 Claire B. Paris1*
 Igal Berenshtein1
 Marcia L. Trillo1
 Robin Faillettaz1
 Maria J. Olascoaga1
 Zachary M. Aman2
 Micheal Schlüter3
 Samantha B. Joye4
- 1Department of Ocean Sciences, Rosenstiel School of Marine and Atmospheric Science, University of Miami, Miami, FL, United States
- 2Fluid Science and Resources Division, Department of Chemical Engineering, The University of Western Australia, Perth, WA, Australia
- 3Institute of Multiphase Flows, Technische Universität Hamburg, Hamburg, Germany
- 4Department of Marine Sciences, University of Georgia, Athens, GA, United States
After the Deepwater Horizon oil platform explosion, an estimated 172.2 million gallons of gas-saturated oil was discharged uncontrollably into the Gulf of Mexico, causing the largest deep-sea blowout in history. In an attempt to keep the oil submerged, massive quantities of the chemical dispersant Corexit® 9500 were deployed 1522 m deep at the gushing riser pipe of the Macondo prospect’s wellhead. Understanding the effectiveness of this unprecedented subsea dispersant injection (SSDI) is critical because deep-water drilling is increasing worldwide. Here we use the comprehensive BP Gulf Science Data (GSD) to quantify petroleum dynamics throughout the 87-day long blowout. The spatio-temporal distribution of petroleum hydrocarbons revealed consistent higher concentrations at the sea surface and in a deep intrusion below 1000 m. The relative importance of these two layers depended on the hydrocarbon mass fractions as expected from their partitioning along temperature and pressure changes. Further, analyses of water column polycyclic aromatic hydrocarbons (PAH) of GSD extensively sampled within a 10-km radius of the blowout source demonstrated that substantial amounts of oil continued to surface near the response site, with no significant effect of SSDI volume on PAH vertical distribution and concentration. The turbulent energy associated with the spewing of gas-saturated oil at the deep-sea blowout may have minimized the effectiveness of the SSDI response approach. Given the potential for toxic chemical dispersants to cause environmental damage by increasing oil bioavailability and toxicity while suppressing its biodegradation, unrestricted SSDI application in response to deep-sea blowout is highly questionable. More efforts are required to inform response plans in future oil spills.
Introduction
On April 20th, 2010, the Deepwater Horizon (DWH) blowout – one of the largest oil spill disasters in history – took place in the Gulf of Mexico at a depth of 1,522 m. A total amount of 4.1 million barrels of oil (McNutt et al., 2012) spilled over 87 days before the Macondo wellhead was capped on July 15th, 2010.
Since then, numerous studies have focused on this particular oil spill and revealed important characteristics of deep-sea blowouts. The dynamic physiochemical processes that transport petroleum hydrocarbons in the water column depend on the gas-to-oil ratio, the type and behavior of “live oil” (crude oil saturated with natural gas) under variable hydrostatic pressure, and on turbulent flows and ambient currents near the wellhead (Tolman, 1949; Aman et al., 2015). With a flow rate in the range of 50,000–70,000 bbl/d (Griffiths, 2012) and stratification-dominated currents, a live oil plume became trapped at levels of neutral buoyancy (Aman et al., 2015), leading to formation of intrusion layers (Camilli et al., 2010; Kessler et al., 2011). A noticeable dominant deep intrusion, the so-called “deep plume”, was centered around 1,100 m, while secondary shallower intrusions were identified at about 800 and 300 m (Kessler et al., 2011; Spier et al., 2013). Further, the dissolution and biodegradation of the live oil as it rose in the water column lead to hydrocarbon partitioning between organic and aqueous phases. These key processes dictate the spatio-temporal dynamics of the oil spilled (Ryerson et al., 2011; Camilli et al., 2012). A detailed temporal analysis of the distribution of hydrocarbons in the water column is still lacking.
Recently, a comprehensive collection of more than 24,500 water samples from at least 67 Response and Natural Resource Damage Assessment (NRDA) studies were made available to the scientific community through the BP Gulf Science Data (GSD) (BP Gulf Science Data1, 2016; BP Gulf Science Data2, 2016). This dataset provides a unique opportunity to examine how the different petroleum hydrocarbons were transported and partitioned in the water column through time. What is more, massive amounts (ca. 771 thousand gallons) of chemical dispersants, namely Corexit® 9500 produced by Nalco-Champion (BP Gulf Science Data2, 2016; BP Gulf Science Data3, 2016), was injected directly at the wellhead as an unprecedented first response, to prevent rapid rise of oil to the surface.
Corexit 9500 is a powerful surfactant containing dioctyl sodium sulfosuccinate (DOSS) that lowers the interfacial tension between the oil and the water and enhances formation of neutrally buoyant micro-droplets (Wilson et al., 2015). This mechanism dictates that the enhanced dispersion increases the hydrocarbon content of the deep plume (Paris et al., 2012; Aman et al., 2015; Pesch et al., 2018), but DOSS could also increase the toxicity of the sequestered material (Kujawinski et al., 2011). Additionally, the amount of surfacing oil should slow, and sheens should be thinner, further downstream from the spill site (Socolofsky et al., 2015), which could help mitigate response efforts. Indeed, the droplet size distribution (DSD) generated during subsea blowouts has a strong impact on their outcome since they dictate the oil rising speed (Paris et al., 2012; Pesch et al., 2018). Yet, little is known about the impacts of subsea dispersant injection (SSDI) on the transport of petroleum hydrocarbons and its tradeoffs, beyond modulating the extent of environmental contamination by decreasing natural degradation and increasing water column toxicity. The impact of chemical dispersants on biodegradation is still debated (Kleindienst et al., 2015a,b).
The first objective of this study is to use the water column chemistry GSD to describe the monthly dynamics of light and heavy hydrocarbon mass fractions of the Macondo oil from May 5 to December 31, 2010. The second objective is to determine the relationship between the water column chemistry GSD and the variable dispersant injection volumes at the wellhead (BP Gulf Science Data2, 2016; BP Gulf Science Data3, 2016). This analysis provides the first quantitative insight as to whether SSDI is an effective control method during the turbulent release of live oil in the deep-sea.
Materials and Methods
The GSD (BP Gulf Science Data1, 2016) Water Chemistry Data conforms to the Analytical Quality Assurance Plan and provides the concentrations on volatile hydrocarbons, polycyclic aromatic hydrocarbons (PAH), and saturated hydrocarbons (SHC) and benzene, toluene, ethylbenzene, xylenes (BTEX) in the water column from the sea surface to a maximum depth of 2,850 m. We filtered the BP GSD Water Chemistry Data by time from May 5, 2010 (first recorded BP GSD) to December 31, 2010 and by two radial distances from the blowout. We computed individual radial distances for each sample with the GIS WGS 1984 Geographic Coordinate System, and the World Behrmann Projected Coordinate System. Of the 13,218 water sample oil concentrations reported from offshore stations during the year 2010, 59% (7,741) and 26% (3.464) were collected within a radial distance of 100 and 10 km from Macondo, respectively (Figure 1). We used the water column samples within 100 km from the oil spill source for the spatio-temporal distribution of low (C5–C12) and high (C13+) hydrocarbon mass fractions, and within 10 km for the SSDI analysis. The spatial discretization of 10 km is specifically designed to test the assumption that SSDI would reduce the amount of oil rising directly at the response site (Socolofsky et al., 2015).
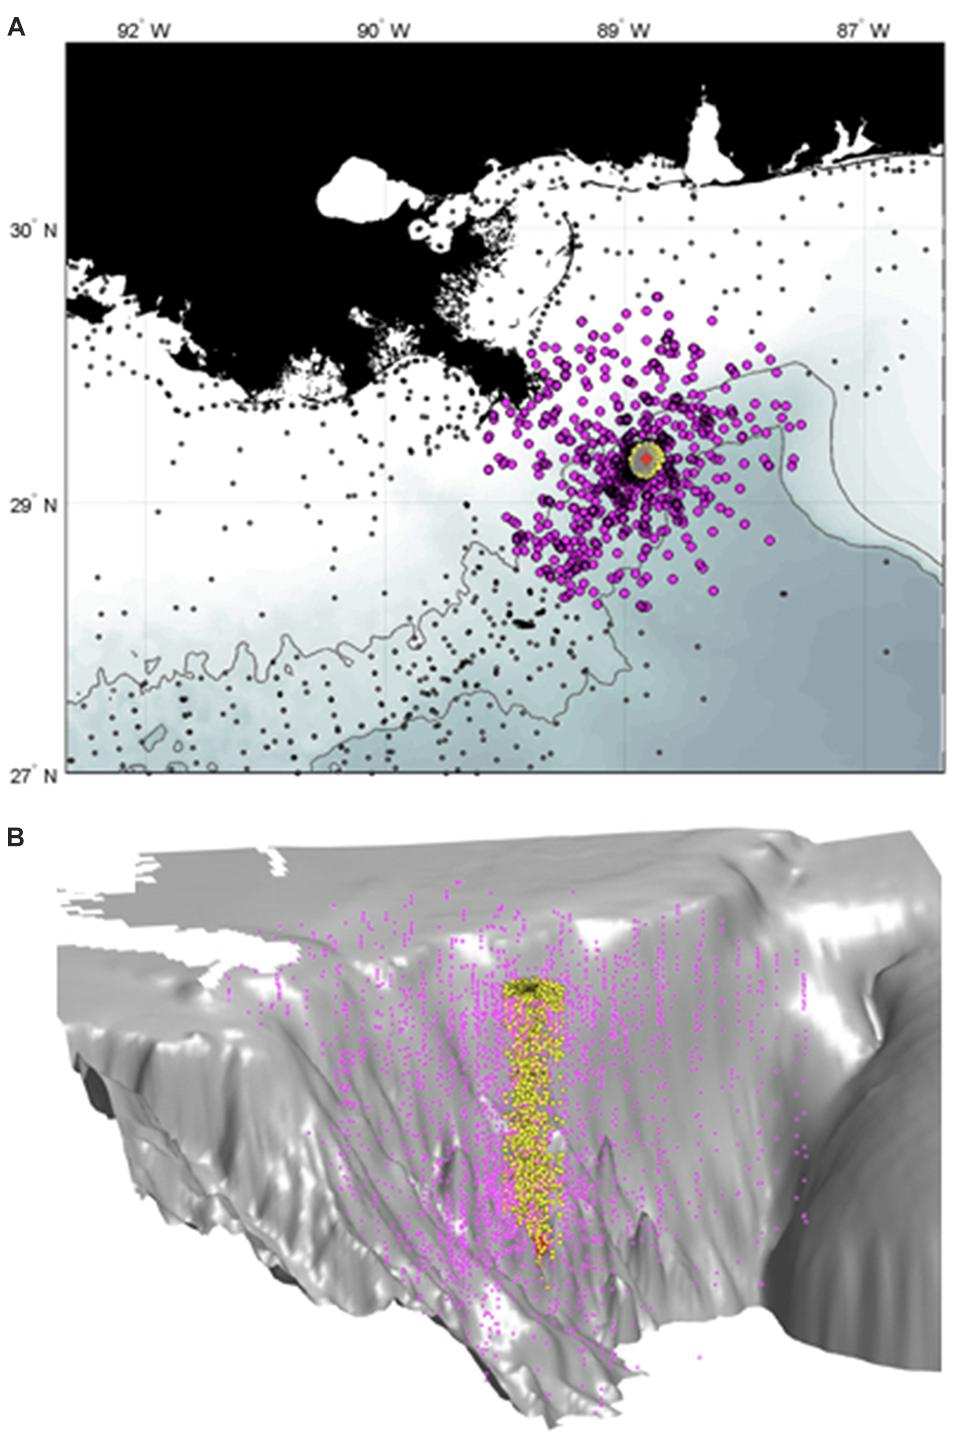
FIGURE 1. BP Gulf Science Data (GSD) Water Chemistry Data stations collected during the Deepwater Horizon (DWH) blowout from May to December 2010. (A) Stations located within 100 km (magenta stations, n = 7,741) and 10 km (yellow stations, n = 3,464) perimeters from Macondo (red+) are used to analyze the daily vertical distribution of low (C5–C12) and high (C13+) molecular weight petroleum hydrocarbons, and to evaluate subsea dispersant injection (SSDI) volumes on the vertical distribution of polycyclic aromatic hydrocarbons (PAHs) around the response area, respectively. Green dots are GSD stations outside the study area (n = 5,477). The gray lines are at the 1,000 and 2,000 m isobaths. (B) Three-dimensional view of the selected stations relative to Macondo wellhead’s depth (red circle, not to scale).
Spatio-Temporal Distribution of Hydrocarbon Mass Fractions
For deep-sea blowouts, the dissolution, biodegradation, and chemical composition of live oil influences partitioning of hydrocarbons throughout the water column (Jaggi et al., 2017). This partitioning behavior is based on the volatility and aqueous solubility of each hydrocarbon species (Ryerson et al., 2011; Reddy et al., 2012). To distinguish these processes, we classified the water chemistry results of PAH, SHC, and BTEX into two hydrocarbon fractions based on their molecular weight: a light fraction between five and twelve carbons (C5–C12) and a heavier fraction with more than thirteen carbons (C13+) (Supplementary Table S1). Concentrations within 100 km of the spill source ranged from 0.0008 to 58,730 μg/L and 0.0004 to 101,768 μg/L for the light and heavy fractions, respectively. Concentrations <0.05 μg/L are considered background concentrations derived from natural petroleum seeps (Wade et al., 2016). To obtain a unique concentration value per coordinate and sample date, values of replicates from different laboratories were averaged. The DWH oil spill began with the drilling rig explosion on April 20, 2010, but the GSD collection was initiated on May 5, 2010. We report the monthly distribution of mean concentrations for the two mass fractions from May through December 2010 (Figure 2).
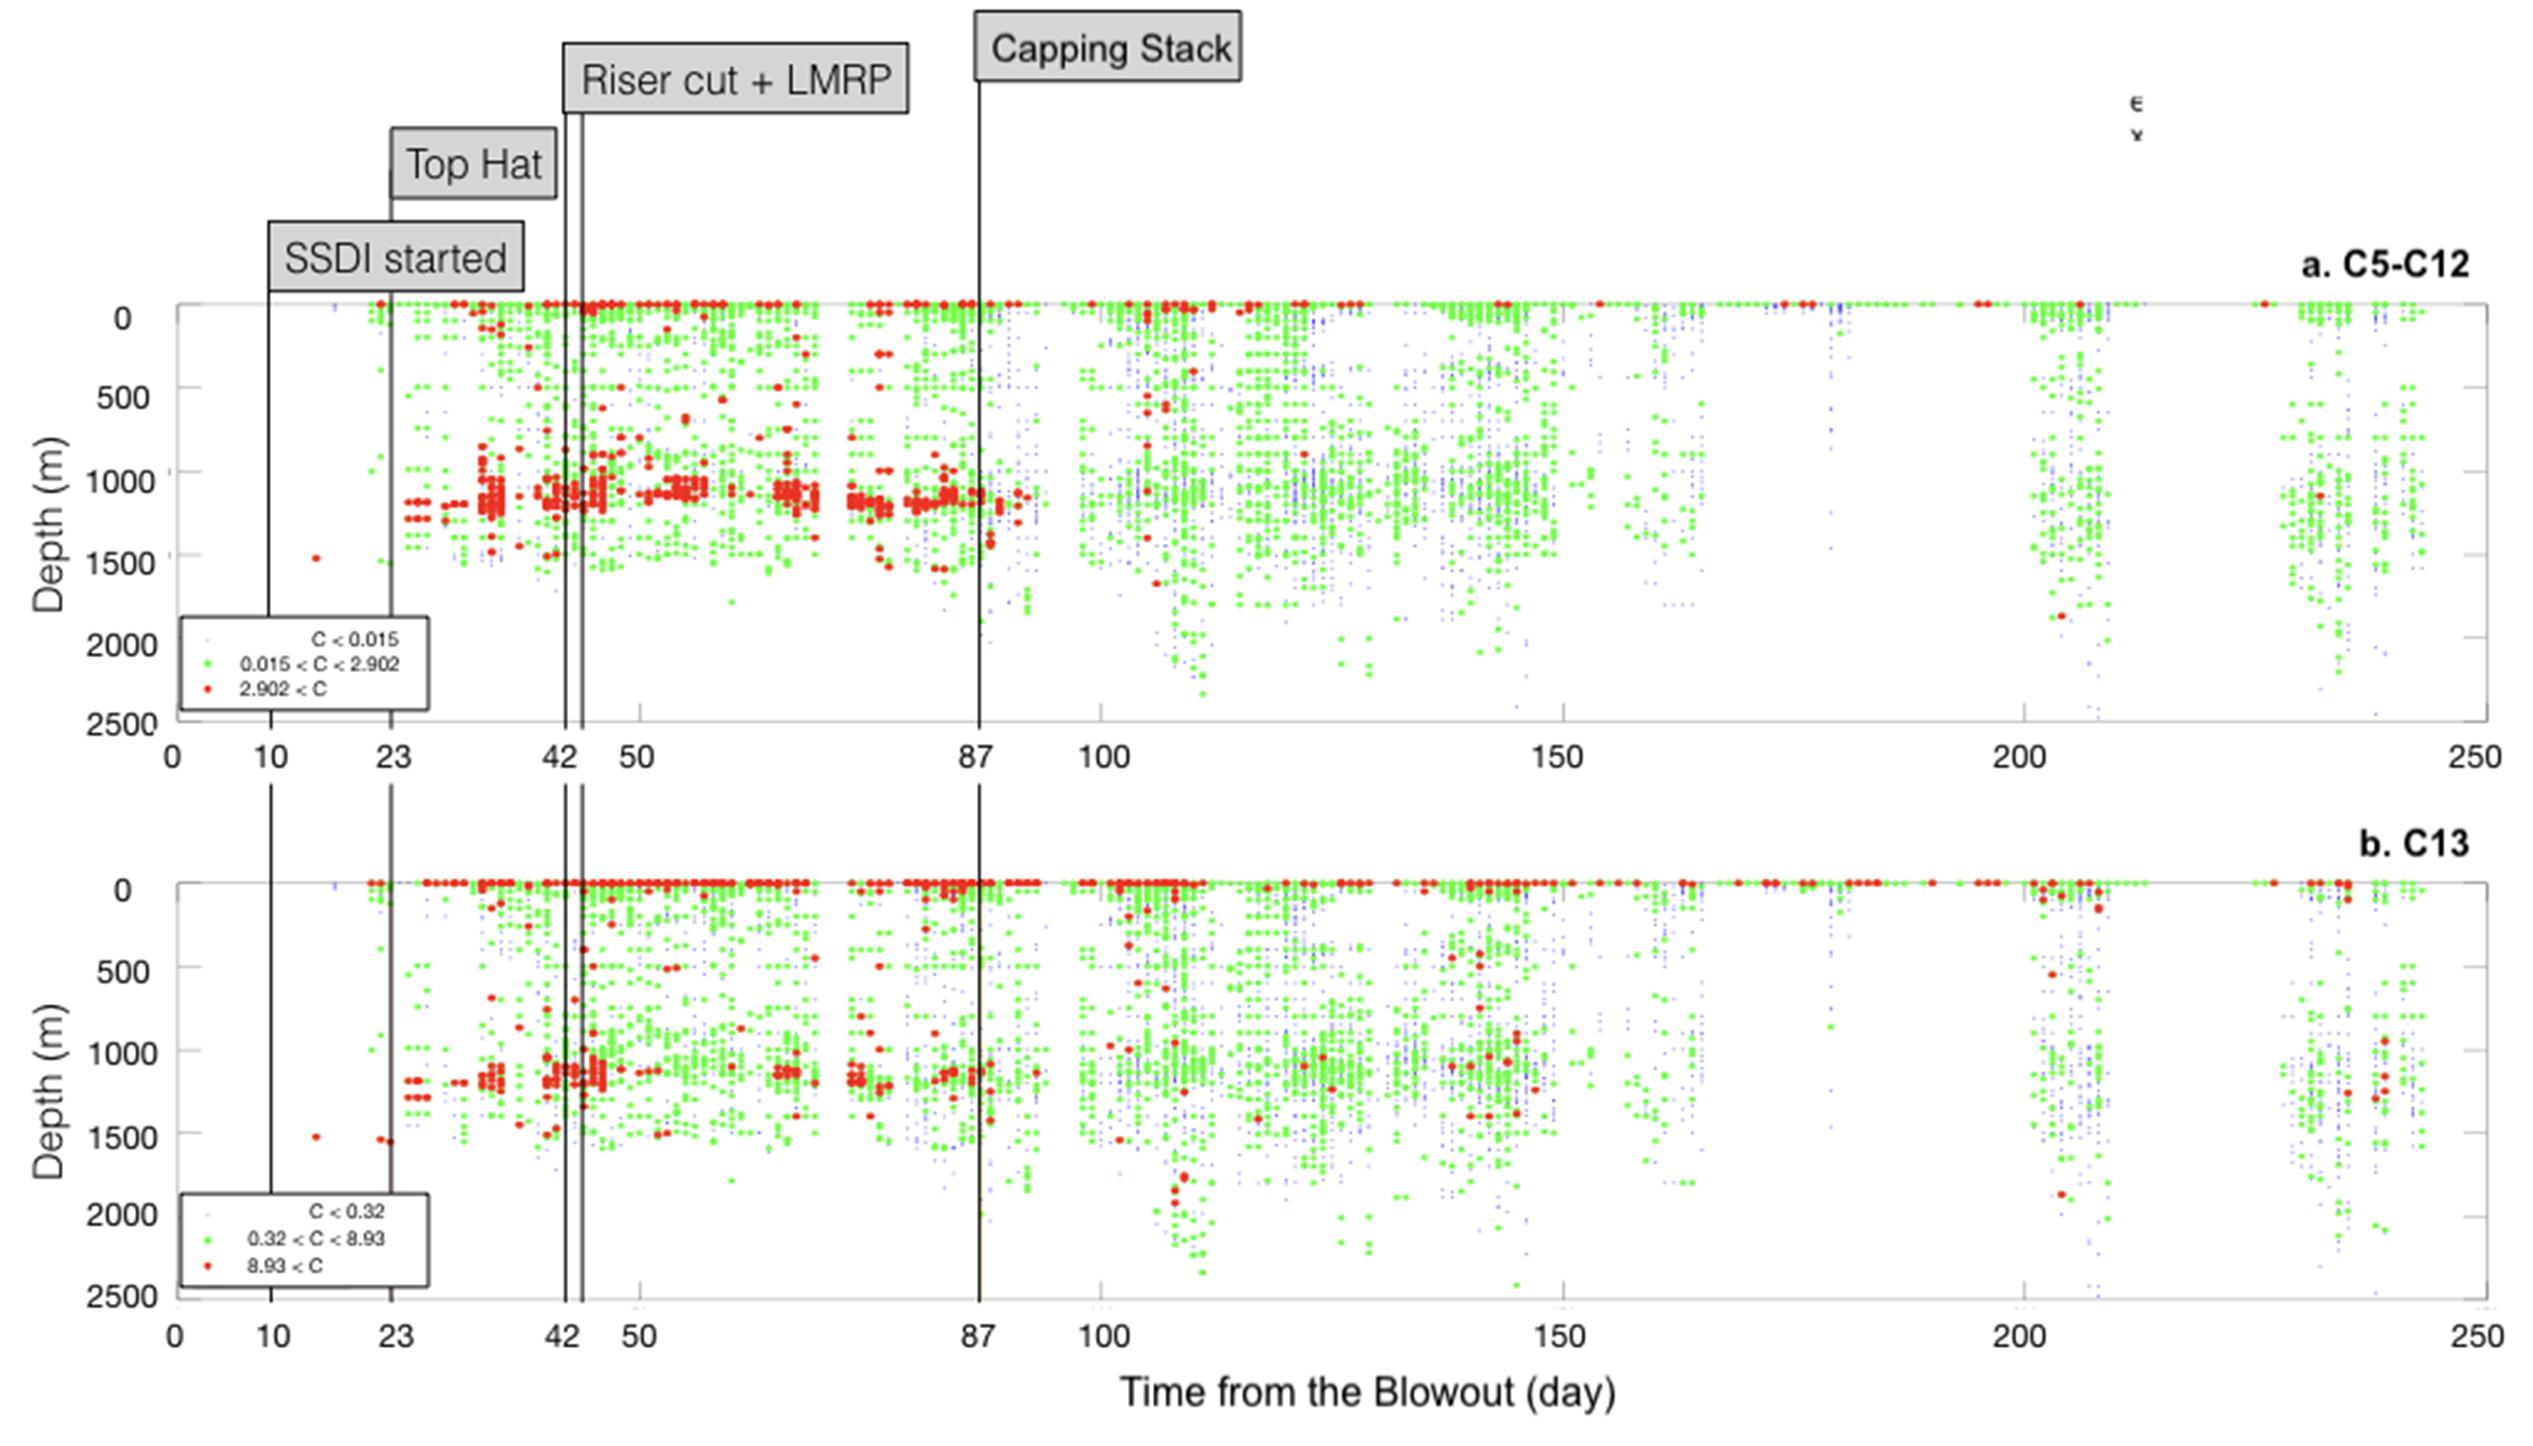
FIGURE 2. Daily vertical distribution of petroleum hydrocarbon concentrations in the Gulf of Mexico (GoM) from the Deepwater Horizon blowout until December 31, 2010. (A) Concentrations of low (C5–C12) and (B) high (C13+) molecular weight hydrocarbon fractions. Values are computed into a grid of 10 m depth over the entire GoM. Oil-contaminated samples are represented by red dots for values above the 90 percentile (2.902 and 8.93 μg/L for C5–C12 and C13+, respectively) and by green dots between the median and the 90 percentile (0.015 μg/L < C5–C12 < 2.902 μg/L and 0.32 μg/L < C13+ < 8.93 μg/L); blue dots are samples that are below the median to uncontaminated samples (0–0.015 μg/L and 0–0.32 μg/L for C5–C12 and C13+, respectively); white area has no samples. The key dates of the various attempts to stop the oil spill are indicated: (1) SSDI started on April 30 (day 10 after the blowout); (2) top hat on May 13 (day 23); (3) riser cut followed by the Lower Marine Riser Package (LMRP) on June 4th (day 42); and (4) finally the Stacking Cap on June 15th (day 87). Note: no data were recorded in BP Gulf Science Data (GSD) before May 5, 2010.
Subsea Dispersant Injection Analysis
To identify the potential effect of the SSDI on fresh live oil rising directly above the wellhead, we separate samples within a 10 km perimeter from Macondo (Ryerson et al., 2011; Figure 1). In addition to the PAH Water Chemistry Data (BP Gulf Science Data1, 2016; (Supplementary Table S2), we use the BP GSD records of surface and subsea dispersant application (BP Gulf Science Data2, 2016; BP Gulf Science Data3, 2016).
To assess the effect of the SSDI on Macondo oil dynamics, we use three complementary statistical approaches: (i) a regression tree analysis (RT) to explore the factors affecting oil concentrations, (ii) a generalized least squares (GLS) analysis to directly examine the hypothesis that increasing SSDI volume increases oil in the deep sea and reduces oil at the surface (Socolofsky et al., 2015), and (iii) linear regression models (LM) to detect if higher SSDI volume retains overall oil deeper in the water column. For each analyses, we analyzed the PAH samples and applied a logarithm transformation log(X + 1) on the PAH concentrations to stabilize variances. Hence, the response variables were (i) PAH concentration, (ii) the vertical ratio of the PAH concentrations between the deep (≥600 m) and shallow (<600 m) depth layers, and (iii) the depth center of mass of PAH concentration in the RT, GLS, and LM analyses, respectively. The different explanatory variables used are the volume of surface dispersant application [gal], the volume of SSDI [gal], the distance from the wellhead [km], the flow rate [bbl/day], and the time from initial blowout [days]. The hallmark effects of SSDI are an increase of oil entrainment in the deep plume and a decrease in the amount of oil surfacing directly above the response site (Socolofsky et al., 2015). The effectiveness of SSDI may therefore be observed quantitatively through changes in subsea oil concentration and/or the relative oil concentration between the sea surface and the subsea. All analyses were performed with R statistical software, using the R open-source software with the packages “rpart,” “rpart.plot,” “nlme,” and “visreg” (R Core Team, 2018).
Regression Tree Analysis
The RT splits maximize the variation between the groups and minimizes the variation within groups using the sum of squares. The analysis initially generates a full tree, following by an optimal trimming of the tree, based on the 1SE rule, with a 10% cross-validation and a complexity-parameter of 0.039.
Generalized Least Squares Analysis
We examine the range of potential SSDI effects by computing the ratio between the geometric mean oil concentration of various depth layers where the nominator is always the upper layer, hereafter referred to as oil vertical ratio. SSDI effect is examined on its application day (not lagged), with the assumption that Corexit® 9500 would reach equilibrium adsorption to the water-oil interface on the timescale of seconds (Wade et al., 2016). We also examine the next day effect (1-day lagged). First, collinearity between explanatory variables is tested using Variance Inflation Factor (VIF; cutoff threshold = 2). Second, we checked for temporal dependence of the multiple regression model residuals using Ljung–Box test. We then used the GLS analysis to account for the autocorrelation and evaluated the association between the explanatory variables and the response variables. Finally, we used a Likelihood ratio test to find the best fitted model. The addition of the temporal auto-correlation term resulted in a significantly better GLS model (Likelihood ratio test, X2 = 11.46, p < 0.001). A negative slope of the oil vertical ratio GLS regressions would indicate that the SSDI procedure was effective. Alternatively, no significant slope or a positive slope for the oil vertical ratio would demonstrate no SSDI effect (Supplementary Table S3).
Linear Regressions Analysis
The application of SSDI should limit the rise of the oil in the water column (Socolofsky et al., 2015). Applying higher volume of SSDI should enable to treat a higher proportion of oil overall, and therefore retain it deeper in the water column. To detect for the presence of a relationship between the volume of SSDI applied and the overall vertical distribution of PAH concentrations, we split the SSDI volume into 500 L/d bins (ranging from 0 to 20,500 L/d, 22 bins in total) and computed the depth center of mass of PAH concentrations (Zcm) for each bin. The Zcm, which therefore summarizes the vertical distribution of PAH concentrations, were then tested against SSDI volume with linear regression.
Results
Spatio-Temporal Analysis of Hydrocarbon Mass Fractions
Oil droplets rise to the surface depending on their buoyancy relative to the surrounding density stratification (Paris et al., 2012). Due to their varying size and biodegradation, they have different rise rates and follow different trajectories. The lighter, more volatile fraction (C5–C12) are generally consumed rapidly (Valentine et al., 2010; Crespo-Medina et al., 2014), while the heaviest category (C13+) resides longer in the water column before eventually reaching the surface.
Despite irregular sampling employed during collection of the BP GSD, a clear signal emerges through time (Figure 2). We find high concentrations of the lighter fraction (C5–C12) forming a deep intrusion between 1000 and 1300 m (Camilli et al., 2010) from May to July (red dots, Figure 2A). As reported in Crespo-Medina et al. (2014), the deep plume started to break down after July when the discharge stopped, with lower concentrations onward (green dots, Figure 2B). A clear gap in intermediate waters with background concentrations suggested acceleration of degassing droplets under decreasing pressure (Pesch et al., 2018) and/or biological consumption of this low molecular weight hydrocarbon category in the water column (Bagby et al., 2017).
We found elevated concentrations of heavy mass fraction (C13+) in the upper 200 m mostly near the DWH response site to about 80 km downstream from May through December 2010 (Figure 2B and Supplementary Figure S1b). This mass fraction was also trapped in the deep intrusion layer within 25 km from Macondo from May to July (Figure 2B and Supplementary Figure S1b). Significant concentration values were also observed throughout the water column, suggesting additional sequestration in secondary intrusion layers. In contrast to the lighter mass fraction, we observed concentrations values higher than the 90 percentile after the well was capped, from August through December (red dots, Figure 2B). Indeed, these heavier oil compounds contained primarily PAHs, which are persistent pollutants that are effectively transported by currents (Camilli et al., 2010). We also observed concentrations above the median later in the year (green dots, Figure 2B). The unprecedented amount of chemical dispersants injected at depth may also have inhibited biodegradation (Kleindienst et al., 2015b), increasing the residence time of the oil in the Gulf of Mexico. Whether chemical dispersants inhibit biodegradation of different crude oil components is vigorously debated (Kleindienst et al., 2015a,b), but it is clear that oil degradation is not necessarily accelerated after dispersant addition (Rahsepar et al., 2016), potentially undermining the utility of SSDI.
Subsea Dispersant Injection
Variable volumes of the powerful ionic dispersant Corexit® 9500 (BP Gulf Science Data2, 2016) were deployed for the first time subsea, directly at the discharging wellhead (Supplementary Figure S2). Periods with no treatment alternated with periods of low, high, and peak SSDI volumes from April 20 to July 15, 2010. For example, a peak application in early June accounted for nearly 8% of the total SSDI volume of 771,272 gal (Supplementary Figure S1). Presumably, chemically dispersed oil should be sequestrated at depth via a shift in the spectrum of the oil DSD toward slow-rising micro-droplets (Aman et al., 2015); this should lead to a significant fraction of the spilled oil not reaching the sea surface – or at least not directly at the response site above the wellhead (Socolofsky et al., 2015). There is no empirical evidence of this effect. While water depth (RT; highest rank: 0.53) and time from the blowout (RT; rank: 0.23) are the two most important explanatory variables of the variance in PAH concentrations, the amount of chemical dispersants injected at the wellhead does not control the PAH distribution (RT; lowest rank: 0.04). Consequently, SSDI does not appear in any branches of the RT (Figure 3). The first split of the tree partitions early deep samples with high PAH concentrations (Figure 3) collected before May 13th, 2010 (day 23) —indicating the presence of a deep intrusion without chemical dispersants (Figure 4 and Supplementary Figures S2, S3). Indeed, the intrusion occurs when a multiphase, buoyant jet entrains seawater. This date coincides with the Top-Hat operation, when methanol was injected into a dome placed on the discharging riser pipe to prevent hydrate formation (McNutt et al., 2012). The second split distinguishes surfaced oil (depth < 2 m) of intermediate concentration from the subsea oil (node b, Figure 3). Water Chemistry Data samples are further partitioned after day 42 (June 2, node f). This date corresponds to the partially successful leaking lower marine riser package (LMRP) cap operation (Figure 2 and Supplementary Figure S2). This cap system was collecting 25,000 bpd of oil directly above blowout preventer (BOP) by two containment systems: a riser pipe connected to a surface vessel and a choke line connected to a submersible (McNutt et al., 2011, 2012; Griffiths, 2012). This explains why samples taken after June 2 were characterized by lower oil concentration (node f, Figure 3). At the same time, the SSDI volume was increased by threefold (Supplementary Figure S2).
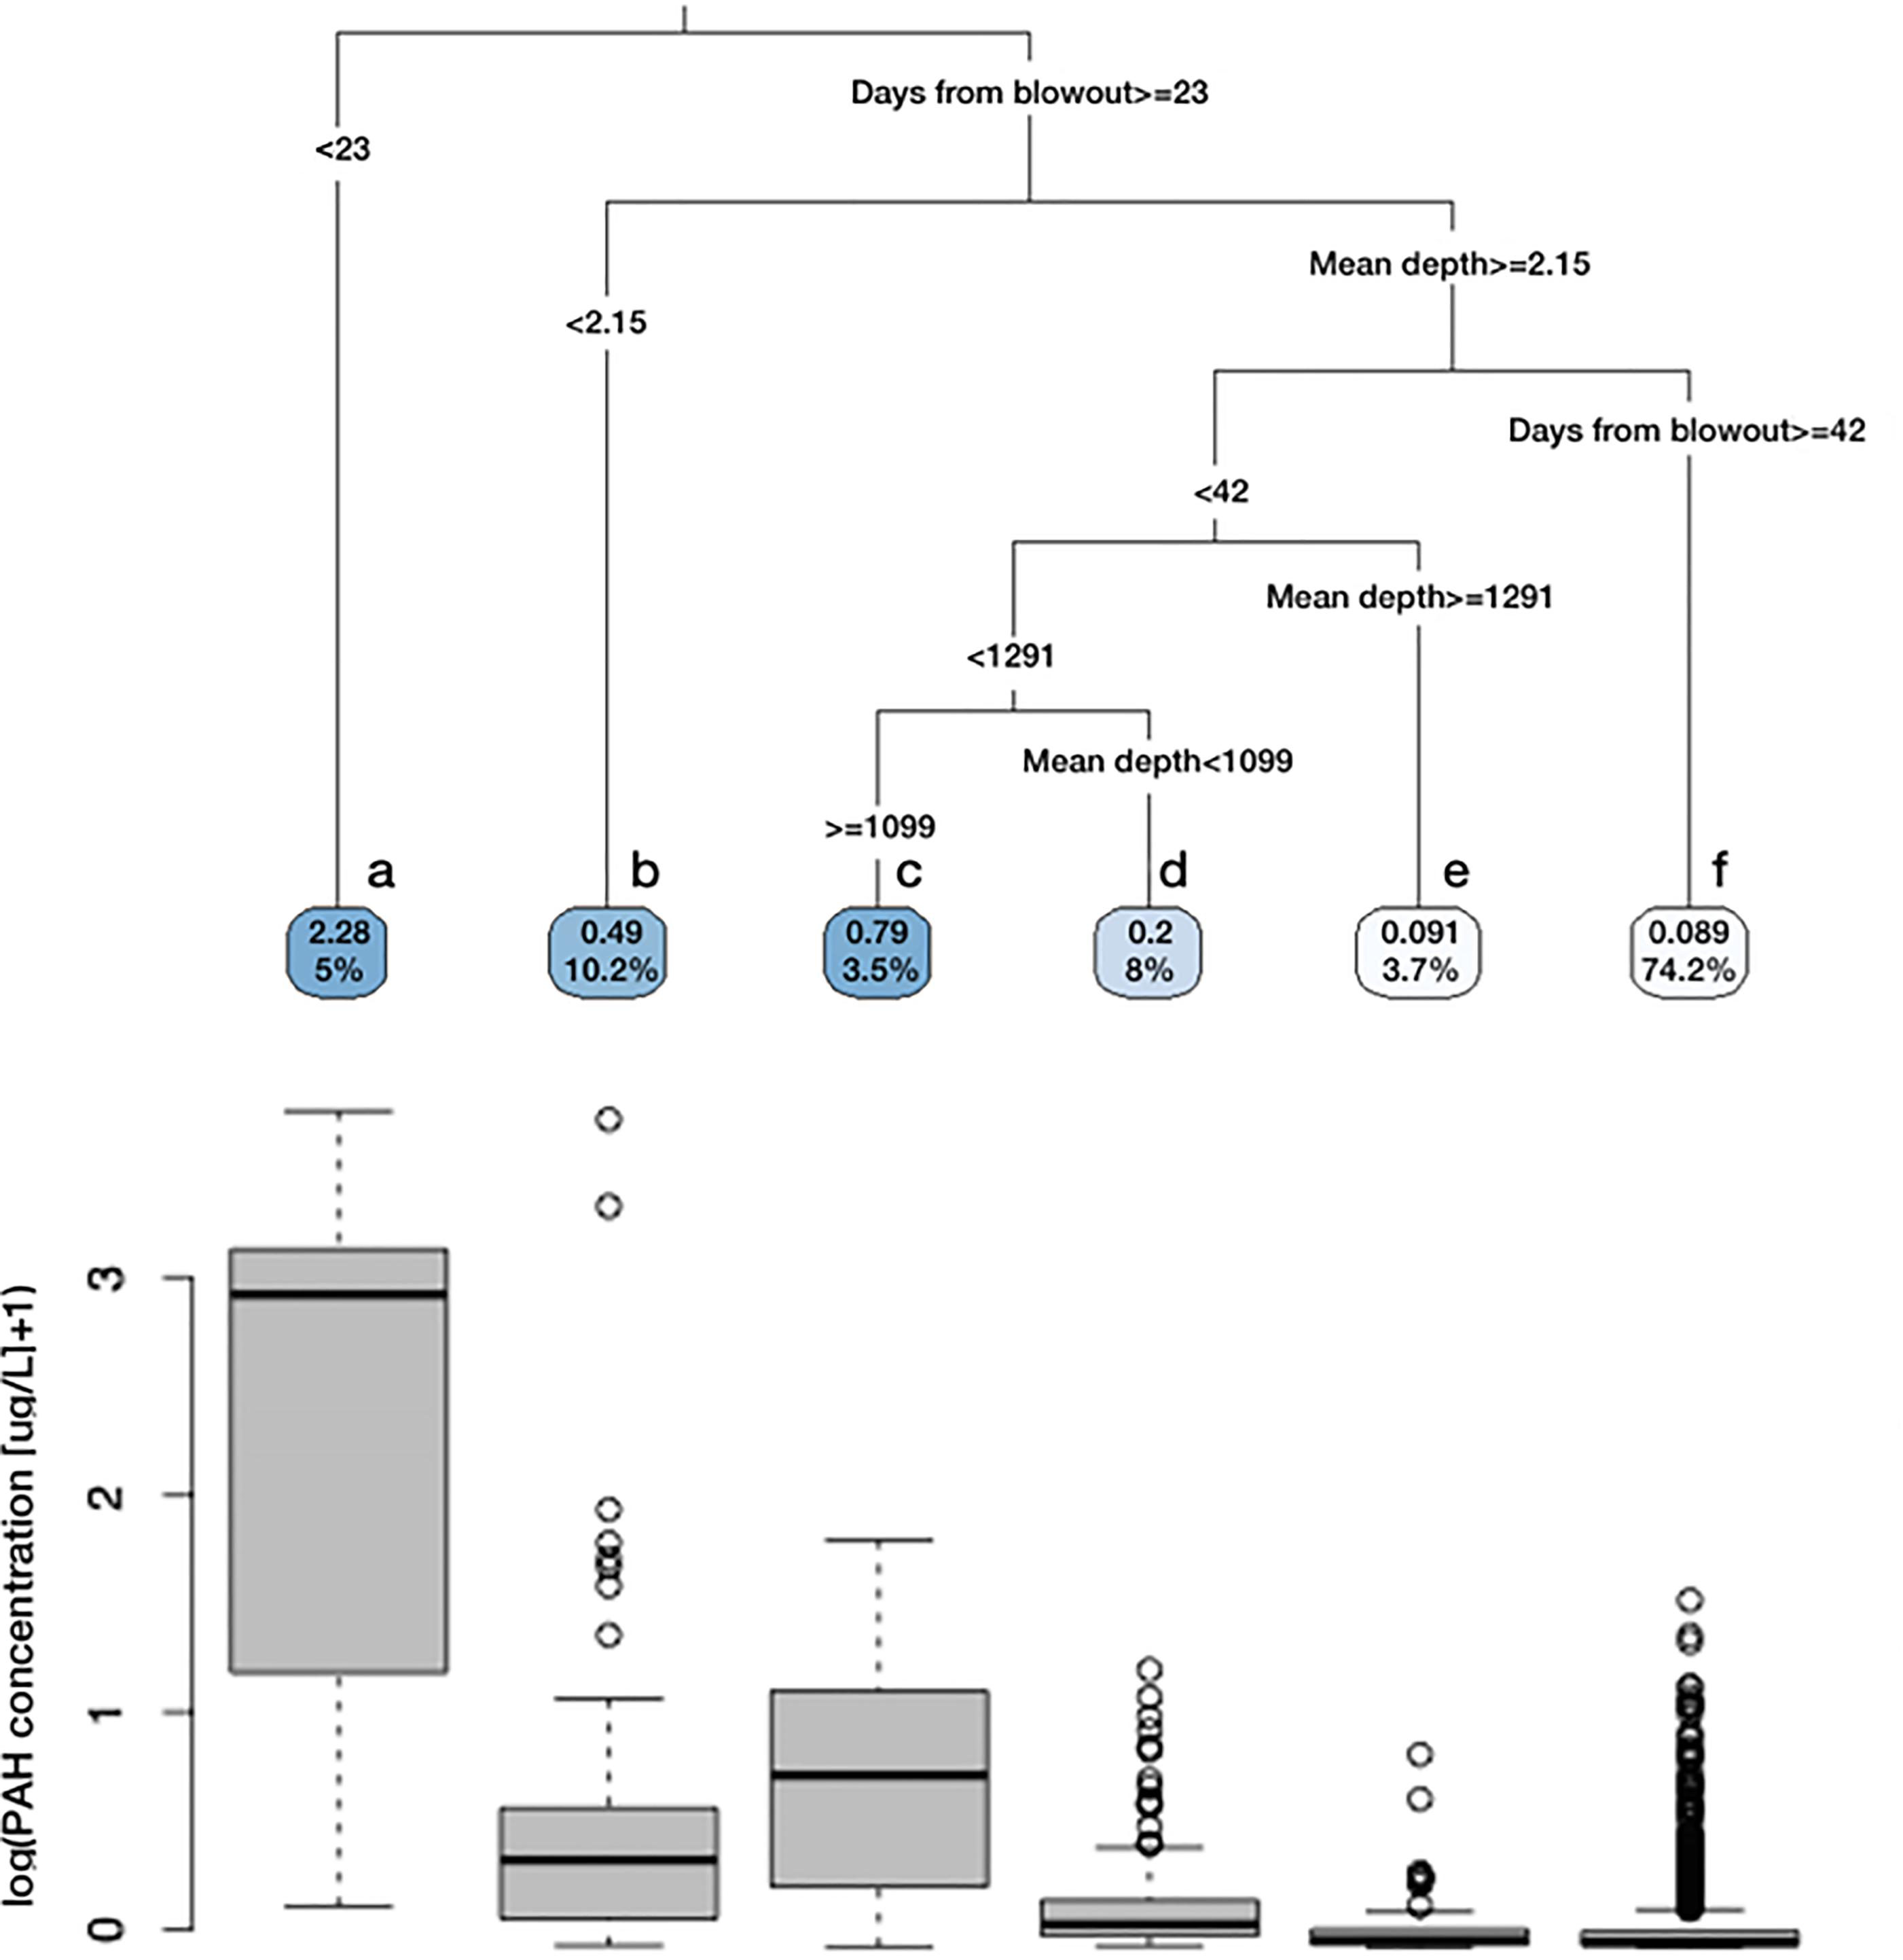
FIGURE 3. Factors explaining oil distribution during the Macondo blowout. Regression tree of the log-transformed concentration [log(μg/l + 1)] of polynuclear aromatic hydrocarbon (PAH) as response variable against depth of the sample [m], time from the blowout [days], distance from the wellhead [km], subsea dispersant injection (SSDI, [gal]), and surface dispersant application [gal] as explanatory variables. The numbers in each terminal leaf (or node) are the mean concentration of PAH and the percentage of samples; the darker leaf shade, the higher the explanatory power of the branch. Box plots show the distribution of PAH concentration values in each node (n = sample size). The tree partitions 1428 samples collected from May 5th to July 12th within 10 km from Macondo and explains 39% of the variance in PAH concentrations. No effect of SSDI volume is detected within the six main nodes (a–f).
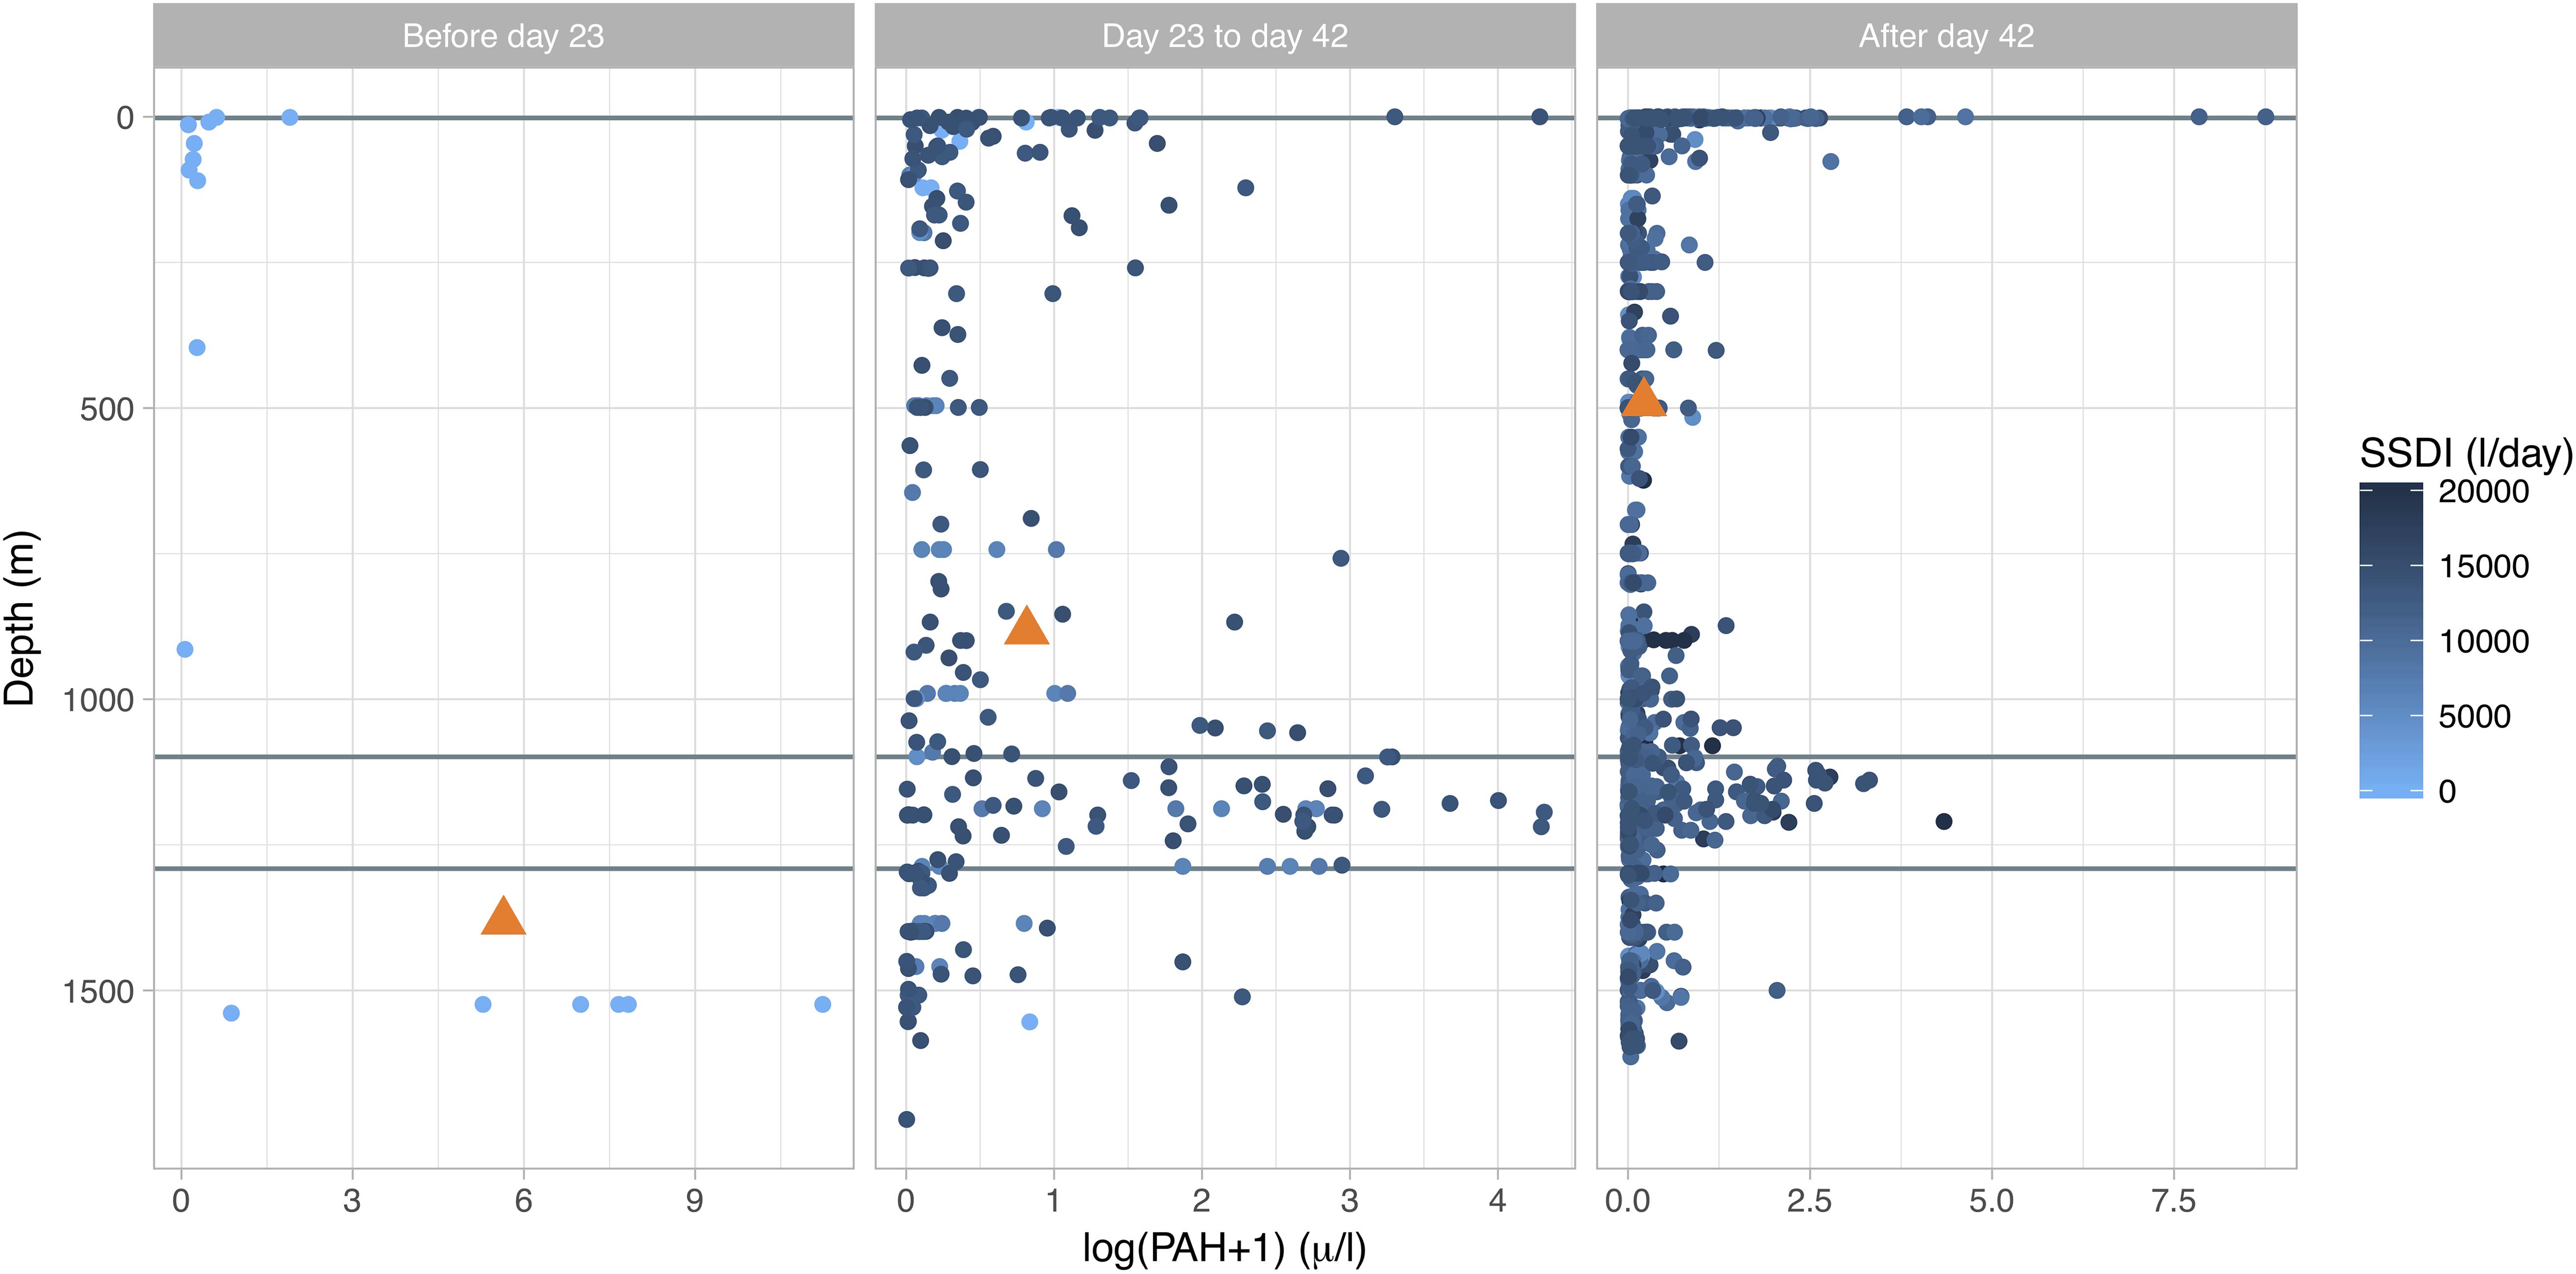
FIGURE 4. Polycyclic aromatic hydrocarbon (PAH) concentration as a function of depth and Subsea Dispersant Injection (SSDI) volume (marker color). The panels correspond to the temporal splits (before and after day 23 and 42) from the hierarchical regression tree (RT) analysis of factors explaining the spatio-temporal variance in PAH concentrations (see Figure 3). The light blue lines correspond to the significant splits by depth (2, 1099, and 1291 m) in the RT analysis (see Figure 3). Orange triangles indicate the center of mass of the data points presented in each panel.
Samples collected between May 13th and June 3rd are further partitioned by depth. Water sampled between 1099 m and 1291 m captures the deep intrusion (nodes c, Figures 3, 4) with higher oil concentrations relative to samples collected deeper (node e, Figure 3) and shallower (node d, Figure 3). We find no evidence of SSDI effectiveness since deep and shallow samples are not characterized by particularly high and low oil concentrations when SSDI is applied (Figure 4). The absence of relationship between SSDI volume and oil concentrations is supported by the results of the GLS regression analysis (Supplementary Figure S4), indicating no change in the oil vertical ratio with SSDI volume (slope = −10−7, t = −0.1, p = 0.9, (Supplementary Figure S5a and Supplementary Table S2) even when considering a lagged effect of SSDI. Similarly, the depth center of mass of oil concentrations was not affected by the volume of SSDI applied (F = 0.93, R2 = 0.04, p = 0.34, Supplementary Figure S5b).
Discussion
If the SSDI had the desired effect, we would see a negative effect, denoting higher oil concentration in the deep plume with increased SSDI. In theory, deep injection should have increased the petroleum hydrocarbon concentration values at depth by enhancing the natural formation of micro-droplets that intrude in the deep plume (Aman et al., 2015; Chan et al., 2015). Instead, the analysis captures the dynamics of the blowout containment attempts and demonstrates that SSDI volume does not explain the high PAH concentrations found between 1099 and 1291 m (Figures 3–5 and Supplementary Figure S1). The finding of a dense petroleum hydrocarbon layer around the expected trap height without dispersant indicates the natural formation of a dominant intrusion, owing to the atomization of the live oil that was turbulently dispersed from the broken pipe. A large pressure-drop of approximately 9 MPa across the 16 m BOP stack and the high flow rates (ca. Q = 0.08 m3 s−1) (Griffiths, 2012) could provide sufficient energy dissipation rates for the atomization of live oil into micro-droplets (Li et al., 2008). If initial droplet were tiny (i.e., generally below <300 μm, Li et al., 2008), it is unclear that addition of dispersants would generate significantly smaller droplet sizes.
A combination of temperature- and pressure-dependent processes may also have played a large role on the behavior of the Macondo blowout, and consequently on the oil concentration distribution in the water column. The impact of these deep seafloor processes is presumably larger than the role of SSDI on the uncontrolled release of gas-saturated live-oil (McNutt et al., 2012; Oldenburg et al., 2012). These processes include: (1) a sudden pressure drop at the BOP upon exit of the multiphase jet into the ambient seawater (Aliseda et al., 2010; Griffiths, 2012) leading to rapid expansion of the dissolved gas (Oldenburg et al., 2012), which would atomize the live oil into micro-droplets (Malone et al., 2018); (2) cold water and gas combined under high pressure (i.e., 5°C and 15.45 MPa at Macondo; Oldenburg et al., 2012) enhanced the formation of gas hydrates that may have encapsulated some crude oil, which may have decreased their buoyancy (Joye et al., 2011); or (3) as live oil rises in the water column and hydrostatic pressure decreases, degassing should increase the apparent droplet size. “Growing” droplets would then rise faster than expected from their initial size at the wellhead (Paris et al., 2012; Pesch et al., 2018). Such complex live oil processes may have shifted the initial DSD toward smaller droplets that remained suspended thousands of meters below the surface (Camilli et al., 2010) without the need of chemical dispersants (Aman et al., 2015), while more buoyant droplets at the tail of the size distribution may have expanded; degassing would have accelerated the droplet ascent in the water column. To date, these processes are unaccounted for in the response options for uncontrolled subsea oil spills. More work is necessary to measure the dispersion dependence on pressure released and the turbulent kinetic energy and dissipation rate at the blowout.
Moreover, efforts to control the Macondo blowout and repair the riser modulated both the pressure at the wellhead and the flow rate (McNutt et al., 2011; Griffiths, 2012) and influenced the DSD of the oil spewing from the wellhead independently of the oil treatment with Corexit. In particular, a drop of pressure in the BOP during early May (May 5–8, 2010) increased the turbulent energy (Griffiths, 2012) and the Riser Cut operation during early June (June 1–5, 2010) increased the flow rate by about 4%, both mechanically dispersing the oil into a plume of micro-droplets (Tolman, 1949; Griffiths, 2012; Aman et al., 2015). The timing of these operations coincided with increased SSDI volume and oil collection at the wellhead (Supplementary Figure S2). The combination of these efforts would have prohibited objective visual evaluation of the effect of SSDI from surface responders at the DWH site.
The spatial-temporal distribution of oil constituents in the water column depends on each species’ aqueous phase solubility and volatility. The lighter mass fraction (C5–C12) dissipates earlier from the environment and its chemical signature was weak after the capping of Macondo. Alternatively, the heaviest mass fractions (C13+) were still present in high concentration up to 5 months beyond the blowout. This petroleum hydrocarbon fraction contains most of the highly toxic PAHs. Yet, both fractions form the deep plume centered around 1100 m, even in the absence of, or low SSDI during May (Figure 2 and Supplementary Figures S2, S3).
Here, several methods were applied to assess the effect of SSDI on the oil vertical distribution and PAH concentration throughout the Macondo blowout, but none detected significant results. This study therefore provides the first quantitative insight as to whether SSDI is an effective control method during the turbulent release of live oil in the deep-sea. Highly turbulent mixing at the wellhead may have generated natural dispersion (Aman et al., 2015; Boufadel et al., 2018). At the same time, the oil continued to surface near the DWH response site even under high SSDI volumes, presumably displacing the rising oil downstream (Socolofsky et al., 2015). This indicates that processes acting on DSD through time and space (Fingas, 2011) were not accounted for in the response strategy. The lack of effect of the SSDI volume variation on the vertical distribution of petroleum hydrocarbons does not mean that the oil droplet interfacial tension with water was not affected, but rather indicates that thermo-physical and chemical processes had a stronger effect on the uncontrolled release of gas-saturated oil and free gas. There was an extreme pressure drop at the Macondo wellhead (Aliseda et al., 2010; Wereley, 2011), leading to rapid outgassing and fractioning of the oil into fine droplets (Malone et al., 2018; Pesch et al., 2018). Extensive GSD revealed no significant SSDI effect on the oil vertical distribution throughout the DWH spill. These conclusions were previously suggested and supported both by numerical simulation and high-pressure experiments (Paris et al., 2012; Aman et al., 2015). Given the adverse toxic effects of Corexit® 9500, which can also suppress natural oil degradation (Kleindienst et al., 2015b), intense SSDI as response for deep-sea blowouts should be revised. Natural processes of mechanical dispersion may therefore have overcome SSDI as an effective response tool during the DWH oil spill. More work is necessary to better understand these fundamental mechanisms and measure the emulsification dependence on pressure released and the turbulent kinetic energy and dissipation rate at the blowout.
Data Availability
Data are publicly available through the Gulf of Mexico Research Initiative Information & Data Cooperative (GRIIDC) at https://data.gulfresearchinitiative.org (doi: 10.7266/N7902251, 10.7266/N7VQ3139, 10.7266/N70G3HK6).
Author Contributions
CP, MO, MT, ZA, IB, and RF designed the study. IB, CP, RF, and MT analyzed the data. CP, IB, RF, SJ, ZA, and MS wrote the manuscript. All authors listed have made a substantial, direct and intellectual contribution to the work, and approved it for publication.
Funding
This work was supported by the Gulf of Mexico Research Initiative (GoMRI). CP, MT, ZA, and MS acknowledge support from the Center for the Integrated Modeling and Analysis of the Gulf Ecosystem (C-IMAGE II). MO and SJ acknowledge support from the GoMRI CARTHE and ECOGIG Consortia, respectively. IB and CP were funded by a National Academies of Sciences (NAS) Gulf Research Program. CP and IB are also funded by the National Academies of Sciences Gulf Research Program.
Conflict of Interest Statement
The authors declare that the research was conducted in the absence of any commercial or financial relationships that could be construed as a potential conflict of interest.
Acknowledgments
We thank writer Dallas Murphy for his editorial help.
Supplementary Material
The Supplementary Material for this article can be found online at: https://www.frontiersin.org/articles/10.3389/fmars.2018.00389/full#supplementary-material
References
Aliseda, A., Bommer, P., Espina, P., Flores, O., Lasheras, J. C., Lehr, B., et al. (2010). Deepwater Horizon Release Estimate of Rate by PIV. Report to the Flow Rate Technical Group. Available at: https://engineering.purdue.edu/wereley/oilspill/Deepwater_Horizon_June_V.pdf [accessed November 29, 2011].
Aman, Z., Paris, C. B., May, E., and Johns, M. (2015). High-pressure visual experimental studies of oil-in-water dispersion droplet size. Chem. Eng. Sci. 127, 392–400. doi: 10.1016/j.ces.2015.01.058
Bagby, S., Reddy, C., and Aeppli, C. (2017). Persistence and biodegradation of oil at the ocean floor following Deepwater Horizon. Proc. Nat. Acad. Sci. U.S.A. 113, E9–E18. doi: 10.1073/pnas.1610110114
Boufadel, M. C., Gao, F., Zhao, L., Özgökmen, T., Miller, R., King, T., et al. (2018). Was the deepwater horizon well discharge churn flow? Implications on the estimation of the oil discharge and droplet size distribution. Geophys. Res. Lett. 45, 2396–2403. doi: 10.1002/2017GL076606
Bp Gulf Science Data1 (2016). Chemical Analysis of Oil Samples from the Gulf of Mexico and Adjoining States from May 2010 to March 2014. Filename: WaterChemistry_W-01v02-01_xTab. Available at: https://data.gulfresearchinitiative.org/data/BP.x750.000:0005
Bp Gulf Science Data2 (2016). Subsea Dispersant Application Records Collected during the Deepwater Horizon (DWH) Accident Near the Mississippi Canyon block 252 Wellhead from April 30 to July 22, 2010 Filename: DispersantApplication_OTH-02v01-01. Available at: https://data.gulfresearchinitiative.org/data/BP.x750.000:0018#
Bp Gulf Science Data3 (2016). Application of Dispersants to Surface Oil Slicks by Aircraft and by Boat in Approved Areas of the Gulf of Mexico from April 22, 2010 to Final Application on July 19, 2010. Filename: DispersantApplication_OTH-01v01-01a. Available at: https://data.gulfresearchinitiative.org/data/BP.x750.000:0017
Camilli, R., Iorio, D., Di, and Bowen, A. (2012). Acoustic measurement of the Deepwater Horizon Macondo well flow rate. Proc. Nat. Acad. Sci. U.S.A. 109, 20235–20239. doi: 10.1073/pnas.1100385108
Camilli, R., Reddy, C., and Yoerger, D. (2010). Tracking hydrocarbon plume transport and biodegradation at Deepwater Horizon. Science 330, 201–404. doi: 10.1126/science.1195223
Chan, G., Chow, A., and Adams, E. (2015). Effects of droplet size on intrusion of sub-surface oil spills. Environ. Fluid Mech. 15, 959–973. doi: 10.1007/s10652-014-9389-5
Crespo-Medina, M., Hunter, K., Meile, C., Diercks, A., Asper, V., Orphan, V., et al. (2014). The rise and fall of methanotrophy following a deepwater oil-well blowout. Nat. Geosci. 7, 423–427. doi: 10.1038/ngeo2156
Fingas, M. (2011). “Chapter 15 - oil spill dispersants: a technical summary,” in Oil Spill Science and Technology, ed. M. Fingas (Boston, MA: Gulf Professional Publishing), 435–582.
Griffiths, S. (2012). Oil release from Macondo well MC252 following the Deepwater Horizon accident. Environ. Sci. Technol. 46, 5616–5622. doi: 10.1021/es204569t
Jaggi, A., Snowdon, R., Stopford, A., and Radović, J. (2017). Experimental simulation of crude oil-water partitioning behavior of BTEX compounds during a deep submarine oil spill. Organic 108, 1–8. doi: 10.1016/j.orggeochem.2017.03.006
Joye, S. B., MacDonald, I. R., Leifer, I., and Asper, V. (2011). Magnitude and oxidation potential of hydrocarbon gases released from the BP blowout. Nat. Geosci. 4, 160–164. doi: 10.1038/ngeo1067
Kessler, J., Valentine, D., Redmond, M., and Du, M. (2011). A persistent oxygen anomaly reveals the fate of spilled methane in the deep Gulf of Mexico. Science 311, 312–315. doi: 10.1126/science.1199697
Kleindienst, S., Paul, J. H., and Joye, S. B. (2015a). Assessing the impacts of chemical dispersants on microbial community composition and activity. Nat. Rev. Microbiol. 13, 388–396. doi: 10.1038/nrmicro3452
Kleindienst, S., Seidel, M., Ziervogel, M., Grim, K., Mailkin, S., Harrison, S., et al. (2015b). Chemical dispersants can suppress the activity of natural oil-degrading microorganisms. Proc. Nat. Acad. Sci. U.S.A. 48, 14900–14905. doi: 10.1073/pnas.1507380112
Kujawinski, E., Soule, M. K., Valentine, D. L., Boysen, A. K., Longnecker, K., and Redmond, M. C. (2011). Fate of dispersants associated with the Deepwater Horizon oil spill. Sci. Technol. 45, 1298–1306. doi: 10.1021/es103838p
Li, Z., Lee, K., King, T., and Boufadel, M. (2008). Oil droplet size distribution as a function of energy dissipation rate in an experimental wave tank. Proc. Int. Oil Spill 1, 621–626. doi: 10.7901/2169-3358-2008-1-621
Malone, K., Pesch, S., Schluüter, M., and Krause, D. (2018). Oil droplet size distributions in deep-sea blowouts: influence of pressure and dissolved gases. Environ. Sci. Technol. 52, 6326–6333. doi: 10.1021/acs.est.8b00587
McNutt, M., Camilli, R., Crone, T. J., Guthrie, G. D., Hsieh, P. A., Ryerson, T. B., et al. (2011). Review of flow rate estimates of the Deepwater Horizon oil spill. Proc. Nat. Acad. Sci. U.S.A. 109, 20260–20267. doi: 10.1073/pnas.1112139108
McNutt, M., Chu, S., Lubchenco, J., Hunter, T., Dreyfus, G., Murawski, S. A., et al. (2012). Applications of science and engineering to quantify and control the Deepwater Horizon oil spill. Proc. Nat. Acad. Sci. U.S.A. 109, 20222–20228. doi: 10.1073/pnas.1214389109
Oldenburg, C., Freifeld, B., and Pruess, K. (2012). Numerical simulations of the Macondo well blowout reveal strong control of oil flow by reservoir permeability and exsolution of gas. Proc. Nat. Acad. Sci. U.S.A. 109:20255. doi: 10.1073/pnas.1105165108
Paris, C. B., Le Hénaff, M., Aman, Z. M., Subramanian, A., Helgers, J., Wang, D. P., et al. (2012). Evolution of the Macondo Well Blowout: simulating the Effects of the Circulation and Synthetic Dispersants on the Subsea Oil Transport. Environ. Sci. Technol. 46, 13293–13302. doi: 10.1021/es303197h
Pesch, S., Jaeger, P., Jaggi, A., Malone, K., Hoffman, M., Krause, D., et al. (2018). Rise velocity of live-oil droplets in deep-sea oil spills. Environ. Eng. Sci. 52:11. doi: 10.1089/ees.2017.0319
R Core Team (2018). R: A Language and Environment for Statistical Computing. Vienna: R Foundation for Statistical Computing.
Rahsepar, S., Smit, M. P. J., Murk, A. J., Rijnaart, H. H. M., and Langenhoff, A. A. M. (2016). Chemical dispersants: friend or Foe. Mar. Poll. Bull. 108, 113–119. doi: 10.1016/j.marpolbul.2016.04.044
Reddy, C., Arey, J., and Seewald, J. (2012). Composition and fate of gas and oil released to the water column during the Deepwater Horizon oil spill. Proc. Nat. Acad. Sci. U.S.A. 109, 20229–20234. doi: 10.1073/pnas.1101242108
Ryerson, T. B., Aikin, K. C., and Angevine, W. M. (2011). Atmospheric emissions from the Deepwater Horizon spill constrain air-water partitioning, hydrocarbon fate, and leak rate. Geophys. Res. Lett. 38:L07803. doi: 10.1029/2011GL046726
Socolofsky, S. A., Adams, E., Boufadel, M., and Aman, Z. (2015). Case study: intercomparison of oil spill prediction models for accidental blowout scenarios with and without Subsea Chemical Dispersant Injection. Mar. Pollut. Bull. 96, 1–2. doi: 10.1016/j.marpolbul.2015.05.039
Spier, C., Stringfellow, W., Hazen, T., and Conrad, M. (2013). Distribution of hydrocarbons released during the 2010 MC252 oil spill in deep offshore waters. Environ. Pollut. 173:224e230.
Tolman, R. (1949). The effect of droplet size on surface tension. J. Chem. Phys. 17:333. doi: 10.1063/1.1747247
Valentine, D. L., Kessler, J., Redmond, M. C., Mendes, S. D., Heintz, M. B., Farwell, C., et al. (2010). Propane respiration jump-starts microbial response to a deep oil spill. Science 330, 208–211. doi: 10.1126/science.1196830
Wade, T. L., Sericano, J. L., Sweet, S. T., Knap, A. H., and Guinasso, N. L. (2016). Spatial and temporal distribution of water column total polycyclic aromatic hydrocarbons (PAH) and total petroleum hydrocarbons (TPH) from the Deepwater Horizon (Macondo) incident. Mar. Pollut. Bull. 103, 286–293. doi: 10.1016/j.marpolbul.2015.12.002
Wereley, S. (2011). “Gulf oil spill particle image velocimetry (PIV) analysis, appendix 5, appendix D plume calculation team, PIV Report,” in Proceedings of the 10th Asian Control Conference (ASCC), Sabah.
Wilson, M., Graham, L., Hale, C., Maung-Douglass, E., Sempier, S., and Swann, L. (2015). “Oil spill science: persistence, fate, and effectiveness of dispersants used during the deepwater horizon oil spill,” in Oil Spill Science and Technology, ed. M. Fingas (Houston, TX: Gulf Professional Publishing).
Keywords: oil spill, deep-sea blowout, chemical dispersants, water column, Macondo, subsea dispersant injection, petroleum, Gulf Science Data
Citation: Paris CB, Berenshtein I, Trillo ML, Faillettaz R, Olascoaga MJ, Aman ZM, Schlüter M and Joye SB (2018) BP Gulf Science Data Reveals Ineffectual Subsea Dispersant Injection for the Macondo Blowout. Front. Mar. Sci. 5:389. doi: 10.3389/fmars.2018.00389
Received: 16 April 2018; Accepted: 04 October 2018;
Published: 30 October 2018.
Edited by:
Juan Bellas, Instituto Español de Oceanografía (IEO), SpainReviewed by:
André Ricardo Araújo Lima, Universidade Federal de Pernambuco, BrazilMarkus Huettel, Florida State University, United States
Copyright © 2018 Paris, Berenshtein, Trillo, Faillettaz, Olascoaga, Aman, Schlüter and Joye. This is an open-access article distributed under the terms of the Creative Commons Attribution License (CC BY). The use, distribution or reproduction in other forums is permitted, provided the original author(s) and the copyright owner(s) are credited and that the original publication in this journal is cited, in accordance with accepted academic practice. No use, distribution or reproduction is permitted which does not comply with these terms.
*Correspondence: Claire B. Paris, Y3BhcmlzQHJzbWFzLm1pYW1pLmVkdQ==