 Melanie Grenier1,2*
 Ester Garcia-Solsona1,3†
 Nolwenn Lemaitre1,4†
 Thomas W. Trull2,5Vincent Bouvier1†
 Philippe Nonnotte6Pieter van Beek1Marc Souhaut1
 Francois Lacan1‡
 Catherine Jeandel1
- 1LEGOS, Université de Toulouse, CNES, CNRS, IRD, Toulouse, France
- 2Antarctic Climate and Ecosystems CRC, University of Tasmania, Hobart, TAS, Australia
- 3Institut de Ciència i Tecnologia Ambientals, Universitat Autònoma de Barcelona, Bellaterra, Spain
- 4Laboratoire des sciences de l'environnement marin (LEMAR), Université de Bretagne Occidentale, Brest, France
- 5CSIRO Oceans and Atmosphere, Hobart, TAS, Australia
- 6Laboratoire Géosciences Océan, Université de Bretagne Occidentale, CNRS, IRD, UMR6539, IUEM, Technopole Brest Iroise, Plouzané, France
Distributions of dissolved rare earth element (REE) concentrations and neodymium isotopic compositions (expressed as εNd) of seawater over and off the Kerguelen Plateau in the Southern Ocean are presented. The sampling took place during the austral spring bloom in October–November 2011 (KEOPS2 project, GEOTRACES process study) and aimed to further the investigations of the KEOPS1 austral summer study in terms of sources and transport of lithogenic material, and to investigate the impact of local biogeochemical cycles on the REE distributions. The REE signature of the coastal eastern Kerguelen Islands waters was characterized by negative europium anomalies (Eu/Eu*) and negative εNd in filtered samples. By contrast, the unfiltered sample showed a positive Eu/Eu* and more radiogenic εNd. These distinct signatures could reflect either differential dissolution of the local flood basalt minerals or differential leaching of local trachyte veins. The dissolved Kerguelen coastal REE patterns differ from those observed close to Heard Island, these latter featuring a positive Eu/Eu* and a less radiogenic εNd (Zhang et al., 2008). These differences enabled us to trace the transport of waters (tagged by the Kerguelen REE signature) 200 km downstream from the coastal area, north of the Polar Front. Northward transport of the central Plateau shallow waters, enriched by both local vertical supplies and lateral advection of inputs from Heard Island, was also evident. However, the transport of Kerguelen inputs southeastward across the Polar Front could not be discerned (possibly as a result of rapid dilution or scavenging of REE signatures), although evidence for such transport was found previously using Ra isotopes (Sanial et al., 2015). Comparison of the REE patterns at stations sampled prior, during and at the demise of the bloom revealed diverse fractionations, including production of significant lanthanum and europium anomalies, which are tentatively ascribed to chemical reactions with various inorganic and biogenic phases, including surface coatings, barite crystals, and biogenic silica.
Introduction
The Southern Ocean is recognized as the major high-nutrient, low-chlorophyll (HNLC) oceanic region, where phytoplankton growth is limited by a low availability of the micronutrient iron (Fe; Martin, 1990; de Baar et al., 1995; Boyd et al., 2007). Nevertheless, natural iron fertilization occurs in some locations of the Southern Ocean, as a consequence of the release of Fe from the shelf sediments (Tagliabue et al., 2009, 2014). Thus, patches of high phytoplankton biomass can be observed off the Antarctic continental shelf (Moore and Abbott, 2002; Arrigo et al., 2008) or around subantarctic islands (Blain et al., 2001; Korb et al., 2004; Pollard et al., 2007; Tarling et al., 2012; Measures et al., 2013). A recurrent annual phytoplankton bloom is notably observed in the Indian sector of the Southern Ocean, in the vicinity of the Kerguelen Plateau (Blain et al., 2001, 2007). This bloom—one of the largest of the Southern Ocean—extends more than 1,000 km downstream of the Kerguelen Islands, on either side of the Polar front (PF; Figure 1). The northern branch extends northeast of the island, off the Northern Kerguelen Plateau, while the larger southern part mostly extends over the Central Kerguelen Plateau (Mongin et al., 2008). The KEOPS1 and KEOPS2 (KErguelen Ocean and Plateau compared Study, PI: S. Blain) projects aimed at understanding the physical, chemical and biological processes that are responsible for the phytoplankton bloom observed over and downstream of the Kerguelen Plateau. The KEOPS1 cruise was conducted in the Central Kerguelen Plateau area in austral summer 2005, during the decline of the bloom (Blain et al., 2007). The complementary KEOPS2 cruise was mostly conducted in the Northern Kerguelen Plateau area in spring 2011, during the onset of the bloom (Carlotti et al., 2015; Figure 1).
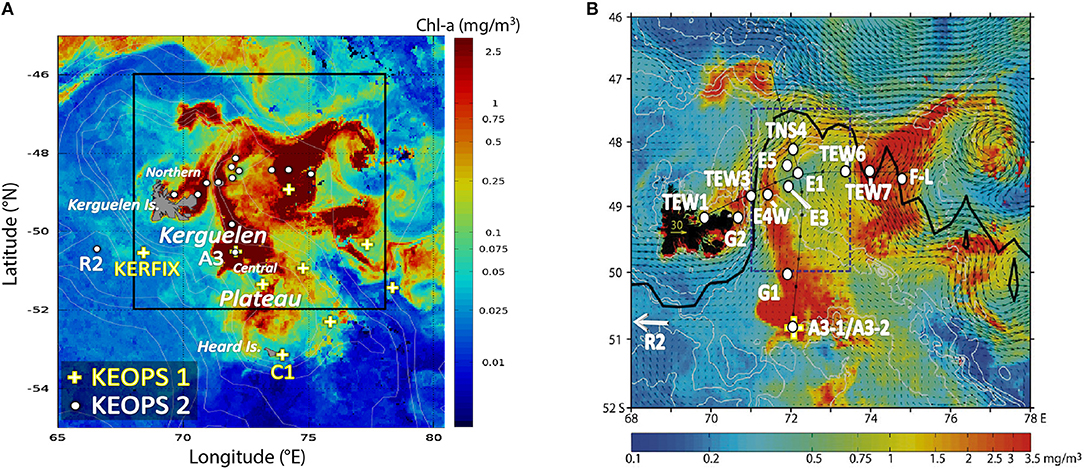
Figure 1. (A) Location of the REE samples collected during KEOPS1 (yellow crosses and upper case names; Central Kerguelen Plateau area) and KEOPS2 cruises (white dots and upper case names; Northern Kerguelen Plateau area), in the Indian sector of the Southern Ocean. White italic names refer to topographical features. (B) Zoom on the KEOPS2 area [defined in (A) by the black square], which details the station names. The stations are superimposed on the composite chlorophyll-a surface concentration map, derived from chlorophyll satellite images from 19 October to 19 November 2011, overlaid in (B) by the mean surface velocity field over the same period (arrows, scale shown in yellow on the Kerguelen Islands) and the hydrography-derived climatological Polar Front (thick black line), by courtesy of Young-Hyang Park and co-authors (Figure 6 of Park et al., 2014, reproduced with permission).
The major dissolved Fe sources to the upper ocean are considered to be the dissolution of atmospheric aerosols and of sedimentary particles deposited onto continental margins (Coale et al., 1996; Johnson et al., 1999; Elrod et al., 2004; Blain et al., 2008; Tagliabue et al., 2009; Jeandel et al., 2011; Labatut et al., 2014). Similarly to Fe, rare earth elements (REEs) are supplied to the oceans from the continents (Goldstein and Hemming, 2003), notably from the dissolution of sedimentary particles deposited onto shelves and upper slopes (Jeandel et al., 1998; Lacan and Jeandel, 2001, 2005; Grenier et al., 2013). As in many other areas (Arsouze et al., 2007; Jeandel et al., 2011; Radic et al., 2011), the sedimentary source was suggested to be the dominant source of Fe and REEs in seawater in the central part of the Kerguelen Plateau, refueling the stocks through vertical supplies from the plateau sediments (Blain et al., 2008; Zhou et al., 2014) or through lateral advection of supplies from the continental shelf of Heard Island (van Beek et al., 2008; Zhang et al., 2008; Chever et al., 2010). KEOPS1 results revealed that marine Fe and REEs had the same main sedimentary origin in the Kerguelen area, underlining the relevance of the use of REEs to trace the local lithogenic sources and their transport along the circulation for the complementary KEOPS2 project.
REEs are a set of elements with similar atomic structure and chemical properties and hence behave coherently in natural systems (Elderfield and Greaves, 1982; Elderfield, 1988). They are mostly found in the 3+ oxidation state and are particle reactive, exhibiting increasing concentrations with depth (e.g., Elderfield, 1988). Despite their chemical coherence, several processes (e.g., adsorption, re-mineralisation, scavenging, oxidation, etc.) may cause slight fractionations within the group with respect to the average continental source, which are revealed by shale-normalized REE patterns. A typical open-ocean shale-normalized REE pattern displays a heavy REE (HREE; Tb-Lu) enrichment relative to the light REE (LREE; La-Gd) that has commonly been attributed to preferential LREE scavenging by marine particles (Elderfield, 1988; Byrne and Kim, 1990; McLennan, 1994). However, it was also recently attributed to dissolution of HREE-enriched diatom opal (Akagi et al., 2011). In addition, the shale-normalized REE pattern is typically depleted in dissolved cerium (Ce3+) relative to its neighboring REEs, due to the low solubility of the oxidized form of this element (Ce4+; Elderfield, 1988; Byrne and Kim, 1990; Moffett, 1990; Bertram and Elderfield, 1993; Sholkovitz et al., 1994; German et al., 1995; Tachikawa et al., 1999b). Variations from this typical pattern can provide information on the types of processes occurring during particulate-dissolved exchange. Close to a lithogenic source, the Ce anomaly will tend to be much smaller and the shale normalized Ndn/Ybn ratio much higher than in the open-ocean; however, the dissolved REE pattern may also reveal specific characteristics of the geological nature of the weathered lithogenic matter (Sholkovitz et al., 1999; Chavagnac et al., 2007, 2008; Zhang et al., 2008; Grenier et al., 2013). The dissolved REE pattern may be influenced by additional processes occurring in situ in the water column, i.e., exchanges between the dissolved phase and authigenic inorganic or biological particles such as calcium carbonate, opal, barite, organic matter, or Fe/Mn oxy-hydroxide coatings (Sholkovitz et al., 1994; Lerche and Nozaki, 1998; Alibo and Nozaki, 1999; Tachikawa et al., 1999b; Nozaki and Alibo, 2003; Haley et al., 2004, 2014; Hara et al., 2009; Akagi et al., 2011; Stichel et al., 2012; Garcia-Solsona et al., 2014; Molina-Kescher et al., 2014; Strady et al., 2015; Shiller et al., 2017).
Among the LREEs, neodymium (Nd) is studied to a greater extent because its radiogenic isotopic composition (IC), expressed as εNd1, is a useful tool to trace oceanic processes given that it is not affected by biological or thermodynamic fractionation. As the εNd of the rocks varies according to their nature, and more specifically according to the age and samarium content of the rock, the εNd of the rocks outcropping around the ocean margins is heterogeneous and tags the seawater accordingly, mostly through particle dissolution (Jeandel et al., 2007). Furthermore, because Nd has an oceanic residence time long enough to be transported within the global thermohaline circulation without complete homogenization (Tachikawa et al., 1999a; Siddall et al., 2008; Arsouze et al., 2009), εNd variations of a water mass along its circulation are a powerful tracer of lithogenic supplies to the ocean and/or tracer of mixing with a water mass tagged by a distinct εNd signature (Piepgras et al., 1979; Frank, 2002; Goldstein and Hemming, 2003; Tachikawa et al., 2003, 2004; Lacan and Jeandel, 2004, 2005; Carter et al., 2012; Grenier et al., 2013, 2014; Jeandel et al., 2013; Garcia-Solsona et al., 2014; Osborne et al., 2014).
Recent publications of lithogenic tracer distributions measured in the framework of the KEOPS2 project have already brought complementary information to the KEOPS1 results. Notably, high contents of radium isotopes (including the short-lived nuclides) were observed in the eastern Kerguelen coastal waters and also further east both north and south of the PF indicating recent input of waters that had interacted with the shallow sediments of the Kerguelen plateau, and suggesting rapid transport of these waters across the PF (Sanial et al., 2015). These results led to the conclusion that the PF does not act as a complete physical barrier for the south-eastward transport of lithogenic material of Kerguelen origin. These observations were corroborated by the dissolved Fe and particulate trace metal distributions (Quéroué et al., 2015; van der Merwe et al., 2015). These latter studies have also presumed a contribution from direct fluvial runoff and/or glacial melting from the Kerguelen and Heard Islands. Other works characterized different spatial and temporal systems of production, remineralization, and export associated with the Kerguelen phytoplankton bloom (e.g. Christaki et al., 2014; Jouandet et al., 2014; Lasbleiz et al., 2014; Jacquet et al., 2015; Laurenceau-Cornec et al., 2015; Planchon et al., 2015; Trull et al., 2015). Discerning the impacts that these different processes may have on local REE distributions is very useful given the expanding use of REEs to explore biogeochemical cycles.
The KEOPS2 work presented here seeks to complement the KEOPS1 observations of Zhang et al. (2008) regarding the REE distributions in the Kerguelen Plateau area during the productive season, focusing on the sources, transport and fate of the dissolved REEs in this naturally fertilized region. More precisely, this paper presents the dissolved REE concentrations and Nd IC of 13 supplementary stations collected upstream, over and downstream of the Northern Kerguelen Plateau, from coastal areas to deep offshore stations, north and south of the PF, in and outside of the phytoplankton bloom core. This diverse sampling aims to characterize the REE features in the different environments that compose the area in order to investigate the lithogenic supplies and authigenic processes—inorganically or biologically mediated—that shape the local REE distribution. This work contributes to the larger KEOPS objective to characterize the Kerguelen Plateau, a key area of the Southern Ocean in terms of ecosystems and the carbon dioxide biological pump.
Hydrological Features of the Stations
Location of the Stations in the Regional Physical and Biological Context
Station locations are represented in Figure 1 on the composite chlorophyll-a surface concentration map, derived from chlorophyll-a satellite images from 19 October to 19 November 2011, overlaid in Figure 1B by the mean surface velocity field over the same period, by courtesy of Young-Hyang Park and co-authors (Figure 6 of Park et al., 2014). The largescale view (Figure 1A) shows the location of stations sampled for the REE analysis—hereafter “REE stations”—during the two KEOPS cruises. The KEOPS1 sampling (Zhang et al., 2008) mostly documented the central part of the plateau, extending as far south as the Heard Island coastal station, whereas the KEOPS2 cruise (austral spring 2011) mostly documented the northern part of the plateau, and offshore waters east of the Kerguelen Islands. West of the Kerguelen Islands, KERFIX and R2 were chosen as reference stations for Antarctic Circumpolar Current waters prior to contact with the Kerguelen Plateau for KEOPS1 and KEOPS2, respectively. Over the Central Plateau, at the location displaying the highest chlorophyll-a content, station A3 was sampled twice during KEOPS1 and reoccupied and sampled twice again during KEOPS2, around the beginning and the end of each cruise. This repeated sampling of the same site at four different times of the bloom season provides a time series perspective.
Zooming in on the area delimited by the black square in Figure 1A allows us to focus on the location characteristics of the KEOPS2 stations (Figure 1B). Kerguelen coastal waters were sampled at two stations, TEW1 and G2, which were the only stations located north of the Polar Front (PF; thick black line, from Park et al., 2014). Four stations were located in the PF vicinity: R2, west of the Kerguelen Plateau; TEW3, northeast of the coastal stations, over the plateau, surrounded by chlorophyll-a-rich waters on its western side and a tongue of low surface chlorophyll concentration on its eastern side; TEW7 and F-L, in the eastern part of the cyclonic meander structure of the PF, marked by high surface chlorophyll concentrations.
All the other stations were located south of the PF. Two stations were sampled over the plateau: A3 (visited twice: A3-1 and A3-2), and G1, north of A3 and located in the same high surface chlorophyll-a concentration patch that extends northward (Figure 1). The other stations were sampled in the PF cyclonic meander area. Turning clockwise from the west, E4-W, TNS4, and TEW6 were located within the strong flow of the recirculation, marked by a decreasing gradient of surface chlorophyll concentrations from high to moderate (from ~3.5 to ~1 mg m−3). Going from E5 to E3 to E1, the chlorophyll-a concentration decreased from moderate to low, similarly to the flow strength, E1 being located in the vicinity of the recirculation center. The complex topography and circulation scheme characterizing the Kerguelen Plateau region have been suggested to play an important role in the mosaic structure of the phytoplankton bloom observed in Figure 1 (Lasbleiz et al., 2014; Park et al., 2014; d'Ovidio et al., 2015; Sanial et al., 2015). They also largely explain the variety of water masses observed locally, as described below.
Water Mass Characteristics
The water masses observed at the stations sampled during KEOPS2 were characterized with potential temperature-salinity θ-S and theta-oxygen θ-O2 diagrams (Figure 2), from surface to bottom.
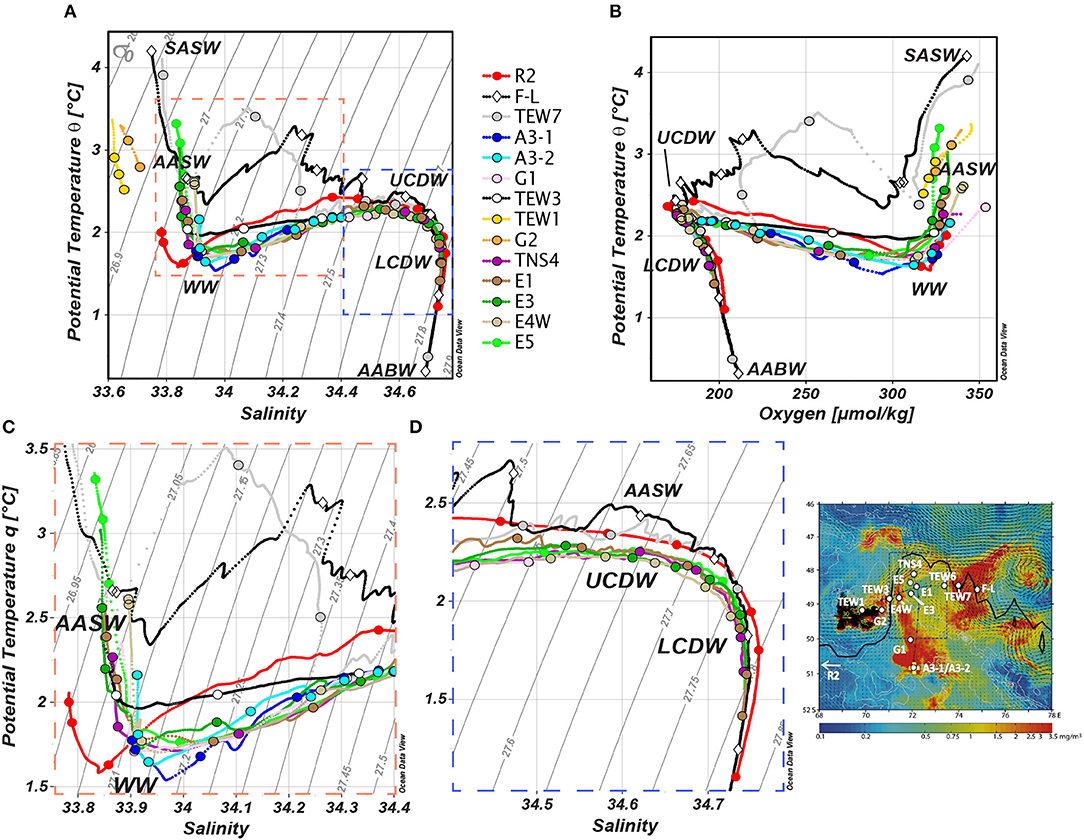
Figure 2. (A) Potential temperature (θ, in °C)-salinity (S) plots and (B) potential temperature (θ, in °C)-oxygen (O2, in μmol kg−1) for the stations indicated in Figure 1B. Water masses are identified in black (SASW, Subantarctic Surface Water; AASW, Antarctic Surface Water; WW, Winter Water; UCDW & LCDW, Upper & Lower Circumpolar Deep Water; AABW, Antarctic Bottom Water). REE samples are identified by colored dots. Potential density contours are shown by the gray lines. The red and blue dashed squares in (A) define the θ-S zooms of the surface/subsurface waters and deep waters that are shown in (C,D), respectively.
The coastal stations TEW1 and G2 were very shallow stations (< 100 m) that exhibited homogeneous waters, relatively warm and distinctly fresher than the offshore stations (θ = [2.5–3.5] °C; S = [33.6–33.7]; Figure 2A). This feature likely reflects freshwater supplies from the Kerguelen Islands (van der Merwe et al., 2015). However, they have the same range of oxygen concentrations than all the other surface waters (O2 = [320–350] μmol kg−1; Figure 2B). These coastal waters were clearly distinct from the surface mixed layer waters of station TEW3, which exhibited saltier, colder, and thus denser waters, these hydrological characteristics being in the ranges typical of the Antarctic Surface Water (AASW) that flows south of the PF (S ~ 33.85; θ = [2.0–2.5] °C; Figure 2C). Thus, TEW3 is likely located in the vicinity of the southern side of the PF (Park et al., 2014). Among the other stations located in the vicinity of the PF, the reference station R2 exhibits fresher AASW than TEW3 (S ~ 33.8). Stations F-L and TEW7 exhibit surface waters as fresh as R2 but warmer than all the other surface waters of the REE stations (θ = [3.0–4.0] °C; Figure 2A), revealing some influence of Subantarctic Surface Water (SASW), flowing in the Polar Frontal Zone (PFZ), between the Polar Front (PF) and the Subantarctic Front (SAF; Park et al., 2014). The surface waters of the stations located south of the PF were mainly AASW. The “purest” AASW hydrological characteristics were observed at the southernmost station (i.e., station A3; S ~ 33.9; θ ~ 2.0°C). Northward, closer to the PF in the recirculation area, the influence of the warmer and fresher SASW was observed (Figure 2C).
Below the surface waters lies the Winter Water (WW), likely advected into the study area from the southeast of the Kerguelen Islands (Park et al., 2014) and characterized by a temperature minimum centered at approximately 180 m depth (potential density σθ ~ 27.15 kg m−3; Figure 2C). All the stations located south of the PF show similar WW features (S ~ 33.95; θ ~ 1.7°C; O2 = [260–325] μmol kg−1). By contrast, the stations sampled in the vicinity of the PF show distinct patterns around this density: the WW found at station R2 was significantly fresher and colder in its core (S ~ 33.85; θ ~ 1.6°C; z = 180 m) than the one found at the stations south of the PF. However, it warms more quickly with depth (θ ~ 2.0°C at 250 m). The WW at station TEW3 was slightly fresher and warmer (S ~ 33.90; θ ~ 2.0°C; O2 ~ 300 μmol kg−1) than the one found at the stations south of the PF. The most distinguishable features around this density are however observed at stations TEW7 and F-L, which exhibit much warmer, saltier and less oxygenated subsurface waters (θ = [2.5–3.5] °C; S ~ 34.10; O2 = [225–260] μmol kg−1). Following Park et al. (2014), these waters were likely associated with intrusion of PFZ subsurface waters occurring during recent frontal exchange with the SAF. The warmer and saltier contents found at R2 and TEW3 may also be, although to a lesser extent, imprints of some PFZ water influence.
These PFZ exchanges seem to be able to impact the profiles of the stations of this PF area until depths >1,000 m, as suggested by the “noisy” warmer θ-S profile of stations TEW7 and F-L at the depth range of the Upper Circumpolar Deep Water (UCDW; Figure 2D; Park et al., 2014). The UCDW is characterized by typical oxygen concentration minima and local temperature maxima between 500 and 1,000 m depth (θ ~ 2.3°C; O2 ~ [170–180] μmol kg−1). The deeper salinity maximum (S ~ 34.75) centered on 1,800 m characterizes the core of the Lower Circumpolar Deep Water and was, as for the UCDW, sampled at all the stations located off the plateau. Finally, the fresher, colder and more oxygenated Antarctic Bottom Water (AABW; S ~ 34.7; θ ~ 0.8°C; O2 ~ 210 μmol kg−1) was sampled only at the bottom of the two deepest stations TEW7 and F-L.
Analytical Methods
Each station was sampled at several depths covering the whole water column. All sample handling, processing and measurements were performed in accordance with general GEOTRACES protocols (http://www.geotraces.org/, http://www.geotraces.org/images/stories/documents/intercalibration/Cookbook_v1_2010.pdf). Water samples were collected using 12 L Niskin bottles equipped with Teflon-coated springs and mounted on a rosette frame with a CTD sensor. The samples were filtered on-board through SARTOBRAN 150 0.45/0.2 μm pore size filters, these latter being pre-cleaned with 10 L of Milli-Q water (except one coastal sample that remained unfiltered and had afterwards to be digested to dissolve or eliminate matter prior to be loaded on the first chromatographic columns). The filters were preconditioned with 500 mL of the seawater sample before the beginning of the filtrate collection. About 10 L of filtrate were recovered in an acid-cleaned cubitainer for Nd IC analysis, then an aliquot of 500 mL was collected in an acid-cleaned 500 mL Nalgene low-density polyethylene bottle for dissolved REE concentrations. All water samples were acidified to pH = 2 with twice-distilled HCl and stored at room temperature.
Rare Earth Element Concentrations
All sample treatments were performed in a clean lab. Similarly to KEOPS1 REE analyses (Zhang et al., 2008), the REE purification and preconcentration of KEOPS2 samples were performed following the method published by Tachikawa et al. (1999b) and Lacan and Jeandel (2001). Briefly, the acidified seawater samples were spiked with 150Nd and 172Yb. Then 2.5 mg of Fe (dissolved and purified FeCl3) were added, and samples were vigorously shaken. After isotopic equilibration for at least 24 h, the pH was increased to 7–8 by addition of Suprapur NH4OH, yielding REE–Fe(OH)3 co-precipitation. The precipitate was then extracted by centrifugation and rinsed 5 times with deionized water in order to remove salts. After dissolving the precipitate in 1 mL of 6 M HCl, an anion exchange column (AG 1X8; 2 mL) was used to extract the REE from the remaining matrix (mostly Fe). REE concentrations were then measured on a high resolution (sector field) Inductively Coupled Plasma Mass Spectrometer (ICP-MS; Thermo Scientific Element XRTM) by the external standard method, while Nd and Yb were additionally determined by isotopic dilution. Comparison of these two methods allowed us to determine the analytical recovery, equal to 83% for Nd and to 79% for Yb on average. Linear interpolation and extrapolation relative to mass was then used to estimate the recoveries for the other REEs. A desolvating nebulizer (Aridus II) was coupled to the Element XR in order to minimize oxide formation and, thus, oxide interferences (CeO < 0.05%; Chung et al., 2009; Pahnke et al., 2012). Notably, this substantially reduced interferences of barium oxides (BaO) on 151Eu, 152Sm, and 153Eu (BaO interferences equal to 0–1% of the Eu signal; see Grenier et al., 2013), which are otherwise too high to be accurately corrected, leading to potential miss-estimations of Eu and Sm concentrations. Note that REE measurements of KEOPS1 samples were done without the use of a desolvating system and might have resulted in less accurate corrections of BaO interferences (Zhang et al., 2008); nevertheless, several arguments make us believe that the comparison of some KEOPS1 REE characteristics with the KEOPS2 dataset, including Eu, is legitimate and valuable, as discussed further. The accuracy of our analyses was assessed using the certified river water reference material SLRS-5. Our measurements were characterized by a bias on Nd between 0.5 and 3% and a precision on Nd concentration of 4%, both with a 95% confidence interval (2σ), based on replicates (A3-2 354 m and E4-W 1,382 m; Table 1). The average total procedural blank (n = 15) was equal or lower than 0.3% of the analyzed REE3+ signal (averaged on 109 measurements) except for Ho (0.8%) and for Ce4+ (4.5%). The whole analytical procedure was validated through our successful participation in the GEOTRACES intercalibration exercise (van de Flierdt et al., 2012; Behrens et al., 2016).
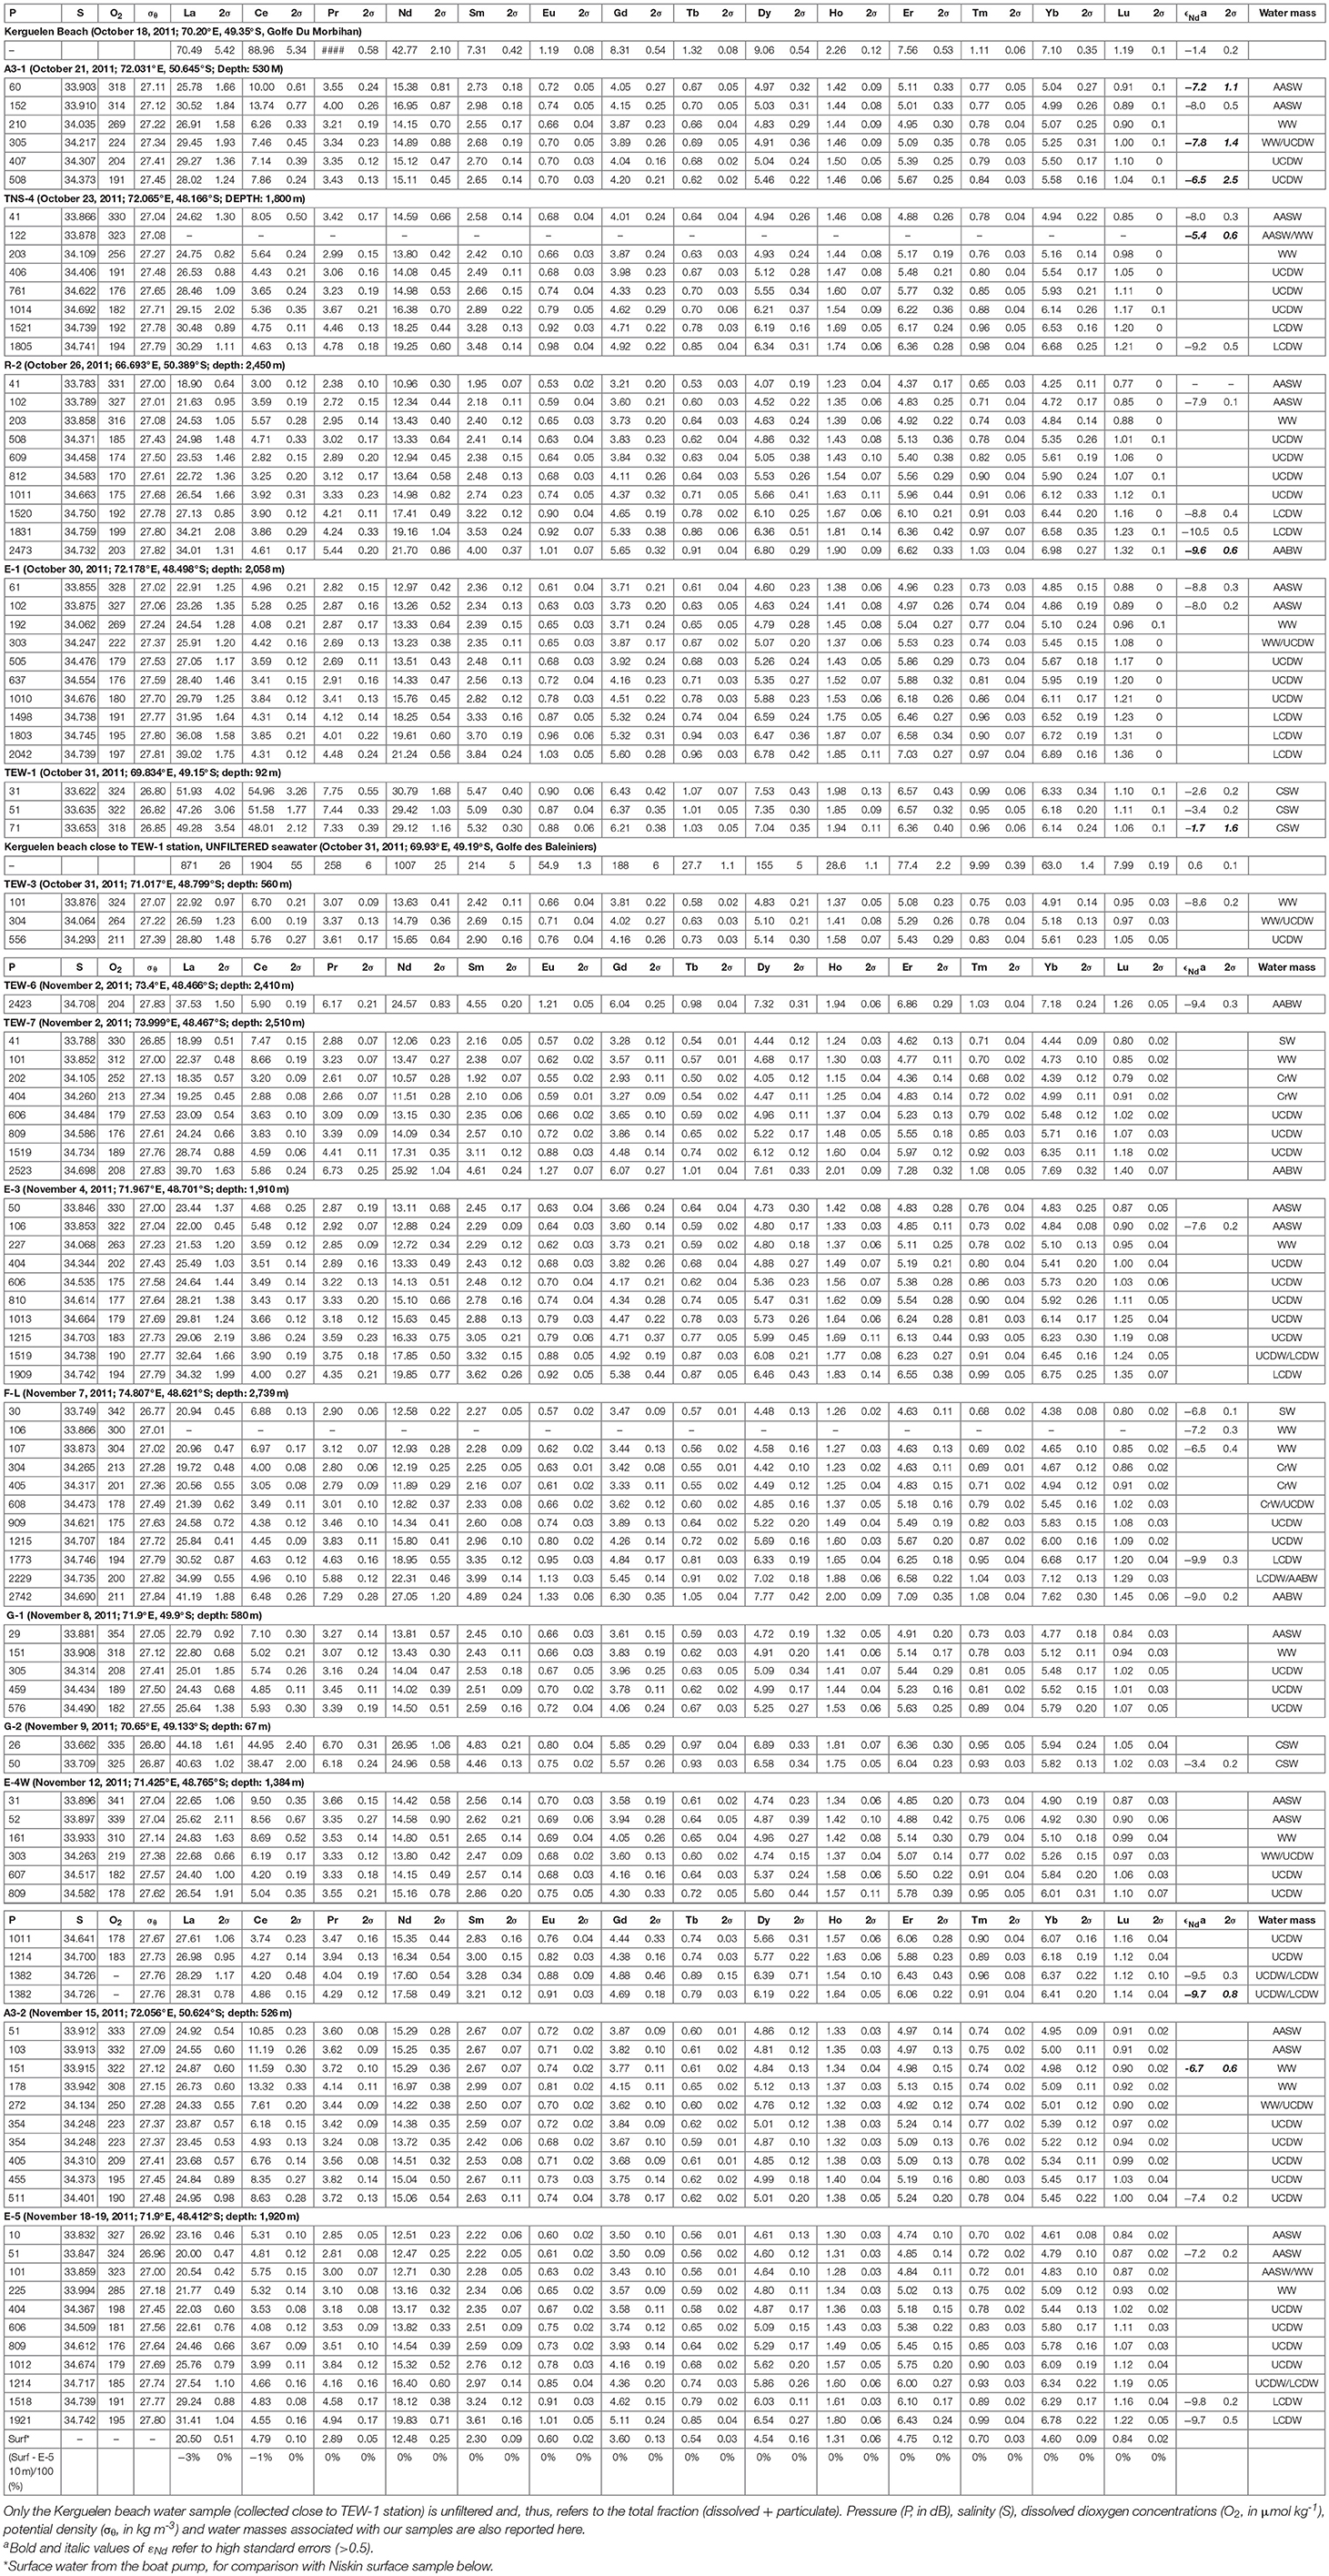
Table 1. Dissolved REE concentrations (in pmol kg−1) and εNd measured in our samples, with their associated standard errors (2σ; ICP-MS method uncertainty—i.e., internal reproducibility of each element intensity for 2 runs of 5 passes– associated with each sample measurement after post-processing, i.e., including oxide rate and spike calibration uncertainties).
Neodymium Isotopic Compositions
Pre-concentration for Nd IC was performed either on board or in the land-based laboratory (LEGOS, Toulouse, France). To do that, Suprapur ammonium hydroxide was added to each 10 L sample to obtain a pH of 3.8 ± 0.2, necessary to quantitatively pre-concentrate all the REEs by slowly (max flow rate of 20 mL min−1) passing the water sample through SEP-PAK C18 cartridges (2 per sample), previously impregnated with 300 mg of complexing agent HDEHP.H2.MEHP (Shabani et al., 1992). The pre-concentrated REE on C18 cartridges were later eluted in the LEGOS laboratory. For that, 5 mL of 0.01 M HCl (flow rate of 20 mL min−1) were first passed through the cartridge to eliminate the remaining major salts and barium. Then, 35 mL of 6M HCl were used to elute the REE (and some remaining traces of other elements). The eluted sample was evaporated and treated with 0.1 mL of 16 M HNO3 to eliminate organic matter via further evaporation. Subsequently, two chemical extractions were performed: (i) a chromatographic extraction using cationic resin (Dowex AG 50WX8, 200–400 mesh; 1.4 mL) to separate the REEs from the remaining ions (traces of Fe, Ca, Sr, Ba, Mg) and (ii) a final separation of Nd from the other REE using a second cation exchange column with alpha-hydroxyisobutyric acid (α-HIBA) as the eluent (Choppin and Silva, 1956). This α-HIBA separation method was beforehand validated by comparison with the Ln Spec separation method (Pin and Zalduegui, 1997). All measurements were made using Thermo Ionization Mass Spectrometers (TIMS) equipped with multicollectors (THERMO MAT 261 in Toulouse and THERMO Triton in Brest) and were mass bias corrected using 146Nd/144Nd ratio of 0.7219. External precision and accuracy of both mass spectrometers were determined using La Jolla international Nd reference material. Thirteen analyses of La Jolla standard were performed to monitor instrumental drift and gave 0.511853 ± 0.000010, within the uncertainty of the generally accepted reference value of 0.511860 ± 0.000020. Blank contributions to the Nd isotopic measurement were of 6 pg on average, i.e., lower than 1% of the total signal. As for the REEs, the performance of our seawater Nd isotopic analyses was certified through the GEOTRACES intercalibration exercise (van de Flierdt et al., 2012).
Results
Results are given in Table 1 and are displayed in Figures 3–5. For the sake of simplicity, we have shown the concentration vertical profiles of only some REEs: the lightest (La), the most particle-reactive REE in seawater (Ce), the two ones used for the isotope dilution (Nd and Yb –Yb being also representative of the heavy REEs) and two middle REEs (Eu and Dy; Figure 3). The REE fractionation patterns are shown by normalizing their concentrations to the average post-Archean upper continental crust (Post Archean Australian Shale, referred as the acronym “PAAS” hereafter; McLennan, 1989) to highlight changes from the crustal input (Elderfield, 1988). Such normalization allows us to eliminate the effect of Oddo-Harkin's Rule (whereby even atomic-numbered elements are more abundant than odd atomic-numbered elements; Schmidt et al., 1963), making any fractionation of an individual REE more discernible (Figure 4). Finally, some of these fractionations—for La, Ce, Eu, and Yb—are converted into anomalies that are calculated as follows:
where [X]n refers to the concentration of the element X normalized to the concentration of this same element X in the PAAS standard [Equations (1) and (2) from Bolhar et al. (2004); Equations (3) and (4), respectively derived from the Gd anomaly expression of Bau et al. (1996), and from the Lu anomaly expression of Garcia-Solsona et al. (2014)]. The propagation of uncertainty is determined from these equations for each anomaly and detailed in the Supplementary Material. We refer to positive anomalies when they are >1, negative when lower than 1. Anomalies are defined as weak if close to 1, strong if much below or much above 1.
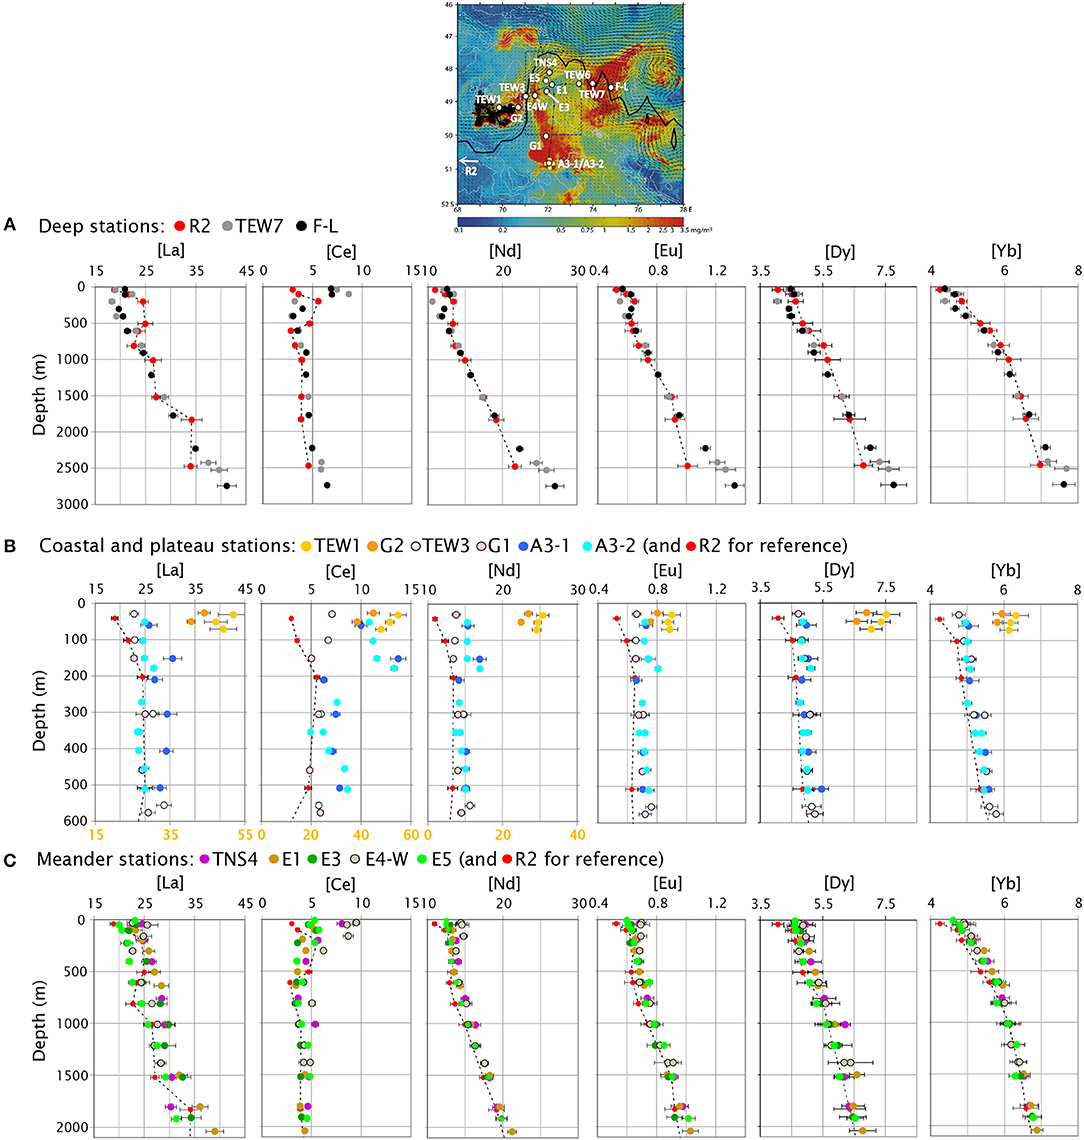
Figure 3. Vertical profiles of the concentrations (in pmol kg−1) of the lightest REE La, the most particle-reactive REE in seawater Ce, the two ones used for the isotope dilution Nd and Yb—Yb being also representative of the heavy REEs—and the middle REEs Eu and Dy, for (A) the deep stations R2, TEW7, and F-L, in the vicinity of the PF; (B) the coastal and plateau stations TEW1, G2, TEW3, G1, A3-1, and A3-2; and (C) the stations located in the meander area TNS4, E1, E3, E4-W, and E5. The data of the station R2, station defined as the high-nutrient low-chlorophyll reference station, are reported for comparison in (B,C) (profile represented by the red dots and gray dashed line). Note the larger scale for La, Ce, and Nd concentrations associated with the samples of the coastal stations TEW1 and G2 [yellow secondary horizontal axis in (B)]. Error bars represent the ICP-MS method uncertainty associated with each sample measurement.
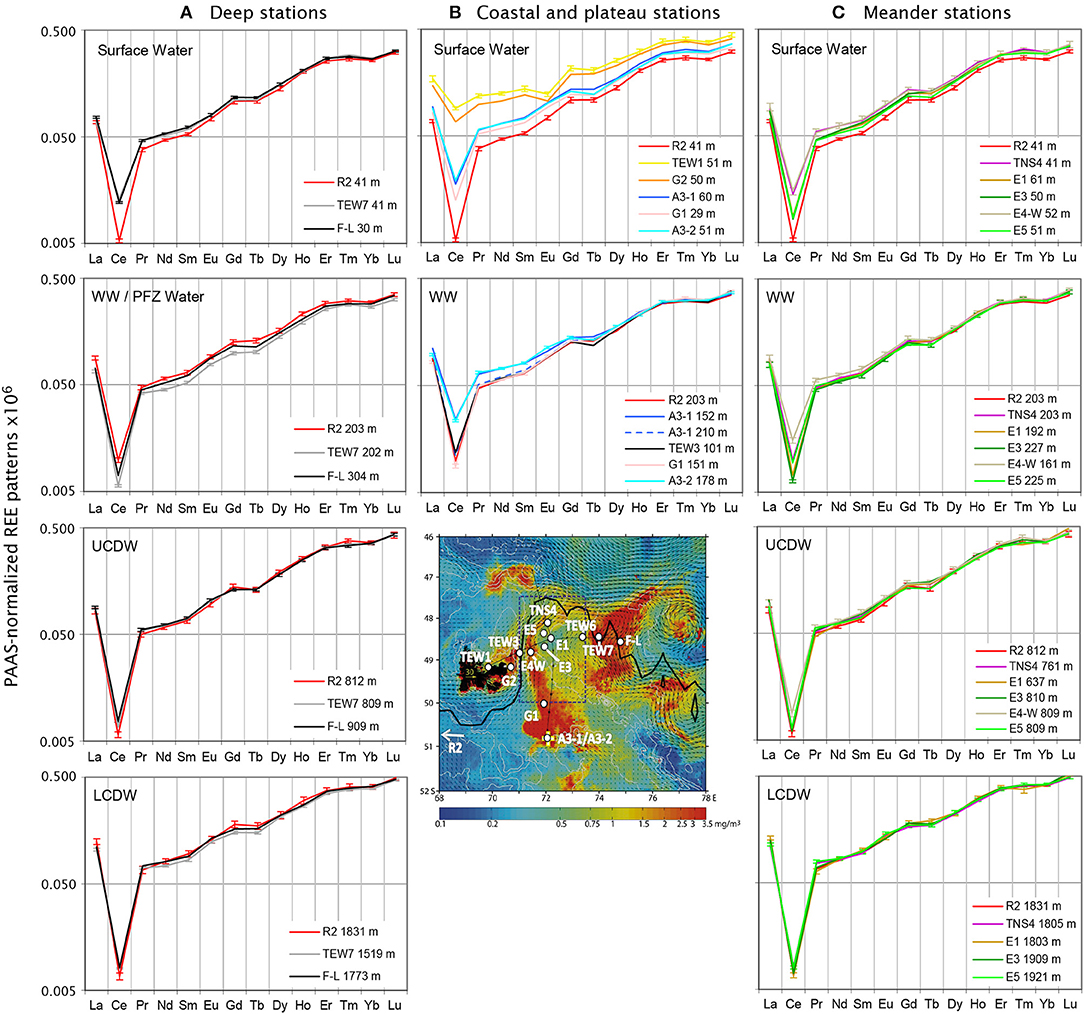
Figure 4. PAAS-normalized REE patterns (PAAS, Post-Archean Australian Shale; McLennan, 1989; logarithmic scale) of the surface waters, the Winter Water (WW)/Polar Frontal Zone (PFZ) Water, the upper and the lower Circumpolar Deep Water (UCDW and LCDW), from top to bottom, for, as in Figure 3, (A) the deep stations R2, TEW7, and F-L, in the vicinity of the PF; (B) the coastal and plateau stations TEW1, G2, TEW3, G1, A3-1, and A3-2; and (C) the stations located in the meander area TNS4, E1, E3, E4-W, and E5. As in Figure 3, the patterns of the station R2 are reported for comparison in (B,C) (red pattern). For the sake of clarity, associated error bars are shown for some patterns only. They represent the ICP-MS method uncertainty associated with each sample measurement.
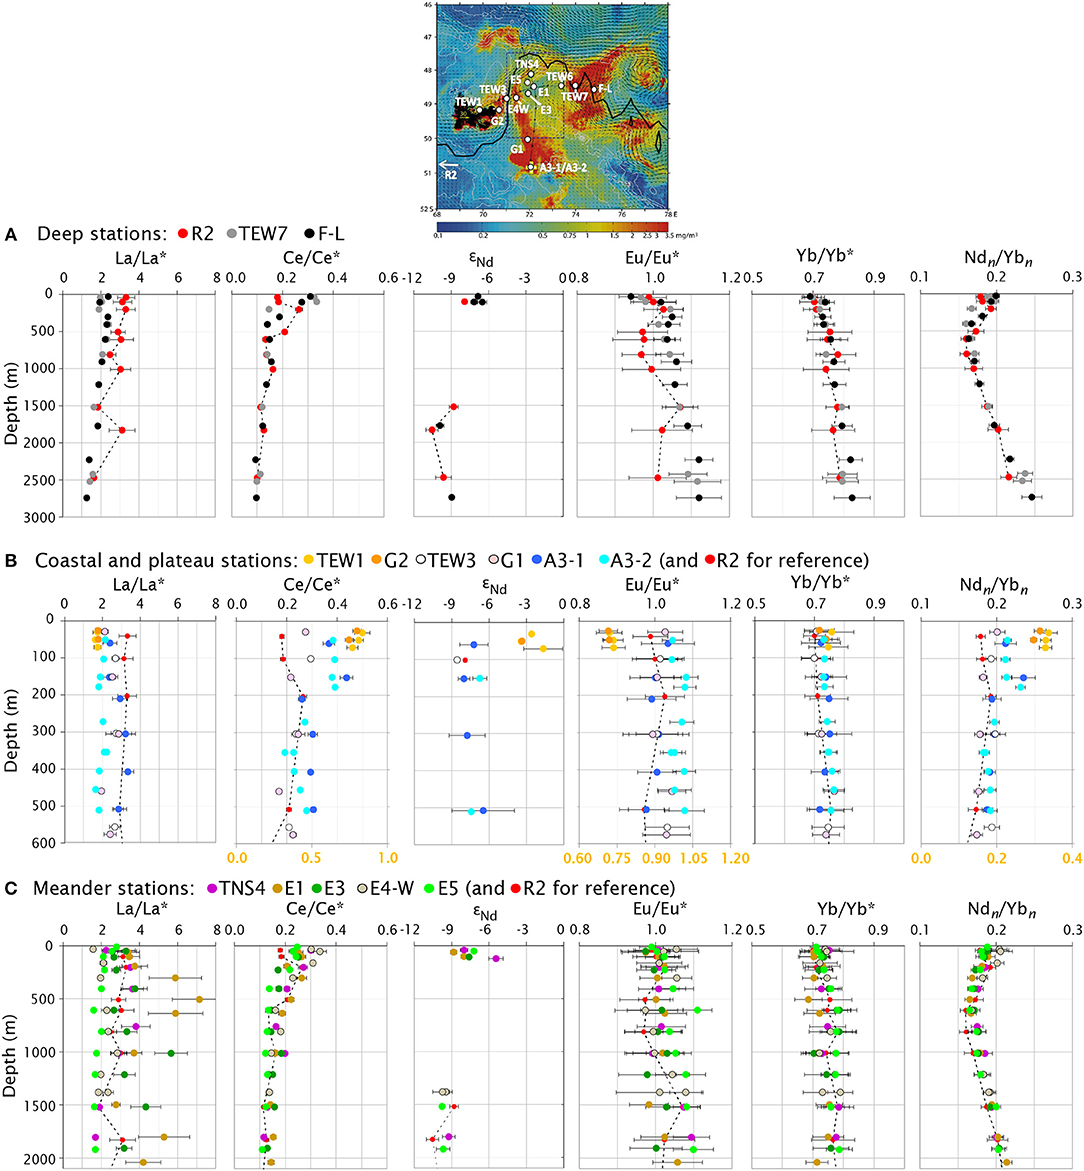
Figure 5. Vertical profiles of the anomalies of La (La/La*), Ce (Ce/Ce*), Eu (Eu/Eu*), and Yb (Yb/Yb*), calculated following Garcia-Solsona et al. [2014; Equations (1–4) in the text], and of Ndn/Ybn, from the PAAS-normalized REE patterns shown in Figure 4. The vertical profiles of the dissolved Nd isotopic composition, expressed as εNd, are also shown. These six parameters complement the vertical profiles of the concentrations shown in Figure 3. As in Figures 3, 4: (A) deep stations R2, TEW7, and F-L, in the vicinity of the PF; (B) coastal and plateau stations TEW1, G2, TEW3, G1, A3-1, and A3-2; and (C) stations located in the meander area TNS4, E1, E3, E4-W, and E5. Also, as in Figures 3 and 4, the data of station R2 are reported for comparison in (B,C) (profile represented by the red dots and gray dashed line). Note the larger scale of Ce/Ce*, of Eu/Eu*, and of Ndn/Ybn associated with the coastal sample parameters of stations TEW1 and G2 [yellow secondary horizontal axis in (B)]. Error bars are given for each parameter, representing the TIMS method uncertainty (2σ) for εNd and the uncertainty propagation from the anomaly Equations (1–4) for the other profiles (see the Supplementary Material for details).
Along with these anomalies, two complementary parameters are also shown: (i) the Ndn/Ybn vertical profiles, which give information about the slope of the normalized pattern, and thus, information about the relative importance between potential recent lithogenic supplies and authigenic processes; (ii) the vertical profiles of Nd isotopic composition εNd, which give information about the potential occurrence of elemental inputs or water mass mixing.
All the results are similarly displayed, divided into three groups of stations: (i) the deep stations R2, TEW7, and F-L, in the vicinity of the PF; (ii) the coastal and plateau stations TEW1, G2, TEW3, G1, A3-1, and A3-2; and (iii) the stations located in the PF cyclonic meander area TNS4, E1, E3, E4-W, and E5 (subplots a, b, and c of Figures 3, 5, respectively). Because station R2 was considered as the high-nutrient low-chlorophyll reference station, R2 data were also reported in the subplots of the shallow (coastal and plateau) stations and meander stations for comparison (Figures 3–5).
On a broad geographical scale, our results are consistent with the dissolved REE concentrations and εNd data from the literature that are measured upstream in the Southern Ocean, in the southeast Atlantic Ocean, and especially with those measured between the Polar Front and the southern Antarctic Circumpolar Front (see Table 2 for comparison with German et al., 1995; Stichel et al., 2012; Garcia-Solsona et al., 2014; Hathorne et al., 2015). Our results are also in agreement with those found by Zhang et al. (2008) in the same area, during KEOPS1 (Table 2). The main difference between the REE dataset reported upstream and in the Kerguelen area is observed for the Ce concentrations, which reach much higher values in the coastal environment of KEOPS1 and KEOPS2 areas compared to the open ocean environment of the upstream stations. These locally high Ce concentrations will be discussed in the following section.
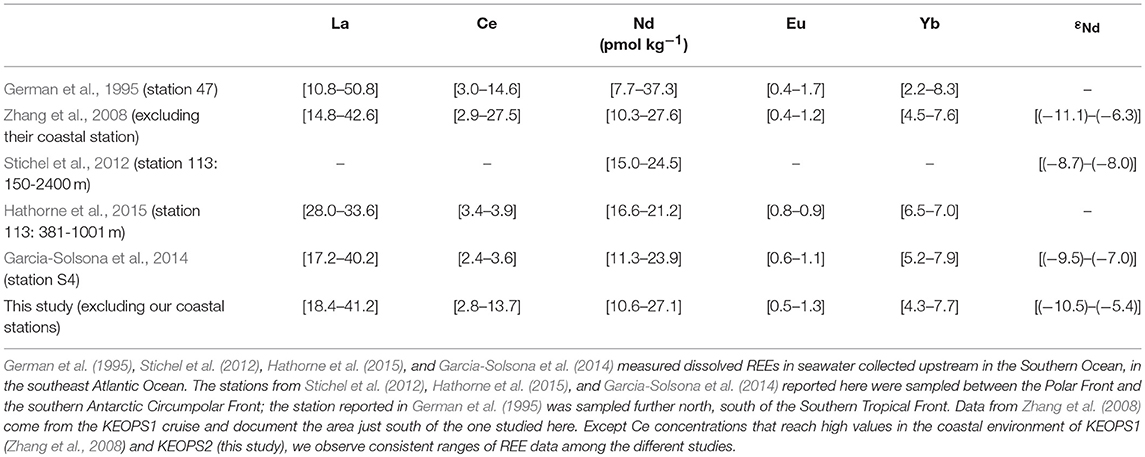
Table 2. Comparison of our data with those from the literature.
Deep Stations, on the Edges of the PF
Above 500 m depth, we observe three distinct features when considering the deep stations located on the edges of the PF. The first one is the convex shape of the R2 concentration profiles between 100 and 500 m depth, especially pronounced for the light and middle REEs (LREE—La to Nd—and MREE—Sm to Dy, respectively), which is not observed in stations TEW7 and F-L. These subsurface R2 samples are also characterized by a weaker Ce anomaly (higher Ce/Ce* value) and a weaker Ndn/Ybn slope (higher Ndn/Ybn value; Figure 5A). All these characteristics suggest that recent lithogenic supplies are influencing the area of station R2, which challenges its definition as a “reference station.” The second distinct feature in the upper layer of the deep stations is the high LREE concentrations observed in the first 100 m at TEW7 and F-L, which are higher than in the underlying subsurface waters, especially pronounced in Ce (Figure 3A). These high Ce concentrations are associated with weak Ce anomalies (~0.3), weak Ndn/Ybn slopes and slightly negative Eu anomalies, especially for the surface water sampled at station F-L (Surface Water subplot of Figure 4A, 5A). The εNd of the F-L surface water is also relatively high, compared to that measured at R2 (F-L: εNd = −6.8 ± 0.1; R2: εNd = −7.9 ± 0.1). Similar to the WW at station R2, these SASW also seem to be tagged by recent lithogenic inputs. The origin of these supplies will be discussed in the next section. The third distinct feature is the very low concentrations found between 200 and 500 m at F-L and TEW7 compared to all the other stations. These low concentrations, the lowest of our study, may reflect the different origin of the waters flowing at these depths. As discussed in the hydrological section, these waters are significantly warmer than the waters flowing at the same depth range at the other stations and are therefore thought to come from the SAF area. Their REE contents are in the same range as those found in the SAF area of the southeastern Atlantic Ocean (German et al., 1995: Nd = [9.5–11.0] pmol kg−1; Hathorne et al., 2015: Nd = [9.6–10.9] pmol kg−1; Stichel et al., 2012: Nd = [10.3–11.8] pmol kg−1; Garcia-Solsona et al., 2014: Nd = [9.5–11.0] pmol kg−1; this study: Nd = [10.6–12.2] pmol kg−1).
Below 500 m, the deep stations exhibit increasing REE concentrations with depth, commonly observed in deep open-ocean profiles (e.g., Elderfield, 1988; Sholkovitz et al., 1994; German et al., 1995; Figure 3A). East of Kerguelen, as the depth increases, stations TEW7 and F-L exhibit a positive Eu anomaly that progressively increases and a smooth accentuation of Ce anomaly, together with a smooth decrease in La anomaly and a Ndn/Ybn slope becoming weaker with depth (Figures 4A, 5A). Anomalies of La and Eu show jerkier variations at station R2, although weakly constrained due to higher standard deviations (i.e., error bars), especially for Eu and below 500 m depth, and thus, only significant in the surface layer compared to those at 1,500 m. εNd values measured for some R2 and F-L samples between 1,500 m and the bottom are in similar ranges, between −8.8 and −10.5.
Coastal and Plateau Stations
Compared to other stations, coastal stations are highly concentrated in REE, especially in LREE (note the extended scales in Figures 3B, 5B for coastal stations), which leads to a much flatter PAAS-normalized pattern (Surface Water subplot of Figure 4B). These patterns typically highlight recent substantial lithogenic supplies. Surprisingly, they are characterized by a prominent negative Eu anomaly (discussed below). They are also associated with the most radiogenic dissolved εNd values of the study (−2.6 ± 0.2; −3.4 ± 0.2; Figure 5B).
Over the plateau, concentrations are higher than at the reference station R2, even between 200 and 500 m depth where R2 exhibits—although to a lesser degree—concentrations abnormally high for a so-called HNLC station. Station A3 exhibits significantly higher Ce concentrations in the upper 200 m than below, with a maximum at 200 m, a feature also noticeable but much less marked for Nd, Eu, and La, even less in Yb and Lu (Figure 3B). Ce concentrations are significantly higher at station A3 than at G1 or TEW3 (~2–9 pmol kg−1 higher), and La concentrations are significantly higher during the first visit to station A3 (A3-1, ~2–5 pmol kg−1 higher) than at G1, TEW3, and A3-2; otherwise, all plateau stations exhibit similar REE vertical profiles. The weak Ce anomaly associated with the weak Ndn/Ybn slope (i.e., high Ndn/Ybn ratio) in the first 200 m depth of station A3 suggests relatively strong and recent inputs of lithogenic material (Figures 4B, 5B). Two features make the second visit to station A3 (A3-2) distinguishable from the first visit (A3-1): station A3-1 exhibits higher positive La anomalies than A3-2 and almost no Eu anomaly over the whole profile, while A3-2 shows significant positive Eu anomalies. However, considering the anomaly uncertainties, these features are more significant for the La anomalies than for the Eu ones (Figure 5B). The εNd values measured for station A3-1 and A3-2 are in the same range as the surface samples of the deep stations and are also similar to those found during KEOPS1 at this same station A3, varying between −6 and −8 (Figure 8B).
Meander Stations
In the meander region, above 500 m depth, vertical profiles behave differently depending on which REE is considered. HREE (Ho to Lu) concentrations mostly increase with increasing depth. LREE except Ce, and MREE exhibit quite constant concentrations (Figure 3C). Ce is roughly twice more concentrated in the first 200 m than in the underlying waters, especially at stations E4-W and TNS4, which are located in the strongest streamline of the meander recirculation (see Figure 1B). This feature, associated with relatively low Ce anomalies and weak Ndn/Ybn slopes, is similar to the upper part characteristics of some other stations (TEW7, F-L, TEW1, G2, and A3; Figures 3, 5). Eu anomalies are low and variable from one station to the other, from slightly negative at E1 and E3 to slightly positive at E4-W, in the surface waters. Finally, εNd values are in a relatively narrow range [−9; −7], similarly to the surface waters sampled at R2 and at A3, and slightly less radiogenic than F-L surface waters. However, WW sampled at TNS4 is characterized by a more radiogenic value (εNd = −5.4 ± 0.6).
Between 500 m depth and the bottom, vertical profiles of REE concentrations show general trends similar to those of the deep stations: a progressive increase with depth, less pronounced in Ce (Figure 3C, compared to Figure 3A). The REE concentrations are equivalent to or slightly higher than those observed at the reference station R2. Concerning the REE fractionations, the deep waters at station E5 exhibit the most pronounced Ce anomalies, even slightly more pronounced than in deep waters of R2, together with constant low La anomalies and positive Eu anomalies, slightly increasing with depth (Figure 5C). These characteristics resemble those observed in the deep waters at stations TEW7 and F-L. In contrast, the deep waters at stations E1 and E3—located in the vicinity of the meander center—exhibit jerky profiles of pronounced La anomalies (the highest of the study, albeit with relatively high error bars) and no clear Eu anomalies, similar to the characteristics of station R2. The εNd values, determined only for the LCDW, are constant (ranging from −10 to −9) and similar to those measured at the deep stations R2 and F-L.
Discussion
The results described above highlight that the distribution of dissolved REEs and εNd in the Kerguelen Plateau area are influenced by the following factors:
1) Recent lithogenic supplies, deduced from concentration increases (especially LREEs) and from weakening of Ce anomaly and of Ndn/Ybn slope, which impact most of the waters sampled between the surface and 500 m depth;
2) Two kinds of fractionation processes observed below 500 m depth: (i) constant low La anomalies and positive Eu anomalies, and (ii) high jerky La anomalies and no Eu anomalies. We hypothesize that these features—although less significant for Eu than for La due to weaker overall variations relatively to the associated uncertainties—are related to authigenic processes operating within the water column.
The signatures of the lithogenic supplies are spatially and vertically nuanced. Surface lithogenic inputs are unequivocally observed at the coastal stations TEW1 and G2, at all stations sampled above the Central Kerguelen Plateau (e.g., A3, G1), at the deep stations TEW7 and F-L and at the meander stations E4-W and TNS4. The lithogenic signal imprint is much less obvious in the surface waters of the recirculation center (stations E1, E3, and E5), although higher than in the surface waters of R2, almost not impacted. By contrast, this latter station exhibits a clear imprint of lithogenic supplies at 200 m. Such subsurface input is also observed at the plateau stations, especially A3, and at the meander stations E4-W and TNS4. Between 200 and 500 m depth, lithogenic supplies are still observed -although to a lesser degree- at every station except at TEW-7, F-L, E3, and E5. Finally, below 500 m depth, only a minor remnant lithogenic signature could be suggested in the UCDW for stations E4-W and TNS4, compared to the other deep stations.
Such lithogenic signatures raise two questions: (i) Where do these supplies come from? (ii) Do they all exhibit similar REE characteristics? The relative REE fractionations could help to investigate further. The parameters showing the strongest variations when comparing the coastal samples—likely the most impacted by source effects—to the other sites are the Ce and Eu anomalies and the Ndn/Ybn ratio (Figure 5). While the intensity of the Ce anomaly and of the slope Ndn/Ybn are good indicators of the freshness of the lithogenic supplies, the direction and intensity of the Eu anomaly could help revealing the nature of the lithogenic supplies. These three parameters are displayed in Figure 6 and discussed below. For comparison, we also report these parameters for the KEOPS1 station C1, from Zhang et al. (2008), which characterizes Heard Island coastal waters (see yellow dots circled in red in Figure 6). Zhang et al. (2008) did not use a desolvating system for their REE analyses; therefore, they had to apply a more important correction of oxy-hydroxide interferences on their measurements, mainly impacting Eu (CeO ~ 3–4%; BaO interferences ranging from 20 to 40% of the Eu signal). However, the similarity of the Eu anomaly range between their study and ours ([0.97–1.15] and [0.98–1.13] pmol kg−1, respectively) for the off-plateau stations and the consistency of the variations observed in their dataset (notably between their 2 stations A3, both characterized by higher Eu anomalies than at the other stations of their study) make us believe that the comparison of our Eu data with theirs is legitimate.
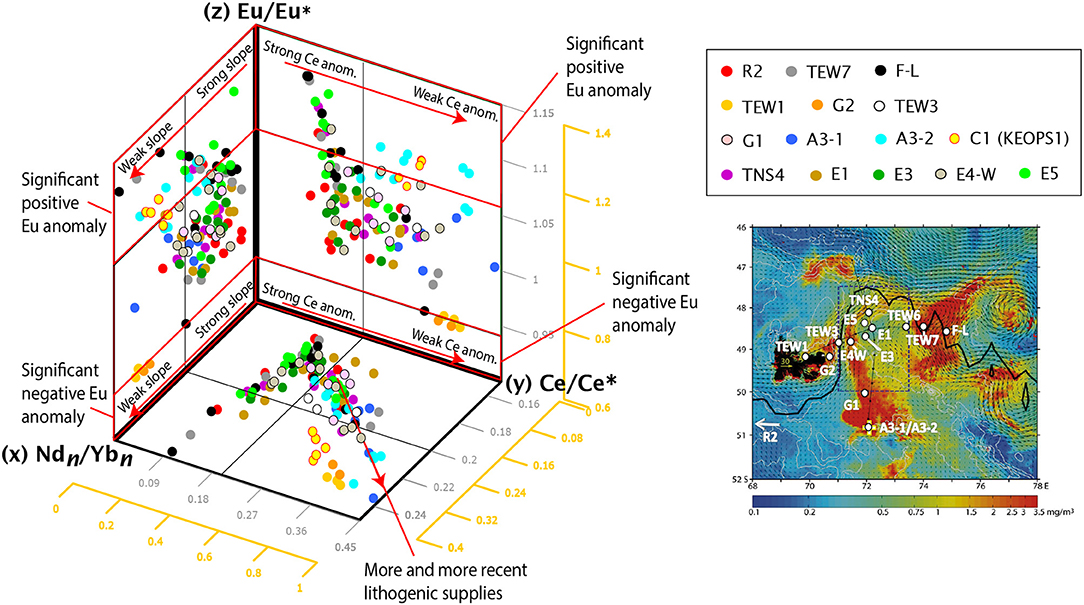
Figure 6. Inter-comparisons of REE fractionations appearing to best inform about the freshness and the nature of the lithogenic supplies. xy plan: Ndn/Ybn = f(Ce/Ce*); xz plan: Ndn/Ybn = f(Eu/Eu*); yz plan: Ce/Ce* = f(Eu/Eu*). The station C1 samples from Zhang et al. (2008; KEOPS1), which characterize the Heard Island coastal waters, are also reported here, for comparison (yellow dots circled in red). Note the larger scale associated with the fractionation parameters of the coastal samples (stations TEW1, G2 and C1; yellow scales). The black lines in the xy plan represent the thresholds above which an imprint of lithogenic supplies is defined in the study as significant (i.e., for Ce/Ce* > 0.2 and Ndn/Ybn > 0.2), determined from the vertical profiles of Ce/Ce* and of Ndn/Ybn in Figure 5. Eu anomalies included in the areas delimited by the red squares at the bottom and top of the plans xz and yz are considered as significantly negative (Eu/Eu* ≤ 0.95) and positive (Eu/Eu* ≥ 1.05), respectively (corresponding to the thresholds 1 ± 0.5, 0.5 being the average of the standard errors determined by propagation of uncertainty on the Eu/Eu* equation for each sample).
Characterization of the Lithogenic Sources
We consider the imprint of lithogenic supplies as significant if Ce/Ce* > 0.2 and Ndn/Ybn > 0.2 (see Figure 6). Following the general statements of the dissolved oceanic REE behavior (Elderfield, 1988; Byrne and Kim, 1990; Moffett, 1990), the freshest lithogenic supplies are tagged by the weakest Ce anomaly and Ndn/Ybn slope (see the red arrow in the xy plane, in Figure 6). As expected, they are observed on coastal samples near the Kerguelen and Heard Islands, which likely suggests a recent release of lithogenic material into the dissolved phase. More surprisingly, these coastal samples exhibit distinct Eu anomaly signatures: while Kerguelen Islands samples exhibit a prominent negative Eu anomaly, Heard Island samples are, as previously noted by Zhang et al. (2008), characterized by a significant positive one (z-planes in Figure 6; see TEW1 and G2 dots for Kerguelen samples and C1 dots for Heard samples). This latter pattern could reflect REE release from Heard margin basaltic sediments, characterized by a positive Eu anomaly (dotted light gray pattern in Figure 7B; Weis et al., 2002; Doucet et al., 2005; Arevalo and Jr, 2008). Such basaltic imprint was also suggested to explain the positive Eu anomaly observed in seawater in several areas of the equatorial and tropical Pacific, in the vicinity of basaltic islands (Grenier et al., 2013; Fröllje et al., 2016; Molina-Kescher et al., 2018). However, the Kerguelen samples are characterized by a REE pattern displaying a negative Eu anomaly. To our knowledge, such significant negative Eu anomalies were observed only once before, by Elderfield and Greaves (1982), in the surface and deep waters of the Eastern Equatorial Atlantic, and in deep Mediterranean outflow water. These authors attributed this negative Eu anomaly to be the result of leaching of aeolian loess particles of Saharan origin.
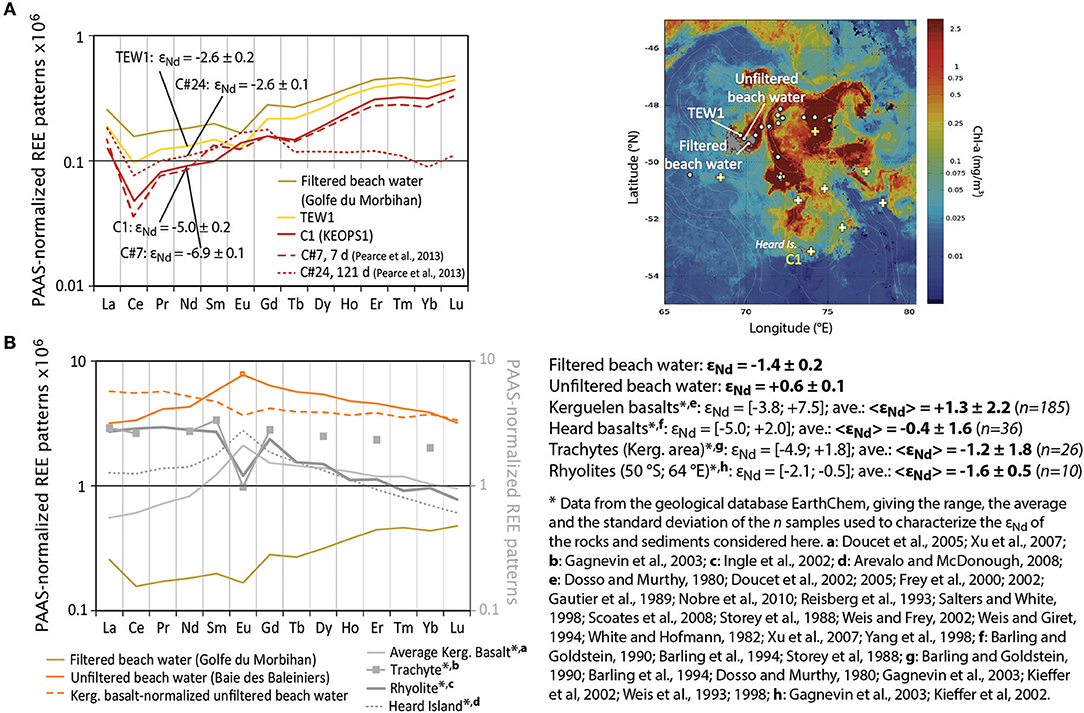
Figure 7. (A) PAAS-normalized REE patterns and εNd of the dissolved fraction of the TEW1 coastal sample and of a beach water sample collected during the KEOPS2 cruise in the Golfe du Morbihan, W-SW of station G2. For the readability of the Figure, G2 is not reported here, as it is similar to TEW1. The pattern of the Heard Island coastal water (station C1, Zhang et al., 2008) is also reported here, for comparison. We also reported the PAAS-normalized REE patterns obtained 7 days (C#7) and 121 days (C#24) after the beginning of an experiment performed by Pearce et al. (2013) that investigated the dissolution of marine sediments taken from a core top collected at C1 during the KEOPS1 cruise. (B) PAAS-normalized REE patterns and εNd of the sediments and rocks characterizing the Kerguelen Plateau area (average patterns of the Kerguelen and Heard basalts and of the trachytes and rhyolites of the area, from the geological database EarthChem www.earthchem.org; right gray scale). We also added the REE patterns and εNd of TEW1 and of an unfiltered beach water sample collected in the Baie des Baleiniers, close to TEW1 (S-SE of it; left black scale). The dashed orange pattern results from the normalization of the unfiltered beach water REE concentrations to the averaged REE concentrations of the Kerguelen basalts.
Using the online geological database EarthChem (www.earthchem.org/), we compared the PAAS-normalized REE patterns and εNd of the Kerguelen coastal samples to those of the sediments and rocks of the Kerguelen Plateau area (Figures 7A,B). We also reported the REE patterns and εNd of two beach water samples collected from a zodiac during the KEOPS2 cruise. One was collected in the Golfe du Morbihan, W-SW of station G2, and was filtered, like the other samples reported in this work. The other one was collected in the Baie des Baleiniers, near TEW1 (S-SE of it) and was not filtered, in order to get the total “particulate + dissolved” signal. The filtered beach water sample exhibits a REE pattern very similar to those observed at TEW1 and G2—although logically slightly more concentrated and flatter—with a similar prominent negative Eu anomaly (brown pattern in Figures 7A,B; G2 pattern shown in Figure 4B). By contrast, the unfiltered beach water sample shows a much more concentrated PAAS-normalized REE pattern, increasing from La to Eu and decreasing from Eu to Lu (orange continuous pattern in Figure 7B). This pattern is very similar in shape to the average PAAS-normalized pattern for the Kerguelen flood basalt (light gray pattern in Figure 7B; Doucet et al., 2005; Xu et al., 2007). This could suggest that the unfiltered beach water is tagged by a release of basaltic REEs, consistent with the signature of some particulate trace metal ratios measured at the Kerguelen coastal stations (van der Merwe et al., 2015). But how to explain the negative Eu anomaly in the dissolved phase if it results from basaltic release, while most of the studies reporting dissolved REE patterns in the vicinity of basaltic islands observed a positive Eu anomaly (e.g., Zhang et al., 2008; Grenier et al., 2013; Fröllje et al., 2016; Molina-Kescher et al., 2018)? To our knowledge, such negative Eu anomaly in the dissolved fraction during exchanges between basaltic sediments and seawater was only observed in laboratory experiments (Pearce et al., 2013). While performing particulate dissolution experiments on marine sediments taken from a core top collected at C1 during the KEOPS1 cruise, Pearce et al. (2013) observed the formation of a negative dissolved Eu anomaly within the first 14 days of their experiment, presumably caused by the stronger incorporation of Eu during the initial precipitation of the over-saturated rhabdophane, a secondary REE-phosphate mineral (dashed dark red patterns in Figure 7A). However, this negative Eu anomaly was eroded within 1 month and eventually turned to be positive (Figure 5 of Pearce et al., 2013; dotted dark red patterns in Figure 7A). Thus, according to these experimental results, if the lithogenic inputs impacting the Kerguelen Islands waters are pure basaltic release, they would have to be very fresh to explain the concomitant opposed Eu anomalies observed in the dissolved and total REE patterns of our coastal samples. Nevertheless, the rock/water ratio of the in vitro experiments performed by Pearce et al. (2013) was most likely higher than in the environment of the coastal samples studied here and potentially led to formation of minerals that may not occur in natural settings. These setting differences may explain why the REE pattern and εNd of the Heard Island coastal C1 sample measured by Zhang et al. (2008) differ significantly from those acquired by Pearce et al. (2013) at the end of their experiment (Figure 7A).
As such, the basaltic origin of the lithogenic signature is more strongly presumed in the total phase than in the dissolved phase of the coastal Kerguelen samples and is likely mainly derived from the particulate fraction. In order to remove this particulate basaltic imprint, we normalized the unfiltered beach water to the average Kerguelen flood basalts, assuming that the remaining signal would reveal information about the dissolved fraction included in this total phase. This basalt-normalization leads to a pattern enriched in LREE and marked by a significant negative Eu anomaly, indeed reminding the characteristic of the dissolved Kerguelen coastal samples (orange dashed pattern in Figure 7B). The only geological formations that look like to these patterns are trachytes and rhyolites (discontinuous pattern with gray squares and continuous thick dark gray pattern in Figure 7B, respectively; Ingle et al., 2002; Gagnevin et al., 2003). Fedele et al. (2015) showed that the negative Eu anomaly of trachytes comes from the dominant glassy matrix, the minerals (dominated by alkali feldspars and plagioclases) being rather characterized by a positive Eu anomaly. Numerous veins of trachytes and rhyolites are present in the Kerguelen flood basalts (Bitschene et al., 1992; Damien Guillaume, LMV, Saint-Etienne, and Léandre Ponthus, GET, Toulouse, personal communication). Interestingly, Mungall and Martin (1994) observed a significant leaching of trachyte lava without devitrification at ambient groundwater conditions in Azores area. This differential leaching between trachytes and basalts could explain why the dissolved seawater off the Kerguelen coast exhibits an imprint of trachytic glass leaching, while the total seawater (dissolved + particulate) exhibits a dominant basalt signature, with a positive Eu anomaly and decreasing PAAS-normalized concentrations from Eu to Lu.
This hypothesis is strengthened by the εNd results. The unfiltered beach water has a radiogenic εNd value of +0.6 ± 0.1. As the εNd of surface offshore seawater varies between −7 and −8, this beach water must have been strongly enriched by a more radiogenic source. Lithogenic particles have presumably been dissolved during the etching process of this unfiltered sample. Among trachytes, rhyolites and basalts, the sole candidate characterized by εNd values higher than +0.6 are the basalts (< εNd> = +1.3 ± 2.2; Figure 7B; Dosso and Murthy, 1980; White and Hofmann, 1982; Storey et al., 1988; Gautier et al., 1989; Barling and Goldstein, 1990; Reisberg et al., 1993; Weis et al., 1993, 1998; Barling et al., 1994; Weis and Giret, 1994; Salters and White, 1998; Yang et al., 1998; Frey et al., 2000, 2002; Doucet et al., 2002, 2005; Kieffer et al., 2002; Weis and Frey, 2002; Xu et al., 2007; Scoates et al., 2008; Nobre Silva et al., 2010). The filtered beach water has a less radiogenic value, consistent with a higher contribution of the less radiogenic trachytes or rhyolites (see values in Figure 7B). Finally, the Kerguelen coastal waters are the freshest waters of the study, suggesting a supply of meteoric water runoff or groundwater that could erode the local lithogenic material (Figure 2A). The ongoing measurements of εNd and REE concentrations of the particulate phases of the coastal samples will help us to determine which of these hypotheses–signature of basalts only or of both trachytes and basalts—is the most plausible.
By contrast, the REE patterns of the Heard Island coastal samples do not reveal such evidence of trachyte imprint in their lithogenic signature (Zhang et al., 2008; Figure 7A). Compared to the Kerguelen coastal area, the marine influence seems to be more pronounced in the Heard Island area, as supported by the lower REE concentrations, especially LREE, added to the less radiogenic εNd. This suggests a more efficient water mass renewal in the coastal area of Heard Island, consistent with the proximity of this area to the Fawn Trough, a favored zonal passage for the circumpolar flow (Park et al., 2008). Alternatively, the REE patterns of Heard Island coastal water samples could also reflect hydrothermal input. Indeed, hydrothermal activity—which was recently discovered between Heard and McDonald Islands (Holmes et al., 2017), a shoal area of maximum depth of 300 m—is known to (i) preferentially scavenge the LREEs from the surrounding waters, thus becoming a sink rather than a source of REEs dissolved in seawater; and (ii) result in a rapidly weakening Eu enrichment in the surrounding waters (Klinkhammer et al., 1983; Olivarez and Owen, 1991).
Transport of the REE Lithogenic Signature as Tracer of Water Mass Pathways
Although less pronounced than at coastal stations, lithogenic signatures were also observed offshore, both above and off the Plateau, in various depth ranges. This presumes a transport of lithogenic supplies, laterally or vertically, away from the sources.
The slight negative Eu anomaly observed north of the PF, in the surface samples of the easternmost stations F-L and, at a lower degree, TEW7, hints at the signature of the Kerguelen coastal dissolved samples (Figures 5A, 6). This suggests that surface waters freshly enriched in lithogenic supplies were transported relatively quickly from the north-eastern Kerguelen coast to the location of these offshore stations, along a path confined to north of the PF. This is in agreement with (i) the PF location and the circulation of the surface/subsurface waters (Figure 1; Figure 15 of Park et al., 2014; d'Ovidio et al., 2015), (ii) the water mass characteristics displayed in Figure 2A, and (iii) the trajectories of the drifters launched during KEOPS2 (Sanial et al., 2015). This interpretation is also supported by the KEOPS2 radium data (Sanial et al., 2015) and particulate trace metal data (van der Merwe et al., 2015).
Based on the distance from the eastern Kerguelen coast, we could expect stronger surface lithogenic imprints at stations located in the meander area, south of the PF, than at the further stations TEW7 or F-L. Yet, the lithogenic imprints observed in the core of the meander, at E1, E3, and E5, are negligible. They are at best as pronounced as at TEW7 and F-L at stations further away from the core of the meander, where surface currents were stronger, but by contrast, they do not show any visible Eu anomaly (E4-W and TNS4; Figures 5A, 6). Sanial et al. (2015) reported significant short-lived Ra isotope activities in this region located downstream of Kerguelen Islands, south of the PF, indicative of recent continental supplies. Using Ra isotopes as a chronometer, these authors estimate a transit time for the surface waters between the shelf and stations E4-W or TNS4 of the order of 1–2 months. Considering the transit times and pathways of the surface waters, they presumed that these recent supplies were coming from the Kerguelen shelves—rather than from Heard Island or from the Central Kerguelen Plateau—and were sporadically transported through the PF. It is therefore highly plausible that the initial negative Eu anomaly of the Kerguelen supplies was quickly eroded within this time interval, either by authigenic process, or by dilution with water tagged by a different REE pattern. Since F-L and E4-W show similar biological characteristics, any biogenic scavenging could be ruled out (Cavagna et al., 2015; Jacquet et al., 2015; Laurenceau-Cornec et al., 2015; Planchon et al., 2015). In addition, F-L surface waters were advected slower than E4-W ones from the Kerguelen coast (in ~2 months for F-L; Sanial et al., 2015), while they preserve their Eu anomaly. As such, the erosion of the negative Eu anomaly more likely results from dilution with water tagged by a null to positive Eu anomaly, presumably coming from the south, than from a local authigenic process. This hypothesis is consistent with the back-trajectories of water parcels as calculated from altimetry (d'Ovidio et al., 2015).
Central Plateau stations eexhibit strong lithogenic signatures characterized by null to positive Eu anomalies (Figures 5B, 6). The difference of Eu anomaly between A3-1 (first visit) and A3-2 (second visit) will be discussed in the following subsection. As suggested by other lithogenic tracers, vertical supplies from the Central Kerguelen Plateau sediments likely contribute dominantly to the signatures observed from the bottom to 200 m depth (Bowie et al., 2015; Sanial et al., 2015; van der Merwe et al., 2015). However, lithogenic imprints are more pronounced in the first 200 m of our stations A3 than in the underlying waters, suggesting that lateral supplies are added to the vertical ones, especially in the upper layer. The signature of these upper supplies shares no similarities with those characterized in the eastern Kerguelen coastal samples, and circulation investigations rather suggest a southern source, most likely from the Heard Island area (Charrassin et al., 2004; Park et al., 2008; Figures 6, 15 from Park et al., 2014; Figure 9 from Sanial et al., 2015). This advective supply of southern origin was already suggested from the KEOPS1 results, first by the dissolved radium-228 distribution observed on the Central Kerguelen Plateau, and confirmed by the REE distribution at station A3 (van Beek et al., 2008; Zhang et al., 2008). This southern advection is also supported by the particulate trace metal distribution (van der Merwe et al., 2015). Overall, our REE results support the hypotheses for regional circulation drawn by Park et al. (2014, their Figure 15): a surface/subsurface southern source—of water and of lithogenic material—that is transported toward the Central Plateau (A3), with its lithogenic signature fading along its northward pathway, as shown by the weaker imprint at G1. As it reaches the meander area, just south of the PF and East of Kerguelen Islands, this southern flow mixes with the western flow, itself tagged by Kerguelen continental material, explaining the enhanced lithogenic signature in the REE data at E4-W and TNS4 compared to G1 or TEW3 (Figures 3B,C, 5B,C, 6). The residual signal observed between 500 and 1,000 m at stations E4-W and TNS4 (meander area) can be explained by supply of sediments from the Kerguelen plateau and their partial lateral advection. The core of the meander area (stations E1, E3, and E5) seems to be more affected by a local recirculation, being therefore likely more isolated from the area of lithogenic material transit, as previously explained.
The sporadic “permeability” of the PF (i.e., transport across it) is not only confirmed by data of the off-core meander stations but also by the subsurface data obtained at station R2. Samples collected at 200 m depth and, to a lesser degree, at 500 m depth, exhibit a clear lithogenic imprint that contrasts with shallower and deeper samples (local maxima of LREE and MREE concentrations, of Ce/Ce* and of Ndn/Ybn; Figures 3A, 5A). Local maxima were not only observed in REEs but also in other lithogenic tracers (Lasbleiz et al., 2014; Quéroué et al., 2015; Sanial et al., 2015; van der Merwe et al., 2015). The closest upstream source is Leclaire Rise (or Skiff Bank; Kieffer et al., 2002; Weis and Frey, 2002), a seamount located west of Kerguelen Islands, just northwest of station R2, which rises up to 200 m depth below the sea level and is on the northern border of the PF circulation, following Park et al. (2014; their Figure 15). Therefore, and as suggested by the KEOPS2 tracer studies cited above, lithogenic supplies seem to be transferred through the PF, from its northern border to its southern one, to be detected at station R2.
Relationship Between REE Distribution and Authigenic Processes
Zhang et al. (2008) found a pronounced positive Eu anomaly at their twice-visited station A3 that was attributed to basaltic signature from Heard Island sediments. Station A3 was also sampled twice during the KEOPS2 study but negligible or much weaker positive Eu anomalies were observed, this time. Although the 1st/2nd and 3rd/4th samplings at station A3 occurred 6 years apart, similar profiles of εNd and weak Ce anomalies were observed at this station during four different visits, suggesting a relatively constant flux of lithogenic supplies likely coming from the same source (Figure 8). In addition, the circulation patterns show similar southern origin of the A3 waters during KEOPS1 and KEOPS2 (Park et al., 2008, 2014). These observations led us to suggest that the lithogenic fraction observed at this station was similar during the four visits and thus that concentration and fractionation differences observed between these four profiles were rather related to authigenic processes occurring during the different stages of the phytoplankton bloom. The section below is dedicated to the identification of these processes. Note that some features, notably the Eu anomaly variations, remain to be confirmed due to their overall weak variations relatively to their associated uncertainties—although still significant. In addition, the time series proposed below is built on the results of two cruises conducted 6 years apart. Therefore, the preliminary interpretations discussed in the following have to be cautiously considered and mainly aim at giving food for thought for future investigations.
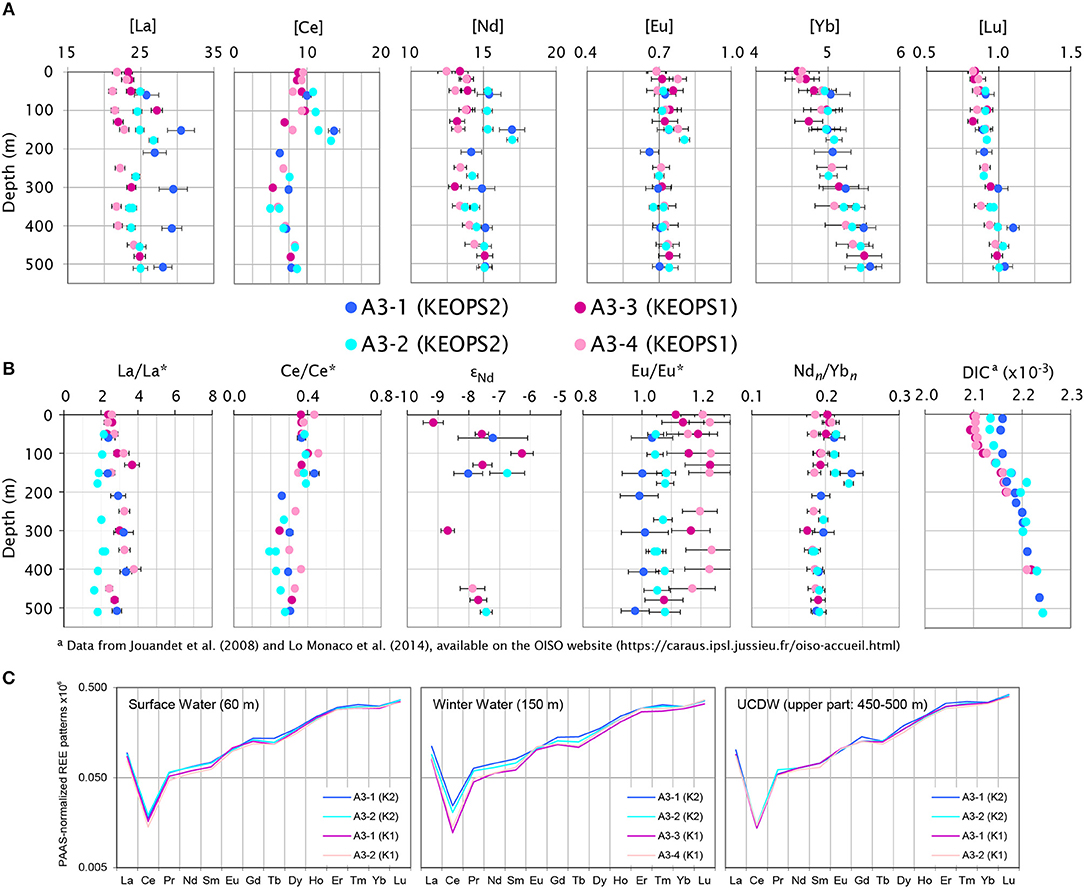
Figure 8. Comparison of the dissolved REE distributions of station A3 for the four different visits: A3-1 and A3-2 refer to the two spring visits (KEOPS2) and A3-3 and A3-4 refer to the 2 summer visits (KEOPS1). (A) Concentration vertical profile of some of the REEs (in pmol kg-1), as in Figure 3; (B) Vertical profiles of some REE fractionations and of Ndn/Ybn, from the PAAS-normalized REE patterns shown in (C). The associated Nd isotopic composition, expressed as εNd, and the concentrations of dissolved inorganic carbon (DIC, in μmol kg−1) are also shown. Error bars are defined as in Figures 3, 5.
We defined the stations A3-1, A3-2, A3-3, and A3-4, following the seasonal chronology rather than the date of sampling (spring first—KEOPS2, then summer—KEOPS1). Similar circulation scheme and chl-a distribution—positioning A3 in the core of the chl-a maximum—argue in favor of a seasonal (spring vs. summer) rather than interannual (2005 vs. 2011) interpretation. This seasonal approach was followed in several other studies (e.g., Bowie et al., 2015; Jacquet et al., 2015). A3-1 was sampled just before the development of the spring bloom; A3-2 was sampled during the maturing phase of a fast growing and large diatom bloom (Lasbleiz et al., 2014; Carlotti et al., 2015; Trull et al., 2015), in an autotrophic mixed layer production system, with photosynthesis exceeding respiration (Christaki et al., 2014). A3-3 and A3-4 correspond to the visits at station A3 at the beginning and at the end of the austral summer cruise KEOPS1 during the bloom decline, in a heterotrophic system (Lefèvre et al., 2008).
During the development of the bloom (from A3-1 to A3-2, KEOPS2), MREE slightly decreased, except Eu, leading to the formation of a small positive Eu anomaly; both La concentrations and the positive La anomaly substantially decreased, especially below 200 m depth (Figure 8). In summer, most of the REE, notably the LREE and MREE, were significantly less concentrated than in spring, especially in the first 200 m, except Eu, which was instead equivalently or slightly more concentrated (Figure 8; Zhang et al., 2008). Therefore, the upper layer REE pattern slope was more pronounced in summer and the weak positive Eu anomaly observed during the bloom development was much more marked over the whole water column as the bloom was declining. Also, the positive La anomaly was, in summer, similar to A3-1 pre-bloom values (Figure 8). These characteristics significantly differ from the REE pattern features observed by Haley et al. (2014) in the upper Gulf of Alaska, defined by these authors as “bio-reactive” REE patterns and suggested to be mediated by microbial processes. Our hypothesis is that the REE distribution variations observed at these different stages of the Kerguelen Plateau bloom are mainly related to interactions between these elements and marine particulate phases (carbonated and/or oxidized surface coatings, diatoms and barite), as discussed in the following subsections.
Positive EU Anomaly
We speculate that the positive Eu anomaly results from the combination of two processes: a net removal of the REEs (especially LREEs and MREEs) onto particles, increasing as the bloom ages, and a constant REE supply from the basaltic sediments. LREE and MREE are preferentially scavenged onto surface coatings such as ferro-manganese oxy-hydroxides and carbonate phases in the upper water column and preferentially released at depth, compared to the HREE (Sholkovitz et al., 1994). Such coatings might have developed onto organic matter and tests before their export, contributing to the LREE and MREE depletion of the upper layer observed in the summer period (A3-3 and A3-4; Figure 8A). This hypothesis is consistent with the decrease of dissolved inorganic carbon observed in the upper layer between spring and summer (Figure 8B; Jouandet et al., 2008; Lo Monaco et al., 2014). However, based on the MREE-enriched patterns of the acetic acid leaching of suspended and sinking particles (Sholkovitz et al., 1994; Lerche and Nozaki, 1998), Eu concentrations should decrease as the other LREEs and MREEs in the upper layer between spring and summer at A3, instead of being preserved as observed. A compensative source of dissolved REEs such as the Heard Island sediments, enriched in Eu (light gray pattern in Figure 7B; Zhang et al., 2008), would allow the Eu stock to be maintained throughout the bloom development and balance its removal through the LREE and MREE scavenging onto coatings.
Interestingly, there seems to be a relationship between some REE fractionations and the export efficiency at the investigated stations that would be consistent with the two processes described above. A positive Eu anomaly seems to progressively be formed with depth for stations characterized by low export efficiency (e.g., station F-L; Figures 4, 5; Laurenceau-Cornec et al., 2015). This might result from the progressive dissolution of Eu-enriched secondary minerals included in the basaltic lithogenic particles (such as rhabdophanes) that settle to the seafloor. In case of increasing export, we could expect an erosion of this Eu lithogenic signature in seawater through the preferential removal of Eu onto the sinking particles. This may explain the absence of Eu anomaly observed at stations characterized by a high export, such as R2 and E1 (Figure 5; Laurenceau-Cornec et al., 2015). Nevertheless, further investigations are necessary to verify the link between the REE fractionation processes and the export efficiency relative to the ocean dynamics of the area.
La Behavior
The KEOPS2 dissolved samples display ubiquitous positive La anomalies. This feature is commonly observed in the ocean and presumably results from the empty 4f electron shell of La that increases its relative stability in solution (de Baar et al., 1985; Byrne and Kim, 1990; Byrne et al., 1996). Nevertheless, both La concentration and La anomaly variations throughout the four visits to A3 are surprisingly different from the other LREE variations. The sharp decrease of La concentrations between A3-1 and A3-2 over the whole water column is not observed for the other REEs, which explains the associated decrease of La anomalies. Thus, unless a real difference of kinetics exists for a preferential adsorption and desorption of La onto and from carbonated and/or oxidized surface coatings, these latter patterns might not be the sole driver to explain the marine La distribution and fractionation in the Kerguelen area. Barite (BaSO4), which is known to incorporate more La than the other LREEs when precipitating in the water column (Guichard et al., 1979; Hein et al., 2007), could also contribute to the observed differential behavior of La. An enhancement of barite formation over the water column during the KEOPS2 bloom stage could contribute to the observed diminution of the La concentrations and anomalies. It is currently believed that barite crystals mainly precipitate within supersaturated micro-environments, mostly constituted by aggregates of organic material (Dehairs et al., 1980; Bishop, 1988; Stroobants et al., 1991; Ganeshram et al., 2003; van Beek et al., 2007). During remineralization of these aggregates through heterotrophic bacterial activity, suspended barite crystals are released (Ganeshram et al., 2003). Jacquet et al. (2008, 2015) characterized the distribution of biogenic barite during KEOPS1 and KEOPS2 by measuring the amount of particulate barium in excess (denoted by BaXS), which is the total Ba corrected for the Ba associated with the lithogenic fraction (Dehairs et al., 1980, 1990). The decrease of La concentrations between A3-1 and A3-2 is not accompanied by an increase in the particulate Baxs concentrations, which suggests that there is no significant increase in the synthesis of suspended barite between the two visits. However, barite may also be included in the dense fast-sinking particles, a pool that was not investigated by Jacquet et al. (2008, 2015), since their sampling techniques (Niskin bottles and in situ pumps) allowed them to only characterize the suspended fraction of barite. We know that the sinking particles were not the dominant fraction at A3-2, but were still present (Laurenceau-Cornec et al., 2015). The differential behavior of La between A3-1 and A3-2 might thus be related to a slight enhancement of barite crystallization within large aggregates, a pool of particles that was not studied at A3-2.
In summer, the slowing down of productivity and aggregate formation might have led to a slowing down of barite formation and La incorporation, explaining why La concentrations only slightly decreased, compared to spring. However, La anomalies increased again, compared to A3-2. This indicates a process that allowed the dissolved stock of La to be better maintained in the water column than the Pr and Nd stocks. Therefore, another factor contributing to the REE fractionation may be involved, in addition to surface coatings, to explain the differential behavior of La compared to Pr and Nd. We again presume an impact from the barite cycle, and more precisely, some La release from the suspended barites, which were more abundant at that time (Jacquet et al., 2008, 2015). Once released from the aggregates into the undersaturated waters of the Southern Ocean (Monnin et al., 1999), suspended barites are more susceptible to be redissolved and therefore to release their La. The hypothesis linking La distribution and barite cycle has already been recently suggested, upstream in the Southern Ocean (Garcia-Solsona et al., 2014).
The role of barite production or dissolution on dissolved La depletion or enrichment compared to the other LREE is also suggested at other KEOPS stations. A mirror effect between BaXS and La/La* vertical profiles is notably observed over the whole water column at the meander stations E1 and E3 (Figure 9). Jacquet et al. (2015) suggested from these BaXS profiles that remineralization processes were not ongoing anymore at these stations and were resulting from a previous bloom. Thus, the high La concentrations and anomalies might represent a post-remineralization state, where barite has been released following disaggregation and then dissolved.
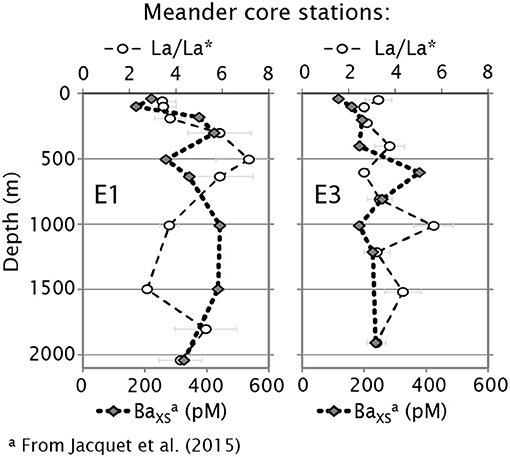
Figure 9. Vertical profiles of La anomaly (La/La*) compared to the vertical profiles of particulate non-lithogenic barium concentrations (BaXS, pM; from Jacquet et al., 2015) at the meander core stations E1 and E3. These plots highlight the mirroring of La/La* and BaXS variations (local minima of La/La* associated with local maxima of BaXS and vice versa).
HREE Behavior
The HREE vertical profiles at the deep and meander stations show a slope break at around 600 m, with a slower increase of their concentrations below this depth. This vertical structure looks strikingly similar to the vertical profiles of silicic acid; a clear relationship appears from the comparison of the evolution of Yb concentrations with the dissolved silicon ones (H4SiO4 or DSi; Figure 10). In addition, the Ndn/Ybn profiles of the deep and meander stations exhibit a pronounced re-increase with depth below their inversion of slope, compared to the rate we usually observe in the ocean (e.g., Jeandel et al., 2013; Haley et al., 2014; Molina-Kescher et al., 2014; Figures 5A,C). We propose here that HREE uptake-remineralization processes are more linked to the Si cycle than the MREE and LREE are, in agreement with Akagi and co-authors' hypotheses (Akagi et al., 2011; Akagi, 2013) and with REE profiles sampled in other areas of the Southern Ocean (Garcia-Solsona et al., 2014; Molina-Kescher et al., 2014). The slower dissolution rates of biogenic silica compared to the remineralization/dissolution rates of the LREE and MREE carrier phases could thus explain the pronounced slope inversion.
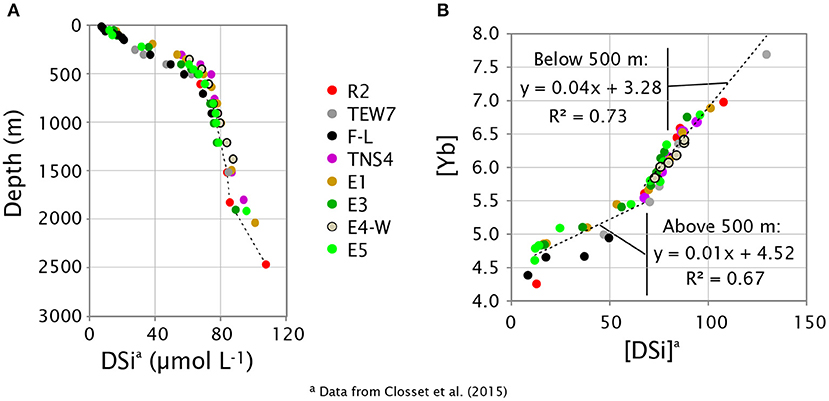
Figure 10. (A) Vertical profiles of the H4SiO4 concentrations (DSi, in μmol L−1; from Closset et al., 2014) of the deep and meander stations; (B) Relationships between Yb concentrations (in pmol kg−1) and DSi concentrations (in μmol L−1) of these same stations, excluding the samples tagged by lithogenic signatures. Two linear regressions are given to characterize the distribution above and below 500 m depth, which corresponds to the slope break depth of the [DSi] vertical profile shown in (A).
Conclusions
The shallow and coastal environments of the Kerguelen Plateau strongly modify the dissolved rare earth element (REE) distributions and neodymium isotopic compositions (expressed as εNd) of the upstream offshore waters. Consequently, the KEOPS2 sampling covers a large range of REE concentrations, depending on whether they were sampled upstream, on, or downstream the Kerguelen Plateau. The concentration and fractionation variations of the dissolved REE result from significant lithogenic supplies and authigenic processes (Figure 11A).
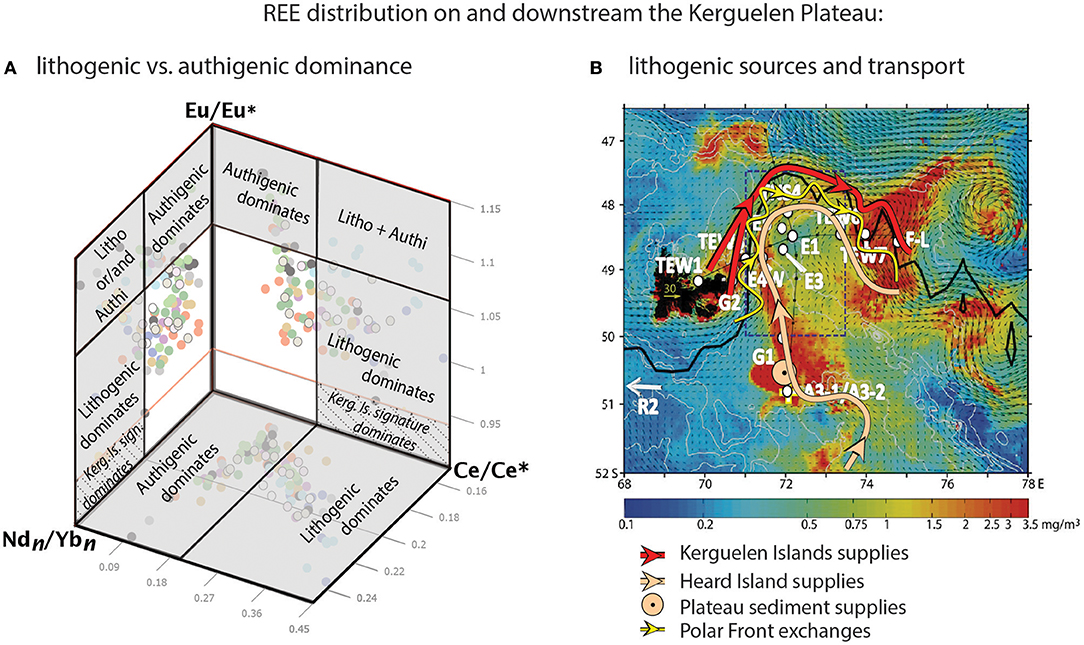
Figure 11. Synthesis of the main processes that control the REE distribution in the Kerguelen Plateau area: (A) schematic summary of Figure 6 identifying the dominance of lithogenic vs. authigenic processes in REE fractionations; (B) schematic representation of the different sources of lithogenic material -Kerguelen Islands, Heard Island, Central Plateau sediments- and their transports via the different oceanic pathways identified in Park et al. (2014), north of, south of, and across the Polar Front.
Eastern Kerguelen coastal samples clearly reveal a local source of lithogenic material, most likely coming from some weathering and/or dissolution of the shallow sediments. Moreover, the comparison of REE patterns of filtered and unfiltered samples reveals distinct features, with negative europium anomalies (Eu/Eu*) and εNd in the filtered samples but a positive Eu/Eu* and more radiogenic εNd in the unfiltered one. These discrepancies presumably reflect differential dissolution and/or weathering processes of the local flood basalts and/or trachyte veins from which the margin sediments mainly result. Interestingly, these REE coastal signatures contrast with those observed close to Heard Island, although also attributed to the interaction of seawater with the margin sediments (Zhang et al., 2008). Thus, the nature or the supply processes of lithogenic material from the Kerguelen Islands likely differ from those from Heard Island. Coastal environments are not the sole areas enriching seawater with dissolved lithogenic supplies in the vicinity of the Kerguelen Plateau: contributions are also presumably coming from seamounts like the Leclaire Rise, upstream from the Kerguelen Islands (this study; Quéroué et al., 2015; Sanial et al., 2015), and Gallieni Spur (Grenier et al., 2015), downstream. The Central Kerguelen Plateau also plays a key role in terms of lithogenic supplies, likely providing a vertical enrichment from the sediments to the overlying water.
The REE and εNd distributions allow us to identify two main routes for the transport of these supplies (Figure 11B). The atypical signature of the dissolved Kerguelen coastal samples traces an eastward transport of the enriched waters north of the Polar Front (red route on Figure 11B). This signature rapidly vanishes, likely through mixing, and precludes us to identify the Kerguelen contribution among the lithogenic signatures observed across and south of the Polar Front, although indicated by other tracers (e.g., radium isotopes; Sanial et al., 2015). The sediment/particulate signature of Heard Island is presumably advected north-westward, toward the Central Kerguelen Plateau where it mixes with the signature of the vertical supplies from the sediments. These signatures are likely advected up to the meander area where they can mix with Kerguelen supplies sporadically crossing the front (light pink and yellow routes on Figure 11B, respectively).
Variations in REE concentrations and fractionations are also partly driven by authigenic processes, both inorganically and biologically mediated. More particularly, the REE behavior seems to be closely related to biogeochemical cycles resulting directly and indirectly from the recurrent diatom-dominated bloom observed in austral spring/summer above and downstream the Plateau. The more pronounced decrease of the concentrations of light REEs with the bloom aging seems to mainly reflect their preferential scavenging by surface coatings, such as carbonate phases and/or (ferro)manganese oxides. A more important involvement of La in the barite cycle could explain an additional differentiation compared to the other light REEs. Fractionation of the heavy REEs seems to be more closely related to the opal cycle. A difference of reversible scavenging kinetics between the surface coatings and opal could explain the evolution changes of the Ndn/Ybn ratio with depth, decreasing in the upper layer and increasing below.
This study highlights the role of the lithogenic and authigenic particles on the dissolved REE distributions in the Kerguelen Plateau area. It raises the importance of a future complementary work to compare dissolved and particulate REE fractions in order to better describe and understand the main active processes that govern the oceanic cycle of the REEs.
Author Contributions
EG-S did most of the sample collection, helped by PvB and MS. PvB was the onboard scientific representative of the seawater sampling for the REE analyses. EG-S carried out the onboard chemical treatments of the samples and part of the on land neodymium isotopic composition (Nd IC) chemical analyses. VB and MG carried out part of the on land Nd IC chemical analyses. NL and MG did the on land chemical analyses of the rare earth element (REE) concentrations. MG and CJ conducted the REE concentration measurements on the Inductively Coupled Plasma Mass Spectrometer. MG, NL, and CJ were in charge of the Nd IC measurements of samples on the Thermo Ionization Mass Spectrometers (TIMS) in Toulouse. CJ and PN conducted the Nd IC measurement of samples on the TIMS in Brest. MG drafted the manuscript and figures. MG, EG-S, CJ, NL, TT, PvB, FL, and MS contributed to the data representation and interpretation. MG, CJ, EG-S, NL, PvB, FL, and TT revised the form and content revisions of the manuscript. CJ and TT supervised the postdoctoral position of MG during which the chemical analyses were done. CJ supervised the postdoctoral position of MG during which the manuscript was drafted.
Funding
KEOPS2 project was funded by the French Research program of INSU-CNRS LEFE-CYBER (Les enveloppes fluides et l'environnement—Cycles biogéochimiques, environnement et ressources), ANR (Agence Nationale de la Recherche, SIMI-6 program, ANR-10-BLAN-0614), CNES (Center National d'Etudes Spatiales), and IPEV (Institut Polaire Paul-Émile Victor). MG was mostly supported by a conjoint LEGOS and ACE CRC postdoctoral appointment and a CAMPUS FRANCE grant (FASIC award #30418QG; campusfrance.org), and also by a European Union's Horizon 2020 research and innovation programme (Marie Skłodowska-Curie action, grant agreement # 657853) while finishing the redaction.
Conflict of Interest Statement
The authors declare that the research was conducted in the absence of any commercial or financial relationships that could be construed as a potential conflict of interest.
Acknowledgments
We thank the captain B. Lassiette, officers and crew of RV Marion Dufresne, Pierre Sangiardi (Institut Paul-Émile Victor) and the Institut National des Sciences de l'Univers for voyage logistics and their support of the science, and Bernard Quéguiner (Institut Méditerranéen d'Océanologie) and Stéphane Blain (Université Pierre et Marie Curie, LOMIC) for the KEOPS2 expedition leadership. We are grateful to Anne Royer, Lionel Scouarnec, and Fabien Perault (DT-INSU) for their technical support. We thank Bruno Lansard for help during sampling at sea. Thanks to ACE-CRC people Emmanuel Laurenceau-Cornec, Andy Bowie, and Pier van der Merwe for fruitful discussions concerning biological export and trace metal distribution interpretations, and Zanna Chase and Taryn Noble (University of Tasmania) for feedbacks and comments about our REE distribution interpretations. MG and CJ also acknowledge Sebastien Fabre (Université Paul Sabatier, IRAP) for insights into aqueous model perspectives using the PHREEQC program. We thank Catherine Pradoux for her technical support in the clean laboratory. We also acknowledge Jerome Chmeleff and Frederic Candaudap (Center National de la Recherche Scientifique, GET) for their technical support on the ICP-MS. The manuscript was significantly improved by the comments provided by three reviewers.
Supplementary Material
The Supplementary Material for this article can be found online at: https://www.frontiersin.org/articles/10.3389/fmars.2018.00426/full#supplementary-material
Footnotes
1. ^ εNd = [(143Nd/144Nd)SAMPLE/(143Nd/144Nd)CHUR – 1] × 104, where (143Nd/144Nd)CHUR = 0.512638 (Wasserburg et al., 1981). CHUR, Chondritic Uniform Reservoir; present day average Earth value.
References
Akagi, T. (2013). Rare earth element (REE)–silicic acid complexes in seawater to explain the incorporation of REEs in opal and the “leftover” REEs in surface water: new interpretation of disolved REE distribution profiles. Geochim. Cosmochim. Acta 113, 174–192. doi: 10.1016/j.gca.2013.03.014
Akagi, T., Fu, F.-F., Hongo, Y., and Takahashi, K. (2011). Composition of rare earth elements in settling particles collected in the highly productive North Pacific Ocean and Bering Sea: implications for siliceous-matter dissolution kinetics and formation of two REE-enriched phases. Geochim. Cosmochim. Acta 75, 4857–4876. doi: 10.1016/j.gca.2011.06.001
Alibo, D. S., and Nozaki, Y. (1999). Rare earth elements in seawater: particle association, shale-normalization, and Ce oxidation. Geochim. Cosmochim. Acta 63, 363–372. doi: 10.1016/S0016-7037(98)00279-8
Arevalo, R. Jr., and McDonough, W. (2008). Tungsten geochemistry and implications for understanding the Earth's interior. Earth Planet. Sci. Lett. 272, 656–665. doi: 10.1016/j.epsl.2008.05.031
Arrigo, K. R., van Dijken, G. L., and Bushinsky, S. (2008). Primary production in the Southern Ocean, 1997–2006. J. Geophys. Res. 113:C08004. doi: 10.1029/2007JC004551
Arsouze, T., Dutay, J.-C., Lacan, T., and Jeandel, C. (2007). Modeling the neodymium isotopic composition with an ocean global circulation model. Chem Geol. 239, 165–177. doi: 10.1016/j.chemgeo.2006.12.006
Arsouze, T., Dutay, J. C., Lacan, F., and Jeandel, C. (2009). Reconstructing the Nd oceanic cycle using a coupled dynamical-biogeochemical model. Biogeosci. Discuss. 6, 5549–5588. doi: 10.5194/bgd-6-5549-2009
Barling, J., and Goldstein, S. L. (1990). Extreme isotopic variations in Heard Island lavas and the nature of mantle reservoirs. Nature 348, 59–62. doi: 10.1038/348059a0
Barling, J., Goldstein, S. L., and Nicholis, I. A. (1994). Geochemistry of Heard Island (Southern Indian Ocean): characterization of an enriched mantle component and implications for enrichment of Sub-Indian Ocean Mantle. J. Petrol. 35, 1017–1053. doi: 10.1093/petrology/35.4.1017
Bau, M., Koschinsky, A., Dulski, P., and Hein, J. R. (1996). Comparison of the partitioning behaviours of yttrium, rare earth elements, and titanium between hydrogenetic marine ferromanganese crusts and seawater. Geochim. Cosmochim. Acta 60, 1709–1725.
Behrens, M. K., Muratli, J., Pradoux, C., Wu, Y., Böning, P., Brumsack, H.-J., et al. (2016). Rapid and precise analysis of rare earth elements in small volumes of seawater – Method and intercomparison. Mar. Chem. 186, 110–120. doi: 10.1016/j.marchem.2016.08.006
Bertram, C. J., and Elderfield, H. (1993). The geochemical balance of the rare earth elements and neodymium isotopes in the oceans. Geochim. Cosmochim. Acta 57, 1957–1986. doi: 10.1016/0016-7037(93)90087-D
Bishop, J. K. B. (1988). The barite-opal-organic carbon association in oceanic particulate matter. Nature 332, 341–343. doi: 10.1038/332341a0
Bitschene, P. R., Mehl, K. W., and Schmincke, H.-U. (1992). “Composition and origin of marine ash layers and epiclastic rocks from the Kerguelen Plateau, southern Indian Ocean (Legs 119 and 120),” in Proc. ODP, Sci. Results, eds S. W. Wise Jr, R. Schlich, et al. (College Station, TX: Ocean Drilling Program), 135–149.
Blain, S., Quéguiner, B., Armand, L., Belviso, S., Bombled, B., Bopp, L., et al. (2007). Effect of natural iron fertilization on carbon sequestration in the Southern Ocean. Nature 446, 1070–1074. doi: 10.1038/nature05700
Blain, S., Sarthou, G., and Laan, P. (2008). Distribution of dissolved iron during the natural iron-fertilization experiment KEOPS (Kerguelen Plateau, Southern Ocean). Deep Sea Res. II, 55, 594–605. doi: 10.1016/j.dsr2.2007.12.028
Blain, S., Tréguer, P., Belviso, S., Bucciarelli, E., Denis, M., Desabre, S., et al. (2001). A biogeochemical study of the island mass effect in the context of the iron hypothesis: Kerguelen Islands, Southern Ocean. Deep Sea Res. Part I, 48, 163–187. doi: 10.1016/S0967-0637(00)00047-9
Bolhar, R., Kamber, B. S., Moorbath, S., Fedo, C. M., and Whitehouse, M. J. (2004). Characterisation of early Archaean chemical sediments by trace element signatures. Earth Planet. Sci. Lett. 222, 43–60. doi: 10.1016/j.epsl.2004.02.016
Bowie, A. R., van der Merwe, P., Quéroué, F., Trull, T., Fourquez, M., Planchon, F., et al. (2015). Iron budgets for three distinct biogeochemical sites around the Kerguelen archipelago (Southern Ocean) during the natural fertilisation study, KEOPS-2. Biogeosciences 12, 4421–4445. doi: 10.5194/bg-12-4421-2015
Boyd, P. W., Jickells, T., Law, C. S., Blain, S., Boyle, E. A., Buesseler, K. O., et al. (2007). Mesoscale iron enrichment experiments 1993-2005: synthesis and future directions. Science 315, 612–617. doi: 10.1126/science.1131669
Byrne, R. H., and Kim, K. H. (1990). Rare earth element scavenging in seawater. Geochim. Cosmochim. Acta 54, 2645–2656. doi: 10.1016/0016-7037(90)90002-3
Byrne, R. H., Liu, X., and Schijf, J. (1996). The influence of phosphate coprecipitation on rare earth distributions in natural waters. Geochim. Cosmochim. Acta 60, 3341–3346. doi: 10.1016/0016-7037(96)00197-4
Carlotti, F., Jouandet, M.-P., Nowaczyk, A., Harmelin-Vivien, M., Lefèvre, D., Guillou, G., et al. (2015). Mesozooplankton structure and functioning during the onset of the Kerguelen phytoplankton bloom during the Keops2 survey. Biogeosciences 12, 2381–2427. doi: 10.5194/bg-12-4543-2015
Carter, P., Vance, D., Hillenbrand, C. D., Smith, J. A., and Shoosmith, D. R. (2012). The neodymium isotopic composition of waters masses in the eastern Pacific sector of the Southern Ocean. Geochim. Cosmochim. Acta 79, 41–59. doi: 10.1016/j.gca.2011.11.034
Cavagna, A. J., Fripiat, F., Elskens, M., Mangion, P., Chirurgien, L., Closset, I., et al. (2015). Production regime and associated N cycling in the vicinity of Kerguelen Island, Southern Ocean. Biogeosciences 12, 6515–6528. doi: 10.5194/bg-12-6515-2015
Charrassin, J. B., Park, Y.-H., LeMaho, Y., and Bost, C.-A. (2004). Fine resolution 3D temperature fields off Kerguelen from instrumented penguins. Deep-Sea Res. I 51, 2091–2103. doi: 10.1016/j.dsr.2004.07.019
Chavagnac, V., Lair, M., Milton, J. A., Lloyd, A., Croudace, I. W., Palmer, M. R., et al. (2008). Tracing dust input to the Mid-Atlantic Ridge between 14°450N and 36°140N: geochemical and Sr isotope study. Mar. Geol. 247, 208–225. doi: 10.1016/j.margeo.2007.09.003
Chavagnac, V., Waniek, J. J., Atkin, D., Milton, J. A., Leipe, T., Green, D. R. H., et al. (2007). Source of lithogenic derived element fluxes to the deep subtropical North East Atlantic Ocean. Geophys. Res. Lett. 34:L21604. doi: 10.1029/2007GL030985
Chever, F., Sarthou, G., Bucciarelli, E., Blain, S., and Bowie, A. R. (2010). An iron budget during the natural iron fertilisation experiment KEOPS (Kerguelen Islands, Southern Ocean). Biogeosciences 7, 455–468. doi: 10.5194/bg-7-455-2010
Choppin, G. R., and Silva, R. J. (1956). Separation of the lanthanides by ion exchange with alpha-hydroxy isobutyric acid. J. Inorg. Nucl. Chem. 3, 153–154. doi: 10.1016/0022-1902(56)80076-6
Christaki, U., Lefèvre, D., Georges, C., Colombet, J., Catala, P., Courties, C., et al. (2014). Microbial food web dynamics during spring phytoplankton blooms in the naturally iron-fertilized Kerguelen area (Southern Ocean). Biogeosciences 11, 6739–6753. doi: 10.5194/bg-11-6739-2014
Chung, C.-H., Brenner, I., and You, C.-F. (2009). Comparison of microconcentric and membrane-desolvation sample introduction systems for determination of low rare earth element concentrations in surface and subsurface waters using sector field inductively coupled plasma mass spectrometry. Spectrochim. Acta B 64, 849–856. doi: 10.1016/j.sab.2009.06.013
Closset, I., Lasbleiz, M., Leblanc, K., Quéguiner, B., Cavagna, A.-J., Elskens, M., et al. (2014). Seasonal evolution of net and regenerated silica production around a natural Fe-fertilized area in the Southern Ocean estimated with Si isotopic approaches. Biogeosciences 11, 5827–5846. doi: 10.5194/bg-11-5827-2014
Coale, K. H., Fitzwater, S. E., Gordon, R. M., Johnson, K. S., and Barber, R. T. (1996). Control of community growth and export production by upwelled iron in the equatorial Pacific Ocean Nature 379, 621–624.
de Baar, H. J. W., Bacon, M. P., Brewer, P. G., and Bruland, K. W. (1985). Rare earth elements in the Pacific and Atlantic oceans. Geochim. Cosmochim. Acta 49, 1943–1959. doi: 10.1016/0016-7037(85)90089-4
de Baar, H. J. W., de Jong, J. T. M., Bakker, D. C. E., Löscher, B. M., Veth, C., Bathmann, U., et al. (1995). Importance of iron for plankton blooms and carbon dioxide drawdown in the Southern Ocean. Nature 373, 412–415.
Dehairs, F., Chesselet, R., and Jedwab, J. (1980). Discrete suspended particles of barite and the barium cycle in the open ocean. Earth Planet. Sci. Lett. 49, 528–550. doi: 10.1016/0012-821X(80)90094-1
Dehairs, F., Goeyens, L., Stroobants, N., Bernard, P., Goyet, C., Poisson, A., et al. (1990). On the suspended barite and the oxygen minimum in the Southern Ocean. Glob. Biogeochem. Cycles 4, 85–102.
Dosso, L., and Murthy, V. R. (1980). A Nd isotopic study of the Kerguelen Islands: inferences on enriched oceanic mantle sources. Earth Planet. Sci. Lett. 48, 268–276. doi: 10.1016/0012-821X(80)90190-9
Doucet, S., Scoates, J. S., Weis, D., and Giret, A. (2005). Constraining the components of the Kerguelen mantle plume: a Hf–Pb–Sr–Nd isotopic study of picrites and high-MgO basalts from the Kerguelen Archipelago. Geochem. Geophys. Geosyst. 6:Q04007. doi: 10.1029/2004GC000806
Doucet, S., Weis, D., Scoates, J. S., Nicolaysen, K., Frey, F. A., and Giret, A. (2002). The depleted mantle component in the Kerguelen Archipelago basalts: petrogenesis of tholeiitic–transitional basalts from the Loranchet Peninsula. J. Petrol. 43, 1341–1366. doi: 10.1093/petrology/43.7.1341
d'Ovidio, F., Della Penna, A., Trull, T. W., Nencioli, F., Pujol, M. I., Rio, M. H., et al. (2015). The biogeochemical structuring role of horizontal stirring: lagrangian perspectives on iron delivery downstream of the Kerguelen Plateau. Biogeosciences 12, 5567–5581. doi: 10.5194/bg-12-5567-2015
Elderfield, H. (1988). The oceanic chemistry of the rare earth elements. Philos. Trans. R. Soc. Lond. A 325, 105–126. doi: 10.1098/rsta.1988.0046
Elderfield, H., and Greaves, M. J. (1982). The rare earth elements in seawater. Nature 296, 214–219. doi: 10.1038/296214a0
Elrod, V. A., Berelson, W. M., Coale, K. H., and Johnson, K. S. (2004). The flux of iron from continental shelf sediments: a missing source for global budgets. Geophys. Res. Lett. 31:L12307. doi: 10.1029/2004GL020216
Fedele, L., Lustrino, M., Meluso, L., Morra, V., Zanetti, A., and Vannucci, R. (2015). Trace-element partitioning between plagioclase, alkali feldspar, Timagnetite, biotite, apatite and evolved potassic liquids from Campi Flegrei (Southern Italy). Am. Minerol. 100, 233–249. doi: 10.2138/am-2015-4995
Frank, M. (2002). Radiogenic isotopes: tracers of past ocean circulation andweathering inputs. Rev. Geophys. 40, 1-1–1-38. doi: 10.1029/2000RG000094
Frey, F. A., Nicolaysen, K., Kubit, B. K., Weis, D., and Giret, A. (2002). Flood basalt from Mont Tourmente in the Central Kerguelen Archipelago: the change from transitional to alkalic basalt at ~25 Ma. J. Petrol. 43, 1367–1387. doi: 10.1093/petrology/43.7.1367
Frey, F. A., Weis, D., Yang, H., Nicolaysen, K., Leyrit, H., and Giret, A. (2000). Temporal geochemical trends in Kerguelen Archipelago basalts: evidence for decreasing magma supply from the Kerguelen Plume. Chem. Geol. 164, 61–80. doi: 10.1016/S0009-2541(99)00144-8
Fröllje, H., Pahnke, K., Schnetger, B., Brumsack, H.-J., Dulai, H., and Fitzsimmons, J. N. (2016). Haawiian imprint on dissolved Nd and Ra isotopes and rare earth elements in the central North Pacific: local survey and seasonal variability. Geochim. Cosmochim. Acta 189, 110–131. doi: 10.1016/j.gca.2016.06.001
Gagnevin, D., Ethien, R., Bonin, B., Moine, B., Féraud, G., Gerbe, M. C., et al. (2003). Open-system processes in the genesis of silica-oversaturated alkaline rocks of the Rallierdu-Baty Peninsula, Kerguelen Archipelago (Indian Ocean). J. Volcanol. Geotherm. Res. 123, 267–300. doi: 10.1016/S0377-0273(02)00509-7
Ganeshram, R. S., Francois, R., Commeau, J., and Brown-Leger, L. (2003). An experimental investigation of barite formation in seawater. Geochim. Cosmochim. Acta 67, 2599–2605. doi: 10.1016/S0016-7037(03)00164-9
Garcia-Solsona, E., Jeandel, C., Labatut, M., Lacan, F., Vance, D., Chavagnac, V., et al. (2014). Rare earth elements and Nd isotopes tracing water mass mixing and particle-seawater interactions in the SE Atlantic. Geochim. Cosmochim. Acta 125, 351–372. doi: 10.1016/j.gca.2013.10.009
Gautier, I., Weis, D., Mennessier, J.-P., Vidal, P., Giret, A., and Loubet, M. (1989). Petrology and geochemistry of Kerguelen basalts: evolution of an hotspot from a ridge to an intraplate position. Earth Planet. Sci. Lett. 100, 59–76.
German, C. R., Masuzawa, T., Greaves, M. J., Elderfield, H., and Edmond, J. M. (1995). Dissolved rare earth elements in the Southern Ocean: cerium oxidation and the influence of hydrography. Geochim. Cosmochim. Acta 59, 1551–1558. doi: 10.1016/0016-7037(95)00061-4
Goldstein, S. L., and Hemming, S. R. (2003). Long-lived Isotopic Tracers in Oceanography, Paleoceanography, and Ice-sheet Dynamics. Palisades, NY: Columbia University.
Grenier, M., Della Penna, A., and Trull, T. W. (2015). Autonomous profiling float observations of the high-biomass plume downstream of the Kerguelen Plateau in the Southern Ocean. Biogeosciences 12, 2707–2735. doi: 10.5194/bg-12-2707-2015
Grenier, M., Jeandel, C., and Cravatte, S. (2014). From the subtropics to the equator in the Southwest Pacific: continental material fluxes quantified using neodymium data along modeled thermocline water pathways. J. Geophys. Res. Oceans 119, 3948–3966. doi: 10.1002/2013JC009670
Grenier, M., Jeandel, C., Lacan, F., Vance, D., Venchiarutti, C., Cros, A., et al. (2013). From the subtropics to the central equatorial Pacific Ocean: neodymium isotopic composition and rare earth element concentration variations. J. Geophys. Res. Oceans 118, 592–618. doi: 10.1029/2012JC008239
Guichard, F., Church, T. M., Treuil, M., and Jaffrezic, H. (1979). Rare earths in barites: distribution and effects on aqueous partitioning. Geochim. Cosmochim. Acta 43, 983–997. doi: 10.1016/0016-7037(79)90088-7
Haley, B. A., Frank, M., Hathorne, E., and Pisias, N. (2014). Biogeochemical implications from dissolved rare earth element and Nd isotope distributions in the Gulf of Alaska. Geochim. Cosmochim. Acta 126, 455–474. doi: 10.1016/j.gca.2013.11.012
Haley, B. A., Klinkhammer, G. P., and McManus, J. (2004). Rare earth elements in pore waters of marine sediments. Geochim. Cosmochim. Acta 68, 1265–1279. doi: 10.1016/j.gca.2003.09.012
Hara, Y., Obata, H., Doi, T., Hongo, Y., Gamo, T., Takeda, S., et al. (2009). Rare earth elements in seawater during an iron-induced phytoplankton bloom of the western sub-arctic Pacific (SEEDS-II). Deep-Sea Res. II Top. Stud. Oceanogr. 56, 2839–2851. doi: 10.1016/j.dsr2.2009.06.009
Hathorne, E. C., Stichel, T., Brück, B., and Frank, M. (2015). Rare earth element distribution in the Atlantic sector of the Southern Ocean: the balance between particle scavenging and vertical supply. Mar. Chem. 177, 157–171. doi: 10.1016/j.marchem.2015.03.011
Hein, J. R., Zierenberg, R. A., Maynard, J. B., and Hannington, M. D. (2007). Multifarious barite-forming environments along a rifted continental margin, Southern California Borderland. Deep-Sea Res. II 54, 1327–1349. doi: 10.1016/j.dsr2.2007.04.011
Holmes, T. M., Chase, Z., Van Der Merwe, P., Townsend, A. T., and Bowie, A. R. (2017). Detection, dispersal and biogeochemical contribution of hydrothermal iron in the ocean. Mar. Freshw. Res. 68, 1–21. doi: 10.1071/MF16335
Ingle, S., Weis, D., and Frey, F. A. (2002). Indian continental crust recovered from Elan Bank, Kerguelen Plateau (ODP Leg 183, Site 1137). J. Petrol. 43, 1241–1257. doi: 10.1093/petrology/43.7.1241
Jacquet, S. H. M., Dehairs, F., Lefèvre, D., Cavagna, A. J., Planchon, F., Christaki, U., et al. (2015). Early spring mesopelagic carbon remineralization and transfer efficiency in the naturally iron-fertilized Kerguelen area. Biogeosciences 12, 1713–1731. doi: 10.5194/bg-12-1713-2015
Jacquet, S. H. M., Dehairs, F., Savoye, N., Obernosterer, I., Christaki, U., Monnin, C., et al. (2008). Mesopelagic organic carbon remineralization in the Kerguelen Plateau region tracked by biogenic particulate Ba. Deep-Sea Res. Part II, 868–879. doi: 10.1016/j.dsr2.2007.12.038
Jeandel, C., Arsouze, T., Lacan, F., Téchiné, P., and Dutay, J.-C. (2007). Isotopic Nd compositions and concentrations of the lithogenic inputs into the ocean: a compilation, with an emphasis on the margins. Chem. Geol. 239, 156–164. doi: 10.1016/j.chemgeo.2006.11.013
Jeandel, C., Delattre, H., Grenier, M., Pradoux, C., and Lacan, F. (2013). Rare earth element concentrations and Nd isotopes in the South East Pacific Ocean. Geochem. Geophys. Geosyst. 14, 328–341. doi: 10.1029/2012GC004309
Jeandel, C., Peucker-Ehrenbrink, B., Jones, M. T., Pearce, C. R., Oelkers, E. H., Godderis, Y., et al. (2011). Ocean margins: the missing term for oceanic element budgets? Eos Trans. AGU 92, 217–219. doi: 10.1029/2011EO260001
Jeandel, C., Thouron, D., and Fieux, M. (1998). Concentrations and isotopic compositions of Nd in the Eastern Indian Ocean and Indonesian Straits. Geochim. Cosmochim. Acta 62, 2597–2607. doi: 10.1016/S0016-7037(98)00169-0
Johnson, K. S., Chavez, F. P., and Friederich, G. E. (1999). Continental shelf sediments as a primary source of iron to coastal phytoplankton. Nature 398, 697–700.
Jouandet, M.-P., Jackson, G. A., Carlotti, F., Picheral, M., Stemmann, L., and Blain, S. (2014). Rapid formation of large aggregates during the spring bloom of Kerguelen Island: observations and model comparisons. Biogeosciences 11, 4393–4406. doi: 10.5194/bg-11-4393-2014
Jouandet, M. P., Blain, S., Metzl, N., Brunet, C., Trull, T., and Obernosterer, I. (2008). A seasonal carbon budget for a naturally iron-fertilized bloom over the Kerguelen Plateau in the Southern Ocean. Deep-Sea Research II 55, 265–279. doi: 10.1016/j.dsr2.2007.12.037
Kieffer, B., Arndt, N. T., and Weis, D. (2002). A bimodal alkalic shield volcano on Skiff Bank; its place in the evolution of the Kerguelen Plateau. J. Petrol. 43, 1259–1286. doi: 10.1093/petrology/43.7.1259
Klinkhammer, G., Elderfield, H., and Hudson, A. (1983). Rare earth elements in seawater near hydrothermal vents. Nature 305, 185–188. doi: 10.1038/305185a0
Korb, R. E., Whitehouse, M. J., and Ward, P. (2004). SeaWiFS in the southern ocean: spatial and temporal variability in phytoplankton biomass around South Georgia. Deep Sea Res. Part II 51, 99–116. doi: 10.1016/j.dsr2.2003.04.002
Labatut, M., Lacan, F., Pradoux, C., Chmeleff, J., Radic, A., Murray, J. W., et al. (2014). Iron sources and dissolved particulate interactions in the seawater of the Western Equatorial Pacific, iron isotope perspectives. Global Biogeochem. Cycles 28, 1044–1065. doi: 10.1002/2014GB004928
Lacan, F., and Jeandel, C. (2001). Tracing Papua New Guinea imprint on the central Equatorial Pacific Ocean using neodymium isotopic compositions and rare earth element patterns. Earth Planet. Sci. Lett. 186, 497–512. doi: 10.1016/S0012-821X(01)00263-1
Lacan, F., and Jeandel, C. (2004). Subpolar mode water formation traced by neodymium isotopic composition. Geophys. Res. Lett. 31:L14306. doi: 10.1029/2004GL019747
Lacan, F., and Jeandel, C. (2005). Neodymium isotopes as a new tool for quantifying exchange fluxes at the continent–ocean interface. Earth Planet. Sci. Lett. 232, 245–257. doi: 10.1016/j.epsl.2005.01.004
Lasbleiz, M., Leblanc, K., Blain, S., Ras, J., Cornet-Barthaux, V., Hélias Nunige, S., et al. (2014). Pigments, elemental composition(C, N, P, and Si), and stoichiometry of particulate matter in the naturally iron fertilized region of Kerguelen in the SouthernOcean. Biogeosciences 11, 5931–5955. doi: 10.5194/bg-11-5931-2014
Laurenceau-Cornec, E. C., Trull, T. W., Davies, D. M., Bray, S. G., Doran, J., Planchon, F., et al. (2015). The relative importance of phytoplankton aggregates and zooplankton fecal pellets to carbon export: insights from free-drifting sediment trap deployments in naturally iron-fertilised waters near the Kerguelen Plateau. Biogeosciences 12, 1007–1027. doi: 10.5194/bg-12-1007-2015
Lefèvre, D., Guigue, C., and Obernosterer, I. (2008). The metabolic balance at two contrasting sites in the Southern Ocean: the iron-fertilized Kerguelen area and HNLC waters. Deep-Sea Res. Part II 55, 766–776. doi: 10.1016/j.dsr2.2007.12.006
Lerche, D., and Nozaki, Y. (1998). Rare earth elements of sinking particulate matter in the Japan Trench. Earth Planet. Sci. Lett. 159, 71–86. doi: 10.1016/S0012-821X(98)00066-1
Lo Monaco, C., Metzl, N., D'Ovidio, F., Llort, J., and Ridame, C. (2014). Rapid establishment of the CO2 sink associated with Kerguelen's bloom observed during the KEOPS2/OISO20 cruise. Biogeosci. Discuss. 11, 17543–17578. doi: 10.5194/bgd-11-17543-2014
Martin, J. H. (1990). Glacial-interglacial CO2 change: the iron hypothesis. Paleoceanography 5, 1–13.
McLennan, S. M. (1989). “Rare earth elements in sedimentary rocks: influence of provenance and sedimentary processes. Geochemistry and Mineralogy of Rare Earth Elements,” in Reviews in Mineralogy, Vol. 21, eds B. R. Lipin and G. H. Mckay (Washington, DC: Mineralogical Society of America), 170–200.
McLennan, S. M. (1994). Rare earth element geochemistry and the tetrad effect. Geochim. Cosmochim. Acta 58, 2025–2033. doi: 10.1016/0016-7037(94)90282-8
Measures, C. I., Brown, M. T., Selph, K. E., Apprill, A., Zhou, M., Hatta, M., et al. (2013). The influence of shelf processes in delivering dissolved iron to the HNLC waters of the Drake Passage, Antarctica. Deep-Sea Res. Part II 90, 77–88. doi: 10.1016/j.dsr2.2012.11.004
Moffett, J. W. (1990). Microbially mediated cerium oxidation in seawater. Nature 345, 421–423. doi: 10.1038/345421a0
Molina-Kescher, M., Frank, M., and Hathorne, E. (2014). South Pacific dissolved Nd isotope compositions and rare earth element distributions: water mass mixing versus biogeochemical cycling. Geochim. Cosmochim. Acta 127, 171–189. doi: 10.1016/j.gca.2013.11.038
Molina-Kescher, M., Hathorne, E. C., Osborne, A. H., Behrens, M. K., Kölling, M., Pahnke, K., et al. (2018). The influence of Basaltic Islands on the Oceanic REE distribution: a case study from the Tropical South Pacific. Front. Mar. Sci. 5:50. doi: 10.3389/fmars.2018.00050
Mongin, M., Molina, E., and Trull, T. W. (2008). Seasonality and scale of the Kerguelen plateau phytoplankton bloom: a remote sensing and modeling analysis of the influence of natural iron fertilization in the Southern Ocean. Deep Sea Res. II 55, 880–892. doi: 10.1016/j.dsr2.2007.12.039
Monnin, C., Jeandel, C., Cattaldo, T., and Dehairs, F. (1999). The marine barite saturation state of the world's oceans. Mar. Chem. 65, 253–261.
Moore, J. K., and Abbott, M. R. (2002). Surface chlorophyll concentrations in relation to the Antarctic Polar Front: seasonal and spatial patterns from satellite observations. J. Mar. Syst. 37, 69–86. doi: 10.1016/S0924-7963(02)00196-3
Mungall, J. E., and Martin, R. F. (1994). Severe leaching of trachytic glass without devitrification, Terceira, Azores. Geochim. Cosmochim. Acta 58, 75–83. doi: 10.1016/0016-7037(94)90447-2
Nobre Silva, I. G., Weis, D., and Scoates, J. S. (2010). Effects of acid leaching on the Sr-Nd-Hf isotopic compositions of ocean island basalts. Geochem. Geophys. Geosyst. 11:Q09011. doi: 10.1029/2010GC003176
Nozaki, Y., and Alibo, D. S. (2003). Importance of vertical geochemical processes in controlling the oceanic profiles of dissolved rare earth elements in the northeastern Indian Ocean. Earth Planet. Sci. Lett. 205, 155–172. doi: 10.1016/S0012-821X(02)01027-0
Olivarez, A. M., and Owen, R. M. (1991). The europium anomaly of seawater: implications for fluvial versus hydrothermal REE inputs to the oceans. Chem. Geol. 92, 317–328.
Osborne, A. H., Haley, B. A., Hathorne, E. C., Flögel, S., and Frank, M. (2014). Neodymium isotopes and concentrations in Caribbean seawater: tracing water mass mixing and continental input in a semi-enclosed ocean basin. Earth Planet. Sci. Lett. 406, 174–186. doi: 10.1016/j.epsl.2014.09.011
Pahnke, K., van de Flierdt, T., Jones, K., Hemming, S. R., and Goldstein, S. L. (2012). GEOTRACES intercalibration of neodymium isotopes and rare earth element concentrations in seawater and particles—Part 2: systematic tests and baseline profiles. Limnol Oceanogr. Methods 10, 252–269. doi: 10.4319/lom.2012.10.252
Park, Y.-H., Durand, I., Kestenare, E., Rougier, G., Zhou, M., d'Ovidio, F., et al. (2014). Polar Front around the Kerguelen Islands: an up-to-date determination and associated circulation of surface/subsurface waters. J. Geophys. Res. 119, 6575–6592. doi: 10.1002/2014JC010061
Park, Y.-H., Roquet, F., Durand, I., and Fuda, J. L. (2008). Large-scale circulation over and around the Northern Kerguelen Plateau. Deep Sea Res. Part II 55, 566–581. doi: 10.1016/j.dsr2.2007.12.030
Pearce, C. R., Jones, M. T., Oelkers, E. H., Jeandel, C., and Pradoux, C. (2013). The importance of particulate dissolution for the marine neodymium (Nd) isotope and Rare Earth Element (REE) budgets. Earth Planet. Sci. Lett. 369–370, 138–147. doi: 10.1016/j.epsl.2013.03.023
Piepgras, D. J., Wasserburg, G. J., and Dasch, E. J. (1979). The isotopic composition of Nd in different ocean masses. Earth Planet. Sci. Lett. 45, 223–236. doi: 10.1016/0012-821X(79)90125-0
Pin, C., and Zalduegui, J. F. S. (1997). Sequential separation of light rare-earth elements, thorium and uranium by miniaturized extraction chromatography: application to isotopic analyses of silicate rocks. Anal. Chim. Acta 339, 79–89. doi: 10.1016/S0003-2670(96)00499-0
Planchon, F., Ballas, D., Cavagna, A.-J., Bowie, A. R., Davies, D., Trull, T., et al. (2015). Carbon export in the naturally iron-fertilized Kerguelen area of the Southern Ocean based on the 234Th approach. Biogeosciences 12, 3831–3848. doi: 10.5194/bg-12-3831-2015
Pollard, R., Sanders, R., Lucas, M., and Statham, P. (2007). The crozet natural iron bloom and export experiment (CROZEX). Deep Sea Res. II 54, 1905–1914. doi: 10.1016/j.dsr2.2007.07.023
Quéroué, F., Sarthou, G., Planquette, H. F., Bucciarelli, E., Chever, F., van der Merwe, P., et al. (2015). High variability of dissolved iron concentrations in the vicinity of Kerguelen Islands (Southern Ocean). Biogeosciences12, 3869–3883. doi: 10.5194/bg-12-3869-2015
Radic, A., Lacan, F., and Murray, J. W. (2011). Isotopic composition of dissolved iron in the equatorial Pacific Ocean: new constraints for the oceanic iron cycle, Earth Planet. Sci. Lett. 306, 1–10. doi: 10.1016/j.epsl.2011.03.015
Reisberg, L., Zindler, A., Marcantonio, F., White, W., Wyman, D., and Weaver, B. (1993). Os isotope systematics in ocean island basalts. Earth Planet. Sci. Lett. 120, 149–167. doi: 10.1016/0012-821X(93)90236-3
Salters, V., and White, W. (1998). Hf isotope constraints on mantle evolution. Chem. Geol. 145, 447–460. doi: 10.1016/S0009-2541(97)00154-X
Sanial, V., van Beek, P., Lansard, B., Souhaut, M., Kestenare, E., d'Ovidio, F., et al. (2015). Use of Ra isotopes to deduce rapid transfer of sediment-derived inputs off Kerguelen. Biogeosciences 12, 1415–1430. doi: 10.5194/bg-12-1415-2015
Schmidt, R. A., Smith, R. H., Lasch, J. E., Mosen, A. W., Olehy, D. A., and Vasilevshis, J. (1963). Abundances of fourteen rare-earth elements, scandium, and yttrium in meteoritic and terrigenous matter. Geochim. Cosmochim. Acta 27, 577–622. doi: 10.1016/0016-7037(63)90014-0
Scoates, J. S., Weis, D., Franssens, M., Mattielli, N., Annell, H., Frey, F. A., et al. (2008). The Val Gabbro plutonic suite: a sub-volcanic intrusion emplaced at the end of flood basalt volcanism on the Kerguelen Archipelago. J. Petrol. 49, 79–105. doi: 10.1093/petrology/egm071
Shabani, M. B., Akagi, T., and Masuda, A. (1992). Preconcentration of trace rare earth elements in seawater by complexation with (2-ethylhexyl) hydrogen phosphate and 2-ethylhexyl dihydrogen phosphate adsorbed on a C18 cardridge and determination by inductively coupled plasma mass spectrometry. Anal. Chem. 64, 737–743.
Shiller, A. M., Chan, E. W., Joung, D. J., Redmond, M. C., and Kessler, J. D. (2017). Light rare earth element depletion during Deepwater Horizon blowout methanotrophy. Sci. Rep. 7:10389. doi: 10.1038/s41598-017-11060-z
Sholkovitz, E. R., Elderfield, H., Szymczak, R., and Casey, K. (1999). Island weathering: river sources of rare earth elements to the Western Pacific Ocean. Mar. Chem. 68, 39–57. doi: 10.1016/S0304-4203(99)00064-X
Sholkovitz, E. R., Landing, W. M., and Lewis, B. L. (1994). Ocean particle chemistry: the fractionation of rare earth elements between suspended particles and seawater. Geochim. Cosmochim. Acta 58, 1567–1580. doi: 10.1016/0016-7037(94)90559-2
Siddall, M., Khatiwala, S., van de Flierdt, T., Jones, K., Goldstein, S. L., Hemming, S., et al. (2008). Towards explaining the Nd paradox using reversible scavenging in an ocean general circulation model. Earth Planet. Sci. Lett. 274, 448–461. doi: 10.1016/j.epsl.2008.07.044
Stichel, T., Frank, M., Rickli, J., and Haley, B. A. (2012). The hafnium and neodymium isotope composition of seawater in the Atlantic sector of the Southern Ocean. Earth Planet. Sci. Lett. 317–318, 282–294. doi: 10.1016/j.epsl.2011.11.025
Storey, M., Saunders, A. D., Tarney, J., Leat, P., Thirlwall, M. F., Thompson, R. N., et al. (1988). Geochemical evidence for plume–mantle interactions beneath Kerguelen and Heard Islands, Indian Ocean. Nature 336, 371–374. doi: 10.1038/336371a0
Strady, E., Kim, I., Radakovitch, O., and Kim, G. (2015). Rare earth element distributions and fractionation in plankton from the northwestern Mediterranean Sea. Chemosphere 119, 72–82. doi: 10.1016/j.chemosphere.2014.05.049
Stroobants, N., Dehairs, F., Goeyens, L., Vanderheijden, N., and van Grieken, R. (1991). Barite formation in the Southern Ocean water column. Mar. Chem. 35, 411–421. doi: 10.1016/S0304-4203(09)90033-0
Tachikawa, K., Athias, V., and Jeandel, C. (2003). Neodymium budget in the modern ocean and paleo-oceanographic implications. J. Geophys. Res. 108:3254. doi: 10.1029/1999JC000285
Tachikawa, K., Jeandel, C., and Roy-Barman, M. (1999a). A new approach to the Nd residence time in the ocean: role of atmospheric input. Earth Planet. Sci. Lett. 170, 433–446.
Tachikawa, K., Jeandel, C., Vangriesheim, A., and Dupré, B. (1999b). Distribution of rare earth elements and neodymium isotopes in suspended particles of the Tropical Atlantic Ocean (EUMELI site). Deep-Sea Res. I 46, 733–756.
Tachikawa, K., Roy-Barman, M., Michard, A., Thouron, D., Yeghicheyan, D., and Jeandel, C. (2004). Neodymium isotopes in the Mediterranean Sea: comparison between seawater and sediment signals. Geochim. Cosmochim. Acta 68, 3095–3106. doi: 10.1016/j.gca.2004.01.024
Tagliabue, A., Bopp, L., and Aumont, O. (2009). Evaluating the importance of atmospheric and sedimentary iron sources to Southern Ocean biogeochemistry. Geophys. Res. Lett. 36:L13601. doi: 10.1029/2009gl038914
Tagliabue, A., Sallée, J.-B., Bowie, A. R., Lévy, M., Swart, S., and Boyd, P. W. (2014). Surface-water iron supplies in the Southern Ocean sustained by deep winter mixing. Nat. Geosci. 7, 314–320. doi: 10.1038/ngeo2101
Tarling, G. A., Stowasser, G., Ward, P., Poulton, A. J., Zhou, M., Venables, H. J., et al. (2012). Seasonal trophic structure of the Scotia Sea pelagic ecosystem considered through biomass spectra and stable isotope analysis. Deep-Sea Res. Pt. II 59–60, 222–236. doi: 10.1016/j.dsr2.2011.07.002
Trull, T. W., Davies, D. M., Dehairs, F., Cavagna, A.-J., Lasbleiz, M., Laurenceau-Cornec, E. C., et al. (2015). Chemometric perspectives on plankton community responses to natural iron fertilisation over and downstream of the Kerguelen Plateau in the Southern Ocean. Biogeosciences 12, 1029–1056. doi: 10.5194/bg-12-1029-2015
van Beek, P., Bourquin, M., Reyss, J.-L., Souhaut, M., Charette, M. A., and Jeandel, C. (2008). Radium isotopes to investigate the water mass pathways on the Kerguelen Plateau (Southern Ocean). Deep Sea Res. Pt. II 55, 622–637. doi: 10.1016/j.dsr2.2007.12.025
van Beek, P., Francois, R., Conte, M., Reyss, J.-L., Souhaut, M., and Charette, M. (2007). 228Ra/226Ra and 226Ra/Ba ratios to track barite formation and transport in the water column. Geochim. Cosmochim. Acta 71, 71–86. doi: 10.1016/j.gca.2006.07.041
van de Flierdt, T., Pahnke, K., Andersson, P., Basak, C., Coles, B., Colin, C., et al. (2012). GEOTRACES intercalibration of neodymium isotopes and rare earth element concentrations in seawater and suspended particles. Part 1: reproducibility of results for the international intercomparison. Limnol. Oceanogr. Methods 10, 234–251. doi: 10.4319/lom.2012.10.234
van der Merwe, P., Bowie, A. R., Quéroué, F., Armand, L., Blain, S., Chever, F., et al. (2015). Sourcing the iron in the naturally fertilised bloom around the Kerguelen Plateau: particulate trace metal dynamics, Biogeosciences 12, 739–755. doi: 10.5194/bg-12-739-2015
Wasserburg, G. J., Jacobsen, S. B., De Paolo, D. L., McCulloch, M. T., and Wen, T. (1981), Precise determination of Sm/Nd ratios, Sm Nd isotopic abundances in standard solutions. Geochim. Cosmochim. Acta 45, 2311–2323.
Weis, D., and Frey, F. A. (2002). Submarine basalts of the Northern Kerguelen Plateau: interaction between the Kerguelen plume and the Southeast Indian Ridge revealed at ODP Site 1140. J. Petrol. 43, 1287–1309. doi: 10.1093/petrology/43.7.1287
Weis, D., Frey, F. A., Giret, A., and Cantagrel, J. M. (1998). Geochemical characteristics of the youngest volcano (Mount Ross) in the Kerguelen Archipelago: inferences for magma flux and composition of the Kerguelen Plume. J. Petrol. 39, 973–994. doi: 10.1093/petroj/39.5.973
Weis, D., Frey, F. A., Leyrit, H., and Gautier, I. (1993). Kerguelen Archipelago revisited: geochemical and isotopic study of the SE Province lavas. Earth Planet. Sci. Lett. 118, 101–119.
Weis, D., Frey, F. A., Schlich, R., Schaming, M., Montigny, R., Damasceno, D., et al. (2002). Trace of the Kerguelen mantle plume: evidence from seamounts between the Kerguelen Archipelago and Heard Island, Indian Ocean. Geochem. Geophys. Geosyst. 3, 1–27. doi: 10.1029/2001GC000251
Weis, D., and Giret, A. (1994). Kerguelen plutonic complexes: Sr, Nd, Pb isotopic study and inferences about their sources, age and geodynamic setting, Geol. Geochim. Geophys. 166, 47–59.
White, W. M., and Hofmann, A. W. (1982). Sr and Nd isotope geochemistry of oceanic basalts and mantle evolution. Nature 296, 821–825. doi: 10.1038/296821a0
Xu, G., Frey, F. A., Weis, D., Scoates, J. S., and Giret, A. (2007). Flood basalts from Mt. Capitole in the central Kerguelen Archipelago: Insights into the growth of the archipelago and source components contributing to plume-related volcanism. Geochem. Geophys. Geosyst. 8:Q06007. doi: 10.1029/2007gc001608
Yang, H.-Y., Frey, F. A., Weis, D., Giret, A., Pyle, D., and Michon, G. (1998). Petrogenesis of the flood basalts forming the Northern Kerguelen Archipelago: implications for the Kerguelen Plume. J. Petrol. 39, 711–748. doi: 10.1093/petroj/39.4.711
Zhang, Y., Lacan, F., and Jeandel, C. (2008). Dissolved rare earth elements tracing lithogenic inputs over the Kerguelen Plateau (Southern Ocean). Deep Sea Res. Pt. II 55, 638–652. doi: 10.1016/j.dsr2.2007.12.029
Keywords: Southern Ocean, Kerguelen Islands, rare earth elements, fractionation, anomalies, lithogenic, biologic, GEOTRACES
Citation: Grenier M, Garcia-Solsona E, Lemaitre N, Trull TW, Bouvier V, Nonnotte P, van Beek P, Souhaut M, Lacan F and Jeandel C (2018) Differentiating Lithogenic Supplies, Water Mass Transport, and Biological Processes On and Off the Kerguelen Plateau Using Rare Earth Element Concentrations and Neodymium Isotopic Compositions. Front. Mar. Sci. 5:426. doi: 10.3389/fmars.2018.00426
Received: 04 December 2017; Accepted: 24 October 2018;
Published: 20 November 2018.
Edited by:
Sunil Kumar Singh, Physical Research Laboratory, IndiaReviewed by:
Ed Hathorne, Christian-Albrechts-Universität zu Kiel, GermanyMaxime M. Grand, Moss Landing Marine Laboratories, United States
Vineet Goswami, Colorado State University, United States
Copyright © 2018 Grenier, Garcia-Solsona, Lemaitre, Trull, Bouvier, Nonnotte, van Beek, Souhaut, Lacan and Jeandel. This is an open-access article distributed under the terms of the Creative Commons Attribution License (CC BY). The use, distribution or reproduction in other forums is permitted, provided the original author(s) and the copyright owner(s) are credited and that the original publication in this journal is cited, in accordance with accepted academic practice. No use, distribution or reproduction is permitted which does not comply with these terms.
*Correspondence: Melanie Grenier, bWVsYW5pZS5ncmVuaWVyQGxlZ29zLm9icy1taXAuZnI=; bWVsYW5pZWdyZW5pZXIxNEB5YWhvby5mcg==
†Present Address: Ester Garcia-Solsona, GRC Geociències Marines, Departament de Dinàmica de la Terra i de l'Oceà, Facultat de Ciències de la Terra, Universitat de Barcelona, Barcelona, Spain
Nolwenn Lemaitre, Department of Earth Sciences, Institute of Geochemistry and Petrology, ETH-Zürich, Zurich, Switzerland
Vincent Bouvier, GET, Université de Toulouse, CNES, CNRS, IRD, Toulouse, France
‡ Francois Lacan orcid.org/0000-0001-6794-2279