 Ramasamy Venkatesan
 Krishnamoorthy Ramesh
 Anand Kishor
- Ministry of Earth Sciences, National Institute of Ocean Technology, Chennai, India
Real-time spatio-temporal meteorological and oceanographic data, from the Ocean moored observatories, are essential for the precise forecast of the ocean state, climate variability studies and reliable weather prediction. Precise spatio-temporal measurement of subsurface parameters such as temperature, salinity and current are essential to understand the intra-seasonal and inter-annual evolution of monsoons and tropical cyclones. To cater to this time-critical information, moored observatories have to continuously be operational in the harsh marine environment to measure these essential ocean variables. However, bio-fouling and corrosion limits the life time and accuracy of the highly precise measuring instruments. Thus, best practices in these moored observations are essential for long term accurate and cost-effective ocean observation. The Indian moored buoy network which has been operational since 1997, has been providing quality data over the past decade. This paper describes the best operational practices and quality control processes followed in the Indian moored buoy system design, sensor calibration, testing, integration, deployment, retrieval, and data quality control over the past two decades, which has helped to achieve an average meteorological data return of 90%.
Introduction
The oceans cover more than 70% of the earth's surface and play a key role in our planet's life and ecology. Understanding climatic processes and the resulting impact are essential because of the increasing level of greenhouse gas emissions. Tropical oceans play a major role in the planet's climate as these regions are exposed to maximum solar irradiance and export this heat toward higher latitudes, causing climate events such as El Nino/southern oscillation (ENSO), Indian Ocean Dipole (IOD) and globally changing seasonal monsoons (McPhaden et al., 2009). Unattended ocean observatories capable of operating reliably under a harsh environment, while providing continuous temporal and spatial measurements of surface meteorological and the oceanographic parameters in real time, is essential to understand changes in the global climate (Bigg et al., 2003). As the ocean observing platforms and networks need to adopt common standards for data collection and dissemination, the Global Ocean Observation System (GOOS) has framed the Physics and climate Essential Ocean Variables (EOVs), based on the relevance (i.e., Climate, Operational Ocean Services, and Ocean Health), the feasibility of deriving the variable on a global scale and cost effectiveness. The variables associated with ocean biogeochemistry, biology, and the ecosystem, are therefore the major variables identified as EOVs by the GOOS. The Ocean Observations Panel for Climate (OOPC) is responsible for the Physics and Climate EOVs and delivers the climate theme for the oceans domain. The Physics EOVs include sea state, ocean surface stress, sea ice, sea surface height, sea surface temperature, subsurface temperature, surface currents, subsurface currents, sea surface salinity, subsurface salinity, and the ocean surface heat flux. These parameters are measured using satellites, moored observatories, drifting buoys, coastal radars, ships, tide gauges, ARGO floats, and sea gliders.
There are around 318 moored observatories (Figure 1) deployed globally, measuring the EOVs and reporting the data collected in the GTS format. Considering the importance of ocean observation in tropical regions, the Global Tropical Moored Buoy Array (GTMBA) was established. They include the Tropical Atmosphere Ocean/Trans-Ocean Buoy Network (TAO/TRITON) in the Pacific, the Prediction, and Research Moored Array in the Tropical Atlantic (PIRATA) and the Research Moored Array for African-Asian-Australian Monsoon Analysis and Prediction (RAMA) in the Indian Ocean (McPhaden et al., 2009). In addition to the GTMBA, several national networks are also maintained by many countries. In India, the Ocean Moored buoy Network for the Northern Indian Ocean (OMNI) is developed, deployed, and maintained in the Arabian Sea, while in the Bay of Bengal the network is maintained by the National Institute of Ocean Technology (NIOT) in Chennai, under the Ministry of Earth Sciences (MoES). Moored observatories in tropical regions, such as RAMA and OMNI, provide invaluable data sets to understand the Madden-Julian Oscillation (MJO), the Indian Ocean Dipole (IOD), and the intraseasonal variability of the currents at the equator (Masumoto et al., 2008) as well as tropical cyclones (McPhaden et al., 2009; Venkatesan et al., 2014).
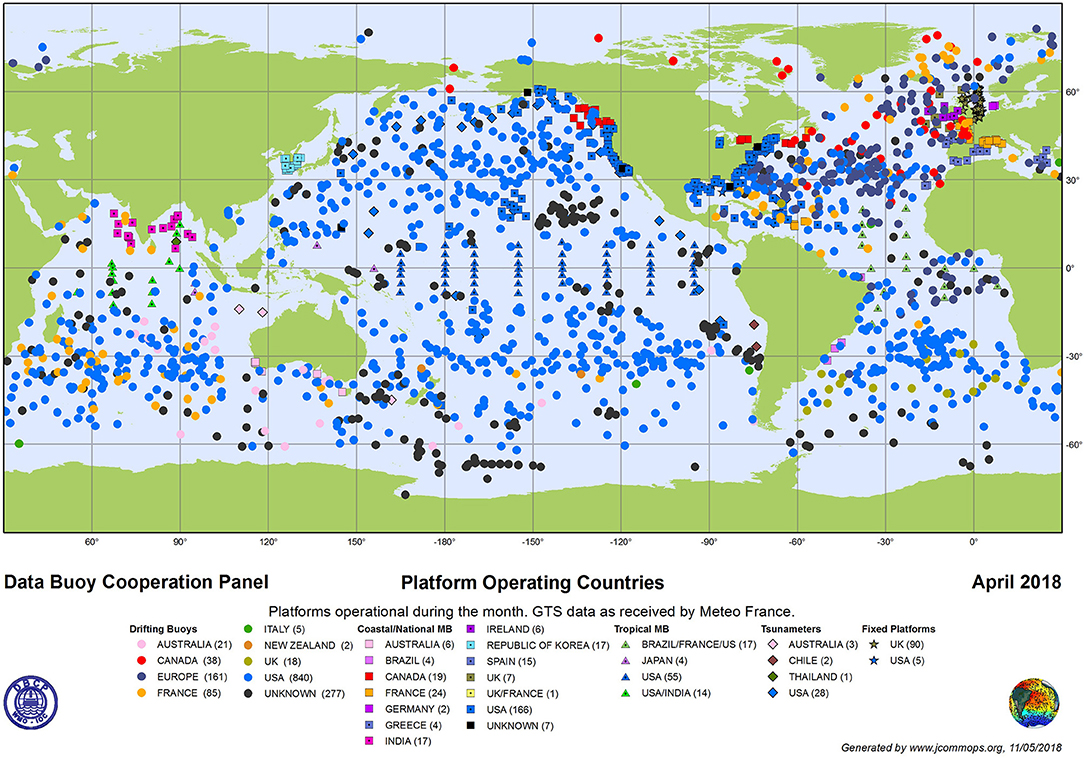
Figure 1. Moored observatories in Global Oceans with permission of (Data Buoy Cooperation Panel, 2009).
The OMNI buoys measure the EOVs and transmits the information in GTS format, in real time through satellites (Vengatesan et al., 2013). Currently, the moored buoys network has 19 moored observatories, four of which are deployed in coastal regions. The OMNI buoys comprise of polyurethane foam-filled fiber reinforced plastic hulls, moored to the sea bed using dead weight in an inverse centenary configuration (Figure 2).
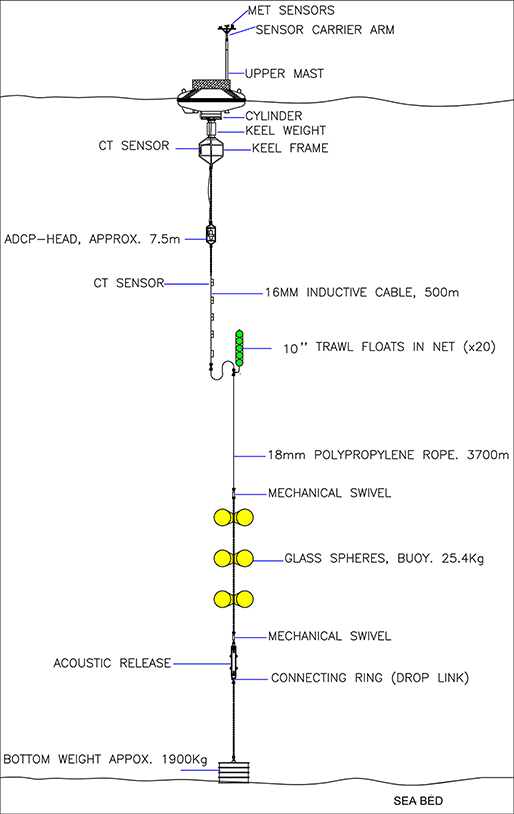
Figure 2. OMNI buoy system architecture.
The central aluminum cylinder comprises of a watertight instrument housing energy storage batteries, a power management unit and the data acquisition system (DAS) that are connected with the external sensors, to measure meteorological and ocean parameters such as the wind speed and direction, air temperature, humidity, pressure, precipitation, solar radiation, waves, sea water temperature, conductivity, and the water current. The sensors for measuring the meteorological parameters are mounted on the mast at 3 m above the mean sea level as recommended by the World Meteorological Organization (WMO)1. The measured data sets are stored in the DAS and transmitted to the mission control center (MCC) in NIOT using INMARSAT. The sensors are programmed to acquire data samples at a programmed frequency. The averaged data at the end of the sampling process is transmitted to the MCC every 3 h (Figure 3). The power system comprises of four 200 Ah lead-acid batteries powered by solar panels and backed with LiSoCl2 primary batteries. They are configured to meet the IEC 61508 safety reliability and Safety Integrity Level (SIL 4) (Venkatesan et al., 2015b).
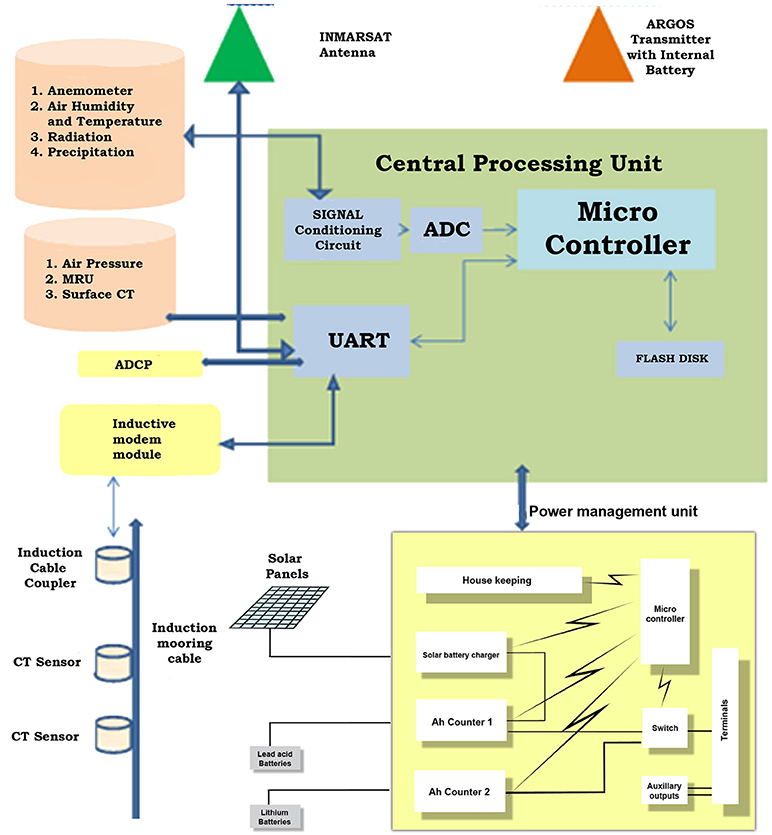
Figure 3. Moored buoy power system.
As accurate measurements of the EOVs are essential to understand climatic processes, moored observatories should follow the best practice methods and quality standards. The experiences gained, the best application practices adopted and the quality processes which have evolved over the past two decades through the process of development, operation, and upgradation of the Indian moored buoy networks, including the calibration of sensors, DAS, power systems, and mooring (Level–L1); integrated buoy testing, deployment and recovery (L2), as well as data acquisition and quality management (L3) (Figure 4), are detailed in this paper.
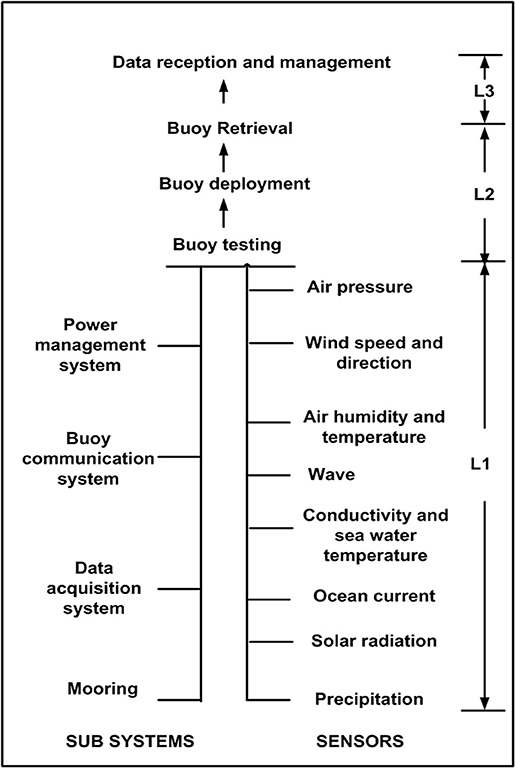
Figure 4. Quality and best practices in buoy system.
Data Acquisition System (DAS)
Data acquisition, processing, storage, and transmission are the key functions of the DAS. The DAS activates the respective sensors at pre-determined intervals and logs the received sensor data. The data acquisition from the sensors is done concurrently. The acquired raw data is processed and the averaged value of each parameter is encrypted and sent to the MCC through satellite telemetry (Meindl, 1996; Venkatesan et al., 2018). The DAS is a microprocessor-based system with custom developed application software. The sensor signal output may be in analog or digital formats, however, digital signals are highly immune to external noise compared to analog signals. A conventional digital interface device with RS232 protocol is also used for communication between the DAS and the sensors. Analog signal conditioning, to eliminate noise, is another important function of the DAS. Placing the signal conditioning and digitization electronics closer to the analog sensor reduces noise interference (Weller, 2018). The analog signal channels in the DAS need to be calibrated to acquire high quality data. The channels are calibrated to the voltage range which corresponds to the sensor's output range, using the standard digital DC source, digital multimeter (Venkatesan et al., 2018). Quality data acquisition can be achieved by:
1. The proper selection of the cable and connector. Use of shielded signal cables for reducing noise interference and electromagnetic coupling. Incorporation of analog isolation circuits such as capacitor, optical coupling or transformer coupling for elimination of ground loops and common mode signals. These practices help to achieve higher signal-to-noise ratio.
2. Using suitable analog to digital converters (ADC) to get the best resolution. As the range of analog outputs from the sensors vary, ADC using variable gain amplifiers in the signal conditioning units are preferred.
3. Using low pass filters to separate the signal from the noise which allows a correct corner frequency so that the original signal is not lost.
4. Using multi-channel ADC and channel switching methods, which may save power, reduce cost and footprint, as the resolution of the sensor reading depends on the number of bits of the ADC.
5. Using a reduced power processor with sleep mode provisions and multi-level watch dog timers, which protects the DAS from software hang-ups.
6. Carrying out qualification tests for newly developed DAS such as IP67, vibration, shock, climatic, and EMI/EMC.
7. Synchronizing the Real Time Clock (RTC) used in the processor and powered by a battery, with the Global Positioning System (GPS).
8. Selecting the size of the memory based on the number of connected sensors, sampling intervals, derived quantities and the deployed duration of the system. Circular memory management will be implemented as old data are overwritten by the latest.
9. Using software that has been designed to accommodate additional sensors and future changes in quality control criteria.
10. Using application software that has been designed with a Graphical User Interface (GUI) that supports user designed requirements such as the deployed position of the system, the sensors need to interface for monitoring with initialization time period, sampling time of the sensor, calibration coefficients, number of samples to be measured, averaging, data reduction, message formatting, data storage, and configuration of data transmission system details like destination details and mode of communication. This program is generally operated through a personal computer and finally these requirements will be downloaded in the field CPU.
11. Using reception software that has been developed to receive the data from the remote station, decode the data into a readable format, carry out quality control, and store the data in the database. This software could be operated with a Windows or Linux-based operating system.
Best Practice
1. The application software may have the option for two-way communication and the offshore station may be programmed to poll form MCC. The time slot for this communication may be configurable in the offshore remote station for polling data and troubleshooting the systems.
Buoy Communication System
Selection of the communication method depends on the distance of the buoy from the shore and the data bandwidth requirements, though other factors such as timeliness, cost and energy requirements also play a role. In the case of moored buoys closer to the shore, any of the systems described in Figure 5 may be selected. For deep ocean platforms operating far from the shore, satellite communication is the only realistic option. Based on the altitude of the satellite, systems are categorized as the GEO, Geostationary Earth Orbit; MEO, Mid altitude Earth Orbit; and the LEO, Low Earth Orbit. Globally, buoy user communities widely use three satellite communication systems i.e., INMARSAT (GEO), ARGOS, and IRIDIUM (LEO) (Vengatesan et al., 2013) The data transmission through the LEO satellites require less energy compared to the energy required for transmission through the GEO satellites, as they are positioned closer to the Earth (780 km).
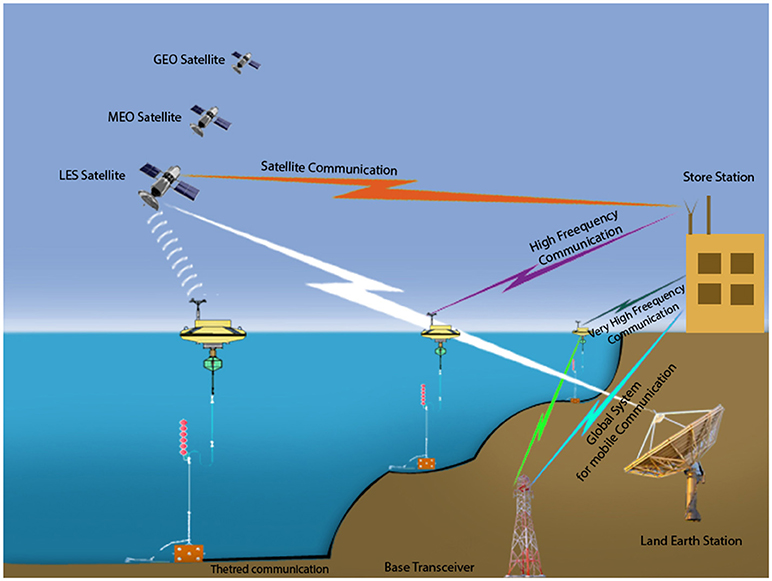
Figure 5. Buoy communication.
GPRS communication is used for data transmissions when the buoy is deployed in a coastal area within the GSM coverage zone. The GPRS is based on the principle of packet switching (Xu, 2005), along with the IP address and transmitted to the destination. The GPRS [GPRS Technical manual with specification by Merilin for GPRS, 2002] works on the Quad-Band GSM 850/900/1800/1900 MHz frequency.
Best Practice
1. To use two destinations with appropriate addresses with one redundant destination.
2. In GPRS, having two SIM cards, one primary and the other secondary, helps to avoid data transmission loss during network outages.
3. The IRIDIUM provides a greater data throughput and consumes less power.
4. The ARGO is the best option for buoy tracking purposes, as the transmitter has a smaller foot print and weighs less.
5. The INMARSAT antenna should be placed away from any obstacle, while the buoy antenna should be in the line of sight with the satellite.
Power Management System
In the data buoy, the primary source of power is from the lead-acid battery charged by the solar panel, while the secondary source is the primary lithium thionyl chloride battery. The power management system (PMS) is the central node in the buoy power supply system. The initial power to the entire system is supplied by the primary source and in case of outage of the primary source, the PMS switches the buoy power to the secondary source (Linden and Thomas, 2002). Other functions of the PMS include controlling the charging and discharging of the batteries, distributing power to the connected loads, providing power system status information to the DAS and performing DC/DC conversion to provide a constant voltage to the sensor, irrespective of the changes in the battery voltage. The total capacity of the battery is calculated based on the power budget (Figure 6). The number of sensors, sampling frequency and back up duration are other factors determining the battery capacity (Venkatesan et al., 2015a).
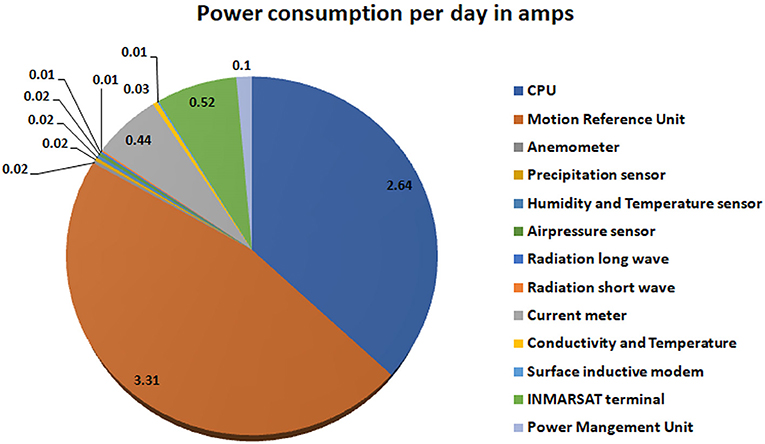
Figure 6. Power consumption of the buoy systems.
Best Practice
1. To have a secondary (backup) power source to support the system during unavailability of the primary power source.
2. Use of a resettable fuse in the sensor protection circuit to protect the power source in case of an external cable failure of the sensor.
3. To incorporate a vent valve in the battery compartment to release the hydrogen gas produced by the lead-acid batteries during charging.
4. To ensure a fail-safe operation, PMS should have redundant electronic circuits operating in a master and slave configuration.
5. Use of marine solar panels, with high durability and proper protective coating against dust, bird dropping etc., which does not affect the optical characteristics (Coppola et al., 2016).
Sensors
Wind Speed and Direction
The anemometer must be placed on the windward side of the buoy tower to allow undisturbed airflow. For this purpose, many buoy operators use a large wind vane on the mast to align the buoy hull with the wind (Meindl, 1996). The cup/propeller type anemometers are used in the majority of moored observatories in which the revolution speed is proportional to the wind speed, irrespective of the wind direction. The wind speed signals are generated using either a generator or a pulse generator and the wind direction is measured using either a potentiometer or an encoder system. The propeller type anemometer has a sensor with a streamlined body and a vertical tail to detect wind direction (Weller et al., 1990; Freitag et al., 2001). The threshold for these wind measurement sensors is around 1 m/s, due to the mechanical friction associated with the generator. In the propeller anemometer, the impellors and wind vane bearings tend to wear or corrode over time, which pose challenges in the measurement of lower wind speeds and start-up speed thresholds (Integrated Ocean Observing System, 2017a). Birds landing on the buoys, as well as wear and corrosion, are the main cause of failures in a mechanical type anemometer (Weller, 2018). To overcome these issues, sonic anemometers capable of measuring the wind speed based on the time of flight of sonic pulses between pairs of transducers could be used. Sonic anemometers measure wind speeds with very fine resolution, which makes them well-suited for turbulence measurements. The main disadvantage is the distortion of the wind flow structure supporting the transducers and a lower accuracy caused by precipitation. The threshold of these sensors is ideally zero as there is no mechanical friction.
A change in the sensor characteristic leads to deterioration of wind data quality. This may occur as a result of the physical damage or an increase in the bearing friction due to an ingress of dust and corrosion. In order to ensure stable, highly accurate wind speed observations, anemometers should be maintained and calibrated periodically (Freitag et al., 2001; World Meteorological Organization, 2008) in which the reference wind speed from a standard Pitot-static tube system is calculated using the differential pressure measurement principle. The measurement of the local conditions inside the wind tunnel test section such as ambient pressure, temperature, and humidity should be closely monitored to ensure high accuracy, as per the MEASNET guidelines and the calibration procedure for Cup/propeller/sonic performed as per ASTM, IEC and ISO standards. The equipment used to measure the differential pressure from the Pitot static tube, barometric pressure, air temperature, and relative humidity etc., must be traceable to a standard authority. The wind direction reference zero has to be aligned with the buoy compass reference north (Figure 7).
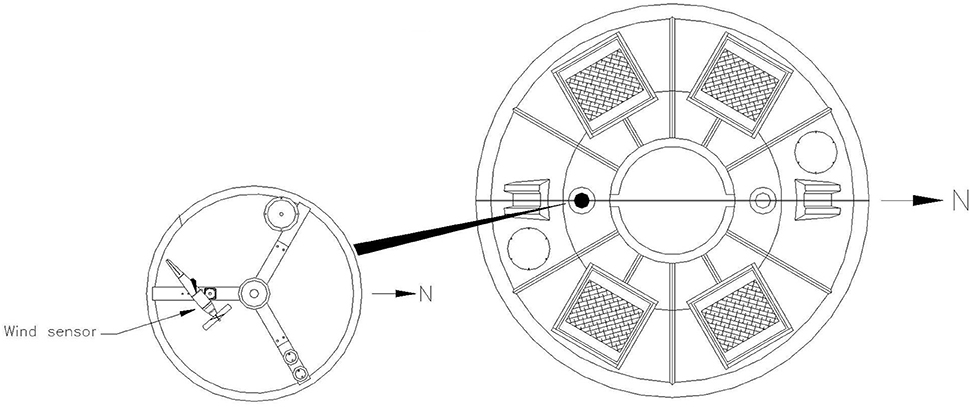
Figure 7. Top view of the buoy with north alignment.
Best Practice
1. The sensor should be fixed to align to the north.
2. It is preferable to have two anemometers with different sensing technologies.
3. The bearing must not be lubricated. If a significant increase of the starting value of the sensor is noticed, it needs attention.
4. The sensor should be relieved from the tractive load of the connecting cable.
5. The sensor should not be installed under the lee of large obstacles.
6. The cable should not be hanging or routed through outside.
Air Humidity and Temperature
Humidity sensors comprise of a hygroscopic dielectric material sandwiched between a pair of electrodes forming a small capacitor. Absorption of water vap or by the hygroscopic material results in an increase in sensor capacitance (World Meteorological Organization, 2008; Farahani et al., 2014). Relative humidity measurements require temperature data and air humidity and air temperature sensors are therefore provided as a combined system (Stephanie Bell, 2011). The metal resistance thermometers change their electrical resistance depending on the temperature, which is caused by the conduction mechanism of the metals. As the electrical resistance increases, in proportion to the temperature, the principle of positive temperature coefficient is used to measure the temperature. The sensor must be protected from shortwave solar radiation using multiple plate radiation shields (Anderson and Baumgartner, 1998; Richardson and Brock, 1999; Amudha et al., 2008) and R.M Young reported the heating of sensors in the radiation shield at 1080 W/m2 short-wave radiation as 0.4°C at 3 m/s and 1.5°C at 1 m/s.
Hygrogen is a portable humidity and temperature generator, which is used to generate a range of temperatures and humidity. A chilled mirror and a platinum resistance thermometer is used as a reference sensor to calibrate the air humidity sensor and air temperature sensor, respectively. Humidity sensor calibration is performed at different humidity conditions by keeping the air temperature constant while for air temperature calibration, it is vice versa. Sensors are calibrated in pre and post cruises. Post cruise calibration is performed without cleaning the filter (in the same form of retrieval) and the coefficient identified is used for data correction (Lake et al., 2003).
It was observed during measurements made by a humidity sensor probe (Figure 8) that when the relative humidity (RH) reaches 100% RH (saturated) it remains saturated permanently. This may be due to the saturation of RH that occurs during precipitation, or when direct water is sprayed on the Teflon cover of the humidity sensor probe. To avoid the permanent shift observed in the sensor %RH, the humidity sensor probe should be placed two inches below the roof of the shield, thus reducing the risk of direct exposure to the atmosphere. This may also increase the surface evaporation phenomenon on the filter surface, as the carrying wind flows away from the sensors, thus creating a temperature gradient between the cold wind above and the hot stagnant air below, resulting in evaporation, while the Teflon surface returns to normal %RH.
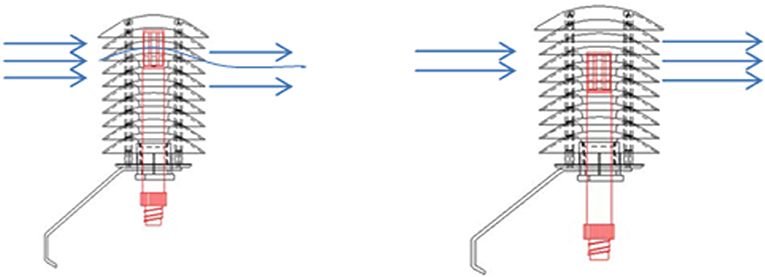
Figure 8. Humidity sensor placement in the radiation shield.
Best Practice
1. The probe must be protected from water splashes and rain and needs to be fitted accordingly. Fix the sensor probe two inches below the roof
2. Do not touch the sensors with fingers and use the Teflon filter to protect the transducer from dust.
3. The radiation shield should have low thermal conductivity.
Air Pressure
The capacitive type pressure measurement sensor is comprised of a main body with a metallic diaphragm, or coated with a conductive material forming one of the two plates of a dual-plate capacitor. If the diaphragm is deflected under pressure, the separation between the plates decrease, which results in an increase in its capacitance, while the plates' surface area and permittivity remains constant. The basic challenge associated with the atmospheric pressure measurement, is changes in the static value because of the dynamic effect of wind at the entrance port of the transducer. To overcome this, the orientation of the pressure port should be maintained perpendicular to the direction of wind flow. Another challenge associated with pressure measurement is the sensitivity of the transducer, referenced to the force of gravity and acceleration, which arises due to buoy motion. Fixing the transducer orthogonal to the direction of the highest possible acceleration will minimize the error (Meindl, 1996). The most fundamental pressure measurement technique for primary calibration of pressure sensors, is the deadweight tester that produces calibrated pressure related to the precision weights used and the local gravity field.
Best Practice
A water trap should be used to protect the pressure fitting from the rain, as water entry may result in errors in the pressure measurement.
Precipitation
Precipitation is measured using a capacitive transducer, which rests in the center of the measuring tube sensing the collected water column height. Precipitation is collected in a catchment funnel with a cross sectional area of 100 cm2. Periodic interrogation by a data logging system (sampling at 1 Hz with interval of 2 min) allows for the computation of the total precipitation and rate. The error associated with the evaporation from rain gauges and sea spray into the sensors is negligible and it is within the measurement error. However, the under catch, due to wind, is a tangible source of error in the precipitation measurement as it may create error in rainfall measurements to above 50% when wind speeds are above 10 m/s. The catchment area of the sensor should be located in undisturbed airflow (Serra et al., 2001).
Calibration is carried out using a flow bench in which a standard and known quantity of water is pumped from the reservoir to the sensor. Post calibration is performed without cleaning the measuring tube as received from the field.
Best Practice
1. Use a bird spike in the catchment area and install a plastic guard inside the funnel to prevent solid materials from falling into the gauge.
2. Do not mount the rain gauge with any inclination i.e., it should be vertically installed
3. Before deployment, the gauge must be primed to provide the necessary reservoir in the bottom of the gauge by adding cup water to the top.
Wave
The motion reference unit (MRU) measures the attitude of the buoy, which is one mode of moored buoy wave measurement. The six degrees of freedom in linear and rotational axis are measured with inbuilt accelerometers and gyro sensors, based on which wave parameters including roll, pitch, and yaw are calculated. The MRU is highly configurable and its dynamic response can be user programmed. For buoys, it is programmed for a cut-off frequency of 0.025 Hz. Above this frequency, the dynamic frequency response is given and is corrected by the software in the buoy controller. The wave direction measurement is based on the rapid sampling of heave, pitch and roll, together with the heading, which is then transformed to heave and slopes in a geographic co-ordinate system. The analysis to derive directional spectra is done using the traditional method used for the discus buoy and is carried out on board the buoy. From this analysis, the 1-D wave spectrum, mean wave direction and the directional wave spectrum is computed.
The bottom of the buoy hull is equipped with an anti-rotation fin to align the buoy with the wave direction. The wave exposed portion is also coated with antifouling paint to reduce the attachment of bio-organisms, since an increased fouling mass reduces the ability of the buoy to follow the ocean surface. In general, the response is improved by reducing the buoy mass, reducing the superstructure and employing a highly compliant mooring, which is particularly important for higher-frequency observations (Integrated Ocean Observing System, 2015b).
To carry out wave measurement consistently across various global networks, even though the hull, sensors and processing systems, payload, mooring, sampling frequency, and period vary, the Joint Technical Commission for Oceanography and Marine Meteorology (JCOMM) are taking necessary steps to establish required guidelines of best practices for wave measurements.
Best Practice
1. The sensor should be aligned to the north of the buoy.
2. Ensure the supply voltage to the wave sensor is stable and connect a proper power supply protection unit.
3. Fix the MRU to the floating buoys acting center of gravity.
4. Use non-magnetic material as a holder and do not place any magnetic material around the wave sensor.
Solar Radiation
Short wave/long wave radiation is measured using the thermopile sensor. The solar radiation is absorbed by the black coated area and is converted into heat. The heat flowing through the thermopile sensor generates a voltage output that is proportional to the incident solar radiation. For the incoming long wave radiation, the sensor is placed inside an opaque silicon dome, which filters the shortwave and allows only the long wave. The output voltages from these sensors are in the range of 0–10 μV/W/m2. The amplifier and digitizer of the measurement channel should be very stable and should not change either its gain or offset when the input power is recycled (Weller, 2018).
Best Practice
1. Clean the dome with a soft cloth/delicate wipes before deployment.
2. Replace the desiccant regularly when the color changes.
3. Align the spirit level on the sensor to the waterline of the buoy.
4. Never transport the sensors without proper packing.
5. The sensor should be mounted at the highest point in the buoy to avoid shadows being cast.
Ocean Current
Widely used current meters measure the ocean current at a single point up to 5 m, by sending a short pulse of sound at a known frequency generated by each monostatic transducer. As the sound travels through the water, it is reflected in all directions by particulate matter sediment, small organisms and air bubbles. Some portion of the reflected energy travels back along the transducer axis. The reflected energy is received and measures the frequency shift of the received signal. The Doppler frequency shift measured by a single transducer is an indicator of the velocity of the water along the axis of its acoustic beam. An optimum sampling frequency in surface current measurement should be selected considering the impact of wave orbital velocity in the currents. Wave orbital velocity is a function of wave height and wave period and penetrates to deeper depths thereby modifying the currents (Bigorre and Galbraith, 2018).
Best Practice
1. Never set the transducer on a hard or rough surface, as the urethane faces may get damaged.
2. Do not expose the transducer faces to prolonged sunlight (24 h or more), as the urethane faces may develop cracks.
3. Do not store the instrument in temperatures higher than 60°C or below −25°C, as the urethane faces (and some electronic components) may get damaged.
4. Do not connect or disconnect the cables when the instrument is energized, as when disconnected the connector pins may become pitted.
5. Align the compass whenever the battery is replaced, since ferro magnetic materials affect the compass (Integrated Ocean Observing System, 2015a).
6. Always dry the instrument before placing it in a storage case to avoid fungus growth.
Conductivity and Sea Water Temperature
The temperature sensor is a compact module containing a pressure-protected, high-speed thermistor, and Wien-bridge-oscillator interface electronics. The thermistor is the variable element in the Wien-bridge, while a precision Vishay resistor and two ultra-stable capacitors form the fixed components.
The principle of water conductivity measurement involves placing the two plates in the sample as a potential is applied across the plates, normally a sine voltage and the resultant current is measured. The charge on the ions in the solution facilitates the conductance of an electrical current and the conductivity of a solution is proportional to its ion concentration. Conductivity G, the inverse of Resistivity R is determined from the voltage and current values according to Ohm's law. G = I/R = I Amperes/E Volts.
The temperature and conductivity of the sensors are calibrated using computer-controlled temperature baths. Calibrations in pre and post deployment are important for the data correction. The Standard Platinum Resistance Thermometer (SPRT) calibrated using physical standards as triple-point-of-water cells and gallium melt cells, is used as a reference sensor (George et al., 2014).
IAPSO Standard Seawater is used as a primary standard for the conductivity calibration (Seitz et al., 2011; Integrated Ocean Observing System, 2016). The practical salinity of IAPSO is obtained by a series of conductance measurements at OSIL relative to KCL standard solutions, prepared using precise weights of KCL crystals (Bacon et al., 2007). The reference conductivity is calculated using the salinity of the water and reference temperature (Ando et al., 2004; Venkatesan et al., 2012; Caroline et al., 2014). Post-deployment calibration is done, as received from the field, without cleaning the conductivity cell. Based on the result of post-deployment, the pre deployment calibration is performed either by re-platinizing the cell or after cleaning the internal part of the cell. Temperature sensors are quite stable, whereas conductivity sensors tend to drift more rapidly over time because of the changes in the cell geometry by biofouling and scouring of the inner part of a conductivity cell (Ando et al., 2004; Bigorre and Galbraith, 2018).
Best Practice
1. Do not insert anything into the instrument to clean it; doing so can damage the electrodes or the interior glass walls.
2. Use an anti-fouling device (Seabird Electronics, 2016) and replace it every year.
3sw. Keep the cell clean of internal coatings.
Mooring System
The mooring systems widely used are taut or slack/inverse catenary. In the inverse catenary the upper section of the mooring is made of wire rope to provide strength and prevent failures caused fish bites, followed by a nylon rope which is connected to the Polypropylene rope (PP) below (Figure 2). The moorings offer a larger scope (1.2 to 1.5), allowing it to perform well even in high currents and wind forcing conditions. The positively buoyant PP rope ensures that the nylon rope does not get entangled with the mooring line below it, in low water currents. Thus, the inverse catenary design can sustain a wider range of environmental conditions (Trask and Weller, 2009). However, in some cases, the dynamic loads induced by rough seas may be so severe that is results in the fatigue failure of standard mooring hardware components (Ma et al., 2013). Therefore, choice and preparation of mooring hardware requires attention (Health Safety Executive UK, 1997). The design of a mooring system is finalized for each buoy system based on the deployment location's depth, water current, wind speed, and waves during extreme storm conditions and fatigue cycles (Coppola et al., 2016), by carrying out a finite element analysis using software packages like ORCAFLEX and CABLE (Figure 9).
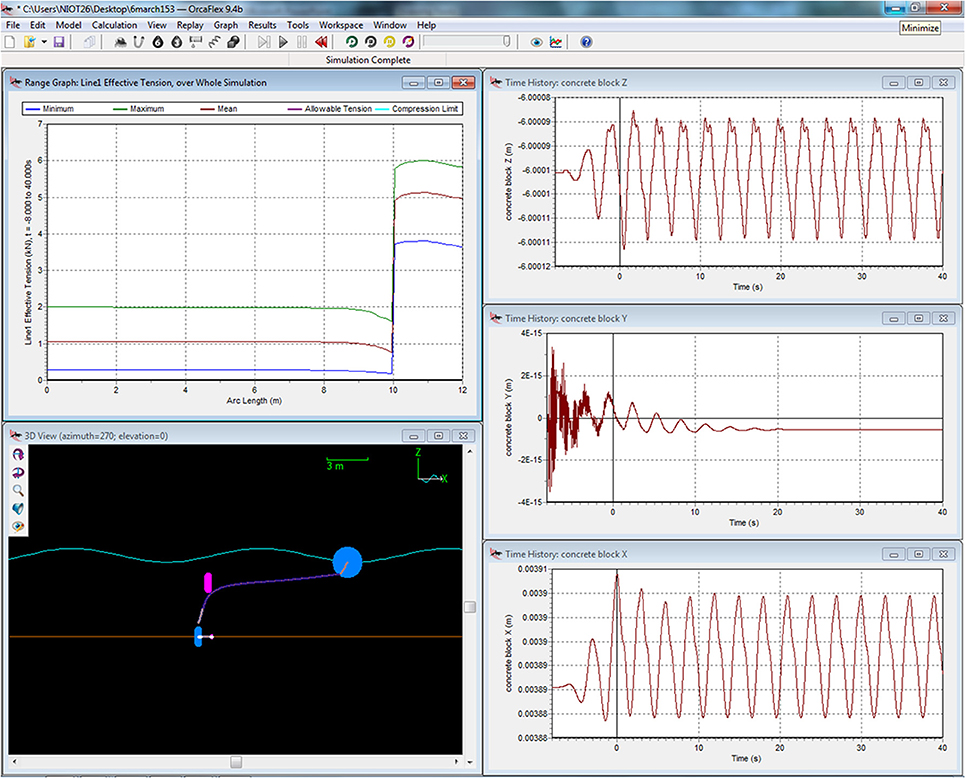
Figure 9. Mooring load analysis.
The weight of the mooring components, their net buoyancy, current profile, and the coefficient of drag are vital parameters used to calculate the mooring tension. Forces acting in the vertical direction include buoyancy, tension from above, tension from below, and drag from any vertical current. As the mooring components are not aerodynamic in shape the lift force can be neglected. In horizontal directions the forces include horizontal components of tension from above, horizontal components of tension from below and the drag due to the horizontal velocities. The buoyancy is determined by the mass and displacement of the device and is assumed to be a constant. The drag for each mooring element is calculated from its shape, the exposed surface area of the component, the appropriate velocity component and a drag coefficient. Table 1 summarizes the size and weight/length of the vital mooring components.
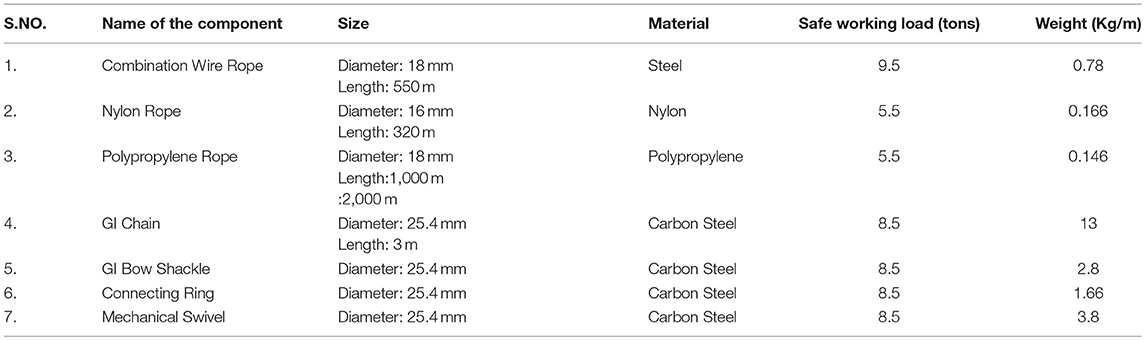
Table 1. Mooring components properties.
Safety Systems
The batteries are placed inside the instrument cylinder. Flammable gases like H2 (in case of the lead acid batteries) accumulate inside the instrument cylinder which may result in an increase in pressure, causing conditions that are prone to explosion. Based on the design considerations, as well as the established maintenance procedure, the following are some of the safety procedures. The buoys are equipped with radar reflector and lamp following the rule of IALA in order to make the buoy visible to sailor (Coppola et al., 2016)
FRP Casing for Batteries
Lead-acid batteries are mounted rigidly by using a separate FRP battery box in the instrument cylinder, to prevent batteries to come into contact with the aluminum cylinder, thus reducing the chance of explosion of hydrogen gas, caused by the cracking the batteries. A rubber gasket is provided on the battery compartment to isolate the remaining cylinder instrumentation from the gases released from the batteries.
Vent Valve and Its Testing Method
The vent valves provide ventilation to the battery compartment. The hose of the vent valve is directly connected to the battery compartment. At any instance, during the submergence of a buoy, the vent valves would not allow the seawater to seep inside the battery compartment. Hydrogen (H2) gas which is lighter than air, moves to the top of the cylinder and escapes through the vent valves, thus reducing the concentration of H2 inside the compartment. The vent valves are mounted on the top of the buoy in opposite directions and at reasonable distances, to avoid re-entry of exit air from the cylinder, thus providing circulation of fresh air inside the battery compartment. The pressure differences between the vent valves is generally caused by the wind, the heave and roll of the buoy and temperature differences within the buoy battery compartment.
Pressure Relief Valve
Pressure relief valves are incorporated to allow the escape of the gas to the atmosphere. The gas leaks from the battery compartment enter the cylinder, causing a redundancy in the safety of the cylinder. By using a pressure relief valve, the gaseous pressure that exceeds the pre-determined pressure value, is allowed to escape into the atmosphere. As a non-return valve, a pressure relief valve does not allow the water into the cylinder from outside.
Nitrogen Purging Plug
Two nitrogen plugs, as an inlet and an outlet, are used to purge the cylinder. Purging is done during deployment and retrieval operations, to allow the air inside the cylinder to exit, thus making the cylinder internal environment inert. Filling of nitrogen gas (with maximum pressure of 0.5 bar) will avoid the condensation of air with hydrogen when lead-acid batteries are used.
Protection Cover
The key feature of the cover is that it prohibits all access to the buoy lid and the buoy interior. It is fastened to the buoy using a rod that goes through the buoy. It is also used in areas where vandalism and theft may pose a problem. Metallurgical treatments are carried out to ensure the durability of the mechanical components of the buoy system.
Galvanic Corrosion Prevention
Zinc anodes are placed at the bottom of the central cylinder and keel weight to protect the metal parts from galvanic corrosion. Galvanic corrosion occurs when dissimilar metals are placed in an electrolyte solution such as seawater (Drisko, 1969), the addition of zinc actually increases the electric current activity between the metals, but because zinc is the least noble of the metals, corrosion damage is primarily confined to the zinc itself when properly installed (Winston Revie, 2011). The weight and the placement of the zinc anode plays a vital role in this process. The weight of the zinc anode depends on the surface area that needs to be protected and the current density of the parent material being protected. Based on the mentioned factors, the required weight is calculated and fixed at the parts of the components.
Antifouling Measures
The bio-fouling protection systems used in oceanographic sensors are categorized as purely mechanical devices such as wipers or scrapers; uncontrolled biocide generation systems based on the copper corrosion mechanism, biocide leaching, and controlled biocide generation systems based on a localized seawater electro-chlorination system or automatic acid dispensing devices (Delauney et al., 2010; Venkatesan et al., 2017). Various methods of anti-fouling approaches such as copper guard protection, polyester tape on a sensor casing and copper tape on a sensor casing are used in oceanographic sensors located on moored surface buoys (Venkatesan et al., 2016). Zinc oxide cream (Desitin), applied on the sensing parts of the transducers, to control the biomass deposition is also found to be effective (Bigorre and Galbraith, 2018). Silicone-based grease, applied to the acoustic element heads of Acoustic Doppler Current Profilers (ADCP), has shown to help inhibit biological growth on bottom-mounted frames. Copper guards, which serve as excellent antifouling devices deployed in oceanographic systems, corrode in seawater and the oxidized molecules get released into the water in the near proximity (Coppola et al., 2016). Copper is toxic at high concentrations to microbial (e.g., bacteria) and other larger organisms. Recently reported ultraviolet irradiation techniques, even though found effective for short term operations, is not suitable for long term deep sea buoys as the power required to run the system would be more than the power required to run a full system (Venkatesan et al., 2017).
Buoy Testing
The individual sensors are tested for its functionality prior to installation and deployment, which are to be interfaced with the buoy system. After individual sensor testing, the burn in test begins, in which a suit of tested sensors interfaced with the data logger and the telemetry for real time data transmission, is subjected to a burn-in test for 100 transmissions in open space, while the buoy is placed in good wind as well as a no shadow zone, in a low magnetic field location. The functionally of the electronics, data logger, power system, the sensors, and telemetry are monitored during the burn-in test period. After the successful completion of the burn-in test, the systems is qualified for deployment. All the tested sensors/components should be transported via ship using heat/shock proof containers. During transportation, pre-deployment test are carried out on-board where-in memory cards are initialized and the real time clock is set to GMT (Bigorre and Galbraith, 2018). Before deployment, transmitted data quality is verified for 72 h and a record is maintained in the MCC.
Deployment of the Buoy System
A Bathymetry survey is conducted by a multi-beam echo sounder (MBES) to identify a suitable location for deployment of the anchor (Figure 10). The length of the mooring and the watch circle radius (the calculated range of the buoy movement) is then calculated based on the depth of the location obtained from the MBES.
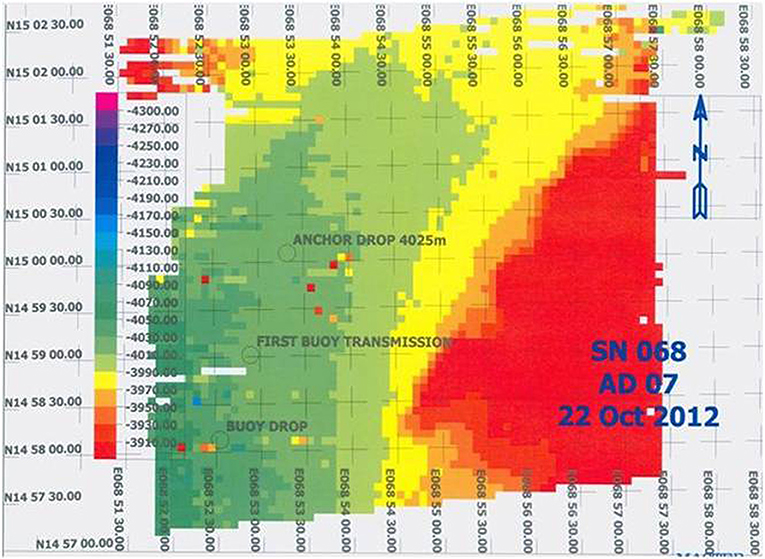
Figure 10. Sea floor bathymetry.
The following checks and procedures are vital for the pre-deployment procedure:
1. The instrument container should be purged with nitrogen gas before deployment.
2. All the buoy components and its details must be noted in the deployment sheet for future reference.
Once the on-board test data are confirmed as correct, the ship is positioned upwind and the buoy system is deployed (Figure 11).
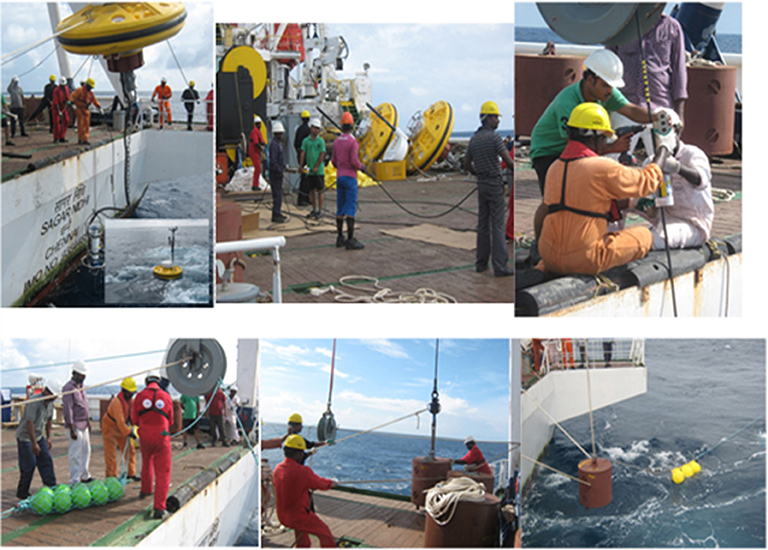
Figure 11. Deployment of the buoy systems.
Retrieval of the Buoy System
Upon reaching the site, the acoustic release command is executed so that the mooring is detached from the sinker weight. In all the activities, preference is given to safety. It is mandatory that all persons involved in the deployment and retrieval operations wear safety helmets, safety boots, coveralls, life jackets, and hand gloves etc. Photographs are taken of the entire buoy system for further studies and for vandalized components. The retrieved sensors are listed with a serial number and the corresponding depth and time of recovery for each sensor, while the sensor which measures temperature, is placed in cold water at a known precise time. This information is useful for real time clock correction in case of clock off or drifts (Bigorre and Galbraith, 2018). After completion of the retrieval procedure, the sensors should be cleaned for data downloading and processing to check the data availability of the sensor, over the complete deployment period. If not, the sensor is sent back to OEM for service. On completion of the data processing, the sensor should undergo post cruise calibration. The result of this calibration ensures the quality of the data collected over the sensors deployed period and is also useful for post-retrieval data correction.
Data Reception and Management
An integrated tool is required for the management of buoys, data, sensors, inventory, cruise, and operations. To place this tool in data management perspective, key areas such as ocean data management, quality control (QC) methodologies, QC standards (global, climatologic, and local), metadata, visualization tools, and communication systems are the focus. Managing data to ensure its availability and utility is the best practice and software tools are aimed at mining the data in the required format for predictive analysis, to apply quality control routines, to plot, and visualize the data in a dashboard on the go, thereby supporting scientific research, technical analyses, and syntheses of scientific information that can help to explain critical emerging issues.
Software- Raw Data to Useful Information
There is ample evidence supporting the importance of data from ocean observational systems but processing these data and converting them into information to a broader user community remains a huge challenge. Data managers face two major challenges today: the exponential growth of data volumes, which continually strain data ingestion, storage, and assimilation capabilities; and the need for timely accessibility of these data to the user community in a variety of useful formats. Meeting these challenges will require a concerted effort to integrate and modernize the current management system. An example is described below.
The ADvanced Data Reception & analysis System is a customized software solution, built in-house at NIOT, to reach across present barriers and allow information sharing and process automation across organizational needs. ADDRESS allows processing of complex and non-heterogeneous data files, permit objective analysis, interactive exploration, analysis and visualization of meteorological or oceanographic data, while other geo-referenced profiles are very useful during deployment cruises for instant data visualization and monitoring of buoy watch circles (Figure 12).
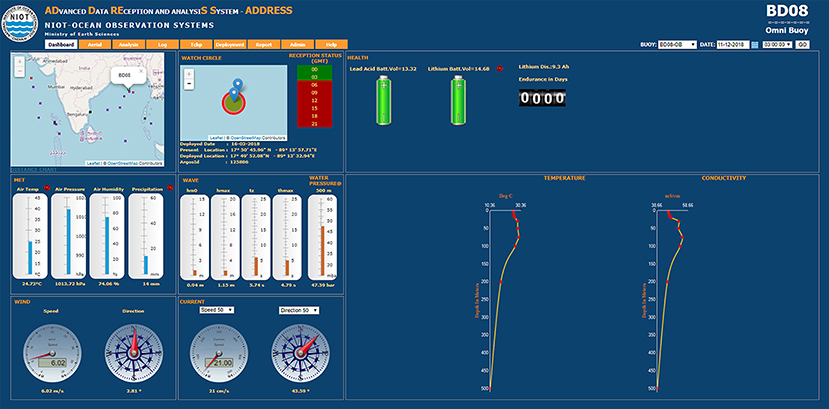
Figure 12. Graphical panel- ADDRESS software.
Best Practice
1. There should be an integrated dashboard for real time data reception, visualization, analysis, and sensor management.
2. Functionality includes instant monitoring on data reception from remote ocean platforms and endurance of individual buoys system.
3. To be equipped with a watch circle monitor, which tracks the movement of the buoy system in real time, with respect to world coordinates
4. To be designed with in-depth data analysis capabilities and automated QC, conforming to international standards.
5. Notifies the data availability statistics of individual platforms.
6. To be equipped with quick bird's eye view to have a panoramic view of platform and sensor configurations
7. To be incorporated with information on inventory, history of components & cruise operations.
8. Cross reference with related satellite data links and offers animated aerial view of current & wind patterns for analysis.
Quality Control Procedure
The Quality Assurance/Quality Control of Real-Time Oceanographic Data (QARTOD) manuals issued by the Integrated Ocean Observing System (Integrated Ocean Observing System, 2017b), the quality control manual issued by oceans ITES (Oceansites, 2015) and the data Quality Control Checks and Procedures issued by National Data Buoy Center (National Data Buoy Center, 2009) should be used for quality control of the real time data received from in-situ observations.
These quality control procedures are carried out in real time mode as well as in delayed mode, known as Real Time Quality Control (RTQC) and Delayed Mode Quality Control (DMQC). The real-time quality control procedures involve five basic tests (National Data Buoy Center, 2009). These basic tests are a primary level test to ensure the data delivered are of good quality. In the delayed mode, the data undergoes a correlation and range tests based on long term climatology data, which double-checks the real time quality control.
1. Range test
2. Spike test
3. Stuck value
4. Impossible location
5. Impossible time
Delayed Mode Quality Check
Later in DMQC, the measured values are checked against new range limits based on ± 3 times standard deviation of the climatological mean data, computed for each parameter, and specific to each location. The standard long-term data used for such an exercise is the International Comprehensive Ocean-Atmosphere Data Set (ICOADS) of National Ocean and Atmospheric Administration (NOAA). Buoy data can also be used to compute the daily climatological mean and standard deviation of each parameter. Thus, the daily atmospheric pressure data obtained from a moored buoy (10.5N/94E) during 2014 was plotted against the minimum and maximum limits of three times standard deviation from the climatological mean data computed using the data obtained from the buoy over 5 years (Figure 13).
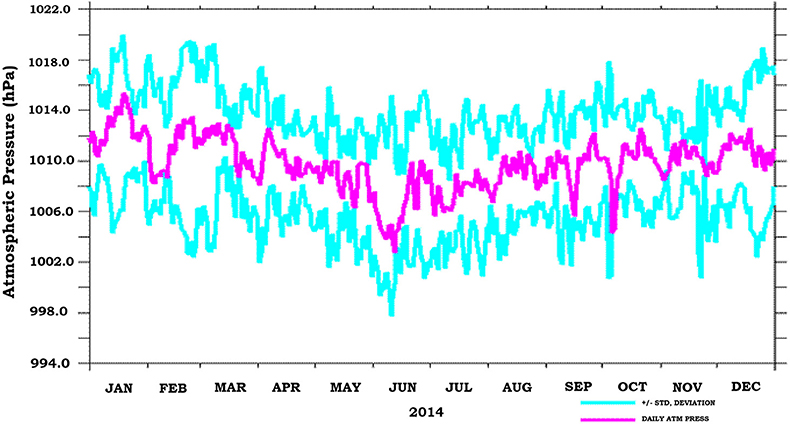
Figure 13. Atmospheric pressure measured by buoy system.
Correlation Test
This test checks the correlation between related parameters of an individual buoy. Abnormal changes in any of the parameters should be checked for similar changes in other related parameters. Especially for the Conductivity-Temperature (CT), sensors fitted in the top layer show similar kinds of variability in temperature and salinity values, as long as the sensors are within the mixed layer depth. The variability in the meteorological as well as oceanographic parameters can also be correlated with measurements taken using any other nearby platforms (ship-based measurement during deployment and retrieval). The conductivity-temperature measurements obtained from the CT sensors are validated against the Conductivity-Temperature-Depth (CTD) casts, which are done very close to the buoy location during the deployment and service period (Kanzow et al., 2006; Coppola et al., 2016; Mathew et al., 2016). If the correlations are good, then the CT sensor measurements taken by the buoy are proven to be free of any drift. One such comparison exercise was carried out near a BD10 (16.5N/88E) location using the CTD cast during the service of the buoy (Figure 14). Similarly the ADCP data can also be compared with the measurement made by a ship based ADCP. Due to the motion of the ship the uncertainty in the measurement is higher. This comparison should therefore be for validation purposes only (Bigorre and Galbraith, 2018). The parameters, which do not qualify the real time quality check and delayed mode quality check, will be flagged using different numbers.
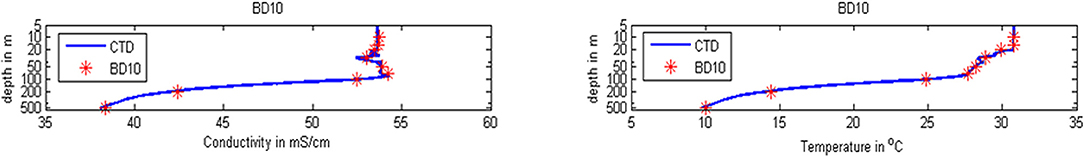
Figure 14. CTD profile comparison.
Discussion and Conclusion
In situ observations play a key role in operational oceanography and provides a wide spectrum of data to society. These real time data supports oceanographers to understand the thermodynamics of the ocean and enhances their knowledge about weather and climate. Data from in-situ observations are fed into ocean and atmosphere models for operational forecasts, which include warnings of tropical cyclones, storm surges, high waves, and monsoons. Small errors in these data can lead to major changes in the predicted outputs, causing misinterpretations of the results. The measurements from the moored observatories should, therefore, be highly accurate. Major challenges of ocean based in-situ observations include the adaptation of sensors and instruments for the ocean environment, as many of the sensors are designed and manufactured considering only land based and fixed observatories; the continued operation of moored buoy systems by providing cost effective, reliable, and stabilized power sources and data acquisition systems; corrosion in the mooring component and biofouling in the sensor; a reliable data communication system between the buoy and shore to provide better data return; and high quality data processing and storing. The experiences gained and the best application practices and methods adopted are the result of two decades of development, operation, and the up keep of the Indian moored buoy networks described in this paper. The presented information will contribute to addressing future challenges in a fruitful manner and ensure that high quality data is available for the user community.
Author Contributions
RV identified the need for best practices of moored observation systems, as the Chair of International Tsunameter Partnership of Data Buoy Cooperation Panel of UNESCO IOC & WMO and also the Steering committee member of UNESCO IOC Global Ocean Observation Systems (GOOS) and envisaged the article. KR and AK realized the article. NV provided the reliability aspects. MA contributed to the article text.
Funding
This work was supported by the Ministry of Earth Sciences MoES, Govt. of India.
Conflict of Interest Statement
The authors declare that the research was conducted in the absence of any commercial or financial relationships that could be construed as a potential conflict of interest.
Acknowledgments
The authors thank the Ministry of Earth Sciences MoES, Govt. of India, for funding the Ocean Observation network program and the members of the National Expert Committee for evolving this program. The authors also thank the Directors of NCAOR Goa and INCOIS Hyderabad for providing all the facilities and logistical support. We also thank the staff of the Ocean Observation Systems (OOS) group, Vessel Management Cell of the NIOT as well as the ship staff and crew for their excellent help and support on board.
Footnotes
1. ^World Meteorological Organization. Available online at: https://www.jcomm.info/index.php?option=com_content&view=article&id=90
References
Amudha, B., Anjan, A., Ranalkar, M., Vashistha, R. D., and Pratap, R. (2008). Effect of Non-Wooden Radiation Shield on Measurements of Air Temperature and Humidity in Automatic Weather Stations at Climatologically Different Indian Stations Pune and Mumbai. WMO TECO, Petersburg, VA.
Anderson, S. P., and Baumgartner, M. F. (1998). Radiative heating errors in naturally ventilated air temperature measurements made from buoys. J. Atmos. Ocean Technol. 15, 157–173.
Ando, K., Matsumoto, T., and Nagahama, T. (2004). Drift characteristics of a moored conductivity-temperature-depth sensor and correction of salinity data. J. Atmos. Ocean. Technol. 22, 282–291. doi: 10.1175/JTECH1704.1
Bacon, S., Culkin, F., Higgs, N., and Ridout, P. (2007). IAPSO Standard Seawater: Definition of the uncertainty in the calibration procedure, and stability of recent batches. J. Atmos. Ocean. Tech. 24, 1785–1799. doi: 10.1175/JTECH2081.1
Bigg, G. R., Jickells, T. D., Liss, P. S., and Osborn, T. J. (2003). The role of the oceans in climate. Int. J. Climatol. 23, 1127–1159. doi: 10.1002/joc.926
Bigorre, S. P., and Galbraith, N. R. (2018). “Sensor performance and data quality control,” in Observing the Oceans in Real Time. Springer Oceanography, eds R. Venkatesan, A. Tandon, E. D'Asaro and M. Atmanand (Cham: Springer), 243–262.
Caroline, L. B., Florence, S., Nolwenn, L., and Chantal, C. (2014). “The effect of the salinity level on conductivity sensor calibration,” 16th International Congress Of Metrology (Plouzané). doi: 10.1051/epjconf/20147700015
Coppola, L., Ntoumas, M., Bozzano, R., Bensi, M., Hartman, S. E., CharcosLlorens, M. I., et al. (2016). Handbook of Best Practices for Open Ocean Fixed Observatories. European Commission, FixO3 Project, 127. (European Commission, FixO3 project, FP7 Programme 2007-2013 under grant agreement n° 312463). Available online at: http://hdl.handle.net/11329/302
Data Buoy Cooperation Panel (2009). Joint Technical Commission for Oceanography and Marine Meteorology. Available online at: http://www.jcommops.org/dbcp/network/dbcpmaps.html (Accessed August 13, 2018).
Delauney, L., Compère, C., and Lehaitre, M. (2010). Biofouling protection for marine underwater observatories sensors. Ocean Sci. 6, 503–511. doi: 10.5194/os-6-503-2010
Farahani, H., Wagiran, R., and Hamidon, M. N. (2014). Humidity sensors principle, mechanism, and fabrication technologies: a comprehensive review. Sensors 14, 7881–7939. doi: 10.3390/s140507881
Freitag, H. P., Haleck, M. O., Thomas, G. C., and McPhaden, M. J. (2001). Calibration Procedures and Instrumental Accuracies for ATLAS Wind Measurements. NOAA Technical Memorandum OAR PMEL-119.
George, P., Michael, H., Wilhelm, P., Rajesh, N., Jukka, S., and Florence, S. (2014). JERICO. Report on Calibration Best Practices. D4.2.
Health and Safety Executive UK (1997). Improved Reliability of Mooring Chain Systems. Offshore Technology Report-OTO 96 018.
Integrated Ocean Observing System (2015a). Manual for Real-Time Quality Control of In-Situ Current Observations Version 2.0: A Guide to Quality Control and Quality Assurance of Acoustic Doppler Current Profiler Observations. Available online at: https://ioos.noaa.gov/ioos-in-action/currents/
Integrated Ocean Observing System (2016). Manual for Real-Time Quality Control of In-situ Temperature and Salinity Data Version2: A Guide to Quality Control and Quality Assurance for In-situ Temperature and Salinity Observations. Available online at: https://ioos.noaa.gov/ioos-in-action/temperature-salinity/
Integrated Ocean Observing System (2017a). Manual for Real-Time Quality Control of Wind Data Version 1.1: A Guide to Quality Control and Quality Assurance for Coastal and Oceanic Wind Observations. Available online at: https://ioos.noaa.gov/ioos-in-action/wind-data/
Integrated Ocean Observing System (2017b). Manual for the Use of Real-Time Oceanographic Data Quality Control Flags.
Integrated Ocean Observing System (2015b). Manual for Real-Time Quality Control of In-Situ Surface Wave Data Version2:A Guide to Quality Control and Quality Assurance of In-Situ Surface Wave Observations. Available online at: https://ioos.noaa.gov/ioos-in-action/wave-data/
Joint Technical Commission for Oceanography Marine Meteorology (2018). Wave Measurement Evaluation and Test. Available online at: https://www.jcomm.info/index.php?option=com_content&view=article&id=90 (Accessed August 05, 2018).
Kanzow, T., Send, U., Zenk, W., Chave, A. D., and Rhein, M. (2006). Monitoring the integrated deep meridional flow in the tropical North Atlantic: long-term performance of a geostrophic array. Deep Sea Res. I 53, 528–546. doi: 10.1016/j.dsr.2005.12.007
Lake, B. J., Sonya, M., Noor, H., Freitag, P., and McPhaden, M. J. (2003). Calibration Procedures and Instrumental Accuracy Estimates of ATLAS Air Temperature and Relative Humidity Measurements. NOAA Technical Memorandum OAR PMEL.
Ma, K.-T., Duggal, A., Smedley, P., L'Hostis, D., and Shu, H. (2013). “A historical review of on integrity issues of permanent moorings,” in Offshore Technology Conference, OTC24025. Houston, TX.
Masumoto, Y., Horii, T., Ueki, I., Hase, H., Ando, K., and Mizuno, K. (2008). Short-term upper-ocean variability in the central equatorial Indian Ocean during 2006 Indian Ocean Dipole event. Geophys. Res. Lett. 35:L14S09. doi: 10.1029/2008GL033834
Mathew, S., Shamji, V. R., Vengatesan, G., Arul Muthiah, M., and Venkatesan, R. (2016). Systematic Validation of Conductivity and Temperature from Ocean moored buoy data in the northern Indian Ocean with in situ ship based measurements. Indian J. Mar. Sci. 45, 224–229. Available online at: http://nopr.niscair.res.in/handle/123456789/35034
McPhaden, M. J., Ando, K., Bourlès, B., Freitag, H. P., Lumpkin, R., Masumoto, Y., et al. (2009). “The global tropical moored buoy array,” in Proceedings of the OceanObs'09: Sustained Ocean Observations and Information for Society Conference, Vol. 2, eds J. Hall, D. E. Harrison, and D. Stammer (Venice: ESA Publication WPP-306).
McPhaden, M. J., Foltz, G. R., Lee, T., Murty, V. S. N., Ravichandran, M., Vecchi, G. A., et al. (2009). Ocean-atmosphere interactions during cyclone Nargis. Trans. Am. Geophys. Union 90, 53–54. doi: 10.1029/2009EO070001
Meindl, A. (1996). Guide to Moored Buoys and Other Ocean Data Acquisition Systems. Geneva: WMO & IOC Data Buoy Cooperation Panel.
National Data Buoy Center (2009). Handbook of Automated Data Quality Control Checks and Procedures. NDBC technical document 09–02.
Oceansites (2015). Oceansites Data Format Reference Manual. Available online at: http://www.oceansites.org/docs/oceansites_data_format_reference_manual.pdf
Richardson, S. J., and Brock, F. V. (1999). Minimizing errors associated with multiplate radiation shields. J. Atmos. Oceanic Technol. 16, 1862–1872.
Seabird Electronics (2016). Anti-foulant Device. Available online at: http://www.seabird.com/glossary (last accessed October14, 2016).
Seitz, S., Feistel, R., Wright, D. G., Weinreben, S., Spitzer, P., and de Bievre, P. (2011). Metrological traceability of oceanographic salinity measurement results. Ocean Sci. 7, 45–62. doi: 10.5194/os-7-45-2011
Serra, Y. L., A'Hearn, P., Freitag, H. P., and McPhaden, M. J. (2001). ATLAS self-siphoning rain gauge error estimates. J. Atmos. Ocean Technol. 18, 1989–2002 doi: 10.1175/1520-0426(2001)018<1989:ASSRGE>2.0.CO;2
Stephanie Bell, A. (2011). A Beginner's Guide to Humidity Measurement. New Delhi: National Physical Lab.
Trask and Weller, R. A. (2009). “Mooring,” in Woods Hole Oceanographic Institution. Woods Hole, MA: Academic Press. doi: 10.1006/rwos.2001.0304
Vengatesan, G., ArulMuthiah, M., Upadhyay, J. S., Sundaravadivelu, N., Sundar, R., and Venkatesan, R. (2013). “Real time, low power, high data rate and cost effective transmission scheme for coastal buoy system,” in SYMPOL 2013 Conference (Kochi).
Venkatesan, R., Kadiyam, J., SenthilKumar, P., Lavanya, R., and Loganathan, V. (2017). Marine biofouling on moored buoys and sensors in the Northern Indian Ocean. Mar.Technol. Soc. J. 51, 22–30. doi: 10.4031/MTSJ.51.2.11
Venkatesan, R., Mathew, S., Vimala, J., Latha, G., Arul Muthiah, M., Ramasundaram, S., et al. (2014). Signatures of very severe cyclonic storm Phailin in met–ocean parameters observed by moored buoy network in the Bay of Bengal. Curr. Sci. 107, 589–595.
Venkatesan, R., Ramesh, K., Kesavakumar, B., Arul Muthiah, M., Ramasundaram, S., and Jossia Joseph, K. (2018). Coastal observation by moored buoy system in Indian region. J. Ocean Technol. 13, 54–70.
Venkatesan, R., Senthilkumar, P., Vedachalam, N., and Murugesh, P. (2016). Biofouling and its effects in sensor mounted moored observatory system in Northern Indian Ocean. Int. Biodeterior. Biodegrad. 116, 198–204.doi: 10.1016/j.ibiod.2016.10.034
Venkatesan, R., Shamji, V. R., Latha, G., Mathew, S., Rao, R. R., Muthiah, A., et al. (2013). In situ ocean subsurface time-series measurements from OMNI buoy network in the Bay of Bengal. Curr. Sci. 104, 1166–1177.
Venkatesan, R., Vedachalam, N., Arul Muthiah, M., Kesavakumar, B., Sundar, R., and Atmanand, M. A. (2015a). Evolution of reliable and cost-effective power systems for buoys used in monitoring Indian seas. Mar. Technol. Soc. J. 49, 71–87. doi: 10.4031/MTSJ.49.1.8
Venkatesan, R., Vedachalam, N., Murugesh, P., Kaliyaperumal, P., Kalaivanan, C. K., Gnanadhas, T., et al. (2015b). Reliability analysis and integrity management of instrumented buoy moorings for monitoring the Indian seas. Soc. Underwater Technol. 33, 115–126. doi: 10.3723/ut.33.115
Venkatesan, R., Yadava, Y. S., and Atmanand, M. A. (2012). “Training Manual on Best of Practices for Instruments and Methods of Ocean Observation”. Regional Workshop on ‘Best Practices for Instruments and Methods of Ocean Observation' Chennai: WMO/DBCP.
Weller, R. A. (2018). “Observing Surface Meteorology and Air-Sea Fluxes,” in Observing the Oceans in Real Time. Springer Oceanography, eds R. Venkatesan, A. Tandon, E. D'Asaro, and M. Atmanand (Cham: Springer), 17–36.
Weller, R. A., Rudnick, D. L., Payne, R. E., Dean, J. P., Pennington, N. J., and Trask, R. P. (1990). Measuring near-surface meteorology over the ocean from an array of surface moorings in the subtropical convergence zone. J. Atmos. Ocean. Technol. 7, 85–103.
World Meteorological Organization (2008). Guide to Meteorological Instruments and Methods of Observation.
Keywords: moored buoys, data return, reliability, Indian ocean, data acquisition system, sensors
Citation: Venkatesan R, Ramesh K, Kishor A, Vedachalam N and Atmanand MA (2018) Best Practices for the Ocean Moored Observatories. Front. Mar. Sci. 5:469. doi: 10.3389/fmars.2018.00469
Received: 24 August 2018; Accepted: 23 November 2018;
Published: 20 December 2018.
Edited by:
Jay S. Pearlman, Institute of Electrical and Electronics Engineers (France), FranceReviewed by:
Mark Bushnell, National Oceanic and Atmospheric Administration (NOAA), United StatesChristoph Waldmann, University of Bremen, Germany
Copyright © 2018 Venkatesan, Ramesh, Kishor, Vedachalam and Atmanand. This is an open-access article distributed under the terms of the Creative Commons Attribution License (CC BY). The use, distribution or reproduction in other forums is permitted, provided the original author(s) and the copyright owner(s) are credited and that the original publication in this journal is cited, in accordance with accepted academic practice. No use, distribution or reproduction is permitted which does not comply with these terms.
*Correspondence: Ramasamy Venkatesan, dmVua2F0QG5pb3QucmVzLmlu