 Jochen Wollschläger
 Rüdiger Röttgers
 Wilhelm Petersen
 Oliver Zielinski
- 1Institute for Chemistry and Biology of the Marine Environment, University of Oldenburg, Oldenburg, Germany
- 2Institute of Coastal Research, Helmholtz-Zentrum Geesthacht, Geesthacht, Germany
Together with scattering, the process of absorption determines the propagation of light within the water column. It is influenced by the concentration and composition of optically active substances (phytoplankton, chromophoric-dissolved organic matter, and non-living particles). For this reason, the absorption coefficients of a water sample can provide corresponding information. However, the accurate determination of absorption coefficients in natural waters is often difficult due to the usually low concentration of absorbing material and the errors that scattering on particles introduce in the measurements. These problems can be overcome by instruments based on integrating cavities like the point-source integrating-cavity absorption meter (PSICAM). The accuracy of PSICAM measurements is to a large degree related to the accuracy of the measurement of the reflectivity inside its cavity, as this determines its mean optical path length. A reflectivity measurement (“calibration”) is usually carried out by measuring a liquid dye (nigrosin) with known absorption coefficients, followed by bleaching and rinsing of the cavity. The procedure requires additional equipment like spectrophotometers and handling of a liquid standard. Therefore, it might be difficult or at least non-convenient under field conditions and is additionally a major obstacle for a potential automation of these systems. In the present study, an alternative calibration approach for a PSICAM is evaluated, taking advantage of a solid standard. The standard is characterized and its suitability for calibration is compared to that of a conventional, nigrosin-based reflectivity measurement. Furthermore, the application in an automated flow-through PSICAM system (HyAbS) used in the field is tested. The results show that the performance of the solid standard calibration is comparable to that of the nigrosine-based calibration. Furthermore, it improves the measurements of the automated system. Thus, due to its simplicity, the solid standard calibration might foster the use of PSICAM systems, which allow a more accurate determination of absorption coefficients in natural water samples compared to conventional spectrophotometric techniques. Furthermore, it will potentially facilitate further approaches to automate these instruments.
Introduction
When light enters a medium, e.g., the ocean’s water column, two processes determine the fate of the photons: light absorption and scattering. These processes are determined by the properties of the water molecules themselves together with the properties of the substances dissolved or suspended therein. Since they are independent of the structure of the ambient radiation (the present light field), absorption and scattering are considered as the inherent optical properties (IOPs) of the water (Preisendorfer, 1976). Together with fluorescence-based approaches, measurements of these properties are nowadays among the primary means of probing water for concentration and composition of optically active substances like phytoplankton, chromophoric dissolved organic matter (CDOM), and non-living particles (Moore et al., 2009). However, often a clear differentiation in the measurement of the two processes is technically difficult, because the substances present in natural waters usually both absorb and scatter light. Normally, the measurement of one optical process has to be corrected for the influence of the other, or the optical setup has to be arranged in a way that the influence of absorption is avoided or at least minimized when a scattering property is going to be determined, and vice versa. Nevertheless, an unbiased determination is necessary for the correct development of models and algorithms, as well as for the validation of remote sensing products.
The present study is related to the determination of the total volume absorption coefficients of water constituents (except that of water itself). Light absorption by these constituents has a major impact on the light distribution in the water column (Kirk, 2011; Watson and Zielinski, 2013), and the spectral properties of suspended particles, mainly phytoplankton, provide information about phytoplankton pigment concentrations (Hoepffner and Sathyendranath, 1992) and taxonomic composition (Johnsen et al., 1994; Millie et al., 2002). However, the determination of the absorption coefficients is hindered by two problems: The usual low concentration of absorbing substances, especially particles, in natural waters, and the fact that these particles do not only absorb, but also scatter light. Imagine a simple photometric setup for the determination of absorption coefficients: A light beam is emitted by a light source, passes the volume of water constituting the sample, and finally reaches the detector, a light-sensitive element like a photomultiplier, where it is converted in an electrical current that can be quantified. If the water contains optically active substances, the light loss is greater than for pure water. In case particles are part of these substances, a certain proportion of light that is used for the measurement is not lost due to the absorption properties of the sample, but because it is scattered out of the field of view of the detector. This additional light loss leads to an overestimation of the true absorption coefficient of the sample.
Originating from simple spectrophotometric measurements, a variety of methods have evolved to obtain more accurate absorption coefficient data. One way to deal with low concentrations is simply to increase the optical path length, e.g., by using long path length cuvettes (Bricaud et al., 1981). However, classical rectangular cuvettes for laboratory spectrophotometers are limited in their availability and handleability (commercial versions up to 10 cm). Furthermore, the scattering error increases with path length. Alternatively, liquid core fibers can be used, enabling path lengths of up to 5 m (D’Sa et al., 1999). Although these systems have been used for the analysis of native water samples (Kirkpatrick et al., 2000), they are, due to the risk of clogging and the still present scattering error caused by particles, mostly used for the analysis of the dissolved fraction of the optically active substances. Still then, their handling requires careful procedures (e.g., avoiding air bubble contaminations).
For the investigation of the particulate fraction, a widespread approach is the so-called quantitative filter pad method, where the material is concentrated on a glass fiber filter before it is measured photometrically (Yentsch, 1962). Although this allows the analysis of particulate absorption in very clear waters, these measurements require the application of a correction factor (β), which takes into account path length amplifications due to internal reflections of the measuring light inside the filter. The value of this factor has to be determined empirically and varies depending on particle composition, type and concentration in the filter; this variation is considered as a major source of error for this method (Roesler, 1998). Furthermore, through the filtering process, the sample can be altered from its in situ state, what might also introduce biases in the analysis.
The approaches to overcome or minimize the scattering errors in absorption measurements have been similarly manifold: In laboratory spectrophotometers, opaque glass slides have been introduced in the optical pathway to introduce the same amount of diffusivity in both the reference and the sample (Shibata, 1959). Alternatively, the cuvettes or filters used have been placed in front of or inside integrating spheres (Haardt and Maske, 1987; Röttgers and Gehnke, 2012). These spheres consist of highly reflective materials that are able to reflect an individual photon may times. Therefore, by placing the sample at the entrance or inside of such a sphere, a diffuse light field is created that consist of both the photons of the coherent light beam passing the sample as well as of the photons that are scattered by the particles present. Thus, as by this method the scattered photons are included in the measurement, the measured light loss can be completely attributed to the absorption properties the sample.
An example for an in situ instrument that tries to minimize particle scattering during the absorption coefficient measurements is the AC-S or its predecessor the AC-9 (formerly WetLabs, now Sea-Bird Scientific, United States). Here, the absorption measurements are performed inside a tube of approx. 25 cm length. The walls are reflective, what allows the collection of the majority of the forward scattered light by the detector. However, the remaining error is still considerable, requiring correction procedures (Röttgers et al., 2013). Furthermore, there have been approaches by which the sample water is directly filled into an integrating cavity, tube or sphere. These instruments are referred to as integrating cavity absorption meters (ICAMs; Fry et al., 1992; Dana and Maffione, 2006). By also using a diffuse light field for absorption measurements, they minimize the scattering error like described above, since all light is included in the measurement, whether scattered on particles or not. Furthermore, the use of a relatively large sample volume makes the samples more representative and, due to the multiple reflections of the photons on the cavity wall, the optical path length is considerably increased, allowing also measurements in very clear waters. A special, simple form of these ICAM-systems is the point-source integrating cavity absorption meter (PSICAM; Kirk, 1995, 1997). Its integrating cavity is spherical, and the diffuse light field used for the absorption measurements is arranged by a light source located in the center of the sphere. The PSICAM concept was transferred into a laboratory instrument by Röttgers and co-workers and into an in situ sensor (OSCAR, TriOS GmbH, Germany) and is successfully used since a decade. In recent times, there have been made also efforts to operate ICAM or PSICAM devices continuously in flow-through mode, and even to automate them (Gray et al., 2006; Musser et al., 2009; Wollschläger et al., 2013, 2016).
However, it is important to note that the PSICAM does not have a constant path length, as the mean optical path length is a function sample absorption and wall reflectivity (Kirk, 1997). The reflectivity can change due to contaminations on the cavity wall and aging of the wall material. Thus, the accuracy of the PSICAM depends on a careful and frequent determination of the wall’s reflectivity. This so-called “calibration” of the instrument is usually carried out by measuring the ratio of light intensities when the cavity is filled with two solutions with different, but known absorption coefficients (Kirk, 1997). Usually, one solution is purified water, where the absorption coefficients can be derived from literature (Pope and Fry, 1997), the other is a solution of the black dye nigrosin that is measured in a conventional spectrophotometer to determine its absorption coefficients. More details about the calibration procedure can be found in Leathers et al. (2000) and Röttgers et al. (2005). However, in this approach, the dye itself also alters the reflective properties of the cavity wall as it stains the wall material. This remaining color has to be removed before measuring the actual sample, usually by bleaching the cavity with a sodium hypochlorite solution for several minutes. Thus, the whole procedure is to a certain degree inconvenient, relatively time consuming, and depends in its quality not only on the measurements in the PSICAM itself, but also on the accuracy in the spectrophotometric determination of the absorption coefficients of the used dye solution. Especially in the field, this can be a major source of error (influence of the ship’s movement on the photometric measurements), or it requires special equipment (e.g., liquid core fibers). Furthermore, it is a major obstacle with respect to a potential automated long-term deployment of instruments based on integrating cavities, because their operation duration would be limited by the supply of all necessary liquids (purified water as reference, dye solution and bleach for calibration; Wollschläger et al., 2013).
To overcome this disadvantage using a PSICAM, we propose and evaluate an alternative approach for its calibration: Instead using a black dye, the known absorption coefficient spectrum required for calibration is created by a black plastic stick that is introduced into the cavity. This approach would make the handling of a PSICAM much simpler, and could also potentially improve the accuracy of the measurements, because calibrations could be performed much more frequently (ideally one calibration per sample measurement). For other instruments, for example fluorometers, the application of a solid standard to check the instrument performance is already common (Earp et al., 2011). Furthermore, such a solid standard calibration could foster an automation of integrating cavity systems and their integration into autonomous observing systems in the future.
Materials and Methods
PSICAM Reflectivity and Absorption Measurement
For the evaluation of the solid standard calibration approach, a laboratory PSICAM was used (Figure 1A). The principal setup is identically with the one described by Röttgers et al. (2005, 2007). The liquid that is measured is directly filled into the cavity. The cavity consists of a highly reflective material (OP.DI.MA, Gigahertz Optik, Germany) and has a diameter of about 9 cm. In the center, a quartz ball of 1 cm diameter is glued to a custom made optical fiber (Loptek, Germany) that is pushed through a plug and connected to the light source (CF1000e, Illumination Technologies, United States). This arrangement constitutes the point light source that creates the diffuse light field inside the spherical cavity. A second optical fiber (Avantes, Netherlands), used as radiance detector for the transmitted light, is integrated in the cavity wall and is connected to a spectrophotometer (AvaSpec ULS2048XL-EVO, Avantes, Netherlands). For both the calibration measurements performed to calculate the reflectivity of the cavity and for the measurement of the spectral absorption coefficients inside the sphere, purified water (18.2 MΩ) was used as reference. The calibration standard was either a solution of nigrosine or a solid standard.
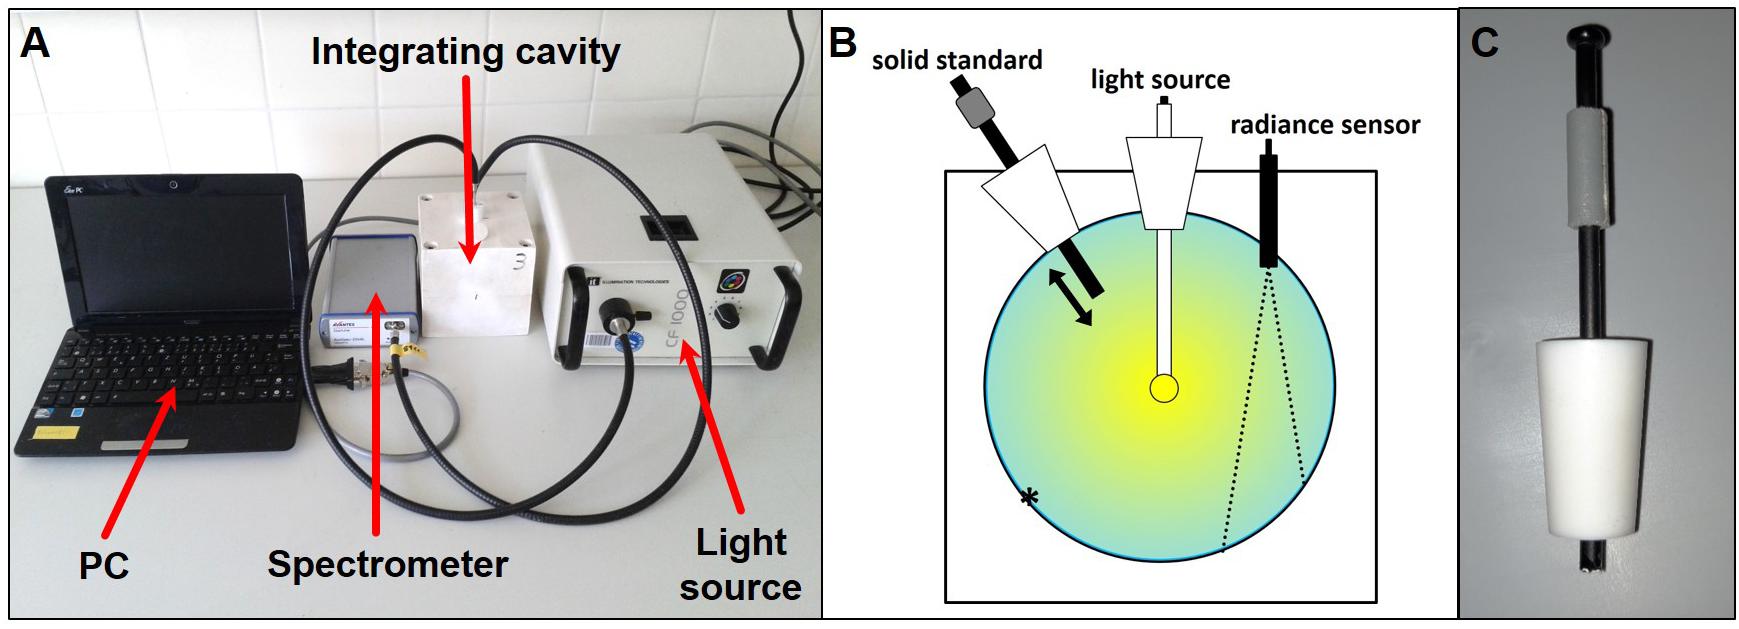
Figure 1. Point-source integrating-cavity absorption meter (PSICAM). (A) Principal setup. (B) Schematic longitudinal section through the PSICAM cavity equipped with the solid standard. The star marks the spot where the reflectivity was altered locally by a piece of black tape; the dotted lines indicate the field of view of the detector. (C) PSICAM solid standard.
The nigrosine solution was always prepared right before the experiment by diluting a few drops of a stock solution in purified water, and its absorption was determined using a spectrophotometer (UV-2700, Shimadzu, Japan) and a 10-cm cuvette. Each PSICAM calibration measurement consisted of a light intensity measurement inside the cavity when it was filled with purified water, followed by a measurement when it was filled with the nigrosine solution. After every filling of the cavity with nigrosine, the cavity was bleached with 0.1% NaOCl solution for 15 min to remove nigrosine residuals, followed by rinsing with purified water.
The solid standard consisted of a black plastic stick (4 mm diameter) pushed through a hole in the plug that closed the cavity (Figures 1B,C). A stopper ensured that the distance over which the stick reaches in the cavity (max. 30 mm) was reproducible. There had been no special considerations regarding the material of the stick (in this study, it was made of PVC) except that the surface should be matt instead of glossy to keep the light field in the cavity homogeneous. The measurement procedure was identically to the one using nigrosine, but instead of re-filling the cavity after the reference measurement, just the stick was pushed in the cavity still filled with purified water, and then the light intensity was measured. Sample measurements were done in the same way (measuring of the reference followed by the sample).
The equations used for calculating wall reflectivity and absorption coefficients are given elsewhere (Kirk, 1997; Leathers et al., 2000; Röttgers et al., 2005). The required absorption coefficients of pure water were taken from Pope and Fry (1997), while the results were corrected for the influence of temperature and salinity on the water absorption using the coefficients given by Röttgers et al. (2014). Temperature of the respective liquid inside the cavity was determined right before the measurement, while the salinity (in case of natural samples analyzed) was taken from CTD measurements obtained at the sampling depth. Reflectivity and absorption coefficient spectra were evaluated from 400 to 710 nm, thus in the range of the visible light spectrum. At longer wavelengths, the absorption of the water itself becomes too high to have sufficient light to achieve accurate measurements, while at shorter wavelengths the light source does not provide enough intensity for accurate measurements.
Laboratory Experiments and Proof-of-Concept
Characterization of the Solid Standard
When the solid standard is introduced into the cavity filled with purified water it absorbs light inside the PSICAM, and this absorption effect is equivalent to an absorption inside the PSICAM by homogeneously distributed particles or dissolved material. Thus, correctly speaking, not the absorption of the stick itself is measured, but its effect on the volume absorption coefficient of a sample (in this case purified water) in the PSICAM. In order to measure this equivalent effect of the solid standard on the absorption coefficient spectrum in the cavity, first the reflectivity of the PSICAM cavity had to be determined by conventional calibrations (n = 4) using nigrosin, each separated by a bleaching and rinsing step as described above. To ensure maximal reflectivity at the beginning of the experiments, the cavity was initially bleached once before the first measurement for 30 min. For measurements to characterize the solid standard, the cavity was filled with purified water for the reference measurement, and subsequently, the solid standard was pushed into the water-filled cavity. This was repeated several times (n = 5). For evaluating the influence of small changes in the optical setup, additional measurements were made where both the plug with the standard and the plug with the light source (see Figure 1) were arranged in various orientations (n = 5 for each arrangement). In detail, the both plugs were switched clockwise in 90, 180, and 270°. Furthermore, in order to examine whether the absorption effect of the standard behaves linearly, the stick was also pushed into the cavity to only 25, 50, and 75% of its maximal length (30 mm).
Comparison of Calibration With Nigrosin and Solid Standard
In order to determine whether changes in the reflectivity of the PSICAM cavity can be seen by a calibration with the solid standard in the same way as with a calibration with nigrosin, the following experiments were conducted: First, the mean cavity reflectivity was artificially altered by placing a piece of black tape (approx. 0.5 cm diameter) on the cavity wall, outside of the field of view of the detector (see Figure 1). To prevent further alteration by the bleaching treatments, the tape piece was covered with transparent tape. Then, sets of calibrations (n = 5) were made where first the solid standard was used then a nigrosine solution. A second set of experiments (n = 5) aimed to observe potential differences between the described punctual change of reflectivity and an overall change. To create the latter situation, the PSICAM cavity was filled with a highly concentrated nigrosin solution (10× the concentration used for the calibration measurement) before the beginning of the measurements. To minimize leeching of the dye from the wall into the measuring liquids, the cavity was one additional time rinsed with purified water before the reference measurement.
Field Application in an Automated System
One of the potential applications of a solid standard calibration of a PSICAM-derived system is the fostering of automation. An already existing prototype of a flow-through PSICAM (Hyperspectral Absorption Sensor, HyAbS; Wollschläger et al., 2013, 2016) was equipped with such a standard. Then, its performance was compared to the measurements with a conventional laboratory PSICAM. The field data were obtained on a cruise (HE516) with the research vessel Heincke from July to August 2018. The cruise covered the North Sea and the western coast of Great Britain and Ireland (Figure 2). Measurements with the HyAbS were performed continuously during the cruise; the instrument was supplied with sample water from the moon pool of the ship. At certain cruise stations (marked in red in Figure 2), PSICAM measurements using the same surface water were made for comparison.
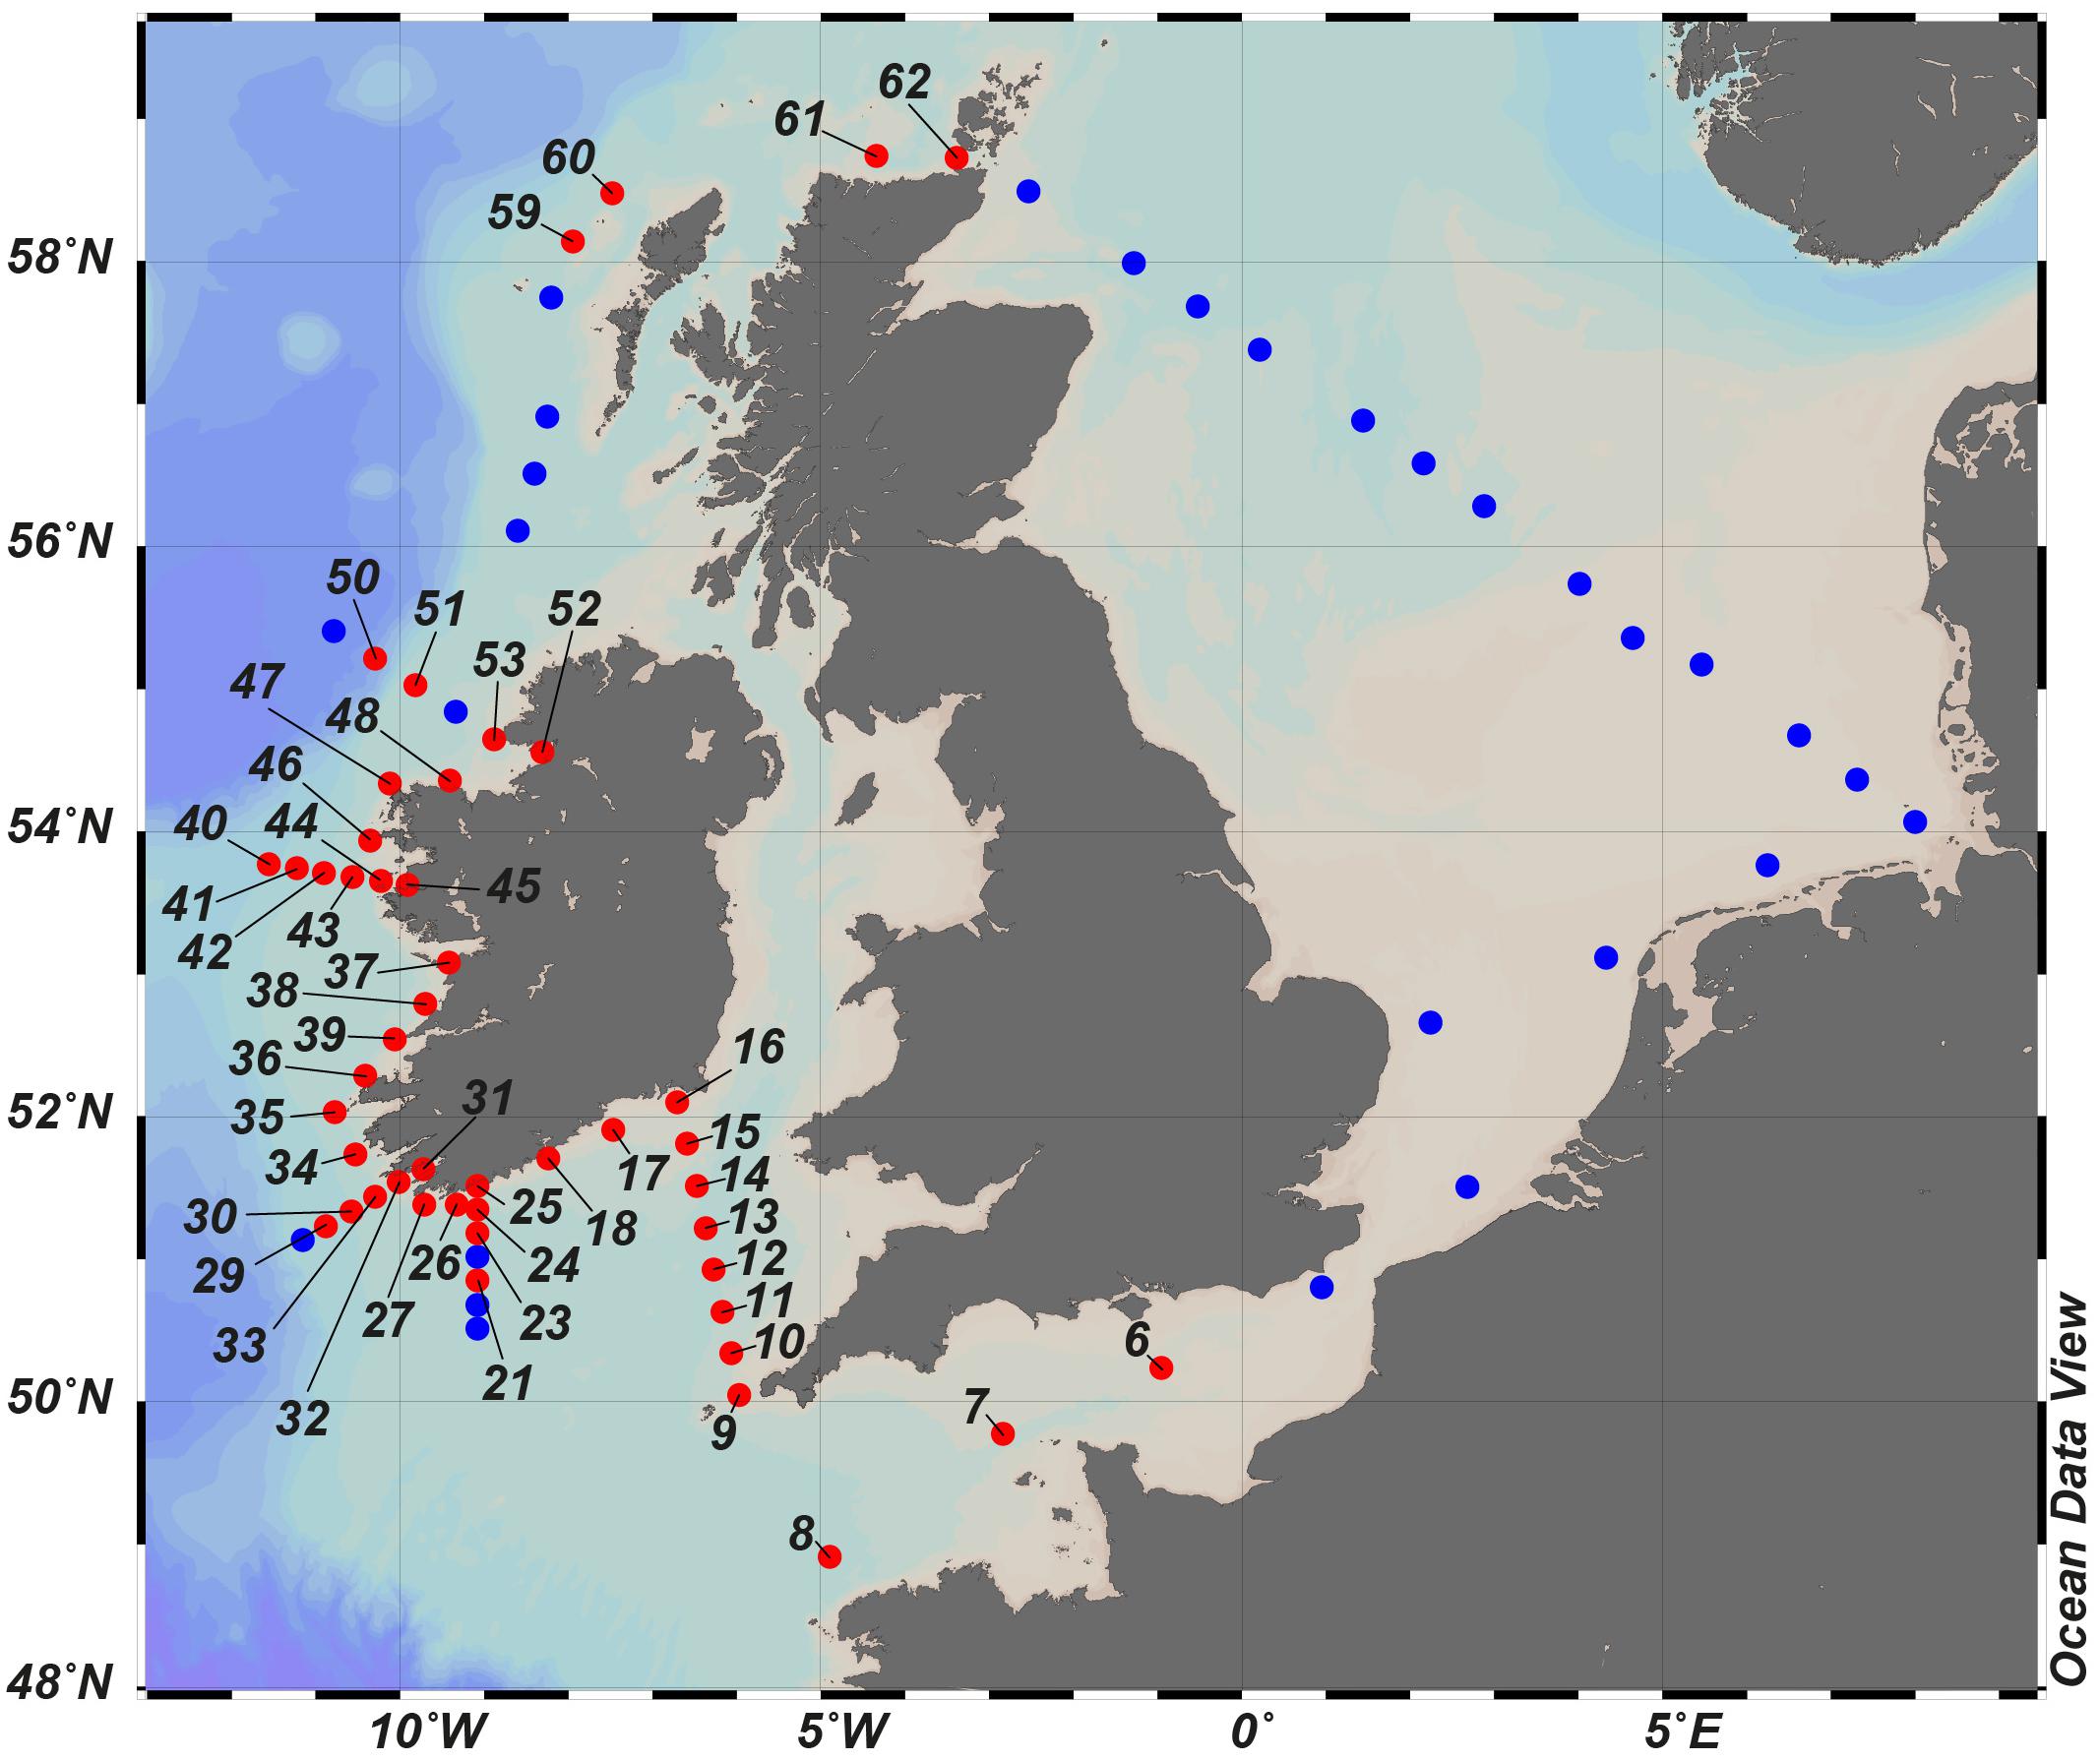
Figure 2. Research area of the cruise HE516. The labeled stations marked in red are those where measurements for a comparison of the HyAbS and the PSICAM were available.
For the technical details of the HyAbS, the reader is referred to Wollschläger et al. (2016), but a schematic overview is also given in Figure 3. Basically, it consists of a PSICAM-cavity that was modified with water in- and outlets to enable flow-through operation. The water stream pumped through the cavity is guided by a system of valves. All components, including the light source and the spectrometer, are controlled by a custom-made software written in LabView. The newly added solid standard enters the cavity through one of the water outlets and is moved via a rocker by a linear actuator (Nanotec, Germany) that is also controlled by the software to enable automated usage. The standard used here had a diameter of 8 mm and entered the cavity at a length of 14 mm.
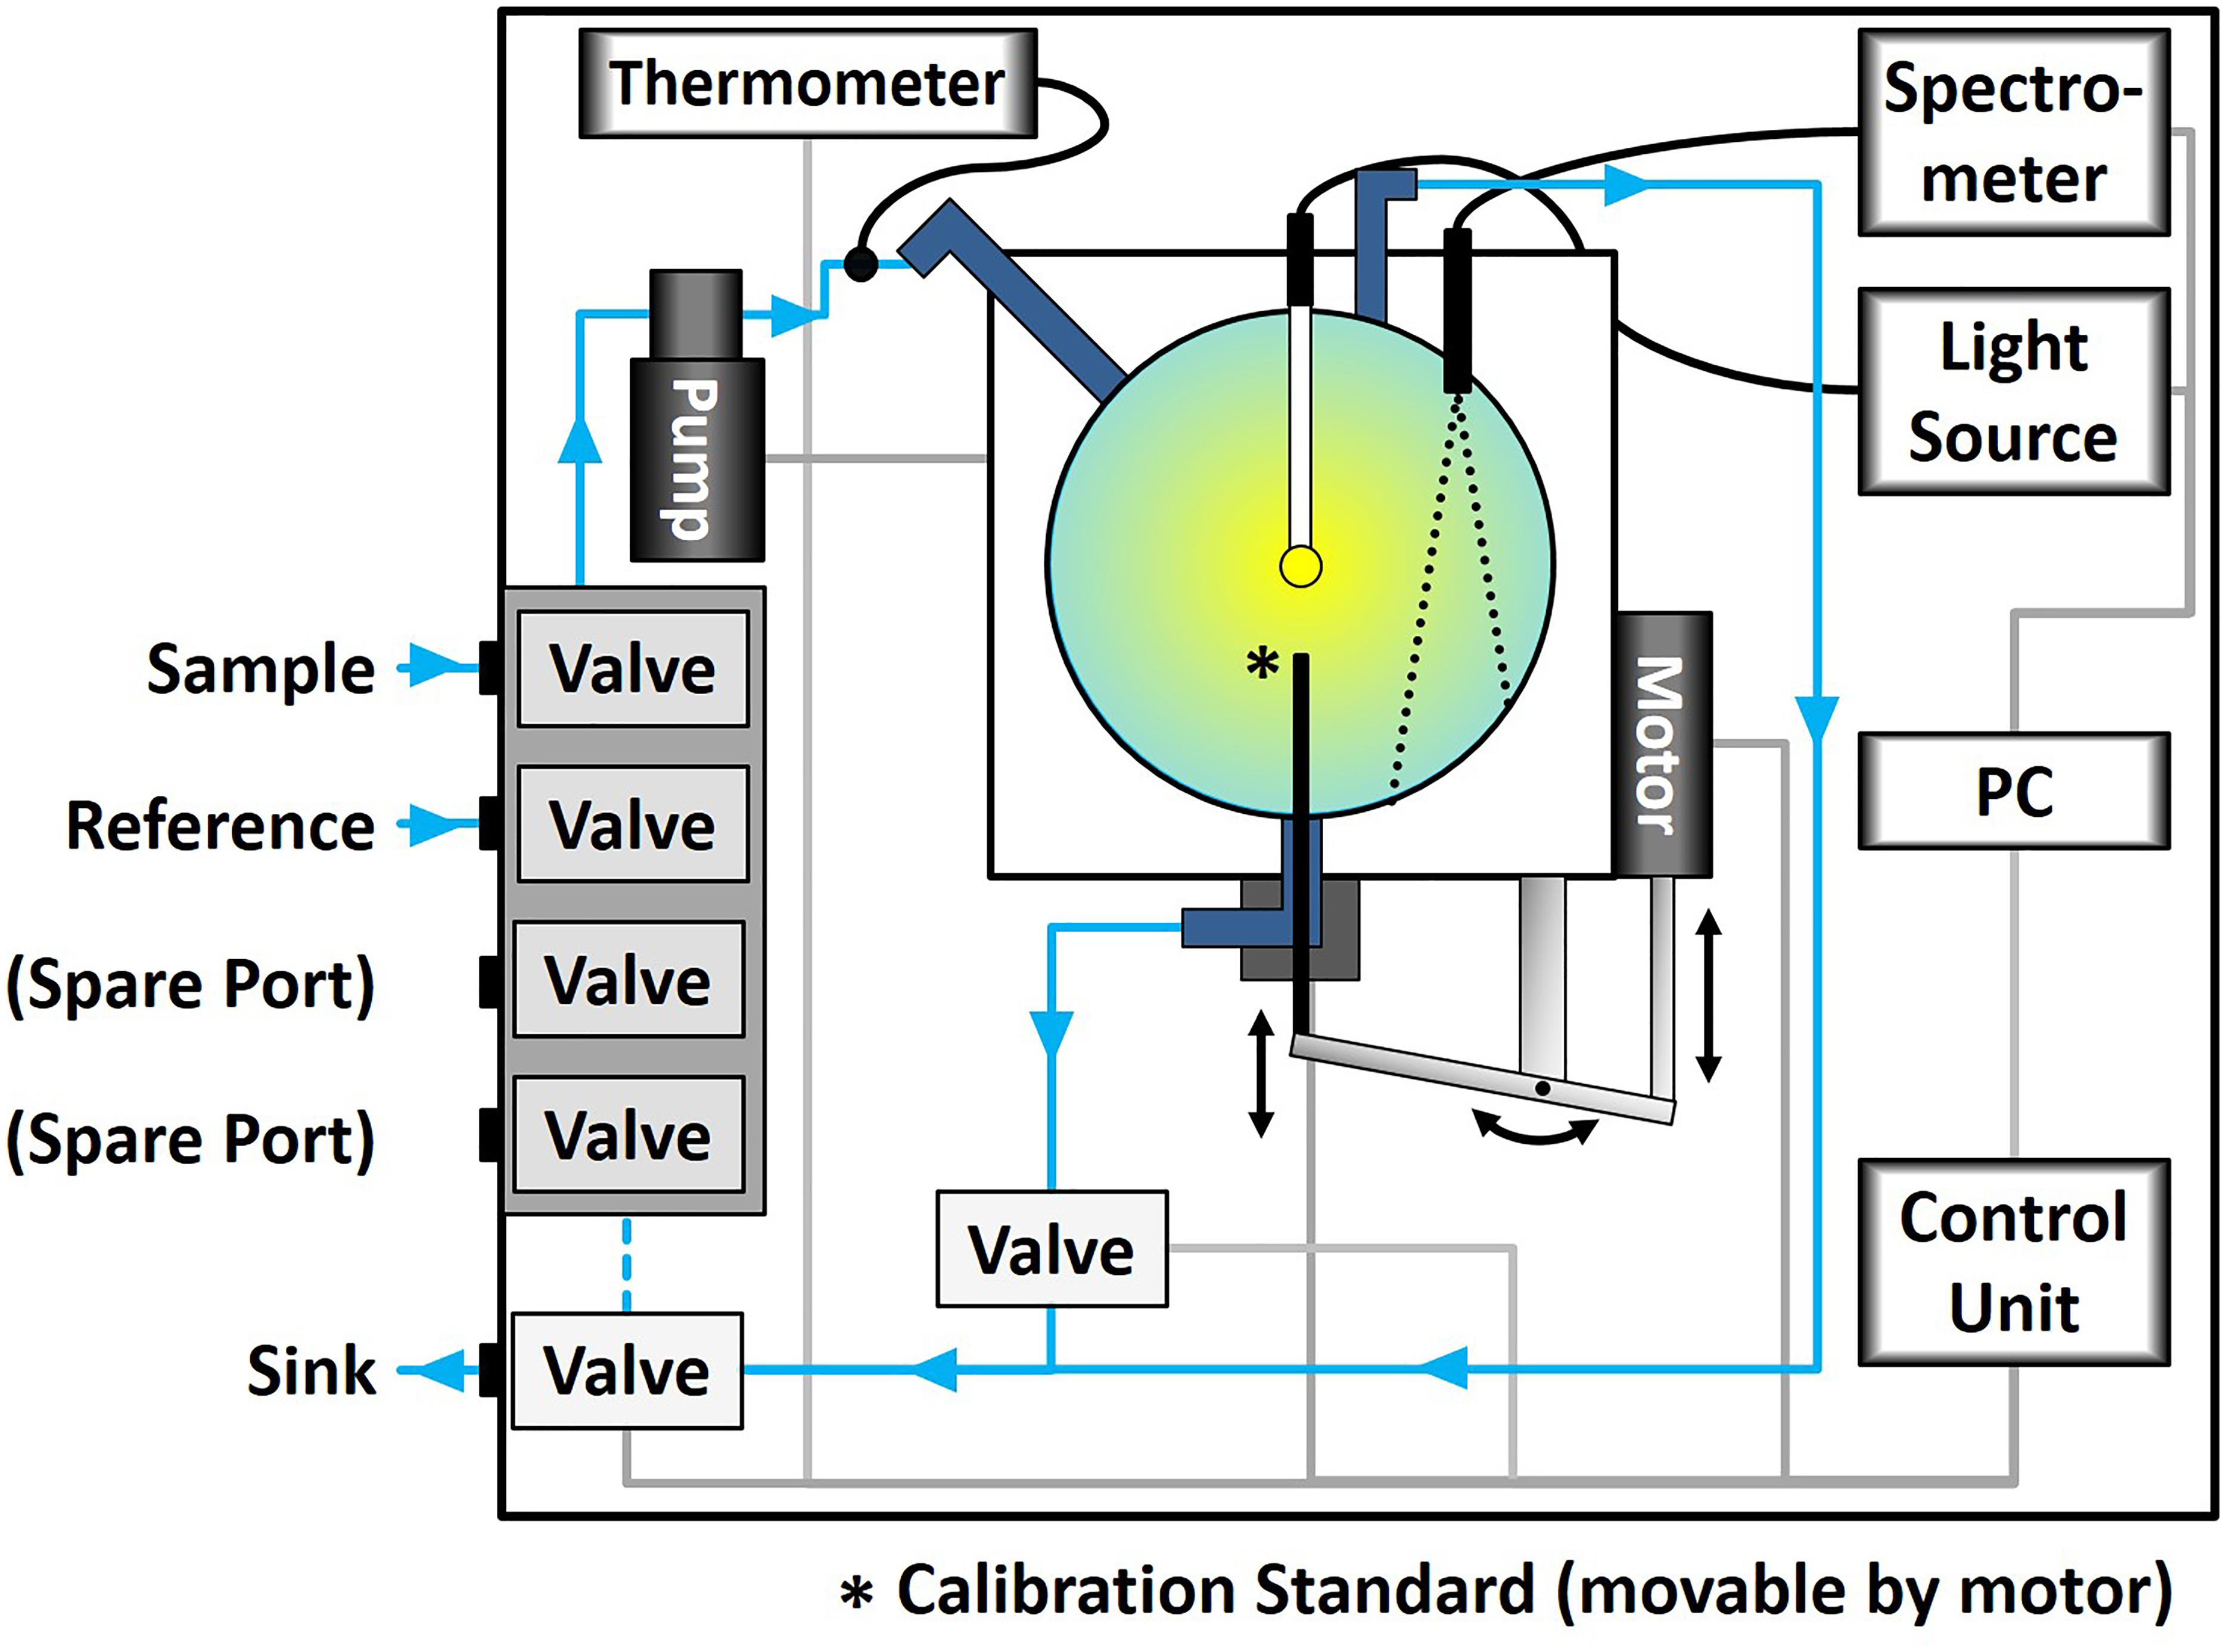
Figure 3. Schematic setup of the Hyperspectral Absorption Sensor (HyAbS) equipped with the solid standard.
The principle of the reflectivity and absorption coefficient calculations are identically with those described for the PSICAM above. Temperature was measured with an internal by the HyAbS itself, while salinity values were obtained from a FerryBox (Petersen et al., 2011) that was connected to the same water source. Before the cruise, the absorption coefficient spectrum induced by the standard was determined in the laboratory in the same way as described for the PSICAM solid standard: Initial determination of the reflectivity using a nigrosin solution, followed by repeated measurements of the solid standard (n = 5 in both cases). During the cruise, absorption coefficient spectra of sample water were obtained every 5 s and then averaged in 1 min intervals. Calibrations with the solid standard were done approximately once per hour. As the supply with purified water was limited and the measurements were done in flow-through mode, there was no measurement of a reference right before each sample. Instead, reference measurements were made together with the calibration measurements every hour; for the time in between, reference data were interpolated linearly.
In order to evaluate the effect of a regular calibration of the HyAbS with the solid standard compared to the case if the instrument would have been only calibrated once, the HyAbS sample measurements have been processed after the cruise in two different ways: The first dataset (“HyAbS frequent calibration”) was calculated using the data from all calibrations performed during the cruise. In between the calibration measurements, the reflectivity values were interpolated linearly. For the second dataset (“HyAbS single calibration”), the mean of the first 10 reflectivity measurements was used for all measurements.
Results
Characterization of the Solid Standard
Before the black plastic stick can be used as solid standard for a calibration of the PSICAM, its effect on the measured absorption coefficient spectra inside the cavity has to be determined. Thus, an initial calibration with nigrosine solution was done to measure the reflectivity of the cavity, which in turn was necessary for calculating the equivalent absorption coefficients induced by the solid standard. Figure 4 shows the mean value of the spectral absorption coefficients of the nigrosine solution used for this initial calibration measured with a spectrophotometer. The solution showed significant absorption over the complete spectral range, with a minimum of approx. 0.4 m-1 and a maximum of approx. 0.7 m-1. The variability of the replicate measurements was small, barely exceeding 1% of the mean as indicated by the dotted line in Figure 4. The wall reflectivity of the PSICAM resulting from calibration measurements using this nigrosin solution was in a range of 0.96 to 0.99 (Figure 5A), with the higher values at longer wavelengths.
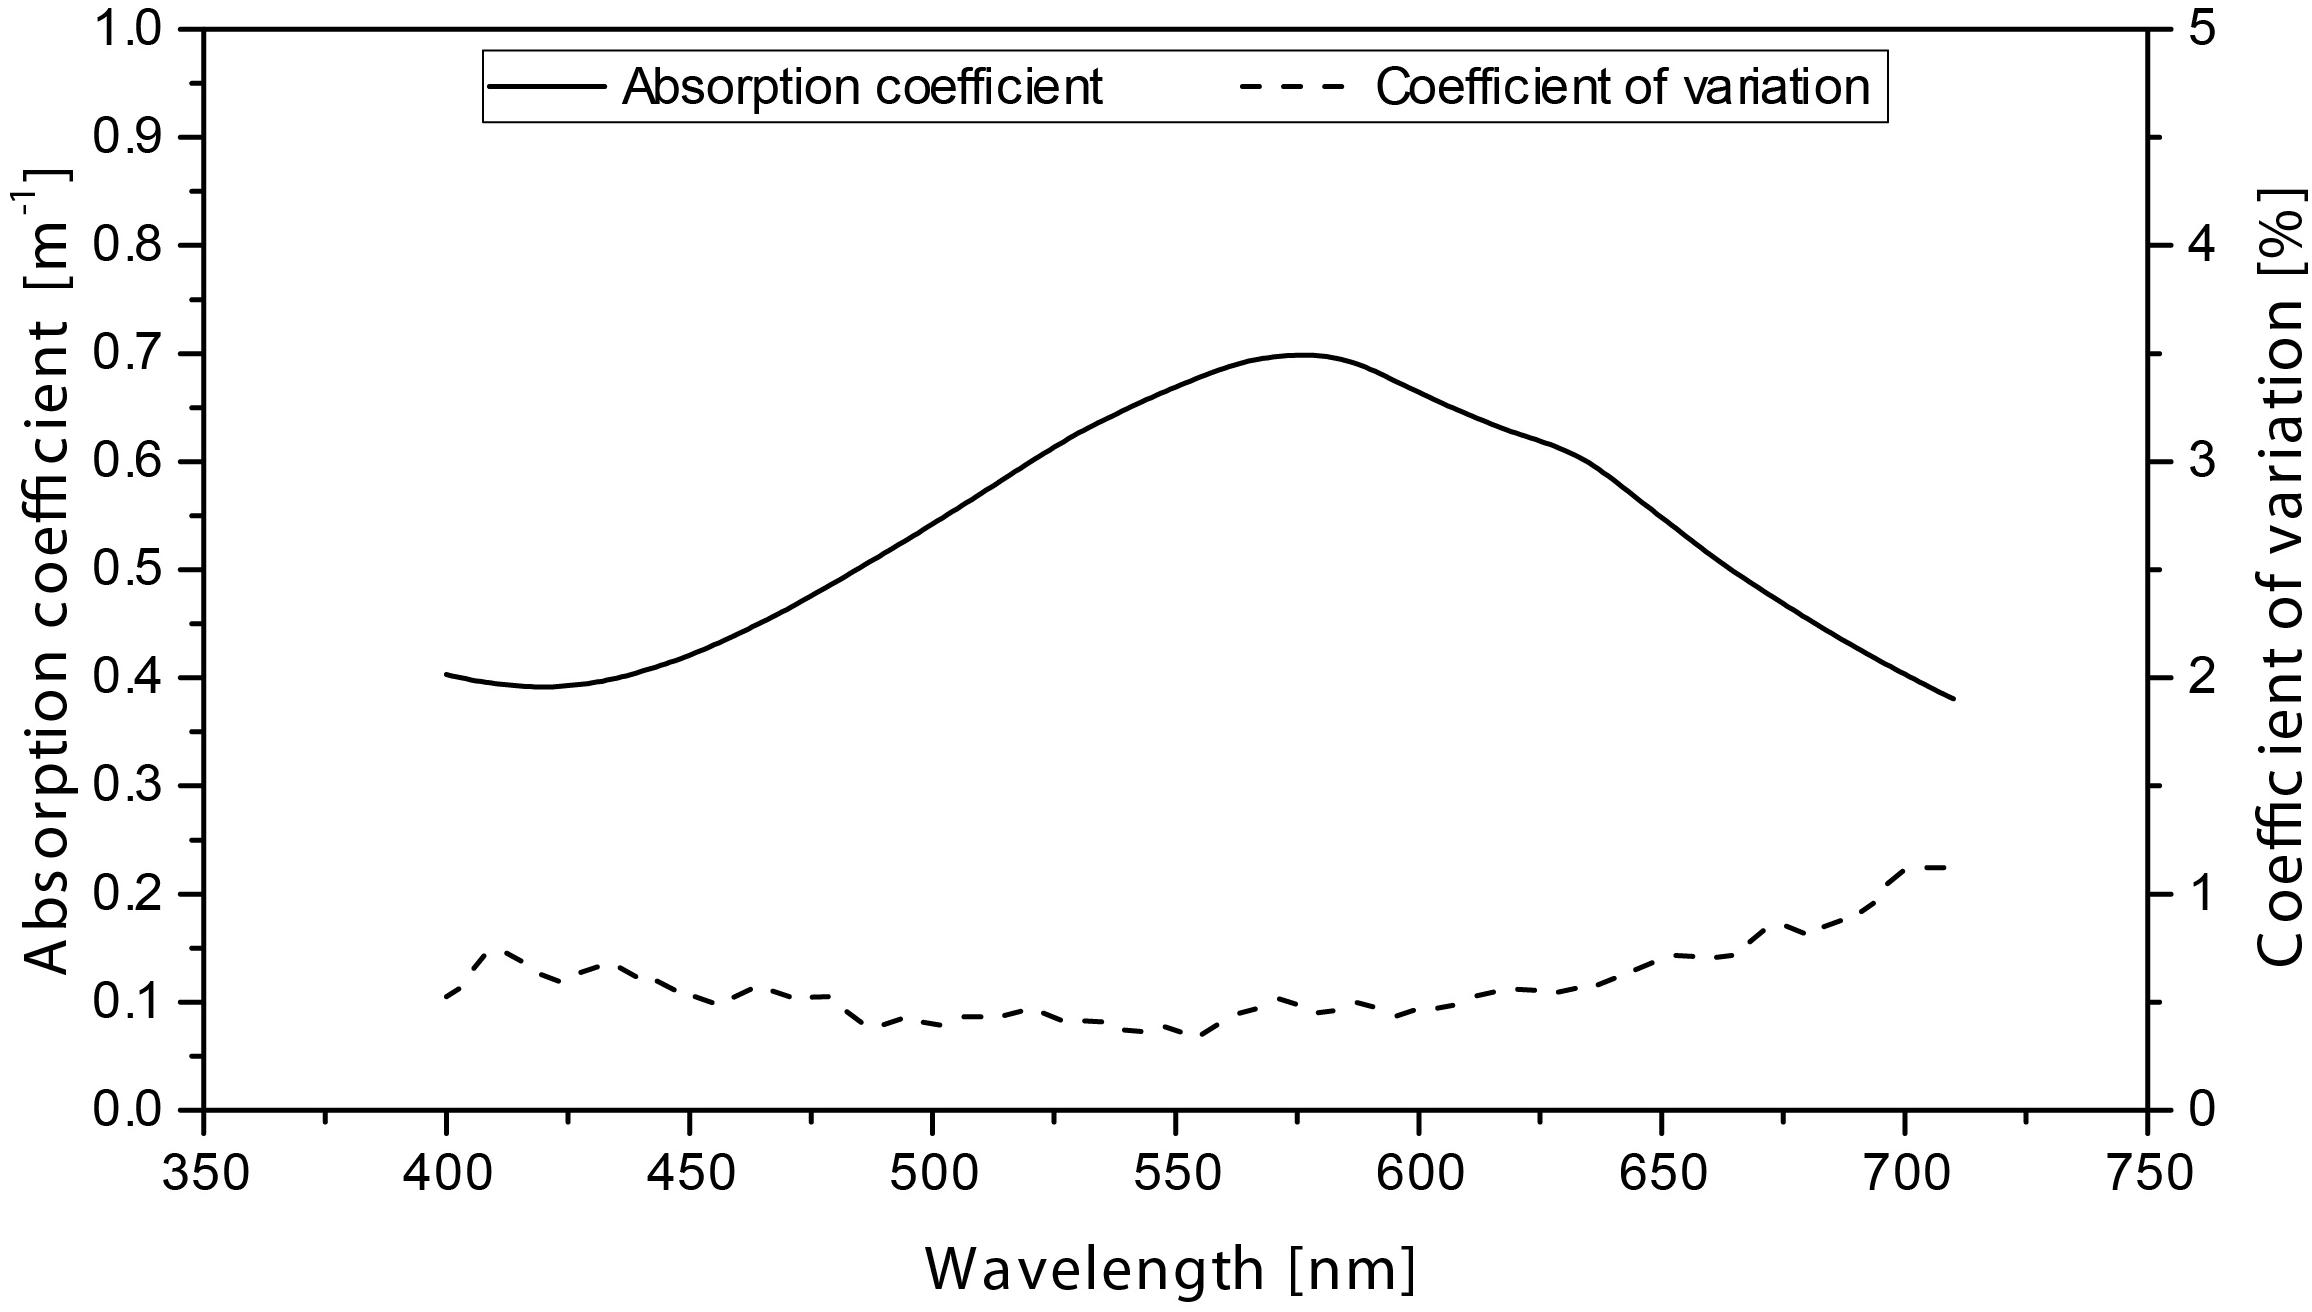
Figure 4. Mean spectrum of the nigrosine solution used as standard (n = 18). The dotted line gives the coefficient of variation based on the standard deviation of the replicate measurements.
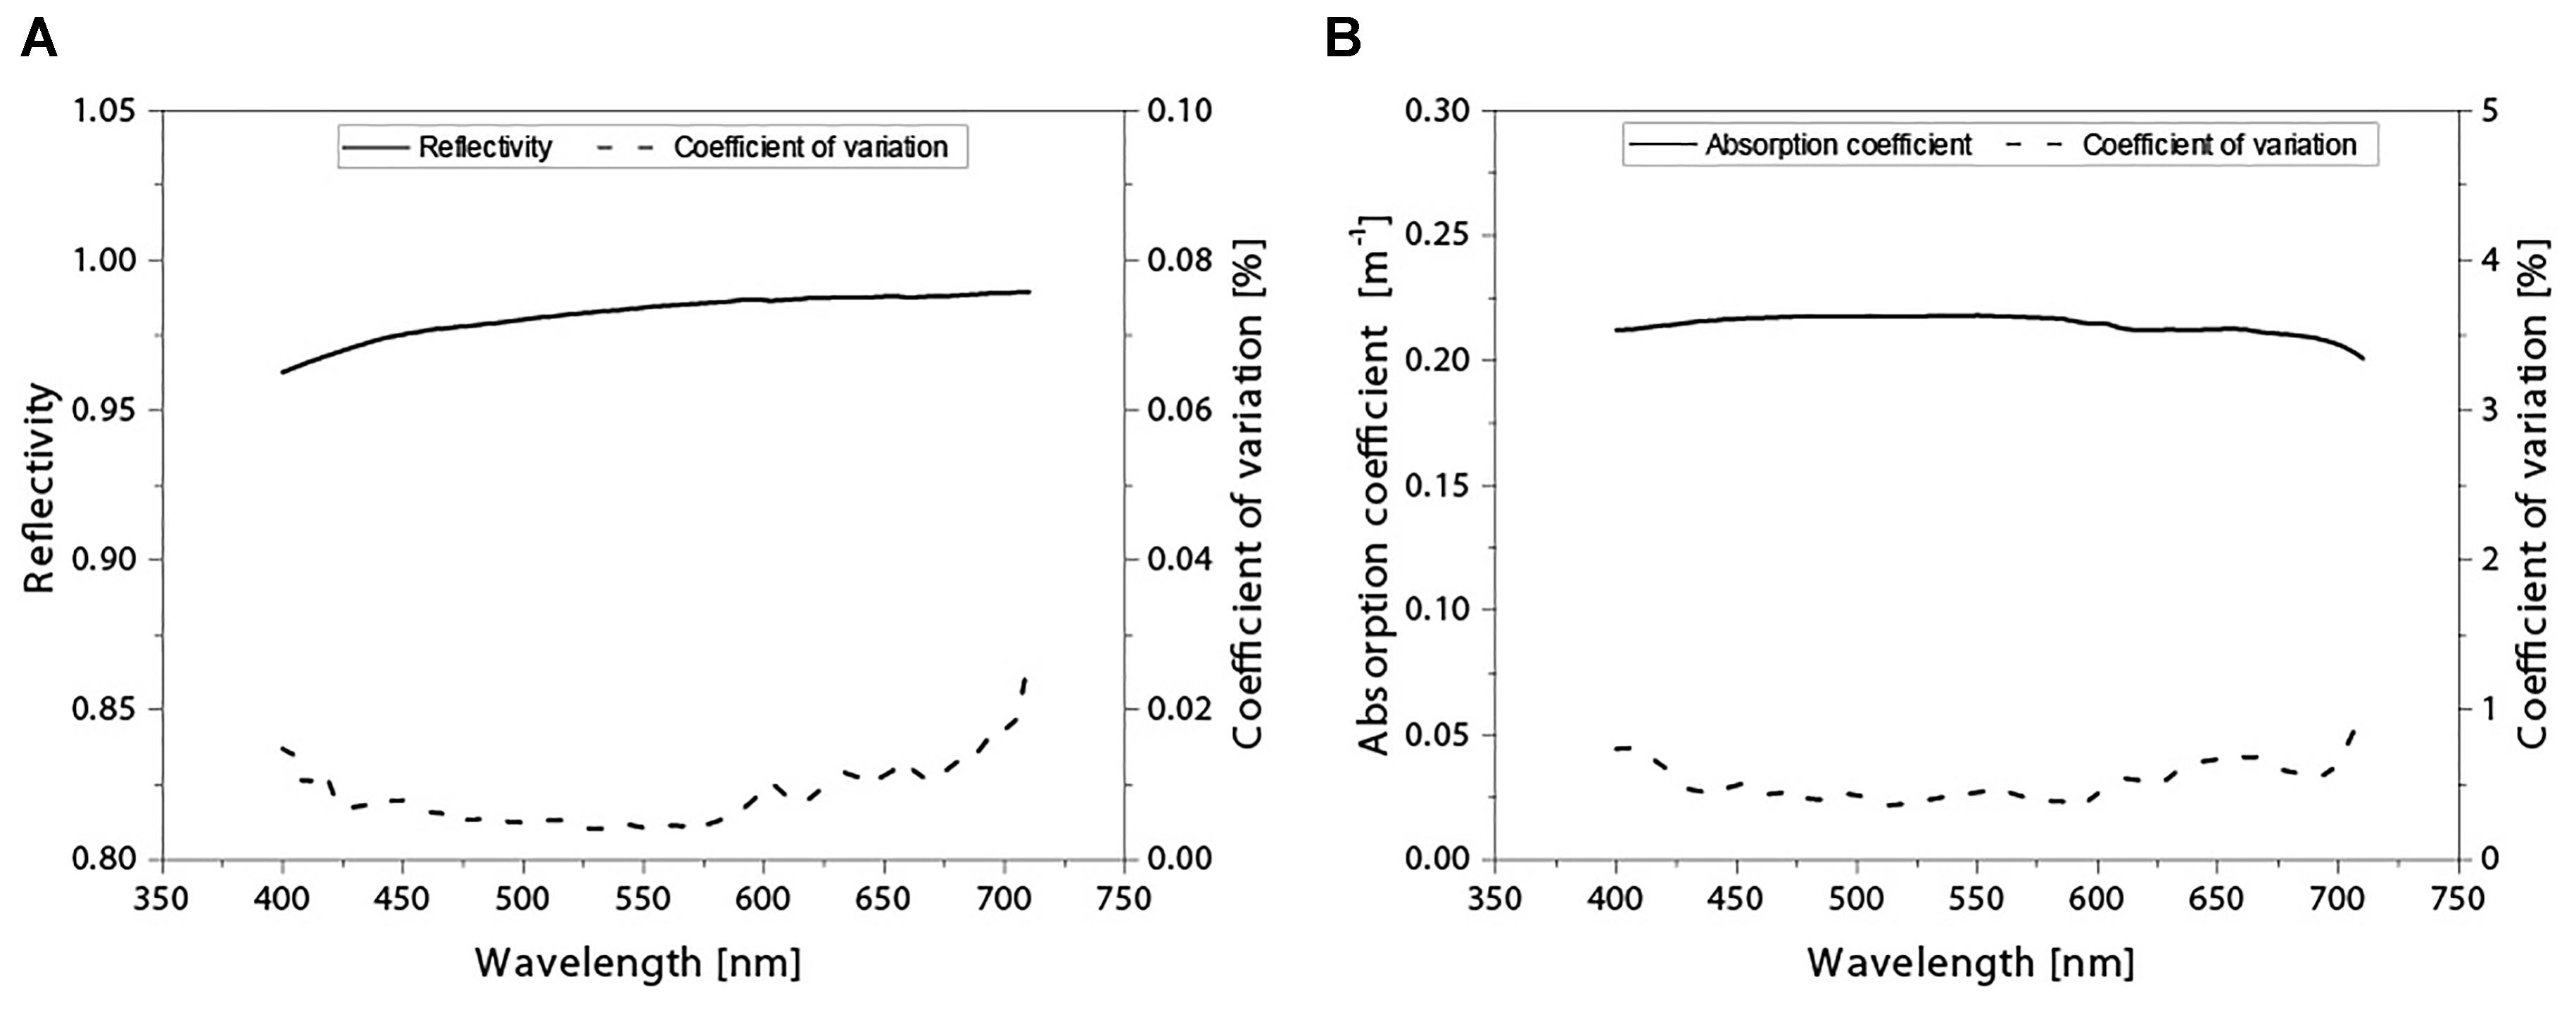
Figure 5. Initial calibration of the PSICAM. (A) Mean reflectivity calculated from the calibration measurements using the nigrosine solution (n = 4). (B) Mean absorption coefficient spectrum of the solid standard (n = 5). The dotted line gives the coefficient of variation based on the standard deviation of the replicate measurements.
Using this reflectivity mean value, the absorption effect of the solid standard was determined by measuring the light intensity in the cavity when it was filled with purified water and no stick was introduced, and the intensity when the stick was introduced to its maximum length (30 mm). The resulting absorption coefficient spectrum was in a range of 0.200–0.225 m-1, with only small variations over the evaluated wavelength range (Figure 5B). This absorption spectrum was very reproducible, with variations less than ±1% of the mean. The orientation of the plugs with the standard or the light source had negligible effects on the absorption coefficient spectrum (data not shown).
For a more comprehensive understanding and characterization of the effect on the absorption coefficient spectrum induced by the solid standard, it was also evaluated whether this absorption effect is linear. The results of the linearity test are shown in Figure 6. The variability of replicate measurements was very small; in most cases, it was below 1%. Only for the measurements when the standard was introduced to 25% of its full length, the variability increased to 3% at some wavelengths. There were no spectral changes in the absorption coefficients depending on the length of the standard introduced, the equivalent absorption coefficient increases rather linearly with the introduced length of the stick (Figure 6A). This was confirmed by linear regressions between the length of the standard introduced and the absorption coefficient measured, performed for four selected wavelengths (400, 500, 600, and 700 nm; Figure 6B). All regression analyses showed R2 values of >0.99, and slopes between 0.007 and 0.0074 (maximum mean standard error ± 0.0001). The offset was almost zero with values between –0.0041 and –0.0058 m-1 (maximum mean standard error ± 0.0029).
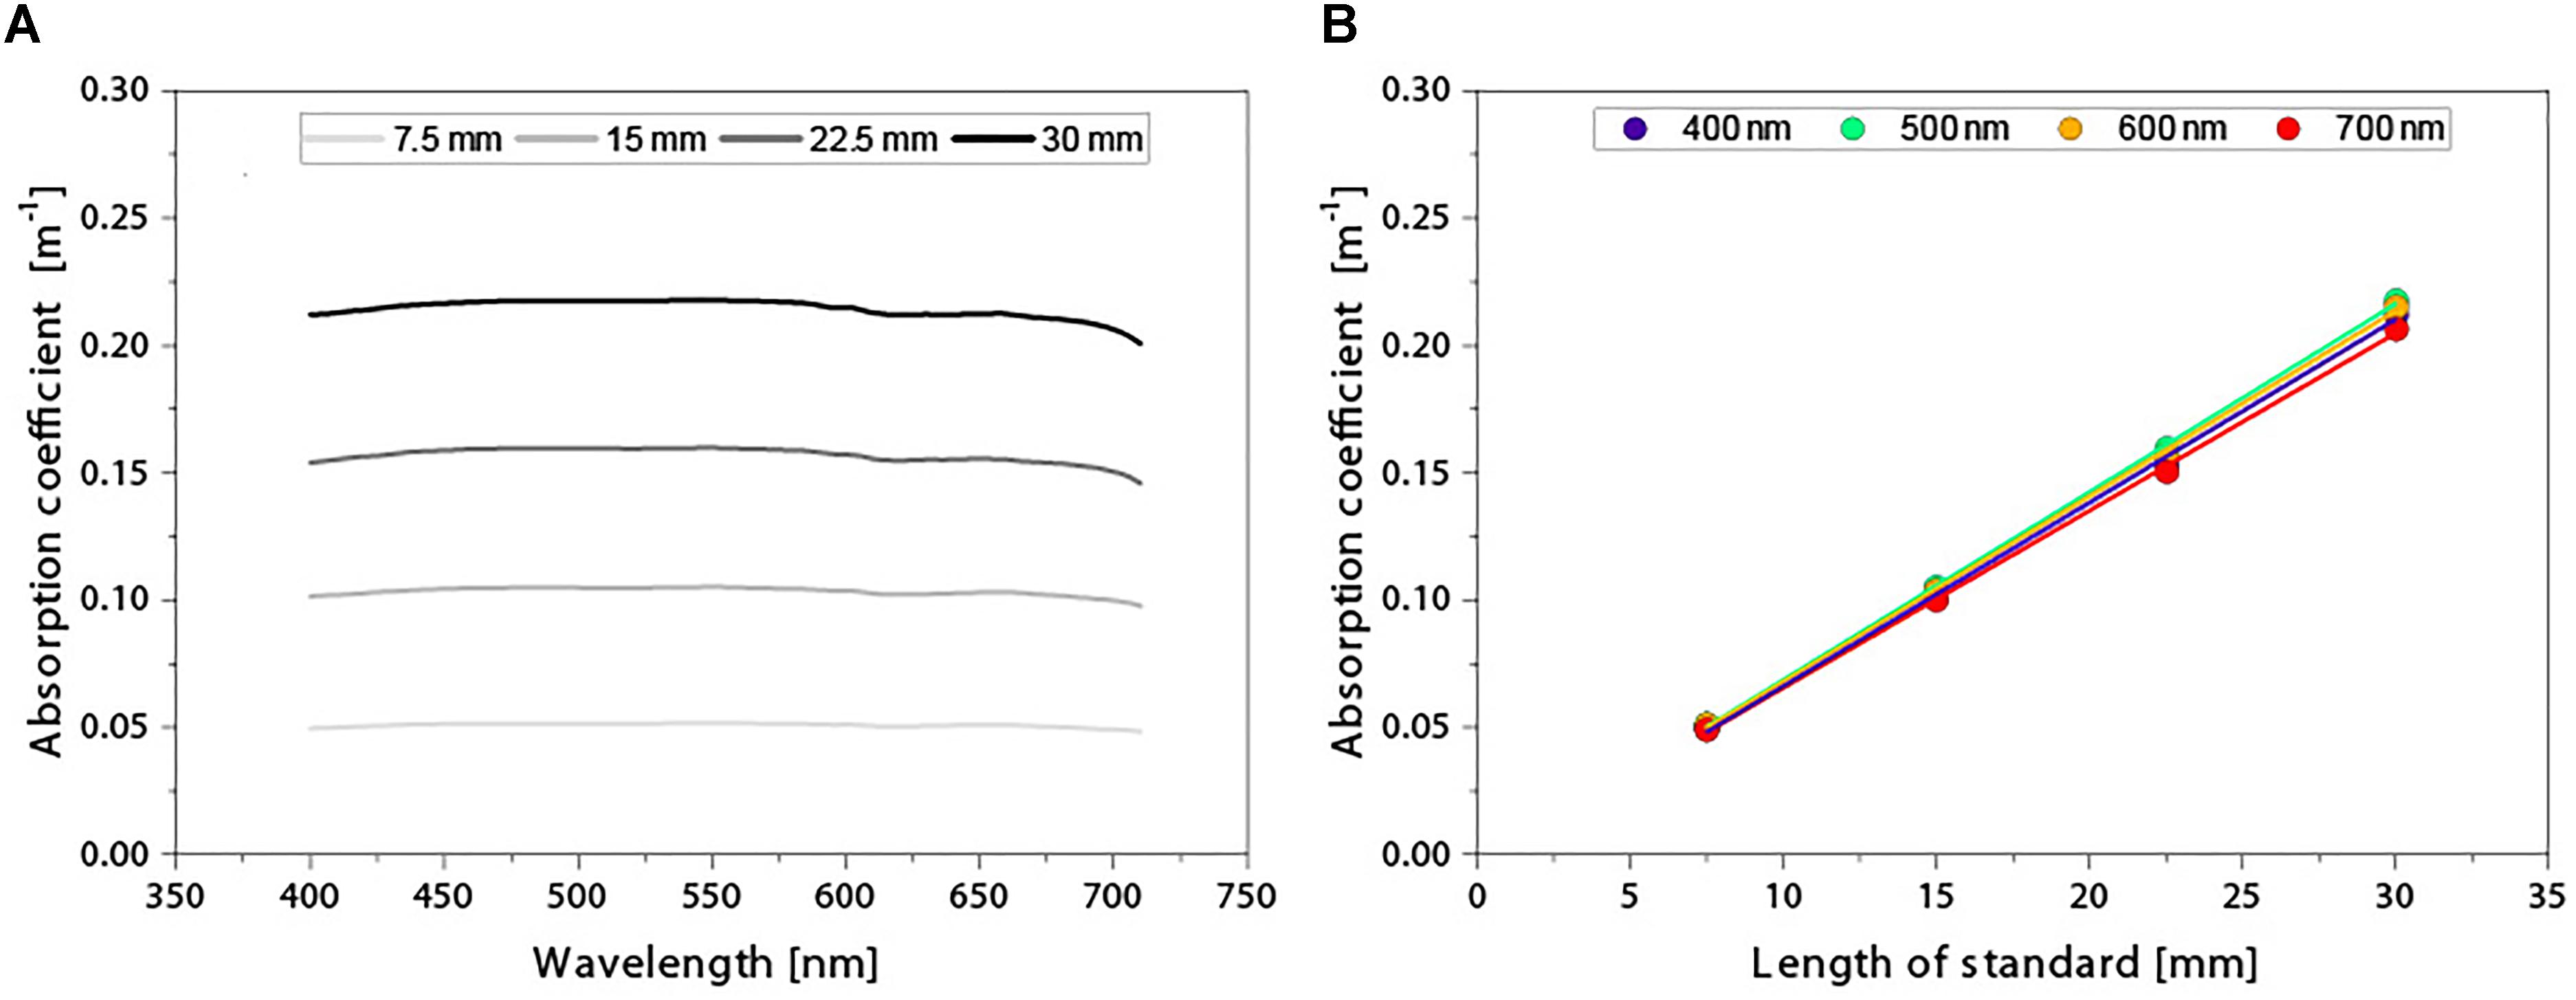
Figure 6. Linearity test of the absorption effect by the solid standard. (A) Spectral absorption coefficients induced by the solid standard when introduced to different lengths into the cavity. (B) Regressions between the absorption coefficients and stick lengths for four selected wavelengths.
Comparison of PSICAM Calibration With Nigrosin and Solid Standard
The final test whether the solid standard would be a suitable alternative to nigrosin for calibrating a PSICAM was to check if a change in the reflectivity is detected similarly by both methods. For this experiment, the reflectivity of the PSICAM cavity was altered both locally and overall, then the reflectivity was measured using the solid standard followed by a measurement using nigrosine. The results are shown in Figure 7. Both the placement of the tape (local alteration of the reflectivity) and the application of the higher concentrated nigrosine solution (overall alteration) led to a small reduction of the cavity reflectivity over almost all wavelengths when compared to the reflectivity determined in the initial calibration (see difference of the black curves to the gray curve in Figure 7). Regardless of the way the reflectivity was changed to the begin of the experiment, the mean reflectivity determined by using the solid standard was nearly identical to the one determined by the calibration with nigrosin. In average over all wavelengths, the reflectivity calculated with the solid standard was less than 0.1% smaller than the reflectivity calculated with nigrosin. To estimate the effect of this difference on the calculation of the absorption coefficients, the PSICAM field data were processed with both spectra. The difference in the resulting absorption coefficient spectra was in average less than 2% over the whole spectrum. Furthermore, both types of calibration showed a comparable small variability (<0.1% of the respective mean for all wavelengths). This indicates the suitability of using a solid standard for calibrating an integrating cavity.
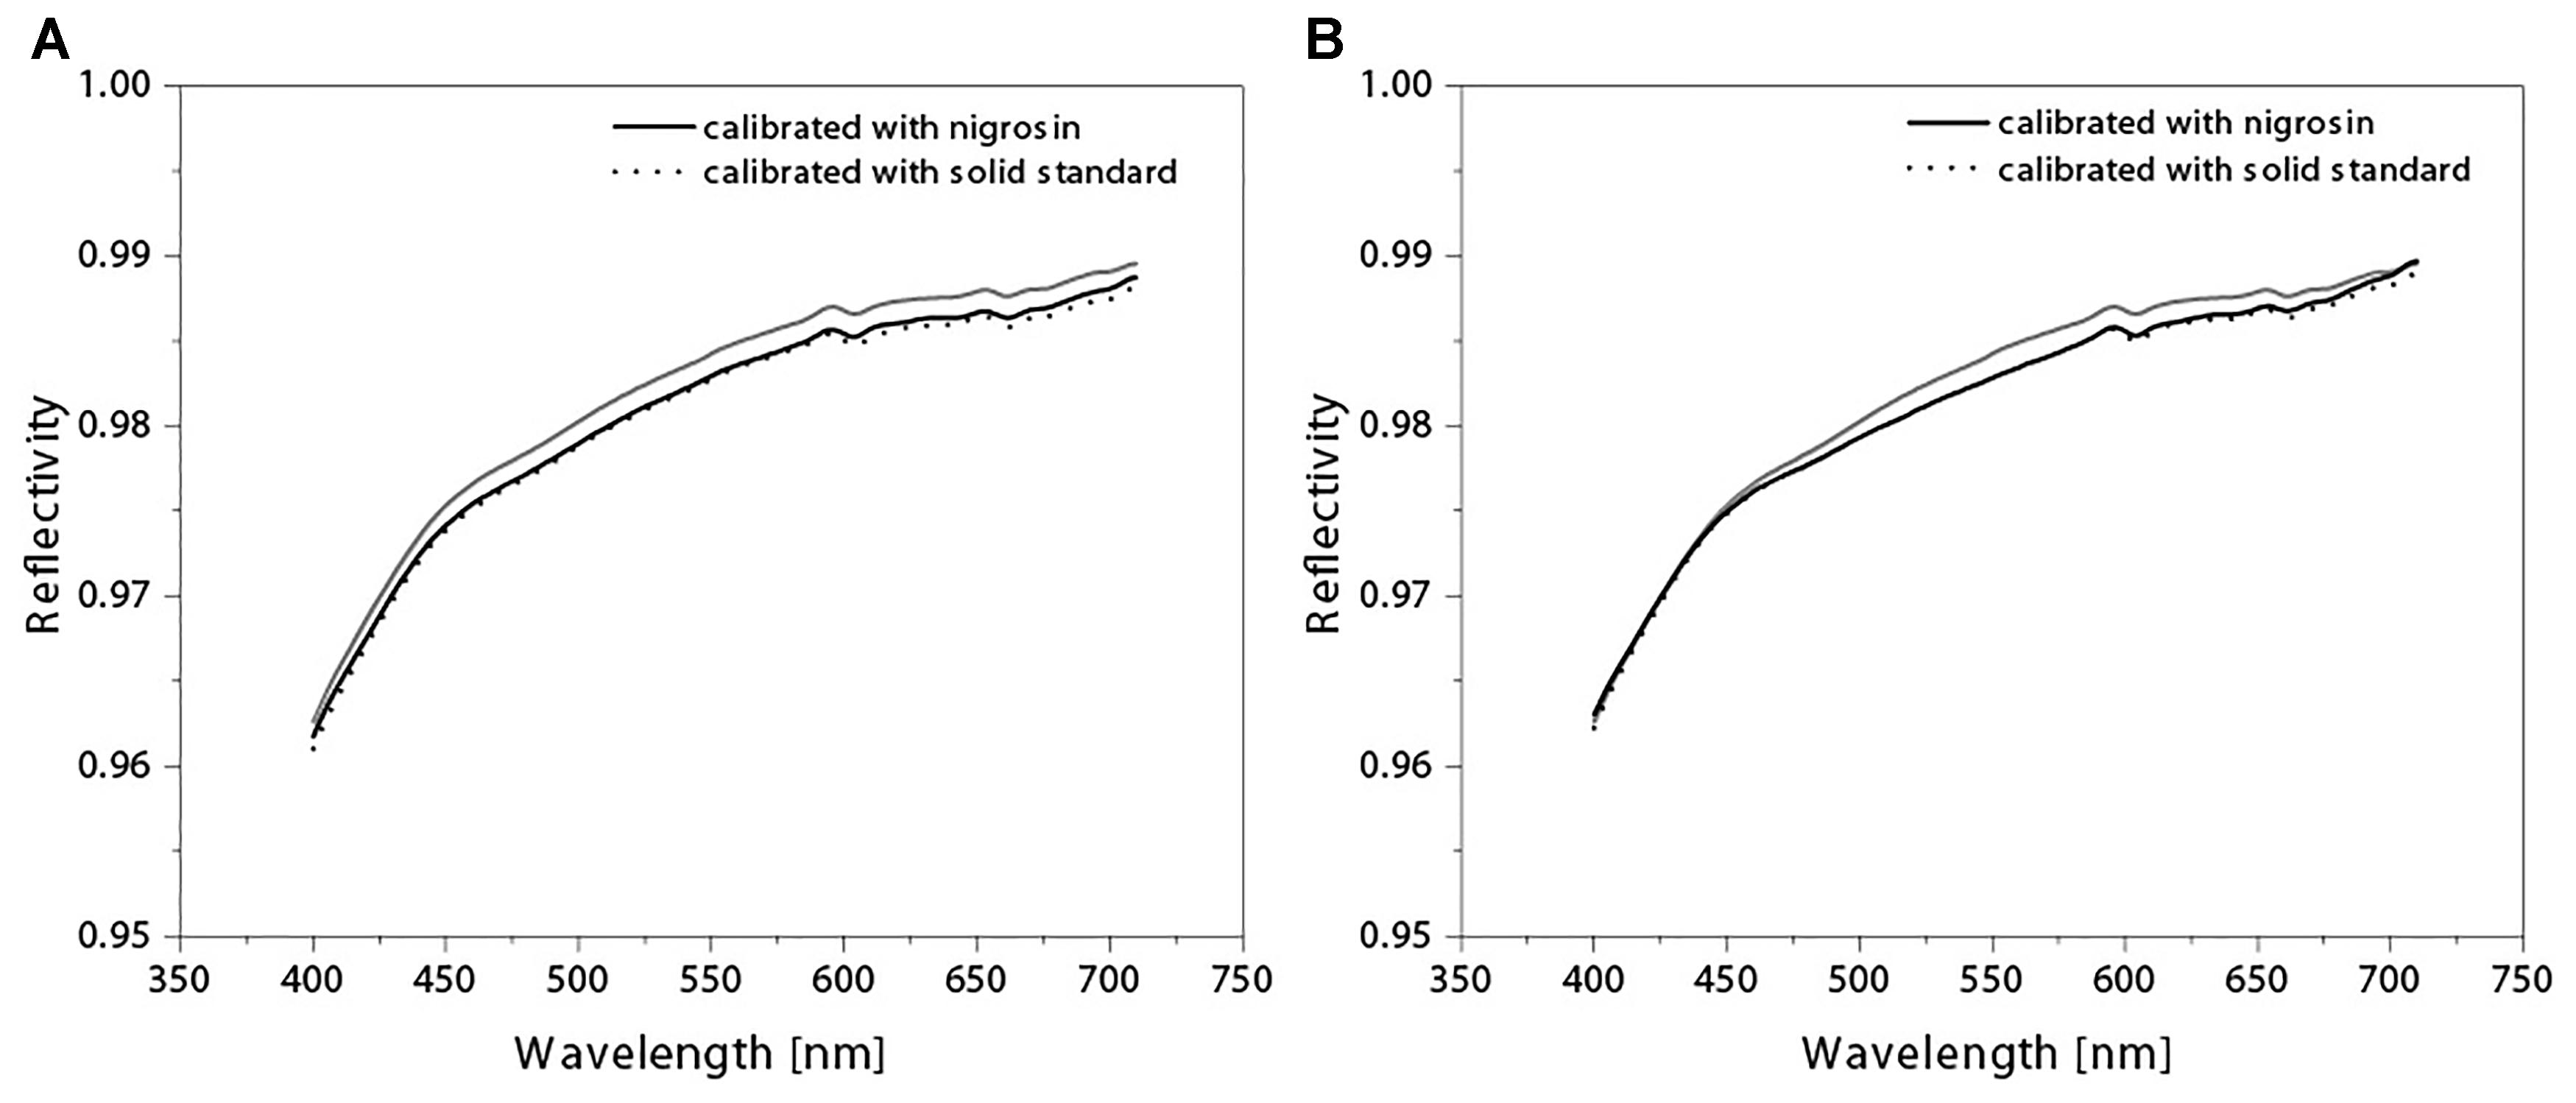
Figure 7. Comparison of nigrosin-based and solid standard-based calibration. (A) Reflectivity was altered by application of a black tape on the cavity wall. (B) Reflectivity was altered by rinsing the cavity with a concentrated nigrosine solution. The gray curve represents the reflectivity of the initial calibration for comparison.
Comparison of Field Data From PSICAM and HyAbS
As for the PSICAM, also for the HyAbS the effect of the introduction of the solid standard on the volume absorption coefficients in the cavity had to be determined (Figure 8). The initial calibration with nigrosine (Figure 8A) showed a considerably lower reflectivity compared to the PSICAM, ranging from 0.825 in the blue region of the spectrum to approx. 0.95 in the red. The variability in the measurements were almost one order of magnitude higher compared to the calibration of the laboratory PSICAM with nigrosine (compare Figure 5A). Furthermore, the spectral shape of the coefficient of variation showed at the longer wavelengths (>600 nm) features that resembled those also visible in the absorption coefficient spectrum of pure water (bulges at ∼610 and 670 nm, as well as a strong increase >700 nm). However, the absorption coefficient spectra created by the solid standard inside the cavity using this mean reflectivity were similarly reproducible as in the laboratory PSICAM (Figure 8B). For most wavelengths, the variability was less than 1%. The shape of the absorption coefficient spectrum resembled that of the solid standard used in the laboratory PSICAM with almost no wavelength-dependency, and also the values were comparable (approx. 0.225 m-1).
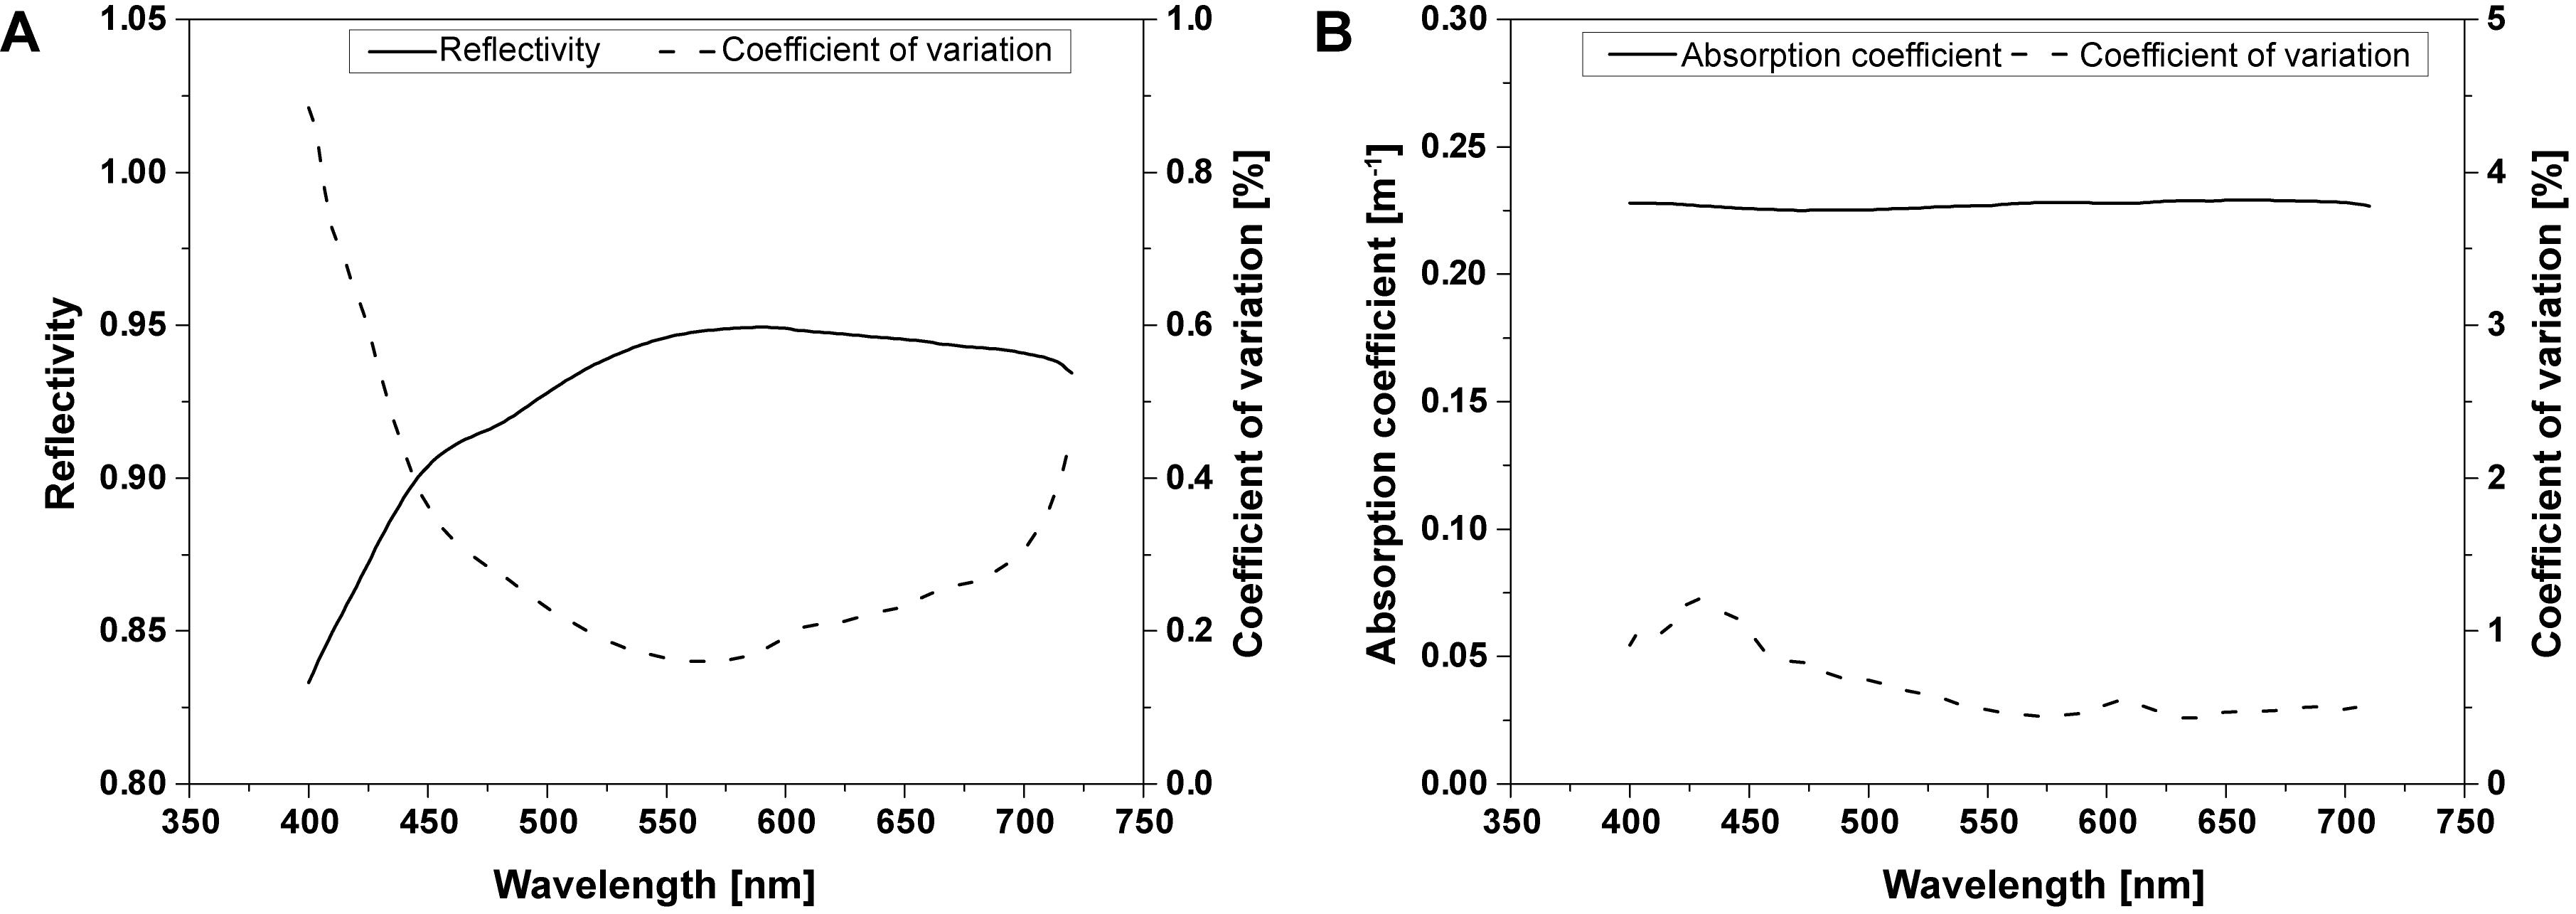
Figure 8. Characterization of the solid standard in the HyAbS. (A) Reflectivity determined in the initial calibration. (B) Spectral absorption coefficients of the solid standard.
When comparing the field data obtained with the HyAbS (both the “frequent calibration” and the “single calibration” dataset) with the laboratory PSICAM, it was observed that they were in good agreement at some stations, while there were larger differences at others. A set of examples is given in Figure 9. Basically, three types of differences between the HyAbS and the PSICAM spectra could be distinguished: (i) HyAbS spectra matched the PSICAM spectra to a high degree, with variability mainly in the blue (Figure 9, upper panels), (ii) HyAbS spectra were especially distorted toward the longer wavelengths, starting from approx. 600 nm (mid panels), (iii) HyAbS spectra were different from the PSICAM spectra, but had in general the same shape (lower panels). The distortion of the spectra in the red region of the spectrum (type ii) indicate general problems in the respective measurement, potentially caused by air bubbles (Wollschläger et al., 2016). As it cannot be excluded that also the others wavelengths might be influenced by this, the stations showing these kind of absorption coefficient spectra were considered as generally incorrect and omitted from the following analyses (in total 8 of 41 stations).
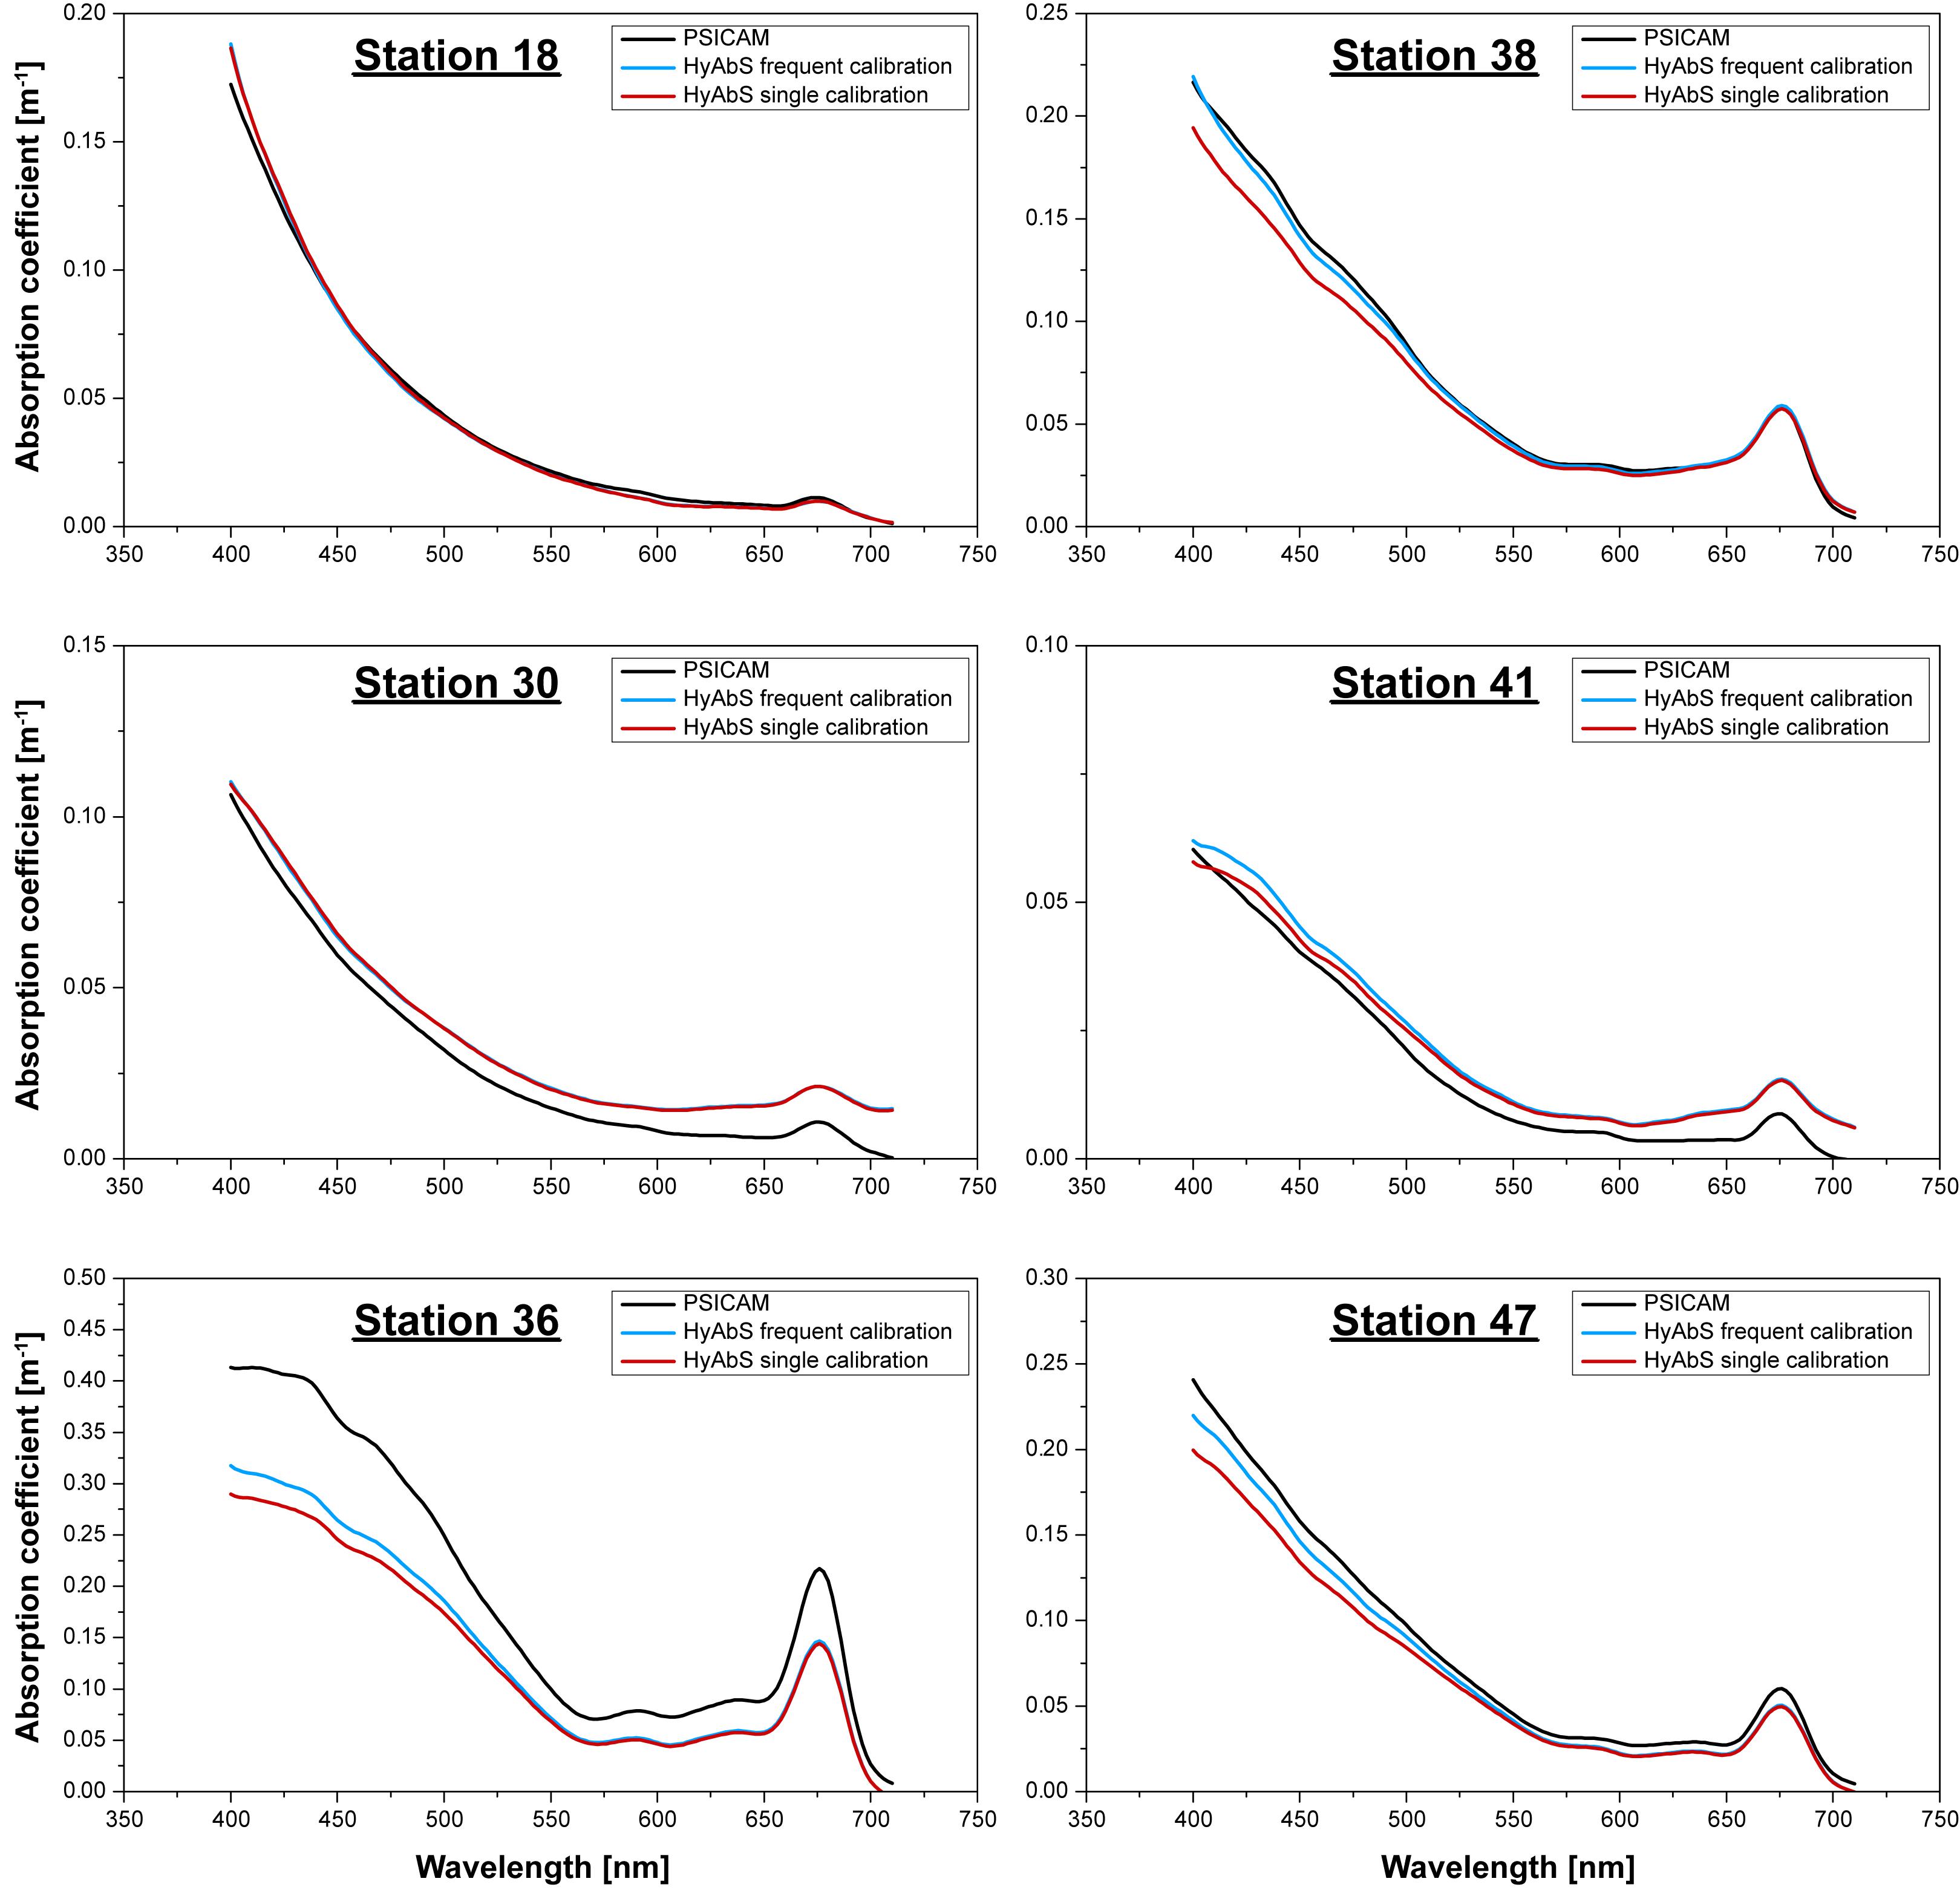
Figure 9. Example comparisons of absorption coefficient spectra between PSICAM and HyAbS at different stations during the cruise HE516.
Furthermore, differences were visible in most cases also between the frequently calibrated HyAbS data and those calculated only with one calibration. To investigate this in more detail, the differences in the absorption coefficient at 400 nm relative to the PSICAM were calculated, both for the HyAbS “frequent calibration” and “single calibration” dataset (Figure 10A). The 400 nm wavelength was selected since the impact of contaminations on the reflectivity is expected to be strongest in the blue region of the spectrum, as these contaminations are most likely particles like phytoplankton or detritus, which predominantly absorb at smaller wavelengths. The deviations between the two sets of HyAbS data to the PSICAM reached from less than 0.1% to more than 100%. However, the “frequent calibration” HyAbS data were in the majority of cases closer to the PSICAM measurements (smaller difference) than the “single calibration” HyAbS measurements. Furthermore, looking at the difference between the deviations of both HyAbS datasets (Figure 10B), it can be seen that they increase with station number thus with deployment time.
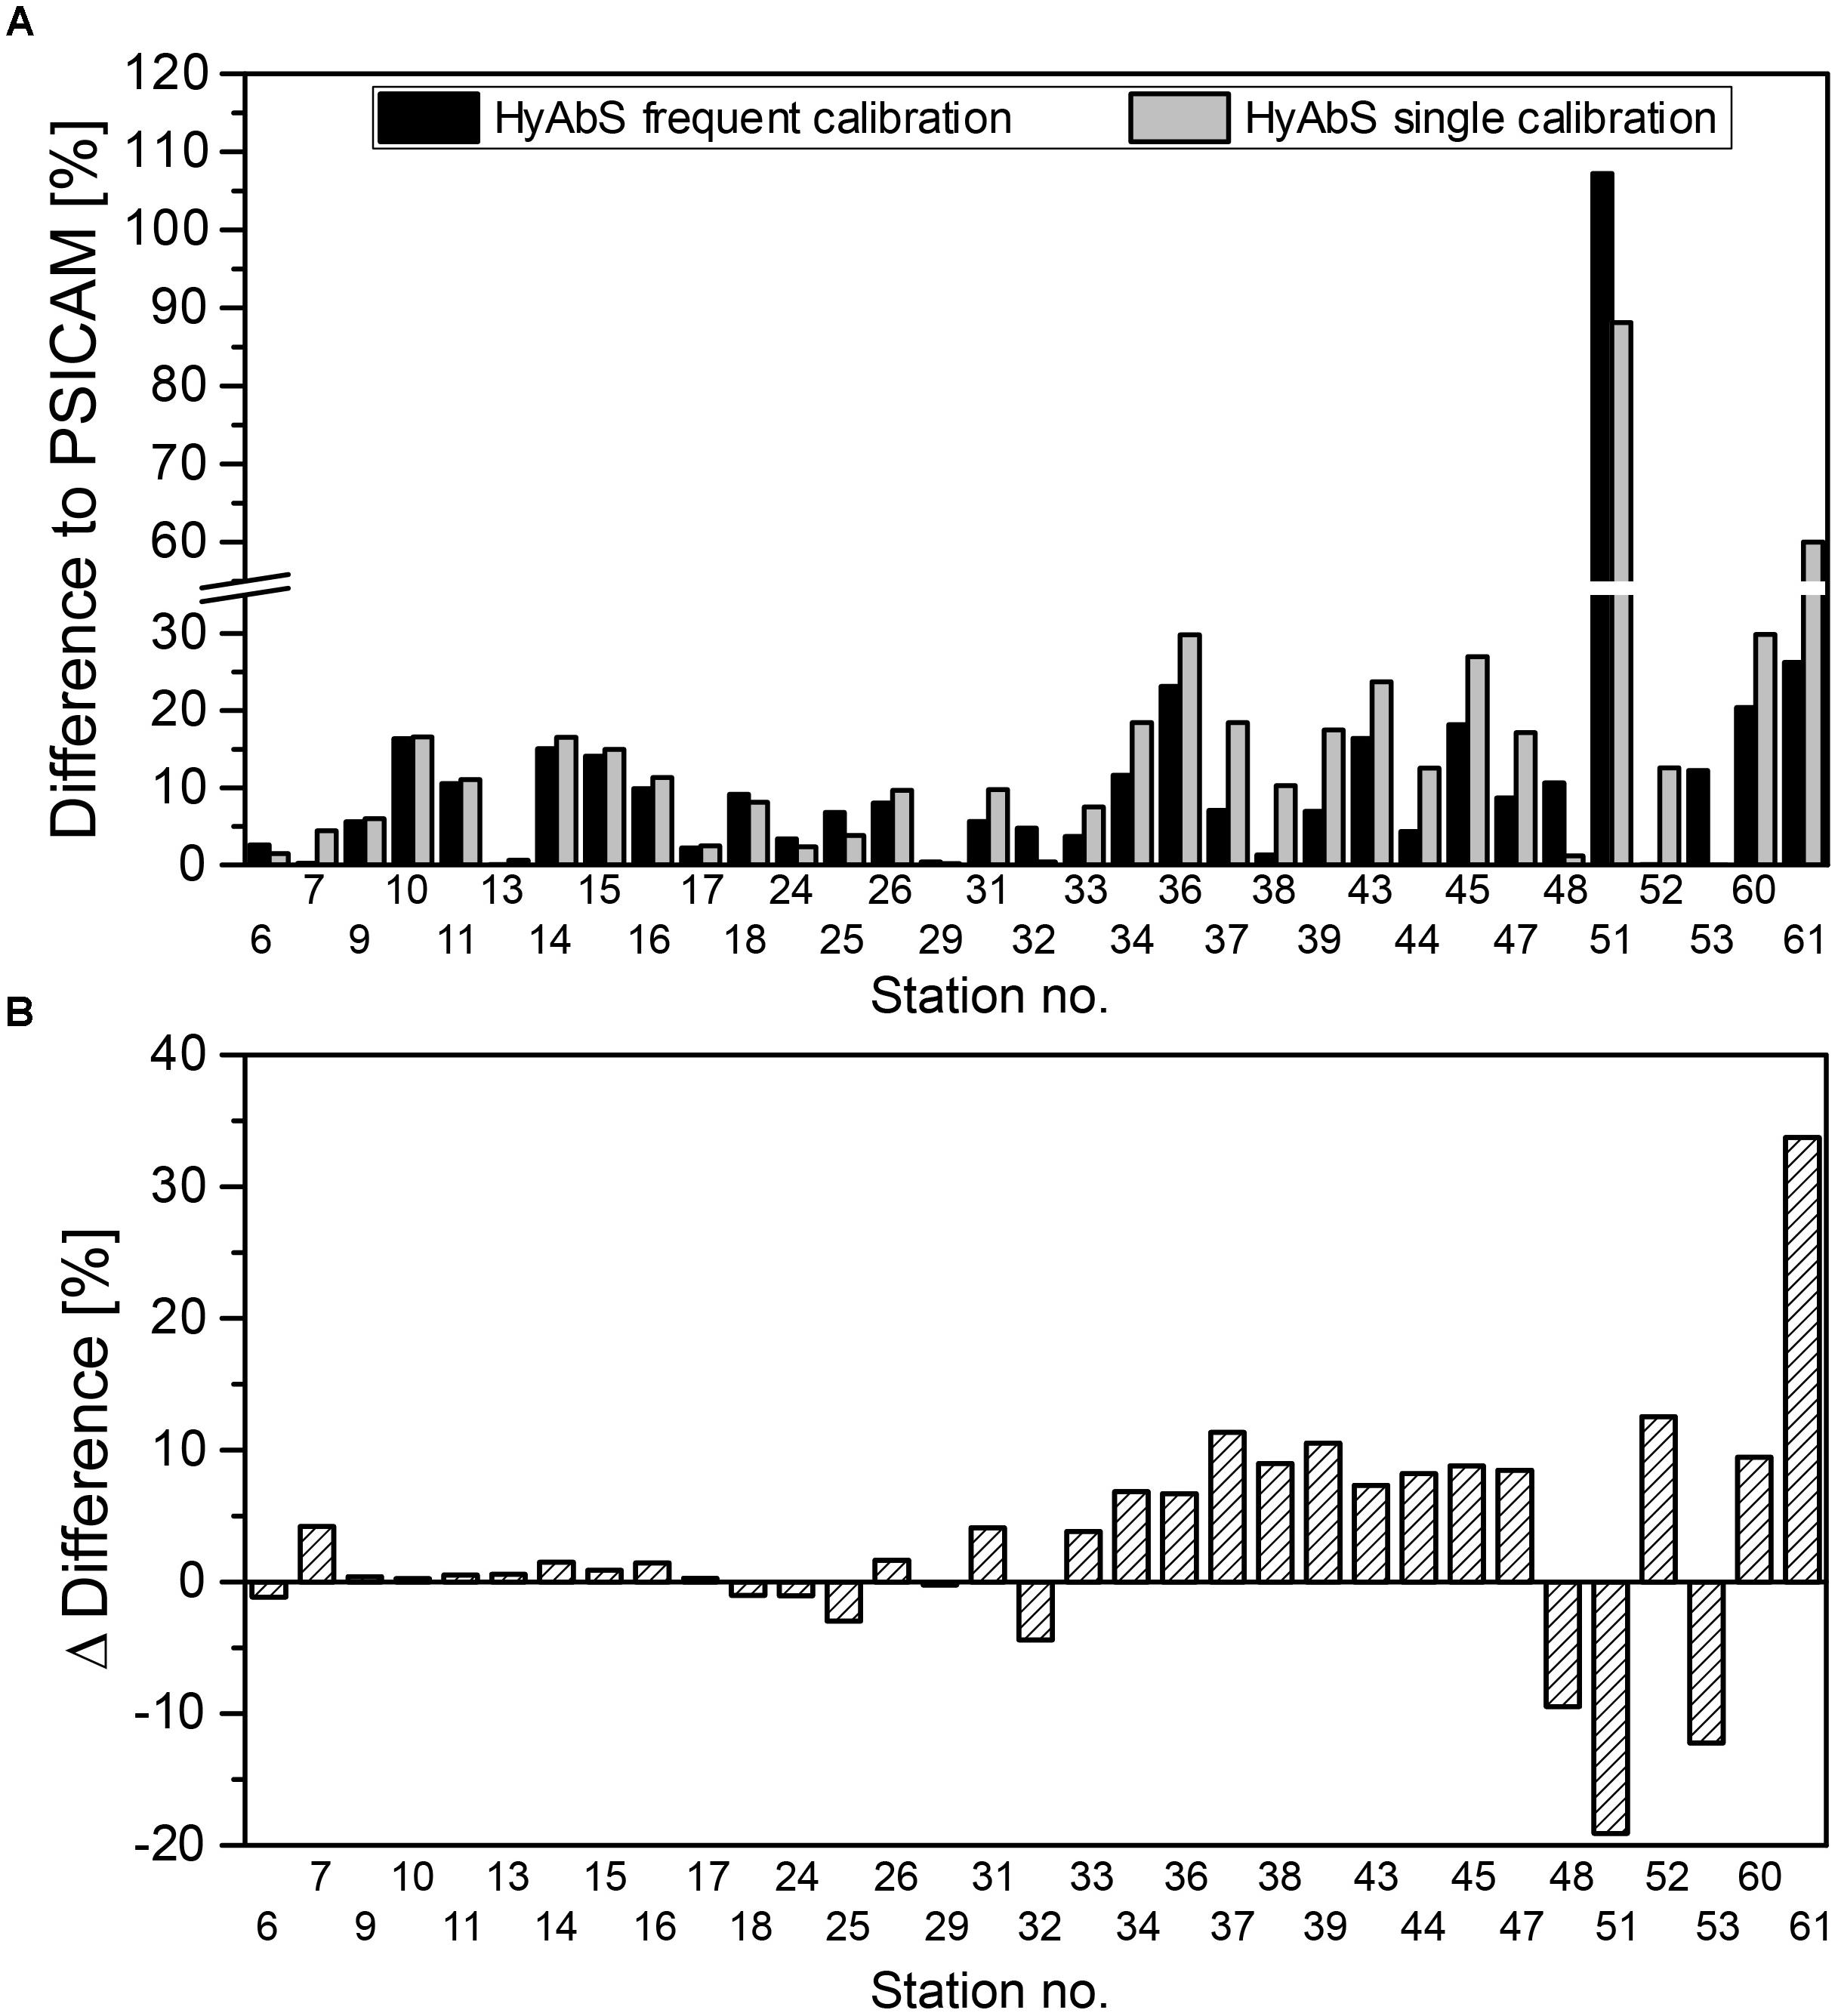
Figure 10. Comparison of PSICAM and HyAbS absorption coefficient measurements at 400 nm. (A) Difference to PSICAM when absorption coefficients were calculated with frequent calibrations or a single calibration, respectively. (B) Difference between both kinds of calculations (Difference PSICAM/HyAbS “single calibration” minus difference PSICAM/HyAbS “frequent calibration”).
Discussion
Instruments utilizing the PSICAM principle for the in situ measurement of water absorption have certain advantages over conventional spectrophotometric methods. However, they suffer from a relatively laborious calibration process (determination of wall reflectivity, thus mean optical path length). This can be a major obstacle in the field and might be a reason why the use of PSICAM instruments is still relatively uncommon. In order to have a more convenient, compact, and robust alternative, we tested in this work the possibility of creating the required known absorption by a solid standard instead of a dye solution. This was done for a laboratory PSICAM and a custom-made flow-through version, the Hyperspectral Absorption Sensor (HyAbS).
For both instruments, first the absorption coefficient spectrum induced by the black plastic stick used as solid standard in the respective cavity was determined. This task required initial calibrations with nigrosin and showed differences between the two instruments. The reflectivity of the laboratory PSICAM was similar to other PSICAM designs (Röttgers et al., 2005), thus substantially higher than determined for the HyAbS cavity. However, it has to be kept in mind that even in the retracted position, the front end of the stick is visible as a black surface on the cavity wall, thus the reflectivity is probably lower than it would be when a completely white plug would be used to close the cavity. In the future, this minor decrease in reflectivity could be eliminated by manufacturing the tip of the standard from e.g., Teflon, so that the stick is invisible when retracted into the plug. The variability between the calibration measurements was much lower for the PSICAM than for the HyAbS (Figures 5A, 8A). Reasons for the general difference in reflectivity might be the different material used for both cavities (OP.DI.MA in the PSICAM versus Teflon in the HyAbS) and the fact that the HyAbS was used in long-term deployment on several cruises before. Although it was thoroughly rinsed, wiped out, and bleached after use, it might be that not all of the contaminations accumulated were removed completely. Thus, a more intense (mechanical) cleaning with a subsequent calibration would be necessary to see if the reflectivity could be improved. However, even if the HyAbS cavity would be made of a higher reflective material, its reflectivity would probably be always lower than those of a PSICAM due to the water in- and outlets (holes through which the light can escape from the cavity). The higher variability in the nigrosin-based calibration of the HyAbS is probably related to the handling of the instrument: While the PSICAM is carefully filled and controlled manually before each measurement, the necessary liquids are pumped from larger containers into the HyAbS. When changing the liquids, residuals from the previous liquid might have slightly contaminated the next measurement. In addition, also bubbles remaining in the cavity have the potential of disturbing the measurements (Wollschläger et al., 2016). As in the course of the calculation of the absorption coefficients of the water constituents the coefficients for pure water are subtracted, the presence of air bubbles, thus an incompletely filled cavity, can lead to an error in the calculation. It could be speculated that this also contributes in this case to the observed variability, as the spectral shape of the variability in the red part of the spectrum (Figure 8A) showed some features also visible in the water absorption coefficient spectrum. This emphasizes the advantage of using a solid standard in an automated PSICAM, as such effects could be reduced due to less pumping and refilling the cavity with different liquids, provided that the solid standard would create an reproducible absorption inside the cavity. Indeed, for both PSICAM and HyAbS this is the case according to the low variability in the results shown in Figures 5B, 8B, respectively. Furthermore, it can be seen that the standards absorb over the whole visible spectrum, which is a prerequisite for their use for calibration.
The most important experiment to test the suitability of the solid standard approach was, however, the direct comparison of the solid standard approach with the nigrosin-based absorption (Figure 7). As there was overall good accordance between the reflectivity spectra for both methods, the solid standard approach can, despite its simple design, be considered as sufficient for a calibration of the PSICAM. Thus, it can be considered a valuable alternative to the conventional nigrosin-based calibration. Furthermore, because the need for bleaching is eliminated, the calibration can be performed more often, what potentially increases the accuracy of the sample measurements eventually. However, a small deviation between the solid standard and the nigrosine-based absorption is visible, especially toward the longer wavelengths. To distinguish whether the error occurs randomly or systematically, additional experiments are required. It could be speculated that the stick leads to a small error in the correct assumption of the water absorption inside the cavity, because by its introduction, it displaces a small amount of water during the measurements. However, according to the results of the present study, the error appears to be negligible for practical purposes.
The high linearity (Figure 6) of the solid standard calibration approach offers furthermore the possibility of adjusting its absorption relatively precisely by measuring the length of introduction into the cavity. Thus, the PSICAM could be calibrated according to the absorption coefficients expected in subsequent sample measurements. Still, it has to be kept in mind that the absolute value of the absorption coefficient spectrum introduced by the solid standard depends on the accuracy of the initial calibration of the cavity. If there is substantial error or variability either in the spectrophotometrically nigrosin measurements used or in the PSICAM calibration measurements themselves, the absorption coefficient spectrum calculated for the solid standard is consequently wrong, too. This error will proliferate to all subsequent sample measurements. Thus, the absorption of the standard needs to be determined very carefully and checked in regular intervals.
Finally, a best practice with respect to (automated) PSICAM measurements is not limited to the calibration of the system. What is also important is the recognition of obviously erroneous spectra (Figure 9 mid panel), especially in datasets too large for manual inspection. A first attempt has been made by Wollschläger et al. (2016) by defining two quality criteria: (i) the absorption coefficient at 700 nm has to be >0, and (ii) the slope between the coefficient at 650 and 690 nm has to be negative. These criteria allow to exclude spectra that are obviously curved down- or upward, respectively, but there is certainly potential for future, more detailed work in this respect. In the course of automation, a real time quality check would also allow to implement mitigation steps (e.g., repetition of a reference measurement, when the first subsequent absorption coefficient spectrum measured shows a distorted shape). However, not all deviations between PSICAM and HyAbS visible in the field data presented in this study should be attributed to air bubbles and calibration issues. At some stations, were the spectra are in generally of correct shape, but deviate more or less uniformly over all regions (examples given in Figure 9, lower panel), also simple sampling differences might be responsible. Although the discrete samples have been taken from the same source that was measured continuously by the flow-through device, patchiness in the distribution of the optically active substances can still lead to differences in the measured absorption coefficient spectra, as not exactly the same water volume is measured.
In summary, this study shows that the proposed solid standard is a suitable alternative to the conventional nigrosin-based calibration of a PSICAM. Differences in the results of both methods are minor, however, depended on the desired level of accuracy, further studies might be conducted in order to investigate if these differences are systematically and, if so, correctable. The strength of the solid standard calibration approach is in any case the simplification of the calibration procedure, which is especially of advantage when the PSICAM is used in the field. Furthermore, it has been shown that the solid standard approach can also be used to calibrate an automated flow-through PSICAM (the HyAbS). This is an important prerequisite for a potential integration of such instruments in autonomous sensor platforms like gliders or AUVs (Delory et al., 2014; Pearlman et al., 2014), a key requirement to address environmental challenges (Zielinski et al., 2009). However, in context of the automated long-term deployment of a flow-through PSICAM system, it has to be kept in mind that the calibration is not the only source of error. Contaminations of the central light source, the optical fiber to the detector, or other issues leading to variability in the optical setup also affect the measurements. In principle, many of these variations are accounted for by the reference measurements performed in between the sample measurements. However, the interval of these measurements is crucial, especially as in between reference data have to be interpolated to calculate the absorption coefficient spectra. However, the solid standard calibration is an approach to reduce the uncertainties associated with changes in cavity reflectivity and improves the handling of an automated flow-through PSICAM in this respect. The remaining error sources have to be solved by other means in future work.
Data Availability Statement
The datasets used for this study are available upon request by the authors.
Author Contributions
JW conceptualized the study and performed the field investigations. JW, RR, and OZ validated and analyzed the data. JW, RR, and WP designed the methodology. WP and OZ involved with project administration and acquired funding and resources. All authors contributed to the writing and revision process.
Funding
This research was partly funded by the project NeXOS (Grant Agreement No. 614102) under the call FP7-OCEAN- 2013.2 from the EU Commission as part of the 7th Framework Program, “The Ocean of Tomorrow.”
Conflict of Interest Statement
The authors declare that the research was conducted in the absence of any commercial or financial relationships that could be construed as a potential conflict of interest.
Acknowledgments
We would like to thank the crew of the research vessel Heincke for their support during the cruise (Grant No. AWI-HE516-00). In this context, we would like to acknowledge the project “Coastal Ocean Darkening,” funded by the German Lower Saxony Ministry for Science and Culture (VWZN3175), which provided the framework for the fieldwork. Furthermore, many thanks go to Oliver Listing and the technical department of the Helmholtz-Zentrum Geesthacht for help in the development of the Hyperspectral Absorption Sensor. Finally, thanks goes also to the company TriOS GmbH for their support of the work, as well as to the reviewers who helped to improve the quality of the manuscript by their comments.
References
Bricaud, A., Morel, A., and Prieur, L. (1981). Absorption by dissolved organic matter of the sea (yellow substance) in the UV and visible domains. Limnol. Oceanogr. 26, 43–53. doi: 10.4319/lo.1981.26.1.0043
Dana, D. R., and Maffione, R. A. (2006). A New Hyperspectral Spherical-Cavity Absorption Meter. Honolulu: HOBI Labs, Inc.
Delory, E., Castro, A., Waldmann, C., Rolin, J. F., Woerther, P., Gille, J., et al. (2014). “NeXOS development plans in ocean optics, acoustics and observing systems interoperability,” in 2014 IEEE Sensor Systems for a Changing Ocean, SSCO 2014, (France). doi: 10.1109/SSCO.2014.7000382
D’Sa, E. J., Steward, R. G., Vodacek, A., and Blough, N. V. (1999). Determining optical absorption in seawater of colored dissolved organic matter with a liquid capillary waveguide. Limnol. Oceanogr. 44, 1142–1148. doi: 10.4319/lo.1999.44.4.1142
Earp, A., Hanson, C. E., Ralph, P. J., Brando, V. E., Allen, S., Baird, M., et al. (2011). Review of fluorescent standards for calibration of in situ fluorometers: recommendations applied in coastal and ocean observing programs. Opt. Express 19:26768. doi: 10.1364/OE.19.026768
Fry, E. S., Kattawar, G. W., and Pope, R. M. (1992). Integrating cavity absorption meter. Appl. Opt. 31, 2055–2065. doi: 10.1364/AO.31.002055
Gray, D. J., Kattawar, G. W., and Fry, E. S. (2006). Design and analysis of a flow-through integrating cavity absorption meter. Appl. Opt. 45, 8990–8998. doi: 10.1364/AO.45.008990
Haardt, H., and Maske, H. (1987). Specific in vivo absorption coefficient of chlorophyll a at 675 nm. Limnol. Ocean. 32, 608–619. doi: 10.4319/lo.1987.32.3.0608
Hoepffner, N., and Sathyendranath, S. (1992). Bio-optical characteristics of coastal waters: absorption spectra of phytoplankton and pigment distribution in the western North Atlantic. Limnol. Oceanogr. 37, 1660–1679. doi: 10.4319/lo.1992.37.8.1660
Johnsen, G., Samset, O., Granskog, L., and Sakshaug, E. (1994). In vivo absorption characteristics in 10 classes of bloom-forming phytoplankton – Taxonomic characteristics and responses to photoadaptation by means of discriminant and HPLC analysis. Mar. Ecol. Prog. Ser. 105, 149–158. doi: 10.3354/meps105149
Kirk, J. T. (1995). Modeling the performance of an integrating-cavity absorption meter: theory and calculations for a spherical cavity. Appl. Opt. 34, 4397–4408. doi: 10.1364/AO.34.004397
Kirk, J. T. (1997). Point-source integrating-cavity absorption meter: theoretical principles and numerical modeling. Appl. Opt. 36, 6123–6128. doi: 10.1364/AO.36.006123
Kirk, J. T. O. (2011). Light & Photosynthesis in Aquatic Ecosystems, 3rd Edn. New York, NY: Cambridge University Press.
Kirkpatrick, G. J., Millie, D. F., Moline, M. A., and Schofield, O. (2000). Optical discrimination of a phytoplankton species in natural mixed populations. Limnol. Oceanogr. 45, 467–471. doi: 10.4319/lo.2000.45.2.0467
Leathers, R. A., Downes, T. V., and Davis, C. O. (2000). Analysis of a point-source integrating-cavity absorption meter. Appl. Opt. 39, 6118–6127. doi: 10.1364/AO.39.006118
Millie, D. F., Schofield, O. M. E., Kirkpatrick, G. J., Johnsen, G., and Evens, T. J. (2002). Using absorbance and fluorescence spectra to discriminate microalgae. Eur. J. Phycol. 37, 313–322. doi: 10.1017/S0967026202003700
Moore, C., Barnard, A., Fietzek, P., Lewis, M. R., Sosik, H. M., White, S., et al. (2009). Optical tools for ocean monitoring and research. Ocean Sci. Discuss. 5, 659–717. doi: 10.3390/ijerph121215044
Musser, J. A., Fry, E. S., Gray, D. J., and Musser, J. A. (2009). Flow-through integrating cavity absorption meter - experimental results. Appl. Opt. 48, 3596–3602. doi: 10.1364/AO.48.003596
Pearlman, J., Garello, R., Delory, E., Castro, A., Del Río, J., Toma, D. M., et al. (2014). “Requirements and approaches for a more cost-efficient assessment of ocean waters and ecosystems, and fisheries management,” in 2014 Oceans - St. John’s, OCEANS 2014, (St. John’s, NL). doi: 10.1109/OCEANS.2014.7003144
Petersen, W., Schroeder, F., and Bockelmann, F. D. (2011). FerryBox - Application of continuous water quality observations along transects in the North Sea. Ocean Dyn. 61, 1541–1554. doi: 10.1007/s10236-011-0445-0
Pope, R. M., and Fry, E. S. (1997). Absorption spectrum (380 -700 nm) of pure water. II. Integrating cavity measurements. Appl. Opt. 36, 8710–8723. doi: 10.1364/AO.36.008710
Preisendorfer, R. W. (1976). Hydrologic Optics. Honululu: US Dept. of Commerce, National Oceanic and Atmospheric Administration, Environmental Research Laboratories, Pacific Marine Environmental Laboratory.
Roesler, C. S. (1998). Theoretical and experimental approaches to improve the accuracy of particulate absorption coefficients derived from the quantitative filter technique. Limnol. Oceanogr. 43, 1649–1660. doi: 10.4319/lo.1998.43.7.1649
Röttgers, R., and Gehnke, S. (2012). Measurement of light absorption by aquatic particles: improvement of the quantitative filter technique by use of an integrating sphere approach. Appl. Opt. 51:1336. doi: 10.1364/AO.51.001336
Röttgers, R., Häse, C., and Doerffer, R. (2007). Determination of the particulate absorption of microalgae using a point-source integrating-cavity absorption meter. Limnol. Oceanogr. Methods 5, 1–12. doi: 10.4319/lom.2007.5.1
Röttgers, R., McKee, D., and Utschig, C. (2014). Temperature and salinity correction coefficients for light absorption by water in the visible to infrared spectral region. Opt. Express 22, 25093–25108. doi: 10.1364/OE.22.025093
Röttgers, R., McKee, D., and Woźniak, S. B. (2013). Evaluation of scatter corrections for ac-9 absorption measurements in coastal waters. Methods Oceanogr. 7, 21–39. doi: 10.1016/j.mio.2013.11.001
Röttgers, R., Schönfeld, W., Kipp, P.-R., and Doerffer, R. (2005). Practical test of a point-source integrating cavity absorption meter: the performance of different collector assemblies. Appl. Opt. 44, 5549–5560. doi: 10.1364/AO.44.005549
Shibata, K. (1959). Spectrophotometry of translucent biological materials—opal glass transmission method. Methods Biochem. Anal. 7, 77–109. doi: 10.1002/9780470110232.ch3
Watson, J., and Zielinski, O. (2013). Subsea Optics and Imaging. Cambridge: Woodhead Publishing limited. doi: 10.1533/9780857093523
Wollschläger, J., Grunwald, M., Röttgers, R., and Petersen, W. (2013). Flow-through PSICAM: a new approach for determining water constituents absorption continuously. Ocean Dyn. 63, 761–775. doi: 10.1007/s10236-013-0629-x
Wollschläger, J., Voß, D., Zielinski, O., and Petersen, W. (2016). In situ observations of biological and environmental parameters by means of optics-development of next-generation ocean sensors with special focus on an integrating cavity approach. IEEE J. Ocean. Eng. 41, 753–762. doi: 10.1109/JOE.2016.2557466
Yentsch, C. S. (1962). Measurement of visible light absorption by particulate matter in the ocean. Limnol. Oceanogr. 7, 207–217. doi: 10.4319/lo.1962.7.2.0207
Keywords: absorption, integrating cavity, PSICAM, calibration, solid standard
Citation: Wollschläger J, Röttgers R, Petersen W and Zielinski O (2019) Stick or Dye: Evaluating a Solid Standard Calibration Approach for Point-Source Integrating Cavity Absorption Meters (PSICAM). Front. Mar. Sci. 5:534. doi: 10.3389/fmars.2018.00534
Received: 14 September 2018; Accepted: 31 December 2018;
Published: 04 February 2019.
Edited by:
Jay S. Pearlman, Institute of Electrical and Electronics Engineers (France), FranceReviewed by:
Patrice Brault, Suroit Consulting, FranceHanna Maria Kauko, Norwegian Polar Institute, Norway
Ricardo Giesecke, Universidad Austral de Chile, Chile
Copyright © 2019 Wollschläger, Röttgers, Petersen and Zielinski. This is an open-access article distributed under the terms of the Creative Commons Attribution License (CC BY). The use, distribution or reproduction in other forums is permitted, provided the original author(s) and the copyright owner(s) are credited and that the original publication in this journal is cited, in accordance with accepted academic practice. No use, distribution or reproduction is permitted which does not comply with these terms.
*Correspondence: Jochen Wollschläger, am9jaGVuLndvbGxzY2hsYWVnZXJAdW9sLmRl