 Justin J. H. Buck1*
 Scott J. Bainbridge2
 Eugene F. Burger3
 Alexandra C. Kraberg4
 Matthew Casari3
 Kenneth S. Casey5
 Louise Darroch1
 Joaquin Del Rio6
 Katja Metfies4
 Eric Delory7
 Philipp F. Fischer8
 Thomas Gardner1
 Ryan Heffernan9
 Simon Jirka10
 Alexandra Kokkinaki1
 Martina Loebl11
 Pier Luigi Buttigieg12
 Jay S. Pearlman13
 Ingo Schewe12
- 1National Oceanography Centre, Liverpool, United Kingdom
- 2Australian Institute of Marine Science, Townsville, QLD, Australia
- 3Pacific Marine Environmental Laboratory, Office of Oceanic and Atmospheric Research, National Oceanic and Atmospheric Administration, Seattle, WA, United States
- 4Alfred-Wegener-Institut, Helmholtz-Zentrum für Polar- und Meeresforschung, Bremerhaven, Germany
- 5National Environmental Satellite Data and Information Service, National Centers for Environmental Information, National Oceanic and Atmospheric Administration, Silver Spring, MD, United States
- 6Universitat Politècnica de Catalunya, Barcelona, Spain
- 7Oceanic Platform of the Canary Islands, Telde, Spain
- 8Alfred-Wegener-Institute Helmholtz Centre for Polar and Marine Research, Shelf Sea System Ecology, Helgoland, Germany
- 9Microsoft Corporation, Seattle, WA, United States
- 1052°North Initiative for Geospatial Open Source Software GmbH, Muenster, Germany
- 11Alfred-Wegener-Institute Helmholtz Centre for Polar and Marine Research, Operations and Research Platforms, Bremerhaven, Germany
- 12Institute of Electrical and Electronics Engineers, Paris, France
- 13Alfred-Wegener-Institute Helmholtz Centre for Polar and Marine Research, Tiefseeökologie und –technologie, Bremerhaven, Germany
In the next decade the pressures on ocean systems and the communities that rely on them will increase along with impacts from the multiple stressors of climate change and human activities. Our ability to manage and sustain our oceans will depend on the data we collect and the information and knowledge derived from it. Much of the uptake of this knowledge will be outside the ocean domain, for example by policy makers, local Governments, custodians, and other organizations, so it is imperative that we democratize or open the access and use of ocean data. This paper looks at how technologies, scoped by standards, best practice and communities of practice, can be deployed to change the way that ocean data is accessed, utilized, augmented and transformed into information and knowledge. The current portal-download model which requires the user to know what data exists, where it is stored, in what format and with what processing, limits the uptake and use of ocean data. Using examples from a range of disciplines, a web services model of data and information flows is presented. A framework is described, including the systems, processes and human components, which delivers a radical rethink about the delivery of knowledge from ocean data. A series of statements describe parts of the future vision along with recommendations about how this may be achieved. The paper recommends the development of virtual test-beds for end-to-end development of new data workflows and knowledge pathways. This supports the continued development, rationalization and uptake of standards, creates a platform around which a community of practice can be developed, promotes cross discipline engagement from ocean science through to ocean policy, allows for the commercial sector, including the informatics sector, to partner in delivering outcomes and provides a focus to leverage long term sustained funding. The next 10 years will be “make or break” for many ocean systems. The decadal challenge is to develop the governance and co-operative mechanisms to harness emerging information technology to deliver on the goal of generating the information and knowledge required to sustain oceans into the future.
Introduction
The Earth's surface is 70% ocean, with 40% of humanity living within 100 kilometers of the sea and an even larger proportion reliant on ocean ecosystem services (UN, 2017). Despite its central value to the lives of so many, fundamental information about how our oceans work is only available to a small community of scientists and operational experts. Rapid developments in sensor technologies are providing greater volumes of valuable data than ever before, thus there is a pronounced need for innovation in providing access to a wider collection of stakeholders.
Improving global understanding of our oceans and their value will rely on innovation that removes barriers between each group of users (including potential users) and the marine data most relevant to their needs. This will require new information and data pathways which open up, adaptively structure, and explain complex ocean data to anyone who can generate value and knowledge from it. Simultaneously, improving the connectivity between data networks and facilitating the integration of new sensors will rapidly improve monitoring activities such as maritime safety (piloting and dredging), the prediction of ocean hazards such as Tsunamis, and the disentangling of natural variably from human-induced impact in the natural environment.
While the possibilities are immense, sizeable obstacles currently impede global, interdisciplinary, and inclusive progress. For example, the majority of oceanographic data available today are downloadable from web portals which have tailored their search interfaces and data products to highly specialized consumers, limiting generalized use and cross-boundary innovation. Data are also often available from disparate networks, in a variety of formats and with sparse or poorly structured metadata. Collectively, these issues greatly slow the discovery and use of ocean data, as well as the generation of downstream products and knowledge.
This paper examines the frameworks, standards, protocols and pathways required to break free of the current “portal and download” model of data access and move to a system based on interoperable services, allowing users to configure and apply varied yet compatible ocean data services to build their own knowledge systems. In particular, we explore solutions which will allow new data flows around models, artificial intelligence, and user-defined knowledge systems.
Under the banner of the “democratization of data,” a series of examples from other disciplines are dissected to look at what the framework needs to deliver and how this democratization is currently being done in other areas. The need to ensure that data provenance, Quality Control (QC) information, appropriate use and attribution information are embedded in any data access workflow is fundamental to ensuring user trust in the data and any products generated and so the paper focuses on issues of cyber-security and provenance. The standards, protocols, technologies, and tools that link the various parts of the workflow into a true framework are also detailed along with a number of Use-Cases that demonstrate the current state of the art in ocean data systems. Finally, the vision of what this open access to data may look like and how it may work are presented along with a set of recommendations for advancing this over the next decade, or sooner.
To provide context, a Data Life Cycle diagram is shown (Figure 1), which visualizes the various stages in data workflows from sensor to user, the roles and organizations involved and what structural units are required to deliver the workflow. Figure 2 is a schematic of what a future work-flow may look like with the concepts of information and knowledge brokers introduced as key parts of the work-flow. Finally, Figure 3 shows how data integrity is delivered by the work-flow, particularly from sensor to data center, and how this may be secured.
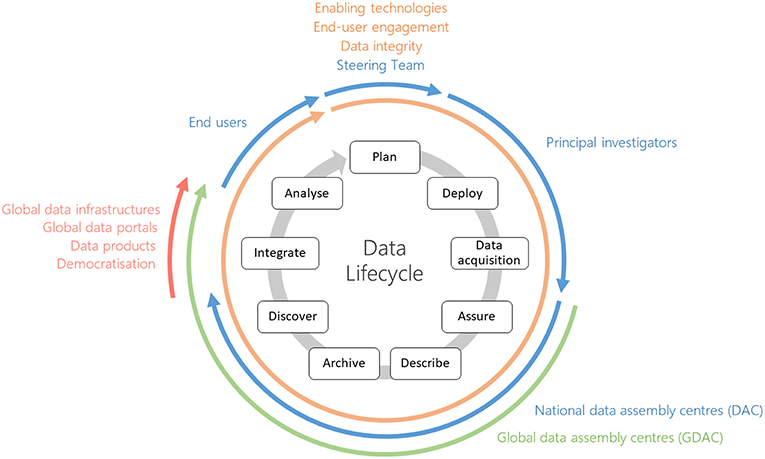
Figure 1. Roles and processes involved in the data lifecycle.
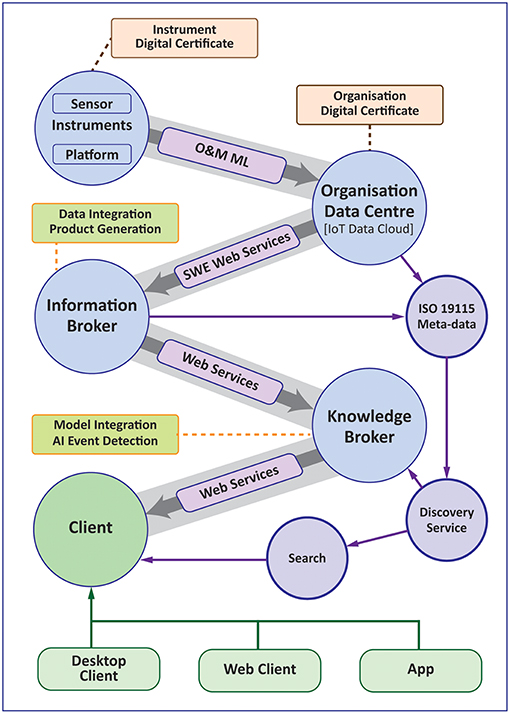
Figure 2. Workflow diagram showing the role of information and knowledge brokers.
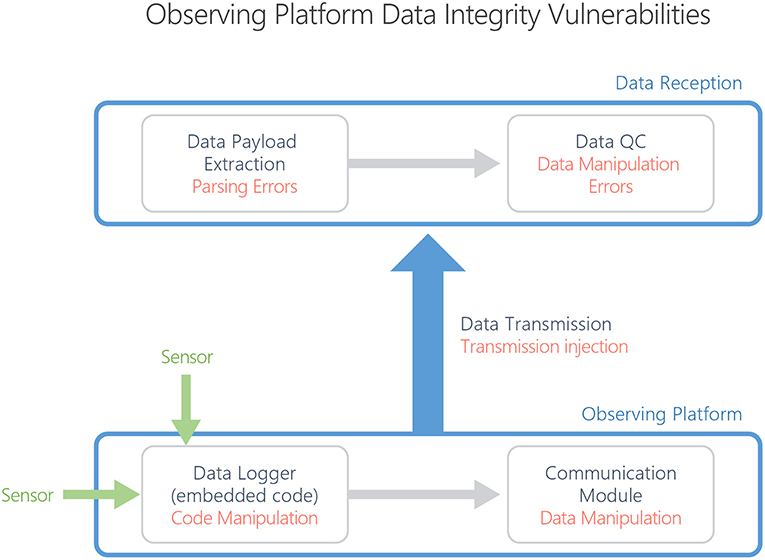
Figure 3. Data integrity vulnerabilities in an example data workflow scenario.
The coming decade will see rapid advances in our ability to collect data, the challenge is to develop the frameworks and work flows to similarly increase the conversion of data to information, to facilitate and encourage the uptake and use of the data, and to ensure that the decisions that impact the state of the oceans in 10 years are based on creditable, defensible, understood data generated from high quality sustained observations.
Democratization of Data
The democratization of data is the process of making data that is difficult or complex to find, understand and use, available to anyone in a way that makes sense to them. Given that most ocean data are funded by various national and international government programs, there is an expectation that publicly funded data should be freely and easily available to the public: data paid for by the people for use by the people. For most ocean data this is currently not the case. The idea behind data democratization is to change this.
While there have been efforts to make ocean data freely available, via portals and other mechanisms, there are still substantial barriers to entry for people outside the ocean community. Even within the ocean community barriers exist; for example, most biologists struggle to use file formats such as NetCDF. For simple data sets, such as satellite-derived Sea Surface Temperature1, there are numerous sites with varying products, making it difficult for non-experts to understand. If ocean data is to impact how we use, manage and sustain our oceans then it needs to be available in a form that provides value and satisfies the needs of end users from all communities. This democratization of data requires a new paradigm for how data is converted into information, and ultimately knowledge, which leverages new information frameworks and rethinks how people use and gain value from data.
An example from the marine community where effort toward democratization of data has begun is the MedSea project2 (Ziveri, 2014). The EMODnet Med Sea checkpoint3 is a Mediterranean Sea wide monitoring system and assessment activity based upon targeted end-user applications including windfarm siting, managing marine protected areas, detecting oil platform leakage, climate and coastal protection, fisheries management, marine environmental management, and monitoring river inputs to the coastal environment. The goal was to provide a basis for rational decision-making, assessing the status of the Mediterranean Sea observing and modeling infrastructure, analyzing gaps, and identifying priorities to optimize regional monitoring and sampling strategies. Examples of applications of this work are oil spill management and safer professional and recreational activities (Liubartseva et al., 2016; Coppini et al., 2017). Other related but less mature EMODnet activities for different regions that are illustrative of European policy are for the Atlantic as part of the AtlantOS project (Koop-Jakobsen et al., 2016) and North Sea Checkpoint project4.
The new paradigm looks to reverse how ocean data is traditionally accessed and used. In this paradigm the user defines the way the information derived from data is converted to knowledge. The end users are empowered to create knowledge relevant to their own needs from the data and information provided. This is the reverse of traditional systems where the custodian of the data pre-defines the use and constraints of the data and in so doing defines the knowledge that can be extracted. The knowledge a shipping company extracts from current data may be very different to that a marine insurance company, local sailor, or fisherman derives.
The new paradigm is built around Data as a Service (DaaS), where data sets are made available as fully-described, web-enabled data streams. This removes the need to download data from a portal or data store, to know what data exists and where it resides, to be able to understand and decode the storage format and to manually convert it to a form that adds value to the end user (such as changing units, datum, etc.). The DaaS concept enables machine systems to discover, access and deliver data, providing an underlying set of services on which information systems can be built (Terzo et al., 2013).
So how would this work and what would it look like? Four examples are given, showing a range of models from currently existing systems, including how the data is arranged and sourced, how the system adds value, and how it is supported by an underlying business model.
Google Scholar5 provides a single interface for finding and accessing scientific literature as well as tools for citing publications. The system uses “GoogleBots” or web “crawlers” to extract information from publishers' web sites and collate it into a form suitable for public access and use. The data source is therefore un-federated (no single source of data) and the extraction is passive from the point of the data custodian. The system adds value by providing a single point of access to the scientific literature and by providing tools, such as searching, download links and citation tools, to facilitate access and use of the data. The business model for the underlying publisher is either a “pay to publish” model where the author pays the journal to publish the article and generally access is free and open, or a “pay to access” model where the author gets published for free and so pays no fees to the journal but the journal charges for access. For Google the business model is increased web traffic and related advertising revenues along with providing public good.
The second example is AccuWeather6, which exemplifies the operation of many other weather websites. Here the data is federated from a relatively small number of defined sources, mostly meteorological agencies, providing structured data streams, either for free or for a small fee as part of their charter. These sites add value by presenting the data in easy-to-use ways, by combining data from a number of data streams (such as up-to-date temperatures, medium- and long-range forecasts, weather radars, etc.) and by using sophisticated delivery platforms (Apps) to allow users to tailor the information they want (such as by defining locations of interest, display units and updates/alerts).
Another example is from the financial world. The StockCharts7 site again uses a small number of federated, well-defined, machine-readable data streams to drive complex charting and analysis software. The site adds value through the analysis and charting engine but also by allowing extensively customization of the data. Users can annotate charts, construct watch lists, create alerts and notifications and access social media through blogs and on-site forums, where the user can gain and distribute knowledge relevant to their interest or need. This allows the construction of a sophisticated knowledge system around the source data via complex user-defined visualizations combined with the ability to access and contribute to a knowledge community.
The most sophisticated examples given are all based on a similar model of how data is sourced, accessed and then transformed into information for the user to extract knowledge from. The models typically include the following components or attributes:
1. While there may be many data sources, they are federated through a small number of providers, brokers or “clearing houses,” allowing services to be built around a relatively small number of providers;
2. The data are pre-processed and packaged into standardized products that are structured to reflect the information contained within the data (for example, ocean temperatures can be processed into daily averages, climatologies, hot spot values, temperature accumulation values, surface values, daily min/max, etc.);
3. Full metadata is provided in a machine-readable form so that data discovery can be done via automated harvesting rather than manual searches;
4. Visualization and analysis engines are used to allow user interaction with the data such as extrapolating trends, setting alerts for user defined events (e.g., temperature thresholds being exceeded), producing climatologies and other statistics;
5. Models are used to synthesize data, to fill holes (such as the Buoyweather site, which uses models to deliver location-specific forecasts) and to provide higher level products such as forecasts;
6. A range of other resources are presented, in particular access to a community of practice, that allows the user to extract and create knowledge and associated value;
7. The systems use sophisticated platforms, such as Apps, to deliver content where the user can define a knowledge environment in which the information is contextualized and delivered.
A workflow that supports these ideas is shown in Figure 2 where information and knowledge brokers federate data from a number of sources, process it into standardized products and then deliver these via services to a range of clients.
The best example of data democratization is Google Earth8. Google Earth, via the Google Earth Engine, Google Earth client and Google Maps, uses many of the components of the other examples, such as a few federated sources of source data and complex visualizations, but extends these in unique ways that together have changed how people access and use spatial data.
These include:
• The user is totally abstracted from the source data (satellite images) with the system providing the initial processing and presentation. The user just gets to interact with the information in the system, not the data.
• The system allows extensive customization by the user with the ability to add layers, points, images and overlays easily so that, like the financial systems, the user creates a knowledge environment that reflects and contextualizes the knowledge they need to extract from the information;
• Google has built an easy to use import/export format (KML/KMZ), which allows other systems to integrate into their platform; this in particular allowed other companies and agencies to interact and be part of the information system;
• Google also created and promoted a full open API, allowing others to build systems and solutions around Google Earth and to build knowledge solutions that add value and which reflect a particular need or community;
• Google created and made freely available a range of clients from “thick” traditional PC clients to “thin” web systems to Apps, allowing anyone to use the system.
The key point is that Google has abstracted the user from the source data and all of the complexities of purchasing, accessing, storing, processing, and visualizing satellite data. It then made the system open, via the API, the KML/KMZ import/export file and by making a range of clients available for no cost, which gave a path for the commercial and other sectors to invest in the system.
A key part of the above examples is the idea of a broker or clearing house. Brokering, in this instance, is accomplished by bridging technology that spans the gaps between the conventions of two different disciplines, enabling interoperability without levying additional requirements on either end (Nativi et al., 2013). In this role, brokers are able to unify or cross-map differing standards, formats and protocols, add value by enabling data discoverability, map domain specific knowledge and terminology across disciplines, and provide tools for data uptake and use. Effectively data brokers provide an interoperability layer by abstracting the input and output layers from each other, allowing users from one domain to access and use data from another.
This model however, has a number of potential issues. The first revolves around data quality, security, and provenance. Unlike relatively simple share price data, the collection, processing and use of environmental data is often complex, with a knowledge of the domain required to understand what is and what is not appropriate use. The potential for misuse, intentional or otherwise, is significant (as it is with share price data, which has extensive legal controls around access and use). The act of federating the data means that the connection between the data provider and the data user is lost, along with the ability to communicate the limitations, assumptions and complexities of the data to the end user. In science this is problematic; indeed, many meteorological agencies are exempted from legal responsibility for the forecasts they provide for this very reason.
The second problem is more practical; how to build and sustain such a system. While much of the ocean data collected is amassed by publicly funded agencies, they are often either not operational agencies (and so not set up to deliver operational data products) or the data is collected under complex project arrangements that vary in life-span, resourcing and activity. Unlike the meteorological community, where there are agencies funded to produce publicly-available long-term data sets, the ocean community is more fragmented with responsibility shared across a range of research and operational agencies. Coupled with this is a complex political and funding landscape that makes it hard to establish and sustain multi-decade programs and infrastructure.
Developing a business model that supports and sustains data and information systems is not trivial and, while the monetization of data is not an area which the science community tends to explore, it is one that needs to be considered. Partnerships with the commercial sector are one way to build sustainability models that ensure continuity of data and information although reliance on a commercial partner has its own issues.
Importantly, the framework needs to also work in reverse. The framework needs to provide information to data custodians about who is using their data, what pathways and workflows they are using, what end products or information are being generated and what value is being created. The framework needs to be structured so that there are feedback components that measure attribution and deliver credit. Coupled with this is the idea of governance; how the various parts of the framework are governed, controlled, updated and maintained and how credit, resources and attribution are generated and delivered. To be sustainable every party involved needs to understand “what's in it for them”; that is be able to measure the value generated by being an active partner in the framework and how this translates into real-word resources and returns.
User Trust—Data Integrity and Security
Users of scientific or operational data retrieved from credible institutions expect it to accurately represent the phenomenon that was measured in the field or the laboratory. Following collection, the transmission, quality control, and all subsequent processing of this data should not detract from its accuracy. Such quality requirements are also held by data providers, who build their reputations around the validity and verifiability of their holdings. Quality data typically results from the application of community best practices across its lifecycle. Similar community standards also guide the documentation and contextualization of data, as the usability of even the best data is compromised without well-structured metadata and descriptions of provenance. Ensuring the integrity of the data (avoiding data corruption) is especially important for data that are to be stored in perpetuity and intended for future reuse. Integrity and consistency build a foundation of trust essential for information to be used in policy formation and for reliable monitoring of change.
While not an exhaustive treatment, this paper highlights the critical importance of data integrity and its impact on users' trust. A timely and important example involves the data used to understand the anthropogenic effects on our environment and climate. Any malicious attempt to cast doubt on climate science simply has to undermine the integrity of a discipline's data, or even a relatively minor fraction of it. The well-publicized “Climategate” event is indicative of the distraction that can be caused by casting doubt on data or its providers. To guard against such efforts, data integrity has to be transparently confirmed, corroborated, and well-documented throughout its lifecycle. This documentation needs to be readily accessible to the public as part of standard provenance metadata. Where possible, the provenance and quality control data should be bound with the raw data (e.g., via digitally signed data sets and with the provenance and data set QC data embedded in the raw data format) rather than exist in separate metadata systems. In the latter case, key metadata on provenance and quality can too easily be decoupled from raw data sets, to the detriment of all.
Data integrity can be affected through the entire lifecycle of the data, from the initial measurement, to the logging, through the remote platform transmission and payload decoding, to the quality control and long-term storage (see Figure 3). To a large extent, data integrity preservation is integrated into the various technical tools used to move data through its stages of the data lifecycle. For example, rsync and sftp include built-in data integrity checks during file operations. However, not all tools do this and it is evident that gaps or vulnerabilities exist at various steps of the data lifecycle that can potentially affect data integrity.
Internet Connected Instrumentation
Increasingly, scientific and operational instrumentation is connected directly to the internet via Wi-Fi, cellular, or satellite communications. These so-called Internet of Things (IoT) devices commonly use off-the-shelf technologies for data collection, encryption and transmission. This approach differs from comparable instrumentation and data logging devices from previous generations. While the promise of low-cost, easily configured and deployed devices is attractive to the ocean community for obvious reasons, IoT security is in its infancy. IoT devices with UNIX-like operating systems provide all the benefits and weaknesses of a typical desktop machine. Software vulnerabilities of IoT devices have become a prime target for malicious operators looking for ways to gain tangible benefits or disrupt the system for its intended user. Systems with no traditional operating system, or “bare-metal” IoT devices, can be similarly exploited.
Observing Platform Connectivity
Communications from observing platforms to data centers use a variety of technologies and protocols. While this paper cannot discuss the security profile of all communication protocols, we will highlight overarching themes and considerations. A major consideration for the data community is the risk that the communication platform and protocol presents not only to the integrity of the data while in communication transit, but also the vulnerability of the observing platform technologies, such as the data logging platform or sensor, discussed above. The objective is to ensure safe passage of the data, but also to ensure the communication technology is adequately detached from others on its platform to prevent its use as a vector by which the data collection platform is compromised. Attempted compromises of popular satellite communications platforms are well-documented. Global Wi-Fi is an exciting promise for operators on remote observing platforms but the application of off-the-shelf technologies demands data transmission security best practice to ensure secure passage and preserve the integrity of the data received by observing system operators. Safe passage of data is not unique to data platform operators, and industry practices, such as BlockChain, should be investigated and deployed where applicable. These methods should be cataloged and preserved in the platform metadata.
Vulnerability Management
Software solutions, such as operating systems, IoT device drivers, encryption libraries and data analysis applications are used at virtually every stage of ocean observation and data dissemination. Like nearly all software, these solutions contain security vulnerabilities and are therefore a potential entry point for a breach where malicious code or actors could compromise the data or systems. Further, even otherwise secure software can become vulnerable when configured or operated incorrectly.
In order to manage these vulnerabilities, system owners should have a process in place for detecting, tracking, prioritizing and remediating them. Should one or more of these vulnerabilities be exploited and result in an incident, the system owner should have an incident response process. Guidelines for these controls are outlined in NIST SP 800-53 Rev. 5. In the same way, groups that develop software solutions should follow a secure development process in order to minimize the number and severity of vulnerabilities. Guidelines for these controls can be found in NIST SP 800-64 (Kissel et al., 2008).
Data Quality Control (QC)
Data quality control seeks to identify and highlight data elements unrepresentative of the environment measured or outside the expected ranges produced by a processing routine. Best practices for data quality control are well-documented for many variables, but often scattered across the web. To help remedy this, the UNESCO/IOC-IODE Ocean Best Practices system9 is consolidating access to these and other methods in a sustained archive (as described in section Developments in Tools and Standards). As these best practices become more systematically archived and available, the community should embrace well-established and uniquely referenceable QC processes. QC is a critical step to identify deviations from established norms in data. Integrity of processes and workflow elements discussed above should eliminate any concerns about unintended or malicious manipulation of data. The lack of these controls can cast doubt not only on a simple variable, but an entire data collection.
Long-Term Archives
Formal long-term archives play a critical role in ensuring data integrity for many data sets, for many users, over many generations. Many or perhaps most formal environmental data archives attempt to adhere to the standards and practices documented in the Open Archival Information System Reference Model (OAIS-RM10). The OAIS-RM establishes a set of responsibilities and functions that an Archive should commit to and perform, along with a common terminology for discussing these archival functions with stakeholders. Within the OAIS-RM, clear functions designed to assure data integrity (what the OAIS-RM calls Data Fixity) are included, and Data Fixity documentation is a key component of the Preservation Description Information (PDI) for every archival package.
While archives ensure Data Fixity, or integrity, in multiple ways, they also address other important types of PDI to ensure data remain useful and meaningful over time. Even if actual bit-level corruption is avoided, data loss can occur through other means. In addition to Data Fixity information, OAIS archives also work to ensure every archive package includes Reference, Context, Provenance and Access Rights Information at a minimum, to ensure data remain viable over the long term. Reference information includes the use of persistent identifiers like Digital Object Identifiers (DOIs) and taxonomic identifiers to describe and uniquely reference the archived content. Context information addresses why the data were collected and how they relate to other archived packages. Provenance information captures the history of the preserved data, and, via an Access Rights document, details who can access and interact with the data. Without all this information, data “corruption”—in the sense of losing the ability to trust the data—will occur.
The importance of archives, and the trust users place in them, has led to a range of independent archive certification processes. A popular example is the Core Trustworthy Data Repository certification11, offered by the Data Archiving and Networked Services archive and the International Council for Science (ICSU) World Data System (WDS). Together, the OAIS-RM and the various certification processes give users confidence that critical issues such as data integrity have been addressed by the archive.
End User Data Delivery
Ambiguity caused by multiple data centers and third-party hosts having different versions of data is becoming an issue requiring management. If the data are to be used in decision making then users need to be sure they have the definitive version. When copies of data are re-exposed to the web via third parties there is a long-term overhead in ensuring that the most pertinent version of data is maintained. Distributed ledger technology such as Blockchain may be a potential solution to this issue (see: IEEE special report on blockchain12). In a distributed ledger data are effectively assigned a fingerprint, which evolves as data versions evolve. This allows full data lifecycle and versions to be understood by users. The technology is mature for applications like Bitcoin but untested for tracking data provenance. There are also key questions to address such as: Is the high computation and energy cost justifiable for our applications? Can this process be done at sensor level, to cover the full data lifecycle? Also, the data become immutable when placed in a distributed ledger system. This is good from the perspective of long-term integrity but care is required with personal or sensitive data.
Enabling Technologies
Oceanographic data are disseminated and exposed to the web at a range of levels from local, single institution websites and services to regional scale infrastructures and activities. Regional level infrastructures and activities include National Ocean and Atmosphere Administration (NOAA), National Centers for Environmental Information13 (NCEI) and the developmental EarthCube14 project in the USA, SeaDataNet15 and EMODnet16 in Europe, and the Australian National Data Service17 (ANDS) and the Australian Ocean Data Network18 (AODN). Despite continental boundaries, projects such as the in Ocean Data Interoperability Platform19 (ODIP) work to harmonize international data efforts in the marine community. This section will describe many of the technologies used to harmonize data exposure to the web and emerging trends.
Developments in Tools and Standards
The technologies that will underpin automated data collection, processing and dissemination have been evolving for the last two decades and currently exist across a range of maturity levels. This section will focus on key enabling technologies that have the potential to underpin the data revolution this paper presents, looking at current technology before moving on to look at trends and developments.
A key advance is the introduction of Application Programming Interfaces (API). An API is a set of functions and procedures for creating applications that access the features or data of an operating system, application or other service. The modern API was first demonstrated by Roy Thomas Fielding in 2000 (Fielding, 2000), with commercial applications introduced by eBay and Amazon later that year. APIs are now ubiquitous on the internet. Their key benefit is in allowing services and data hosted by an organization to be accessed “machine to machine”; an example would be the display of dynamically sourced data from one organization on another organization's website, connected using common protocols.
The use of standardized services places new requirements on how data and information are exposed to the web, as the content has to be machine readable. A simple example: what is Practical Salinity called within my dataset? Numerous terms have been used that are readily understandable to the human reader e.g., psal, salinity, Salinity, sal, etc. However, these are subject to typographic errors and ambiguities e.g. the salinity reference scale associated with a particular data channel. Controlled vocabularies have been introduced to address these issues, e.g., the Climate Forecast (CF) standard names (sea_water_practical_salinity20). or the European P01 vocabulary used in the SeaDataNet infrastructure (PSALST0121). In the case of SeaDataNet, the vocabularies are audited and published on the NERC Vocabulary Server (NVS 2.0) in the machine-readable, Simple Knowledge Organization System (SKOS) with standardized APIs for querying and delivering terms (REST, SOAP and SPARQL). Many of these vocabularies are also semantically linked to local or external vocabularies, so a user (or machine) can identify similar or related terms. Importantly, the standardization and formalization of descriptors using controlled vocabularies and SKOS modeling is providing the foundation for further innovation in ocean informatics. The application of knowledge representation methods and highly expressive semantic technologies using the Web Ontology Language (OWL) is allowing machine agents to more flexibly handle multi- and interdisciplinary data (see Trends and the future of tools and standards).
Further to the use and importance of standards, standardizing the encoding of metadata and data themselves will be crucial if data are to be readily usable by machines or dataset aggregations. The Ocean Data View and SeaDataNet activities have introduced a standard ASCII representation of data. For multidimensional and larger datasets based on binary formats, key advances have included the introduction of the CF-NetCDF standards and the Attribute Convention for Dataset Discovery (ACDD). Elements of CF-NetCDF and ACDD have been used in NetCDF formats developed by community observing programs (Ocean SITES data management team, 2010; Argo Data Management Team, 2017; EGO gliders data management team, 2017). Concurrently, the OGC has developed Sensor Web Enablement (SWE) standards including SensorML for sensor metadata and Observations and Measurements (O&M) for sensor data. These are XML-based representations but are readily converted to other formats such as JSON. The breadth of data and metadata standards are described in Table 1.
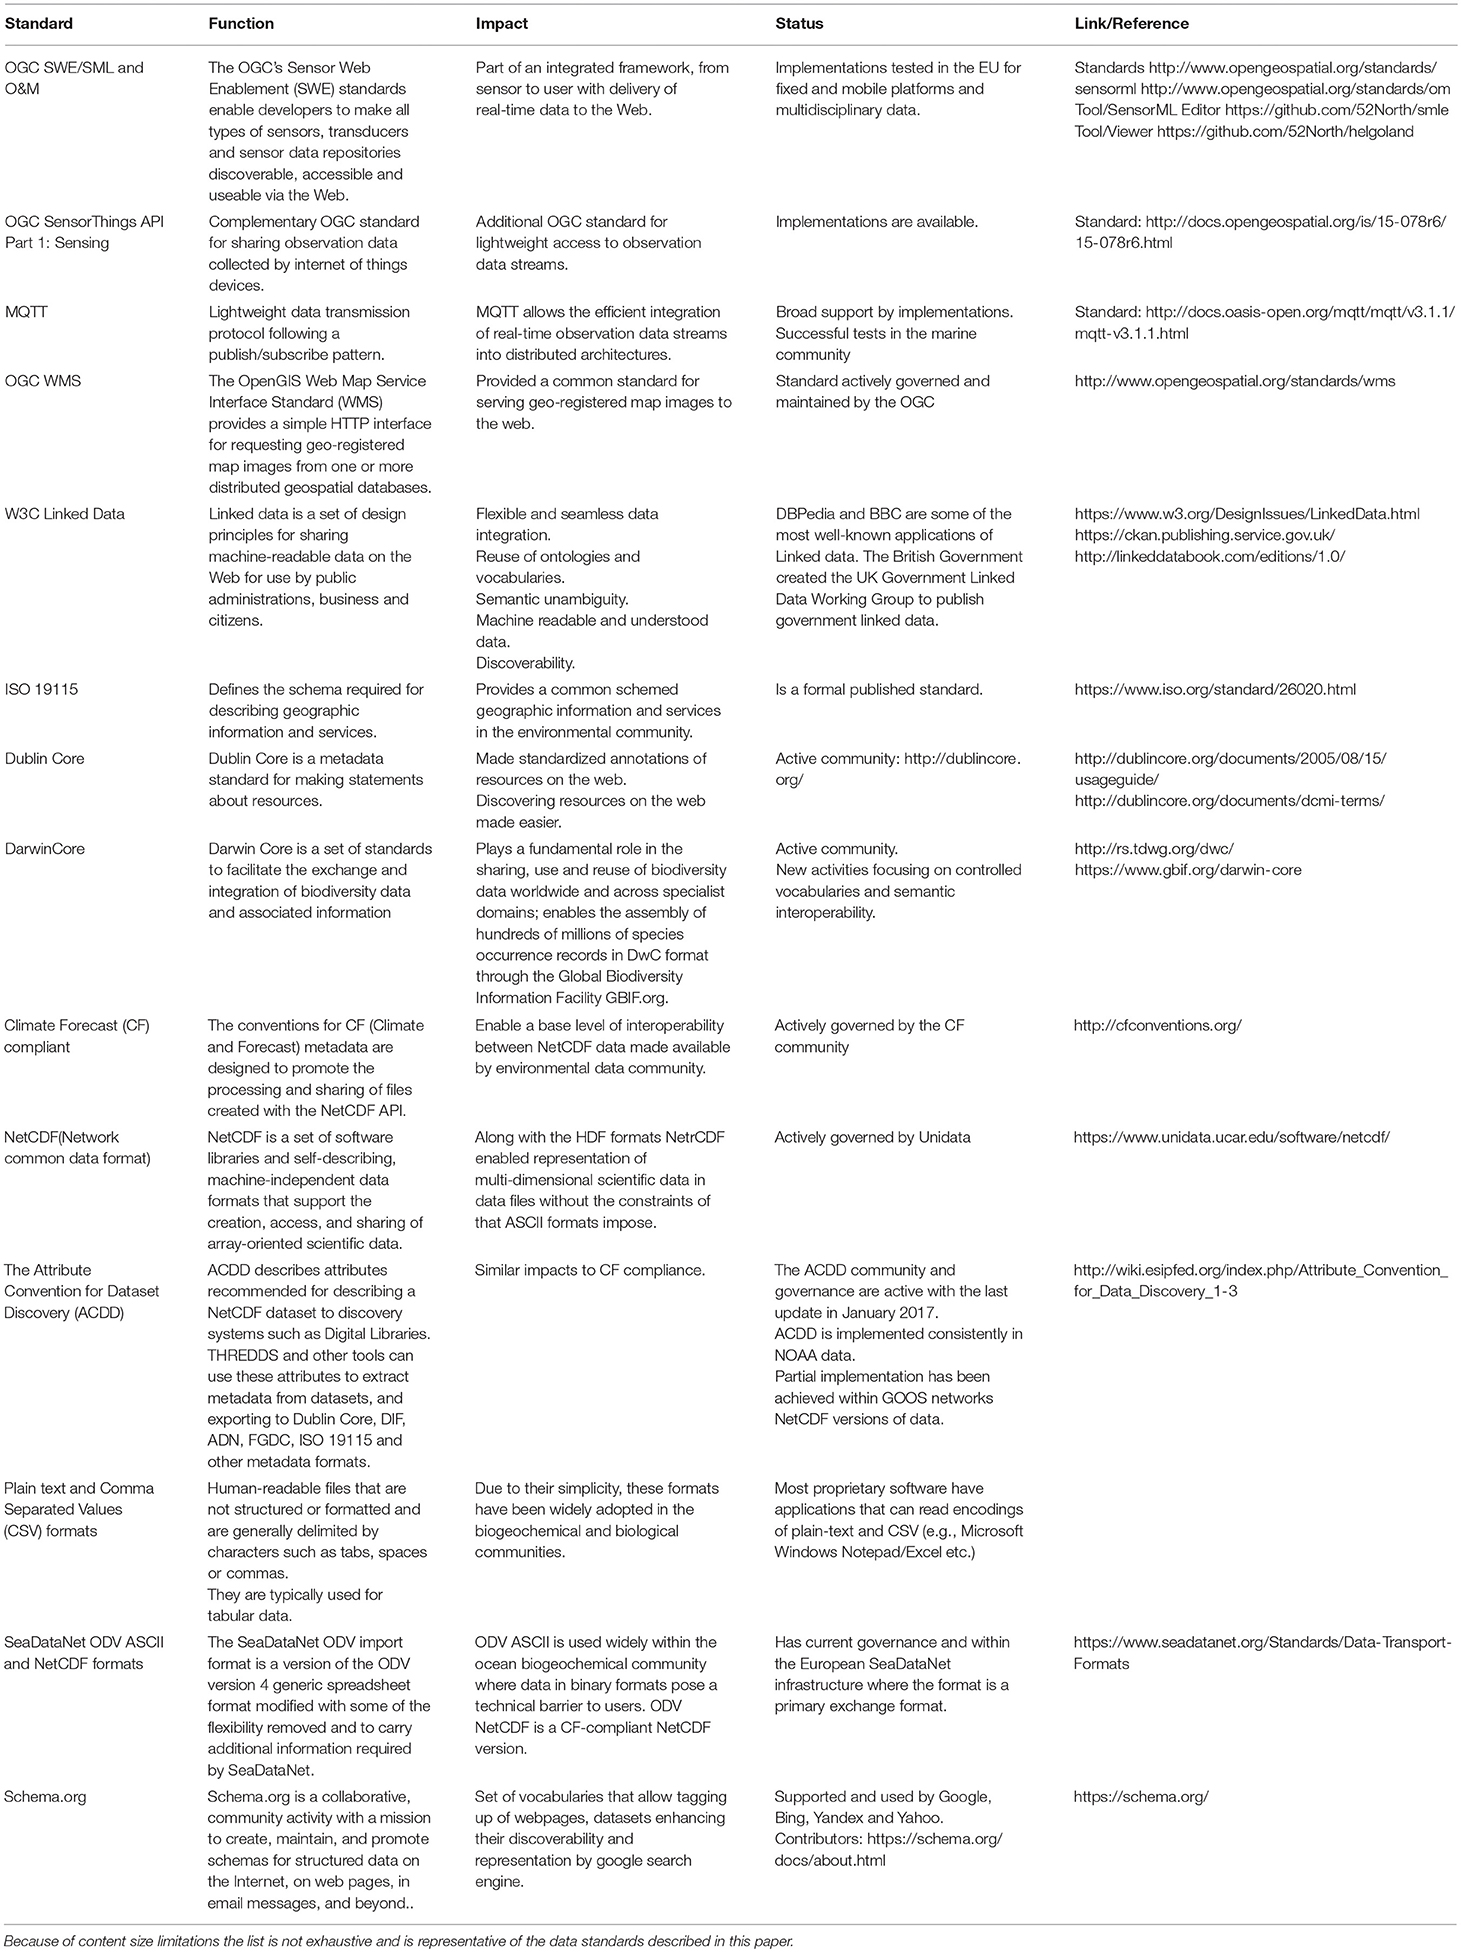
Table 1. Table describing the summary of data and metadata standards presented in this paper.
Best practices (Pearlman et al., 2017a) complement standards in supporting improved interoperability and data/information exchange. A community best practice is defined as a methodology that has repeatedly produced superior results relative to others with the same objective. To be a best practice, a promising method will have been adopted and employed by multiple organizations. Best Practices may occur in a number of areas—standard operating procedures, manuals, operating instructions, etc., with the understanding that the document content is put forth by the provider as a community best practice (Simpson et al., 2018). As with standards, the benefits for ocean data include improved consistency and interoperability among measurements on a local to global scale, increased dialog and cooperation among experts and a reliable base to make comparisons addressing evolution of the ocean ecosystem. Best practices benefit day-to-day operations by reducing duplication of effort and unneeded repetition of learning processes. They create a knowledge base to speed development and improve efficiency. The difference between standards and best practices is the process of consensus building, adaptation and adoption. Standards generally take years to create and adopt once the underlying methodologies are accepted by the community. Best practices have a faster adoption period and can more readily adapt to emerging technology and embody new capabilities. Another factor for standards is that they may not be detailed enough such that implementations by different organizations are interoperable. A combination of best practices and standards may be required for certainty of interoperability.
Brokering data to form new products or services is not a new concept in the marine community. The promotion of standardized data and metadata services can be hastened via the use of community or commercial software. The SeaDataNet infrastructure combines metadata and data from over 20 data centers in a single portal. This is then used by EMODnet in data products. The ERDDAP software developed by NOAA is a different technical solution that enables the brokering of data between data centers with no separate dedicated infrastructure. An example based on OGC standards is the 52°North Sensor Web Suite, which provides an off the shelf OGC SWE capability. The concepts have been applied at the global scale by the International Oceanographic Data and Information Exchange (IODE) Ocean Data portal and by Group on Earth Observations (GEO) Global Earth Observation System of Systems (GEOSS) GEO Discovery and Access Broker (GEODAB). The GEODAB handles brokering of metadata and data, adapting formats to the user's discipline. A significant challenge with such brokering is ensuring unambiguous provenance and that definitive versions of data and metadata are provided as discussed in Democratization of data. Selected tools and software currently available in the marine community are summarized in Table 2.
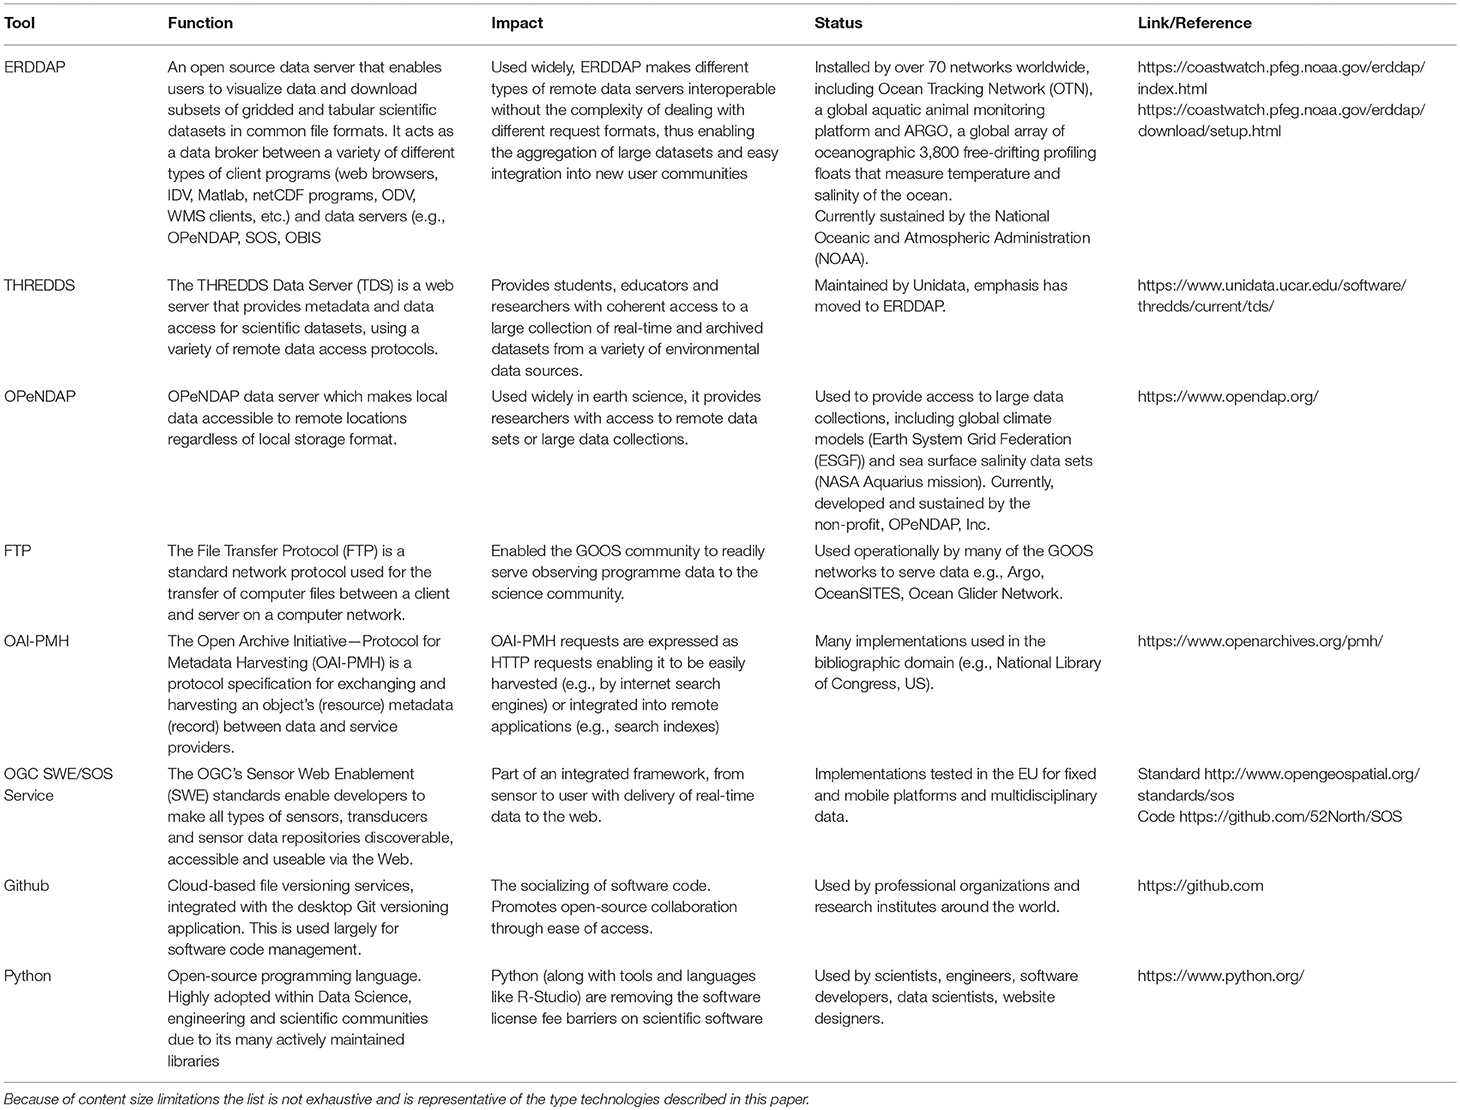
Table 2. Table summarizing selected tools and services applicable to the content presented in this paper.
When comparing open source and proprietary (closed source) software, different aspects need to be considered. The licenses for each type of software differ. While open source code is available to the public and can/must be freely shared, proprietary software's source code is usually only available to the vendor. In case of open source software, openness of the code allows community-driven development of new and extended versions. If a company offering a proprietary software package closes down, the development is usually discontinued (unless another entity acquires the rights to the software). In case of open source, the available source code facilitates the continuation of the development by other companies and organizations (even in-house development by companies using the software is possible). For both types of software there is often a broad range of companies providing professional support. Typical examples of open source software with broad support are PostgreSQL and the projects managed by the Apache Software foundation. In addition, developer communities are an additional source of (often free) support for open source software. In case of proprietary software, the support is usually provided by the vendor or authorized service providers with different levels of available (often paid) support packages. In either paradigm, if we are to depend on the software to give a stable operating environment, the creation process should be performed in a stable manner, guided by well-documented and accepted best practices.
Trends and the Future of Tools and Standards
The technologies and standards used to disseminate data must address the needs of both user communities and data integrators. The term “user communities” encompasses groups such as observation and data scientists, application and policy experts and teachers. Interfacing with all these groups will require collaboration between providers, users and standards communities. In pursuit of this goal, development is occurring on the World Meteorological Organization (WMO) Information System (the next step in the evolution of the Global Telecommunications System). Further, Global Ocean Observing System (GOOS) are defining and developing the EOVs, SeaDataNet and EMODNet are moving to cloud-based services and user-defined data products, IODE—which provides repositories for data, standards, best practices, and community adopted practices—agreed on CF-NetCDF formats. In addition to existing users, there are private sector actors who will readily use any freely available open data. To rally efforts to open and interlink distributed data stores, Wilkinson et al. (2016) introduced the FAIR data principles (Findable, Accessible, Interoperable, Reusable). The use of controlled vocabularies and ontologies, standardized data, and standardized access protocols, created either as standards or operationally adopted as best practices, are central to successfully implementing the FAIR principles to support widespread uptake and long-term use.
To open data as close to its source as possible, data and metadata standards are being applied closer to the sensor in the data life cycle. Monterey Bay Aquarium Research Institute (MBARI) has developed the OGC PUCK protocol, enabling a sensor to forward its own metadata in OGC SensorML format. The NeXOS project developed this further with the integration of optical and acoustic sensors on ocean gliders, profilers and vessels of opportunity (Delory et al., 2017; Ferdinand et al., 2017; Martinez et al., 2017; Memè et al., 2017; Pearlman et al., 2017b; Delory and Pearlman, 2018; Río et al., 2018; Simpson et al., 2018). Such technology will enable the automated installation, processing and dissemination of data via standard software suites and tools making the management and integrity of provenance metadata more robust. Adoption by industry has been slow, possibly because demand needs to come at the procurement stage as a broad requirement from marine community. Infrastructures like Ocean Observatories Initiative (OOI), North-East Pacific Time-series Undersea Networked Experiments (NEPTUNE), Integrated Marine Observing System (IMOS), and European Multidisciplinary Seafloor and water column Observatory (EMSO) can leverage this.
Due to decades of hardware miniaturization and widespread uptake, the majority of humans now carry a powerful connected computing platform. This technology has proved attractive not only because the devices are handheld, but also because their software has either adapted to people's interests or created new capabilities (e.g., communication, navigation through interactive maps, real-time news feeds, entertainment) at little or no cost (but with privacy concerns) and become agnostic to the diversity of operating systems. Attempts to reach out to the public with content related to ocean observation and community-targeted data products are addressed in End user engagement, while most web-based applications are now available or deployable on handheld devices with little effort. The relevance of developing yet another application now seems to only depend on the existence of an identified need or activity and a community of users (e.g., citizen scientists, teachers, surfers) eager to test a new application on their device and feel part of a community. There is a world of opportunities for new services and potential for crowdsourcing—not so much for the funding of new projects but rather engaging with a large number of users to process large sets of complex information, such as for classification of key ocean features—a process that remains difficult to automate. Features extracted by users from pictures could in turn be used to produce large training sets for automated classifiers.
Feeding new applications, federated datastores allow linking of distributed data collections. ERDDAP allows for federation of instances by linking them through APIs, controlled by the ERDDAP admin. The end result is that users can access data from multiple datastores from a single portal or API while the data remains within the control of the experts (data centers). A federated system should always serve the latest version of the data, thus solving the “multiple copies” issues found in a traditional distributed system. While federation between the same software (ERDDAP to ERDDAP) is straightforward, federating between different systems using different software is more complex and relies on mapped—or, preferably, synchronized and co-developed—vocabularies and ontologies which describe the data itself in a machine-readable way. Indeed, communities which are more advanced in semantic data science have federated these descriptive resources themselves. A key example from the life sciences can be found in the Open Biological and Biomedical Ontology (OBO) Foundry and Library22 Smith et al. (2007). This federation of coordinated and interoperable ontologies is guided by common development principles and core software, providing a relatively stable system for linking data. Through OBO ontologies such as the Environment Ontology (Buttigieg et al., 2016), which is coordinating content with standards such as the US Coastal and Marine Ecological Classification Standard23 (CMECS) and the GOOS EOV Panels, this federation is now providing resources and best practices to support future innovation in ocean observation.
Ontologies provide the bridge between expert knowledge and the world of Open Linked Data, which is one of the core pillars of the Semantic Web, or Web of Data. The Semantic Web functions through links between datasets, understandable to machines as well as humans. Linked Data, a set of design principles for sharing machine-readable interlinked data on the web24, provides the best practices for making these links possible.
A representative feature of linked data technology is the use of URLs, URIs, and IRIs as the unique, web-accessible data object identifiers, rather than simple textual names, which are prone to confusion across disciplines and systems. These function much like DOIs, but Linked Data URIs resolve to standardized formats (typically encoded in RDF) which describe their content to machine agents using ontologies and controlled vocabularies. Further, Linked Data stores can include links to other linked data URIs, providing structured access to complementary data and boosting discoverability. As a valuable bridge to practical ocean observing hardware such as sensor systems, the joint W3C (World Wide Web Consortium) and OGC (Open Geospatial Consortium) Spatial Data on the Web (SDW) Working Group developed a set of ontologies (SSN/SOSA) to describe sensors, actuators and samplers as well as their observations, actuation and sampling activities. Annotating sensor metadata and datasets with W3C-defined ontologies and domain-specific vocabularies and ontologies enhances discoverability, understanding and integration with other linked data. In the SenseOcean project, British Oceanographic Data Centre (BODC) used content negotiation to provide either SensorML, or Semantic Sensor Network (SSN) descriptions of sensor metadata. In the next decade, efforts to bridge these various activities and development communities must be intensified to provide thorough semantic alignment (so that the use of each solution can be evenly understood by machine agents) and, consequently, reliable data exchange. Upon this basis, oceanographic data will be more readily and coherently linkable to data in other domains such as socio-economics, governance25 and health [e.g., The Monarch Initiative26 (Mungall et al., 2017)], which are also adopting similar semantic standards.
Together, responsive, integrated, and expressive vocabulary and semantic services will not only allow data to be effectively linked within ocean science, but also to policy-relevant reporting frameworks as they emerge. This is key to ensuring that the products of ocean observing reach decision makers (and the data systems they interface with) in a timely and understandable form. Currently, the Essential Variables for the Ocean, Climate, and Biodiversity [EOVs, (Lindstrom et al., 2012) ECVs (Bojinski et al., 2014), and EBVs (Navarro et al., 2017), resp.] are important global targets to bridge observation, science, and policy in the marine domain. These variables have been selected to provide core insight into the planet's functioning in order to support policy development and assessment, compatible with local and regional frameworks. Through coordination projects such as AtlantOS27, many of these variables have been mapped to the CF and P01 resources (Koop-Jakobsen et al., 2016) and their interrelations (Miloslavich et al., 2018; Muller-Karger et al., 2018) are being resolved and expressed in machine-actionable semantic resources for planetary science such as The Environment Ontology ENVO; Buttigieg et al. (2016).
Promisingly, these initiatives are converging with similar interoperability solutions emerging in policy-focused domains. For example, the UN Environment Sustainable Development Goals Interface Ontology [SDGIO; UNEP (2015); Buttigieg PL et al. (2016)] uses OBO-compliant semantic web technology to create an interface between observational data sources and the indicators of the global Sustainable Development Agenda for 2030 (UN, 2015), including those for ocean health and biodiversity (SDG 14). Such connections will be key in linking diverse marine data to global reporting frameworks in the upcoming UN Decade of Ocean Science for Sustainable Development28.
Machine-readability is the bridge to machine intelligence. With the advent of big data technology and development of SMART cities, artificial intelligence (AI) algorithms are being developed to automate routine decisions such as traffic control and adaptive public transport loading. Such concepts are transferable to marine applications such as SMART ports or SMART sea areas and the role of AI could include regulatory monitoring of hazards or pollution, reducing their cost.
Machine Learning is a branch of AI concerned with developing computer models that “learn” from data by analyzing existing data sets. These models can then be used to identify similar objects or patterns in other data. Currently the main application of AI is to identify objects in images, for example the use of Convoluted Neural Networks to automatically identify benthic types in coral reef survey images (Gonzalez-Rivero et al., 2016). New approaches are being trialed in numeric data where patterns in long-term environmental time series are being transcoded to a form that the AI can model and learn (Shang et al., 2014). The resulting models are able to identify underlying patterns in large volumes of data. These patterns may represent errors in the data, meaning that the AI is performing quality control, or they may represent interesting or new phenomena, making the AI an event detection agent. Machine Learning, by identifying patterns within data, provides new pathways for knowledge generation and in particular provides a new tool for dealing with large complex data sets.
In September 2018 Google launched its new dataset search service29. Similar to how Google Scholar works, Dataset Search lets you find datasets wherever they are hosted, whether on a publisher's site, a digital library, or an author's personal web page. The approach is based on the schema.org standard described in Table 1 with clear guidelines for data providers. This represents a significant step toward the implementation of universal dataset discovery, and an interface for the ocean standards discussed above.
End User Engagement
The scope for high-throughput measurements of the marine environment has greatly increased in recent years, both for physical and chemical oceanography (OceanSITES, ARGO etc.) but also, more recently, for the observation of marine biodiversity. The increasing number of remotely operated sensors/sensor networks and the greater range of parameters coupled with more advanced observation technology, such as those based on molecular or imaging sensors to generate biodiversity data (Buttigieg et al., 2018; Stern et al., 2018), have also considerably increased our potential for analyzing a greater range of complex environmental/climate change related topics.
This means that data can, in theory, also usefully serve a larger number of potential end users. These include the scientific community, conservation practitioners and citizen scientists but also actors at the science-policy interface, who require more detailed monitoring of ocean processes to satisfy important policy drivers, such as the Marine Strategy Framework Directive (European Commission, 2008) or activities addressing, in a broader sense, the UN Sustainable Development Goals goals and targets for managing biodiversity (e.g., the AICHI targets). The latter require the development of National Biodiversity Action Plans, which in turn necessitate the collation and integration of biodiversity data sets from a range of disparate sources deploying different sample collection and analysis pipelines as well as different archival mechanisms with associated data management, analysis, archival and visualization issues.
However, the data sets emanating from a range of different measuring devices, particularly in the field of biology and ecology, while holding great analytical potential, also have increasingly complex metadata and are therefore not easily interpretable. To deal with these complexities, biodiversity-based long-term observation networks, such as Long-Term Ecological Research (LTER)/International LTER (ILTER), have already been established, although they are not yet dealing directly with issues around the integration of sensor-based high throughput data and their visualization and interpretation (and their marine component is currently relatively small).
User engagement therefore has to go beyond generating an interest into given data sets or research results. Indeed, the process of user engagement has become much more complex. It can include early consultation processes during the development phase of data systems and products (e.g., surveys, questionnaires, stakeholder meetings). Most importantly however, user engagement also encompasses the responsibility to ensure that data are correctly understood by different end users. This makes it necessary to monitor, document and archive (using standardized metadata protocols) all elements of the data lifecycle, from sampling protocols via the properties, precision and accuracy of different sensors to archiving in accepted repositories such as Pangaea or EMODnet's GEOSS Portal, and to make relevant metadata available in a well-organized and transparent form relevant to potential end users (Koppe et al., 2015).
The tailoring of products, whether observations or information, also needs to promote user uptake and employment of products. While this is supported by standards and best practices, the interface logic must be simple and intuitive. The data needs to come in widely-used, stable formats. In addition, access interfaces (which address both discovery and access of data and information) should also be intuitive. Users prefer widely accepted methodologies and formats.
Once such mechanisms are in place, data products can be tailored to different audiences, from the research community to the public to political stakeholders and those with reporting duties in support of different policy drivers.
In this way, we can enable existing and emerging observation and analysis networks, such as the European Ocean Observing system (EOOS), other regional ocean observing networks or IOC-UNESCO's TrendsPO, to deliver good data and data products maximizing the output from the largest possible number of data sources. Some examples of advanced data products for “manual” and/or sensor-based time series as well as other types of data, based on agreed and transparent metadata standards, already exist.
Use Cases
Deep Sea Observatories: Fram/Hausgarten (e.g., Soltwedel et al., 2013)
The mission of the FRAM programme (FRontiers in Arctic Marine Monitoring) is to support synchronous, year-round, integrated system observation in the Fram Strait and Central Arctic. The Fram Strait connects the North Atlantic and the Arctic Ocean, one of the fastest changing marine regions on Earth. Unlike the shallow water conjunction to the Pacific, this connection reaches 5,569 meters in depth and is thus the main region for exchange of water between the Arctic and the Atlantic Ocean. Cutting edge technologies are being used and developed to record EOVs to improve our understanding of the Arctic and its unique phenomena. FRAM consists of two Alfred Wegener Institute (AWI) long-term (~20 years) mooring observatories in the West Spitsbergen Current and HAUSGARTEN, and involves a modern vision of integrated underwater infrastructure. Stationary devices are complemented with diverse mobile components such as deep-sea robots, ice buoys, and autonomously operating underwater robots that operate beyond HAUSGARTEN into the Norwegian Sea and the Arctic Ocean. FRAM technology provides large amounts of data. Building on this, FRAM now enhances sustainable knowledge for science, society and the maritime economy as it enables truly year-round observations from surface to depth in the remote and harsh Arctic Sea.
The sheer number and complexity of research platforms and their respective devices and sensors, along with heterogeneous project-driven requirements toward satellite communication, sensor monitoring, quality assessment and control, processing, analysis, and visualization led AWI to build the generic and cost-effective virtual research infrastructure O2A to enable the flow of sensor Observations to Archives. O2A is comprised of several extensible and exchangeable components as well as various interoperability services and is meant to offer practical solutions that support the typical scientific workflow, from data acquisition activities until the very last data publication.
Examples of O2A components are:
1. SENSOR and STREAM components designed to provide metadata on platforms, instruments and sensors along with near real-time data transfer solutions (currently more than 1,100 sensors have been registered);
2. DASHBOARD component offering dashboard-oriented monitoring solutions, which include graphing and mapping widgets among others;
3. VIEWER offering map-based visualization and analysis solutions;
4. repositories PANGAEA and EPIC for data and publications, respectively;
5. DATA portal as a one-stop shop web interface for disseminating scientific content associated with research platforms and thematically grouped data and data products.
In FRAM, and other multi-instrument, multi-user international projects based on O2A, the end user can rely on quality-controlled data with well-described, standardized metadata and can create custom graphics, data, images and text panels, etc. In each data panel the user can freely recombine available data, choose time periods and data granularity for their plots. They can also generate simple descriptive statistics. This facilitates easy data exploration and a means of quality control turning sensor diversity into an advantage. These combined data are an important basis for scientific studies, are supporting computer simulations of the Arctic ecosystem and improve validations of remote sensing products.
Coastal Observing System for Northern and Arctic Seas (COSYNA) (Baschek et al., 2017)
The COSYNA Observing System for Northern and Arctic Seas30 (COSYNA) comprises a variety of terrestrial and underwater sensor systems for monitoring the marine coastal environment of the North Sea and Arctic Ocean. Both areas are “hot spots” with respect to global change in biodiversity and climate. The COSYNA system integrates a wide range of different sensor types, from coastal radar remote-sensing installations (to monitor currents in a large area) via ocean gliders (to scan a larger water body in situ) to specific fixed installations like poles, autonomous landers or cabled underwater observatories to monitor changes and dynamics in a specific marine environment (Baschek et al., 2017; Eschenbach, 2017). The COSYNA sensors are designed to be as close to fully automated as possible to provide real or near-real time information, short-term forecasts and additional data products. Closely related to the development of new sensor types and sensor carrier systems, improved methods and algorithms are developed to improve the quality of remote-controlled sensor data with a specific focus on a better understanding of the interdisciplinary interactions between physics, biogeochemistry and the ecology of coastal seas. Within this framework, new modeling and data assimilation techniques are also developed to better integrate observations and models in a quasi-operational system providing descriptions and forecasts of key hydrographic variables.
A key feature of COSYNA (as for FRAM) is that all data and data products have received automated quality control with quality control flags assigned accordingly and are freely available via the COSYNA portal. Detailed metadata descriptions are also available for each sensor. The end user can combine different types of data e.g., chlorophyll from sensors and remote sensing to produce map visualizations of the parameter in a given area. In addition, selected data from the COSYNA network are used to produce advanced products such as models of current fields in the German Bight, which are also freely available as time series.
The COSYNA system was implemented between 2010 and 2014 and has been followed up in further monitoring projects like ACROSS (2014–2018) and MOSES31 (2017—ongoing). All these projects have the central requirement that data coming from the different sensors must be shared across disciplines and therefore must meet the requirements of FAIR (Findable, Accessible, Interoperable, Reusable) datasets.
In addition to these complex integrated data systems, some specialized data products have also been developed that deal with a small number of parameters from very diverse data sources and providers, which have included considerable user engagement. One example is the IGMETS portal32, which hosts visualization tools for hundreds of plankton time series at a global scale. Development of this portal involved input from two expert groups in the International Council for the exploration of the seas (ICES) and members of an IOC UNESCO working group but also included individual providers of biological, statistical and oceanographic expertise.
EMSO-Obsea: Cabled Underwater Coastal Observing System for Western Mediterranean (Aguzzi et al., 2011)
The Obsea observatory was deployed in 2009 with two main objectives: to study and monitor coastal process and biological habitat at the Catalan coast, and secondly to become a reference underwater test site for new instruments, sensors and also as a test site for new data communication protocols and data management (Río et al., 2014). The Obsea data management system is dealing with many different types of data, mainly physical parameters and biological indicators using video cameras. The observatory is already monitoring real time underwater noise and seismometry. Many interoperability experiments have been carried out using the observatory with the data produced available through European repositories such as EMODnet33 or via public datasets in Pangaea34. This highlights the importance of generating unique identifiers (DOI) for data produced during an experiment where the same data may be held in multiple systems.
Vision for the Future
This paper has covered a broad range of themes, from introducing the democratization of data, to requirements around the integrity of data, describing enabling technologies, and actual use cases. This section summarizes the main points as succinct vision statements.
• Data and metadata are available via standards-based secured API's, using FAIR principles to define data services, to enable new and existing communities to develop their own bespoke web portals, applications, and value-add systems, based on a single digitally-signed quality-controlled data source, to deliver greater uptake, use and value from the collected data.
• Data sets, models and data products are uniquely identified using Digital Object Identifiers (DOI's), digitally signed using certificates to identify source and provenance (including identifying the definitive version of a data set), quality controlled using documented best practice systems (including Quality Control as a Service—QCaaS) with the QC data traveling with or linked to the source data, full machine readable metadata available that includes appropriate use and attribution, as source components of new work-flows.
• Common harmonized standards and reference models, including test and validation environments, for describing metadata and data, allowing interoperability between different communities and disciplines.
• Users can access, extract and understand an unambiguous provenance for all types of data used, versions it originated from and other versions it has been incorporated into, to increase trust into the data and enhance usability.
• New information workflows, based on a standards-based service-based architecture, to move from a portal to a services-based model where users pull knowledge rather than consume pre-built products and so data is used and value added beyond its initial scope and discipline. This will have implications for data provenance, quality control, licensing and appropriate use.
• New methods for data discovery and access, such as discovery and aggregation of data via commercial search engines, continued development of open extensible platforms, such as Google Earth, and the development of sophisticated knowledge clients, including mobile apps, to replace the current Portal-and-Download model, to simplify and extend access for new and existing users
• To have a modular network/system aware of its distributed parts, which can be easily extended by non-technical users—“run this app and extend the network.”
• Integration of advances in Artificial Intelligence (AI) and automated Machine Learning (ML) into information work-flows to deliver new possibilities to users in understanding complex data patterns and relationships within large data volumes and diverse data streams.
• The development of marine observing networks will increasingly be driven by the need to provide decision making information on government and economic matters. The emergence of large arrays of unmanned vehicles that are nimble in deployment, maintenance and low in cost will present unprecedented data coverage.
• Business models that allow manufacturers and commercial partners to use sensor-level standards, enabling users to easily retrieve and understand information directly from sensors. This will help build the foundation for new SMART data flows.
• When of interest to a non-specialist community (decision makers, the public at large), data products will increasingly be accessed from a remote cloud-based software process. Application functionalities will multiply as software (including APIs) becomes multi-platform and accessible by anyone, from anywhere (e.g., selectable from any device, service, and application, from smart devices to virtual research environments). Software development companies are likely to show interest in this usage, and as a result, user requirements will become key in the process of designing and developing new, more user-oriented, software.
• Development and implementation of standards for the securing and hardening of communication protocols (cyber-security) for robust platform communication, from sensor through to publication, as a means to ensure and document data provenance and traceability and to build trust in the source data.
• Full transparency for data use and uptake so that data providers will be able to readily determine the impact of their open datasets through cited reference searches within the academic literature, data download statistics and metrics and data service use when added to operational models. Such metrics will help build the case for sustained funding of observation networks and enable engagement with the full user community of a dataset.
Recommendations
The value of ocean data is in their uptake and use and in the subsequent value they add to individuals, organizations, Governments and custodians. This paper recommends the development of new data frameworks, information flows and knowledge pathways to deliver the understanding required to sustain, manage and protect our oceans. In particular the paper recommends the following actions and outcomes:
Sharing of Data Standards and Best Practices
The development of open source testing suits and benchmarking tools which allow for developing new data workflows, operationalizing standards, and publishing best practice. This development needs to be in partnership with commercial sensor manufacturers to increase uptake. Such tools will need to use the concept of data brokers and federating services to facilitate data interoperability and bring together the various providers (including commercial and user communities). An example of such a set-up would be an end to end federated network of quality control services.
Data Services
To move beyond data portals to service-based architectures that combine data provenance, persistence and security (both physical and cyber). These architectures should empower communities to develop services that serve their specific needs while maintaining data interoperability by utilizing the idea of data brokers and federated services. A demonstrator to show end to end data and information delivery via web services, as a direct replacement for a portal style of access, should be used as a means of educating the marine community around service-based architectures.
Sustainability of Infrastructure and Services
Standards, platforms and data services that have been adopted by scientific communities should be supported through the fostering of active support groups. With active engagement of the communities that depend on these tools, the burden of support, documentation and user engagement can be shared to reduce the overhead on a single entity. Stovepipes of brilliance should be exposed and celebrated through this mechanism of community embracement, instead of being punished through additional documentation and support requirements during the process of adoption beyond their original user community.
Data Standards and Best Practices
Continue the work on standards including the rationalization of standards and best practices, identifying gaps, and links between standards and best practices. Recognition of the need for standard persistent identifiers for sensors, data sets, models, and products. Implement governance arrangements, facilitate an interaction with the commercial sector, and work to bring new technologies and frameworks (such as the IoT and mid-level TRL technologies) into the standards process. Continue efforts toward building and disseminating ideas around best practice and the FAIR principles for data access and use.
End User Engagement
To deeply engage with a range of end users, including the commercial sector (including data companies such as Google, Microsoft and Amazon, instrument manufacturers and commercial information users such as the marine consulting industry) to understand their needs, to engage with them as potential solution providers and to partner with the larger data and informatics community around projects of common interest.
Engagement With International Web and Standards Organizations
To engage with international web and standards organizations (Microsoft, Google, data aggregators, Open Geospatial Consortium, World Wide Web Consortium, etc.) at the international coordination level (IODE/IOC/GOOS/WMO). This would enable alignment of IT infrastructure, standards and best practices beyond the marine and scientific domains, the sharing of expertise specific to environmental (ocean) data, and enable philanthropic exposure of data including reaching out to new users.
Close
The coming decade will see increased pressure on the world's oceans and the systems they sustain as the impacts of climate change and other pressures, such as overfishing, pollution and coastal development, come to bear. Responding to threats such as the predicted increase in frequency and impact of coastal storms, the impact of rising sea levels, of increased frequency of coral bleaching and the mostly unknown impacts of ocean acidification, will require not only new data but new ways of delivery quality actionable information and ultimately the knowledge required to make sound decisions. While the threats to our oceans are increasing, so is the technology to capture and store data, to process data into information, and to contextualize and deliver this as knowledge.
This paper has articulated the types of frameworks, standards, systems and processes required to move beyond portals to truly democratize ocean data, contextualized by measures of data quality and security, to deliver the information and knowledge required to manage our oceans into the future. The decadal challenge is to build these systems, along with the governance, business and political environments that sustains them, to deliver the required knowledge to sustain and protect our oceans.
Author Contributions
This paper is a collaborative effort by all co-authors. The paper structure along with Introduction, Vision for the future, Recommendations, and Close where produced collaboratively by the full authorship of this paper. Other sections were primarily produced and led by sub-teams within the author list. Democratization of data was primarily produced by SB, EB, and ED. User Trust—Data integrity and security was primarily produced by EB, MC, KC, and RH. Enabling technologies was primarily produced by JB, EB, JD, ED, JP, AK, LD, SJ, TG, and PB. End user engagement was primarily produced by ACK, KM, PF, ML, PB, and IS. The production of the paper was coordinated by JB and JP.
Funding
Paper publication costs were supported by NERC National Capability funding. Involvement by JB and JP in the this paper was supported by funding from the European Union's Horizon 2020 research and innovation program under grant agreement No 633211 (AtlantOS).
Conflict of Interest Statement
The authors declare that the research was conducted in the absence of any commercial or financial relationships that could be construed as a potential conflict of interest.
Acknowledgments
The authors thank Paul McGarrigle (NOC) for assistance with the editing, and Roger Proctor (IMOS) for reviewing the paper ahead of submission. This is NOAA/OAR/PMEL Contribution number 4884. Involvement by JB in the this paper was supported by funding from the European Union's Horizon 2020 research and innovation program under grant agreement No 633211 (AtlantOS). PB's contributions was supported by funding from the HGF Infrastructure Programme FRAM of the Alfred-Wegener-Institut, Helmholtz-Zentrum für Polar- und Meeresforschung.
Footnotes
1. ^https://podaac.jpl.nasa.gov/SeaSurfaceTemperature
3. ^http://www.emodnet.eu/med-sea-checkpoints
4. ^http://www.emodnet.eu/northsea/home
5. ^https://scholar.google.com/
6. ^https://www.accuweather.com/
8. ^https://www.google.com.au/earth/
9. ^http://www.oceanbestpractices.org
10. ^https://public.ccsds.org/pubs/650x0m2.pdf
11. ^https://www.icsu-wds.org/services/certification
12. ^https://spectrum.ieee.org/static/special-report-blockchain-world
13. ^https://www.ncei.noaa.gov/
14. ^https://www.earthcube.org/
15. ^https://www.seadatanet.org/
18. ^https://portal.aodn.org.au/
20. ^http://cfconventions.org/Data/cf-standard-names/58/build/cf-standard-name-table.html
21. ^http://vocab.nerc.ac.uk/collection/P01/current/PSALST01/
22. ^http://www.obofoundry.org/
23. ^https://cmecscatalog.org/
24. ^https://ontotext.com/knowledgehub/fundamentals/linked-data-linked-open-data/
25. ^https://ukparliament.github.io/ontologies/
26. ^https://monarchinitiative.org/
27. ^https://www.atlantos-h2020.eu
28. ^https://en.unesco.org/ocean-decade
29. ^https://toolbox.google.com/datasetsearch
30. ^https://www.hzg.de/institutes_platforms/cosyna/index.php.de
31. ^https://moses.geomar.de/de
32. ^www.igmets.net
33. ^http://www.emodnet-physics.eu/Map/platinfo/piroosplot.aspx?platformid=8805&7days=true
References
Aguzzi, J., Manuel, A., Condal, F., Guillen, J., Nogueras, M., Del Rio, J., et al. (2011). The new seafloor observatory (OBSEA) for remote and long-term coastal ecosystem monitoring. Sensors 11, 5850–5872. doi: 10.3390/s110605850
Baschek, B., Schroeder, F., Brix, H., Riethmuller, R., Badewien, T. H., Breitbach, G., et al. (2017). The coastal observing system for northern and arctic seas (COSYNA). Ocean Sci. 13, 379–410. doi: 10.5194/os-13-379-2017
Bojinski, S., Verstraete, M., Peterson, T. C., Richter, C., Simmons, A., and Zemp, M. (2014). The concept of essential climate variables in support of climate research, applications, and policy. Bull. Am. Meteorol. Soc. 95, 1431–1443. doi: 10.1175/BAMS-D-13-00047.1
Buttigieg PL, W. R., Jensen, M., and Mungall, C. J. (2016). “Environmental semantics for sustainable development in an interconnected biosphere,” in Seventh International Conference on Biomedical Ontology (ICBO). (Corvallis, OR).
Buttigieg, P. L., Fadeev, E., Bienhold, C., Hehemann, L., Offre, P., and Boetius, A. (2018). Marine microbes in 4D-using time series observation to assess the dynamics of the ocean microbiome and its links to ocean health. Curr. Opin. Microbiol. 43, 169–185. doi: 10.1016/j.mib.2018.01.015
Buttigieg, P. L., Pafilis, E., Lewis, S. E., Schildhauer, M. P., Walls, R. L., and Mungall, C. J. (2016). The environment ontology in 2016: bridging domains with increased scope, semantic density, and interoperation. J. Biomed. Semant. 7:57. doi: 10.1186/s13326-016-0097-6
Coppini, G., Marra, P., Lecci, R., Pinardi, N., Cretì, S., Scalas, M., et al. (2017). SeaConditions: a web and mobile service for safer professional and recreational activities in the Mediterranean Sea. Nat. Hazards Earth Syst. Sci. 17, 533–547. doi: 10.5194/nhess-17-533-2017
Delory, E., Meme, S., Cervantes, P., Ruiz, P., Casale, A., Figoli, A., et al. (2017). “New compact passive digital acoustic sensor devices with embedded preprocessing,” in Oceans 2017. (Aberdeen).
Delory, E., and Pearlman, J. (2018). Challenges and Innovations in Ocean In Situ Sensors. Cambridge: Elsevier. Available online at: https://www.elsevier.com/books/challenges-and-innovations-in-ocean-in-situ-sensors/delory/978-0-12-809886-8
EGO gliders data management team (2017). EGO Gliders NetCDF Format Reference Manual Version 1.2. doi: 10.13155/34980
Eschenbach, C. A. (2017). Bridging the gap between observational oceanography and users. Ocean Sci. 13, 161–173. doi: 10.5194/os-13-161-2017
European Commission (2008). Directive 2008/56/EC of the European Parliament and of the Council of 17 June 2008 Establishing a Framework for Community Action in the Field of Marine Environmental Policy (Marine Strategy Framework Directive) (Text with EEA relevance). OJ L 164, 25.6.2008, 19–40 (BG, ES, CS, DA, DE, ET, EL, EN, FR, IT, LV, LT, HU, MT, NL, PL, PT, RO, SK, SL, FI, SV). Special edition in Croatian: Chapter 15. 026, 136–157.
Ferdinand, O. D., Friedrichs, A., Miranda, M. L., Voss, D., and Zielinski, O. (2017). “Next generation fluorescence sensor with multiple excitation and emission wavelengths - NeXOS MatrixFlu-UV,” in Oceans 2017. (Aberdeen).
Fielding, R. T. (2000). Architectural Styles and the Design of Network-based Software Architectures. Doctor of Philosophy, University of California, Irvine.
Gonzalez-Rivero, M., Beijbom, O., Rodriguez-Ramirez, A., Holtrop, T., Gonzalez-Marrero, Y., Ganase, A., et al. (2016). Scaling up ecological measurements of coral reefs using semi-automated field image collection and analysis. Remote Sensing 8:30. doi: 10.3390/rs8010030
Kissel, R., Stine, K., Scholl, M., Rossman, H., Fahlsing, J., and Gulick, J. (2008). Security Considerations in the System Development Life Cycle. Gaithersburg, MD: National Institute of Standards and Technology.
Koop-Jakobsen, K., Waldmann, C., Huber, R., Harscoat, V., and Pouliquen, S. (2016). Data Harmonization Report: Report Containing Recommendation on Data Harmonization. AtlantOS. Available online at: https://www.atlantos-h2020.eu/project-information/work-packages/deliverables/
Koppe, R., Gerchow, P., Macario, A., Haas, A., Schafer-Neth, C., and Pfeiffenberger, H. (2015). “O2A: a generic framework for enabling the flow of sensor observations to archives and publications,” in Oceans 2015. (Genova).
Lindstrom, E., Gunn, J., Fischer, A., Mccurdy, A., and Glover, L. K. (2012). A Framework for Ocean Observing. By the task team for an Integrated Framework for Sustained Ocean Observing. Paris: UNESCO.
Liubartseva, S., Coppini, G., Pinardi, N., De Dominicis, M., Lecci, R., Turrisi, G., et al. (2016). Decision support system for emergency management of oil spill accidents in the Mediterranean Sea. Nat. Hazards Earth Syst. Sci. 16, 2009–2020. doi: 10.5194/nhess-16-2009-2016
Martinez, E., Toma, D. M., Jirka, S., and Del Rio, J. (2017). Middleware for Plug and Play Integration of Heterogeneous Sensor Resources into the Sensor Web. Sensors 17:2923. doi: 10.3390/s17122923
Memè, S., Delory, E., Felgines, M., Pearlman, J., Pearlman, F., Del Rio, J., et al. (2017). “NeXOS-next generation, cost-effective, compact, multifunctional web enabled ocean sensor systems,” in OCEANS 2017. (Anchorage, AK).
Miloslavich, P., Bax, N. J., Simmons, S. E., Klein, E., Appeltans, W., Aburto-Oropeza, O., et al. (2018). Essential ocean variables for global sustained observations of biodiversity and ecosystem changes. Global Change Biol. 24, 2416–2433. doi: 10.1111/gcb.14108
Muller-Karger, F. E., Miloslavich, P., Bax, N. J., Simmons, S., Costello, M. J., Sousa Pinto, I., et al. (2018). Advancing marine biological observations and data requirements of the complementary essential ocean variables (EOVs) and essential biodiversity variables (EBVs) frameworks. Front. Marine Sci. 5. doi: 10.3389/fmars.2018.00211
Mungall, C. J., Mcmurry, J. A., Köhler, S., Balhoff, J. P., Borromeo, C., Brush, M., et al. (2017). The Monarch Initiative: an integrative data and analytic platform connecting phenotypes to genotypes across species. Nucleic Acids Res. 45, D712–D722. doi: 10.1093/nar/gkw1128
Nativi, S., Craglia, M., and Pearlman, J. (2013). Earth science infrastructures interoperability: the brokering approach. J. Select. Topics Appl. Earth Observ. Remote Sensing 6, 1118–1129. doi: 10.1109/JSTARS.2013.2243113
Navarro, L. M., Fernández, N., Guerra, C., Guralnick, R., Kissling, W. D., Londoño, M. C., et al. (2017). Monitoring biodiversity change through effective global coordination. Curr. Opin. Environ. Sustain. 29, 158–169. doi: 10.1016/j.cosust.2018.02.005
Ocean SITES data management team (2010). OceanSITES User's Manual. NetCDF Conventions and Reference Tables. doi: 10.13155/36148
Pearlman, J., Luigi Buttigieg, P., Simpson, P., Muñoz, C., Hesop, E., and Hermes, J. (2017a). “Accessing existing and emerging best practices for ocean observation, a new approach for end-to-end management of best practices,” in Oceans 2017. (Anchorage).
Pearlman, J., Pearlman, F., Ferdinand, O., Zielinski, O., Delory, E., Meme, S., et al. (2017b). “NeXOS, developing and evaluating a new generation of in-situ ocean observation systems,” in Oceans 2017. (Aberdeen).
Río, J. D., Toma, D. M., Martínez, E., O'reilly, T. C., Delory, E., Pearlman, J. S., et al. (2018). A sensor web architecture for integrating smart oceanographic sensors into the semantic sensor web. J. Oceanic Eng. 43, 830–842. doi: 10.1109/JOE.2017.2768178
Río, J. D., Toma, D. M., Reilly, T. C. O., Bröring, A., Dana, D. R., Bache, F., et al. (2014). Standards-based plug & work for instruments in ocean observing systems. J. Oceanic Eng. 39, 430–443. doi: 10.1109/JOE.2013.2273277
Shang, C., Yang, F., Huang, D. X., and Lyu, W. X. (2014). Data-driven soft sensor development based on deep learning technique. J. Proc. Control 24, 223–233. doi: 10.1016/j.jprocont.2014.01.012
Simpson, P., Pearlman, F., and Pearlman, J. (2018). Evolving and Sustaining Ocean Best Practices Workshop, 15–17 November 2017. Paris: Intergovernmental Ocean Commission, 74. doi: 10.25607/OBP-3
Smith, B., Ashburner, M., Rosse, C., Bard, J., Bug, W., Ceusters, W., et al. (2007). The OBO Foundry: coordinated evolution of ontologies to support biomedical data integration. Nat. Biotechnol. 25, 1251–1255. doi: 10.1038/nbt1346
Soltwedel, T., Schauer, U., Boebel, O., Nöthig, E.-M., Bracher, A., Metfies, K., et al. (2013). “FRAM-FRontiers in Arctic marine Monitoring Visions for permanent observations in a gateway to the Arctic Ocean,” in OCEANS-Bergen, (Bergen: MTS/IEEE), 1–7. doi: 10.1109/OCEANS-Bergen.2013.6608008
Stern, R., Kraberg, A., Bresnan, E., Kooistra, W. H. C. F., Lovejoy, C., Montresor, M., et al. (2018). Molecular analyses of protists in long-term observation programmes-current status and future perspectives. J. Plankton Res. 40, 519–536. doi: 10.1093/plankt/fby035
Terzo, O., Ruiu, P., Bucci, E., and Xhafa, F. (2013). “Data as a Service (DaaS) for sharing and processing of large data collections in the cloud,” in 2013 Seventh International Conference on Complex, Intelligent, and Software Intensive Systems (Cisis), (Washington DC) 475–480. Available online at: https://dl.acm.org/citation.cfm?id=2546189
UNEP (2015). Clarifying Terms in the SDGs: Representing the Meaning Behind the Terminology. United Nations.
Wilkinson, M. D., Dumontier, M., Aalbersberg, I. J., Appleton, G., Axton, M., Baak, A., et al. (2016). Comment: The FAIR guiding principles for scientific data management and stewardship. Sci. Data 3:160018. doi: 10.1038/sdata.2016.18
Ziveri, P. (2014). MedSea project - final report. Universitat Autònoma de Barcelona. European Commission – Cordis. Available online at: https://cordis.europa.eu/project/rcn/97645/reporting/en
Keywords: data standards, data democratization, end user engagement, data innovation, data integrity
Citation: Buck JJH, Bainbridge SJ, Burger EF, Kraberg AC, Casari M, Casey KS, Darroch L, Rio JD, Metfies K, Delory E, Fischer PF, Gardner T, Heffernan R, Jirka S, Kokkinaki A, Loebl M, Buttigieg PL, Pearlman JS and Schewe I (2019) Ocean Data Product Integration Through Innovation-The Next Level of Data Interoperability. Front. Mar. Sci. 6:32. doi: 10.3389/fmars.2019.00032
Received: 31 October 2018; Accepted: 21 January 2019;
Published: 28 February 2019.
Edited by:
Sanae Chiba, Japan Agency for Marine-Earth Science and Technology, JapanReviewed by:
Lluis Gomez-Pujol, Universitat de les Illes Balears, SpainAthanasios Kampas, Agricultural University of Athens, Greece
Copyright © 2019 Buck, Bainbridge, Burger, Kraberg, Casari, Casey, Darroch, Rio, Metfies, Delory, Fischer, Gardner, Heffernan, Jirka, Kokkinaki, Loebl, Buttigieg, Pearlman and Schewe. This is an open-access article distributed under the terms of the Creative Commons Attribution License (CC BY). The use, distribution or reproduction in other forums is permitted, provided the original author(s) and the copyright owner(s) are credited and that the original publication in this journal is cited, in accordance with accepted academic practice. No use, distribution or reproduction is permitted which does not comply with these terms.
*Correspondence: Justin J. H. Buck, anVja0Bib2RjLmFjLnVr