 Michelle J. Devlin1*
 Mark Breckels1
 Carolyn A. Graves1Jon Barry1Elisa Capuzzo2Francisco P. Huerta3Fahad Al Ajmi3
 Mona M. Al-Hussain3William J. F. LeQuesne1
 Brett P. Lyons2
- 1Centre for Environment, Fisheries and Aquaculture Science, Lowestoft, United Kingdom
- 2Centre for Environment, Fisheries and Aquaculture Science, Weymouth, United Kingdom
- 3Kuwait Environment Public Authority, Safat, Kuwait
This assessment of environmental drivers and phytoplankton community in Kuwait (Arabian Gulf) describes changes in environmental conditions linked to the rapid urbanization over recent decades. To describe these changes, we have analyzed a long-term water quality dataset (1984–2017) and explored potential changes in a sub-set of phytoplankton community data by analyzing 10 years of phytoplankton data available (2007–2016) for Kuwait Bay and the Northern Gulf waters. The longer-term water quality data show that dissolved nutrient concentrations, with the exception of a recent fall in SiO4, have been increasing over 30 years, but with a high degree of variability reflecting the changing rate of inputs from river outflows and point sewage sources. The correlative analysis between the environmental parameters and phytoplankton in the period from 2007 to 2016 shows that the seasonal variability of the phytoplankton are influenced by several co-stressors including higher temperatures, coastal sewage runoff and changing salinity. While the extended nutrient enrichment has changed the trophic state of Kuwait waters, the seasonal and temporal correlations highlight that recent changes in phytoplankton community seem to be responding to cumulative pressures of eutrophication, climate, and salinity changes. The seasonal and temporal changes in the coastal phytoplankton community, responding to co-stressors, present challenges for managers to consider the simultaneous management of local, regional and external pressures. Continued declines in water quality within a system that is influenced by a warming climate can potentially have long-term consequences on the resilience of the Northern Gulf environment.
Introduction
The Arabian Gulf (also known as the Persian Gulf and hereafter referred to as the Gulf), a shallow (35–40 m average depth), semi-enclosed marginal sea, is characterized by extreme natural environmental conditions and severe anthropogenic pressures (Sheppard et al., 2010). It is connected to the Gulf of Oman and the Arabian Sea through a narrow bottleneck of the Strait of Hormuz. Sheppard (2016) and references within identified local and global impacts as the main causes of environmental damage on the marine Gulf ecosystems. The global impacts are those attributed to climate change (Price et al., 1993; Price, 1998; Van Lavieren and Klaus, 2013) particularly temperature extremes in an already high temperature environment. The local impacts are experienced at a smaller spatial scale but are ubiquitous across the Gulf and typically associated with dredging, urban expansion and pollution discharges, particularly nutrient enrichment from sewage inputs. Water quality has been recognized as one of the key drivers impacting unique coastal ecosystems and human health in the Gulf (Sheppard, 1993, 2016; Al-Yamani et al., 2007; Sheppard et al., 2012; Devlin et al., 2015b; Al-Said et al., 2017). This study focuses on Kuwait, a Northern Gulf country that faces those same environmental challenges related to changing climate and increasing pollution. Kuwait experiences a wide range of environmental conditions, with temperature and salinity being at the extremes of known conditions (Riegl, 2003; Riegl and Purkis, 2012; Devlin et al., 2015b), atmospheric fallouts carried by North Western dust storms and particulate matter derived by river transport from the Shatt Al-Arab and increasing coastal pollution (Sheppard, 1993; Sheppard et al., 2012; Al-Sarawi et al., 2015). Coastal water quality issues are significant for Kuwait, with many sewage outfalls discharging directly into the marine environment that are either not properly treated or illegally bypassing the sewage treatment facilities (Lyons et al., 2015; Saeed et al., 2015).
The impacts of eutrophication and coastal sewage issues have been identified in many Gulf countries including long-term coastal pollution in Kuwait (Devlin et al., 2015a; Lyons et al., 2015; Smith et al., 2015), changes in macrobenthic community structure in Bahrain (Naser, 2011), eutrophication related blooms in the Red Sea (Mohamed and Mesaad, 2007), eutrophication impacts on coral reefs in Oman (Al-Jufaili et al., 1999) and long-term degradation from coastal pollution reported across the Gulf marine systems (Price et al., 1993; Sheppard, 1995, 2016; Subba Rao and Al-Yamani, 2000; Sheppard et al., 2010, 2012). The recent observed global increase in severity and frequency of harmful algal blooms (HAB) events has also been linked to eutrophication (Gilbert et al., 2002; Gilbert, 2006; Heisler et al., 2008) although not all HAB events can be directly linked to anthropogenic influences. The Gulf countries have seen substantive coastal expansion with deteriorating water quality conditions arising from unregulated sewage outfalls. These environmental changes have been related to several incidents of algal blooms, HABs, and fish-kills (Heil et al., 2001; Gilbert et al., 2002; Al-Yamani et al., 2004; Sheppard et al., 2010; Al Shehhi et al., 2014). The primary form of nitrogen can differ depending on the pressures and can influence the plankton species (Howard et al., 2007) with growth rate and proliferation of HAB species varying with the nitrogen source (Thessen et al., 2009; Caron et al., 2017; Glibert, 2017; Seubert et al., 2017). Depending on the species and scale, phytoplankton blooms can have significant impacts locally or over wider areas. Examples of negative impacts caused by eutrophication and phytoplankton blooms in the Gulf countries include mass mortality of marine animals such as fish kills (Glibert et al., 2002) shellfish (Richlen et al., 2010), and alternation of marine habitat and community structure (Sheppard et al., 2010, 2012; Sheppard, 2016).
Assessment of the plankton community and possible changes that could be related to nutrient enrichment are an important part of understanding the complexity of eutrophication (Devlin et al., 2009; Foden et al., 2010). Studies on phytoplankton in the Gulf have been varied, with some focusing on the species lists and distribution, particularly in relation to extreme conditions of salinity and temperature and describing the north to south gradient of plankton community structure in the Gulf (Subba Rao and Al-Yamani, 1998; Al-Handal, 2009). The analysis of the temporal and spatial phytoplankton variability in Polikarpov et al. (2008) shows that Kuwait’s northern waters differed from areas further south in terms of phytoplankton structure with the environmental heterogeneity mainly attributed to the influence of the Shatt al-Arab system. The Shatt Al-Arab estuarine waters in the north are generally characterized by low species diversity, high biomass and higher production in contrast to Kuwait waters which have higher species diversity but lower biomass and production than the northern Gulf waters. More than 1,480 eukaryotic and prokaryotic primary producers have been described for the Gulf region (Jacob and Al-Muzaini, 1995) with Subba Rao and Al-Yamani (1998) identifying a dominance of epiphytic, tycho-pelagic diatoms to the north and a mix of diatoms and dinoflagellates to the south. Several papers report on these Gulf differences (Dorgham and Moftah, 1989; Al-Yamani et al., 2006; Nezlin et al., 2010; Quigg et al., 2013; Polikarpov et al., 2016) with a general agreement that there are two main regions in the Gulf along a diagonal northwest–southeast axis, with diatom-dominated phytoplankton assemblage off the south and along the Iranian coast but with flagellate-dominated phytoplankton in the north and along the Arabian coast (Polikarpov et al., 2016). Changes in the Gulf phytoplankton community have been attributed to nutrient increases (El-Gindy and Dorgham, 1992; Al-Azri et al., 2014; Devlin et al., 2015a), and salinity-related changes, particularly in the Northern Gulf region (Al-Said et al., 2017; Ben-Hasan et al., 2018). The only northern source of freshwater inflow into the Gulf is from the Shatt Al-Arab river and this flow from this river has decreased significantly over the past decades due to dam building and water storage in upper catchments of the river (Abdullah et al., 2015; Abdullah, 2017). These changes in long-term salinity have the potential to impact significantly on the phytoplankton community with a corresponding impact on the food web functioning and fish populations in the Gulf (Polikarpov et al., 2008; Al-Said et al., 2017). Changes in reduced productivity (Ben-Hasan et al., 2018) and decreases in fish catch landings in Kuwait (Bishop et al., 2011) have been partly attributed to increases in long-term salinity changes (Al-Said et al., 2017; Al-Yamani et al., 2017; Alosairi and Pokavanich, 2017).
Coastal pollution has been identified as one of the drivers of environmental impacts in Kuwait waters, including well documented fish kills in 1999 and 2001 (Gilbert et al., 2002) and ongoing chronic sewage issues (Saeed et al., 2012a, 2015; Lyons et al., 2015). In the face of population growth, inadequate sewage infrastructure, and increasing environmental degradation, increasing impacts are being observed across Kuwait’s marine systems (Al-Ghadban et al., 2001; Sheppard et al., 2012; Burt, 2013; Al-Sarawi et al., 2015, 2018; Devlin et al., 2015b; Sheppard, 2016). Long-term changes in water quality in Kuwait have been associated with coastal sewage discharges (Devlin et al., 2015a) and modifications to the Shatt Al-Arab river flow (Al-Said et al., 2017; Al-Yamani et al., 2017; Alosairi and Pokavanich, 2017) but limited analysis exists on the impacts on the coastal phytoplankton from cumulative stressors of coastal pollution, salinity changes and a changing climate. We review the historical trends in environmental variables, including dissolved nutrient concentrations, salinity, temperature, dissolved oxygen, turbidity, and chlorophyll from 1983 to 2016 to assess the scale of change, the persistence of eutrophic conditions within Kuwait Bay and the Gulf and how the local and regional drivers influence the phytoplankton community. We explore the shifts in the phytoplankton community in Kuwait marine waters through linked environmental variables from 2007 to 2016 and explored these correlations in context of the long-term changes of the key environmental drivers. This study integrates long-term environmental data with recent phytoplankton data with the aim of understanding seasonal and temporal variability and the main drivers that influence the variability in the phytoplankton communities.
Materials and Methods
Field Sampling
The State of Kuwait is situated at the north-western corner of the Arabian Gulf and has a coastline of approximately 500 km. Kuwait Bay is one of the main features of the Kuwait marine environment alongside the Northern Gulf waters that run adjacent to the eastern side of Kuwait (Figure 1).
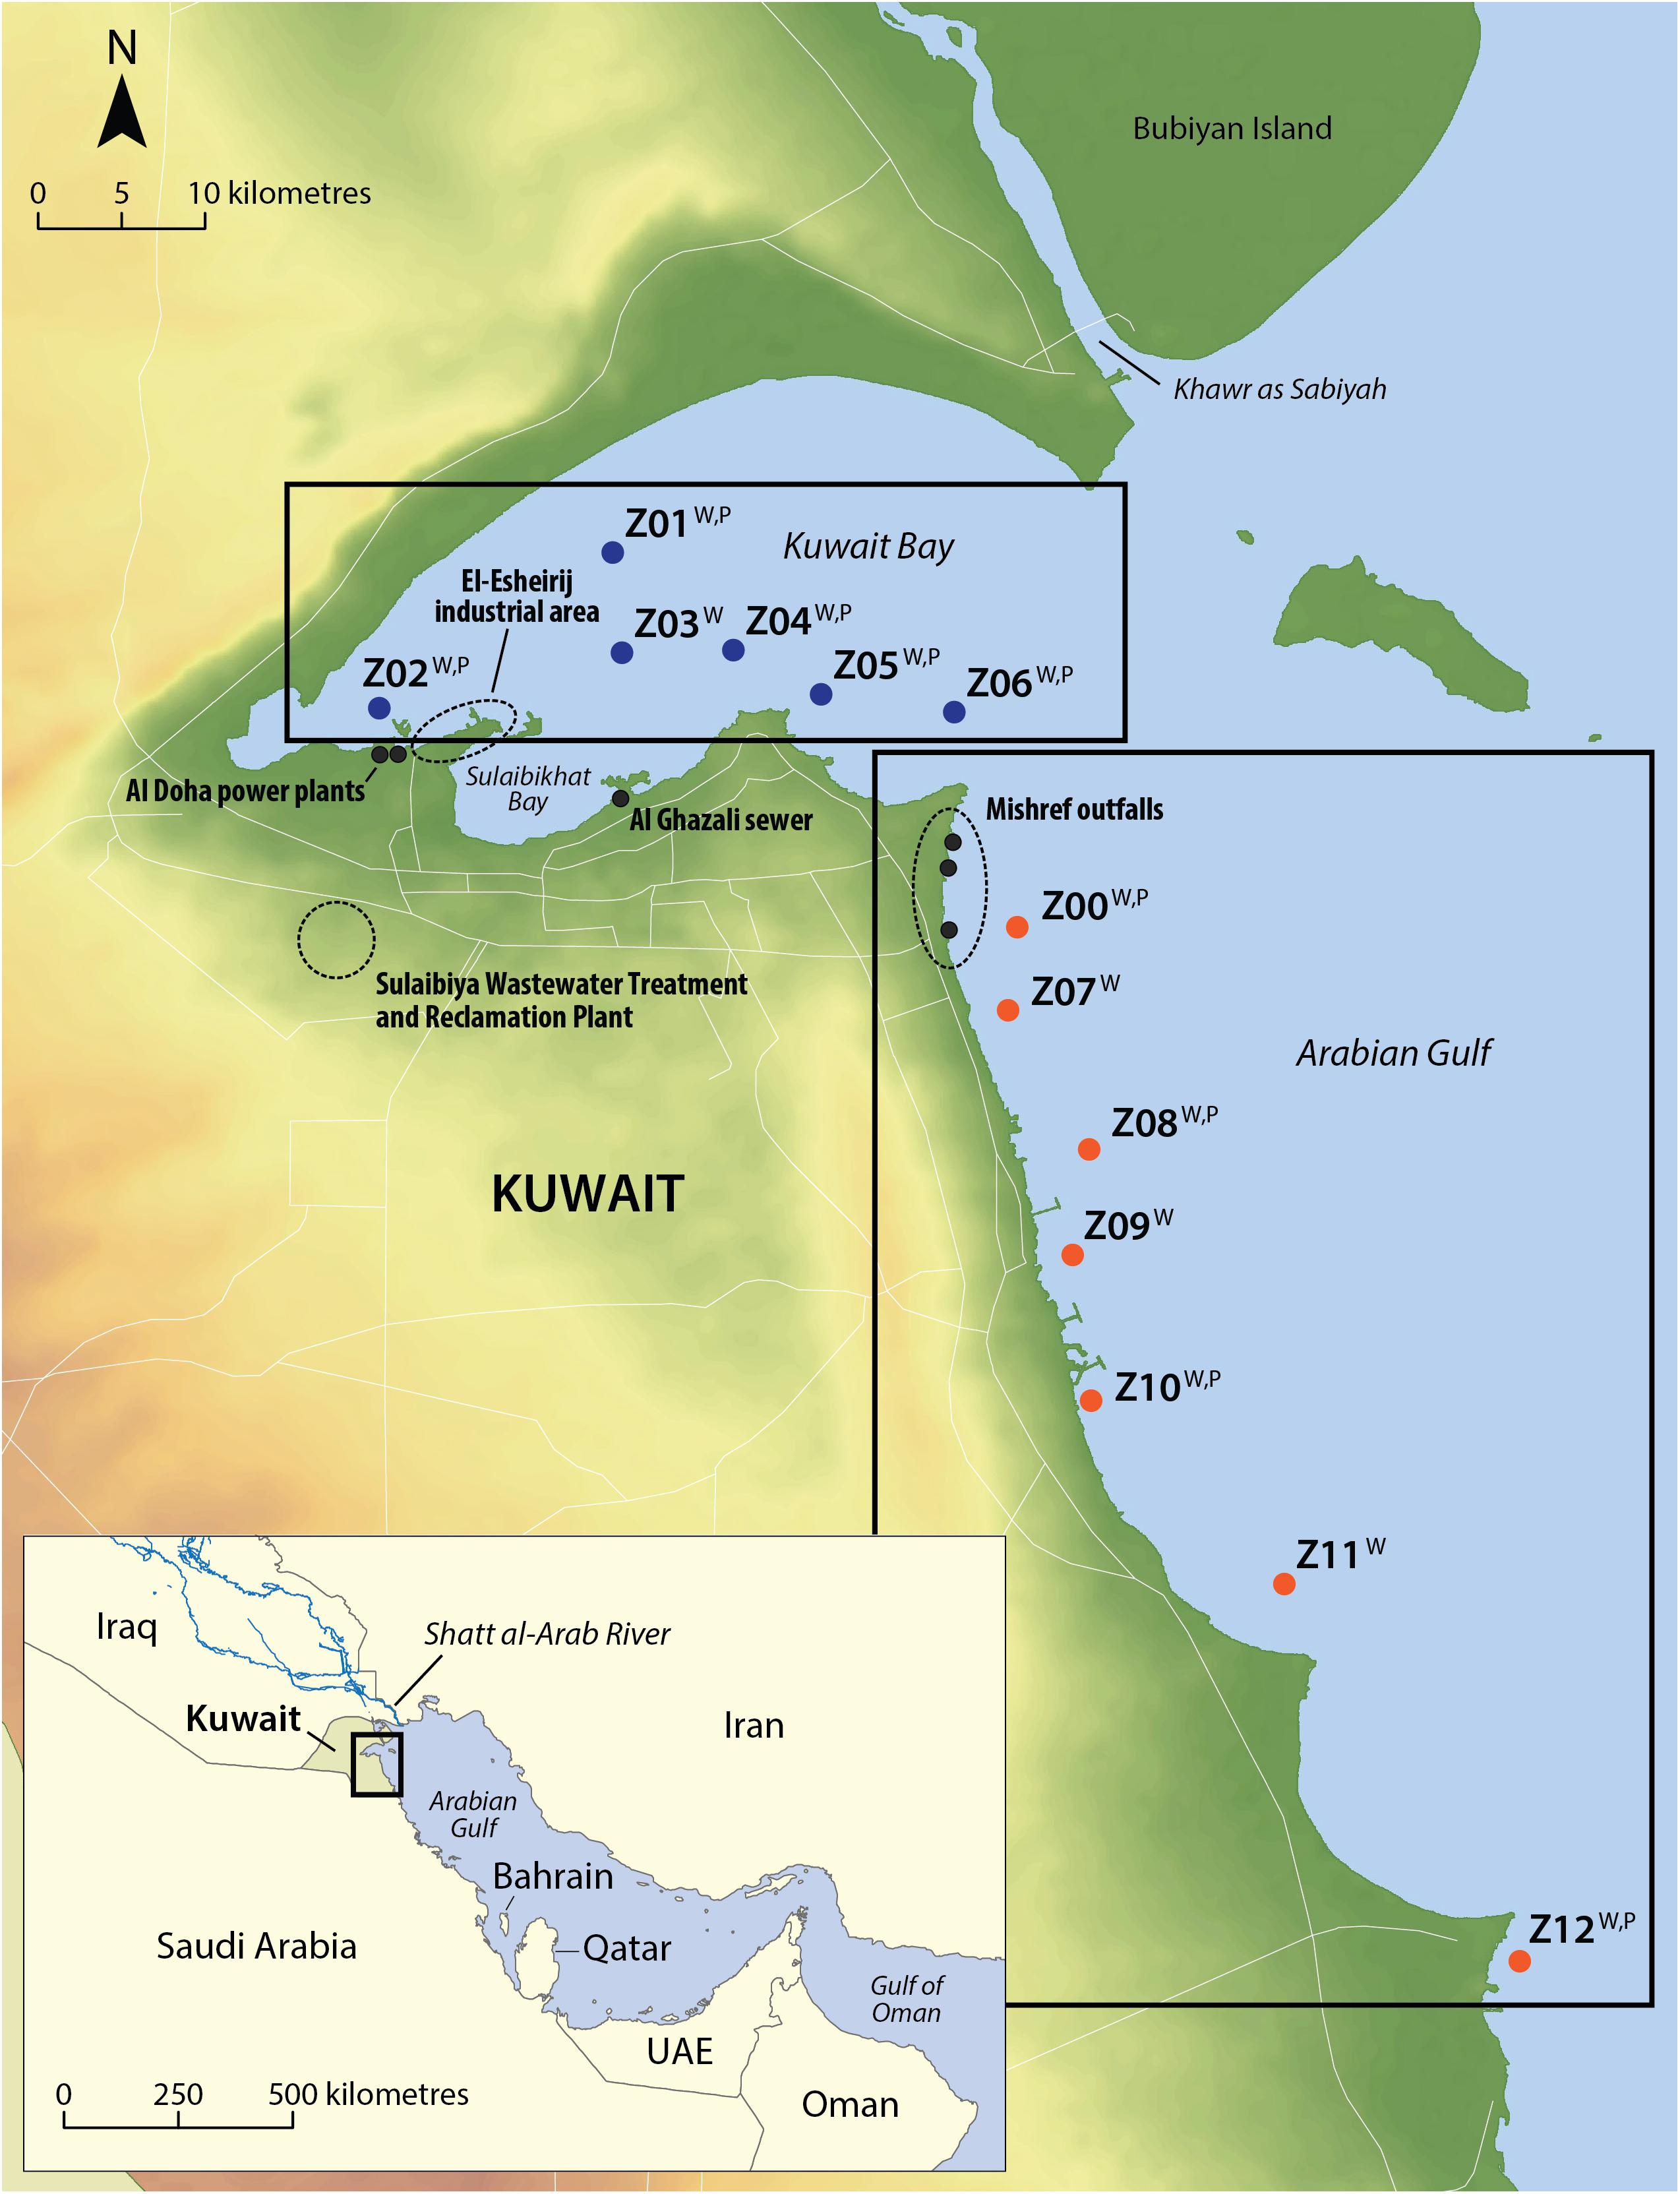
Figure 1. Kuwait marine waters identifying the sites that are located within Kuwait Bay (the “Bay”) and within Arabian Gulf waters (the “Gulf”). Sewage and groundwater outfalls are also identified. The Kuwait Environment Public Authority monitor monthly water quality and phytoplankton over 13 sites, with six sites within Kuwait Bay and seven sites along the coast of the Arabian Gulf. All sites are sampled for water quality (WQ) with seven sites sampled for phytoplankton (P).
Kuwait Environment Public Authority (KEPA) has been collecting water and sediment parameters at sites throughout Kuwait waters from 1983 to present time (Figure 1). Samples are collected at each station at monthly intervals across 13 locations. The seawater stations, of which six are located within Kuwait Bay (hereafter known as “Bay” sites), and seven distributed along the Kuwait coastline (hereafter known as “Gulf” sites), are typically monitored for environmental and biological data under the Kuwait Marine Monitoring Program1.
A series of physical and chemical variables were measured either in situ or in seawater samples collected throughout the year from these 13 nearshore stations. In-situ sampling includes temperature, transparency (Secchi Disk), pH, salinity (S) and dissolved oxygen (DO) collected via Hydrolab DS5 water quality multiprobe, attached to the Hydrolab Surveyor 4 recorder. Water samples were also collected for dissolved inorganic nutrients (DIN), total suspended solids (TSS), and chlorophyll-a (Chl-a). The nutrient parameters analyzed under the water quality monitoring program are nitrate + nitrite (TOxN), ammonia (NH4+), dissolved inorganic phosphate (DIP) and silicate (SiO4).
The biological program measures phytoplankton abundance and diversity. From 2007, samples for phytoplankton analysis at each station were collected with two techniques: (a) a vertical net haul (with mesh size of 20 μm) for qualitative analysis only (presence/absence of taxa); and (b) water samples from Niskin bottles or sampling hose for quantitative analysis (identification and enumeration). Quantitative samples from Niskin or hose were collected at surface and at depth intervals with sampling depth of 2–5 ms depending on local conditions. Phytoplankton data collected in the two different areas are identified as Bay and Gulf communities.
Laboratory Methods
Within 6 h of sampling, water samples collected for the analysis of chlorophyll concentration were filtered (on GFC filters), and pigment concentration was determined by fluorometric technique, following maceration of algal cells and pigment extraction in acetone (Parsons, 2013). A Turner 10-005R fluorometer was used for the analysis and was periodically calibrated against diluted chlorophyll extracts prepared from log-phase diatom cultures (Jeffrey and Humphrey, 1975). After filtration of known volume of water samples, concentrations of TSS were determined gravimetrically from the difference between loaded and unloaded membrane filter weights after drying filters at 60° for a minimum of 12 h.
Water samples were analyzed for concentrations of dissolved inorganic nitrogen (DIN) including NH4+ (ammonia), TOxN, which is the sum of nitrate (NO3) plus nitrite (NO2) and DIN which is the sum of TOxN and NH4+. Other dissolved nutrients included DIP and SiO4. All nutrients were analyzed by standard procedures (Ryle and Wellington, 1982) and conducted on a HACH analyzer (prior to 2009) and then on a Skalar San++ continuous flow analyzer (Skalar Analytical, Breda, Netherlands) after 2009. Detection limits are 0.006 mg/L for NH4+, 0.01 mg/L for NO2+NO3 and 0.01 μg/L for DIP. As a component of instrumental quality control, artificial seawater was used to establish baseline characteristics. Analyses of the total dissolved nutrients (total dissolved nitrogen and total dissolved phosphate) were carried out using persulfate digestion of the water samples (Valderrama, 1981) and were then analyzed for inorganic nutrients, as above.
Phytoplankton samples were fixed with Lugol iodine solution, immediately after collection and analyzed with a compound microscope. Karlson et al. (2010) suggested that phytoplankton net samples should not be used for quantitative analysis and as the focus of this study is on quantitative investigation of changes in the phytoplankton community, only samples from water samples collected from Niskin or hose were used in the analysis and discussed further.
Phytoplankton samples from Niskin bottles were homogenized by inverting the samples multiple times, and 1 ml sub-samples were transferred to a Sedgewick-Rafter chamber using a pipette. All taxa observed were identified and enumerated. The procedure was repeated three times for each sample and the results obtained from replicates were averaged; average abundances in 1 ml were then scaled up to determine cells L-1. This counting technique is considered accurate when samples contain sufficiently high numbers of phytoplankton cells, as it has a detection limit of 1,000 cell L-1 (LeGresley and McDermott, 2010).
Biomass (as μgC L-1) of the 30 most abundant phytoplankton taxa was estimated multiplying the abundance of a given taxon (as cell L-1) by its cell carbon content (as pgC cell-1) and divided by 106 (see Supplementary Table S1). Due to lack of size measurements of the phytoplankton taxa in the samples, the cell volumes were obtained from global coastal datasets (Harrison et al., 2015), from size measurements in Tomas (1997) and Al-Kandari et al. (2009), using geometric formulas given by Edler (1979) (Supplementary Table S1). Ceratium furca represented an exception as the biovolume of this dinoflagellate was calculated based on equation by Thomsen (1992). Biovolumes were then converted to carbon using the equations of Menden-Deuer and Lessard (2000).
Scope of Data Analysis
Full details of collection, sampling, and analysis of the water quality data are given in Devlin et al. (2015a). Analysis of the long-term water quality changes, building on the water quality data set examined in Devlin et al. (2015a) and Lyons et al. (2015) will be presented to illustrate the impacts of the long-term enrichment of Kuwait marine waters and the impacts on the baseline condition. The integrated analysis will focus primarily on the water quality and quantitative phytoplankton data collected between 2007 and 2016. The full scope of the spatial and temporal analysis applied to the available datasets over the different time periods is summarized in Figure 2.
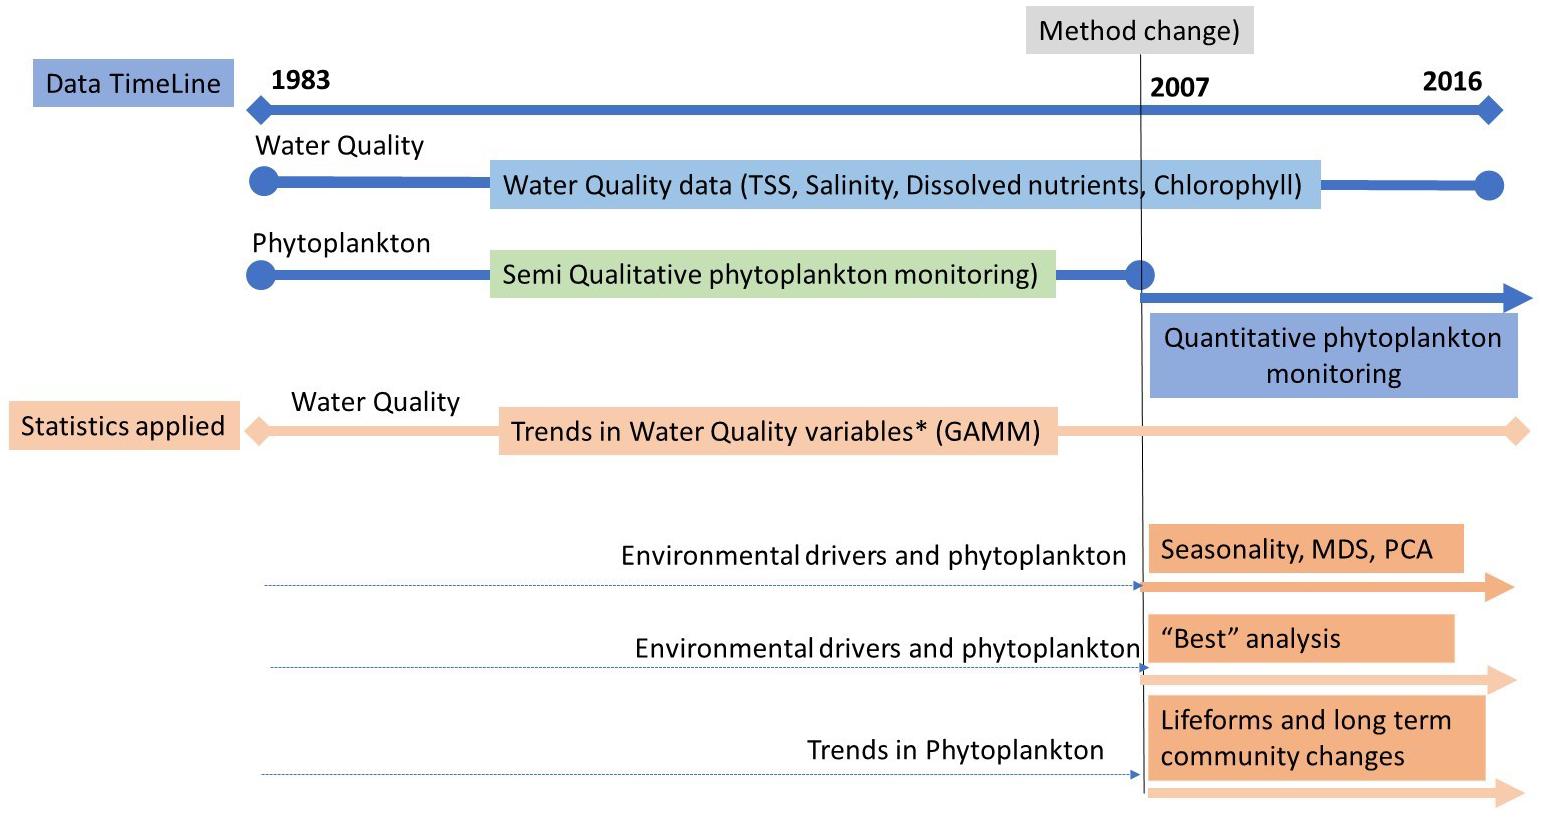
Figure 2. Data analysis was selected based on the scope of data. The main body of correlative analysis is between 2007 and 2016 where water quality, environmental drivers, and quantitative phytoplankton data were available and sampled from the same sites over the same period.
Long-Term Changes in Water Quality Parameters (1983–2016)
Independence of Replicates Between Stations Within Sites
One-way analysis of variance models with normal errors were fitted to see if there was evidence that variation between stations was greater than variation within stations for data collected during 1983 and 2015. This tells us (a) whether there might be any pseudo-replication in our data set, and (b) whether there is evidence of differences between stations within the Kuwait Bay and Arabian Gulf sites. This was repeated for all the 10 variables (DIN, NH4+, TOxN, DIP, SiO4, salinity, temperature, chlorophyll, DO, TSS). The years 1983 and 2015 were chosen as these were at the beginning and toward the end of the time series, and both contained relatively large numbers of observations. Our analysis of variance model showed that variation between stations was not greater than variation within stations. Of the 20 models we fitted, only one was statistically significant at the 5% level. This was Ln TSS for the Arabian Gulf which had a p-value of p = 0.046. Given that from 20 tests, random chance would be expected to result in one statistically significant result at the 5% level even if there were no differences, it seems reasonable to assume that there is little evidence for differences between the stations. Therefore, considering the stations as replicates within each region is a highly plausible assumption. The six Kuwait Bay stations (Z01, Z02, Z03, Z04, Z05, Z06) and the seven Arabian Gulf stations (Z00, Z07, Z08, Z09, Z10, Z11, Z12) were then aggregated into two separate sites, known as the “Bay” and the “Gulf” sites.
Trends in the Water Quality Variables
The raw environmental data were plotted against year for Arabian Gulf and Kuwait Bay sites and investigated for skewness. Skewed data was log transformed for easier interpretation of the long-term data. To investigate the long-term trends, we used Generalized Additive Models (GAMs) to model each water quality (WQ) parameter as a function of time to the transformed and non-transformed data (S and DO). The function gam in the R package (R Core Team, 2017) was used for this modeling. Temporal GAM models are reported for each of the water quality parameters (LnChl-a, LnDIP, DO, LnNH4+, S, LnSi, LnT, LnTSS, LnTOxN, and LnDIN) for the time period 1994 to 2016. Thin plate regression splines were used for the smoothing with the degree of smoothing determined by generalized cross validation. No restrictions were placed on the degrees of freedom for the smoothed terms. Smooth trend plots were computed for each WQ variable across the whole of the time series (1983–2016). Models were constructed for data aggregated across sites within Kuwait Bay (Z01–Z06) and in the Gulf (Z00, Z07–Z12).
Seasonal (Within Year) Trends in Water Quality Parameters
Within year variations of the WQ data were also explored across stations within the two sites (Kuwait Bay and the Gulf). To visually represent seasonal variations, the monthly means of the WQ parameters were calculated from data which had the long-term trend subtracted (the long-term mean are the trend lines shown in Figures 3C). Effectively, these means are from the residuals of the GAM models applied for the long-term trend analysis. This approach ensures that seasonal variation is not confounded with the long-term trends. Approximate 95% confidence intervals for the means were calculated using the percentile bootstrapping method (Manly, 2006).
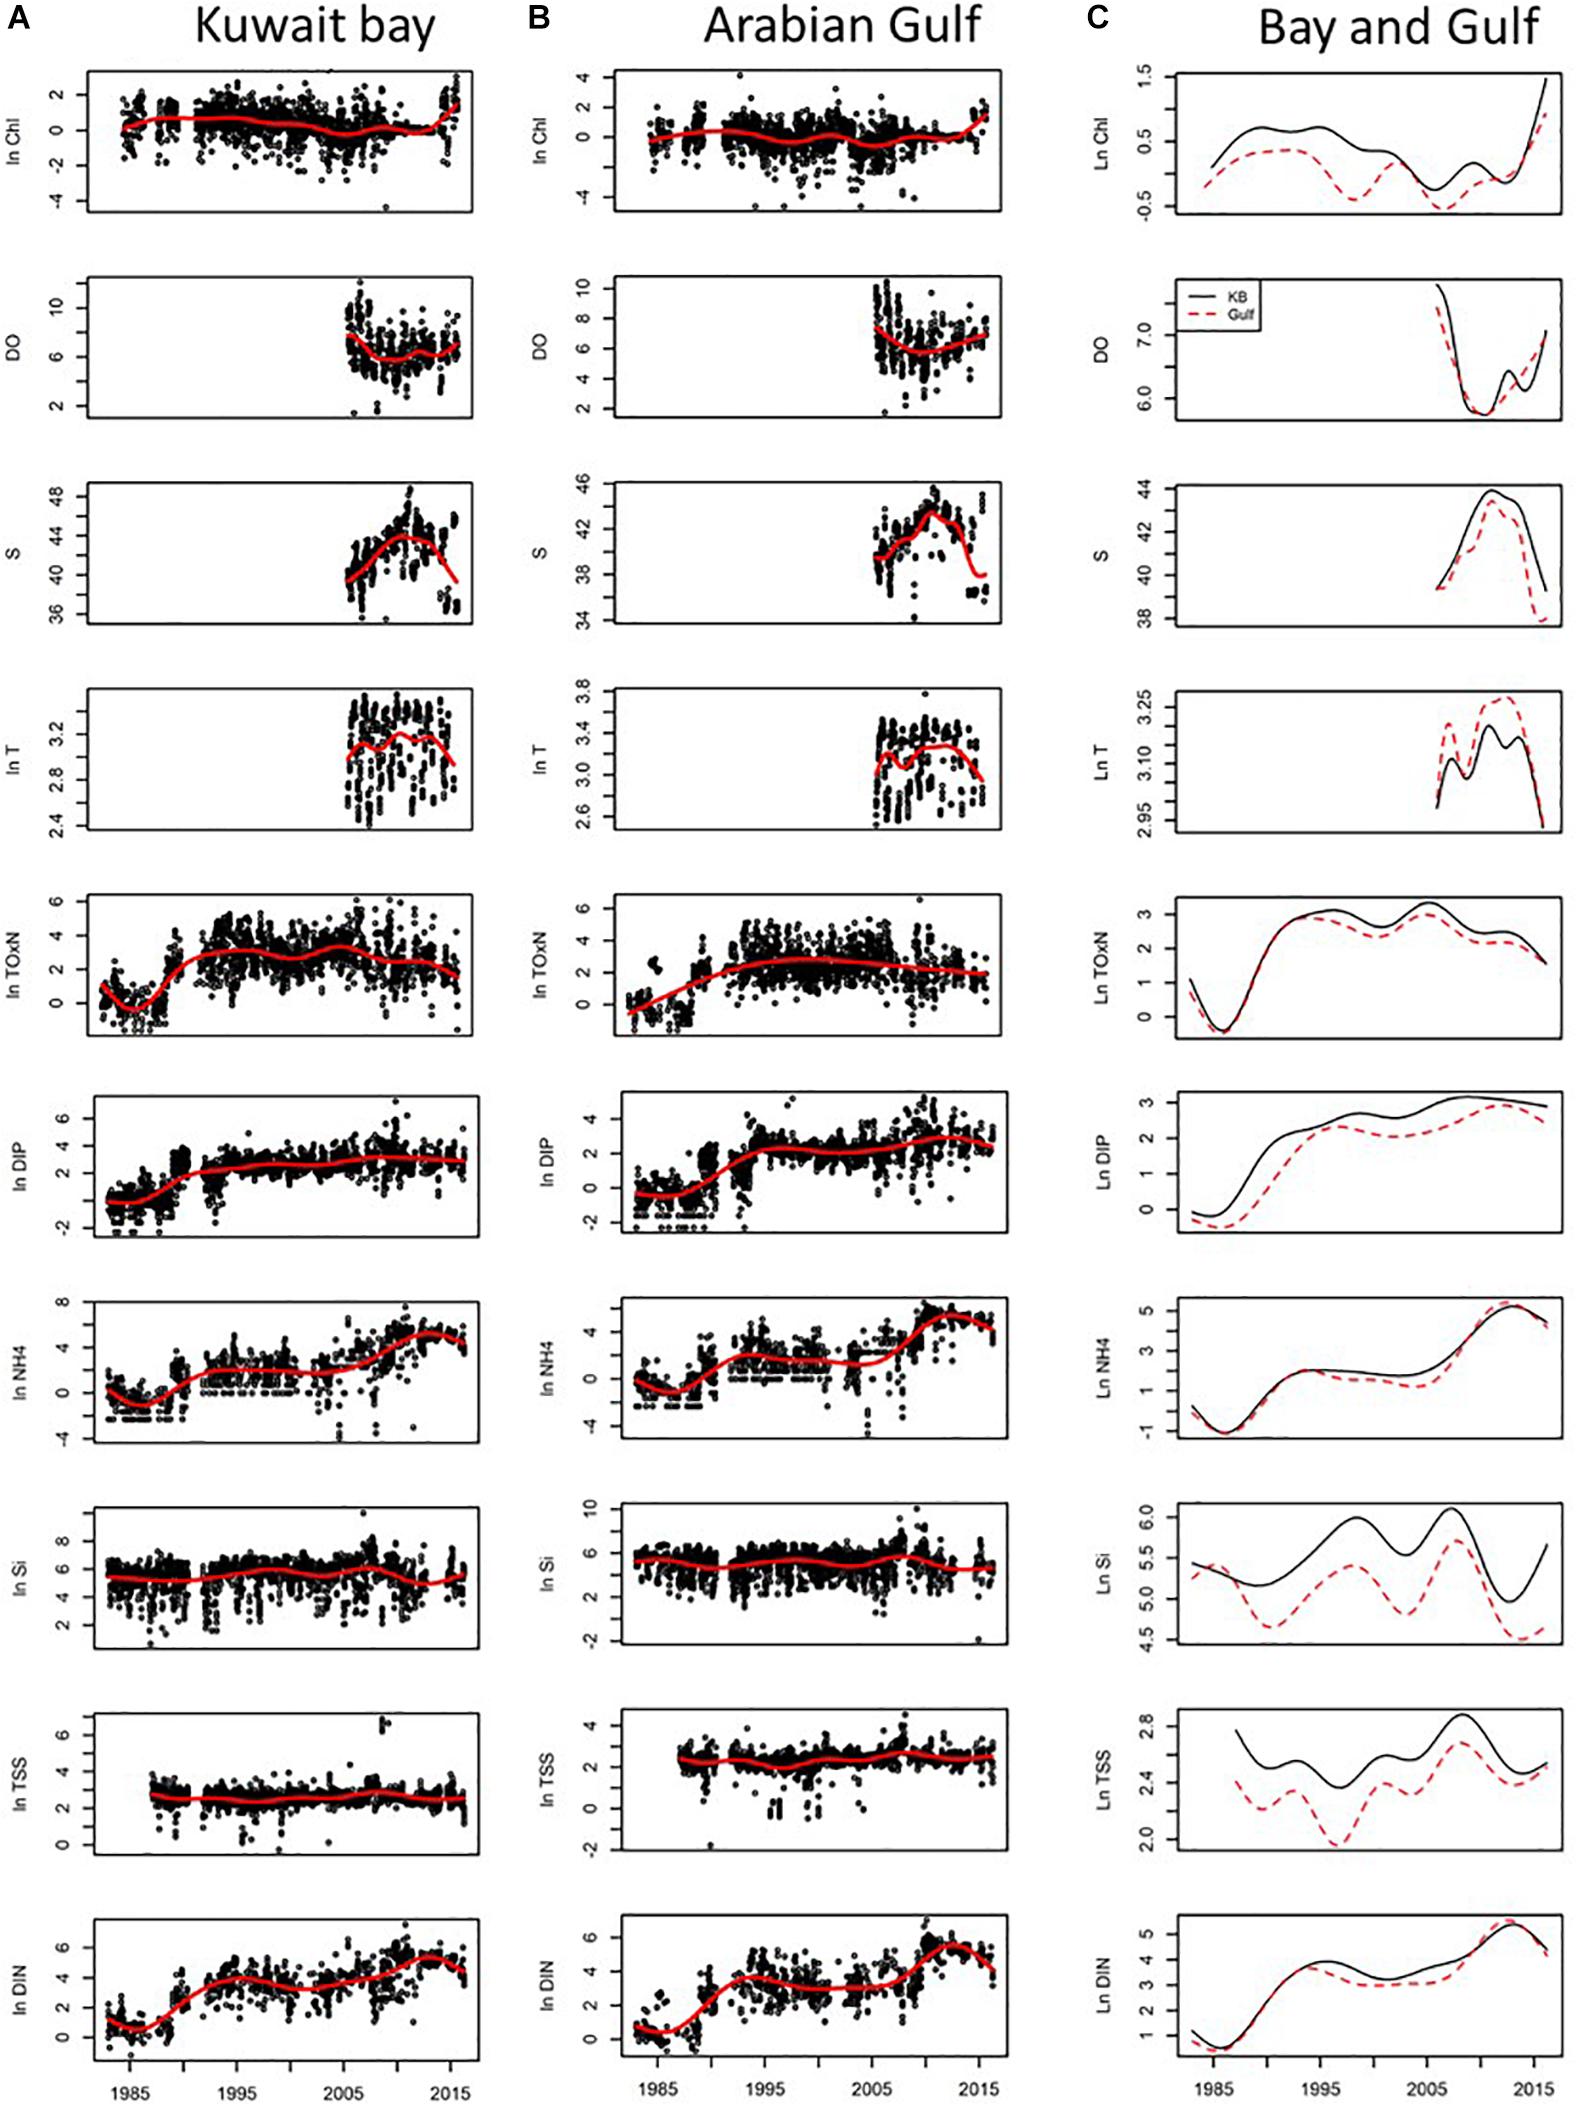
Figure 3. Long-term trend analysis of water quality parameters collected within Kuwait Bay and Arabian Gulf. All the water quality variables, except for S and DO, were ln transformed to make their distributions closer to Gaussian. All nutrients (i.e., excluding S, T, and Chl-a) are in units of mg/L. T (temperature) is in units of degrees Celsius, S (salinity) has units of ppt, Chl-a has units of μg/L. Logged raw data are presented for Kuwait Bay (A) and Gulf (B) with smooth trend plots computed for each water quality variable across the whole of the time series (1983–2016). The GAM model is presented independently of the data (C) note the smaller range on the x axis. The GAM model output for Kuwait Bay is shown by the black line and the red dotted line for the Gulf.
Trends in Phytoplankton Data (2007–2016)
Seasonal Changes in Phytoplankton Community
For an analysis of simple diversity indices over the year, the phytoplankton data were averaged by month over the time period to express the seasonal diversity indices. The number of taxa (S), abundance of taxa (N), Simpsons (D), evenness, Margalef (d), and Shannon index (H’) was averaged for each month. Counts of diatoms and dinoflagellates were averaged for each month over the same time-period and presented against the average water temperature value.
To identify the most common and abundant phytoplankton species sampled from Kuwait Bay and the Gulf, the annual abundance of each species was summed and ranked for every year. The annual ranks were then averaged over the decade and the top 30 species were compiled based on the rank of the decade averages. The monthly abundance of the top 30 species across the time series (as well as the average monthly climatology) is displayed by means of a shade plot, created using the software R, with package ggplot2 (R Core Team, 2017).
To investigate seasonal changes in the phytoplankton community and the environmental drivers, non-parametric multivariate analyses were carried out in PRIMER v7 (Clarke and Warwick, 1994). Due to the requirement to match biotic data with environmental data the 10-year data set was reduced to only include months where both phytoplankton data and environmental data were available. This resulted in a total of 63 monthly data points for the Gulf and 72 monthly data points for Kuwait Bay. Species abundance data was averaged for each month over the period 2007–2016 for Kuwait Bay and the Gulf and ln(x + 1) transformed. Resemblance matrices were compiled based on Bray–Curtis similarity. To aid interpretation, monthly averaged data over the time period was calculated for the Kuwait Bay and the Gulf. Analysis of similarities (ANOSIM) was computed to determine if the within site differences significantly contrasted with the between site differences from the Kuwait Bay and Arabian Gulf sites. Non-metric Multi-Dimensional Scaling (n-MDS) methods were applied to ordinate the seasonality of the phytoplankton communities for the two sites. A simple cyclical model was applied to determine if there was a statistical relationship between the monthly averaged community data and the seasonal cycle using the RELATE function for the Kuwait Bay and the Gulf. The seasonal model relates the annual community shifts to a cyclical model of the year, i.e., January and December are 1 step apart, while June is 6 steps apart.
The environmental data NH4+, DO, DIP, salinity, TSS, TOxN, and temperature was averaged for each month and all variables other than DO and temperature were ln(x + 1) transformed and normalized. Principal components analysis (PCA) was computed to ordinate the environmental variables with season for Kuwait Bay and Arabian Gulf. PCA analysis is a means of projecting the Euclidean distances of normalized environmental variables to describe the relationship between samples (or months in this case). PCA reduces the dimensionality of a data matrix to a low-dimensional summary and provides an interpretation of the axes (PC scores). Similar samples are represented by points located close to each other in the projection. The community data for all available months (using years as a factor) was matched to the environmental data to determine the combination of environmental variables that best explain the patterns in the community composition, using Spearman rank correlations in the BEST (Bio-Env) function. The BEST procedure determines the selection of environmental variable subsets that maximize the rank correlation between the similarity matrices of the community and environmental data by checking all combinations of variables (Clarke and Warwick, 1994; Clarke and Gorley, 2015). Prior to running BEST analyses environmental variables was checked for intercorrelation and DO was removed due to the high intercorrelation with temperature (-0.67 in the Gulf and -0.71 in Kuwait Bay). A permutation test with 999 iterations was completed to test for the agreement in the multivariate matrices. BEST analyses were completed on the full similarity matrices using year as a factor. However, for illustrative purposes monthly average community (n-MDS) and environmental data (PCA) are provided.
Temporal Changes in Phytoplankton Communities
Temporal variability of total abundance and biomass of the top 30 species, by month and by year, was calculated by summing abundance (or biomass) of all the taxa in a given sample. The resulting total abundance (or biomass) was then plotted using the software R (package ggplot2), fitting a local polynomial regression to the data points. Monthly long-term abundance (LnA) and biomass (LnBio) changes were plotted for Kuwait Bay and Gulf communities for the top 30 occurring species.
To test the data further we looked for seasonality and inter-annual variation over the time period (2007–2016). This was done by grouping the data into diatom and dinoflagellate lifeform groups. Lifeforms are aggregations of taxa that group together individual taxa with a similar functional role which are less likely to experience the extreme seasonal fluctuations of single species indicators and their use increases spatial intercomparability (McQuatters-Gollop et al., 2019). Shifts in community structure based on lifeforms were identified by applying the Plankton Index (PI) approach, the details of which are described elsewhere (Tett et al., 2007, 2013; Gowen et al., 2015). Briefly, the abundances of two independent lifeforms (log-transformed and corrected for a zero value) during a chosen “starting period” are plotted against one another to define a “reference envelope in state-space. A sample’s position at any point in time is defined in state space” by orthogonal axes of (log-transformed) lifeform-pair abundance.
In order to capture normal seasonal and inter-annual variability in phytoplankton community structure, at least a 3-year reference interval is recommended, with full seasonal coverage. The reference envelope is defined such that it contains 90% of the reference data which is defined as monthly samples for the period 2007–2009 analyzed independently for both the Bay and the Gulf. The PI value for any year or set of years outside the reference period is defined as the ratio of observed lifeform pair data which fall inside the reference envelope to the total number of data points being compared to the reference period. For example, if comparing a full year of data to the reference period (sampled monthly) and all 12 of the data points data fall within the reference envelope the PI is 1, if only 3 months fall within the reference envelope the PI is 3/12, or 0.25, and if all of the data fall outside the reference envelope the PI is zero, representing a complete change. The statistical significance of the PI value is given by an associated binomial p representing the probability of finding that number of points inside the envelope given change variation and an expectation of 0.9 (Tett et al., 2008). ‘Significance’ is assigned when p < 0.01, corresponding to PI values <≈ 0.7. While a useful guide, statistical significance does not necessarily indicate ecological significance.
Results
Long-Term Data (1983–2016)
Trends in Water Quality Variables
The raw environmental data were plotted against year for both the Arabian Gulf and Kuwait Bay (see Supplementary Figures S1A,B). All nutrient, TSS and Chl-a data showed a substantial degree of skewness due to the large increases in concentrations (nutrients) or episodic peaks (TSS and Chl-a) and were ln-transformed to reduce skewness. Salinity and DO were excluded from the ln-transformation.
Log transformed data shows increasing values for NH4+, TOxN, DIP, DIN for both Bay (Figure 3A) and Gulf (Figure 3B) sites. Temporal GAM models are reported for each of the water quality parameters, as per the methods described in Devlin et al. (2015a), with an additional 6 years added to the long-term analysis of environmental parameters reported in Devlin et al. (2015a) and Lyons et al. (2015) (Figure 3). The smoothed trends over time help estimate the long-term trends in the data. Strong temporal trends in data show significant increases in nearly all nutrient variables, including all dissolved nitrogen components of DIN (NO2, NO3, NH4+) and DIP (Figure 3C). The increase in NH4+ is most likely related to the increased industrial discharges emanating from the sewage and industrial outfalls, many of them illegal discharges. The rapid increase in NH4+ from 2009 to 2012 corresponds to the period of time that a pump malfunction resulted in raw sewage discharging into the Gulf. The temporal patterns observed for TOxN and SiO4 demonstrate more variability, with increases over the early 1990s, and decreasing concentrations from the early 2000s. The simultaneous increases in TOxN, DIP, and NH4+ in Kuwait Bay during the late 2000s are likely to be associated with industrial and sewage discharges which enter directly into Kuwait Bay from the Suibikhat industrial area (Al-Omran, 1998; Al-Ghadban et al., 2001; Saeed et al., 2015). All water quality parameters, with exception of SiO4, have been reducing over the recent years, indicating that the remediation of the more chronic sewage issues in the Gulf in 2012 through improvements in sewage infrastructure (Saeed et al., 2012a, 2015) have had positive effects, including reduction in NH4+, reductions in TSS, DIP and a slight increase in DO concentrations. The change in water quality parameters for the Bay and the Gulf are similar for the nutrients but show small differences in TSS and Chl-a, likely related to the reduced river flow from the Shatt Al-Arab river, driving longer retention times within Kuwait Bay (Alosairi and Pokavanich, 2017), increasing turbidity and reducing phytoplankton growth in the Bay.
Within Year Trends (Seasonality)
The extent of seasonal variation within years is shown in Figure 4. Positive increases are seen for TOxN and DIP in the period for October to December, aligning with periods of higher rainfall and potentially influenced by flow from Shatt Al-Arab River (Al-Yamani et al., 2007; Al-Yamani, 2008). In contrast, particularly for the Gulf area, increases in NH4+ are variable over the year, with the highest deviation occurring in March, April, May, and November indicating that the source of NH4+ is likely to be related to man-made industrial inputs and not affected by weather conditions or river inputs.
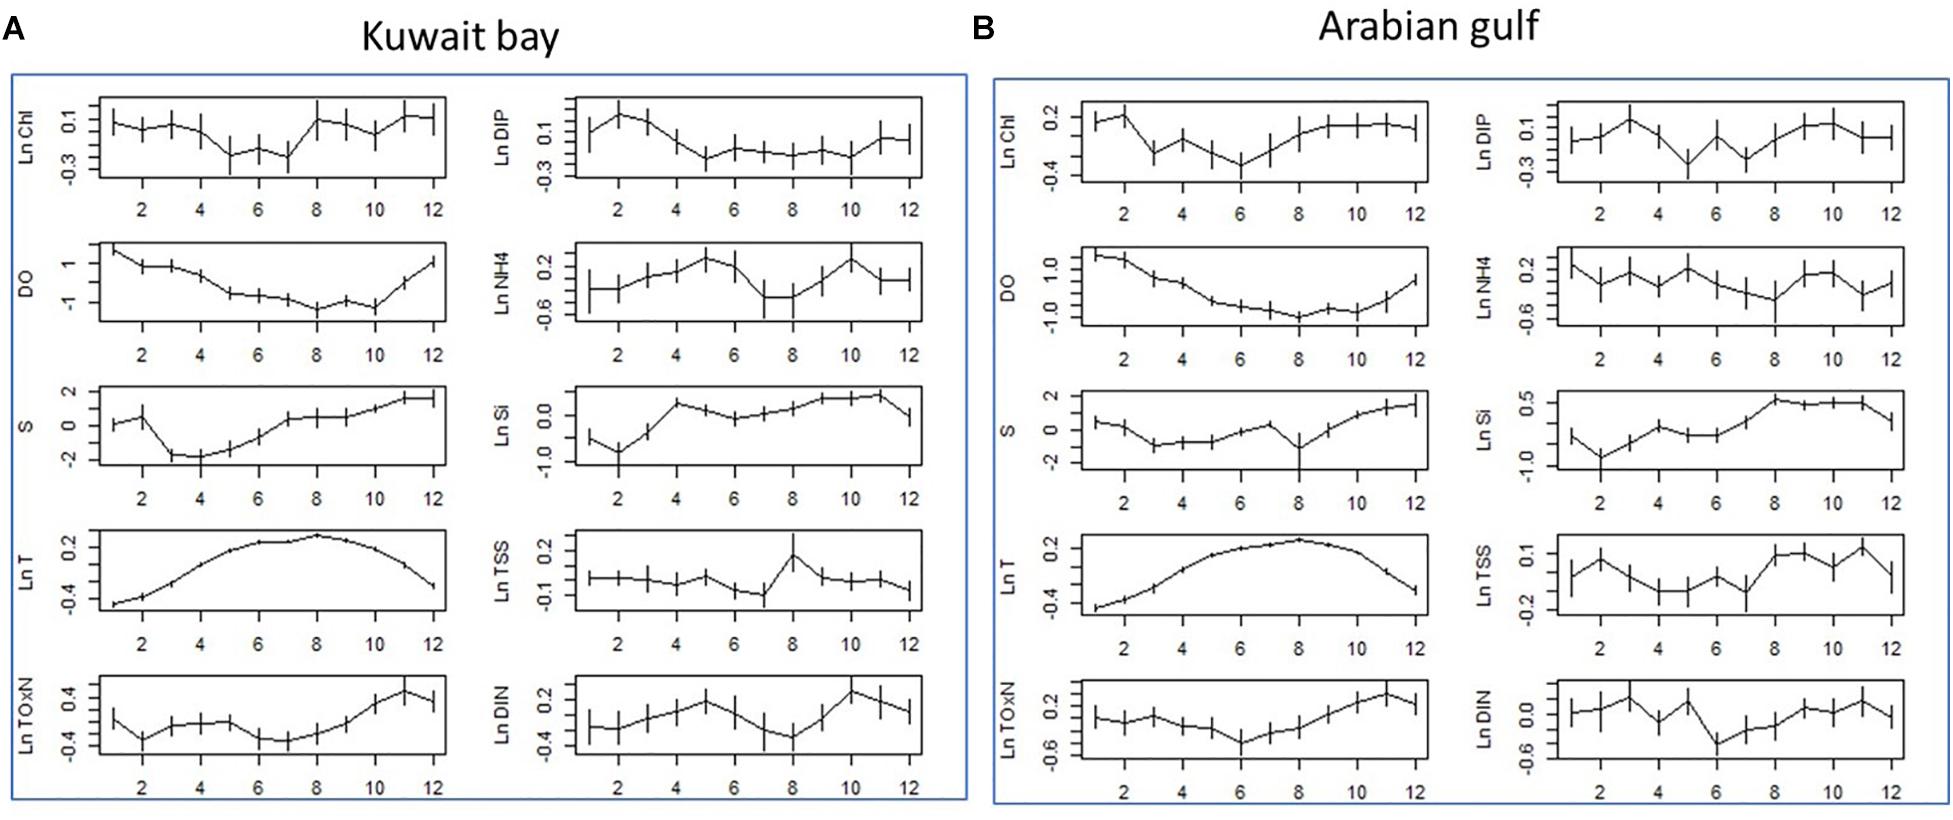
Figure 4. Seasonal changes in water quality parameters for (A) Kuwait Bay and (B) Arabian Gulf. The monthly means of the WQ parameters were calculated from data which had the long-term trend subtracted. Effectively, these means are from the residuals of the GAM models shown in Figure 3. This approach ensures that seasonal variation is not confounded with the long-term trends. All nutrients (i.e., excluding S, T and Chl-a) are in units of mg/L. T (temperature) is in units of degrees Celsius, S (salinity) has units of ppt, Chl-a has units of μg/L.
Seasonal Changes in Phytoplankton Community
The phytoplankton dataset (2007–2016) comprises 214 species divided among eight genera. The set of diversity indices averaged over the calendar year show similar seasonal patterns for the Bay and the Gulf (Figure 5). The number of species ranged between 25 and 43, with slightly more species in the spring to summer months. The abundance values change over the year, with higher abundances experienced in March, May, and September, likely influenced by the warming waters from March. Simpsons, evenness and Shannon indices are relatively constant, with dips in the values, particularly for the Gulf, in the March to May period, indicating that the high abundances in this period is driven by a reduced number of dominant species. The average monthly counts (logx) of the diatoms and dinoflagellates show the abundance increasing in February for the Bay community and in March for the Gulf community. High counts of diatoms are also measured in June and September in the Bay and in May, June and September in the Gulf. The phytoplankton community is dominated by diatoms, with higher counts of dinoflagellates measured in February and March and higher numbers of dinoflagellates occurring in Kuwait Bay compared to the Gulf community.
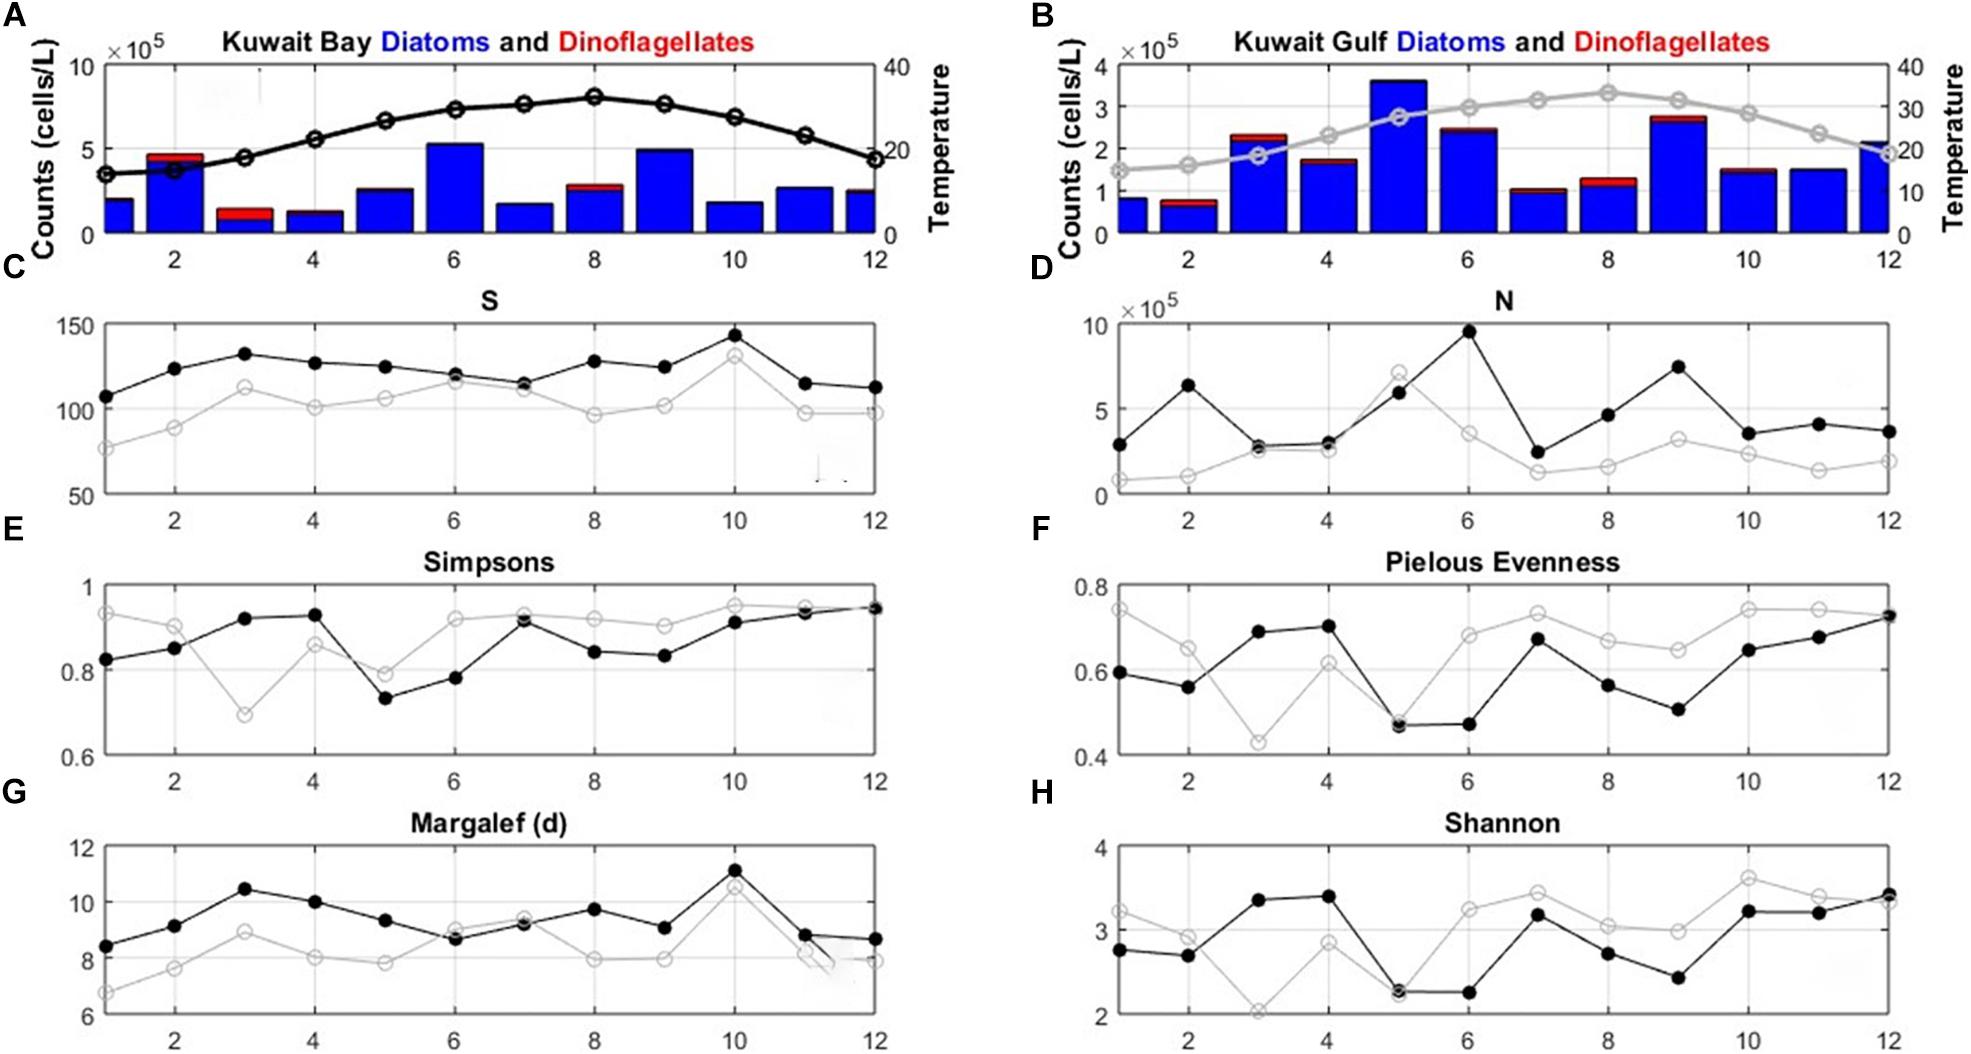
Figure 5. Diversity descriptors for the phytoplankton data (2007–2016) averaged over calendar months for the full 10-year period. Average monthly values are presented for (A) counts of diatoms (lower blue segment of bars) and dinoflagellates (upper red segment of bars), and temperature (black open circles and line) in Kuwait Bay, (B) counts of diatoms (lower blue segment of bars) and dinoflagellates (upper red segment of bars), and temperature (gray open circles and line) in the Gulf, (C) number of species (S), (D) abundance (N), (E) Simpsons index (D), (F) Evenness (J), (G) Margalef and (H) Shannon index. In (C–H) black filled circles = Bay, gray open circles = Gulf.
The seasonality of the top 30 species is presented in ranked species abundance shade plots (Figure 6). Highest counts in Kuwait Bay were measured during February, June, and September, dominated by diatoms, but with higher dinoflagellate counts in February and March (Figure 6A). The Gulf community responded differently to the seasonal cycle, with higher abundances and biomass persisting from March to June, and an autumn bloom in September (Figure 6B). January was characterized by low abundances and biomass for both the Bay and Gulf communities. The top 30 most abundant species in the Bay and Gulf (2007–2016) are dominated by diatom species. Leptocylindrus minimus, Leptocylindrus danicus, Eucampia zodiacus, and several species of Chaetoceros sp. (e.g., Chaetoceros pseudocurvisetus) dominate in terms of abundance in the Bay with C. pseudocurvisetus thriving in the summer conditions, compared with some of the other species. Leptocylindrus minimus is the most abundant in the Gulf, with high counts of Chaetoceros sp., but with higher abundances of Thalassionema fraunfeldii, Thalassionema nitzschioides, and Asterionellopsis glacialis. There are only three dinoflagellates species in the top 30 for both Kuwait Bay and the Gulf: Karenia brevis, Karenia selliformis, and Prorocentrum micans in the Bay, and Karenia brevis, Prorocentrum micans, Ceratium furca in the Gulf. Karenia brevis is part of the Karenia (dinoflagellate) genus, a marine dinoflagellate that is responsible for red tides and associated mortality of seabirds and fish.
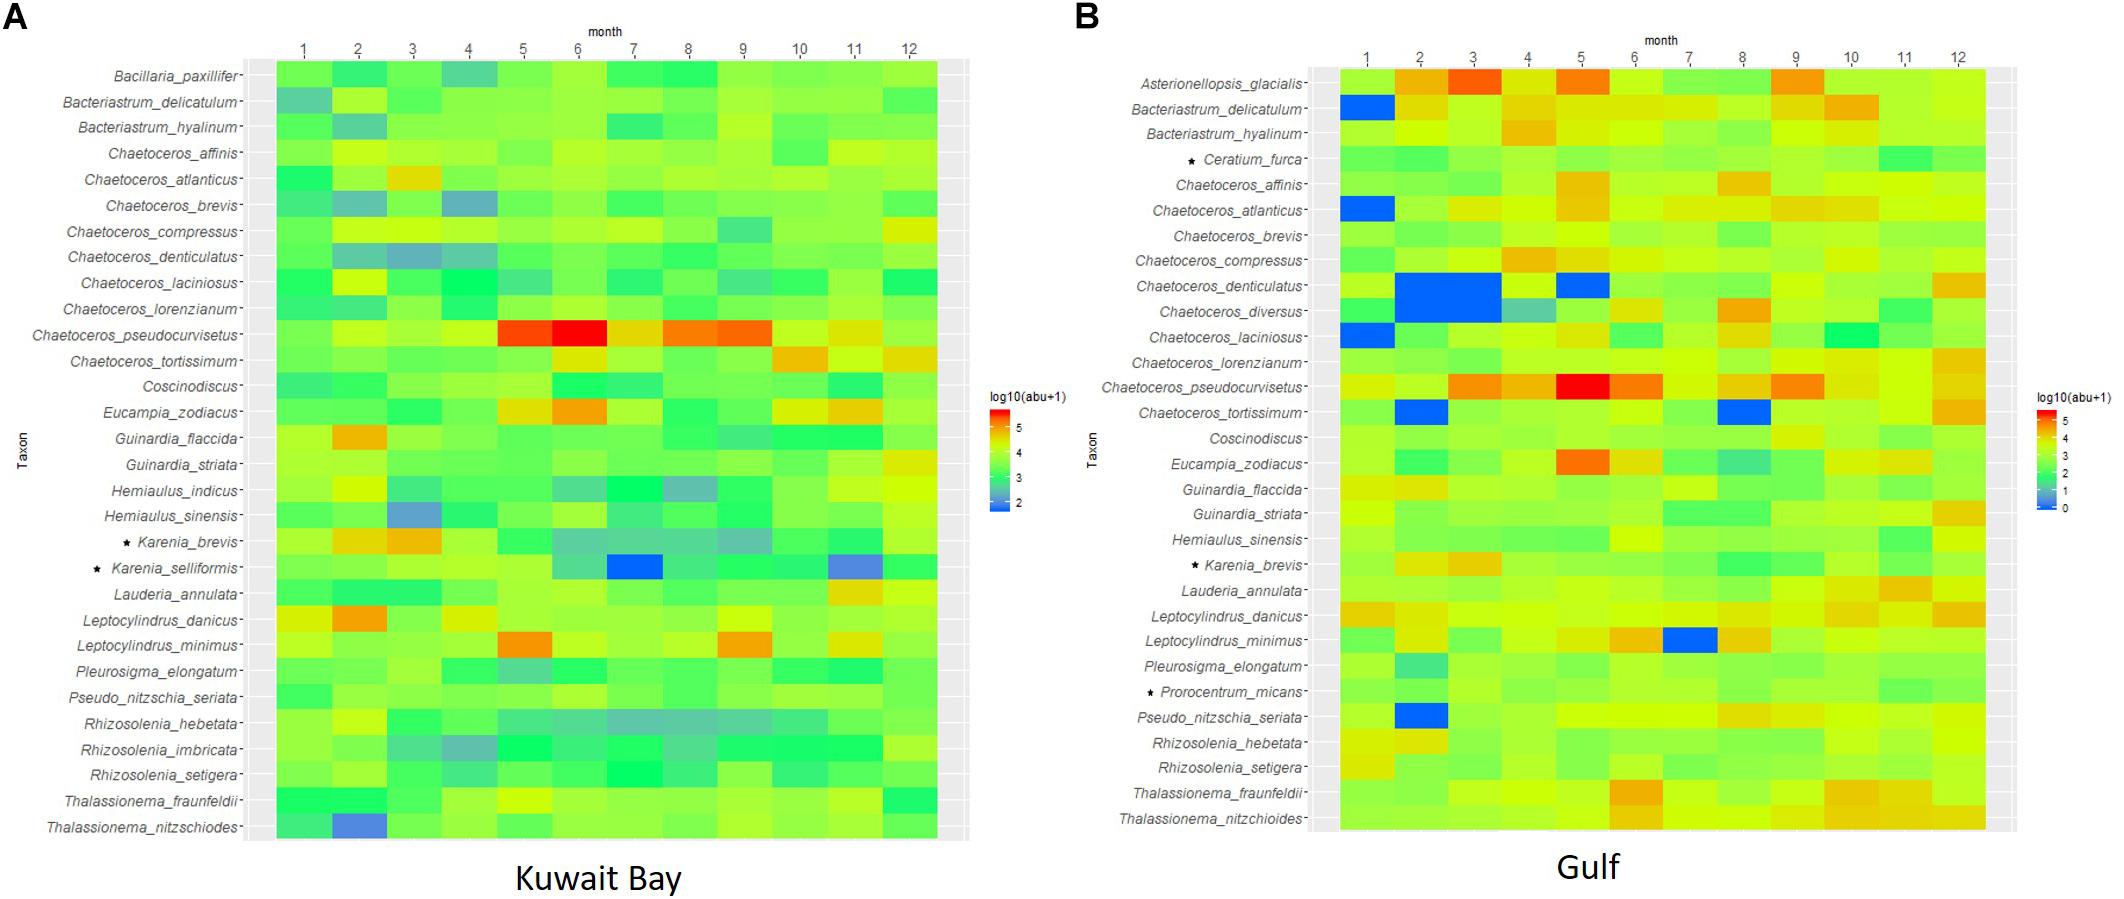
Figure 6. The top 30 phytoplankton species ranked in terms of logged monthly abundance [Log10 (abu+1)] for Kuwait Bay (A) and Gulf (B) communities. The top 30 most abundant species in the Bay and Gulf (2007–2016) are dominated by diatom species. Species counts were averaged across the 12 months of the 10-year period. Dinoflagellate species noted with a symbol (∗).
Seasonal patterns in community composition and the underlying environmental drivers were explored using matched environmental and phytoplankton data averaged for each month over the decade. Significant differences in community composition occurred between the Gulf and the Bay (ANOSIM R = 0.35, p = 0.001, test between sites using months as samples). Seasonal cycling in community composition is evident, both in the Bay (Figure 7A), and to a lesser extent in the Gulf (Figure 7B) and significantly corresponded to the yearly cyclicity model (Gulf: ρ = 0.129, p = 0.04, Bay ρ = 0.454, p = 0.001). The MDS shows the average monthly phytoplankton community, where months in proximity in the ordination space are most similar and months separated are most dissimilar. Consecutive months are linked with a trajectory line. The low ρ-values for the Gulf are in part due to the low resemblance of the February communities (Figure 7B) reducing the fit with the model in the Gulf. It should be noted that only 3 years of matched monthly data was available during February in the Gulf, and diversity indices with the full data set indicate the result may be driven by a lack of data rather than a significant shift in community composition in February. The PCA of the environmental data shows a transition between the warmer summer months (May–October), typified by lower nutrients and TSS, and winter months (November–April) characterized by lower temperature and higher DO (Figures 7C,D). Seasonal cycling of the average environmental parameters was evident in the Bay (ρ = 0.501, p = 0.001) and in the Gulf (ρ = 0.530, p = 0.001).
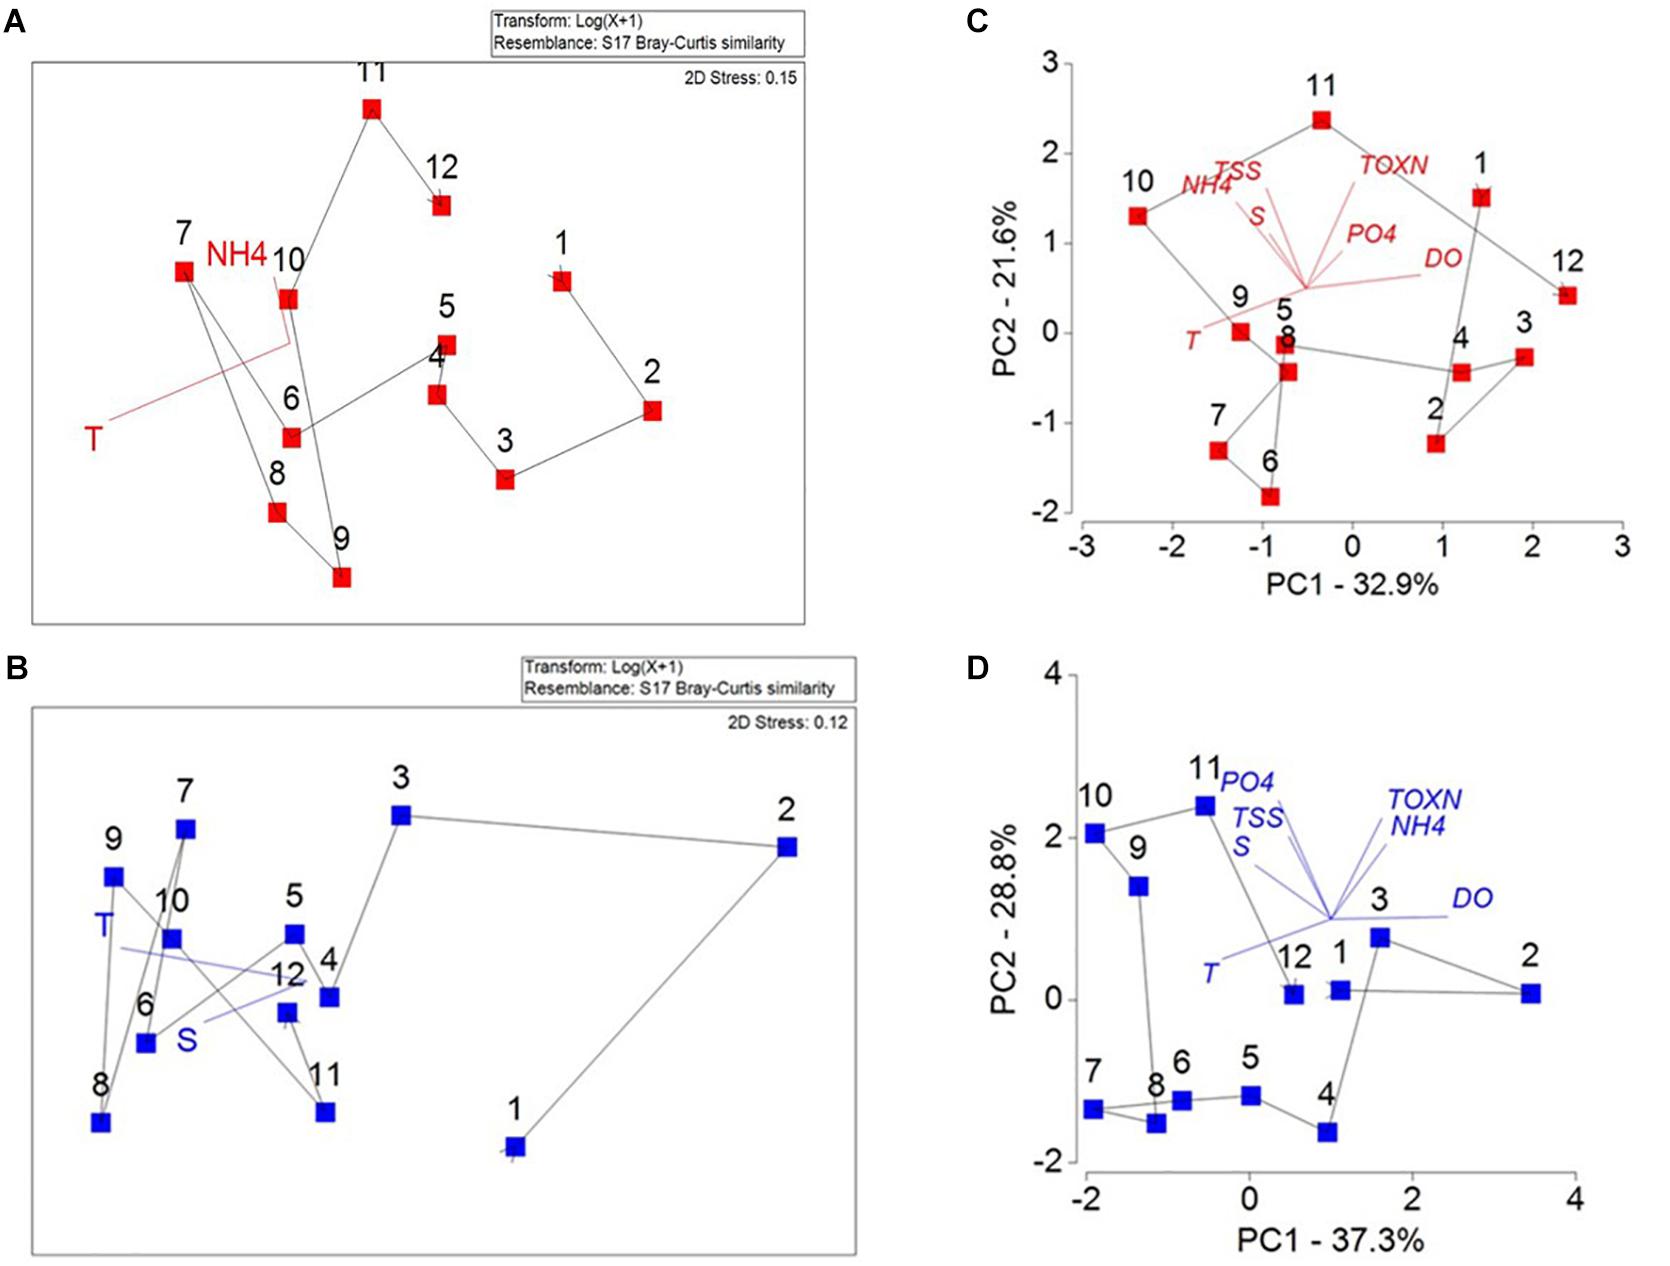
Figure 7. Non-metric Multidimensional Scale (n-MDS) plots of the average seasonal plankton community in the (A) Bay and (B) Gulf. Vectors illustrate the results of BEST analysis on all monthly data showing the most important environmental drivers on the community compositions. Principal component analysis (PCA) of the average seasonal environmental parameters in the (C) Bay and (D) Gulf. Axis values indicate the scores of the principle components PC-1 and PC-2, vectors show the direction of increasing value of each parameter. Months are displayed numerically and a trajectory line links corresponding months.
Environmental variables (excluding DO due to the intercorrelation with temperature) were matched to the community composition using all the monthly data from 2007 to 2016 for the Bay and the Gulf. In Kuwait Bay the within year environmental variables with the BEST correlation coefficient (0.415) to the seasonal community composition were NH4 and temperature (p < 0.05) (Table 1). Individually, temperature and NH4+ (0.225 and 0.224, respectively) are the most highly correlated factors to the community composition. In the Gulf the BEST suite of environmental variables correlating to 0.409 of variation in the community composition are salinity and temperature (p < 0.01). Temperature is the single factor most highly correlated with the changes in community composition in the Gulf (0.371). The environmental factors with the greatest bearing on the seasonal community composition have been overlaid as vectors in the average seasonal MDS ordination (Figure 7).

Table 1. Environmental variables correlated to patterns in the seasonal community composition of phytoplankton in the Kuwait Bay and Gulf.
Temporal Changes in Phytoplankton Community
Monthly long-term abundance (LnA) and biomass (LnBio) changes were plotted for Kuwait Bay (Figure 8A) and the Gulf (Figure 8B) communities for the top 30 occurring species identified in Figure 6. The top 30 species varied between the Bay and the Gulf in terms of abundance and biomass ranking. Coscinodiscus spp., Guinardia flaccida, G. striata, L. annulata and species of the genus Rhizosolenia, accounted for the highest biomass across the time series, both in the Bay and Gulf, indicating that larger (less abundant) taxa were more important in terms of carbon than smaller but more abundant taxa (e.g., Chaetoceros spp.). These same three species also had high abundances, but seasonal abundance was noted in many species, with higher counts, particularly in 2010, in the Bay communities.
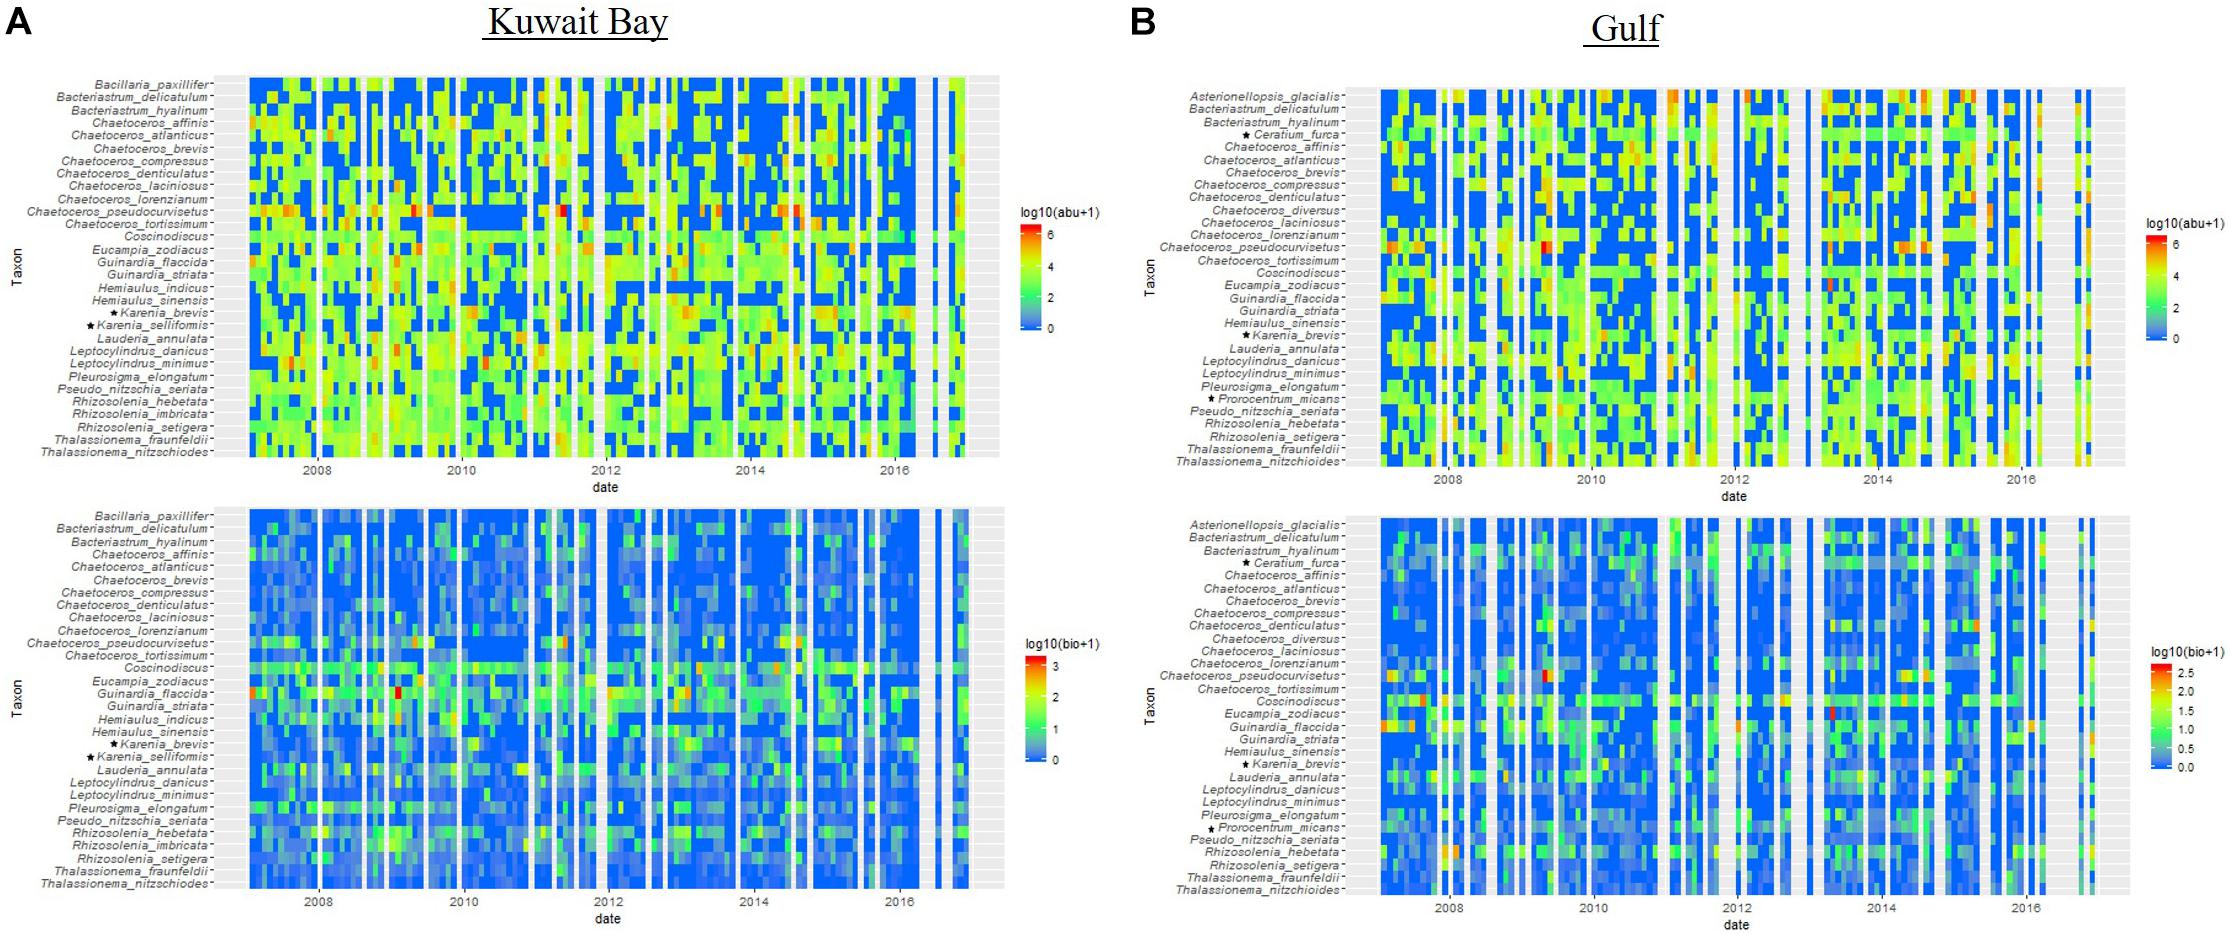
Figure 8. Long-term changes (2007–2016) in the monthly abundances and biomass values for the top 30 species in (A) Kuwait Bay and the (B) Gulf. Three species accounted for the highest biomass in both Bay and Gulf communities with several species accounting for the higher abundances across the years. Dinoflagellate species are noted with a symbol (∗).
The two dinoflagellates species in the top 30 for the Bay (Karenia brevis, Karenia selliformis) have high abundances in 2010 and 2013 in the Bay, with peaks in biomass in 2010 and 2013. Dinoflagellates in the Gulf communities (Karenia brevis, Prorocentrum micans, Ceratium furca) have high abundances in most years but only small contributions to the biomass in the Gulf.
We looked further at the HABs species to see if there was any further evidence of HABS increasing in frequency and the environmental drivers (using the reduced data set). A total of 39 species listed as being potential HABs based on a review of the HABs of Kuwait (Al-Yamani et al., 2012) and the Intergovernmental Oceanographic Commission UNESCO HAB database2 were identified from the species list. The frequency of these HABs species, the maximum counts and number of calendar months in the year they are present in the phytoplankton for the Bay and the Gulf communities is provided in Table 2. Overall, no clear trends in abundance of HABs over the period 2007–2016 were observed, however some species showed differences over the time period. Ceratium fusus increases in the Gulf but decreases in the Bay. Neurotoxin producing Karenia brevis significantly increases in the Bay, particularly during February and March.
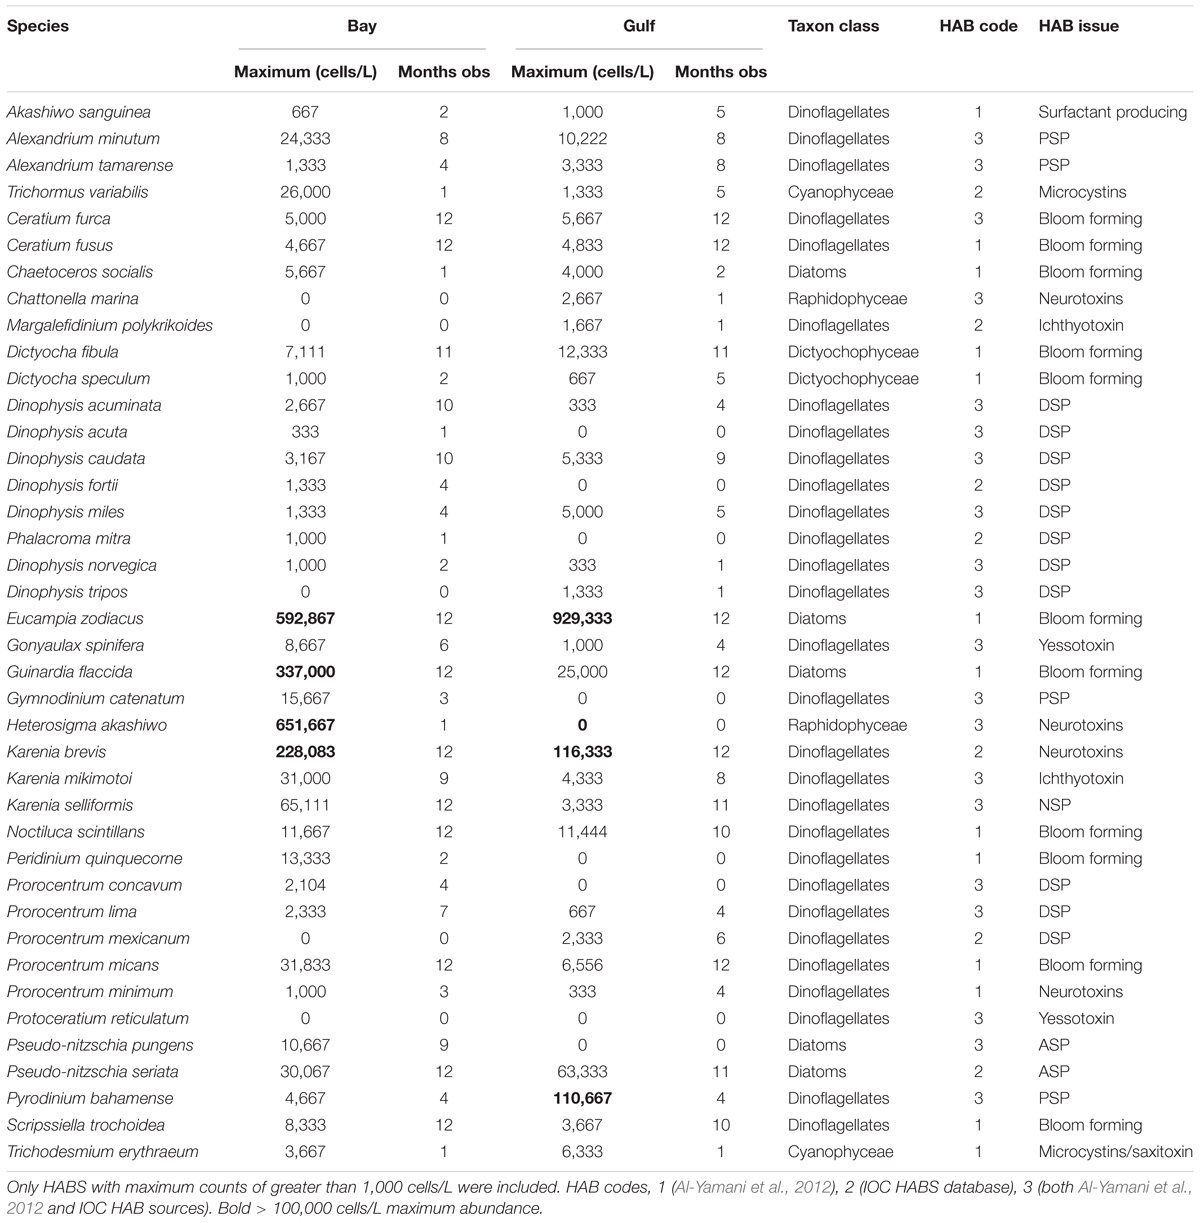
Table 2. Maximum values of HAB species counted in the phytoplankton community over the period 2007–2016 using matched data (63 months in the Gulf, 72 months in the Bay).
The temporal changes between 2007 and 2016 in two major plankton lifeforms (diatoms and dinoflagellates) was investigated further through analyzing the community change over time. The temporal analysis of two lifeform indicators, based on a functional group approach, have proved relevant for the description of plankton community structure and biodiversity (Gallego et al., 2012; Garmendia et al., 2013) and have been used to assess community response to pressures such as sewage pollution (Tett et al., 2008, 2013). The annually calculated PI values with respect to the chosen 2007–2009 “reference period” indicate change in community since the initial observations with the current method (Figure 9). The overall PI for 2010–2016 is 0.53 for the Bay and 0.49 in the Gulf, indicating that about 50% of the observations from the most recent 7 years fall outside the reference period defined by the first 3 years of observations. In the Bay, the change appears to be driven by lower counts of diatoms which occur during all seasons, and both higher and lower counts of dinoflagellates during all seasons. In the Gulf, there is little change in the diatom community, but an increase in dinoflagellates. Looking at each year since 2009 individually, while there is no strong trend, the most recent years are the most different (lowest PI) which suggests that the community structure is continuing to shift over time, with the rate of change increasing in recent years. While a change in community does not, in itself, signify a negative change, the results of the lifeform analysis suggests the Kuwait phytoplankton community, in terms of the two major lifeforms, are experiencing ongoing alterations in community structure and composition.
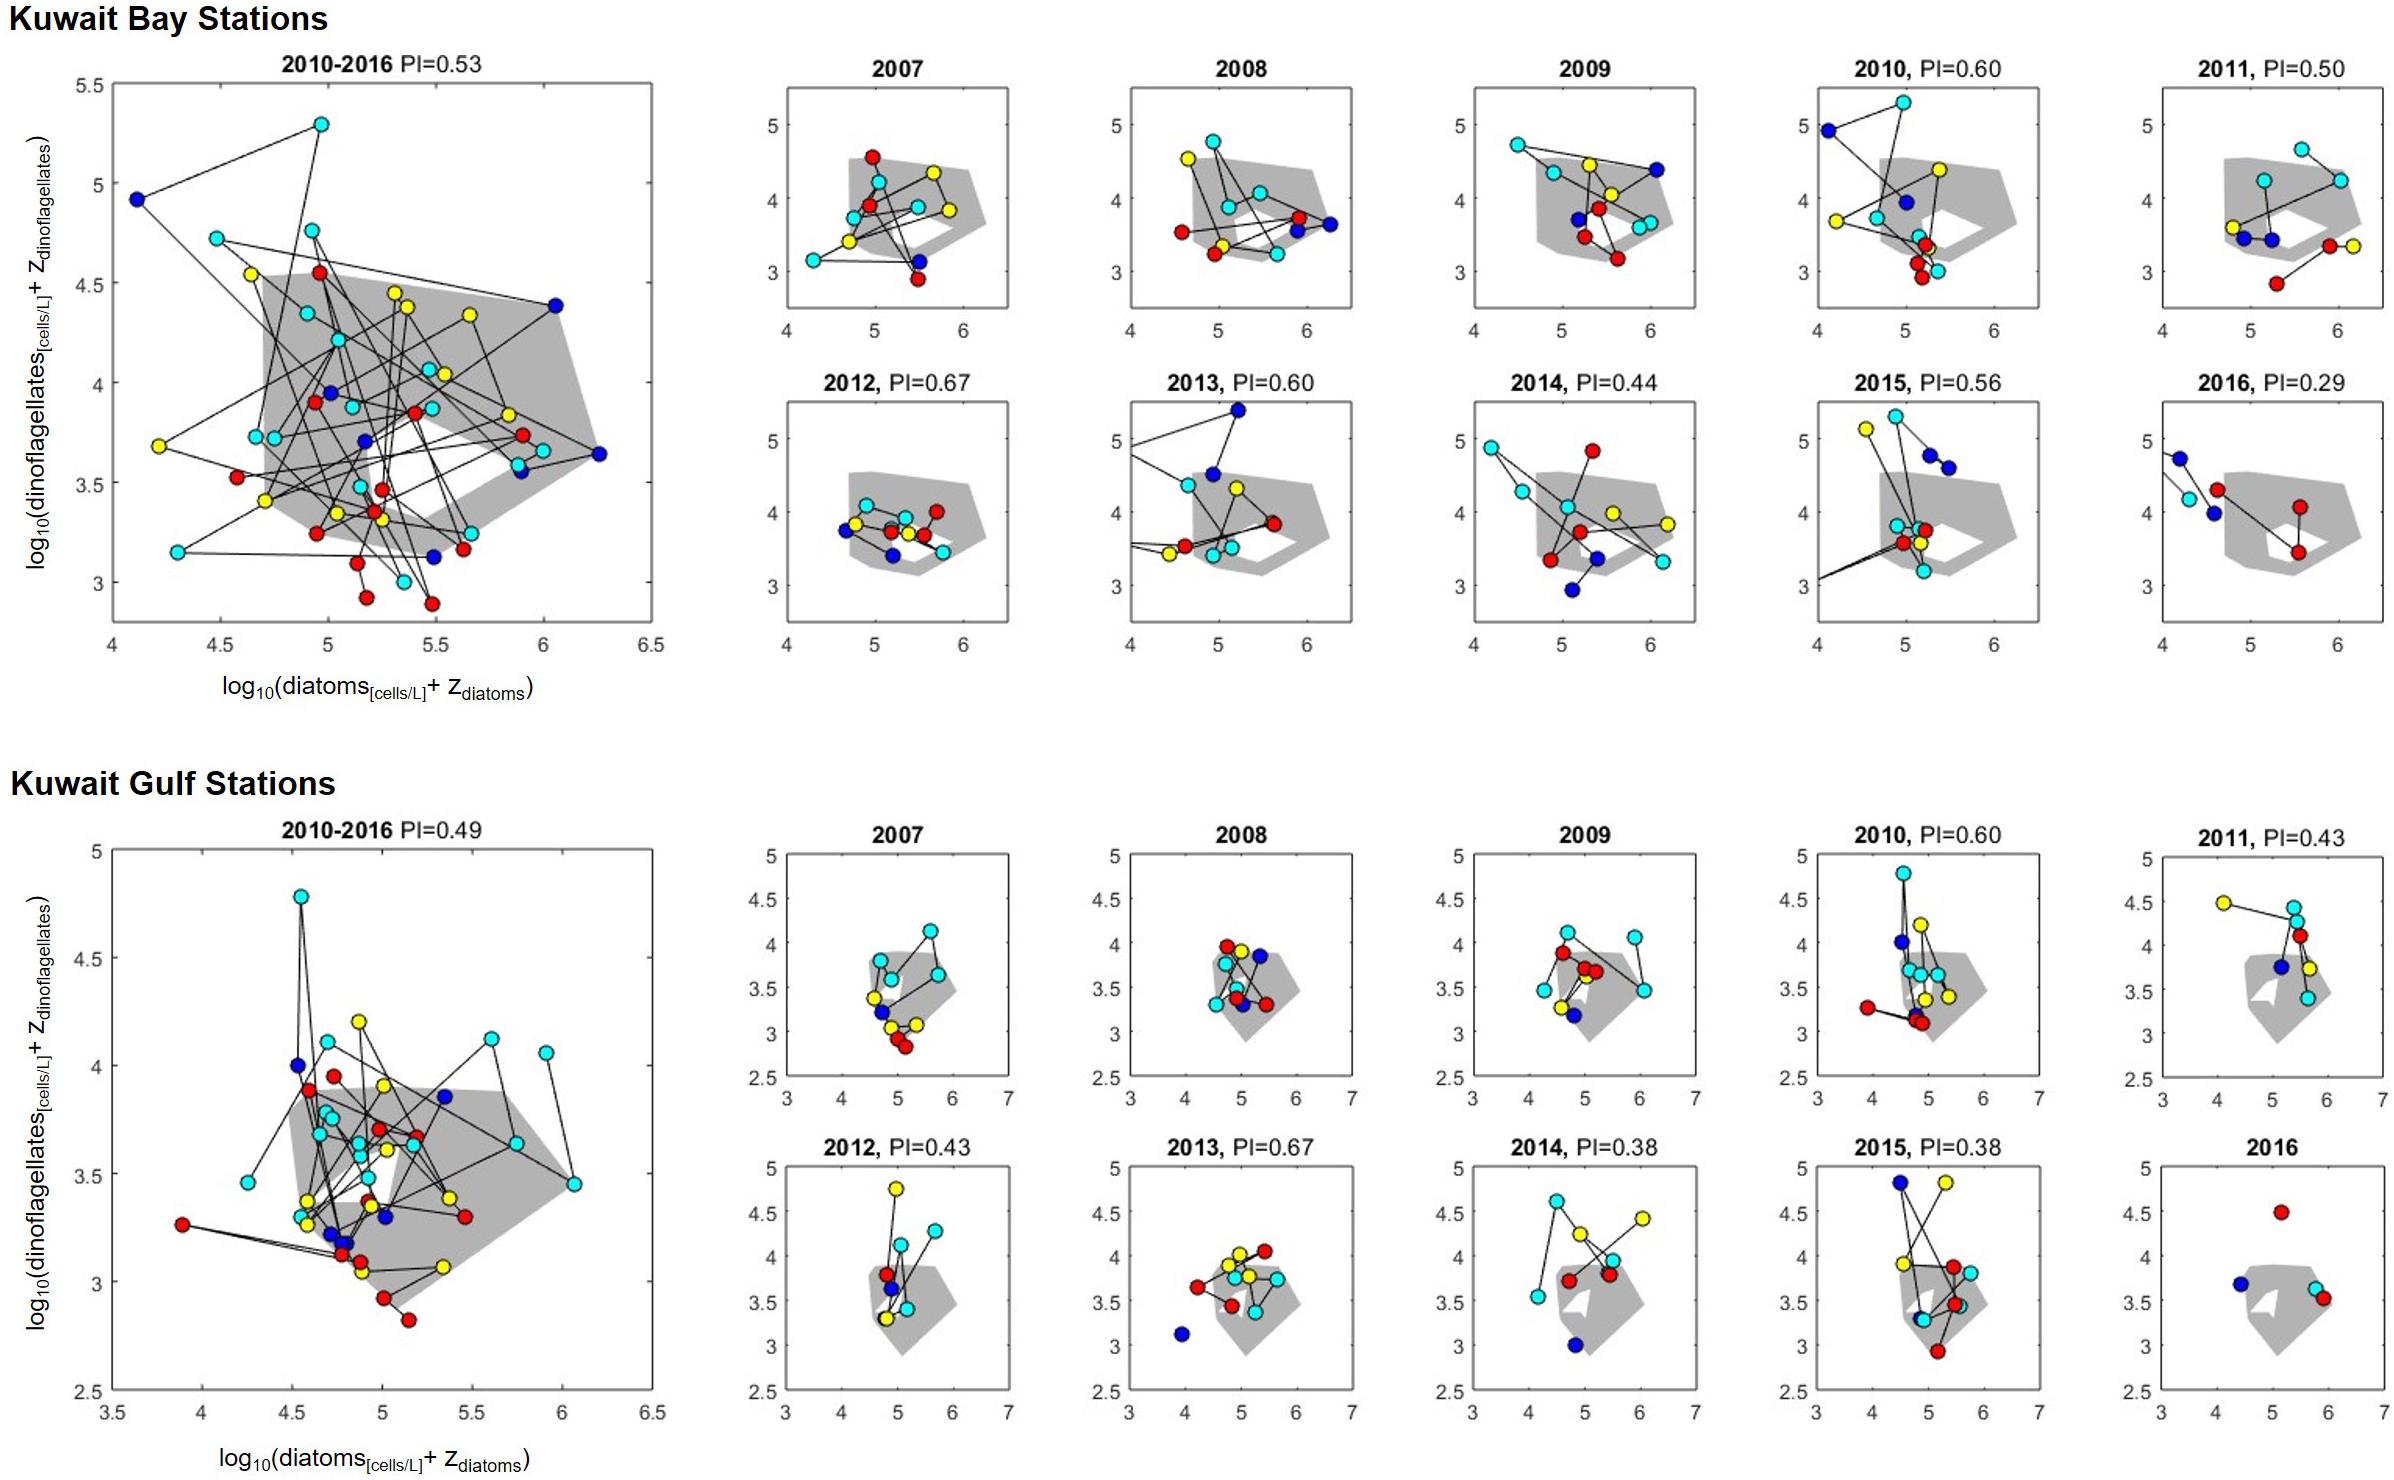
Figure 9. Multi-year (large left-hand plots) and annual (smaller right-hand plots) lifeform-pair plots and PI values for the period 2010 and 2016 relative to the chosen reference period (2007–2009) for Kuwait Bay (upper plots) and Gulf (lower plots). The gray region indicates the reference enveloped defined to include 90% of the data from the reference period. Plotted circles are monthly observations of diatom and dinoflagellate abundance (cells/L, log and zero transformed), colored by season (January and February: dark blue; March–June: light blue; July–September: yellow; October–December: red), and connected in chronological order (black line, broken for month’s without observations). No PI value is given for years in the reference period, as this is defined to be ≥0.9, nor for Gulf in 2016, as there are fewer than 6 months of observations for that region in that year.
Although the Bay and Gulf sites presented similar phytoplankton community structure (with diatoms dominating both in terms of abundance and biomass), the trends of the total abundance and biomass at the two areas (calculated as sum of all abundances or biomass in a given sample) (Figure 10) were opposite, particularly in recent years. In fact, in the Bay, total phytoplankton abundance and biomass showed a decline, while in the Gulf both phytoplankton abundances and biomass showed an increasing trend.
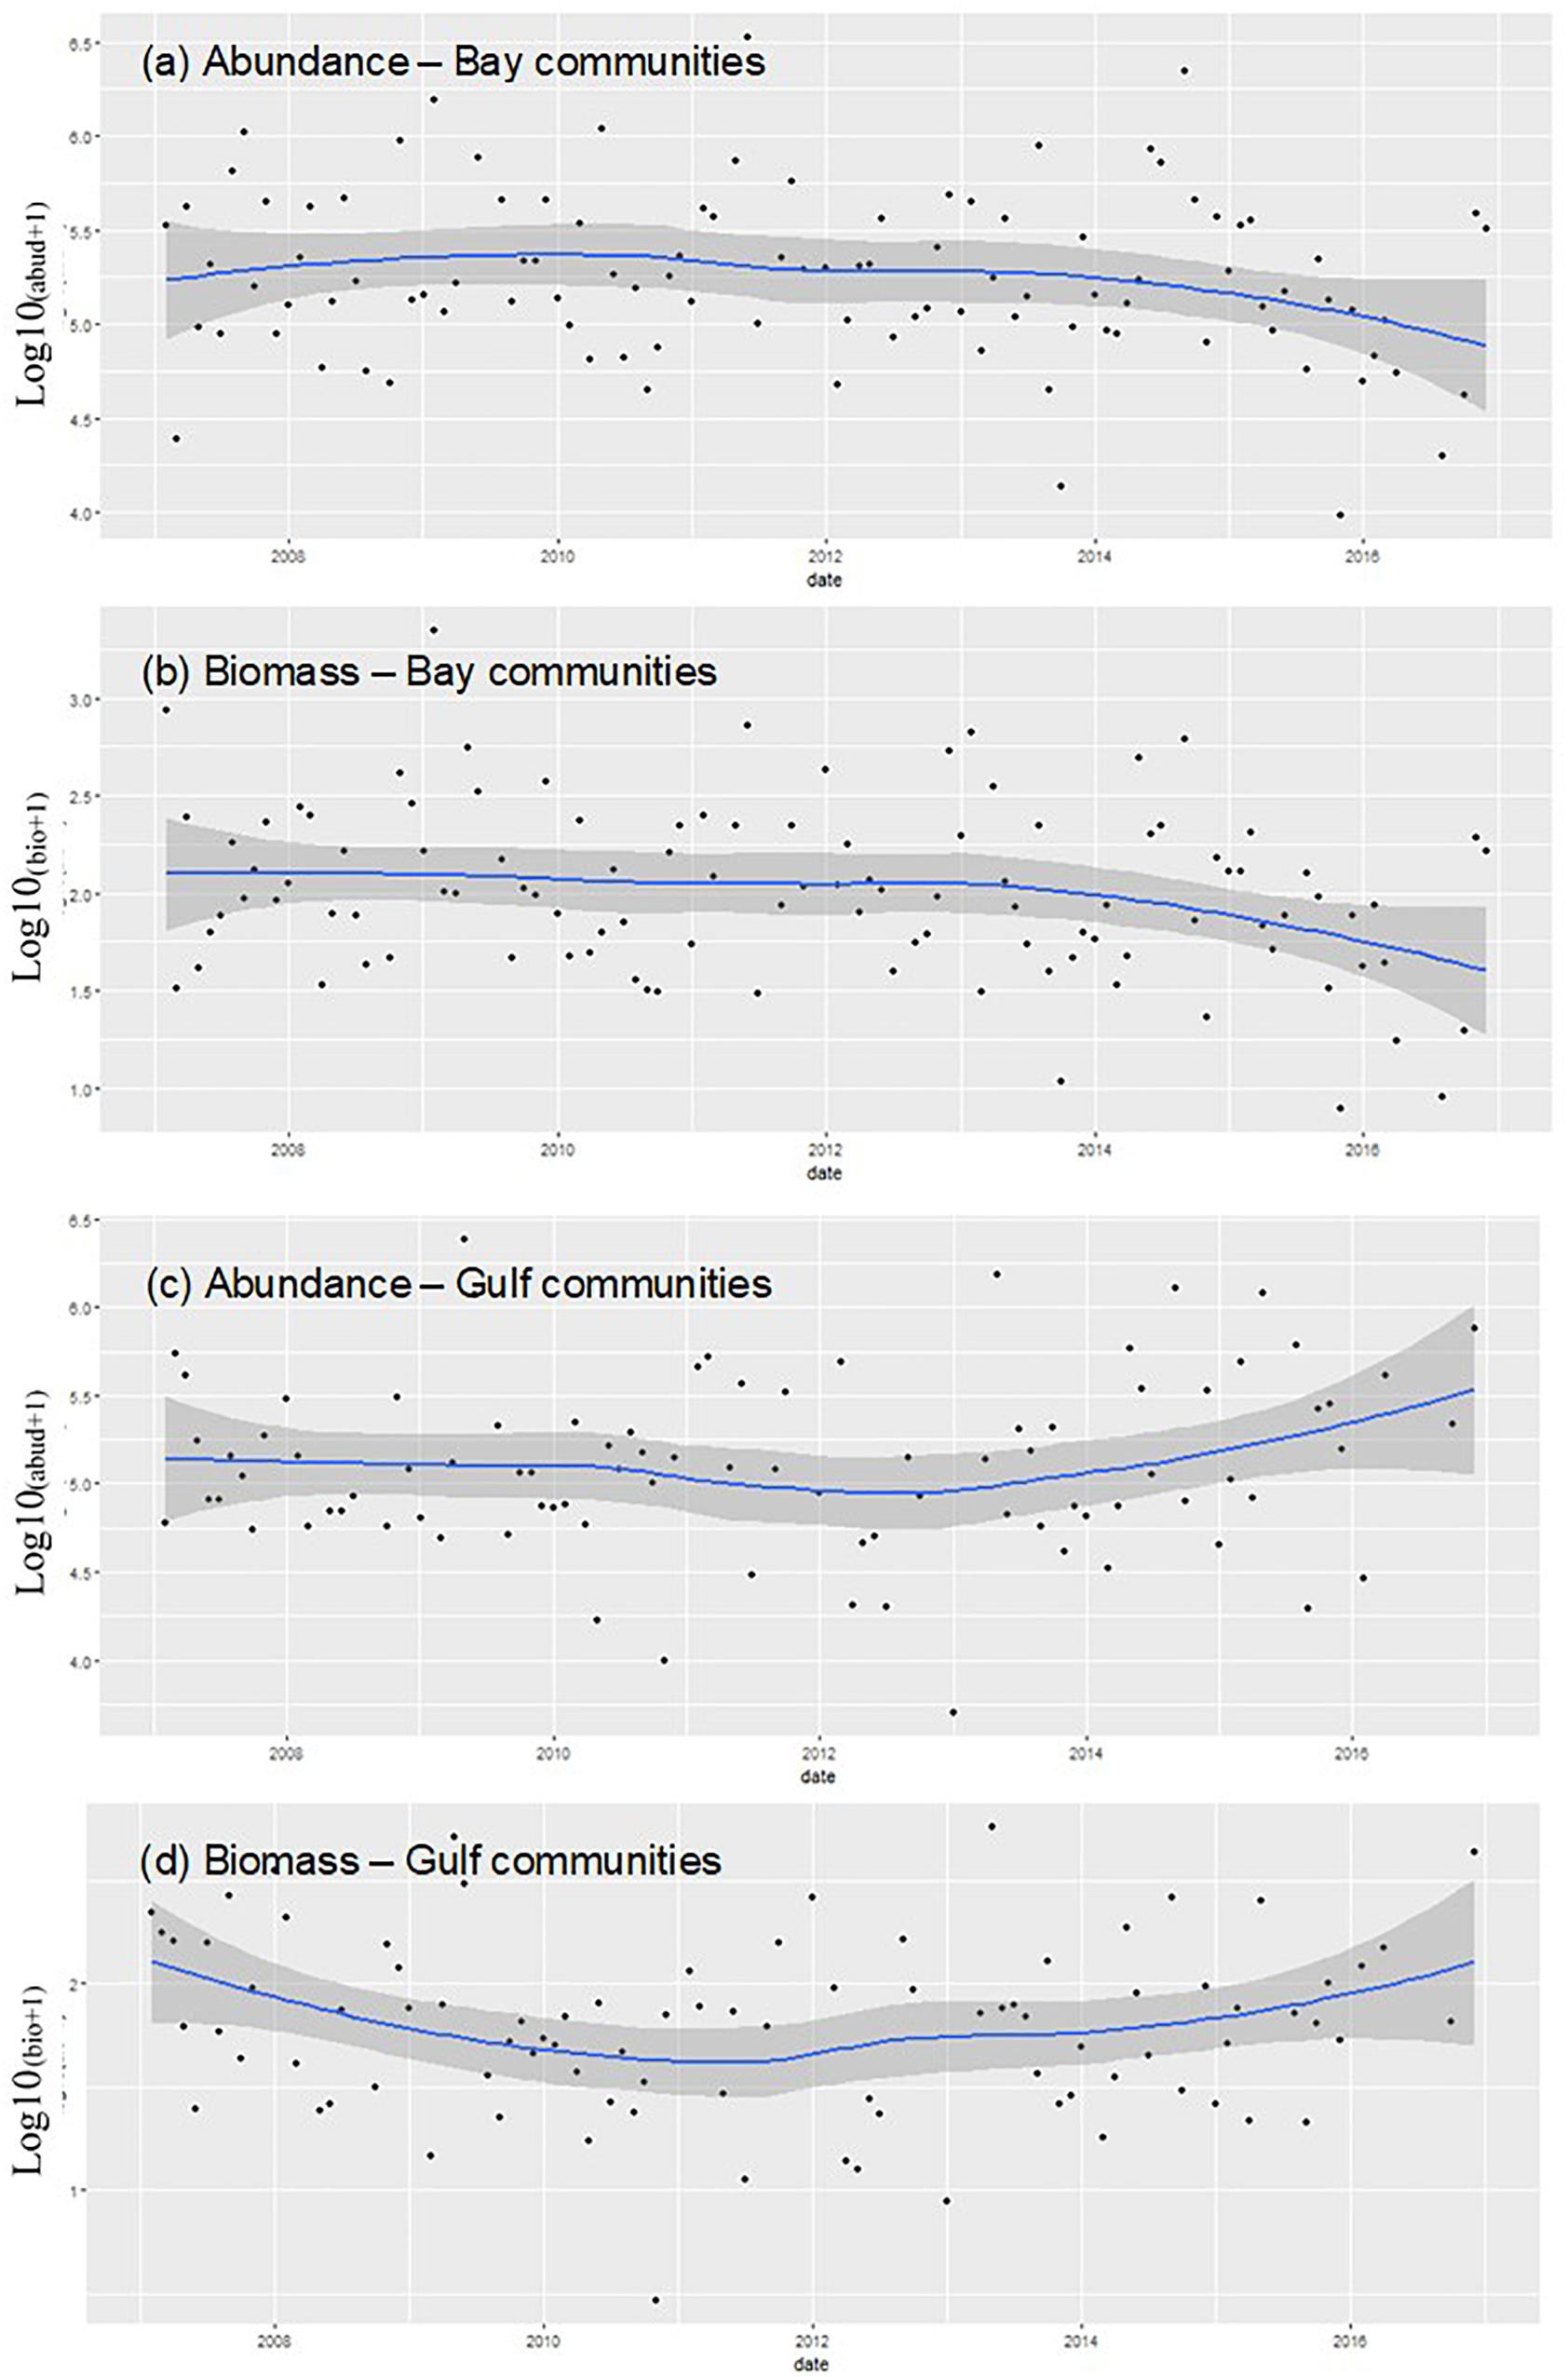
Figure 10. Logged values of phytoplankton abundance and biomass plotted against time (2007–2016) for (a) phytoplankton abundance and (b) phytoplankton biomass for sites within Kuwait Bay and for (c) phytoplankton abundance and (d) phytoplankton biomass (Chl-a) for sites within the Gulf. Trends over time were explored by the fitting of a local polynomial regression line to the monthly phytoplankton values for abundance and biomass.
Drivers of Change in Phytoplankton Community
The analysis on the long-term environmental data shows some significant changes occurring in many of the environmental parameters in both the Bay and Gulf coastal waters. There are many cumulative impacts that are driving these changes and the different statistical approaches presented in this paper provide some useful insights into the main drivers of environmental and community variability. The environmental correlations were explored in relation to seasonality and temporal changes. Potential drivers of this seasonal and temporal variability are also briefly discussed (Table 3).
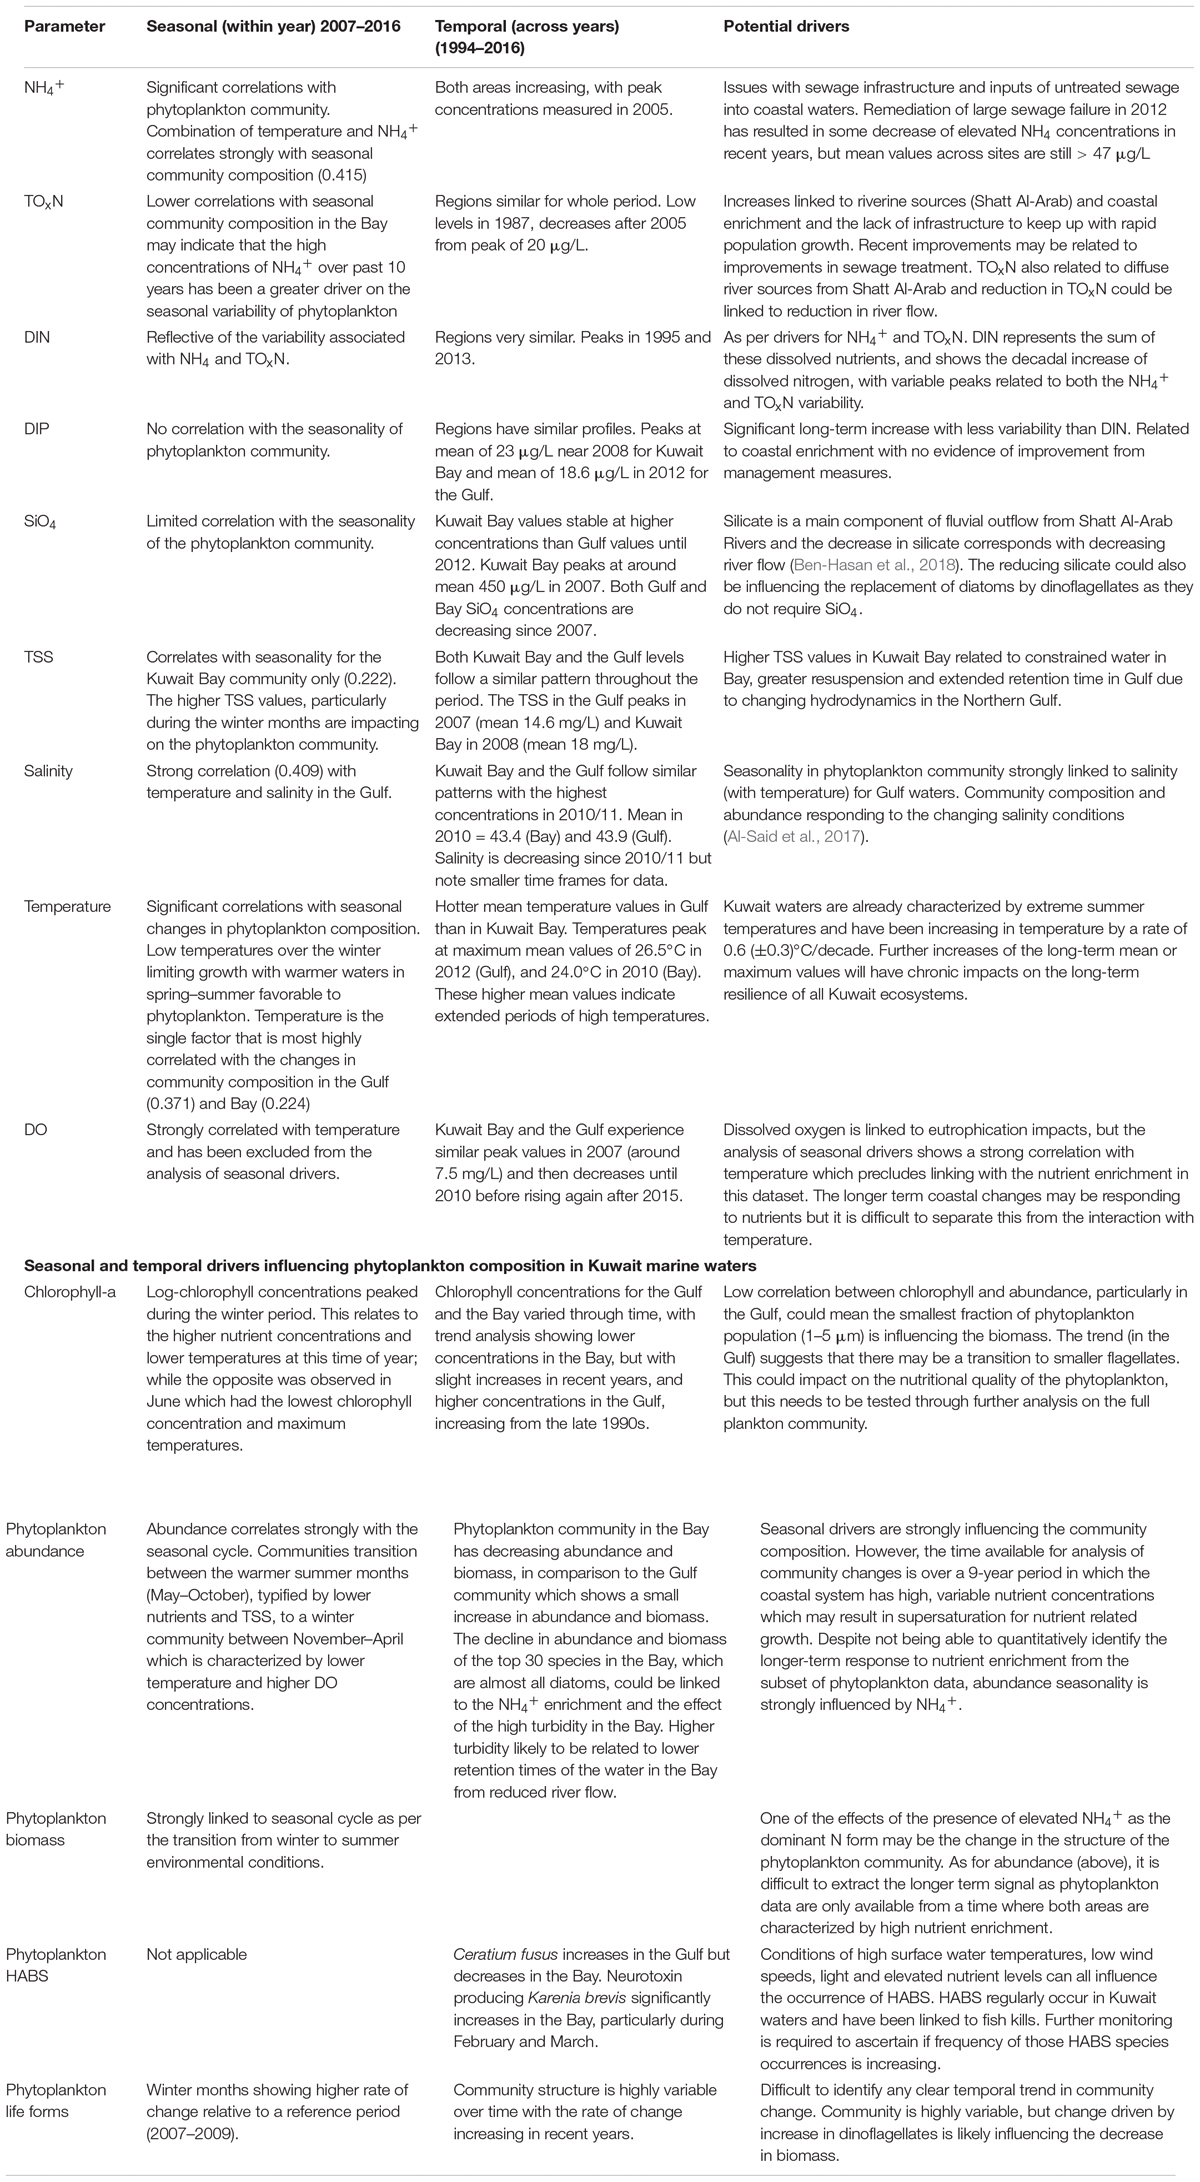
Table 3. Summary of the variable trends in the environmental parameters (dissolved nutrients, TSS, salinity and temperature and phytoplankton community descriptors (Chl-a and community measures) are described over seasonality and temporal scales.
Discussion
The environmental data collected over a 33-year period by KEPA at various coastal and marine sites is a crucial baseline dataset, offering a unique long-term perspective of a changing desert coastal system, where a low nutrient system, influenced mainly by seasonal river flow from the Shatt Al-Arab river and the larger hydrodynamic movement of the Gulf waters has shifted to a high saline, turbid, nutrient-saturated system with many of the changes being recorded in the long-term data (Devlin et al., 2015a; Al-Said et al., 2017). Nutrient enrichment of Kuwait Bay and Arabian Gulf has been ongoing for over two decades, with dissolved nutrient concentrations increasing from the early 1990s coincident with changing river flow and rapid urbanization of Kuwait. Infrastructure around sewage treatment is progressing, with state of the art treatment plants in place, but with many illegal sewage outfalls and drains still directing untreated sewage into the coastal environment (Al-Sarawi et al., 2015; Lyons et al., 2015). The NH4+ signal increased rapidly from the early 2000s, and most likely related to direct sewage inputs, including the untreated sewage discharging into the Arabian Gulf (Sites Z07, Z08, Z09, Figure 1) for 3 years due to a pump malfunction (Al-Mutairi et al., 2014a,b; Saeed et al., 2015). The nutrient signal, both from NH4+ and TOxN are showing signs of reduction over the past 4 years, but with concentrations still highly elevated (mean NH4+: 47 μg/L) from the baseline concentrations measured in the early 1980s (mean NH4+: 0.7–4.0 μg/L).
However, the change in nutrient concentrations relates both to coastal sewage inputs and Gulf wide changes influencing the time scale of nutrient enrichment. The variability in the long-term trend analysis for TOxN and NH4+ indicates the changing sources of dissolved nutrients, with the strong TOxN signal related to diffuse sources from the Shatt Al-Arab river and remineralization of the NH4+. Reductions in precipitation and freshwater flow have had a dramatic impact on the hydro-environment and salinity regime of the northern Arabian Gulf (Abdullah et al., 2015; Alosairi and Pokavanich, 2017). Any analysis of phytoplankton community change needs to consider the impacts of multiple drivers influencing the phytoplankton composition and abundance (Table 3). The long-term changes in environmental parameters demonstrate that the trends, while showing substantial increases over time, have had variable dips and peaks over the three decades of monitoring. This variable movement highlights the changing pressures and inputs with early years of nutrient enrichment driven by coastal urbanization and regional riverine inputs from the Shatt Al-Arab river. The increase in TOxN is likely related to diffuse inputs from the river loads as well as local coastal inputs. Kuwait’s population has grown from just under 300,000 in 1960 to over four million in 2018 which has driven a coincident increase in sewage issues and coastal pollution. The recent years have seen the nutrient concentrations fall, particularly for TOxN which could relate to infrastructure improvements, such as sewage capture and treatment, but also the reduction in nutrient delivery from river flow. The changing hydrodynamics of the Shatt Al-Arab river can be seen in the variable salinity for both the Bay and the Gulf (Figure 3).
Changes in chlorophyll concentrations can provide a useful insight into the total phytoplankton variability (Devlin et al., 2007) due to the (generally) good agreement between planktonic primary production and algal biomass (Boyer et al., 2009). Chlorophyll concentrations for the Gulf and the Bay varied through time, with GAM analysis showing lower concentrations in the Bay compare to the Gulf and both areas showing a slight increase in recent years. Seasonally, log-chlorophyll concentration peaked during the winter period, likely as result of the higher nutrient concentrations and lower temperatures at this time of year; while the opposite was observed in June (lowest chlorophyll concentration and maximum temperature). Furthermore, seasonality drivers strongly influence the changes in phytoplankton community over the annual cycle, with higher abundances corresponding to increasing temperatures from March.
The discrepancy between the chlorophyll trend and phytoplankton abundance trend could be the result of different factors. Firstly, it is important to note that the phytoplankton community data does not take into account the smallest fractions of the phytoplankton population (i.e., picophytoplankton and nanophytoplankton < 5 μm), while the chlorophyll measurements account for the entire phytoplankton population > 1 μm. The smaller phytoplankton taxa could therefore be playing an important role where chlorophyll and/or biomass are stored in the smaller size spectrum of the phytoplankton community. In this context, Brown et al. (1999) demonstrated that picophytoplankton (particularly picoeukaryotes) accounted for up to 35% of the total phytoplankton community biomass at coastal stations of the Arabian Sea (off Oman), and even a higher proportion (up to 56%) of the primary production. Another potential reason for the discrepancy between chlorophyll and biomass is that chlorophyll is a component of the phytoplankton cell biomass, which, as seen in Figure 10, can show different temporal and species distributions compared to phytoplankton abundance. The cellular content of chlorophyll, in respect to the carbon content, varies with different factors, including the type of phytoplankton groups dominating the community, and the local environmental conditions, e.g., light, nutrient availability, and temperature (Geider, 1987; Cloern et al., 1995; Geider et al., 1997; Sathyendranath et al., 2009; Jakobsen and Markager, 2016). So, for example, in nutrient-sufficient phytoplankton, the carbon to chlorophyll ratio increases with increasing light level (at constant temperature) and decrease with increasing temperature (at constant light levels; Geider, 1987). Nutrient (nitrogen) availability is also of significant importance in affecting the carbon to chlorophyll content, as seen for example in stratified waters (Taylor et al., 1997) and in coastal waters (Jakobsen and Markager, 2016). However, N-availability is unlikely to be an issue in the nutrient-rich waters of Kuwait Bay. Finally, the discrepancy between biomass and chlorophyll trends could also be related to the uncertainty associated to the biomass calculations, particularly for the taxa lacking size measurements and for which the global cell volume estimates by Harrison et al. (2015) were used.
Diversity indices are similar in the Bay and the Gulf, with reductions in diversity and evenness in May and June. In Kuwait Bay, the colonial diatom Chaetoceros pseudocurvisetus, along with Eucampia zodiacus and Leptocylindrus minimus dominated in May, with Chaetoceros persisting in high numbers throughout the summer months. Taxa abundances are generally higher in the Gulf, with several species increasing in the spring months, including Karenia brevis. Chaetoceros pseudocurvisetus still dominates through the summer months in the Gulf. A potential explanation for the success of C. pseudocurvisetus during the summer months (when TOxN reaches the lowest values) is the ability of producing both resting spores and resting cells in response to nutrient depletion (Kuwata et al., 1993). The two resting phases maintain or reduce metabolic processes (i.e., low respiration and low photosynthetic activity) until the environmental conditions return to a favorable state. Transformation of spores or resting cell is dependent on the available SiO4 concentration, as spore cell walls are heavily silicified, while resting cell maintains an appearance similar to the vegetative state (Kuwata et al., 1993). Diversity descriptors (Figures 5A,B) show that the phytoplankton community in February, as the weather warms, differs between the Gulf and Bay with April and May having similar diversity indices between the two sites. The Kuwait Bay community is more variable in the summer to autumn months, but winter months (November to December) are characterized by distinctive populations in the Bay.
The outcomes of the n-MDS and the PCA (Figure 7) analysis show a seasonal cycle, noting that the seasonal cycle represented is based on the 10-year averages in the phytoplankton community and environmental parameters. The BEST analysis (Table 1) identifies temperature as an important environmental variable in driving seasonal community composition, explaining 0.371 in the Gulf and 0.224 in the Bay. The enclosed waters of Kuwait Bay experience slightly warmer temperatures and the combination of temperature and NH4+ is correlated to 0.415 of the seasonal community composition. Salinity and TSS are likely to play a role in the seasonal cycle in the Bay due to the higher turbidity conditions, which are influenced by the longer retention times of the Bay given the decline in Shatt Al-Arab river flow and reduced capacity for the flushing. However, the correlation of TSS and salinity to the community data was not significant (Table 1). In the Gulf salinity and temperature combine as the primary environmental variables correlated to the community composition (0.409; Table 1).
The amount and form of nitrogen available in the water (particularly whether in the reduced, NH4+, or oxidized form, e.g., NO3-) have important implications for the productivity and for taxonomic composition of the phytoplankton community [see review by Glibert et al. (2016)]. It is generally accepted that NH4+ is the preferred form of nitrogen taken-up by phytoplankton (see Raven et al., 1992 and references therein). This is the result of two distinct processes: (1) NH4+ requires less energy to be transported by the microalgae across the cell membrane; and (2) NH4+ shows an inhibitory effect on NO3- uptake and assimilation (see Dortch, 1990 and references therein). Particularly, the inhibitory effect of NH4+ can manifest at different concentrations; for example, at concentrations lower than 50 nmol L-1 in the oligotrophic waters of the Atlantic Ocean (L’helguen et al., 2008), or at concentrations > 4 μmol L-1 in San Francisco Bay (Dugdale et al., 2007). The inhibitory effect of NH4+ on NO3- uptake (in conjunction with changes in the phytoplankton community associated to high NH4+), can ultimately result in reduced productivity of phytoplankton community (Dugdale et al., 2007; Glibert et al., 2014). An example is presented by the San Francisco Bay Delta where increased NH4+ concentration in the estuary due to sewage effluents from wastewater treatment plants, in combination with turbid conditions, has been shown to modulate occurrence of spring blooms and chlorophyll concentration, with consequences for the higher trophic levels (Dugdale et al., 2007; Glibert et al., 2014).
The TOxN concentration in the Bay is likely influenced by industrial and sewage discharges and reduced flow from the Shatt Al Arab river driving longer retention times for remineralization. Ongoing sewage failures have kept the NH4+ concentration high, though there is a small decrease in NH4+ in past 3 years which matches the timing of improvements in sewage infrastructure (Saeed et al., 2012b, 2015; Lyons et al., 2015). It could be expected that the high NH4+ concentration in Kuwait Bay and Gulf (and its inhibitory effect on NO3- uptake), particularly in the 2000s, would be affecting phytoplankton composition and productivity. As support of this hypothesis, the decrease in NH4+ (occurring in the last 4 years of the time series) was concomitant with a small increase in phytoplankton abundance and biomass in the Gulf communities, and with an increase in chlorophyll concentration in both Gulf and Bay (Figure 3).
One of the effects of the presence of NH4+ as dominant N form may be the change in the structure of the phytoplankton community. With NH4+ as the dominant nitrogen form in warm waters phytoplankton groups such as cryptophytes, dinoflagellates, cyanobacteria and chlorophytes may proliferate, with smaller size classes (<5 μm) driving production (Glibert et al., 2014; Glibert et al., 2016). Contrarily, with NO3- as main N-form, particularly under cooler water conditions, diatoms (cell size > 5 μm) are more likely to dominate the phytoplankton community and production (Glibert et al., 2014; Glibert et al., 2016). We could speculate that the NH4+-enrichment that occurred in the 2000s in Kuwait coastal waters may be linked to the decline in cumulative abundance and biomass of the top 30 species in the Bay, which are almost all diatoms. Interestingly, Al-Said et al. (2017) reported a change in the phytoplankton community of the Gulf of Kuwait between 2000 and 2013, with a reduction in diatom species and an increase in flagellates such as cryptophytes, and Phaeocystis globosa. However, the authors associated the change to variation in salinity rather than nutrients.
The initial analysis of HABs shows that the phytoplankton species which have been identified as HAB species are occurring in Kuwait marine waters and, for several species, in high abundances. The role of sewage effluent in stimulating or initiating HAB events in Kuwait marine waters is a key question for understanding the complex interactions between drivers and response in the phytoplankton community (Riegl et al., 2012).
This outcomes of this multi-faceted analysis show the difficulties in attributing changes in phytoplankton community to any single stressor and highlights the need to explore the cumulative and synergistic impacts of a combination of stresses including urban sewage discharge and alteration of discharge regime of Shatt Al-Arab River (Devlin et al., 2015a; Alosairi and Pokavanich, 2017).
While the multi-decadal nutrient enrichment is evident in the environmental data (1983–2016), the 10-year phytoplankton community data appears to be responding to several anthropogenic influences, all of which continue to be present in Kuwait marine waters. In an extreme environment, such as in the Bay and the Gulf marine waters, it would be expected that the temperature conditions would be the driving force in the timing of the phytoplankton community dynamics, however, temperature is now just one of several drivers with other anthropogenic factors such as salinity and dissolved nutrients influencing the seasonal phytoplankton community. Recent work (Al-Said et al., 2017; Ben-Hasan et al., 2018) has identified significant changes in phytoplankton community organization on a decadal scale and suggests that salinity-related environmental changes have resulted in a coincidental decrease in species diversity and significant changes in phytoplankton community between the years 2000 and 2013 off Kuwait. The shorter temporal trend in the phytoplankton data (2007–2016) through the analysis of lifeform changes (Figure 9) and temporal changes (Figure 10) shows a variable phytoplankton population, with a small but significant change in abundance and biomass (Figure 10). The data suggest that the phytoplankton community in the Bay has decreasing abundance and biomass, in comparison to the Gulf community which shows an increasing abundance and biomass. However, the phytoplankton community data that is available represents a period where nutrient inputs are already high and makes it difficult to resolve how the community would have responded to the long-term nutrient enrichment described in the GAM water quality plots (Figure 3). The long-term chlorophyll data does offer some perspective on what may have occurred in the phytoplankton community data, with decreasing phytoplankton biomass from the late 1990s to 2010 (Devlin et al., 2015a), attributable to higher number of dinoflagellates.
Conclusion
The work presented here demonstrates the importance of long-term datasets which provide details of the historic baseline in environmental drivers and their subsequent rate and nature of change through time. As with all regional case study approaches, there are many factors that need to be accounted for before the interactions of drivers and community impacts can be fully resolved. This study provides a first step towards this goal by highlighting the different stressors that can impact on a system already characterized by extreme conditions in temperature and salinity, such as those found in the Northern Gulf (Sheppard et al., 2010; Riegl and Purkis, 2012). In our changing world, knowledge of how these interactions with localized stressors can reduce ecosystem resilience to warming waters is critical to how managers respond when prioritising actions to reduce multiple pressures. Recent papers exploring the impacts of cumulative pressures in tropical ecosystems identify that management actions need to address local pressures as well as working on national and global scales to combat climate change (Hughes et al., 2008; Ortiz et al., 2018; Wolff et al., 2018).
For Kuwait, continued support for the long-term monitoring program and ongoing analysis of the phytoplankton community in the context of the changing environmental drivers is required to fully elucidate the contribution of individual and cumulative anthropogenic stressors to the negative changes we observe in the phytoplankton community. This information will be essential to guide management action being implemented through local, national and regional programs. Local actions towards remediating the impacts of coastal sewage outfalls, regional actions towards restoring river flows, and national actions on climate change will offer the best outcomes for the health of Kuwait marine waters and the interdependent phytoplankton communities.
Data Availability
The KEPA monitoring program data, (on which the data used in this study was extracted) and full details of the Kuwait monitoring program can be found on the eMISK website (http://www.emisk.org/emisk/). Data used in this paper is available on request following approval from the Kuwait Environment Public Authority (fahad.alajmi@epa.org.kw). The phytoplankton community data are available on request from CG (Caroline.Graves@cefas.co.uk). The water quality data are available on request from MD (michelle.devlin@cefas.co.uk).
Author Contributions
MD, MB, CG, JB, BL, WL, and EC contributed to the manuscript. FA, FH, and MA-H contributed to the data and editorial comments.
Funding
Funding for this work came from the eMisk Programme funded by the Kuwait Environment Public Authority (KEPA).
Conflict of Interest Statement
The authors declare that the research was conducted in the absence of any commercial or financial relationships that could be construed as a potential conflict of interest.
Acknowledgments
Thank you to Dieter Tracey for assistance on the maps. We would particularly like to thank all the people who have worked in the Water Quality Laboratories and on the KEPA vessels over the 30-year time period and have been responsible for the collection, analysis, and reporting of the long-term monitoring data. Your input into this work has been invaluable.
Supplementary Material
The Supplementary Material for this article can be found online at: https://www.frontiersin.org/articles/10.3389/fmars.2019.00141/full#supplementary-material
Footnotes
References
Abdullah, A. D. (2017). Modelling Approaches to Understand Salinity Variations in a Highly Dynamic Tidal River: The Case of the Shatt al-Arab River. Boca Raton, FL: CRC Press. doi: 10.1201/9781315115948
Abdullah, A. D., Masih, I., van der Zaag, P., Karim, U. F., Popescu, I., and Al Suhail, Q. (2015). Shatt al Arab River system under escalating pressure: a preliminary exploration of the issues and options for mitigation. Int. J. River Basin Manage. 13, 215–227. doi: 10.1080/15715124.2015.1007870
Al Shehhi, M. R., Gherboudj, I., and Ghedira, H. (2014). An overview of historical harmful algae blooms outbreaks in the Arabian Seas. Mar. Pollut. Bull. 86, 314–324. doi: 10.1016/j.marpolbul.2014.06.048
Al-Azri, A. R., Piontkovski, S. A., Al-Hashmi, K. A., Goes, J. I., Gomes, H. D. R., and Glibert, P. M. (2014). Mesoscale and nutrient conditions associated with the massive 2008 Cochlodinium polykrikoides bloom in the Sea of Oman/Arabian Gulf. Estuaries Coast. 37, 325–338. doi: 10.1007/s12237-013-9693-1
Al-Ghadban, A., Al-Majed, N. N., and Al-Muzaini, S. (2001). “The state of marine pollution in Kuwait: Northern Arabian Gulf,” in Proceedings of the International Conference on the Impact of Environmental Pollution on Development in the Gulf Region, eds M. Al-Sarawi and M. Massoud (Kuwait: Environment Public Authority), 97–131.
Al-Handal, A. Y. (2009). Littoral diatoms from the Shatt Al-Arab estuary, North-West Arabian Gulf. Cryptogam. Algol. 30, 153–183.
Al-Jufaili, S., Al-Jabri, M., Al-Baluchi, A., Baldwin, R., Wilson, S., West, F., et al. (1999). Human impacts on coral reefs in the Sultanate of Oman. Est. Coast. Shelf Sci. 49, 65–74. doi: 10.1016/S0272-7714(99)80010-9
Al-Kandari, M., Al-Yamani, F. Y., and Al-Rifaie, K. (2009). Marine Phytoplankton Atlast of Kuwait’s Waters. Kuwait: Kuwait Institute for Scientific Research.
Al-Mutairi, N., Abahussain, A., and Al-Battay, A. (2014a). Environmental assessment of water quality in kuwait bay. Int. J. Environ. Sci. Dev. 5, 527–532. doi: 10.7763/IJESD.2014.V5.539
Al-Mutairi, N., Abahussain, A., and El-Battay, A. (2014b). Spatial and temporal characterizations of water quality in Kuwait Bay. Mar. Pollut. Bull. 83, 127–131. doi: 10.1016/j.marpolbul.2014.04.009
Al-Omran, L. A. G. (1998). Coprostanol in the intertidal sediments of Kuwait. Case study on urban sewage contamination. Int. J. Environ. Stud. 55, 87–100. doi: 10.1080/00207239808711169
Alosairi, Y., and Pokavanich, T. (2017). Residence and transport time scales associated with Shatt Al-Arab discharges under various hydrological conditions estimated using a numerical model. Mar. Pollut. Bull. 118, 85–92. doi: 10.1016/j.marpolbul.2017.02.039
Al-Said, T., Al-Ghunaim, A., Rao, D. S., Al-Yamani, F., Al-Rifaie, K., and Al-Baz, A. (2017). Salinity-driven decadal changes in phytoplankton community in the NW Arabian Gulf of Kuwait. Environ. Monit. Assess. 189:268. doi: 10.1007/s10661-017-5969-4
Al-Sarawi, H. A., Jha, A. N., Al-Sarawi, M. A., and Lyons, B. P. (2015). Historic and contemporary contamination in the marine environment of Kuwait: an overview. Mar. Pollut. Bull. 100, 621–628. doi: 10.1016/j.marpolbul.2015.07.052
Al-Sarawi, H. A., Jha, A. N., Baker-Austin, C., Al-Sarawi, M. A., and Lyons, B. P. (2018). Baseline screening for the presence of antimicrobial resistance in E. coli isolated from Kuwait’s marine environment. Mar. Pollut. Bull. 129, 893–898. doi: 10.1016/j.marpolbul.2017.10.044
Al-Yamani, F. (2008). “Importance of the freshwater influx from the Shatt-Al-Arab River on the Gulf marine environment,” in Protecting the Gulf’s Marine Ecosystems from Pollution, A. H. Abuzinada, H.-J. Barth, F. Krupp, B. Böer, and K. Al-Rifaie (Berlin: Springer), 207–222.
Al-Yamani, F., Bishop, J., Al-Rifaie, K., and Ismail, W. (2007). The effects of the river diversion, Mesopotamian marsh drainage and restoration, and river damming on the marine environment of the northwestern Arabian Gulf. Aquat. Ecosyst. Health Manag. 10, 277–289. doi: 10.1080/14634980701512384
Al-Yamani, F., Saburova, M., and Polikarpov, I. (2012). A preliminary assessment of harmful algal blooms in Kuwait’s marine environment. Aquat. Ecosyst. Health Manag. 15, 64–72. doi: 10.1080/14634988.2012.679450
Al-Yamani, F., Subba Rao, D., Mharzi, A., Ismail, W., and Al-Rifaie, K. (2006). Primary production off Kuwait, an arid zone environment, Arabian Gulf. Int. J. Oceans Oceanogr. 1, 67–85.
Al-Yamani, F., Yamamoto, T., Al-Said, T., and Alghunaim, A. (2017). Dynamic hydrographic variations in northwestern Arabian Gulf over the past three decades: temporal shifts and trends derived from long-term monitoring data. Mar. Pollut. Bull. 122, 488–499. doi: 10.1016/j.marpolbul.2017.06.056
Al-Yamani, F. Y., Bishop, J., Ramadhan, E., Al-Husaini, M., and Al-Ghadban, A. (2004). Oceanographic atlas of Kuwait’s Waters. Kuwait: Kuwait Institute for Scientific Research.
Ben-Hasan, A., Walters, C., Christensen, V., Al-Husaini, M., and Al-Foudari, H. (2018). Is reduced freshwater flow in Tigris-Euphrates rivers driving fish recruitment changes in the Northwestern Arabian Gulf? Mar. Pollut. Bull. 129, 1–7. doi: 10.1016/j.marpolbul.2018.02.012
Bishop, J. M., Chen, W., Alsaffar, A. H., and Al-Foudari, H. M. (2011). Indirect effects of salinity and temperature on Kuwait’s shrimp stocks. Estuaries Coast. 34, 1246–1254. doi: 10.1007/s12237-011-9384-8
Boyer, J. N., Kelble, C. R., Ortner, P. B., and Rudnick, D. T. (2009). Phytoplankton bloom status: Chlorophyll a biomass as an indicator of water quality condition in the southern estuaries of Florida, USA. Ecol. Indic. 9, S56–S67. doi: 10.1016/j.ecolind.2008.11.013
Brown, B. E., Dunne, R., Ambarsari, I., Le Tissier, M., and Satapoomin, U. (1999). Seasonal fluctuations in environmental factors and variations in symbiotic algae and chlorophyll pigments in four Indo-Pacific coral species. Mar. Ecol. Prog. Ser. 191, 53–69. doi: 10.3354/meps191053
Burt, J. A. (2013). The growth of coral reef science in the Gulf: a historical perspective. Mar. Pollut. Bull. 72, 289–301. doi: 10.1016/j.marpolbul.2013.05.016
Caron, D. A., Gellene, A. G., Smith, J., Seubert, E. L., Campbell, V., Sukhatme, G. S., et al. (2017). Response of phytoplankton and bacterial biomass during a wastewater effluent diversion into nearshore coastal waters. Estuar. Coast. Shelf Sci. 186, 223–236. doi: 10.1016/j.ecss.2015.09.013
Clarke, K., and Warwick, R. (1994). An approach to statistical analysis and interpretation. Change Mar. Communities 2, 117–143.
Cloern, J. E., Grenz, C., and Vidergar-Lucas, L. (1995). An empirical model of the phytoplankton chlorophyll: carbon ratio-the conversion factor between productivity and growth rate. Limnol. Oceanogr. 40, 1313–1321. doi: 10.4319/lo.1995.40.7.1313
Devlin, M., Barry, J., Painting, S., and Best, M. (2009). Extending the phytoplankton tool kit for the UK Water Framework Directive: indicators of phytoplankton community structure. Hydrobiologia 633, 151–168. doi: 10.1007/s10750-009-9879-5
Devlin, M., Best, M., Coates, D., Bresnan, E., O’Boyle, S., Park, R., et al. (2007). Establishing boundary classes for the classification of UK marine waters using phytoplankton communities. Mar. Pollut. Bull. 55, 91–103. doi: 10.1016/j.marpolbul.2006.09.018
Devlin, M. J., Massoud, M., Hamid, S., Al-Zaidan, A., Al-Sarawi, H., Al-Enezi, M., et al. (2015a). Changes in the water quality conditions of Kuwait’s marine waters: Long term impacts of nutrient enrichment. Mar. Pollut. Bull. 100, 607–620. doi: 10.1016/j.marpolbul.2015.10.022
Devlin, M. J., Le Quesne, W. J., and Lyons, B. P. (2015b). The marine environment of Kuwait—emerging issues in a rapidly changing environment. Mar. Pollut. Bull. 2, 593–596. doi: 10.1016/j.marpolbul.2015.11.046
Dorgham, M., and Moftah, A. (1989). Environmental conditions and phytoplankton distribution in the Arabian Gulf and Gulf of Oman, September 1986. J. Mar. Biol. Assoc. India 31, 36–53.
Dortch, Q. (1990). The interaction between ammonium and nitrate uptake in phytoplankton. Mar. Ecology Prog. Ser. 61, 183–201. doi: 10.1093/femsec/fiy150
Dugdale, R. C., Wilkerson, F. P., Hogue, V. E., and Marchi, A. (2007). The role of ammonium and nitrate in spring bloom development in San Francisco Bay. Estuar. Coast. Shelf Sci. 73, 17–29. doi: 10.1016/j.ecss.2006.12.008
Edler, L. (1979). Recommendations for marine biological studies in the Baltic Sea: phytoplankton and chlorophyll. Baltic Mar. Biol. 5, 1–38.
El-Gindy, A., and Dorgham, M. (1992). Interrelations of Phytoplankton, Chlorophyll and Physic-Chemical Factors in Arabian Gulf and Gulf of Oman During Summer. Available at: http://nopr.niscair.res.in/handle/123456789/38119
Foden, J., Devlin, M. J., Mills, D. K., and Malcolm, S. J. (2010). Searching for undesirable disturbance: an application of the OSPAR eutrophication assessment method to marine waters of England and Wales. Biogeochemistry 106, 157–175. doi: 10.1007/s10533-010-9475-9
Gallego, I., Davidson, T. A., Jeppesen, E., Perez-Martinez, C., Sanchez-Castillo, P., Juan, M., et al. (2012). Taxonomic or ecological approaches? Searching for phytoplankton surrogates in the determination of richness and assemblage composition in ponds. Ecol. Indic. 18, 575–585. doi: 10.1016/j.ecolind.2012.01.002
Garmendia, M., Borja,Á, Franco, J., and Revilla, M. (2013). Phytoplankton composition indicators for the assessment of eutrophication in marine waters: present state and challenges within the European directives. Mar. Pollut. Bull. 66, 7–16. doi: 10.1016/j.marpolbul.2012.10.005
Geider, R., MacIntyre, H., and Kana, T. (1997). Dynamic model of phytoplankton growth and acclimation: responses of the balanced growth rate and the chlorophyll a: carbon ratio to light, nutrient-limitation and temperature. Mar. Ecol. Prog. Ser. 148, 187–200. doi: 10.3354/meps148187
Geider, R. J. (1987). Light and temperature dependence of the carbon to chlorophyll a ratio in microalgae and cyanobacteria: implications for physiology and growth of phytoplankton. New Phytol. 106, 1–34. doi: 10.1111/j.1469-8137.1987.tb04788.x
Gilbert, P. M. (2006). GEOHAB, Global Ecology and Oceanography of Harmful Algal Blooms Programme. HABs in Eutrophic Systems. Paris: Intergovernmental Oceanographic Commission.
Gilbert, P. M., Landsberg, J. H., Evans, J. J., Al-Sarawi, M. A., Faraj, M., Al-Jarallah, M. A., et al. (2002). A fish kill of massive proportion in Kuwait Bay, Arabian Gulf, 2001: the roles of bacterial disease, harmful algae, and eutrophication. Harmful Algae 1, 215–231. doi: 10.1016/S1568-9883(02)00013-6
Glibert, P. M. (2017). Eutrophication, harmful algae and biodiversity—Challenging paradigms in a world of complex nutrient changes. Mar. Pollut. Bull. 124, 591–606. doi: 10.1016/j.marpolbul.2017.04.027
Glibert, P. M., Dugdale, R. C., Wilkerson, F., Parker, A. E., Alexander, J., Antell, E., et al. (2014). Major–but rare–spring blooms in 2014 in San Francisco Bay Delta, California, a result of the long-term drought, increased residence time, and altered nutrient loads and forms. J. Exp. Mar. Biol. Ecol. 460, 8–18. doi: 10.1016/j.jembe.2014.06.001
Glibert, P. M., Landsberg, J. H., Evans, J. J., Al-Sarawi, M. A., Faraj, M., Al-Jarallah, M. A., et al. (2002). A fish kill of massive proportion in Kuwait Bay, Arabian Gulf, 2001: the roles of bacterial disease, harmful algae, and eutrophication. Harmful Algae 1, 215–231. doi: 10.1016/S1568-9883(02)00013-6
Glibert, P. M., Wilkerson, F. P., Dugdale, R. C., Raven, J. A., Dupont, C. L., Leavitt, P. R., et al. (2016). Pluses and minuses of ammonium and nitrate uptake and assimilation by phytoplankton and implications for productivity and community composition, with emphasis on nitrogen-enriched conditions. Limnol. Oceanogr. 61, 165–197. doi: 10.1002/lno.10203
Gowen, R., Collos, Y., Tett, P., Scherer, C., Bec, B., Abadie, E., et al. (2015). Response of diatom and dinoflagellate lifeforms to reduced phosphorus loading: a case study in the Thau lagoon, France. Estuar. Coast. Shelf Sci. 162, 45–52. doi: 10.1016/j.ecss.2015.03.033
Harrison, P. J., Zingone, A., Mickelson, M. J., Lehtinen, S., Ramaiah, N., Kraberg, A. C., et al. (2015). Cell volumes of marine phytoplankton from globally distributed coastal data sets. Estuar. Coast. Shelf Sci. 162, 130–142. doi: 10.1016/j.ecss.2015.05.026
Heil, C. A., Glibert, P. M., Al-Sarawl, M., Faraj, M., Behbehani, M., and Husain, M. (2001). First record of a fish-killing Gymnodinium sp bloom in Kuwait Bay, Arabian Sea: chronology and potential causes. Mar. Ecol. Prog. Ser. 214, 15–23. doi: 10.3354/meps214015
Heisler, J., Glibert, P. M., Burkholder, J. M., Anderson, D. M., Cochlan, W., Dennison, W. C., et al. (2008). Eutrophication and harmful algal blooms: a scientific consensus. Harmful Algae 8, 3–13. doi: 10.1016/j.hal.2008.08.006
Howard, M. D. A., Cochlan, W. P., Ladizinsky, N., and Kudela, R. M. (2007). Nitrogenous preference of toxigenic Pseudo-nitzschia australis (Bacillariophyceae) from field and laboratory experiments. Harmful Algae 6, 206–217. doi: 10.1016/j.hal.2006.06.003
Hughes, A. R., Williams, S. L., Duarte, C. M., Heck, K. L. Jr., and Waycott, M. (2008). Associations of concern: declining seagrasses and threatened dependent species. Front. Ecol. Environ. 7, 242–246. doi: 10.1890/080041
Jacob, P., and Al-Muzaini, S. (1995). Marine plants of the Arabian Gulf and effects of oil pollution. Mahasagar 28, 83–101. doi: 10.1016/j.marenvres.2014.03.005
Jakobsen, H. H., and Markager, S. (2016). Carbon-to-chlorophyll ratio for phytoplankton in temperate coastal waters: seasonal patterns and relationship to nutrients. Limnol. Oceanogr. 61, 1853–1868. doi: 10.1002/lno.10338
Jeffrey, S. T., and Humphrey, G. (1975). New spectrophotometric equations for determining chlorophylls a, b, c1 and c2 in higher plants, algae and natural phytoplankton. Biochem. Physiol. Pflanzen 167, 191–194. doi: 10.1016/S0015-3796(17)30778-3
Karlson, B., Cusack, C., and Bresnan, E. (2010). Microscopic and Molecular Methods for Quantitative Phytoplankton Analysis. Paris: UNESCO.
Kuwata, A., Hama, T., and Takahashi, M. (1993). Ecophysiological characterization of two life forms, resting spores and resting cells, of a marine planktonic diatom, Chaetoceros pseudocurvisetus, formed under nutrient depletion. Mar. Ecol. Prog. Ser. 102, 245–255. doi: 10.3354/meps102245
LeGresley, M., and McDermott, G. (2010). “Counting chamber methods for quantitative phytoplankton analysis—Haemocytometer, palmer-maloney cell and Sedgewick-Rafter cell,” in Microscopic and Molecular Methods for Quantitative Phytoplankton Analysis, eds B. Karlson, C. Cusack and E. Bresnan (Paris: UNESCO), 25–30.
L’helguen, S., Maguer, J.-F., and Caradec, J. (2008). Inhibition kinetics of nitrate uptake by ammonium in size-fractionated oceanic phytoplankton communities: implications for new production and f-ratio estimates. J. Plankton Res. 30, 1179–1188. doi: 10.1093/plankt/fbn072
Lyons, B., Devlin, M., Hamid, S. A., Al-Otiabi, A., Al-Enezi, M., Massoud, M., et al. (2015). Microbial water quality and sedimentary faecal sterols as markers of sewage contamination in Kuwait. Mar. Pollut. Bull. 100, 689–698. doi: 10.1016/j.marpolbul.2015.07.043
Manly, B. F. (2006). Randomization, Bootstrap and Monte Carlo methods in Biology. Boca Raton, FL: CRC Press.
McQuatters-Gollop, A., Atkinson, A., Aubert, A., Bedford, J., Best, M., Bresnan, E., et al. (2019). Plankton lifeforms as a biodiversity indicator for regional-scale assessment of pelagic habitats for policy. Ecol. Indic. 101, 913–925. doi: 10.1016/j.ecolind.2019.02.010
Menden-Deuer, S., and Lessard, E. J. (2000). Carbon to volume relationships for dinoflagellates, diatoms, and other protist plankton. Limnol. Oceanogr. 45, 569–579. doi: 10.4319/lo.2000.45.3.0569
Mohamed, Z. A., and Mesaad, I. (2007). First report on Noctiluca scintillans blooms in the Red Sea off the coasts of Saudi Arabia: consequences of eutrophication. Oceanologia 49, 1130–1141.
Naser, H. (2011). “Human impacts on marine biodiversity: macrobenthos in Bahrain, Arabian Gulf,” in The Importance of Biological Interactions in the Study of Biodiversity, ed. J. Lopez-Pujol (Rijeka: InTech).
Nezlin, N. P., Polikarpov, I. G., Al-Yamani, F. Y., Subba Rao, D. V., and Ignatov, A. M. (2010). Satellite monitoring of climatic factors regulating phytoplankton variability in the Arabian (Persian) Gulf. J. Mar. Syst. 82, 47–60. doi: 10.1016/j.jmarsys.2010.03.003
Ortiz, J.-C., Wolff, N. H., Anthony, K. R. N., Devlin, M., Lewis, S., and Mumby, P. J. (2018). Impaired recovery of the Great Barrier Reef under cumulative stress. Sci. Adv. 4:eaar6127. doi: 10.1126/sciadv.aar6127
Parsons, T. R. (2013). A Manual of Chemical & Biological Methods for Seawater Analysis. Amsterdam: Elsevier.
Polikarpov, I., Al-Yamani, F., and Saburova, M. (2008). “Space-time variability of phytoplankton structure and diversity in the north-western part of the Arabian Gulf (Kuwait’s waters),” in Proceedings of the First Middle Eastern Biodiversity Congress Environment, Biodiversity and Conservation in the Middle East, Aqaba, 20–23.
Polikarpov, I., Saburova, M., and Al-Yamani, F. (2016). Diversity and distribution of winter phytoplankton in the Arabian Gulf and the Sea of Oman. Cont. Shelf Res. 119, 85–99. doi: 10.1016/j.csr.2016.03.009
Price, A. R. G. (1998). Impact of the 1991 Gulf War on the coastal environment and ecosystems: current status and future prospects. Environ. Int. 24, 91–96. doi: 10.1016/S0160-4120(97)00124-4
Price, A. R. G., Sheppard, C. R. C., and Roberts, C. M. (1993). The Gulf: Its biological setting. Mar. Pollut. Bull. 27, 9–15. doi: 10.1016/0025-326X(93)90004-4
Quigg, A., Al-Ansi, M., Al Din, N. N., Wei, C.-L., Nunnally, C. C., Al-Ansari, I. S., et al. (2013). Phytoplankton along the coastal shelf of an oligotrophic hypersaline environment in a semi-enclosed marginal sea: Qatar (Arabian Gulf). Cont. Shelf Res. 60, 1–16. doi: 10.1016/j.csr.2013.04.015
R Core Team (2017). R: A Language and Environment for Statistical Computing. Vienna: R Foundation for Statistical Computing.
Raven, J. A., Wollenweber, B., and Handley, L. L. (1992). A comparison of ammonium and nitrate as nitrogen sources for photolithotrophs. New Phytol. 121, 19–32. doi: 10.1111/j.1469-8137.1992.tb01088.x
Richlen, M. L., Morton, S. L., Jamali, E. A., Rajan, A., and Anderson, D. M. (2010). The catastrophic 2008–2009 red tide in the Arabian gulf region, with observations on the identification and phylogeny of the fish-killing dinoflagellate Cochlodinium polykrikoides. Harmful Algae 9, 163–172. doi: 10.1016/j.hal.2009.08.013
Riegl, B. (2003). Climate change and coral reefs: different effects in two high-latitude areas (Arabian Gulf, South Africa). Coral Reefs 22, 433–446. doi: 10.1007/s00338-003-0335-0
Riegl, B. M., Bruckner, A. W., Samimi-Namin, K., and Purkis, S. J. (2012). “Diseases, harmful algae blooms (HABs) and their effects on Gulf coral populations and communities,” in Coral Reefs of the Gulf, eds B. M. Riegl, and S. J. Purkis (Dordrecht: Springer), 107–125.
Riegl, B. M., and Purkis, S. J. (2012). “Coral reefs of the Gulf: adaptation to climatic extremes in the world’s hottest sea,” in Coral Reefs of the Gulf, B. M. Riegl, and S. J. Purkis (Dordrecht: Springer), 1–4. doi: 10.1007/978-94-007-3008-3
Ryle, V., and Wellington, J. (1982). Reduction Column for Automated Determination of Nitrates Analytical Laboratory Note, No. 19. Townsville: Australian Institute of Marine Science.
Saeed, T., Al-Bloushi, A., Abdullah, H., Al-Khabbaz, A., and Jamal, Z. (2012a). Preliminary assessment of sewage contamination in coastal sediments of Kuwait following a major pumping station failure usng fecal sterol markers. Aquat. Ecosyst. Health Manage. Soc. 15, 25–32. doi: 10.1080/14634988.2012.672147
Saeed, T., Al-Bloushi, A., Abdullah, H., Al-Khabbaz, A., and Jamal, Z. (2012b). Preliminary assessment of sewage contamination in coastal sediments of Kuwait following a major pumping station failure using fecal sterol markers. Aquat. Ecosyst. Health Manage. 15, 25–32. doi: 10.1080/14634988.2012.672147
Saeed, T., Al-Shimmari, F., Al-Mutairi, A., and Abdullah, H. (2015). Spatial assessment of the sewage contamination of Kuwait’s marine areas. Mar. Pollut. Bull. 94, 307–317. doi: 10.1016/j.marpolbul.2015.01.030
Sathyendranath, S., Stuart, V., Nair, A., Oka, K., Nakane, T., Bouman, H., et al. (2009). Carbon-to-chlorophyll ratio and growth rate of phytoplankton in the sea. Mar. Ecol. Prog. Ser. 383, 73–84. doi: 10.3354/meps07998
Seubert, E. L., Gellene, A. G., Campbell, V., Smith, J., Robertson, G., and Caron, D. A. (2017). Incubation experiments to determine the response of a natural plankton community to treated sewage effluent. Estuar. Coast. Shelf Sci. 186, 250–262. doi: 10.1016/j.ecss.2016.07.018
Sheppard, C. (2016). Coral reefs in the Gulf are mostly dead now, but can we do anything about it? Mar. Pollut. Bull. 105, 593–598. doi: 10.1016/j.marpolbul.2015.09.031
Sheppard, C., Al-Husiani, M., Al-Jamali, F., Al-Yamani, F., Baldwin, R., Bishop, J., et al. (2010). The Gulf: a young sea in decline. Mar. Pollut. Bull. 60, 13–38. doi: 10.1016/j.marpolbul.2009.10.017
Sheppard, C., Al-Husiani, M., Al-Jamali, F., Al-Yamani, F., Baldwin, R., Bishop, J., et al. (2012). “Environmental concerns for the future of Gulf coral reefs,” in Coral Reefs of the Gulf, eds B. M. Riegl, and S. Purkis (Dordrecht: Springer), 349–373.
Sheppard, C. R. C. (1993). Physical environment of the Gulf relevant to marine pollution: an overview. Mar. Pollut. Bull. 27, 3–8. doi: 10.1016/0025-326X(93)90003-3
Sheppard, C. R. C. (1995). Species and community changes along environmental and pollution gradients. Mar. Pollut. Bull. 30, 504–514. doi: 10.1016/0025-326X(95)00122-4
Smith, A., McGowan, T., Devlin, M., Massoud, M., Al-Enezi, M., Al-Zaidan, A., et al. (2015). Screening for contaminant hotspots in the marine environment of Kuwait using ecotoxicological and chemical screening techniques. Mar. Pollut. Bull. 100, 681–688. doi: 10.1016/j.marpolbul.2015.08.043
Subba Rao, D., and Al-Yamani, F. (1998). Phytoplankton ecology in the waters between Shatt-Al-Arab and Straits of Hormuz-the Arabian Gulf. Plankton Biol. Ecol. 45, 101–116.
Taylor, A. H., Geider, R. J., and Gilbert, F. J. (1997). Seasonal and latitudinal dependencies of phytoplankton carbon-to-chlorophyll a ratios: results of a modelling study. Mar. Ecol. Prog. Ser. 152, 51–66. doi: 10.3354/meps152051
Tett, P., Carreira, C., Mills, D., Van Leeuwen, S., Foden, J., Bresnan, E., et al. (2008). Use of a Phytoplankton Community Index to assess the health of coastal waters. ICES J. Mar. Sci. 65, 1475–1482. doi: 10.1111/mec.14496
Tett, P., Gowen, R., Mills, D., Fernandes, T., Gilpin, L., Huxham, M., et al. (2007). Defining and detecting undesirable disturbance in the context of marine eutrophication. Mar. Pollut. Bull. 55, 282–297. doi: 10.1016/j.marpolbul.2006.08.028
Tett, P., Gowen, R., Painting, S., Elliott, M., Forster, R., Mills, D., et al. (2013). Framework for understanding marine ecosystem health. Mar. Ecol. Prog. Ser. 494, 1–27. doi: 10.3354/meps10539
Thessen, A. E., Bowers, H., and Stoecker, D. K. (2009). Intra-and interspecies differences in growth and toxicity of Pseudo-nitzschia while using different nitrogen sources. Harmful Algae 8, 792–810. doi: 10.1016/j.hal.2009.01.003
Valderrama, J. C. (1981). The simultaneous analysis of total nitrogen and total phosphorus in natural waters. Mar. Chem. 10, 109–122. doi: 10.1016/0304-4203(81)90027-X
Van Lavieren, H., and Klaus, R. (2013). An effective regional Marine Protected Area network for the ROPME Sea Area: Unrealistic vision or realistic possibility? Mar. Pollut. Bull. 72, 389–405. doi: 10.1016/j.marpolbul.2012.09.004
Keywords: sewage, phytoplankton, nutrients, Kuwait, eutrophication, assessments
Citation: Devlin MJ, Breckels M, Graves CA, Barry J, Capuzzo E, Huerta FP, Al Ajmi F, Al-Hussain MM, LeQuesne WJF and Lyons BP (2019) Seasonal and Temporal Drivers Influencing Phytoplankton Community in Kuwait Marine Waters: Documenting a Changing Landscape in the Gulf. Front. Mar. Sci. 6:141. doi: 10.3389/fmars.2019.00141
Received: 04 October 2018; Accepted: 06 March 2019;
Published: 04 April 2019.
Edited by:
Jesper H. Andersen, NIVA Denmark Water Research, DenmarkReviewed by:
Hans H. Jakobsen, Aarhus University, DenmarkE. Therese Harvey, NIVA Denmark Water Research, Denmark
Copyright © 2019 Devlin, Breckels, Graves, Barry, Capuzzo, Huerta, Al Ajmi, Al-Hussain, LeQuesne and Lyons. This is an open-access article distributed under the terms of the Creative Commons Attribution License (CC BY). The use, distribution or reproduction in other forums is permitted, provided the original author(s) and the copyright owner(s) are credited and that the original publication in this journal is cited, in accordance with accepted academic practice. No use, distribution or reproduction is permitted which does not comply with these terms.
*Correspondence: Michelle J. Devlin, bWljaGVsbGUuZGV2bGluQGNlZmFzLmNvLnVr