 Gabrielle Canonico1*
 Pier Luigi Buttigieg2
 Enrique Montes3
 Frank E. Muller-Karger3
 Carol Stepien4
 Dawn Wright5,6
 Abigail Benson7
 Brian Helmuth8
 Mark Costello9
 Isabel Sousa-Pinto10
 Hanieh Saeedi11,12
 Jan Newton13
 Ward Appeltans14
 Nina Bednaršek15
 Levente Bodrossy16
 Benjamin D. Best17
 Angelika Brandt11,12
 Kelly D. Goodwin18
 Katrin Iken19
 Antonio C. Marques20
 Patricia Miloslavich21,22
 Martin Ostrowski23
 Woody Turner24
 Eric P. Achterberg25
 Tom Barry26
 Omar Defeo27
 Gregorio Bigatti28,29
 Lea-Anne Henry30
 Berta Ramiro-Sánchez30
 Pablo Durán31
 Telmo Morato32
 J. Murray Roberts30
 Ana García-Alegre31
 Mar Sacau Cuadrado31
 Bramley Murton33
- 1National Oceanic and Atmospheric Administration, U.S. Integrated Ocean Observing System, Silver Spring, MD, United States
- 2Alfred-Wegener-Institut, Helmholtz-Zentrum für Polar- und Meeresforschung, Bremerhaven, Germany
- 3College of Marine Science, Institute for Marine Remote Sensing, University of South Florida, St. Petersburg, St. Petersburg, FL, United States
- 4NOAA Pacific Marine Environmental Laboratory, Seattle, WA, United States
- 5Environmental Systems Research Institute (Esri), Redlands, CA, United States
- 6College of Earth, Ocean, and Atmospheric Sciences, Oregon State University, Corvallis, OR, United States
- 7United States Geological Survey, Lakewood, CO, United States
- 8Department of Marine and Environmental Sciences, Northeastern University, Nahant, MA, United States
- 9Institute of Marine Science, The University of Auckland, Auckland, New Zealand
- 10CIIMAR/CIMAR and Department of Biology, Faculty of Sciences, University of Porto, Porto, Portugal
- 11Senckenberg Research Institute and Natural History Museum, Goethe University Frankfurt, Frankfurt, Germany
- 12Institute for Ecology, Evolution and Diversity, Goethe University Frankfurt, Frankfurt, Germany
- 13Northwest Association of Networked Ocean Observing Systems, Seattle, WA, United States
- 14Intergovernmental Oceanographic Commission of UNESCO, IOC Project Office for IODE, Ostend, Belgium
- 15Southern California Coastal Water Research Project, Costa Mesa, CA, United States
- 16Commonwealth Scientific and Industrial Research Organisation (CSIRO), Canberra, ACT, Australia
- 17EcoQuants, Santa Barbara, CA, United States
- 18NOAA Atlantic Oceanographic and Meteorological Laboratory, La Jolla, CA, United States
- 19College of Fisheries and Ocean Sciences, University of Alaska, Fairbanks, AK, United States
- 20Departamento de Zoologia, Instituto de Biociências, Universidade de São Paulo, São Paulo, Brazil
- 21Institute for Marine and Antarctic Studies, University of Tasmania, Hobart, TAS, Australia
- 22Department of Environmental Studies, Universidad Simón Bolívar, Caracas, Venezuela
- 23Marine Research Centre, Macquarie University, Sydney, NSW, Australia
- 24National Aeronautics and Space Administration (NASA), Washington, DC, United States
- 25GEOMAR Helmholtz Centre for Ocean Research Kiel, Kiel, Germany
- 26Conservation of Arctic Flora and Fauna (CAFF), Akureyri, Iceland
- 27Marine Sciences Laboratory (UNDECIMAR), Faculty of Sciences, Montevideo, Uruguay
- 28Universidad de Especialidades Espíritu Santo, Guayaquil, Ecuador
- 29Instituto de Biología de Organismos Marinos (IBIOMAR), del Consejo Nacional de Investigaciones Científicas y Técnicas (CONICET), Puerto Madryn, Argentina
- 30The University of Edinburgh, Edinburgh, United Kingdom
- 31Centro Oceanográfico de Vigo, Instituto Espaol de Oceanografía, Vigo, Spain
- 32Instituto do Mar (IMAR) and Okeanos Research Unit, Universidade dos Açores, Horta, Portugal
- 33National Oceanography Centre, Southampton, United Kingdom
The diversity of life in the sea is critical to the health of ocean ecosystems that support living resources and therefore essential to the economic, nutritional, recreational, and health needs of billions of people. Yet there is evidence that the biodiversity of many marine habitats is being altered in response to a changing climate and human activity. Understanding this change, and forecasting where changes are likely to occur, requires monitoring of organism diversity, distribution, abundance, and health. It requires a minimum of measurements including productivity and ecosystem function, species composition, allelic diversity, and genetic expression. These observations need to be complemented with metrics of environmental change and socio-economic drivers. However, existing global ocean observing infrastructure and programs often do not explicitly consider observations of marine biodiversity and associated processes. Much effort has focused on physical, chemical and some biogeochemical measurements. Broad partnerships, shared approaches, and best practices are now being organized to implement an integrated observing system that serves information to resource managers and decision-makers, scientists and educators, from local to global scales. This integrated observing system of ocean life is now possible due to recent developments among satellite, airborne, and in situ sensors in conjunction with increases in information system capability and capacity, along with an improved understanding of marine processes represented in new physical, biogeochemical, and biological models.
Introduction
Diversity of life is an essential feature of ecosystems. Depending on the diversity and make up of their biological communities, different habitats may be considered healthy or degraded. Healthy marine ecosystems provide essential services to billions of people, including nutrition, recreation, public safety, and health. Biodiversity—defined here as taxonomic and functional diversity within species, among species, and at the ecosystem level—is, in part, a function of fluctuations in environmental factors. There is evidence that biodiversity in different habitats is changing as a result of climate change and other human pressures (Butchart et al., 2010; Staudinger et al., 2013; Levin and Poe, 2017). Understanding the causes of biodiversity change, and forecasting where, when, and how biodiversity may change, requires building a body of knowledge based on widespread scientific observation and testing of conceptual and quantitative ecological models. Understanding large-scale changes in the distribution of marine species, and understanding whether local changes are part of global, regional, or local processes requires a global science approach. This information is also required to understand biological and physical connectivity among and within coastal and open ocean systems. This approach must be built by networking local and regional observing efforts.
To trace a path to address user needs through better information, the oceanographic community defined a Framework for Ocean Observing in 2012 (Lindstrom et al., 2012). The framework recognized that it is critical to enhance existing ocean observing efforts with routine monitoring of marine biodiversity. This set in motion a process to define sets of Essential Ocean Variables (EOVs) covering ocean physics, biogeochemistry, biology and ecosystems. Yet, baselines to be used as a reference against which to detect changes in marine biodiversity over large scales, and at most coastal, open ocean, or deep ocean locations still need to be defined. The community has to converge on sets of standard methods to collect particular biological EOVs (Miloslavich et al., 2018a) and Essential Biodiversity Variables (EBVs; Pereira et al., 2013, Muller-Karger et al., 2018b). What to observe should be defined by local needs but also must take into account the regional context for assessments that affect multiple industry sectors, localities and countries. Finally, there needs to be an overarching and top-down coordination of regional assessments to enable their integration within a global framework for understanding the condition of and drivers of change for marine biodiversity in to.
Global Partnerships to Understand Marine Life
There have been several notable efforts to develop a global, quantitative understanding of the status of life on Earth. Here we briefly review some of the programs that contribute to a broader understanding of life in the sea, in a systematic manner and over large spatial scales. The good news is that many of the key elements for a global system of coordinated marine biodiversity observations already exist. In their integration lies the key to overall success.
Many countries, individual state agencies, research institutions, and non-governmental institutions hold their own relevant databases. Harmonizing and linking these databases is now a focus of significant effort. To address this pressing need for coordinated biodiversity observations around the globe, the Group on Earth Observations is implementing a Biodiversity Observation Network (GEO BON; Pereira et al., 2013). The Marine Biodiversity Observation Network (MBON), a thematic focus of GEO BON, has emerged as a global community of practice for sustained, operationalized measurements of marine biodiversity. MBON facilitates the coordination between individual monitoring programs and existing networks, promotes monitoring best practices and the contribution of marine biodiversity data, and provides a framework for data management, communication, and application of results. MBON was established because the systematic and coordinated collection of such observations requires leveraging efforts across different institutions, regions, and countries. Standardization of observational approaches, protocols, technologies, and data reporting among biodiversity monitoring programs, as well as open access to observing data, can help overcome some coordination challenges. International cooperation is also required to improve the capacity of nations to satisfy local management requirements while still enabling the reporting to international agreements (e.g., U.N. Convention of Biological Diversity, U.N Sustainable Development Goals, and the Intergovernmental Science-Policy Platform on Biodiversity and Ecosystem Services (IPBES), among many).
MBON also serves as the biodiversity arm of GEO Blue Planet, through which the social and economic needs of governments, intergovernmental bodies, and other stakeholders for marine biodiversity data are addressed. This focus on conservation and sustainable use helps to align national and global policy frameworks through responsive monitoring, predictive ecological modeling, and improved ecosystem-based management and decision-making (Österblom et al., 2017). These activities seek to meet emerging needs for marine biodiversity information in national waters and in areas beyond national jurisdiction.
The BioEco Panel of the Global Ocean Observing System (GOOS), also conceived under the Framework for Ocean Observing, was established in 2015 to develop and coordinate efforts in the implementation of a sustained and targeted global ocean observing system. It develops the rationale for EOVs driven by socio-economic and cultural demands of society. The biological EOVs defined by GOOS are complementary to the EBVs, which are being developed under GEO BON (Miloslavich et al., 2018a; Muller-Karger et al., 2019). The goal is to construct regional and global maps of the essential variables on a routine basis, following standard data collection, quality control, and data archiving and distribution protocols. These maps then provide the baselines against which to detect and quantify changes in marine biodiversity.
The Ocean Biogeographic Information System (OBIS) is a standardized, globally-accessible database for the observations of diversity, distribution, and abundance of life in the sea. OBIS was initiated by the Census of Marine Life and adopted by the Intergovernmental Oceanographic Commission (IOC of UNESCO) in 2009 as a project of the International Oceanographic Data and Information Exchange (IODE). It represents the marine community in the development of international data standards for marine biodiversity and ecosystem data. At present, OBIS integrates approximately 60 million occurrences of 120,000 marine species from over 2,600 databases provided by 600 institutions worldwide. OBIS actively supports international processes, such as the UN World Ocean Assessment, the Convention for Biological Diversity (CBD) and its effort to define Ecologically or Biologically Significant marine Areas (EBSAs), and IPBES assessments. In 2017, OBIS expanded beyond species occurrence data to include ecosystem and associated environmental data (De Pooter et al., 2017). OBIS works closely with, and in a similar manner to, the Global Biodiversity Information Facility (GBIF), which also holds many observations of marine species.
The MBON, GOOS, and OBIS have agreed to leverage the strengths and broad partnerships represented by these groups (Figure 1). The agreement acknowledges MBON’s role to inform and assist development of national and regional observing networks and EBVs, the role of GOOS in articulating the interdisciplinary observing requirements for EOVs, and the role of OBIS to serve local, regional, and international user needs for harmonized biodiversity and biogeographic data. GOOS, OBIS and MBON have agreed to, among other things, to:
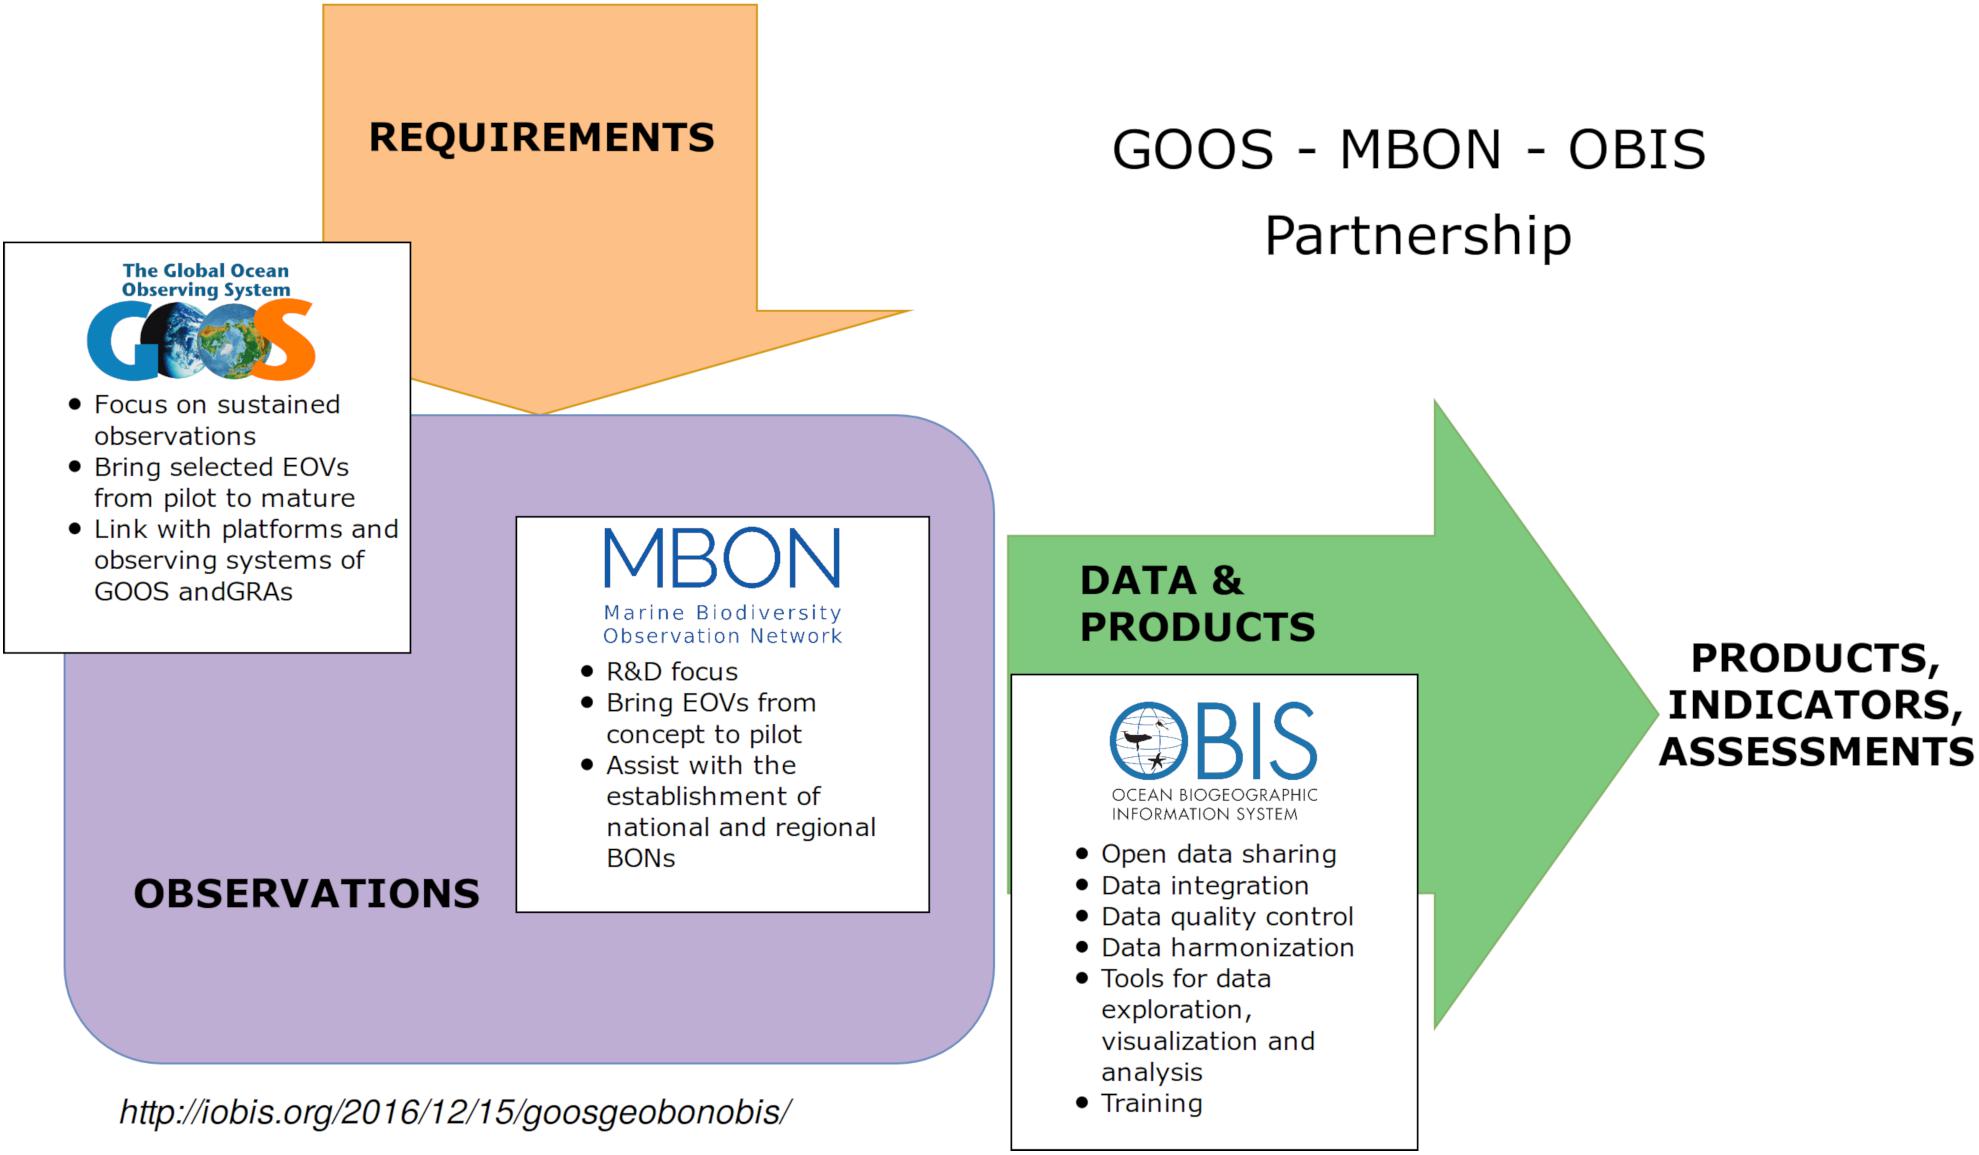
Figure 1. The GOOS-MBON-OBIS collaboration relies on the global framework for ocean observing as a model for a global system integrating marine biology and biodiversity with other types of ocean observations (Benson et al., 2018).
1. Advance continuous, long-term, biological ocean observations in a coherent, globally consistent and coordinated way, based on interdisciplinary EOVs and EBVs;
2. Advance development and testing of EOVs, support evolution of EOVs from pilot to mature, and improve global coverage of EOV monitoring and delivery of open-access data products;
3. Foster systematic data quality control, sharing, curation, and aggregation;
4. Support assessments and targets such as those established by IPBES, CBD, the United Nations and others, and liaise with other relevant national and international initiatives;
5. Support linkages within GEO (e.g., to, GEO Wetlands, AmeriGEO) and IOC (e.g., GOOS Regional Alliances, Large Marine Ecosystems, the Deep Ocean Observing Strategy, and OBIS nodes); and
6. Develop global capacity for data collection, data management, and ecological forecasting by sharing and promoting best practices, manuals and guides.
Other efforts that can support the joint work of these three groups serving as data aggregators include the Living Planet Index, the International Union for Conservation of Nature (IUCN), Aquamaps, Reef Life Survey, the Ocean Health Index, BirdLife, FishBase, and global mangrove mapping efforts such as that coordinated by the United States Geological Survey and NASA in the United States, and under the Ramsar Convention, among many other programs. We only highlight a few of these here.
The Living Planet Index (LPI)1 is an authoritative effort to understand trends in the abundance of biological populations. The LPI employs data from 7,829 populations of 1,234 species of marine birds, mammals, reptiles and fishes and shows a 49% decline between 1970 and 2012. The interpretation is that that the average population size of the species included in the LPI declined by about 50% over that period. Indices should be designed or the LPI augmented to address additional trophic levels, including phytoplankton, macroalgae, and different groups of invertebrates.
The IUCN2 is a membership-based Union composed of government and civil society organizations that seeks to enable sustainable development. The IUCN has developed a Red List of Threatened SpeciesTM, and it is using quantitative criteria to evaluate the extinction risk of over 20,000 marine species through the IUCN Species Program Marine Biodiversity Unit. OBIS contains IUCN conservation status labels for its marine organism records.
AquaMaps3 is a project that generated predictions of relative habitat suitability as maps at a 0.5° latitude by longitude resolution for over 25,000 marine species, including marine fishes, marine mammals, sea turtles, algae and marine invertebrates (Kaschner et al., 2016). These habitat suitability maps were generated using climatological average oceanographic conditions (temperature, salinity, oxygen concentration, etc.). Davies et al. (2017) used the AquaMaps algorithms to conclude that many marine species distributions insufficiently overlap with marine protected areas (MPAs), and, therefore, many species are insufficiently covered by conservation measures as oceanographic conditions shift with climate change. At present, AquaMaps predictions have not been generated at seasonal scales, and this work is needed to understand how different species may overlap in range due to their phenologies or seasonal environmental changes, for example, to address possible interactions with fisheries or other ocean uses.
Reef Life Survey (RLS)4 is a citizen-science program that trains volunteer SCUBA divers to conduct detailed surveys of fish and coral reef species on shallow rocky and coral reefs, often where human pressures are high (Stuart-Smith et al., 2017, 2018). RLS data are of very high quality, and have been used to evaluate the need for or effectiveness of Marine Protected Areas, possible shifts in species ranges, and to compute the Living Planet Index.
Other efforts include: ReefBase5, the database of the Global Coral Reef Monitoring Network (GCRMN), as well as the International Coral Reef Action Network (ICRAN). The ReefBase Project is housed at the WorldFish Center in Penang, Malaysia, with funding through ICRAN from the United Nations Foundation (UNF).
FishBase6 is a global biodiversity information system on finfishes, which covers taxonomy, biology, trophic ecology, and life history of fish, including major commercial fishes. FishBase has information on over 33,000 fish species.
SeaLifeBase7 has a similar purpose for a broader range of marine organisms. Information aggregated for marine birds may be found in databases such as that maintained by Bird Life International8.
The above efforts are all dedicated to the understanding and conservation of life in the sea.
Regional and Thematic Approaches To Building an Mbon Community of Practice
Implementation of a global MBON requires organization of regional efforts that engage the scientific and user communities, define biodiversity baselines, and demonstrate applications in conservation and sustainable use of marine resources. If these communities establish regional observing efforts that follow best practices agreed upon and published by MBON and the Ocean Best Practices System (IOC)9, it will be possible to compare data between localities, within regions and over broader spatial and temporal scales.
The global MBON community met in Montreal, Canada, in May 2018 to discuss the status of the network and future plans, including lessons learned from past and ongoing monitoring efforts of marine biodiversity. The group acknowledged that while long-term regional and international scientific programs are needed to assess biodiversity and track the impacts of environmental change on scales large enough to capture the processes and mechanisms operating in the ocean, the enormous spatial extent of the ocean still presents a significant challenge. Traditional survey methods can be very expensive and thus there is a need to better integrate various methods of remote sensing of biodiversity (Muller-Karger et al., 2018a). Remote areas, and areas with extreme weather such as the Arctic and high southern latitudes present additional challenges. Because human and financial resources are limited, a major goal of MBON and related groups must be facilitation of technology access and development of human capacity. Strengthening existing networks and programs remains the priority before creating new, parallel, and potentially competing structures and organizations. The latter scenario of redundant structures and organizations inevitably incurs human, financial, and other costs, inhibiting everyone’s ability to mainstream biodiversity themes in ocean observing.
Changes in marine biodiversity are being documented from the Arctic to Antarctica. Many nations and regions need information on how these changes affect ecosystem services. MBON activities are increasingly organized as large, multi-sector, interdisciplinary regional efforts. One of these MBON efforts seeks to organize observation of marine ecosystems in the Americas from pole to pole (see below). MBON has also been recognized as a core contribution to the emerging All-Atlantic Ocean Observing System (AtlantOS). Most recent to emerge is the Asia Pacific MBON, announced at the GEOSS Asia-Pacific Symposium in October 2018. MBON is also participating in GEO Blue Planet efforts to support marine biodiversity and fisheries monitoring activities in developing nations, including Small Island Developing States. Some of these regional programs are described below.
US MBON
In 2014, the United States initiated a prototype national network to monitor marine biodiversity with support from NASA, the Department of the Interior’s Bureau of Ocean Energy Management (BOEM), and several NOAA offices including the National Marine Sanctuaries, Oceanic and Atmospheric Research labs and Office of Ocean Exploration, National Marine Fisheries Service, National Ocean Service, and the National Environmental Satellite, Data, and Information Service (NESDIS). The United States National Science Foundation has participated in important aspects of this effort and initial efforts were supported with a significant oil industry investment. Demonstration efforts were launched in multiple locations: the Florida Keys; Gulf of Mexico (Flower Garden Banks); California’s Monterey Bay and Santa Barbara Channel; and the Chukchi Sea in Alaska, with new sites to be announced in late 2019. These networks integrate new and long-term observations from satellite, laboratory, in situ observing systems, and other ocean research and monitoring activities to provide a broader picture of how marine ecosystems are changing and identify drivers of these changes.
The US Integrated Ocean Observing System (US IOOS), the US contribution to the network of GOOS Regional Alliances, provides overall coordination for the US MBON effort. IOOS Regional Associations are helping to facilitate knowledge transfer, tools, and sharing of best practices and data. US MBON participation in global MBON efforts has fostered US IOOS coordination of biodiversity monitoring and data management approaches with Canada through cooperation with Fisheries and Ocean Canada (DFO), and demonstrated how certain biological observing methods and approaches can be implemented in the context of a GOOS Regional Alliance. The MBON efforts led to convergence within US IOOS on the use of the Darwin Core standard schema for biological observations.
The US MBON and IOOS partners have made significant contributions to the development of new and innovative means to assess marine biodiversity. US MBON projects have been central in developing best practices for eDNA and demonstrating its utility for biological observing, and they have advanced the means to collect eDNA samples using autonomous underwater vehicles. US MBON partners are also developing image analysis techniques targeted at underwater image classification for use in an operational setting. Remotely sensed seascape maps (a US MBON product now being distributed for the global ocean through a partnership with the NOAA National Environmental Satellite, Data, and Information Service or NESDIS), as well as models, are being used to scale in situ observations, and to identify and classify habitat for targeted sampling and management activities.
MBON Pole to Pole Efforts in the Americas
The MBON Pole to Pole initiative was intended as a major decadal-scale activity spanning the Arctic, the Americas, and Antarctica that would establish the infrastructure and partnerships needed for global expansion of the network. MBON Pole to Pole focuses on capacity building and applied science for conservation and management of marine living resources with an emphasis on: 1) use of common methods, 2) repeated sampling at the same sites, 3) establishment of similar seasonal and temporal sampling resolution, 4) use of the Darwin Core data schema, and 5) open data sharing via OBIS.
The MBON Pole to Pole is a voluntary network of cooperating research institutions, marine laboratories, parks, and reserves engaged in monitoring and research to document marine biodiversity status and change. Initial efforts are focused in the Americas region along the Pacific and Atlantic coasts (Cruz et al., 2003; Escribano et al., 2003; Miloslavich et al., 2011; Figure 2).
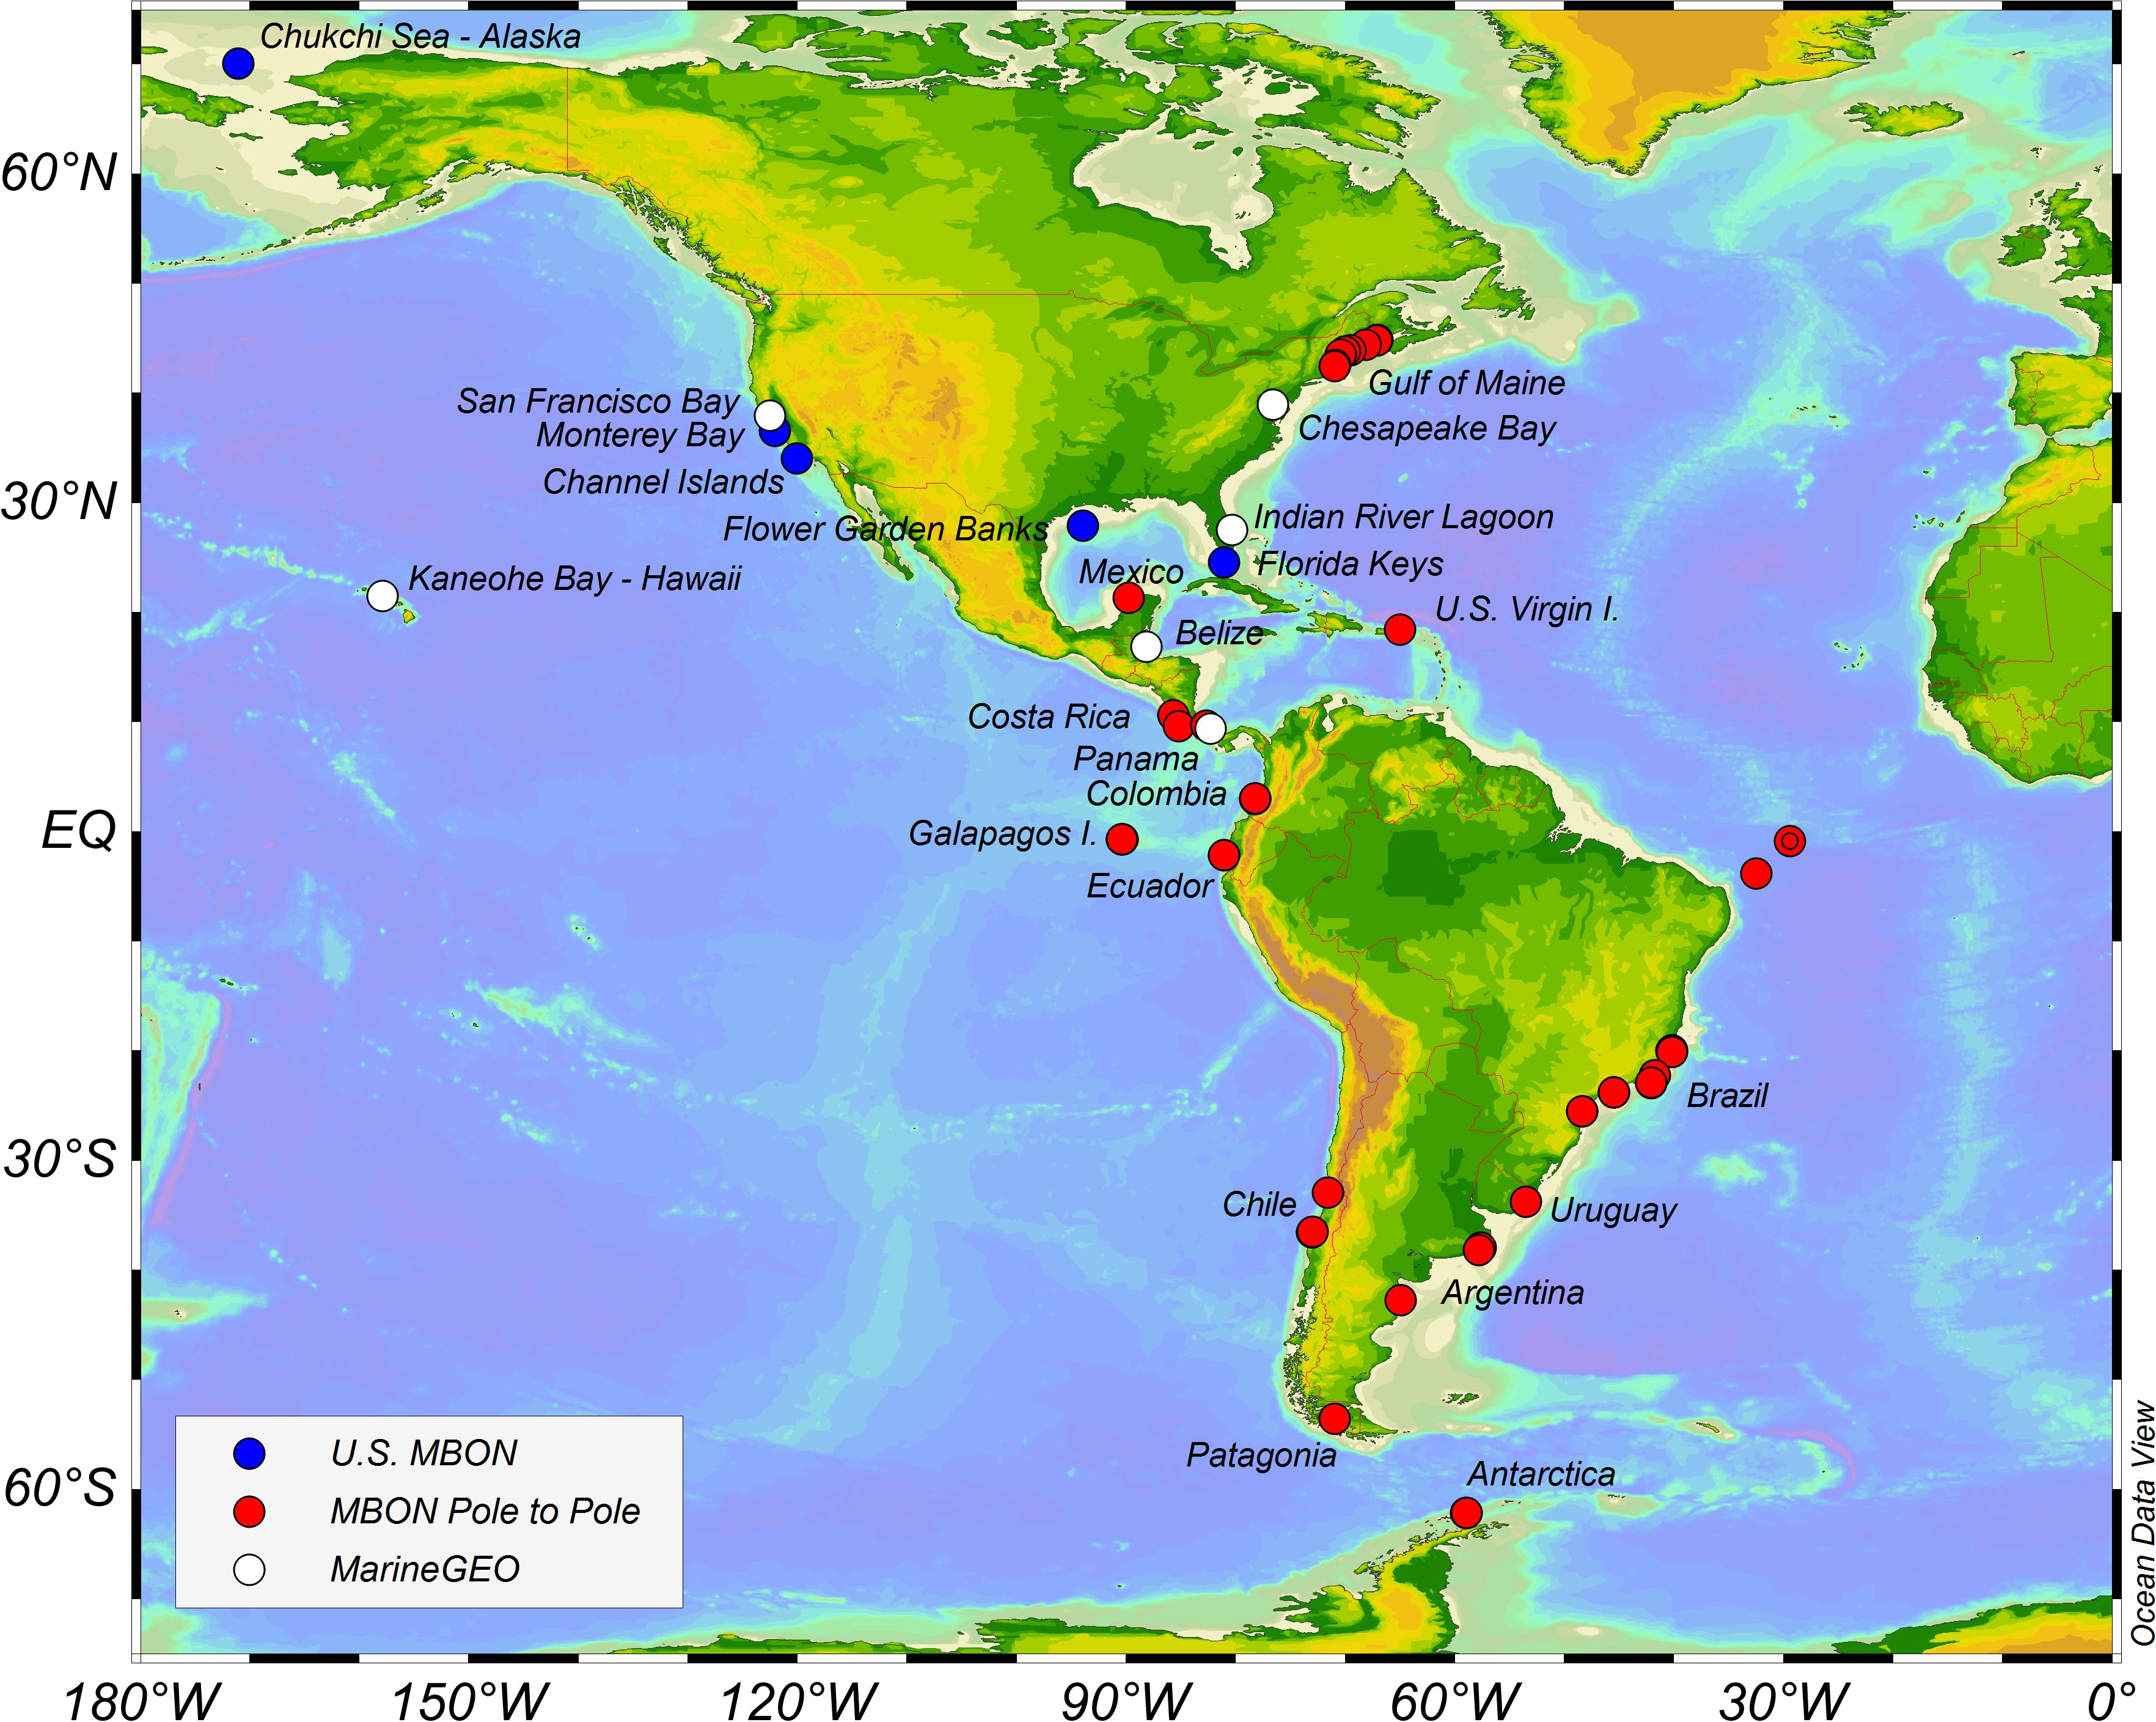
Figure 2. Map of US MBON, MarineGEO, and MBON Pole to Pole in the Americas sites at the time of publication.
Marine Biodiversity Observation Network Pole to Pole activities in the Americas region are being coordinated with initiatives such as the Caribbean Marine Atlas (CMA-2 Project) and the Southeast Pacific Data and Information Network in Support of Integrated Coastal Area Management (SPINCAM) program, both under the umbrella of the IOC-IODE and similar efforts. MBON incorporates historical time series data such as those collected by the CARIACO Ocean Time-Series (Muller-Karger et al., 2019) and the Caribbean Coastal Marine Productivity (CARICOMP) effort (Cortés et al., 2019). Such datasets allow interpretation of regional changes in terms of oceanographic regimes, e.g., the El Niño Southern Oscillation (Chavez et al., 2003). Field data collection efforts include biodiversity and environmental properties (e.g., in situ temperature) using protocols developed by the South American Research Group on Coastal Ecosystems (SARCE), which was established in 2010 to investigate marine diversity and biomass in rocky intertidal ecosystems along both coasts of South America (Miloslavich et al., 2016).
Marine Biodiversity Observation Network Pole to Pole leverages several GOOS Regional Alliances (IOCARIBE for the wider Caribbean region and Gulf of Mexico; the GOOS Regional Alliance for the South-East Pacific, GRASP; the Regional Alliance for the Upper Southwest and Tropical Atlantic. OCEATLAN; and US IOOS) as well as AtlantOS.
Circumpolar Biodiversity Monitoring Program
The Circumpolar Biodiversity Monitoring Program (CBMP) includes several countries working toward harmonized and integrated monitoring across borders and regions. CBMP is an effort of the Arctic Council’s Conservation of Arctic Flora and Fauna (CAFF)10, it represents an agreement across Arctic States to compile, harmonize and compare results from existing Arctic marine biodiversity and ecosystem monitoring efforts, across nations and oceans, coordinated through a network of scientists and traditional knowledge holders, governments, Indigenous organizations and conservation groups. Six Expert Networks (Sea ice, biota, Plankton, Benthos, Marine fishes, Seabirds and Marine mammals) have identified key elements, called Focal Ecosystem Components (FECs), of the Arctic marine ecosystem. Changes in FEC status likely indicate changes in the overall marine environment. For the purposes of reporting and comparison, eight physically and biogeochemically distinct Arctic Marine Areas (AMAs) were identified.
One output from the CBMP (Figure 3) identifies the current gaps in monitoring across the Arctic (an area of over 30 million Km2). Each concentric ring represents a group of focal ecosystem components and each segment represents a specific Arctic Marine Area. The graphic conveys the current status of monitoring across these Arctic Marine Areas, indicating for example where monitoring coverage is sporadic or where it is sufficient. The graphic shows the status of marine biodiversity monitoring by Focal Ecosystem Component and Arctic Marine Area to help visualize gaps where information is lacking, and where monitoring efforts should be focused. The graphic is then broken down into separate wheels for each of the expert networks within the marine CBMP to identify for each FEC status and trends for which data exists11. This type of output from a regional monitoring program is proving useful in communicating with and convincing decision makers about the importance of funding sustained monitoring.
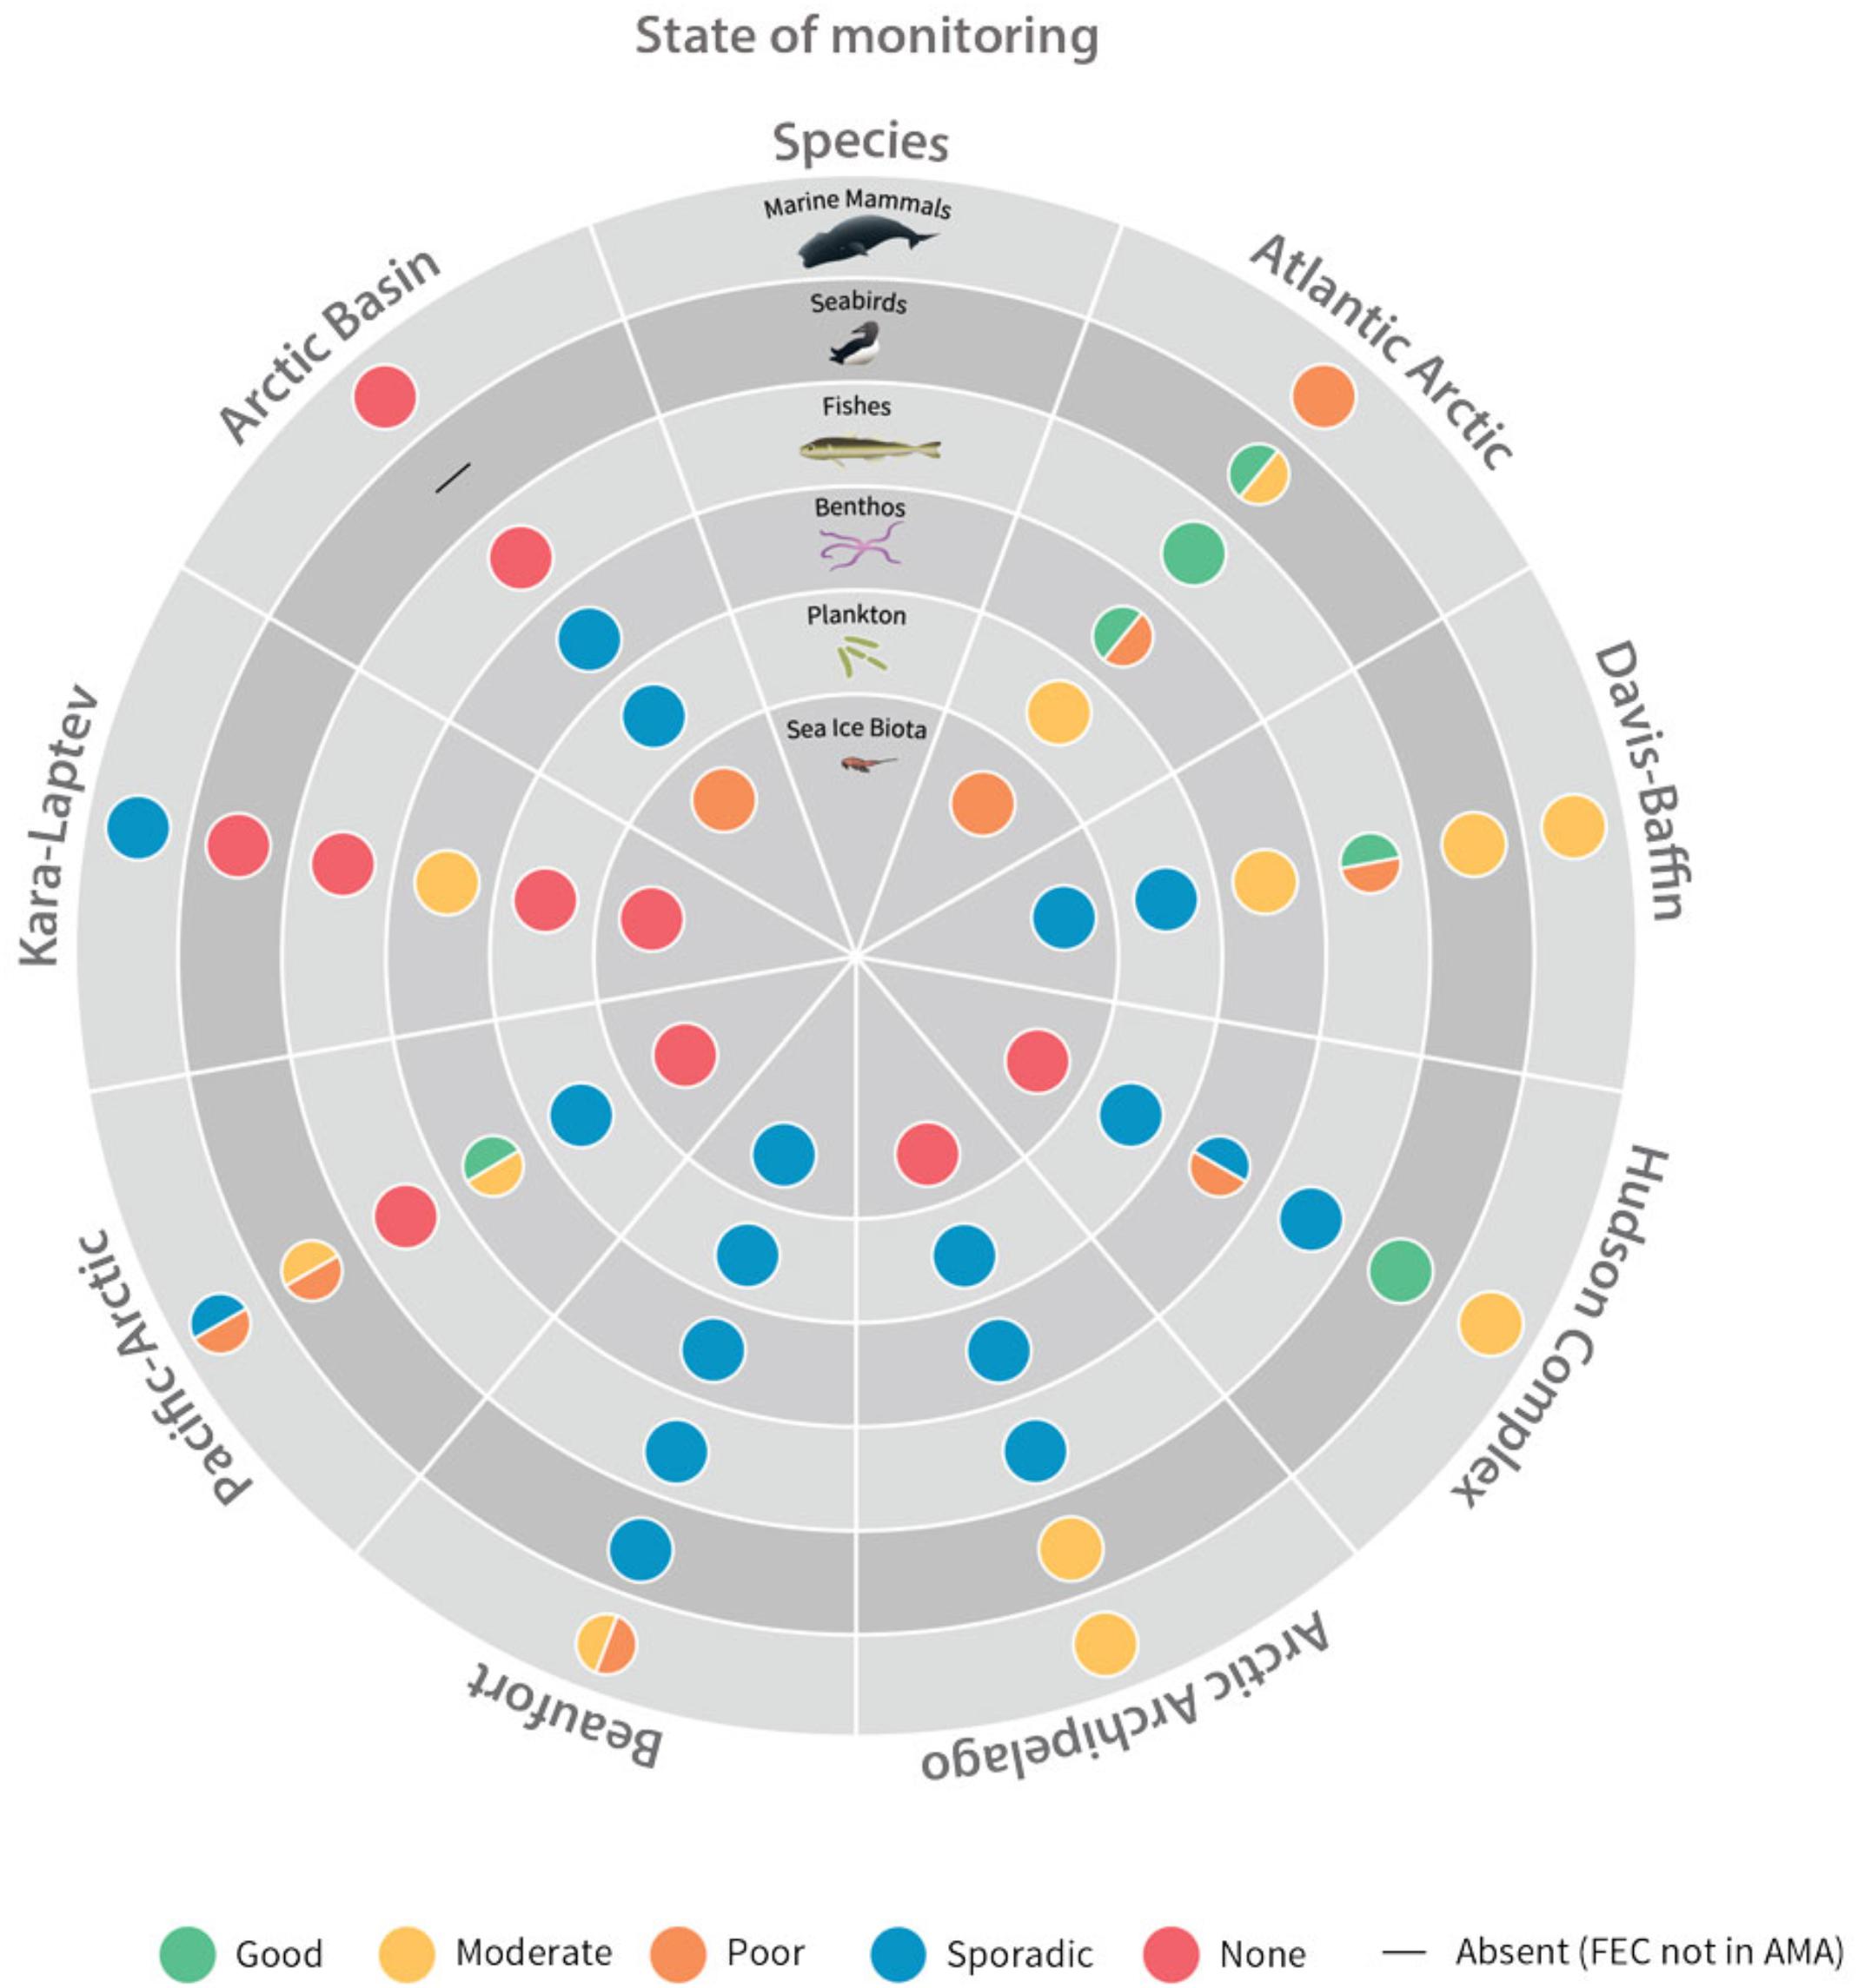
Figure 3. Current status of monitoring across Arctic Marine Areas. Each concentric ring represents a group of focal ecosystem components and each segment represents a specific Arctic Marine Area.
Global Ocean Acidification Observing Network
The Global Ocean Acidification Observing Network (GOA-ON)12 represents a thematic network for which collection of and access to biological observations are increasingly important. GOA-ON is a global, long-term observing network dedicated to monitor ocean acidification (OA), understand its biological effects, and support forecasts allowing for adaptation to OA. GOA-ON and MBON seek to collaborate to enable the collection of observations to support understanding of biological impacts from OA and the effects of biological processes on OA. This multidisciplinary approach is needed to understand how OA affects ecosystems and marine living resources.
The network of OA observations at coastal sites, and from ships or buoys in deeper water, is expanding, but collection of concurrent biological observations at those sites is more limited. Furthermore, research on OA-driven biological impacts has largely been limited to laboratory and confined sites. Without simultaneous collection of biological observations, it is difficult to know how OA affects marine biota in situ, especially marine calcifiers with already demonstrated in situ negative effects. Identification and development of suitable indicators, combined with the integration of sustained observations from GOA-ON and MBON, would allow for long time series observations at specific locations where measurements of biological community composition and activity are collected in tandem with hydrographic and biogeochemical variables.
Global Ocean Acidification Observing Network is actively involved in supporting SDG 14.3 (UNESCO, 2018). The GOA-ON data portal serves13 metadata for a variety of assets, and some limited data products and visualizations of data streams. While primarily chemical and physical variables at present, there is desire to have interoperability with biological data portals; this presents an opportunity for the MBON and GOA-ON communities to develop shared approaches through collaboration.
Observations and Data Products to Meet User Needs
MBON, GEO Blue Planet, and others recognize several broad categories of users of marine biodiversity data: managers, natural and social scientists, private organizations, and governmental and non-governmental organizations. Specific sectors include commercial and recreational fisheries; cruise, hotel and other aspects of tourism; extractive industries such as oil, gas, other energy development and mining; and maritime transportation. Thus, they include managers and planners addressing conservation and multiple and often competing uses of marine resources. Researchers, educators and the general public use these data for activities ranging from scientific inquiry, and the development of pharmaceuticals to recreation. Each user operates at unique spatial and temporal scales and for particular purposes.
The context of planning and management of ocean uses is of particular interest. For example, applications may use information about seasonal biodiversity hotspots, or species aggregation areas, to minimize negative interactions with an industry such as mineral and oil extraction, maritime transport, or fisheries. Specific applications may help to minimize possible bycatch by specific fisheries sectors, route ship traffic to avoid areas of marine mammal migrations, or manage noise that may harm specific marine fauna. The information is intended to define thresholds of vulnerabilities in different habitats. Such applications support marine spatial planning that is temporally dynamic.
Open access to information, analyses and syntheses is critical to an integrated global observing system that serves the broad set of users outlined above. Benson et al. (2018) promote broad acceptance of the Findable, Accessible, Interoperable, Reusable (FAIR) principles for data (Wilkinson et al., 2016). While FAIR does not necessarily imply access at no cost, for MBON, open access means that any user can download the data they require without prerequisites or limitations, and can re-use the data as long as they cite the original datasets. A centralized open access data system exposed through easy and user-friendly portals, tailored to the needs of different stakeholders, is essential. Putting this in context, investment in new or sustained observations of biology should be guided by iterative interactions with users that enable identification of data targets and establish priorities for the observing system.
Implementing such critical applications is difficult today because current databases and our knowledge on biodiversity is uneven in many parts of the world. Historically, sampling efforts have been highly variable (Chaudhary et al., 2017). There have been and continue to be mismatches in long-term observational plans, inequalities in technical and research capacity, and lack of funding and trained scientists in many regions (Hui et al., 2011). Significant spatial and temporal observational gaps remain over large geographic areas around the planet (Muller-Karger et al., 2018b). For example, biological records stored in OBIS show that the density of records of observations in tropical areas and the southern hemisphere is significantly lower than in the northern hemisphere. A major goal of MBON is to encourage contributions by the global ecological community to OBIS to address this. In areas where density of observations is high, challenges include prioritization of core monitoring requirements, integration across existing monitoring activities, and investment in standardized observations and technologies to fill gaps. Maintaining observations for long enough to detect shifts and trends in marine life represents a particular challenge. There is also a challenge with encouraging the science and management communities to report observations to databases like OBIS in a timely fashion.
Compilation of historical data of biological in situ responses to environmental change and variability through data archaeology can provide long-term data and can enhance data synthesis toward measuring changes against baselines to identify the most vulnerable habitats and ecosystems. Data management activities and platforms are needed that can support integration of biological observational data with physical and biogeochemical parameters to understand interactions of species, changes to habitats, and impacts of environmental variations from multiple sources and stressors. A common infrastructure with a shared, open access data platform is critical to pull this all together.
Ocean observing communities must develop and endorse operational best practices for observatory design, sample collection and calibration, data management, and product dissemination of multi-level data products. To enable this process, the IOC hosts the Ocean Best Practices System14. Best practices are documented procedures that, through experience and research, consistently have yielded results superior to those achieved by other means and can be used as a benchmark, and ideally will become widely adopted (Pearlman et al., 2018). Coordination is important to accelerate uptake of new technologies, many of which aim to reduce the time between data collection and quality-controlled data availability through automation. This improves temporal and spatial resolution while reducing long-term costs.
Gaps and Challenges
Better integration of biological observing into the global observing system has challenges that can be overcome working as a community. There is a need for better understanding of critical user needs in different localities and to establish an iterative process that allows review of products at every phase. Integration and widespread implementation of biodiversity observations will require an accelerated development, and lower costs, of new technologies such as those outlined by Boss et al. (2018) and Lombard et al. (2019) (this Frontiers issue in the context of Ocean Obs 19). Inherent challenges of distributed, inter-disciplinary networks include ensuring reproducibility of data products and processes, as well as the technologies involved, promoting data literacy that bridges oceanographers and biologists with data science experts, continued incentives for sharing data (Hazen and Bromberg, 2018), while also realizing that just sharing data and code are not enough—workflows must also be shared (Wright, 2016; Benson et al., 2018).
Development of indicators to address global policy requirements or local management questions is also an area that requires agreement to identify and prioritize observing and data targets. This is a fundamental objective of the development of EOVs and EBVs, as these are the information products from which indicators are assembled. Agreement on methods and common standard sampling protocols still presents many opportunities as well as a solution to ease challenges of interoperability of approaches and data and to facilitate capacity building for expanded sampling coverage. As noted previously, in some areas density of observations is high - but in other areas where the physical environment is difficult to sample or where resources do not exist to support observing efforts, there are significant observation gaps. The global community can better work together to fill these gaps by pursuing facilities, funding and human resources for monitoring; ensuring standardized approaches to collection of biological and biodiversity observations; and providing opportunities for young researchers such as internships, scholarships, and exchanges toward educating new practitioners in shared approaches. Educational organizations such as UNESCO and its field-specific projects such as Ocean Teacher Global Academy (OTGA), the Partnership for Observation of the Global Ocean (POGO), and many academic, private, and informal groups provide platforms for knowledge sharing (Miloslavich et al., 2018b).
Training and educational activities help address these challenges and enhance our understanding of regional and global biodiversity and biogeography patterns.
New Methods and Integrative Approaches
The range of methods for studying and assessing biodiversity is large, yet it exists within largely self-contained expert communities. The potential to deploy many of these methods globally is variable and limited. This challenges our ability to conduct biodiversity assessments within national Exclusive Economic Zones (EEZs) and between the EEZs or in specific areas of interest in different countries and regions with relevance to the CDB or UN SDGs. In the sections below, we describe candidate biodiversity monitoring methods that show promise for the global observing community.
Ultimately, observations lead to the ability to interpret change in the context of environmental data (e.g., Austin, 2007; Helmuth, 2009; Mislan and Wethey, 2011; Woodin et al., 2013). The relative advantages and disadvantages of correlation (“climate envelope”) versus process-based modeling of species distributions and biodiversity patterns remains an active area of discussion and debate (Pacifici et al., 2015), but both are important tools to enable ecological forecasting and species distribution modeling (Rougier et al., 2015).
Remote Sensing
The assessment of changes in marine life to sustain ecosystem services, including food provisioning and water security around the world, requires innovation in the combination and application of in situ and remote sensing observations (Geller et al., 2017). Field surveys cover only small areas but are necessary to evaluate the elements and processes defining marine biodiversity, especially at depth. Remote sensing using satellites offers the only feasible means to assess patterns in surface-ocean EOVs at regional or global scales repeatedly and over long periods (Miloslavich et al., 2018a,b; Muller-Karger et al., 2018a). Combining synoptic environmental data of ocean color, sea surface temperature, sea surface salinity, sea surface height, and sea surface winds provides a means to characterize past and current variability in biogeographic regions (i.e., ‘Seascapes’) across the globe (Kavanaugh et al., 2018). Ultimately, this information is fundamental for any capability to predict changes in ocean ecosystems using models.
The assessment of coastal and marine biodiversity using remote sensing is largely based on the correlation of traits of organisms and of species’ natural ‘tolerance windows’ with the habitats in which they live, and then tracking with remote sensing how these habitats change over time. Much effort is currently placed on determining these patterns from information contained in the sunlight scattered and absorbed, or light emitted (as in fluorescence), by different species, species populations and communities, and habitats. These light-based signals contain information on functional phytoplankton groups, colored dissolved matter, and particulate matter near the surface ocean, and of biologically structured habitats (such as floating and emergent vegetation and also benthic habitats like coral, seagrass, algae). EOVs from remote sensing can be used to derive sets of EBVs (Pereira et al., 2013), including the distribution, abundance, and traits of groups of species populations, and to evaluate fragmentation of habitats.
Satellite ocean color observations of the surface open ocean were first demonstrated with the Coastal Zone Color Scanner (CZCS; 1978–1986). Since then, a number of ocean color missions have been flown by different countries over the years. These data typically have a spatial resolution of between about 300 m and 1 km pixels, with the intent of providing near-daily coverage of the global ocean. A new generation of ocean color sensors is being planned to continue time series that provide important regional and global ocean coverage in order to understand long-term changes in phytoplankton biomass and to make inferences about changes in carbon pools and fluxes in the global ocean. The new sensors will measure additional colors that will improve our ability to monitor biodiversity in pelagic ocean waters and quantify phytoplankton functional types, such as nitrogen-fixing organisms (e.g., Trichodesmium), calcifiers (coccolithophores), producers of dimethyl sulfide or DMS (e.g., Phaeocystis), silicifiers (e.g., diatoms), and identify various harmful algal and bacteria blooms. For example, NASA is building the hyperspectral Plankton, Aerosol, Cloud, and ocean Ecosystem (PACE) imaging spectrometer mission, for launch in the 2022–2023 timeframe. This will complement the European Space Agency’s Sentinel-3A and Sentinel-3B satellites with the two multispectral Ocean and Land Color Instruments (OLCI). Together, these OLCI sensors provide near daily global ocean coverage.
Space agencies of the world are also evaluating plans to design satellite missions to observe coastal areas. These habitats change rapidly with fluctuations in tides, temperature, salinity, wind and river input, pollution, and physical destruction. These changes occur over scales directly relevant to human activity, in the order of meters to tens of meters. Making these observations requires a new generation of satellite sensors able to sample with unique characteristics of high spatial resolution (∼60 m pixels or smaller), high spectral resolution (∼5 to 10 nm in the visible and 10 nm in the short-wave infrared spectrum for atmospheric correction, and aquatic and vegetation assessments), high radiometric quality and high signal to noise ratios, and high temporal resolution (hours to days). This approach is called “H4” imaging (Muller-Karger et al., 2018a). Global H4 coverage of coastal habitats can be achieved with several concurrent H4 satellites. These complement missions such as Landsat and the Sentinel 2 series, and planned hyperspectral missions such as the NASA Surface Biology and Geology (SBG) mission. The SBG concept is in accelerated development and will provide hyperspectral visible and short-wave infrared observations at 30-m spatial resolution, with multiple bands in the infrared at slightly coarser spatial resolution. The objective is to provide observations relevant to biodiversity of continental areas, including inland fresh water bodies and global coastal waters (The name SBG may change as the mission concept evolves).
In situ Observation Methods
Boss et al. (2018) and Lombard et al. (2019) (this issue) describe sensors, instruments, platforms, and methods that are available at present for in situ, operational observations of plankton. The goal of plankton observations is to understand the basis of the food chain, which responds to changes in the environment due to natural abiotic and biotic forcing (bottom-up forcing) and direct human pressures such as fisheries, other extractive practices, and pollution (top-down forcing) (see Muller-Karger et al., 2014). There is a need to go “beyond fluorescence” and collect biological observations that allow the characterization of how carbon, micro-nutrients, and energy are partitioned across diverse forms of life (Boss et al., 2018). This information is important also to understand where and when food webs may develop and sustain ecosystem services, such as fisheries of one type of another, carbon storage or release, or sediment formation.
Measurements of optical characteristics of the water, including absorption, scattering, attenuation and fluorescence, are now routine in oceanography. They characterize bulk properties of small particles and organisms (microns to millimeter-size objects). They can be deployed on CTD (conductivity-temperature-depth) rosettes and in-line flow-through systems on boats, but increasingly also on moorings and other autonomous devices like Argo floats and gliders.
Some devices measure particle size and concentration, such as Coulter Counters and the LISST series of instruments. Other devices image organisms and classify them to some level of taxonomy. An advanced optical device that provides measurements to quantify the biodiversity of phytoplankton is the Imaging Flow Cytobot (Brownlee et al., 2016; Hunter-Cevera et al., 2016). The Imaging Flow Cytobot may be deployed as part of an in-line flow-through system on ships, which provides a means to survey plankton over long distances. It may also be deployed as part of a moored buoy system to measure how phytoplankton is changing over time, including the phenology of individual or aggregate phytoplankton communities, and provide measurements of which organism may dominate during a bloom. Other flow cytometers used in oceanography include the CytoSense/Cytobuoy. Zooplankton imaging is now also possible with a number of devices, such as the ZooScan, ISIIS (In situ Ichthyoplankton Imaging System; Cowen and Guigand, 2008), and the Underwater Vision Profiler (Picheral et al., 2010).
These devices, especially the flow cytometers and imaging devices, are still very expensive; there is a need to develop inexpensive versions of such technologies for more widespread use. Imaging devices also generate large quantities of data and images that require automated expert classification, so a number of information technology challenges (machine learning, data curation, archival, distribution) must also be addressed.
Acoustic monitoring can complement other types of sensor-based or visual observations of biodiversity. This can include active acoustics, such as echosounders that pulse and record reflected sound to support biomass and abundance estimates, spatial and temporal distributions, and measurement of size distributions and population structure; transducers in fixed locations that record sound to identify and count fish; or acoustic cameras that create high resolution, three-dimensional digital images of the water column (Discovery of Sound in the Sea, dosits.org). Passive acoustic monitoring uses technology such as hydrophones to listen to ocean ambient sound, augmenting other survey methods and documenting the acoustic environment to support research on the impacts of ocean noise to marine life. Increase in ocean noise raises concerns about the acoustic quality of marine habitats and could have consequences for many species and ecosystems.
Animal telemetry approaches – including use of archival, satellite, and acoustic tags and receivers – allow understanding of environmental conditions as well as the movements and behavior of some marine life, including cetaceans, pinnipeds, turtles, sharks, rays, and fishes. In the 2018 Future Science Brief of the European Marine Science Board, Benedetti-Cecchi et al. (2018) reviewed the literature describing availability of information about marine animals collected with biologging technology. Animal tagging is important for research on the behavior and condition of animals as well as for collection of oceanographic data about the habitats they occupy, transit and use. Integration of animal tagging information for higher trophic level species with data collected from other parts of the system can help answer questions about impacts on top predators and protected species. Advances in transmitters, receivers, and data storage tags over the past decades enable collection of high-quality biological and oceanographic observations on timescales varying from days to years as the animals move through aquatic habitats (US Animal Telemetry Network Implementation Plan)15. The resulting data can inform management of fisheries and protected species, assessments of impact of human activities on aquatic species, and improved ocean models and forecasts.
Other novel methods of in situ sampling have focused on recording environmental conditions for comparison against physiological tolerance data (Singer et al., 2016). Such measurements have shown surprisingly high spatial and temporal variability in factors such as pH and temperature (Hofmann et al., 2011) which can potentially impact our predictions of environmental change on biodiversity and species distribution patterns (Kroeker et al., 2016). For example, temperatures recorded in situ on coral reefs indicate patterns and extremes that are sometimes, but not always, directly extrapolated from measurements of SST (Smale and Wernberg, 2009; Castillo and Lima, 2010). Environments such as intertidal systems and shallow coral reef habitats (Leichter et al., 2006) are especially problematic in this regard. In intertidal systems, biomimetic instruments such as the ‘Robo-Limpets’ deployed as part of MBON Pole to Pole have demonstrated that geographic patterns based on these instruments, which record conditions directly relatable to those experienced by the organism, can yield radically different predictions from those based on large-scale pixels such as from remote sensing (Helmuth et al., 2002). These observations point to the strength of combined approaches that capitalize on the importance of large-scale, continuous data available from remote sensing with more targeted approaches based on in situ monitoring (Geller et al., 2017; Bates et al., 2018).
Multi-Omic Sampling
Frameworks of biodiversity assessment set forth in agreements such as the CBD urge that observational activities include every level of biological organization. This is echoed by the biological and ecological EOVs under development within GOOS, such as variables for mangroves and corals, as well as microbes. Thus, the components of biodiversity observation networks, such as MBON, must be able to provide integrated insight on molecular, cellular, physiological, population- and community-level diversity, as well as ecosystem-level integrity (Bednaršek et al., 2017; Goodwin et al., 2019). At the finer scale of this continuum, novel, increasingly cost-effective approaches to assess diversity, variation, and anthropogenic impact at the molecular and cellular level are of high interest due to their sensitivity, ability to augment existing methods of observing macro-organisms (e.g., Bourne et al., 2016; Apprill, 2017; Bierlich et al., 2017; Stat et al., 2018), and their ability to report on the microbial life which is central to the functioning of the changing oceans (e.g., Moran, 2015; Sunagawa et al., 2015; Stat et al., 2017; Buttigieg et al., 2018). We thus propose that “omics” approaches – those that analyze organisms at the molecular level, including DNA, RNA, proteins, and small molecules – are utilized to ensure that an integrated and global MBON can report on biodiversity across scales. Omics encompasses fields such as genomics, transcriptomics, proteomics, and metabolomics as well as their application to environmental samples (e.g., metagenomics, metatranscriptomics, metabarcoding; see Aguiar-Pulido et al., 2016 for an overview). Omics approaches identify organisms, their status, and their adaptation potential and are predictive, showing how these might change in response to environmental change).
Over the last decade, omics theory, methods, and applications have been transferred from the research domain into operational and long-term observation settings, and progress has already been linked to MBON’s core objectives through demonstration projects analyzing microbial, invertebrate, and vertebrate target species and populations (Andruszkiewicz et al., 2017; Djurhuus et al., 2017, 2018; Goodwin et al., 2017). In the marine realm, omics methodologies and standards have been driven forward by large-scale surveys of ocean waters such as the Global Ocean Sampling (GOS) expedition (Rusch et al., 2007), the TARA Oceans expedition (Karsenti et al., 2011; Sunagawa et al., 2015), the California Cooperative Oceanic Fisheries Investigations (CalCOFI; Goodwin et al., 2019), and Ocean Sampling Day (OSD; Kopf et al., 2015) with support from organizations such as the Genomic Standards Consortium16 (Field et al., 2011). They have been contextualized by multi-biome initiatives primarily represented by the Earth Microbiome Project (EMP; Thompson et al., 2017). In parallel, omics-enabled marine observatories and time series have emerged from the poles17 (e.g., Soltwedel et al., 2013) to temperate (Andruszkiewicz et al., 2017) and tropical/subtropical latitudes (Steinberg et al., 2001; Karl and Church, 2014; Muller-Karger et al., 2019). Indeed, as an indicator of future integration, some of these efforts have interfaced with established ocean observing activities such as GEOTRACES18 (Biller et al., 2018).
Currently, the bulk of omics ocean observation is directed toward marine microbes. Thus, it addresses a major gap in our observational capacities: most contemporary ocean observation programs do not target microbes, despite their key role in driving major biogeochemical cycles and essential ecosystem services (Boetius et al., 2015; Moran, 2015). Omics technologies–with their falling cost and growing practicality–are our best available option in meeting growing calls for understanding the global microbiome (e.g., Dubilier et al., 2015) and supporting the emergence of the Microbial EOV under development within the GOOS Biology and Ecology Panel (Miloslavich et al., 2018a; Muller-Karger et al., 2018a).
Be it for microbes or metazoans, omics is providing new insights and sensitive tools to detect shifts in community assemblages in response to changes in environmental conditions that can support management of marine environments in the face of rapid global change (e.g., Cordier et al., 2017; Goodwin et al., 2017; Pawlowski et al., 2018). However, the impact of omics observation is strongly dampened by the lack of global, standardized, and well-contextualized datasets and accompanying best practices (Buttigieg et al., 2018). There is a need to engage international networks of omics observers and collectively interface with established global observation programs.
Part of this need is being addressed by existing efforts such as the Genomic Observatories Network (Davies et al., 2014) and the emerging Global Omics Observatory Network (GLOMICON)19, an outcome of the AtlantOS project20. Such networks are facilitating the alignment of protocols and information standards, as well as activities such as round-robin calibrations to enable omics to move closer toward operational biodiversity monitoring systems, e.g., omics applications that complement biodiversity surveying of marine macrophytes (Zardi et al., 2015; Neiva et al., 2017; Hamaguchi et al., 2018). These networks also offer avenues for methodological comparisons (e.g., Pesant et al., 2017; Fahner et al., 2018), (meta)data management solutions (e.g., Deck et al., 2017), and emerging reporting practices (e.g., Nilsson et al., 2018) to attract more rapid reaction from the ocean omics community.
MBON offers a vital rallying point to fully realize the immense potential of multi-omic observation; its focus on operationalizing biodiversity observation will be essential to channeling and guiding marine omics through the next decade. Thus, we argue that:
1. The accessibility and long-term value of omics data should be more widely communicated within the ocean sciences.
2. Marine omics initiatives, particularly long-term or observatory-grade projects, should join and help shape omics observatory networks to present a coordinated front when interfacing with established ocean observation networks.
3. Networks of marine omics observers and MBON should align and guide one another to efficiently enhance and/or complement broader biodiversity observational capacities with molecular methods, with an initial focus on metagenomics and marker gene sequencing.
4. Omics-based observations should be rigorously tested before being integrated into routine ocean observations programs, preferably through a coordinated and international set of facilities.
5. Global baselines of standardized omics observations must be gathered, particularly in undersampled regions of the World Ocean to develop a basis from which changes may be detected with greater consistency.
6. Omics data must be exchangeable in a FAIR-compliant (Findable, Accessible, Interoperable, Reusable) manner, and omically enabled observatories must be able to 1) seamlessly understand and query one another’s data and 2) automatically synchronize and/or submit their data with aggregators such as GBIF and OBIS.
7. The GOOS Biological and Ecological EOVs, particularly the Microbial EOV, should integrate omically-based measures of phylogenetic and functional diversity – and their derived products – to report on marine ecosystem state, functioning, and health.
8. Support should be gathered for the development of autonomous devices which allow the collection of samples for omics, initially focused on collecting samples for processing on shore.
Citizen Science
Successful data collection over the range of scales necessary to detect marine biodiversity change globally and to identify underlying mechanisms will require expansion of currently underutilized methods. These include efforts such as citizen science (Amano et al., 2016; Stuart-Smith et al., 2017; Pandya and Dibner, 2018) and the incorporation of Traditional and Local Ecological Knowledge (Thurstan et al., 2015; Charnley and Carothers et al., 2017). Goals of citizen science activities include a more comprehensive understanding of changes and also more sustained monitoring efforts in remote and difficult to reach areas. Citizen science efforts on land have been very successful in filling information gaps on biodiversity through efforts such as bird counts (Amano et al., 2016).
While some well-supervised and quality-controlled citizen science programs focusing on aspects of marine biodiversity have been successful, such as the Reef Life Survey (Stuart-Smith et al., 2018), compared to terrestrial efforts these programs are still restricted in scope. These programs have tremendous potential that should be considered and explored. In the United States, the Office of National Marine Sanctuaries supports numerous citizen science efforts as part of its outreach programs21. BioBlitz events are popular all over the world, including among MBON partners participating in the Smithsonian-led MarineGEO22, which is working to fill gaps in the systematic collection and sharing of long-term data in the coastal zone. BioBlitzes are intense periods of biological surveying in an attempt to record all the living species within a designated area.
Ocean Sampling Day is a global scientific campaign that takes place during the solstice on June 21st, when 600 citizen scientists collect seawater samples to analyze marine microbial biodiversity and function23 ; Ocean Sampling Day activities have included a citizen science component, “MyOSD” (Schnetzer et al., 2016). In the United Kingdom, the Capturing our Coast project24 trained ∼3000 citizen scientists between 2015 and 2018 to record patterns of species distributions in intertidal zones in the United Kingdom.
Crowd-sourced efforts to record not just biological data but also physical data are nascent, but there are examples of highly successful programs, including the Cefas citizen science diver program25 and Project Hermes26. Wright S. et al., 2016, amalgamated data from recreational diver computers to compare diver profiles with existing Sea Surface Temperature and CTD measurements, to demonstrate the utility of these profiles for monitoring. The NOAA Ocean Acidification Program is cross-validating citizen-collected data on ocean pH with sensor data in the northeastern United States. The Smartfin project is outfitting surfboards with sensors capable of recording temperature and ocean pH27.
Artificial Intelligence
Artificial intelligence (AI) refers broadly to computer systems that “can sense their environment, think, learn, and act in response to what they sense and their programmed objectives” (World Economic Forum, 2018). Machine learning is a subset of AI encompassing methods that incorporate a broad range of prediction, dimension reduction, classification and clustering. Deep Learning is, in turn, a subset of machine learning, composed of a group of specific methodologies using multi-layered neural networks, for more complex classification and predictive decision-making often requiring less training than traditional methods. AI in recent years, using Deep Learning techniques, has demonstrated the ability to drive vehicles and dominate the most complex games, such as Go.
How does this relate to marine biodiversity observation? Traditional forms of statistics and machine learning for predicting the distributions of species has long been a mainstay of marine biogeography. However, one of the most time-consuming aspects of biological observation has been identifying species, historically requiring taxonomic experts. Deep learning techniques enable automated classification of species from a variety of platforms, including: opportunistic citizen science visual observations (e.g., redmap.org.au; iNaturalist.org; Pimm et al., 2015); benthic photo quadrats (BisQue; Rahimi et al., 2014, Fedorov et al., 2017, 2018); cabled video observatories (Marini et al., 2018); unmanned underwater vehicles (Qin et al., 2015; Sung et al., 2017); acoustic-sensing hydrophones (Dugan et al., 2015; McQuay et al., 2017); plankton-sensing flow cytometers (Göröcs et al., 2018); and satellite imagery (Guirado et al., 2018). Taxonomic experts are still very much needed for developing datasets as inputs to this modeling approach.
Using this technology, sensor platforms could stream data into Deep Learning classifiers that produce species classifications with confidence metrics, such that high-confidence species classifications could then populate observational archives, such as OBIS, in real-time. Deploying these automated classification techniques across the wide range of available platforms promises to massively augment our ability to observe marine species.
Beyond simply detecting species, AI could be used to discern sex and age of organisms in the environment or diseases that may be affecting them (Rossi, 2017). Similar to self-driving vehicle applications, AI can improve navigation of unmanned underwater vehicles (Zhang et al., 2017; Cheng and Zhang, 2018). Even more broadly, AI has many potential applications to promote healthy oceans, including: sustainable fishing, preventing pollution, protecting habitats and species, as well as monitoring and mitigating impacts from climate change (including acidification) (World Economic Forum, 2018).
Critical needs in this new emerging area include (Hazen and Bromberg, 2018):
1. Framing of the questions that machine learning and deep learning can tackle – what hypotheses can be tested?
2. Highlighting exploratory questions—what are the specific opportunities we need to address first?
3. Identifying the most important feature in a natural system, including those that humans may have overlooked.
4. Conditioning the data for integration – some are spatial, such as vector point data and some are interpolated.
5. Knowing what tools to use, and when or how to use them (e.g., random forests, deep neural networks, convolutional neural networks, etc.).
6. Training datasets with accurate labels.
Ecological Marine Unit Classifications
Multiple approaches have been considered to classify marine ecosystems. Marine ecoregions (Spalding et al., 2007) represent an approach to classify coastal and shelf regions that has been widely used. The Global Environment Facility (GEF) has adopted the Large Marine Ecosystem concept as a framework to organize and implement ecosystem-scale resource assessment and management in coastal waters28. Here we describe in more depth the Ecological Marine Unit (EMU) approach, but the complementary nature of these and other efforts must be considered.
Ecological Marine Units represent a new approach for stratifying and classifying marine ecosystems at a global scale (Sayre et al., 2017). EMUs were commissioned in 2015 by GEO as a standardized, practical global ecosystems classification and map for the oceans; they are a key outcome of GEO BON and a recent contribution to MBON. The EMU project is one of four components of the new GEO Ecosystems Initiative within the GEO 2016 Transitional Work plan, for eventual use by the Global Earth Observation System of Systems (GEOSS). EMUs are comprised of a global point mesh framework, created from 52,487,233 points from the NOAA World Ocean Atlas; spatial resolution is 1/4° by 1/4° by varying depth; temporal resolution is currently decadal; each point has x, y, z, as well as six attributes of chemical and physical oceanographic structure (temperature, salinity, dissolved oxygen, nitrate, silicate, phosphate) that are likely drivers of many ecosystem responses. Sayre et al. (2017) implemented a new variation of k-means statistical clustering of the point mesh (using the pseudo-F statistic to help determine the numbers of clusters), allowing us to identify and map 37 environmentally distinct 3D regions within the water column. These units can be described according to their productivity, direction and velocity of currents, species abundance, global seafloor geomorphology (Harris et al., 2014), and much more. A series of data products for open access share the 3D point mesh and EMU clusters at the surface, bottom, and within the water column (Figure 4), as well as 2D web apps for exploration of the EMUs and the original World Ocean Atlas data29 (Wright D.J. et al., 2016).
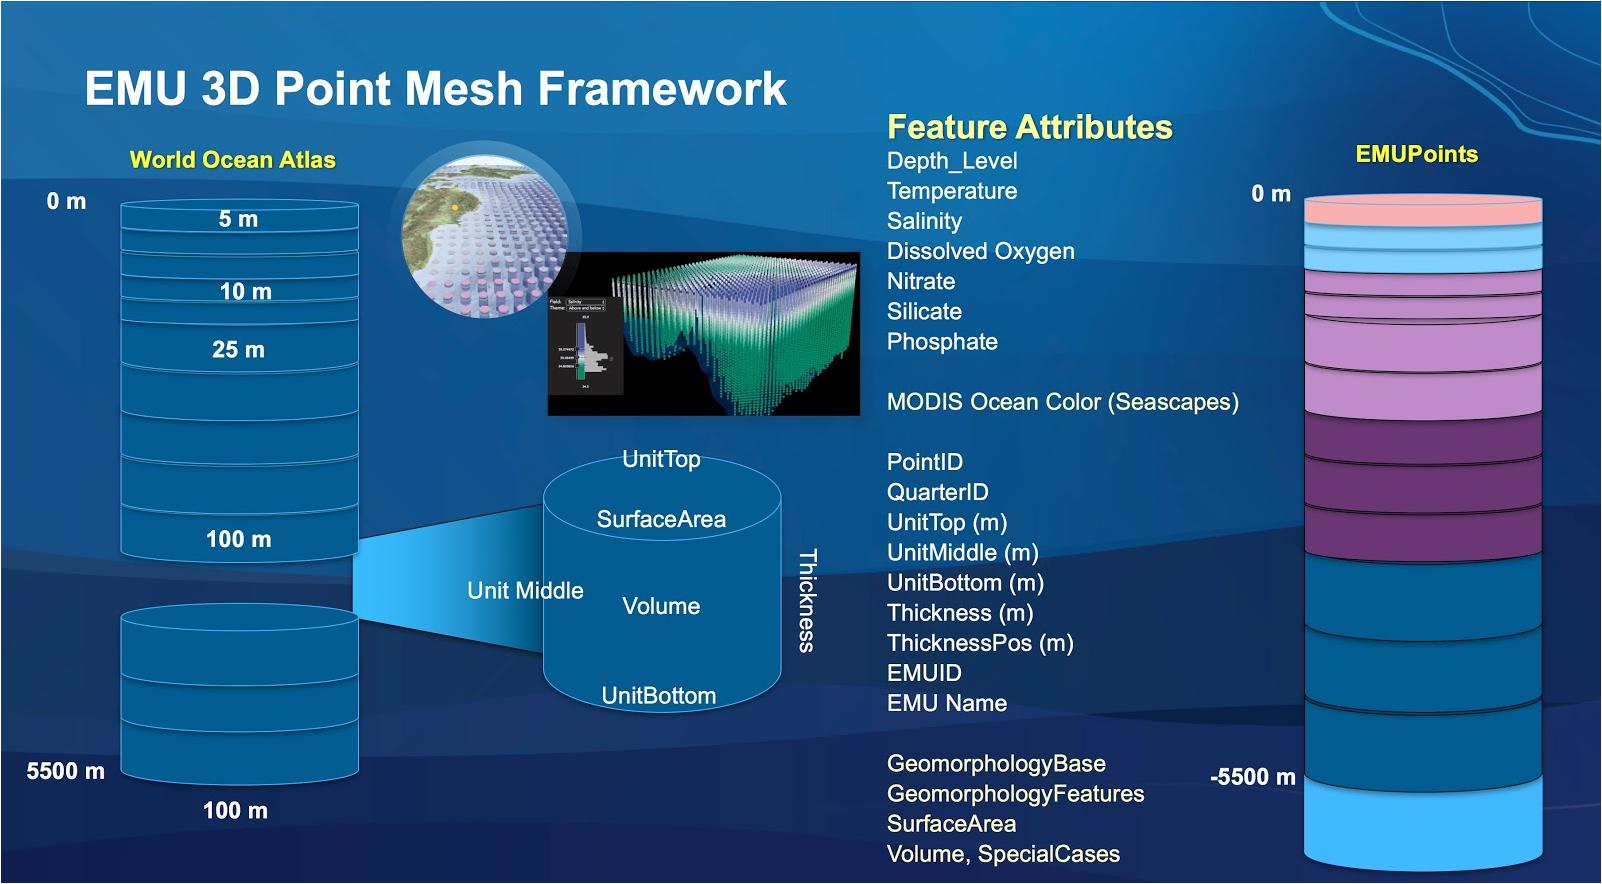
Figure 4. The EMU is comprised of a global point mesh framework, created from the NOAA World Ocean Atlas. Each point includes attributes of chemical and physical oceanographic structure that are likely drivers of many ecosystem responses.
Many cite the need to scale this global framework down regionally and up temporally. Hence, over 15 teams of researchers are implementing EMUs in regional use cases, based on their own higher-resolution data for a richer geospatial accounting framework and visualization of species distributions. Among these are use cases in temperate upwelling, shallow subtropical and polar regions, where boundaries of surface seascapes are compared to surface EMUs, and at seasonal scales (Kavanaugh et al., 2018). The EU-funded ATLAS project30 is comparing EMUs to species-based biogeographic clusters of Vulnerable Marine Ecosystems in the North Atlantic to refine UNESCO’s Global Open Ocean and Deep Seafloor effort for this region. German researchers compiling 5000–6000 deep-sea distribution records from expeditions to the Sea of Okhotsk, the Aleutian Trench, and the Kuril-Kamchatka Trench (e.g., Brandt et al., 2015) are comparing their EMU use case with the ATLAS use case. Another use case seeks to add data on Northeast Pacific, Puget Sound and Southern California Bight carbonate chemistry and how it relates to in situ responses of an ocean acidification indicator, such as pteropoda shell dissolution and stress responses and thresholds (e.g., Bednaršek et al., 2017; Bednaršek et al., in revision) to the EMU 3-D point mesh network to examine responses of ecosystems to influences such as ocean acidification and thermal stress. EMUs may have potential to be closely linked to habitat suitability to describe broader patterns of ocean health.
Validating EMUs for the Deep Sea
The study of vulnerable marine ecosystems (VMEs) biogeography has received limited attention, mainly due to the difficulties of collecting benthic data from deep-water environments—especially in large areas far from land—and the costs associated to these explorations. However, many VMEs lie in areas beyond national jurisdiction (ABNJs) where their distribution and driving factors of occurrence remain poorly understood. Biogeographic classifications have been used to analyze patterns of marine biodiversity and advance knowledge of evolutionary and ecosystem processes, even when information is sparse in certain areas (Rice et al., 2011). Biogeographic classifications can also assist governments in designing area based management tools (ABMT), such as marine protected areas, that might lead to better ocean governance in a future ocean challenged by rapid rates of climate change and increased exploitation of living and non-living resources in the deep ocean.
The Global Open Oceans and Deep Seabed (GOODS) is a biogeographic classification system for the deep ocean (UNESCO, 2009; Watling et al., 2013) based entirely on physical proxies, presumed to reflect species biogeography. GOODS divides the deep ocean into pelagic and benthic biogeographic provinces based on biological data such as primary production, and a range of environmental variables. Other emerging biogeographic classification schemes covering all marine regions, such as the EMUs, generally converge to the same proposed biogeographic units in ABNJs. However, neither EMUs or GOODS are grounded in species data, nor have they been validated for complex habitats formed by VME indicator taxa.
The North Atlantic is a relatively young ocean that potentially offers the longest history of studying VME species, helping to understand VME biogeography. Heavy human exploitation (e.g., fisheries, renewables, oil and gas, deep-sea mining) and a rapidly changing climate (Rahmstorf et al., 2015) amplify the need to bring conservation efforts to this region. To help refine the GOODS biogeographic classification and validate EMUs for benthic species, EMUs were compared to species-based biogeographic clusters of VMEs in the North Atlantic.
Distribution data from VME species were compiled from published and unpublished data during the ATLAS project. Three main VME-forming groups were selected: sponges (Porifera), stony corals (Scleractinia) and soft corals (Octocorallia). Records were sparse (Figure 5), thus species data were aggregated into polygons, each polygon assigned to the EMU that was underneath it, and the original EMUs at 0.5° cell grid resolution were re-sampled to generate EMUs at 5° square cells. A distance matrix using Sorensen’s coefficient was created based on species similarities between polygons, and used to produce biogeographic clusters using the unweighted pair-group method with arithmetic averages (UPGMA) algorithm. Significant differences in species compositions between polygons were assessed using analysis of variance (ANOSIM). Briefly, no statistical differences were found, indicating that representations of deep-sea VME biogeography using physical proxies do not adequately reflect species-level biogeographic patterns (Table 1).
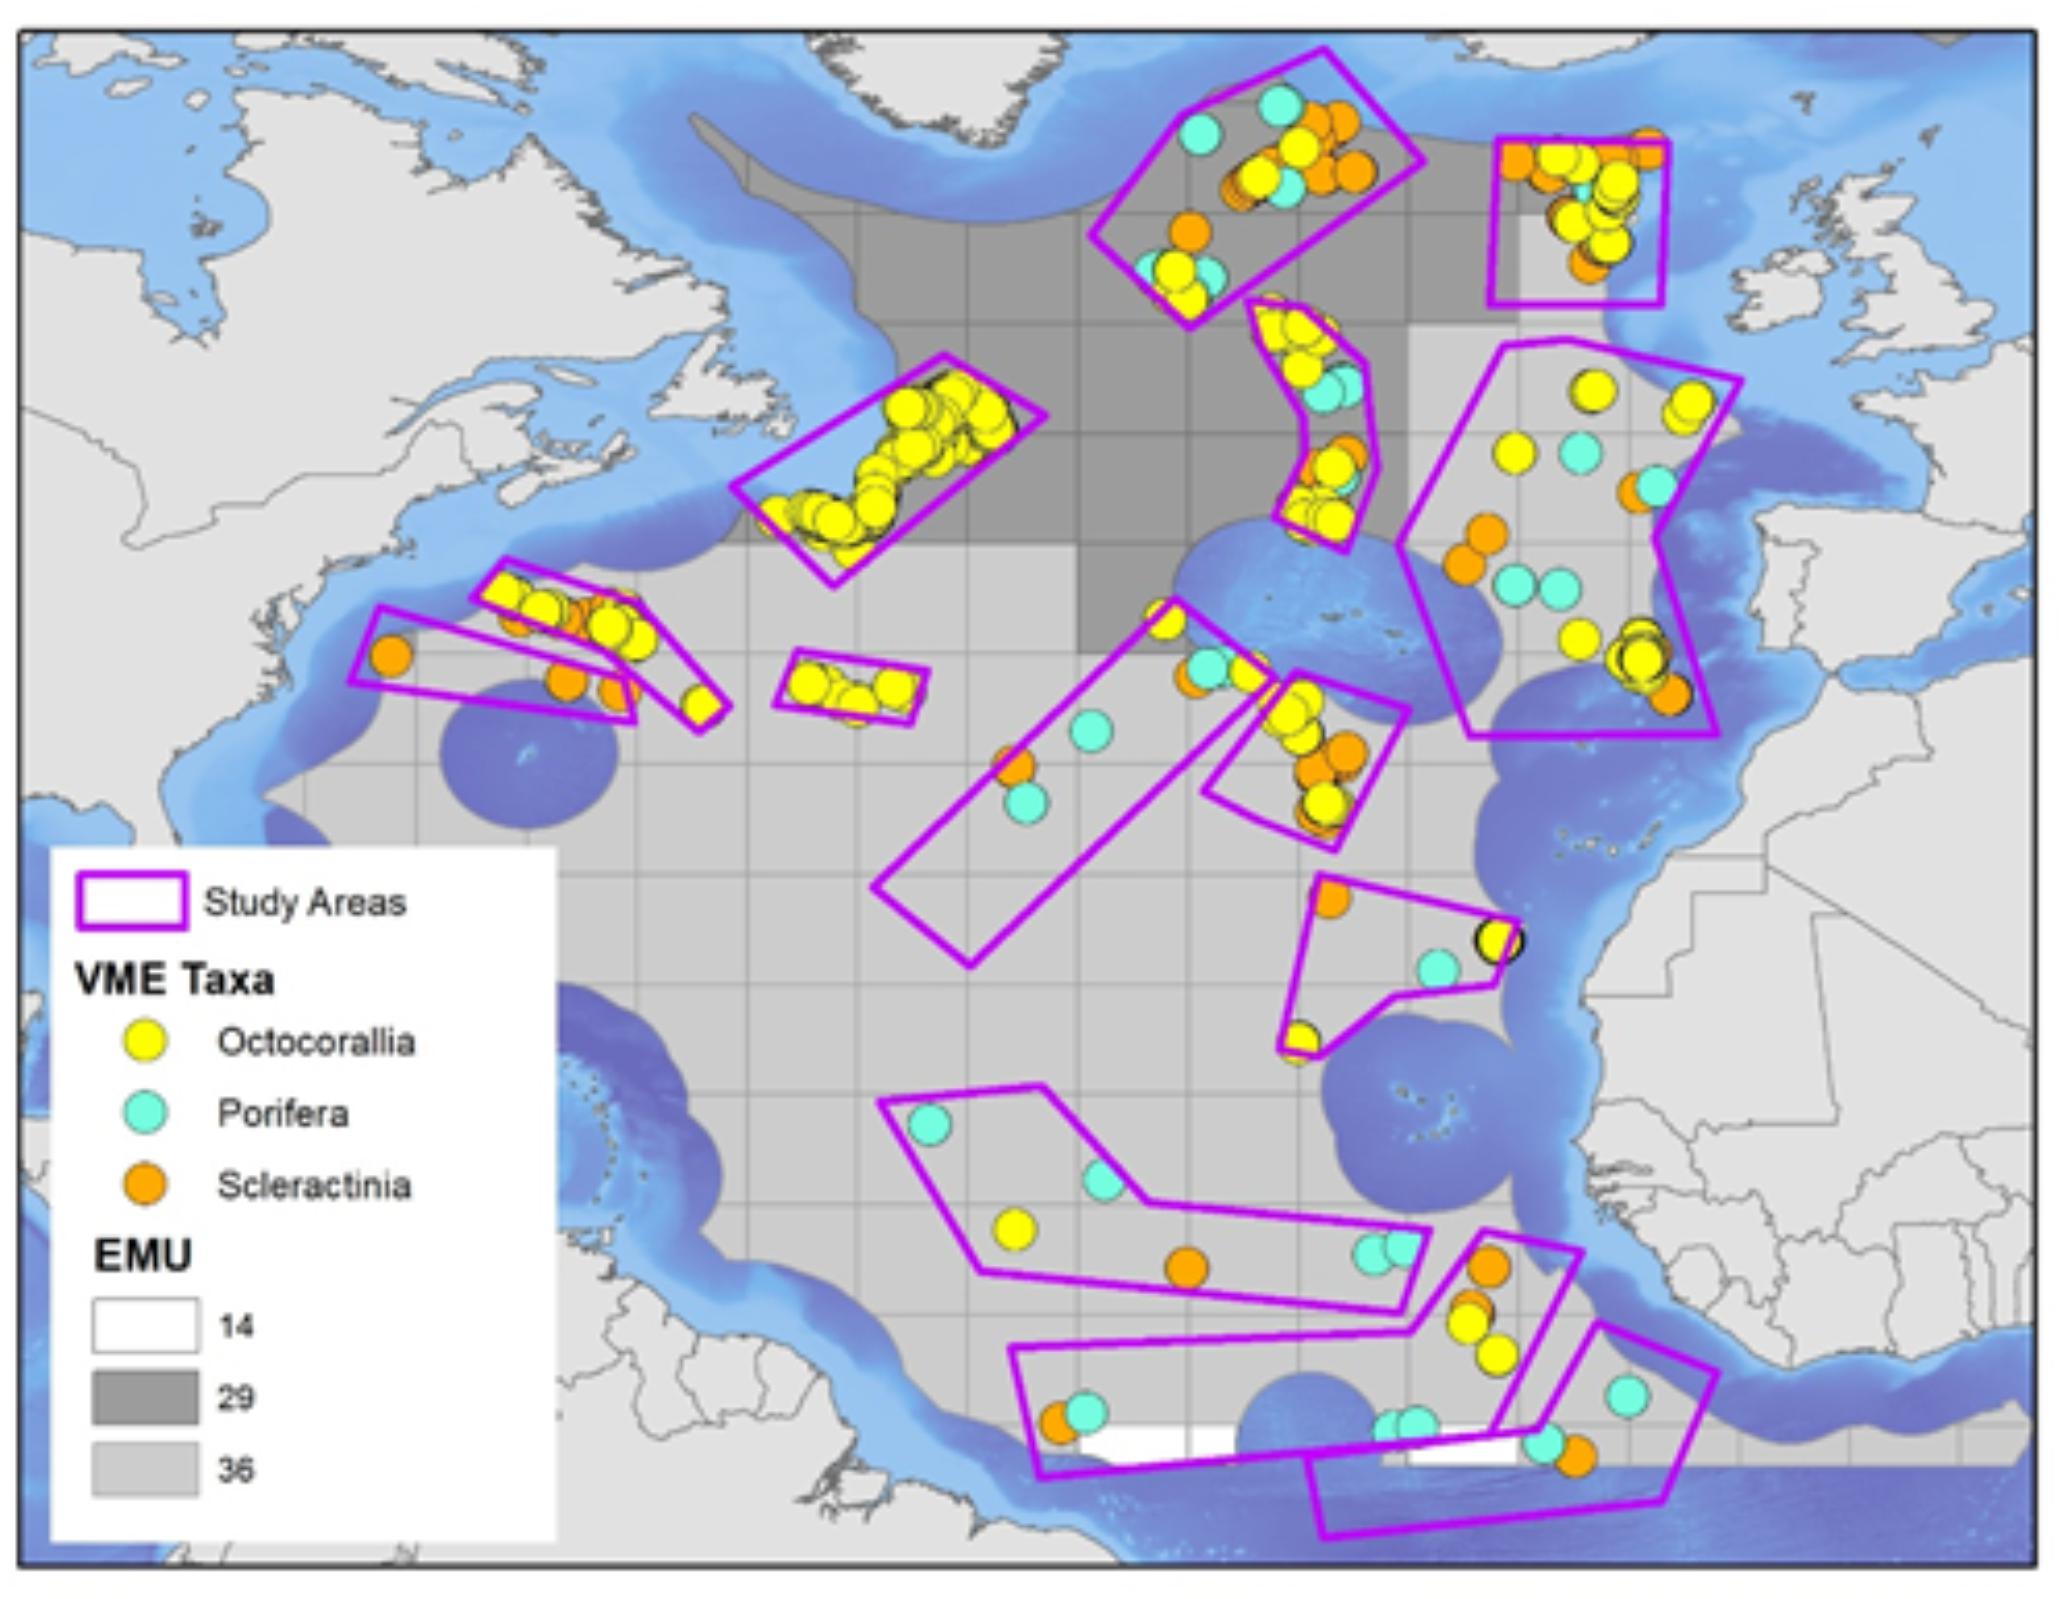
Figure 5. EMUs were compared to species-based biogeographic clusters of vulnerable marine ecosystems (VMEs) in the North Atlantic. Three main VME-forming groups were selected: sponges (Porifera), stony corals (Scleractinia), and soft corals (Octocorallia).
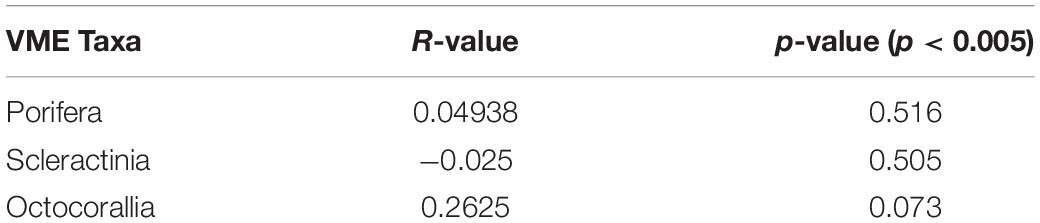
Table 1. Statistical analysis of representations of deep-sea VME biogeography using physical proxies.
The Next Frontier: Benefits and Recommendations
Advancing shared objectives toward the systematic, sustained and routine integration of biology into the global ocean observing system will bring additional important benefits, including: (1) expanding knowledge on the links among the marine environment, marine life, and the services the ocean provides; (2) coordination of disaggregated biodiversity and indicator monitoring and science programs to share data, experiences, knowledge, and standardized protocols; (3) increased understanding of physical, biological, chemical, climate, and anthropogenic drivers and their combined effects on ecosystem health; (4) enhanced capacity for forecasting of marine biodiversity and ecosystem health under future scenarios; (5) efficiency and optimized costs for data management and improved access to information; and (6) a framework for countries to establish biodiversity baselines and indicators to inform future assessments.
As noted previously, the Ocean Obs 09 conference established the Framework for Ocean Observing, which recommends that observing system development be science-driven, informed by societal needs, and iterative – using a feedback loop whereby system requirements and outputs (tools, products, services) are evaluated to ensure the system is meeting user requirements. Ten years later, we still endeavor to establish a sustained biological ocean observing capability that is integrated with GOOS approaches and systems and will enhance our understanding of life in the ocean and our ability to protect ocean resources while supporting robust, resilient economies and communities.
Ocean Obs 19 presents an opportunity to focus the dialogue around relevance of MBON, OBIS, and the GOOS Biology and Ecosystems Panel to JCOMM Observation Coordination Group activities. It is a key mechanism to inform future plans for GOOS, including development of GOOS Regional Alliances. The MBON partnership with GOOS and OBIS ensures a practical focus for development of a globally coordinated, sustained ocean observing system. MBON also works with the IOC’s Ocean Best Practices group31. MBON further works with global consortia focused on specific taxonomic groups or methodological approaches to biological observing (e.g., the global Continuous Plankton Recorder Survey, animal tracking networks). These groups are participating in the global dialogue and are together leading a community of scientists, managers, practitioners and users toward a common vision to build a sustained, coordinated, global ocean system of marine biological and ecosystem observations. Delivering the resulting information through an open access, integrated and quality-controlled database will support management decisions and address relevant science and societal needs.
Based on success of Ocean Obs 09, we encourage Ocean Obs 19 to endorse and advance the grass-roots and expanding effort embodied by MBON. In parallel, Ocean Obs 19 sponsors can promote a sustained, fit-for-purpose biological component of GOOS that leverages existing multi-disciplinary and multisectoral partnerships; integrates biology with physical and biogeochemical ocean observations; maximizes access to data and information products; and supports real-time needs for ecosystem-based assessment and management of marine fisheries, protected species, and special places. This has broad relevance for global policy drivers and priorities, as ecosystem-based assessments can be combined with socio-economic information to answer questions about economic, social and environmental impacts and sustainability. It is the only way to enable reporting mechanisms linked to the UN Sustainable Development Goals (particularly SDGs 14, 13, 15, 6, 2) as well as regional monitoring systems.
Conclusion
There is a real and present need for marine biological and biodiversity information to ensure wise and sustainable uses of the ocean. The Marine Biodiversity Observing Network of GEO provides a mechanism to bring together our global ocean observing community around the design and implementation of an integrated system to collect concurrent biological, biogeochemical and physical time series for marine life and relevant social and economic indicators of the status of humanity. Enabling such observations requires technology transfer between nations and groups, sharing of information, capacity building, and voluntary participation of citizens in biodiversity monitoring, providing standardized data useful for scientific analysis. All nations will benefit from a fit-for-purpose and sustainable observing system that improves our collective understanding of how life in the ocean is changing across spatial and temporal scales.
Author Contributions
GC, PB, AB, EM, HS, and DW contributed to the conception and design of the manuscript and provided the foundation for the manuscript development. GC led development and organization of the manuscript with much assistance from PB, AB, EM, FM-K, and BH. All authors contributed substantive content, supported multiple manuscript revisions, and read and approved the submitted version.
Funding
Contributions to this white manuscript were supported by: NASA grant NNX14AP62A “National Marine Sanctuaries as Sentinel Sites for a Demonstration Marine Biodiversity Observation Network (MBON)” funded under the National Ocean Partnership Program (NOPP RFP NOAA-NOS-IOOS-2014-2003803 in partnership between NOAA, BOEM, and NASA), and the U.S. Integrated Ocean Observing System (IOOS) Program Office; and NASA grant 80NSSC18K0318 “Laying the Foundations of the Pole-to-Pole Marine Biodiversity Observation Network (MBON) of the Americas,” under the A.50 Group on Earth Observations Work Programme. This is also contribution #4988 from NOAA Pacific Marine Environmental Laboratory. Some authors received funding from the European Union’s Horizon 2020 Research and Innovation Program under grant agreement no. 678760 (ATLAS); this output reflects only the authors’ views and the European Union cannot be held responsible for any use that may be made of the information contained therein. Any use of trade, firm, or product names is for descriptive purposes only and does not imply endorsement by the United States Government. PB was supported by the HGF Infrastructure Programme FRAM of the Alfred-Wegener-Institut, Helmholtz-Zentrum für Polar- und Meeresforschung.
Conflict of Interest Statement
BB was employed by company EcoQuants.
The remaining authors declare that the research was conducted in the absence of any commercial or financial relationships that could be construed as a potential conflict of interest.
Acknowledgments
Some recommendations from this work resulted from PEGASuS 2: Ocean Sustainability, a partnership between Future Earth, the National Center for Ecological Analysis and Synthesis (NCEAS), and Global Biodiversity Center at Colorado State University.
Footnotes
- ^ http://livingplanetindex.org/home/index
- ^ https://www.iucn.org
- ^ http://aquamaps.org
- ^ https://reeflifesurvey.com
- ^ http://www.reefbase.org/about.aspx
- ^ http://fishbase.org
- ^ http://sealifebase.org
- ^ http://www.birdlife.org/
- ^ http://www.oceanbestpractices.org/
- ^ https://www.caff.is/monitoring
- ^ https://arcticbiodiversity.is/index.php/monitoring-status-and-advice
- ^ www.goa-on.org
- ^ http://portal.goa-on.org/
- ^ http://www.oceanbestpractices.org/
- ^ https://ioos.noaa.gov/project/atn/
- ^ http://gensc.org/
- ^ http://mars.biodiversity.aq
- ^ http://www.geotraces.org/
- ^ https://glomicon.org/
- ^ http://atlantos-h2020.eu/
- ^ https://sanctuaries.noaa.gov/involved/citizen-science.html
- ^ https://marinegeo.si.edu/
- ^ http://www.my-osd.org/
- ^ https://www.capturingourcoast.co.uk
- ^ https://www.cefas.co.uk/cefas-data-hub/dois/cefas-citizen-science-diver-recorded-temperatures/
- ^ https://cousteaudivers.wordpress.com/2018/04/04/project-hermes/
- ^ https://smartphin.org/our-ocean/
- ^ https://www.thegef.org/topics/large-marine-ecosystems
- ^ http://www.esri.com/ecological-marine-units
- ^ https://www.eu-atlas.org
- ^ http://www.oceanbestpractices.org/
References
Aguiar-Pulido, V., Huang, W., Suarez-Ulloa, V., Cickovski, T., Mathee, K., and Narasimhan, G. (2016). Metagenomics, metatranscriptomics, and metabolomics approaches for microbiome analysis. Evol. Bioinform. 12(Suppl. 1), 5–16. doi: 10.4137/EBO.S36436
Amano, T., Lamming, J. D. L., and Sutherland, W. J. (2016). Spatial gaps in global biodiversity information and the role of citizen science. Bioscience 66, 393–400. doi: 10.1093/biosci/biw022
Andruszkiewicz, E. A., Starks, H. A., Chavez, F. P., Sassoubre, L. M., Block, B. A., and Boehm, A. B. (2017). Biomonitoring of marine vertebrates in Monterey Bay using eDNA metabarcoding. PLoS One 12:e0176343. doi: 10.1371/journal.pone.0176343
Apprill, A. (2017). Marine animal microbiomes: toward understanding host–microbiome interactions in a Changing Ocean. Front. Mar. Sci. 4:222
Austin, M. (2007). Species distribution models and ecological theory: a critical assessment and some possible new approaches. Ecol. Model. 200, 1–19 doi: 10.1016/j.ecolmodel.2006.07.005
Bates, A. E., Helmuth, B., Burrows, M. T., Duncan, M. I., Garrabou, J., Guy-Haim, T., et al. (2018). Biologists ignore ocean weather at their peril. Nature 560, 299–301. doi: 10.1038/d41586-018-05869-5
Bednaršek, N., Harvey, C. J., McCabe, R. M., Tolimieri, N., and Klinger, T. (2017). New Ocean, new needs: application of pteropod shell dissolution as a biological indicator for marine resource management. Ecol. Indic. 76, 240–244. doi: 10.1016/j.ecolind.2017.01.025
Benedetti-Cecchi, L., Crowe, T., Boehme, L., Boero, F., Christensen, A., Grémare, A., et al. (2018). “Strengthening Europe’s capability in biological ocean observations,” in Future Science Brief 3 of the European Marine Board, eds Á. Muñiz Piniella, P. Kellett, K. Larkin, and J. J. Heymans (Ostend: European Marine Board), 2593–5232.
Benson, A., Brooks, C. M., Canonico, G., Duffy, E., Muller-Karger, F., Sosik, H. M., et al. (2018). Integrated observations and informatics improve understanding of changing marine ecosystems. Front. Mar. Sci. 5:428. doi: 10.3389/fmars.2018.00428
Bierlich, K., Miller, C., DeForce, E., Friedlaender, A. S., Johnston, D. W., and Apprill, A. (2017). Temporal and regional variability in the skin microbiome of humpback whales along the Western Antarctic Peninsula. Appl. Environ. Microbiol. 84:e02574-17. doi: 10.1128/AEM.02574-17.
Biller, S. J., Berube, P. M., Dooley, K., Williams, M., Satinsky, B. M., Hackl, T., et al. (2018). Marine microbial metagenomes sampled across space and time. Sci. Data 5:180176. doi: 10.1038/sdata.2018.176.
Boetius, A., Anesio, A. M., Deming, J. W., Mikucki, J. A., and Rapp, J. Z. (2015). Microbial ecology of the cryosphere: sea ice and glacial habitats. Nat. Rev. Microbiol. 13, 677–690. doi: 10.1038/nrmicro3522.
Boss, E., Waite, A., Muller-Karger, F., Yamazaki, H., Wanninkhof, R., Uitz, J., et al. (2018). Beyond chlorophyll fluorescence: the time is right to expand biological measurements in ocean observing programs. Limnol. Oceanogr. Bull. 27, 89–90. doi: 10.1002/lob.10243
Bourne, D. G., Morrow, K. M., and Webster, N. S. (2016). Insights into the coral microbiome: underpinning the health and resilience of reef ecosystems. Annu. Rev. Microbiol. 70, 317–340. doi: 10.1146/annurev-micro-102215-095440
Brandt, A., Elsner, N. O., Malyutina, M. V., Brenke, N., Golovan, O. A., et al. (2015). Abyssal macrofauna of the Kuril–Kamchatka Trench area (Northwest Pacific) collected by means of a camera–epibenthic sledge. Deep Sea Res. Part II 111: 175–187. doi: 10.1016/j.dsr2.2014.11.002.
Brownlee, E. F., Olson, R. J., and Sosik, H. M. (2016). Microzooplankton community structure investigated with imaging flow cytometry and automated live-cell staining. Mar. Ecol. Prog. Ser. 550, 65–81. doi: 10.3354/meps11687
Butchart, S. H., Walpole, M., Collen, B., van Strien, A., Scharlemann, J. P., Almond, R. E., et al. (2010). Global biodiversity: indicators of recent declines. Science 328, 1164–1168. doi: 10.1126/science.1187512
Buttigieg, P. L., Fadeev, E., Bienhold, C., Hehemann, L., Offre, P., and Boetius, A. (2018). Marine microbes in 4D — using time series observation to assess the dynamics of the ocean microbiome and its links to ocean health. Curr. Opin. Microbiol. 43, 169–185. doi: 10.1016/j.mib.2018.01.015.
Castillo, K. D., and Lima, F. P. (2010). Comparison of in situ and satellite-derived (MODIS-Aqua/Terra) methods for assessing temperatures on coral reefs. Limnol. Oceanogr. Methods 8, 107–117. doi: 10.4319/lom.2010.8.0107
Charnley, S., Carothers, C., Satterfield, T., Levine, A., Poe, M. R., Norman, K., Donatuto, J., Breslow, S. J., et al. (2017). Evaluating the best available social science for natural resource management decision-making. Environ. Sci. Policy 73, 80–88. doi: 10.1016/j.envsci.2017.04.002
Chaudhary, C., Saeedi, H., and Costello, M. J. (2017). Marine species richness is bimodal with latitude: a reply to Fernandez and Marques. Trends Ecol. Evol. 32, 234–237. doi: 10.1016/j.tree.2017.02.007
Chavez, F. P., Ryan, J., lluch-Cota, S. E., and Ñiquen, C. M. (2003). From Anchovies to Sardines and Back: multidecadal change in the Pacific Ocean. Science 299, 217–221, doi: 10.1126/science.1075880
Cheng, Y., and Zhang, W. (2018). Concise deep reinforcement learning obstacle avoidance for underactuated unmanned marine vessels. Neurocomputing 272, 63–73. doi: 10.1016/j.neucom.2017.06.066
Cordier, T., Esling, P., Lejzerowicz, F., Visco, J., Ouadahi, A., Martins, C., et al. (2017). Predicting the ecological quality status of marine environments from eDNA metabarcoding data using supervised machine learning. Environ. Sci. Technol. 51, 9118–9126.
Cortés, J., Oxenford, H. A., van Tussenbroek, B. I., Jordán-Dahlgren, E., Cróquer, A., Bastidas, C., et al. (2019). The CARICOMP Network of Caribbean marine laboratories (1985–2007): history, key findings, and lessons learned. Front. Mar. Sci. 5:519. doi: 10.3389/fmars.2018.00519.
Cowen, R. K., and Guigand, C. M. (2008). In situ Ichthyoplankton Imaging System (ISIIS): system design and preliminary results. Limnol. Oceanogr. Methods. 6:126–132. doi: 10.4319/lom.2008.6.126
Cruz, M., Gabor, N., Mora, E., Jiménez, R., and Mair, J. (2003). The known and unknown about marine biodiversity in Ecuador (continental and insular). Gayana 67, 232–260.
Davies, N., Field, D., Amaral-Zettler, L., Clark, M. S., Deck, J., Drummond, A., et al. (2014). The founding charter of the genomic observatories network. Gigascience 3:2.
Davies, T., Maxwell, S., Kaschner, K., Garilao, C., and Ban, N. (2017). Large marine protected areas represent biodiversity now and under climate change. Nat. Sci. Rep. 7:9569. doi: 10.1038/s41598-017-08758-5.
De Pooter, D., Appeltans, W., Bailly, N., Bristol, S., Deneudt, K., Eliezer, M., et al. (2017). Toward a new data standard for combined marine biological and environmental datasets-expanding OBIS beyond species occurrences. Bio. Data J. 5:e10989. doi: 10.3897/BDJ.5.e10989
Deck, J., Gaither, M. R., Ewing, R., Bird, C. E., Davies, N., Meyer, C., et al. (2017). The genomic observatories metadatabase (GeOMe): a new repository for field and sampling event metadata associated with genetic samples. PLoS Biol. 15:e2002925. doi: 10.1371/journal.pbio.2002925.
Djurhuus, A., Pitz, K., Sawaya, N., Rojas-Márquez, J., Michaud, B., and Montes, E., et al. (2018). Evaluation of marine zooplankton community structure through environmental DNA metabarcoding. Limnol. Oceanogr. Methods 16, 209–221.
Djurhuus, A., Port, J., Closek, C. J., Yamahara, K. M., Romero-Maraccini, O., Walz, K. R., et al. (2017). Evaluation of filtration and DNA extraction methods for environmental DNA biodiversity assessments across multiple trophic levels. Front. Mar. Sci. 4:314
Dubilier, N., McFall-Ngai, M., and Zhao, L. (2015). Microbiology: create a global microbiome effort. Nature 526, 631–634. doi: 10.1038/526631a
Dugan, P. J., Clark, C. W., LeCun, Y. A., and Van Parijs, S. M. (2015). DCL System Using Deep Learning Approaches for Land-Based or Ship-Based Real Time Recognition and Localization of Marine Mammals. Bioacoustics Research Program, Cornell University Ithaca United States. Available at: http://www.dtic.mil/docs/citations/AD1014344 (accessed November 2018).
Escribano, R., Fernández, M., and Aranís, A. (2003). Physical-chemical processes and patterns of diversity of the Chilean eastern boundary pelagic and benthic marine ecosystems: an overview. Gayana 67, 190–205.
Fahner, N., McCarthy, A., Barnes, J., Singer, G., and Hajibabaei, M. (2018). Experimental design considerations for assessing marine biodiversity using environmental DNA. PeerJ. Prepr. 6:e26814v1.
Fedorov, D., Kvilekval, K., Doheny, B., Sampson, S., Miller, R., and Manjunath, B. S. (2017). Deep Learning for all: Managing and Analyzing Underwater and Remote Sensing Imagery on the web Using BisQue. Available at: https://escholarship.org/uc/item/9z73t7hv (accessed November 2018).
Fedorov, D., Manjunath, B. S., Lang, C. A., and Kvilekval, K. (2018). Chapter 9 - Scalable image informatics. in R. Chellappa and S. Theodoridis (Eds.), Academic Press Library in Signal Processing, Vol. 6 (347–364). Academic Press: Cambridge. doi: 10.1016/b978-0-12-811889-4.00009-9
Field, D., Amaral-Zettler, L., Cochrane, G., Cole, J. R., Dawyndt, P., Garrity, G. M., et al. (2011). The genomic standards consortium. PLoS Biol. 9:e1001088. doi: 10.1371/journal.pbio.1001088
Geller, G. N., Halpin, P. N., Helmuth, B., Hestir, E. L., Skidmore, A., and Abrams, M. J., et al. (2017). Remote sensing for biodiversity, in The GEO Handbook on Biodiversity Observation Networks, eds M. Walters and R. J. Scholes , Berlin: Springer.
Goodwin, K. D., Muller-Karger, F. E., Djurhuus, A., Zeigler Allen, L., Allen, A. E., McCrow, J. P., et al. (2019). “Molecular approaches for an operational marine biodiversity observation network,” in World Seas: an Environmental Evaluation, ed. C. Sheppard (Amsterdam: Elsevier), 613–631. doi: 10.1016/b978-0-12-805052-1.00032-2
Goodwin, K. D., Thompson, L. R., Duarte, B., Kahlke, T., Thompson, A. R., Marques, J. C., et al. (2017). DNA Sequencing as a tool to monitor marine ecological status. Front. Mar. Sci. 4, 1–14. doi: 10.3389/fmars.2017.00107.
Guirado, E., Tabik, S., Rivas, M. L., Alcaraz-Segura, D., and Herrera, F. (2018). Automatic whale counting in satellite images with deep learning. BioRxiv. doi: 10.1101/443671
Göröcs, Z., Tamamitsu, M., Bianco, V., Wolf, P., Roy, S., Shindo, K., et al. (2018). A deep learning-enabled portable imaging flow cytometer for cost-effective, high-throughput, and label-free analysis of natural water samples. Light Sci. Appl. 7:66. doi: 10.1038/s41377-018-0067-0
Hamaguchi, M., Shimabukuro, H., Hori, M., Yoshida, G., Terada, T., and Miyajima, T. (2018). Quantitative real-time polymerase chain reaction (PCR) and droplet digital PCR duplex assays for detecting Zostera marina DNA in coastal sediments. Limnol. Oceanogr. Methods 16, 253–264. doi: 10.1002/lom3.10242
Harris, P. T., Macmillan-Lawler, M., Rupp, J., and Baker, E. K. (2014). Geomorphology of the oceans. Mar. Geol. 352, 4–24. doi: 10.1016/j.margeo.2014.01.011
Hazen, R. M., and Bromberg, Y. (2018). 4D Workshop: Deep-time Data Driven Discovery and the Evolution of Earth. Washington, DC: Carnegie Institution of Science.
Helmuth, B. (2009). From cells to coastlines: how can we use physiology to forecast the impacts of climate change? J. Exp. Biol. 212, 753–760. doi: 10.1242/jeb.023861
Helmuth, B. S., Harley, C. D. G., Halpin, P., O’Donnell, M., Hofmann, G. E., and Blanchette, C. (2002). Climate change and latitudinal patterns of intertidal thermal stress. Science 298:1015–1017 doi: 10.1126/science.1076814
Hofmann, G. E., Smith, J. E., Johnson, K. S., Send, U., Levin, L. A., and Micheli, F., et al. (2011). High-frequency dynamics of ocean pH: a multi-ecosystem approach. PLoS One 6:e28983. doi: 10.1371/journal.pone.0028983
Hui, C., Foxcroft, L. C., Richardson, D. M., and MacFadyen, S. (2011). Defining optimal sampling effort for large-scale monitoring of invasive alien plants: a Bayesian method for estimating abundance and distribution. J. Appl. Ecol 48, 768–776. doi: 10.1111/j.1365-2664.2011.01974.x
Hunter-Cevera, K. R., Neubert, M. G., Olson, R. J., Solow, A. R., Shalapyonok, A., Sosik, H. M., et al. (2016). Physiological and ecological drivers of early spring blooms of a coastal phytoplankter. Science 354, 326–329. doi: 10.1126/science.aaf8536
Karl, D. M., and Church, M. J. (2014). Microbial oceanography and the hawaii ocean time-series programme. Nat. Rev. Microbiol. 12, 699–713. doi: 10.1038/nrmicro3333
Karsenti, E., Acinas, S. G., Bork, P., Bowler, C., De Vargas, C., Raes, J., et al. (2011). A holistic approach to marine eco-systems biology. PLoS Biol. 9:e1001177. doi: 10.1371/journal.pbio.1001177
Kaschner, K., Kesner-Reyes, K., Garilao, C., Rius-Barile, J., Rees, T., and Froese, R. (2016). AquaMaps: Predicted Range Maps for Aquatic Species. World Wide Web Electronic Publication. Available at: www.aquamaps.org, Version 08/2016 (accessed November 2018).
Kavanaugh, M., Iken, K., Grebmeier, J., Otis, D., Muller-Karger, F., Montes, E., et al. (2018). “Monitoring and predicting Arctic marine biodiversity across dynamic seascapes,” in Proceedings of The 4th World Conference on Marine Biodiversity, Montreal 13–16.
Kopf, A., Bicak, M., Kottmann, R., Schnetzer, J., Kostadinov, I., Lehmann, K., et al. (2015). The ocean sampling day consortium. Gigascience 4:27. doi: 10.1186/s13742-015-0066-5
Kroeker, K. J., Sanford, E., Rose, J. M., Blanchette, C. A., Chan, F., Chavez, F. P., et al. (2016). Interacting environmental mosaics drive geographic variation in mussel performance and species interactions. Ecol. Lett. 19, 771–779. doi: 10.1111/ele.12613
Leichter, J. J., Helmuth, B., and Fischer, A. M. (2006). Variation beneath the surface: quantifying complex thermal environments on coral reefs in the Caribbean, Bahamas and Florida. J. Mar. Res. 64, 563–588. doi: 10.1357/002224006778715711
Levin, P., and Poe, M. (2017). Conservation for the Anthropocene Ocean: Interdisciplinary Science in Support of Nature and People. Cambridge: Academic Press, 530.
Lindstrom, E., Gunn, J., Fischer, A., McCurdy, A., and Glover, L. K. (2012). A Framework for Ocean Observing. By the Task Team for an Integrated Framework for Sustained Ocean Observing. Paris: UNESCO
Lombard, F., Boss, E., Waite, A. M., Vogt, M., Uitz, J., Stemmann, L., et al. (2019). Globally consistent quantitative observations of planktonic ecosystems. Front. Mar. Sci. 6:196. doi: 10.3389/fmars.2019.00196
Marini, S., Fanelli, E., Sbragaglia, V., Azzurro, E., Fernandez, J. D. R., and Aguzzi, J. (2018). Tracking fish abundance by underwater image recognition. Sci. Rep. 8:13748. doi: 10.1038/s41598-018-32089-8
McQuay, C., Sattar, F., and Driessen, P. F. (2017). “Deep learning for hydrophone big data,” in Proceedings of the 2017 IEEE Pacific Rim Conference on Communications, Computers and Signal Processing (PACRIM), Victoria, BC.
Miloslavich, P., Bax, N. J., Simmons, S. E., Klein, E., Appeltans, W., Aburto-Oropeza, O., et al. (2018a). Essential ocean variables for global sustained observations of biodiversity and ecosystem changes. Glob. Chang Biol. 24, 2416–2433. doi: 10.1111/gcb.14108
Miloslavich, P., Seeyave, S., Ali, E., Bax, N., Delgado, C., Evers-King, H., et al. (2018b). Challenges for global ocean observation: the need for increased human capacity. J. Oper. Oceanogr. 1–12. doi: 10.1080/1755876X.2018.1526463
Miloslavich, P., Cruz-Motta, J. J., Hernandez, A., Herrera, C. A., Klein, E., Barros, F., et al. (2016) “Benthic assemblages in South American intertidal rocky shores: biodiversity, services, and threats,” in Marine Benthos: Biology, Ecosystem Functions and Environmental Impact Ed, R. R. Rodríguez (Hauppauge, NY: Nova Science Publishers).
Miloslavich, P., Klein, E., Díaz, J. M., Hernández, C. E., Bigatti, G., Campos, L., et al. (2011). Marine biodiversity in the atlantic and pacific coasts of south america: knowledge and gaps. PLoS One 6:e14631. doi: 10.1371/journal.pone.0014631
Mislan, K. A. S., and Wethey, D. S. (2011). Gridded meteorological data as a resource for mechanistic macroecology in coastal environments. Ecol. Appl. 21, 2678–2690. doi: 10.1890/10-2049.1
Muller-Karger, F. E., Astor, Y. M., Benitez-Nelson, C. R., Buck, K. N., Fanning, K. A., Lorenzoni, L., et al. (2019). The scientific legacy of the CARIACO ocean time-series program. Ann. Rev. Mar. Sci. 11, 413–427.
Muller-Karger, F. E., Kavanaugh, M. T., Montes, E., Balch, W. M., Breitbart, M., Chavez, F. P., et al. (2014). A framework for a marine biodiversity observing network within changing continental shelf seascapes. Oceanography 27, 18–23. doi: 10.5670/oceanog.2014.56
Muller-Karger, F E., Hestir, E., Ade, C., Turpie, K., Roberts, D., Siegel, D., et al. (2018a). Satellite sensor requirements for monitoring essential biodiversity variables of coastal ecosystems. Ecol. Appl. 28, 749–760.
Muller-Karger, F. E., Miloslavich, P., Bax, N., Simmons, S., Costello, M. J., Pinto, I. S., et al. (2018b). Advancing marine biological observations and data requirements of the complementary essential ocean variables (EOVs) and essential biodiversity variables (EBVs) frameworks. Front. Mar. Sci. 5:211. doi: 10.3389/fmars.2018.00211
Neiva, J., Serrão, E. A., Anderson, L., Raimondi, P. T., Martins, N., Gouveia, L., et al. (2017). Cryptic diversity, geographical endemism and allopolyploidy in NE Pacific seaweeds. BMC Evol. Biol. 17:30. doi: 10.1186/s12862-017-0878-2
Nilsson, R. H., Larsson, K. -H., Taylor, A. F. S., Bengtsson-Palme, J., Jeppesen, T. S., Schigel, D., et al. (2018). The UNITE database for molecular identification of fungi: handling dark taxa and parallel taxonomic classifications. Nucleic Acids Res. 47, D259–D264. doi: 10.1093/nar/gky1022
Österblom, H., Crona, B. I., Folke, C., Nyström, M., and Troell, M. (2017). Marine ecosystem science on an intertwined planet. Ecosystems 20, 54–61. doi: 10.1007/s10021-016-9998-6
Pacifici, M., Foden, W. B., Visconti, P., Watson, J. F. M., Butchart, S. H. M., Kovacs, K. M., et al. (2015). Assessing species vulnerability to climate change. Nat. Clim. Change 5, 215–225.
Pandya, R. E., and Dibner, K. A. (2018). Learning Through Citizen Science: Enhancing Opportunities by Design. Washington, DC: National Academies Press.
Pawlowski, J., Kelly-Quinn, M., Altermatt, F., Apothéloz-Perret-Gentil, L., Beja, P., Boggero, A., et al. (2018). The future of biotic indices in the ecogenomic era: integrating (e)DNA metabarcoding in biological assessment of aquatic ecosystems. Sci. Total Environ. 637–638, 1295–1310. doi: 10.1016/j.scitotenv.2018.05.002
Pearlman, J., Buttigieg, P. L., Simpson, P., Heslop, E. E., Munoz, C., Bushnell, M., et al. (2018). “Accessing Existing and Emerging Best Practices for Ocean Observation, a new approach for end-to-end management of Best Practices,” in Proceedings of the Oceans’17, Anchorage: Conference, MTS/IEEE. (Anchorage: IEEE).
Pereira, H. M., Ferrier, S., Walters, M., Geller, G. N., Jongman, R. H. G., Scholes, R. J., et al. (2013). Essential biodiversity variables. Science 339. 277–278.
Pesant, S., Grigorov, I., Malfatti, F., Magalhães, C., Vezzi, A., Poulain, J., et al. (2017). EMOSE (2017) Inter-Comparison of Marine Plankton Metagenomic Analysis Methods. Peoria, IL: OSF.
Picheral, M., Guidi, L., Stemmann, L., Karl, D. M., Iddaoud, G., and Gorsky, G. (2010). The underwater vision profiler 5: an advanced instrument for high spatial resolution studies of particle size spectra and zooplankton. Limnol. Oceanogr. Methods 8, 462–473. doi: 10.4319/lom.2010.8.462
Pimm, S. L., Alibhai, S., Bergl, R., Dehgan, A., Giri, C., Jewell, Z., et al. (2015). Emerging technologies to conserve biodiversity. Trends Ecol. Evol. 30, 685–696. doi: 10.1016/j.tree.2015.08.008
Qin, H., Li, X., Yang, Z., and Shang, M. (2015). “When underwater imagery analysis meets deep learning: A solution at the age of big visual data,” in Proceedings of the OCEANS 2015 - MTS/IEEE Washington, Washington, DC.
Rahimi, A. M., Miller, R. J., Fedorov, D. V., Sunderrajan, S., Doheny, B. M., Page, H. M., et al. (2014). “Marine Biodiversity Classification Using Dropout Regularization,” in Proceedings of the 2014 ICPR Workshop on Computer Vision for Analysis of Underwater Imagery, Tockholm.
Rahmstorf, S., Box, J. E., Feulner, G., Mann, M. E., Robinson, A., Rutherford, S., et al. (2015). Exceptional twentieth-century slowdown in Atlantic Ocean overturning circulation. Nat. Clim. Change 5, 475–480. doi: 10.1038/nclimate2554
Rice, J., Gjerde, K. M., Ardron, J., Arico, S., Cresswell, I., Escobar, E., et al. (2011). Policy relevance of biogeographic classification for conservation and management of marine biodiversity beyond national jurisdiction, and the GOODS biogeographic classification. Ocean Coast. Manag. 54, 110–122. doi: 10.1016/j.ocecoaman.2010.10.010
Rossi, R. E. (2017). Using inaturalist observations to detect disease in red mangroves (Rhizophora mangle). PeerJ 5:e3326v1
Rougier, T., Lassalle, G., Drouineau, H., Dumoulin, N., Faure, T., Deffuant, G., et al. (2015). The combined use of correlative and mechanistic species distribution models benefits low conservation status species. PLoS One 10:e0139194. doi: 10.1371/journal.pone.0139194
Rusch, D. B., Halpern, A. L., Sutton, G., Heidelberg, K. B., Williamson, S., Yooseph, S., et al. (2007). The sorcerer II global ocean sampling expedition: northwest atlantic through eastern tropical pacific. PLoS Biol. 5, 398–431.
Sayre, R. G., Wright, D. J., Breyer, S. P., Butler, K. A., Van Graafeiland, K., Costello, M. J., et al. (2017). A three-dimensional mapping of the ocean based on environmental data. Oceanography 30, 90–103. doi: 10.5670/oceanog.2017.116
Schnetzer, J., Kopf, A., Bietz, M. J., Buttigieg, P. L., Fernandez-Guerra, A., Ristov, A. P., et al. (2016). MyOSD 2014: evaluating oceanographic measurements contributed by citizen scientists in support of ocean sampling day. J. Microbiol. Biol. Educ. 17, 163–171. doi: 10.1128/jmbe.v17i1.1001
Singer, A., Johst, K., Banitz, T., Fowler, M. S., Groeneveld, J., Gutiérrez, A. G., et al. (2016). Community dynamics under environmental change: how can next generation mechanistic models improve projections of species distributions? Ecol. Model. 326, 63–74. doi: 10.1016/j.ecolmodel.2015.11.007
Smale, D. A., and Wernberg, T. (2009). Satellite-derived SST data as a proxy for water temperature in nearshore benthic ecology. Mar. Ecol. Prog. Ser. 387, 27–37. doi: 10.3354/meps08132
Soltwedel, T., Schauer, U., Boebel, O., Nothig, E. M., Bracher, A., Metfies, K., et al. (2013). “FRAM - FRontiers in Arctic marine Monitoring Visions for permanent observations in a gateway to the Arctic Ocean,” in Proceedings of the OCEANS 2013 MTS/IEEE: The Challenges of the Northern Dimension, Bergen.
Spalding, M. D., Fox, H. E., Allen, G. R., Davidson, N., Ferdana, Z. A., Finlayson, M., et al. (2007). Marine ecoregions of the world: a bioregionalization of coastal and shelf areas. BioScience 57, 573–583. doi: 10.1641/b570707
Stat, M., Huggett, M. J., Bernasconi, R., DiBattista, J. D., Berry, T. E., Newman, S. J., et al. (2017). Ecosystem biomonitoring with eDNA: metabarcoding across the tree of life in a tropical marine environment. Sci. Rep. 7:12240. doi: 10.1038/s41598-017-12501-5
Stat, M., John, J., DiBattista, J. D., Newman, S. J., Bunce, M., and Harvey, E. S. (2018). Combined use of eDNA metabarcoding and video surveillance for the assessment of fish biodiversity. Conserv. Biol. 33, 196–205. doi: 10.1111/cobi.13183
Staudinger, M. D., Carter, S. L., Cross, M. S., Dubois, N. S., Duffy, J. E., Enquist, C. A. F., et al. (2013). Biodiversity in a changing climate: a synthesis of current and projected trends in the US. Front. Ecol. Environ. 11, 465–473. doi: 10.1890/120272
Steinberg, D. K., Carlson, C. A., Bates, N. R., Johnson, R. J., Michaels, A. F., and Knap, A. H. (2001). Overview of the US JGOFS bermuda atlantic time-series study (BATS): a decade-scale look at ocean biology and biogeochemistry. Deep Sea Res. Part II Top. Stud. Oceanogr. 48, 1405–1447. doi: 10.1016/S0967-0645(00)00148-X
Stuart-Smith, R. D., Brown, C. J., Ceccarelli, D. M., and Edgar, G. J. (2018). Ecosystem restructuring along the great barrier reef following mass coral bleaching. Nature 560, 92–96. doi: 10.1038/s41586-018-0359-9
Stuart-Smith, R. D., Edgar, G. J., Barrett, N. S., Bates, A. E., Baker, S. C., Bax, N. J., et al. (2017). Assessing national biodiversity trends for rocky and coral reefs through the integration of citizen science and scientific monitoring programs. Bioscience 67, 134–146. doi: 10.1093/biosci/biw180
Sunagawa, S., Coelho, L. P., Chaffron, S., Kultima, J. R., Labadie, K., Salazar, G., et al. (2015). Structure and function of the global ocean microbiome. Science 348, 1261359–1261359. doi: 10.1126/science.1261359
Sung, M., Yu, S., and Girdhar, Y. (2017). “Vision based real-time fish detection using convolutional neural network,” in Proceedings of the OCEANS 2017 - Aberdeen, Aberdeen.
Thompson, L. R., Sanders, J. G., McDonald, D., Amir, A., Ladau, J., Locey, K. J., et al. (2017). A communal catalogue reveals Earth’s multiscale microbial diversity. Nature 551, 457–463. doi: 10.1038/nature24621
Thurstan, R. H., McClenachan, L., Crowder, L. B., Drew, J., AKittinger, J. N., Levin, P. S., et al. (2015). Filling historical data gaps to foster solutions in marine conservation. Ocean Coast. Manag. 115, 31–40. doi: 10.1016/j.ocecoaman.2015.04.019
UNESCO (2009). Global Open Oceans and Deep Seabed (GOODS) - Biogeographic Classification. IOC Technical Series 84. Paris: UNESCO.
UNESCO (2018). Update on IOC Custodianship Role in Relation to SDG 14 Indicators. IOC/EC-LI/2 Annex 6. Paris: UNESCO.
Watling, L., Guinotte, J., Clark, M. R., and Smith, C. R. (2013). A proposed biogeography of the deep ocean floor. Prog. Oceanogr. 111, 91–112. doi: 10.1016/j.pocean.2012.11.003
Wilkinson, M. D., Dumontier, M., Aalbersberg, I. J., Appleton, G., Axton, M., Baak, A., et al. (2016). The FAIR guiding principles for scientific data management and stewardship. Sci. Data 3:160018. doi: 10.1038/sdata.2016.18
Woodin, S. A., Hilbish, T. J., Helmuth, B., Jones, S. J., and Wethey, D. S. (2013). Climate change, species distribution models, and physiological performance metrics: predicting when biogeographic models are likely to fail. Ecol. Evol. 3, 3334–3346.
World Economic Forum (2018). Harnessing Artificial Intelligence for the Earth. Fourth Industrial Revolution for the Earth Series. Available at: http://www3.weforum.org/docs/Harnessing_Artificial_Intelligence_for_the_Earth_report_2018.pdf (accessed November 2018).
Wright, D. J. (2016). Toward a digital resilience. Elem. Sci. Anth. 4:000082. doi: 10.12952/journal.elementa.000082
Wright, D. J., Sayre, R., Breyer, S., Butler, K. A., and Van Graafeiland, K. (2016). 52 Million Points and Counting: A New Stratification Approach for Mapping Global Marine Ecosystems. Eos, Transactions American Geophysical Union. San Francisco, CA: American Geophysical Union.
Wright, S., Hull, T., Sivyer, D. B., Pearce, D., Pinnegar, J. K., Sayer, M. D. J., et al. (2016). SCUBA divers as oceanographic samplers: the potential of dive computers to augment aquatic temperature monitoring. Sci. Rep. 6:30164. doi: 10.1038/srep30164
Zardi, G. I., Nicastro, K. R., Serrão, E. A., Jacinto, R., Monteiro, C. A., and Pearson, G. A. (2015). Closer to the rear edge: ecology and genetic diversity down the core-edgegradient of a marine macroalga. Ecosphere 6, 1–25.
Keywords: biodiversity, ecosystem health, habitat suitability indices, indicators, thresholds, essential ocean variables, essential biodiversity variables, omics
Citation: Canonico G, Buttigieg PL, Montes E, Muller-Karger FE, Stepien C, Wright D, Benson A, Helmuth B, Costello M, Sousa-Pinto I, Saeedi H, Newton J, Appeltans W, Bednaršek N, Bodrossy L, Best BD, Brandt A, Goodwin KD, Iken K, Marques AC, Miloslavich P, Ostrowski M, Turner W, Achterberg EP, Barry T, Defeo O, Bigatti G, Henry L-A, Ramiro-Sánchez B, Durán P, Morato T, Roberts JM, García-Alegre A, Cuadrado MS and Murton B (2019) Global Observational Needs and Resources for Marine Biodiversity. Front. Mar. Sci. 6:367. doi: 10.3389/fmars.2019.00367
Received: 14 November 2018; Accepted: 13 June 2019;
Published: 23 July 2019.
Edited by:
Sabrina Speich, École Normale Supérieure, FranceReviewed by:
Catherine Sarah Longo, Marine Stewardship Council (MSC), United KingdomHervé Claustre, Centre National de la Recherche Scientifique (CNRS), France
Copyright © 2019 Canonico, Buttigieg, Montes, Muller-Karger, Stepien, Wright, Benson, Helmuth, Costello, Sousa-Pinto, Saeedi, Newton, Appeltans, Bednaršek, Bodrossy, Best, Brandt, Goodwin, Iken, Marques, Miloslavich, Ostrowski, Turner, Achterberg, Barry, Defeo, Bigatti, Henry, Ramiro-Sánchez, Durán, Morato, Roberts, García-Alegre, Cuadrado and Murton. This is an open-access article distributed under the terms of the Creative Commons Attribution License (CC BY). The use, distribution or reproduction in other forums is permitted, provided the original author(s) and the copyright owner(s) are credited and that the original publication in this journal is cited, in accordance with accepted academic practice. No use, distribution or reproduction is permitted which does not comply with these terms.
*Correspondence: Gabrielle Canonico, Z2FicmllbGxlLmNhbm9uaWNvQG5vYWEuZ292