 Anne G. O’Carroll1*
 Edward M. Armstrong2
 Helen M. Beggs3
 Marouan Bouali4
 Kenneth S. Casey5
 Gary K. Corlett1
 Prasanjit Dash6
 Craig J. Donlon7
 Chelle L. Gentemann8
 Jacob L. Høyer9
 Alexander Ignatov6
 Kamila Kabobah10
 Misako Kachi11
 Yukio Kurihara11
 Ioanna Karagali12
 Eileen Maturi6
 Christopher J. Merchant13
 Salvatore Marullo14
 Peter J. Minnett15
 Matthew Pennybacker6Balaji Ramakrishnan16
 RAAJ Ramsankaran16
 Rosalia Santoleri15
 Swathy Sunder16
 Stéphane Saux Picart17
 Jorge Vázquez-Cuervo2
 Werenfrid Wimmer18
- 1EUMETSAT, Darmstadt, Germany
- 2NASA Jet Propulsion Laboratory/California Institute of Technology, Pasadena, CA, United States
- 3Bureau of Meteorology, Melbourne, VIC, Australia
- 4Institute of Oceanography, Universidade de São Paulo, São Paulo, Brazil
- 5NOAA NCEI, Silver Spring, MD, United States
- 6NOAA STAR, College Park, MD, United States
- 7ESA ESTEC, Noordwijk, Netherlands
- 8Earth & Space Research, Seattle, WA, United States
- 9Danish Meteorological Institute, Copenhagen, Denmark
- 10Earth Observation Research and Innovation Centre, University of Energy and Natural Resource, Sunyani, Ghana
- 11Earth Observation Research Center, Japan Aerospace Exploration Agency, Chofu, Japan
- 12Department of Wind Energy, Technical University of Denmark, Roskilde, Denmark
- 13Department of Meteorology, University of Reading, Reading, United Kingdom
- 14ENEA, ISAC-CNR, Frascati, Italy
- 15Rosenstiel School of Marine and Atmospheric Science, University of Miami, Miami, FL, United States
- 16Department of Civil Engineering, Indian Institute of Technology Bombay, Mumbai, India
- 17CNRM, Université de Toulouse, Météo-France, CNRS, Lannion, France
- 18Ocean and Earth Science, University of Southampton, Southampton, United Kingdom
Sea surface temperature (SST) is a fundamental physical variable for understanding, quantifying and predicting complex interactions between the ocean and the atmosphere. Such processes determine how heat from the sun is redistributed across the global oceans, directly impacting large- and small-scale weather and climate patterns. The provision of daily maps of global SST for operational systems, climate modeling and the broader scientific community is now a mature and sustained service coordinated by the Group for High Resolution Sea Surface Temperature (GHRSST) and the CEOS SST Virtual Constellation (CEOS SST-VC). Data streams are shared, indexed, processed, quality controlled, analyzed, and documented within a Regional/Global Task Sharing (R/GTS) framework, which is implemented internationally in a distributed manner. Products rely on a combination of low-Earth orbit infrared and microwave satellite imagery, geostationary orbit infrared satellite imagery, and in situ data from moored and drifting buoys, Argo floats, and a suite of independent, fully characterized and traceable in situ measurements for product validation (Fiducial Reference Measurements, FRM). Research and development continues to tackle problems such as instrument calibration, algorithm development, diurnal variability, derivation of high-quality skin and depth temperatures, and areas of specific interest such as the high latitudes and coastal areas. In this white paper, we review progress versus the challenges we set out 10 years ago in a previous paper, highlight remaining and new research and development challenges for the next 10 years (such as the need for sustained continuity of passive microwave SST using a 6.9 GHz channel), and conclude with needs to achieve an integrated global high-resolution SST observing system, with focus on satellite observations exploited in conjunction with in situ SSTs. The paper directly relates to the theme of Data Information Systems and also contributes to Ocean Observing Governance and Ocean Technology and Networks within the OceanObs2019 objectives. Applications of SST contribute to all the seven societal benefits, covering Discovery; Ecosystem Health & Biodiversity; Climate Variability & Change; Water, Food, & Energy Security; Pollution & Human Health; Hazards and Maritime Safety; and the Blue Economy.
Introduction
Sea surface temperature (SST) is a fundamental variable for understanding, monitoring and predicting fluxes of heat, momentum and gases at a variety of scales that determine complex interactions between the atmosphere and ocean. SST at the ocean-atmosphere interface has a significant societal impact, through, e.g., large ocean gyres and atmospheric circulation cells influencing weather and climate, weather systems and severe storms and local scale phenomena, such as the generation of sea breezes and convective clouds.
Mapping SST is now the responsibility of operational monitoring and forecasting agencies (Robinson et al., 2012) as accurate knowledge of global SST distribution and temporal variation is a key input to forecasting and prediction systems. SST fields constrain upper-ocean circulation and thermal structure on daily, seasonal, decadal and climatic timescales, for the exchange of energy between the ocean and atmosphere in coupled ocean-atmosphere models, and as boundary conditions for ocean, weather and seasonal forecasting models. Other applications include maritime safety, military operations, ecosystem assessment, supporting fisheries and tourism, transport and energy, human health, food security and environmental policy. Well-defined and error-quantified measurements of SST are also required in the form of climate data records (CDRs) to reveal the role of the ocean in short and long term climate variability.
A sustained operational stream of satellite SST measurements has been available since 1981, which together with in situ measurements collectively form the modern-era SST observing system. By 1998, SST data were a mature component of the observing system with demonstrated capability and data products. However, SST product availability was limited to a few data sets that were large, scientific in format and difficult to exchange in near real time (NRT). Furthermore, product accuracy was insufficient for the emerging ocean modeling and data assimilation communities, while at the same time the number of applications requiring accurate spatial high-resolution SST was growing.
To address these issues, the Global Ocean Data Assimilation Experiment (GODAE; Bell et al., 2009) defined a minimum data specification for use in operational ocean models, requiring SST observations with global coverage, a spatial resolution of 10 km or higher, an accuracy of 0.2°C or better, and updated every 6 h (Smith and Koblinsky, 2001). The establishment of the Group for High Resolution Sea Surface Temperature, GHRSST (previously, GODAE High-Resolution Sea Surface Temperature Pilot Project) addressed these specifications (Donlon et al., 2009). GHRSST is a self-organizing group of researchers and operational practitioners working together to improve the accuracy and availability of SST fields for all applications.
To achieve the GODAE requirement, GHRSST devised an integrated approach to develop an SST observing system comprising: (1) improved SST data assembly/delivery; (2) quantified SST product accuracy; (3) improved consistency of SST products; and (4) demonstrated benefits for the improved observing system. Over the past 10 years, GHRSST has continued to support the delivery of operational SST data to the user community1 and confirmed that the requirements of GODAE can be met (with the exception of accuracy). Much progress has been made on the inter-comparison of SST products, through activities such as the SST Quality Monitor (SQUAM2; Dash et al., 2010), in situ SST quality monitor (iQuam3; Xu and Ignatov, 2014), ACSPO Regional Monitor for SST (ARMS4) and Felyx5. Progress has been also made on SST applications, including assimilation and demonstrating the benefit of the improved observing system. Many users now assimilate SST in the global and regional models to provide continuous data and information on the physical state, variability and dynamics of the global ocean and marine ecosystems.
This paper focuses mainly on the progress and challenges for satellite SSTs over the past decade and continuing into the next decade. Fiducial Reference Measurements (FRM) and in situ data are described with respect to satellite validation activities and ensuring traceability for climate records. Centurioni et al. (2019), Kent et al. (2019), and Smith et al. (2019) address these surface-based observations in more detail. We conclude with a community-consensus vision for the next decade and beyond as a set of recommendations.
SST’s Role in an Integrated Ocean Observing System
Understanding oceanic and atmospheric processes requires knowledge of the temperature at which these processes occur. Processes at the ocean surface include radiative emission peaking in the infrared (IR), solubility of gasses (including CO2 and therefore ocean-atmosphere gas fluxes), evaporation (the latent heat flux), and sensible heat flux associated with the air–sea temperature difference (which also influences the momentum fluxes from atmosphere to ocean). The atmospheric and oceanic vertical temperature profile near the air–sea interface affect the stability and effectiveness of turbulent exchanges, and thus they influence the magnitudes of air–sea fluxes (Lindzen and Nigam, 1987; Fairall et al., 2003; Kara et al., 2005). Profiles of temperature throughout the ocean depth have indicated a warming of the oceans over the past six decades, the period for which such measurements are available (Levitus et al., 2012).
Satellite remote sensing has provided a mechanism for deriving SST on global scales over decades and needs to be sustained, improved, reconciled and extended into the next decade and beyond. The uninterrupted time-series of global, high resolution (∼4–10 km) SSTs retrieved from satellite IR radiometers extends back to the early 1980s (Kilpatrick et al., 2001), and SSTs from passive microwave (PMW) radiometers back to late 1997 in the tropics, and 2002 globally. In the framework of an integrated ocean observing system, satellite-derived SST fields provide information on upper ocean variability and processes (e.g., Legeckis, 1977; Cornillon, 1986; Gentemann et al., 2008; Liu and Minnett, 2015) and on air–sea interactions (e.g., Chelton et al., 2001; O’Neill et al., 2012). The current constellation of satellites produces global measurements of SST at accuracies useful for many scientific, operational and climate purposes.
The SST Measurement Constellation
Measurements of SST are made in situ with contact thermometers and retrieved from IR and PMW radiometers on satellites (for example, see Walton et al., 1998; Merchant et al., 2009b; Gentemann et al., 2010; Koner and Harris, 2016). IR- and PMW-derived SSTs have different and complementary characteristics. IR emission at the ocean surface originates in a very thin electromagnetic skin layer of <0.1 mm thickness, whereas PMW emission comes from an electromagnetic skin layer which is several millimeters thick. The SST as derived from IR radiometers is cooler than the water beneath, on average, by ∼0.17 K, but can be several tenths of a degree cooler at low wind speeds (Donlon et al., 2002; Minnett et al., 2011). The spatial resolution of IR-derived SSTs from modern satellite instruments is typically 1–4 km at nadir, whereas the resolution of microwave (MW)-derived SSTs is typically 50–75 km. PMW SSTs are not normally derived within ∼100 km of land or ice. A major advantage of PMW-derived SSTs over those from the IR is that the propagation of MW radiation at 6–10 GHz which is largely insensitive to the presence of clouds, except where there is heavy rainfall. In contrast, satellite IR measurements are strongly influenced by scattering and emission from clouds, with the consequence that only measurements taken through clear atmospheres can be used to derive SSTskin. Effective “cloud-screening” algorithms are needed to ensure derived SSTskin values are not tainted (Kilpatrick et al., 2001; Merchant et al., 2005). Merging SST retrievals from IR and MW sensors together with in situ data on any given day is a widely accepted approach to derive global fields (e.g., Chin et al., 2017).
An Increasing Number and Diversity of Satellite Observations
Since satellite SST observations began in the early 1980s, the number and diversity of sensors has increased dramatically, and is ever evolving. A combination of IR (onboard both low-Earth orbiters, LEO, and geostationary, GEO, platforms) and PMW (LEO only) radiometers provide a comprehensive global SST constellation, capable of meeting users’ needs across a wide range of scales by exploiting their different capabilities and strengths. Figure 1 indicates the main satellite missions contributing to the current and recent SST constellation. Continuity and redundancy is ensured primarily by meteorological agencies’ space programs, as well as initiatives such as Copernicus. It is vital to continue innovation to improve the resolution and accuracy of the SST fields. Table 1 lists the satellite SST measurement constellation at the present time, noting that further changes and developments are taking place to the constellation over the next decade and are summarized in the following sections.
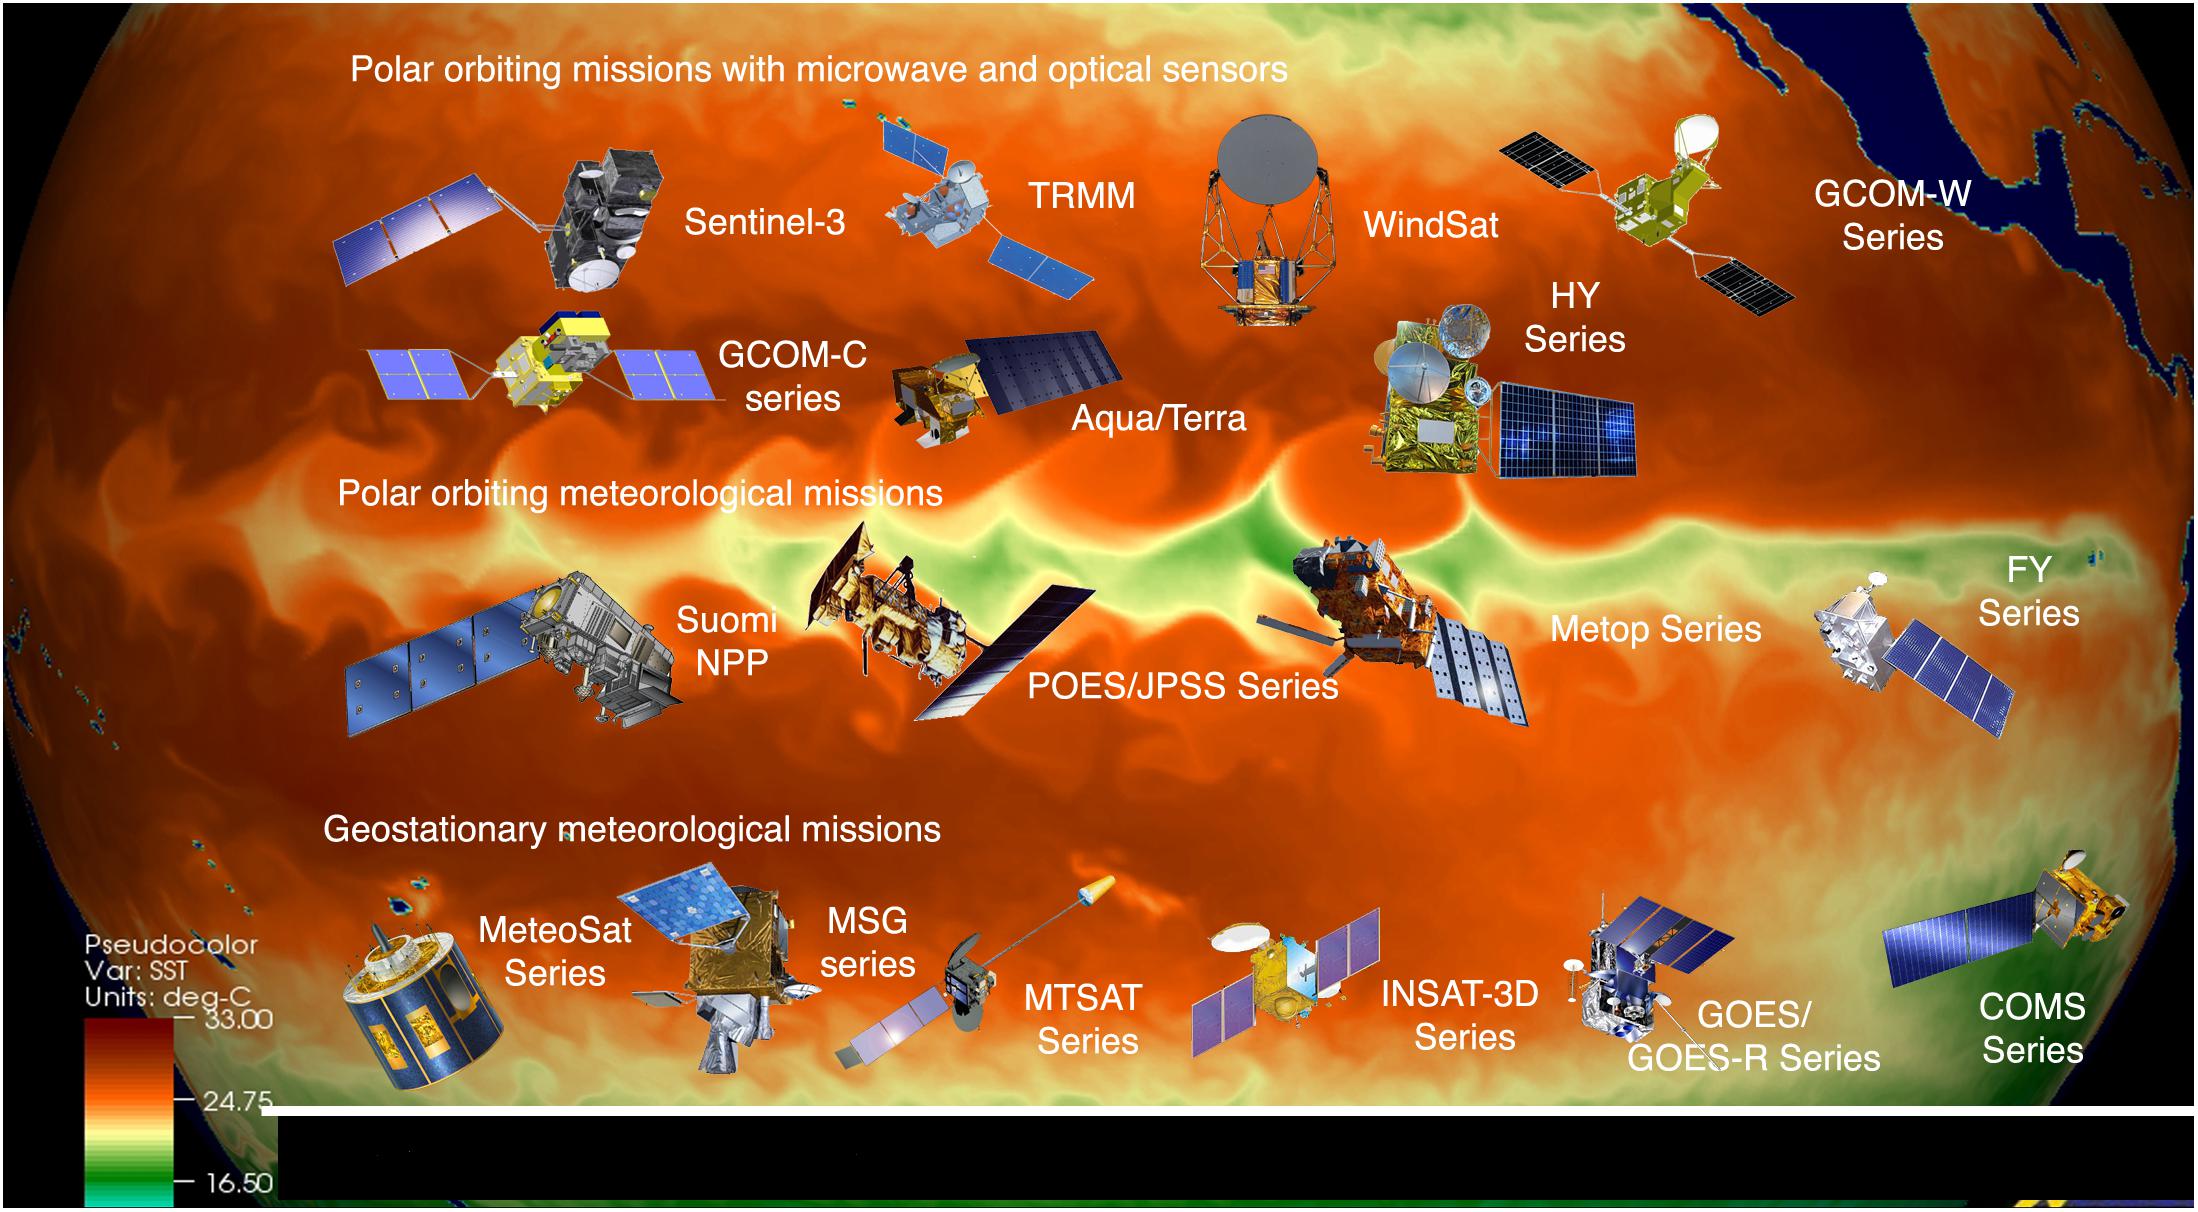
Figure 1. The main satellite missions contributing to the current SST constellation. (Reproduced by permission under CC BY 4.0 from http://doi.org/10.6084/m9. figshare.7291694.
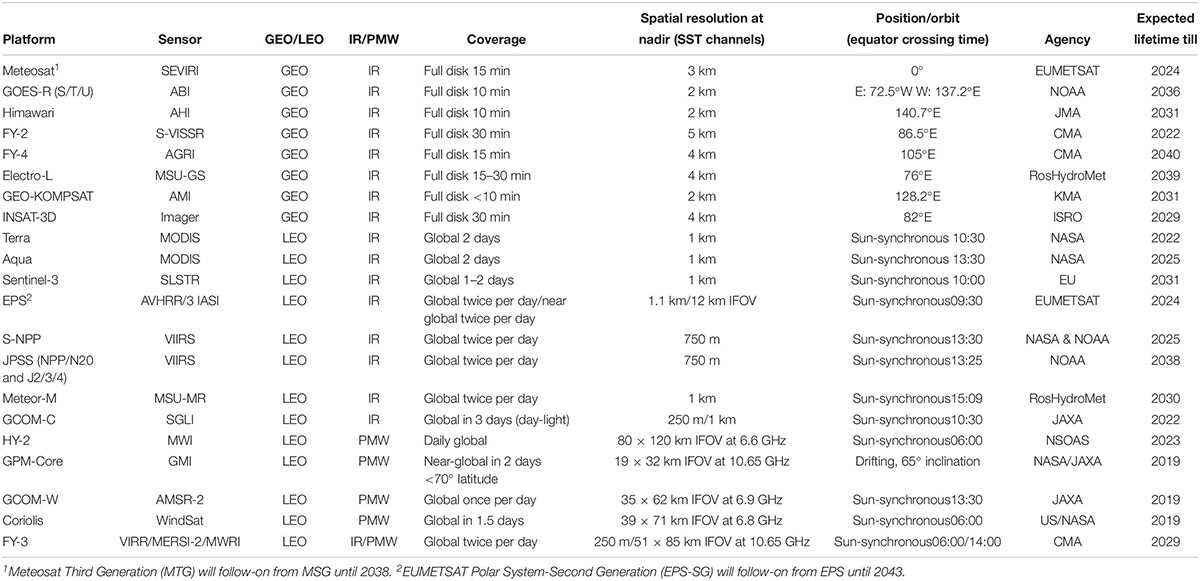
Table 1. Current platform and sensor characteristics with capability for sea surface temperature, specifying whether in GEO or LEO; IR or PMW; daily coverage; spatial resolution at nadir; position or orbit and equator crossing time; agency and the expected lifetime till.
Polar-Orbit IR SST Capability
IR radiometers on LEO satellites provide high spatial resolution SST with global coverage of the Earth up to twice daily at the equator, and more frequently in the higher latitudes. Current retrieval methods and sensor technologies enable highly accurate IR SST retrievals, yielding global monthly differences around 0.2°C with standard deviations around 0.4°C during night-time (e.g., Petrenko et al., 2014; Wang et al., 2016). Progress in IR SST also significantly reduced regional and seasonal differences inherent with non-linear SST (NLSST) retrieval algorithms (e.g., Merchant et al., 2009a; Marsouin et al., 2015). SST products cover Level 2 (original swath projection, with native spatial resolution) to regional and global Level 3 products, remapped and composited over areas and times defined by user needs.
Recently, AVHRR (Cracknell, 1997; Albiñana et al., 2007) and MODIS (Esaias et al., 1998; Kilpatrick et al., 2015) have been joined by newer generation sensors. The newest National Oceanographic and Atmospheric Administration (NOAA) JPSS satellites are now equipped with VIIRS, which first flew on the Suomi-NPP launched in October 2011, and has a wide range of IR channels including 3.70, 4.05, and 8.55 μm as well as two traditional “split-window” 11–12 μm channels. Currently, two Copernicus Sentinel-3 satellites are flying, carrying an SLSTR (Donlon et al., 2012), which is a dual-view radiometer akin to the Along Track Scanning Radiometer (ATSR) series (Llewellyn-Jones and Remedios, 2012). The future European Organisation for the Exploitation of Meteorological Satellites (EUMETSAT) Polar System (EPS) Meteorological Operational Second Generation (Metop-SG) program will include the visible and infrared imager (METimage, Wallner et al., 2017), which will have 20 spectral bands channels, at 500 m resolution at nadir. In December 2017, Japan Aerospace Exploration Agency (JAXA) launched the Global Change Observation Mission – Climate (GCOM-C or “Shikisai”) satellite carrying the Second-generation Global Imager (SGLI) with 19 spectral bands, and switchable resolution from 250 to 1,000 m at nadir (Urabe et al., 2018). Other instruments enabling SST retrieval include the Visible and InfraRed Radiometer (VIRR) on board the Chinese Feng-Yun satellites (Dong et al., 2009; Yang A. et al., 2017).
Geostationary-Orbit Infrared SST Capability
In contrast to LEO, GEO satellites provide many images each day over a fixed geographic region. New-generation GEO sensors include: the Advanced Baseline Imager (ABI; Schmit et al., 2005, 2017) onboard NOAA GOES-16 and -17 (launched in November 2016 and March 2017, respectively, and designated as NOAA operational GOES-East and –West satellites in December 2018 and February 2019, respectively); the Advanced Himawari Imager (AHI, a twin to ABI; Bessho et al., 2016), onboard Himawari-8 and -9 (launched in October 2014 and November 2016, respectively); the Advanced Meteorological Imager (AMI, another ABI twin; Choi and Ho, 2015) onboard Geo-Kompsat-2A (launched December 2018; Kim et al., 2015); the Advanced Geosynchronous Radiation Imager (AGRI; Yang J. et al., 2017) onboard the FY-4 series (FY-4A, launched in November 2016, will be followed by FY-4B & C in 2019 and 2021, respectively); and the Flexible Combined Imager (FCI; Durand et al., 2015) to be launched on EUMETSAT Meteosat Third Generation Imaging satellites (MTG-I) beginning in 2021.
All these new-generation sensors capture IR images every 10–15 min with 2 km nadir resolution (except FY-4, which takes images every 30 min with 4 km resolution at nadir) and have multiple spectral bands, sampling in the atmospheric windows around 3.7, 8.6, and 10–12 μm suitable for SST retrievals. Other currently available GEO sensors with SST capability are the Spinning Enhanced Visible and Infrared Imager (SEVIRI) on Meteosat Second Generation (Meteosat-8, -9, -10, and -11), and the Multi-Spectral Imager onboard the Insat-3D/3DR. The full constellation of geostationary satellites provides nearly global coverage, missing only high latitudes. There should always be a constellation of 5–6 geostationary platforms with SST-capable sensors.
An important feature of new generation GEO sensors is their capability to take measurements at high temporal resolution to improve clear-sky masking (e.g., using temporal information to separate the effects of faster moving clouds and other atmospheric features from the slower evolving SST fields). This approach can significantly improve coverage by using SSTs from successive clear-sky data allowing better characterization of the SST diurnal cycle (Gladkova et al., in review). Moreover, data volumes can be significantly reduced by providing a product at a reduced temporal rate (e.g., hourly) but still sufficient to resolve the diurnal cycle. Also, the sensitivity of the retrieval algorithm to real changes in temperature (Merchant et al., 2009a) is critical to accurately measure the temporal variability in geostationary SSTs, and in particular, to correctly estimate the amplitude of the SST diurnal cycle. Additional applications benefiting from high-frequency SST variability include semi-diurnal tides and their impact on shelf sea fronts. An illustration of the footprint and constellation of the global geostationary satellites can be found from the World Meteorological Organization (WMO)6.
Passive MW Polar-Orbiters and Low Inclination Orbiting SST Capability
PMW SST retrievals from LEO satellites (in both sun-synchronous and non-sun-synchronous orbits) have been collected for approximately 20 years, starting with the joint US-Japan Tropical Rainfall Measuring Mission, launched in 1997, which carried the TRMM Microwave Imager (TMI; Wentz et al., 2000). TRMM was in a low inclination orbit so measurements were limited to within about 40° of the Equator. To sample the diurnal patterns in rainfall, TRMM was put in a sun-asynchronous drifting orbit. The NASA satellite, Aqua, launched in 2002 carried the Advanced Microwave Scanning Radiometer for EOS (AMSR-E; Kawanishi et al., 2003). Aqua is in a sun-synchronous, polar orbit. The first PMW producing global SSTs started in 1978 with SMMR on SeaSat and Nimbus-7. A great advantage of the PMW SSTs is in the cloud penetrating capability of low frequency microwaves to capture SST under most clouds and through atmospheric aerosols. These capabilities make PMW SSTs an essential data source for producing multi-satellite merged SST products on a daily basis, though their spatial resolution is much coarser than IR SSTs. SST retrievals using PMW imagers are based on low-frequency channels of 6.9 and 10.65 GHz that are sensitive to water temperature variations, but the SST sensitivity of the 10.65 GHz emission decreases below SSTs colder than 13°C (Gentemann et al., 2010).
The spatial resolution of PMW SSTs depends on the antenna size and satellite altitudes. Larger antennas and lower satellite altitude result in finer spatial resolution, with the 10.65 GHz measurements having finer footprints than at 6.9 GHz. At present, the finest spatial resolution of 6.9 GHz SST is about 35 × 62 km by AMSR2 on the Japanese GCOM-W satellite launched in 2012, having a 2.0 m diameter antenna and 699 km altitude. The finest spatial resolution of 10.65 GHz SSTs is about 19 × 32 km provided by Global Precipitation Measurement (GPM) Microwave Imager (GMI) onboard the US-Japan joint GPM Core Observatory (launched in 2014 into a low inclination orbit) with a 1.2 m diameter antenna and 402.5 km altitude. Recent validation indicates the accuracy of PMW SSTs to be around 0.5°C for 6.9 GHz, and 0.6°C for 10.65 GHz SSTs by AMSR2 (JAXA, 2017). More research and international collaboration is recommended on harmonizing and improving the calibration of low-level PMW observations across all available missions. Further fundamental observation of and research into the dependence of sea-surface emissivity at SST-relevant frequencies on sea-state and wind speed will be crucial to driving future improvements in uncertainty in PMW SST.
The Evolving in situ SST Observing System
Measurements of SST have been made for more than 200 years for a wide variety of purposes. The earliest measurements of SST in the eighteenth century were taken as an aid to navigation. Over a time and after the connection between SST and ocean currents was strengthened, large numbers of measurements were made for the construction of navigational charts (Kennedy et al., 2012). Gradually, data needs for weather and oceanographic forecasting systems, as well as understanding a changing climate, became the main drivers for collecting SST data. This evolution reflected a change in the method of measurements from mainly human operators on voluntary observing ships (VOS) to fully automated measurements from buoys (and satellites). Satellite measurements rely on in situ data for retrieval and validation (see section “Improved Methods of Validation”) and both sources of SST are used in many applications, such as climate and weather model boundary conditions (Folland, 2005; Kennedy et al., 2012) and SST analysis products (e.g., Roberts-Jones et al., 2012). Figure 2 shows the changes over time of geographical coverage and method for in situ measurements, illustrating the constraint of major shipping lanes have on the data collection and the under-sampling of low and high latitudes.
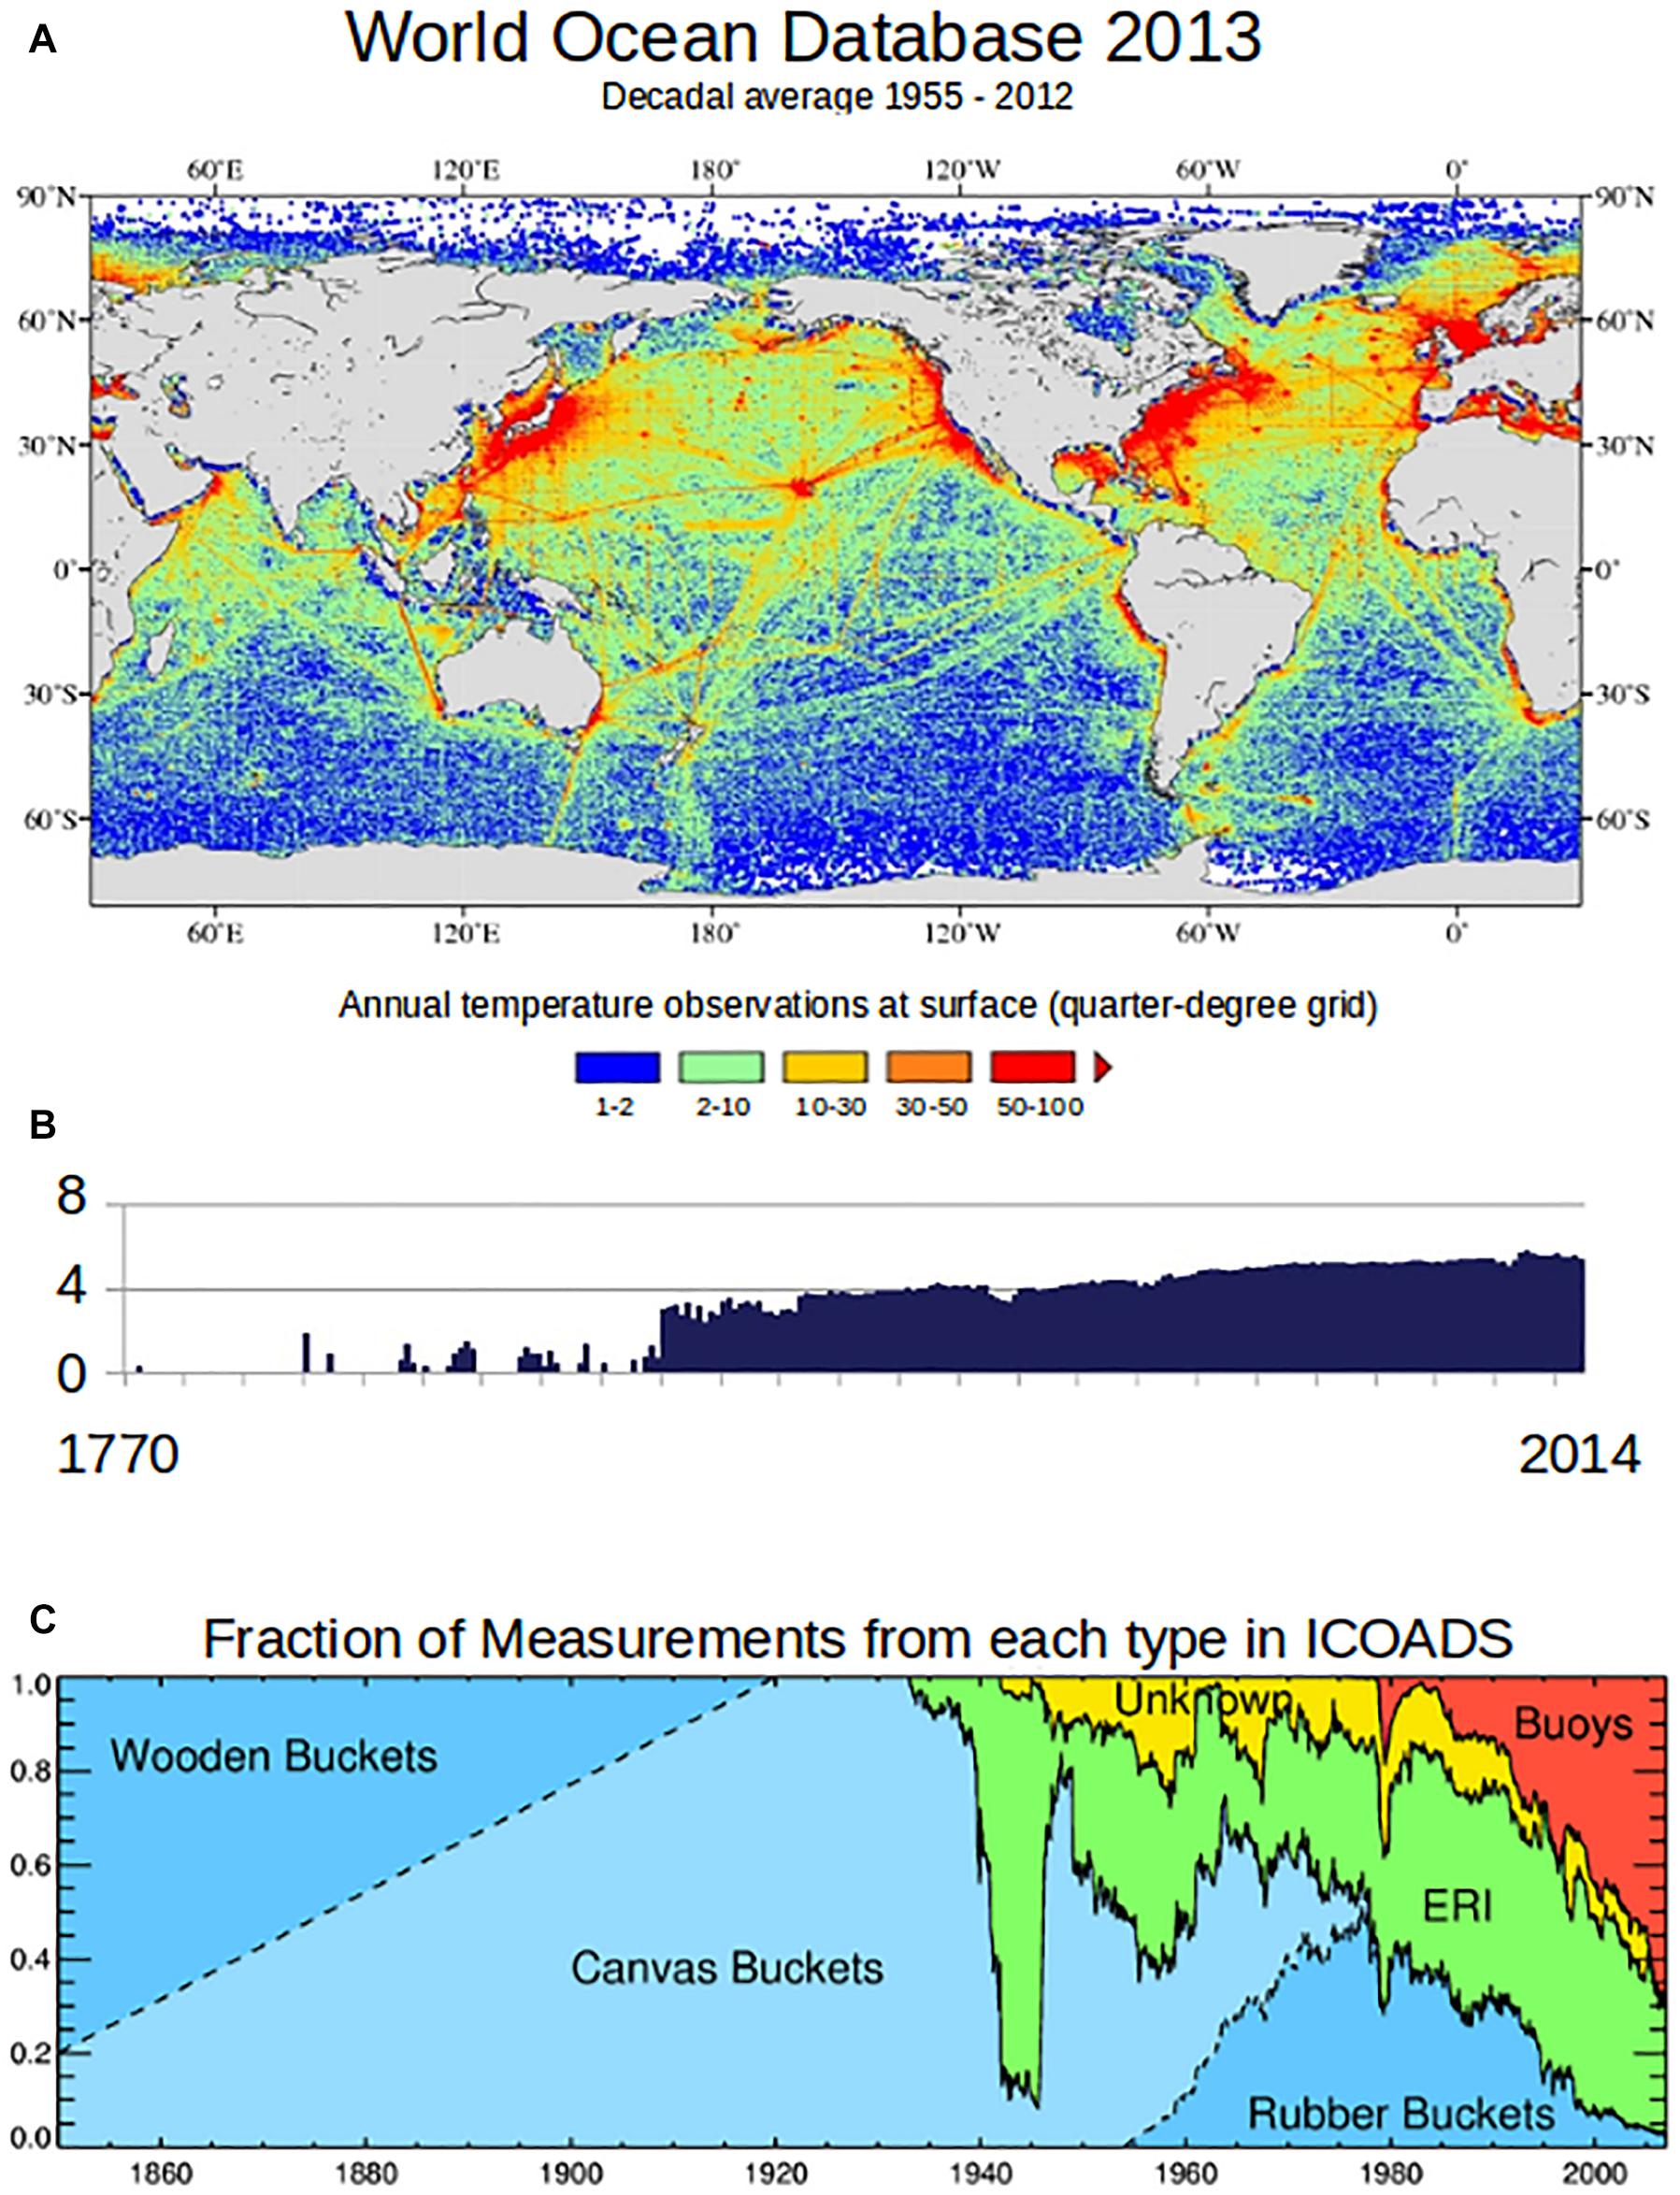
Figure 2. Distribution of SST measurements and by method. (A) Shows the spatial distribution of SST measurements as included in the World Ocean Atlas in 2013. (B) Shows the temporal distribution of SST measurements in the World Ocean Atlas in 2013 (from Freeman et al., 2017). (C) How the measurement methods changed over time. ERI are Engine Room Intake measurements, Buoy measurements include drifting and moored buoys (from Rayner et al., 2018). Please note that the spatial and temporal time lines are different, 1955–2012 for the spatial distribution shown in plate (A) and 1770–2014 for the temporal distribution shown in plate (B).
The change in observation method not only expanded the geographical distribution of the in situ SST measurements but also their quality. The changing requirements led to international efforts to define a common set of requirements and standards with the implementation of the climate observing system that is overseen and coordinated by the Global Climate Observing System (GCOS) providing advice and guidance at national and international levels (e.g., GCOS, 2009, 2010). Coordination of specific activities is through the GCOS-affiliated expert bodies and panels, such as the WMO/Intergovernmental Oceanographic Commission (IOC) Joint Technical Commission for Oceanography and Marine Meteorology (JCOMM), Ship Observations Team (SOT), and the Data Buoy Cooperation Panel (DBCP) to name a few (Berry and Kent, 2017). Different applications of SST fields have varying accuracy requirements, with those for CDR being the most stringent and difficult to meet. Continuation of the Global Tropical Moored Buoy Array (GTMBA; McPhaden et al., 2010) is essential, as it has a major impact on methods to assess the stability of long-term SST data records (e.g., see for example Merchant et al., 2012).
Sea surface temperature is identified by the WMO as an Essential Climate Variable (ECV7), among other parameters (Bojinski, 2014), and a rigorous approach to data quality assessment must be followed, such as recommended by Barker et al. (2015). Most notably, this means that in situ SST measurements should be accompanied by estimates of their uncertainty, following formal metrological protocols (Joint Committee for Guides in Metrology (JCGM, 2008). These specifications should be followed for all SST products but are especially important if satellite-derived SSTs are to be used as a CDR (Minnett and Corlett, 2012). There are several approaches to estimate uncertainties of in situ measurements (e.g., Hirahara et al., 2014; Kennedy, 2014; Berry and Kent, 2017; Freeman et al., 2017). Broadly speaking, the uncertainties can be split into two groups: uncertainties due to random errors, such as incorrect readings or rounding errors; and uncertainties due to systematic errors, such as incorrect calibration or poor positioning of the measurement site. Although this is a convenient way to deal with the uncertainties, inaccuracies in SST measurements generally share characteristics (Kennedy, 2014). Most in situ SST datasets (e.g., International Comprehensive Ocean-Atmosphere Data Set, ICOADS, and the Hadley Centre SST Dataset, HadSST3) include an estimate of a correction for the systematic component based on measurement type (e.g., bucket, engine room intake or buoy), which can reduce discontinuities in the long time records. Kennedy (2014) states that a typical SST measurement made by a ship has an uncertainty of around 1.0–1.5°C and a drifting buoy observation a typical uncertainty of around 0.1–0.7°C. Vessels with well-calibrated and suitably located temperature sensors can provide SST measurements with similar uncertainties to currently deployed drifting buoys, and can therefore provide in situ SST for satellite SST validation in regions lacking in drifting or moored buoys, such as coastal regions and in the Australian region (Beggs et al., 2012).
While the effort to characterize uncertainties for in situ SST records is considerable not all of them are SI-traceable, in a metrological sense, which is needed for a CDR. Therefore, more recent efforts using ship-based infrared radiometers for satellite-derived SST validation have shown the value of SI-traceable measurements, together with rigorous uncertainty budgets (Barton et al., 2004; Rice et al., 2004; Donlon et al., 2008; Minnett, 2010; Wimmer and Robinson, 2016) of 0.14°C (Theocharous et al., 2016), or better. However, the measurements are sparse compared to those of drifting buoys. Continued studies and activities are needed on the inter-comparison of FRM (Donlon et al., 2015) with data; the estimation and provision of the measurement uncertainties; and ensuring SI-traceability is established through international collaboration. In an effort to improve the sampling of SI-traceable in situ SSTs, a new generation of drifting buoys is being designed and tested through efforts of GHRSST, DBCP, European Union’s Copernicus Programme and EUMETSAT (Poli et al., 2019). These efforts to improve in situ records are continuing and require considerable resources to improve the in situ SSTs not only as a standalone CDR but also as a verification tool for satellite-derived SST fields. It is important that improvements in correct metadata provision to in situ records continue to be made. Data from Argo profilers in the near surface layer are used for satellite SST validation, particularly those specifically designed to acquire SST close to the sea surface. These data could be further exploited to explore SST at depth and validate near-surface profiles. Additional in situ measurements, and ideally FRM, are required, especially in high-latitude and sea ice regions.
Improving Current and Future SST Measurements for Users
The increased number of SST products and large number of users makes user-driven developments within the current and future SST products essential. Comments and feedback are typically obtained through dedicated science and user meetings (such as the annual GHRSST meeting), which allow data producers to collect information to guide future product developments. This section presents and discusses necessary developments to provide improvements highlighted by users as the most important for their application, such as: cloud masking, aerosol impact assessment, uncertainty estimation, diurnal variability, and validation.
Improved Cloud Masking of IR Imagery
About 80–90% of pixels are fully or partially cloudy in any IR imagery of the ocean, and it is critically important to identify (and remove) these pixels. Clouds are colder and more reflective, more variable in space/time, and have a particular IR spectral emissivity, compared to clear ocean. Cloud masking algorithms for SST make use of the spectral, spatial, and temporal characteristics of the sensor brightness temperatures (BTs); solar reflectance bands may be additionally employed during daytime. Methods currently used are threshold-based (e.g., Saunders and Kriebel, 1988; Kilpatrick et al., 2001; Petrenko et al., 2010), probabilistic (based on blending physically and empirically derived joint probability distributions, in conjunction with Bayes’ theorem; e.g., Merchant et al., 2005), or trained using artificial intelligence (AI) approaches (e.g., Kilpatrick et al., 2019).
For LEO sensors, an additional spatial pattern recognition approach has been found useful (Gladkova et al., 2015). Also, repeated sampling of the same area of the ocean, from different passes or satellites, may be utilized (Gladkova et al., 2019). For GEO, frequent sampling provides a valuable opportunity to dramatically improve cloud masking, by separating fast-moving atmospheric features from more slowly evolving ocean patterns (Gladkova et al., in review; see example in Figure 3). While not all clouds can be identified in this way, it offers a computationally effective improvement over using only static spatial information.
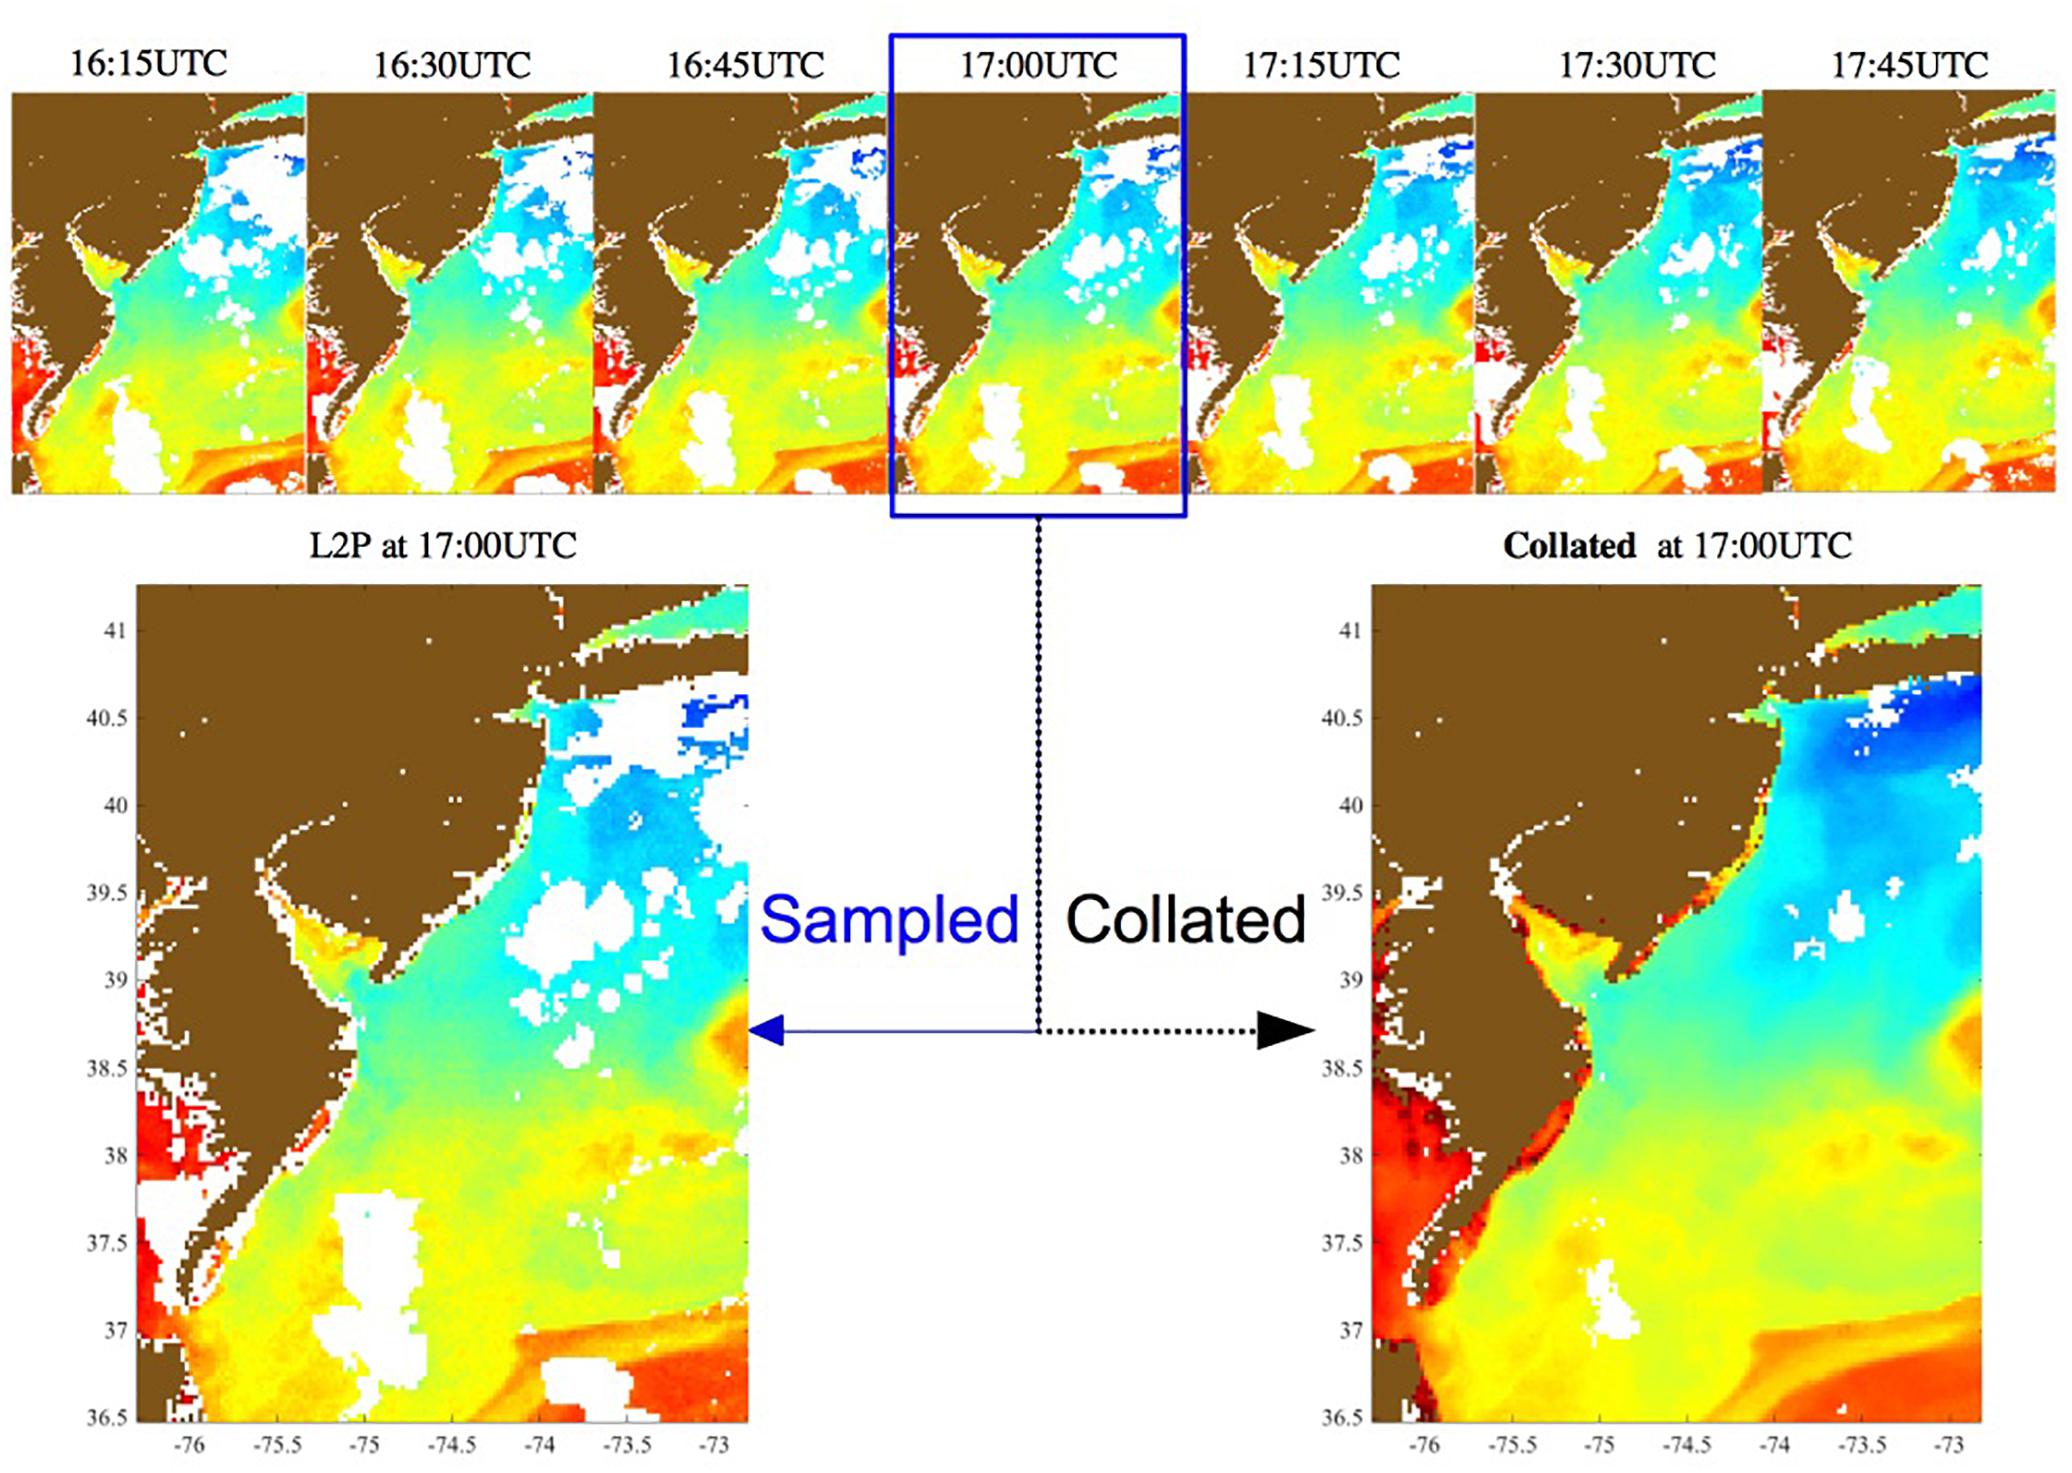
Figure 3. An example of using the temporal context information available from the ABI on GOES-16. The image at lower left is the sampled instantaneous SST at 17UTC. At lower right is collated SST, produced using an algorithm described in Gladkova et al. (in review) that examines 6 h of temporal data to detect residual cloud from drop-outs in the SST time series, and to fill short temporal gaps by noise-tolerant curve fitting. The collated product significantly increases clear-sky coverage, and reduces cloud leakages and noise in the imagery. (Reproduced by permission under CC BY 4.0 from http://doi.org/10.6084/m9.figshare.7286267.v2).
All current methods are formulated to deliver either a binary mask or a continuous score (e.g., probability of clear sky) that can be used to derive quality information. Albeit differently, all methods embed prior knowledge of the physical and radiative transfer properties of the surface, clouds and atmosphere. In dynamic and coastal regions of the ocean, and around ice, uncertainty in the prior SST is larger, and misclassification more likely. In general, dependence on prior information should be minimized wherever reliable classification can be made from the satellite observations themselves, which is aided by new SST sensors that provide measurements in more bands, and at higher spatial and temporal resolution.
More Accurate SST Retrieval Through Aerosol-Laden Atmospheres
Sea surface temperature retrievals from IR measurements are susceptible to forms of aerosol that absorb and scatter IR radiation, particularly mineral dust (such as lofted from the Sahara Desert) and stratospheric volcanic aerosol following major SO2-rich eruptions (the last being Mt. Pinatubo in 1991). Many SST algorithms have little robustness to such events (Blackmore et al., 2012) and will be subject to significant errors. Figure 4 indicates the influence of Saharan dust aerosol outflows on satellite SST retrievals, over the Atlantic Ocean and the benefits of a correction algorithm (Luo et al., 2019). Intermittent mineral-dust loadings cause variable SST errors, which have negative implications for prediction of important phenomena including monsoonal systems, as well as for other applications (Atkinson et al., 2013, 2015).
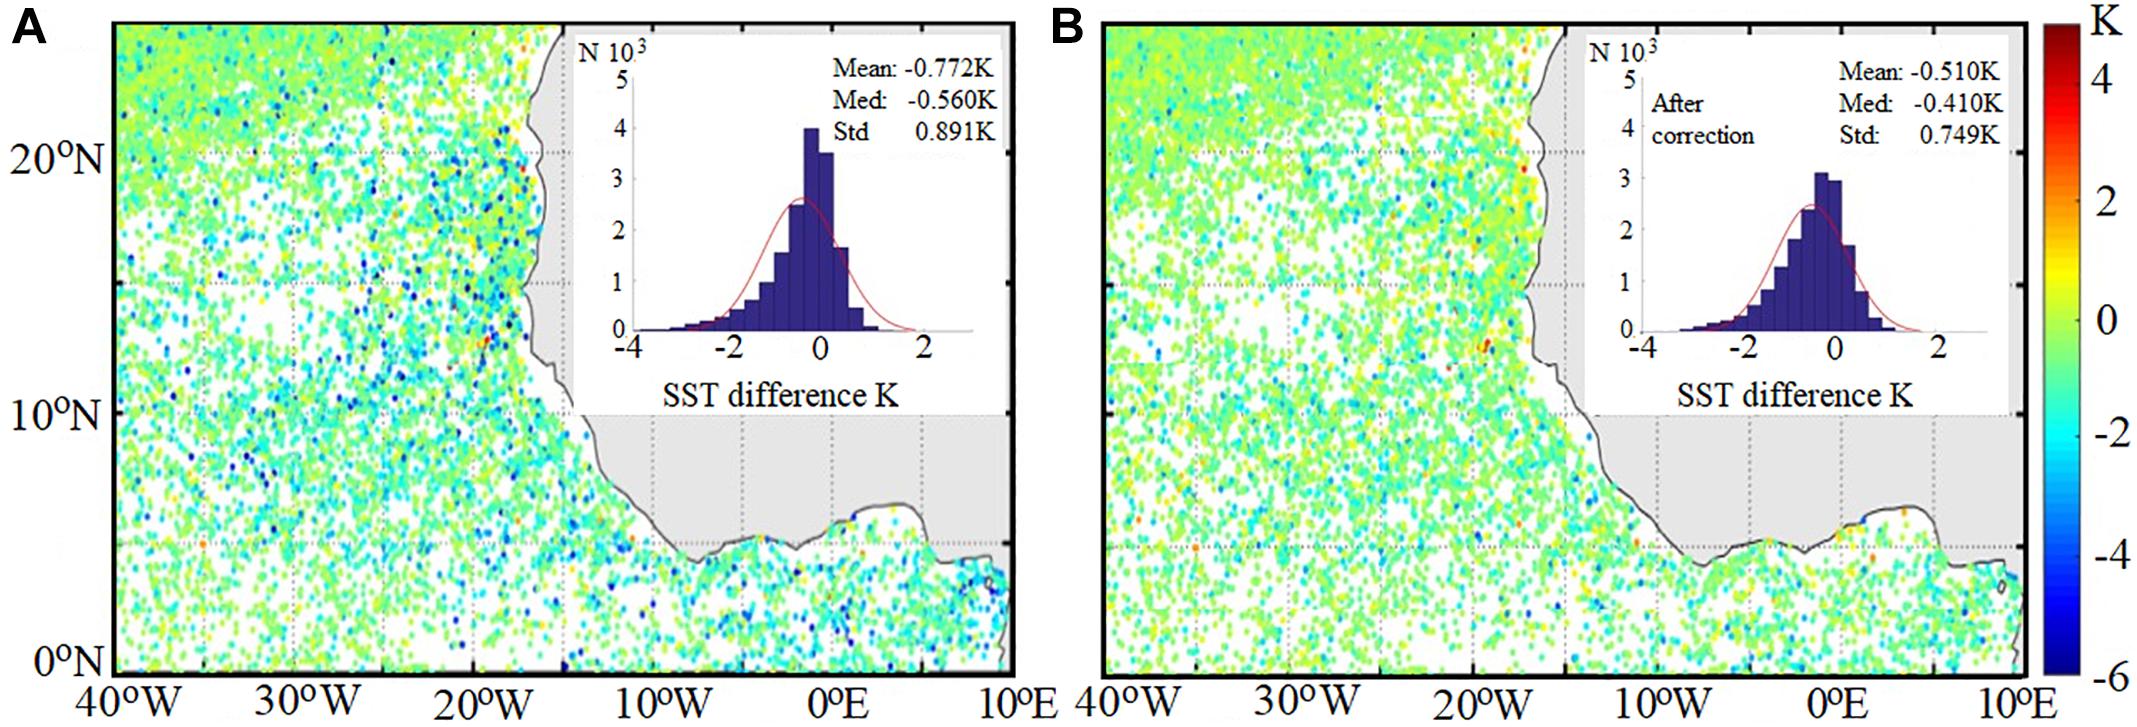
Figure 4. Night-time differences between SSTskin derived from MODIS on Aqua, and collocated, coincident subsurface temperatures from drifting buoys off West Africa, a region frequently subjected to the influence of Sahara dust aerosol outflows to the west and southwest, after Luo et al. (2019). The temperature differences are indicated by colors, as given on the right-hand scale in K. (A) With the standard MODIS SSTskin atmospheric correction algorithm based on measurements at λ = 11 and 12 μm (Kilpatrick et al., 2015), indicating the predominantly negative differences in the dust outflow area. (B) As at panel (A) but after additional correction for aerosol effects with an algorithm that includes measurements at λ = 3.75 and 8.96 μm.
Dual-view SSTs from sensors such as SLSTR are less sensitive to mineral dust than single-view sensors (Merchant et al., 1999). The exploitation of non-traditional SST bands should also help reduce dust-related biases. Microwave SSTs are expected to be unaffected by mineral dust. Nonetheless, improvements in SST retrieval in mineral-dust conditions is possible and is needed, and should involve efforts both on single-sensor algorithms and optimum use of the constellation of sensors.
Some current (MODIS and VIIRS) and planned (METimage) sensors have more than one channel around 3.9 μm. With the information content of these channels, the potential for more accurate SST retrievals in the presence of aerosols arises (Merchant et al., 2006), but this is yet to be widely exploited. It is recommended that studies to address this are pursued to improve SST accuracy in areas of mineral dust aerosol and introduce resilience to major volcanic eruptions, which although rare will occur in future.
Better Uncertainty and Error Estimation
Users of SST increasingly demand uncertainty information, to give greater context for their applications and for quantitative use in systems such as data assimilation (ECMWF Workshop Report, 2018). Good-practice guidance for uncertainty provision for CDRs (Merchant et al., 2017) offers principles that should be applied to SST data products in general.
The error in a measured value of SST is the difference in that value from the unknown true value, and the uncertainty in SST represents the dispersion of error. Although the error in each point is unknown (otherwise we would correct for it), there are a variety of techniques for quantifying uncertainty, in a statistical way. These fall into two classes: empirical methods in which uncertainty is deduced from the distribution of differences between alternative measured values (such as satellites versus drifting buoys; e.g., Castro et al., 2008, 2012; O’Carroll et al., 2008; Petrenko et al., 2016; Xu and Ignatov, 2016); and uncertainty modeling, in which understanding of the instrumental uncertainty, cloud screening, retrieval process and representativity effects are quantified, propagated and combined to form an uncertainty estimate (e.g., Merchant et al., 2014).
To gain confidence of users in applying provided uncertainty information, we recommend that uncertainty estimates should be developed using both uncertainty modeling and by empirical means. Provided a mature forward model exists, agreement of results between the two methods amounts to a convincing validation of the uncertainty model.
Approximate empirical methods of estimating uncertainty are presently the approach within GHRSST format SST products. These include Sensor Specific Error Statistics (SSES), comprising the mean and standard deviation of satellite SSTs differenced from a matched in situ temperature, such as measured from drifting buoys. Improved SSES require better quantification of in situ uncertainty (and preferably its reduction). It is recommended that understanding of drifting buoy uncertainty is improved in support of assessing satellite-derived SST accuracies. As uncertainty modeling methods are more widely developed for satellite SSTs over coming years, this will also enable more rigorous validation including validating uncertainties (see for example Figure 5 and section “Improved Methods of Validation”).
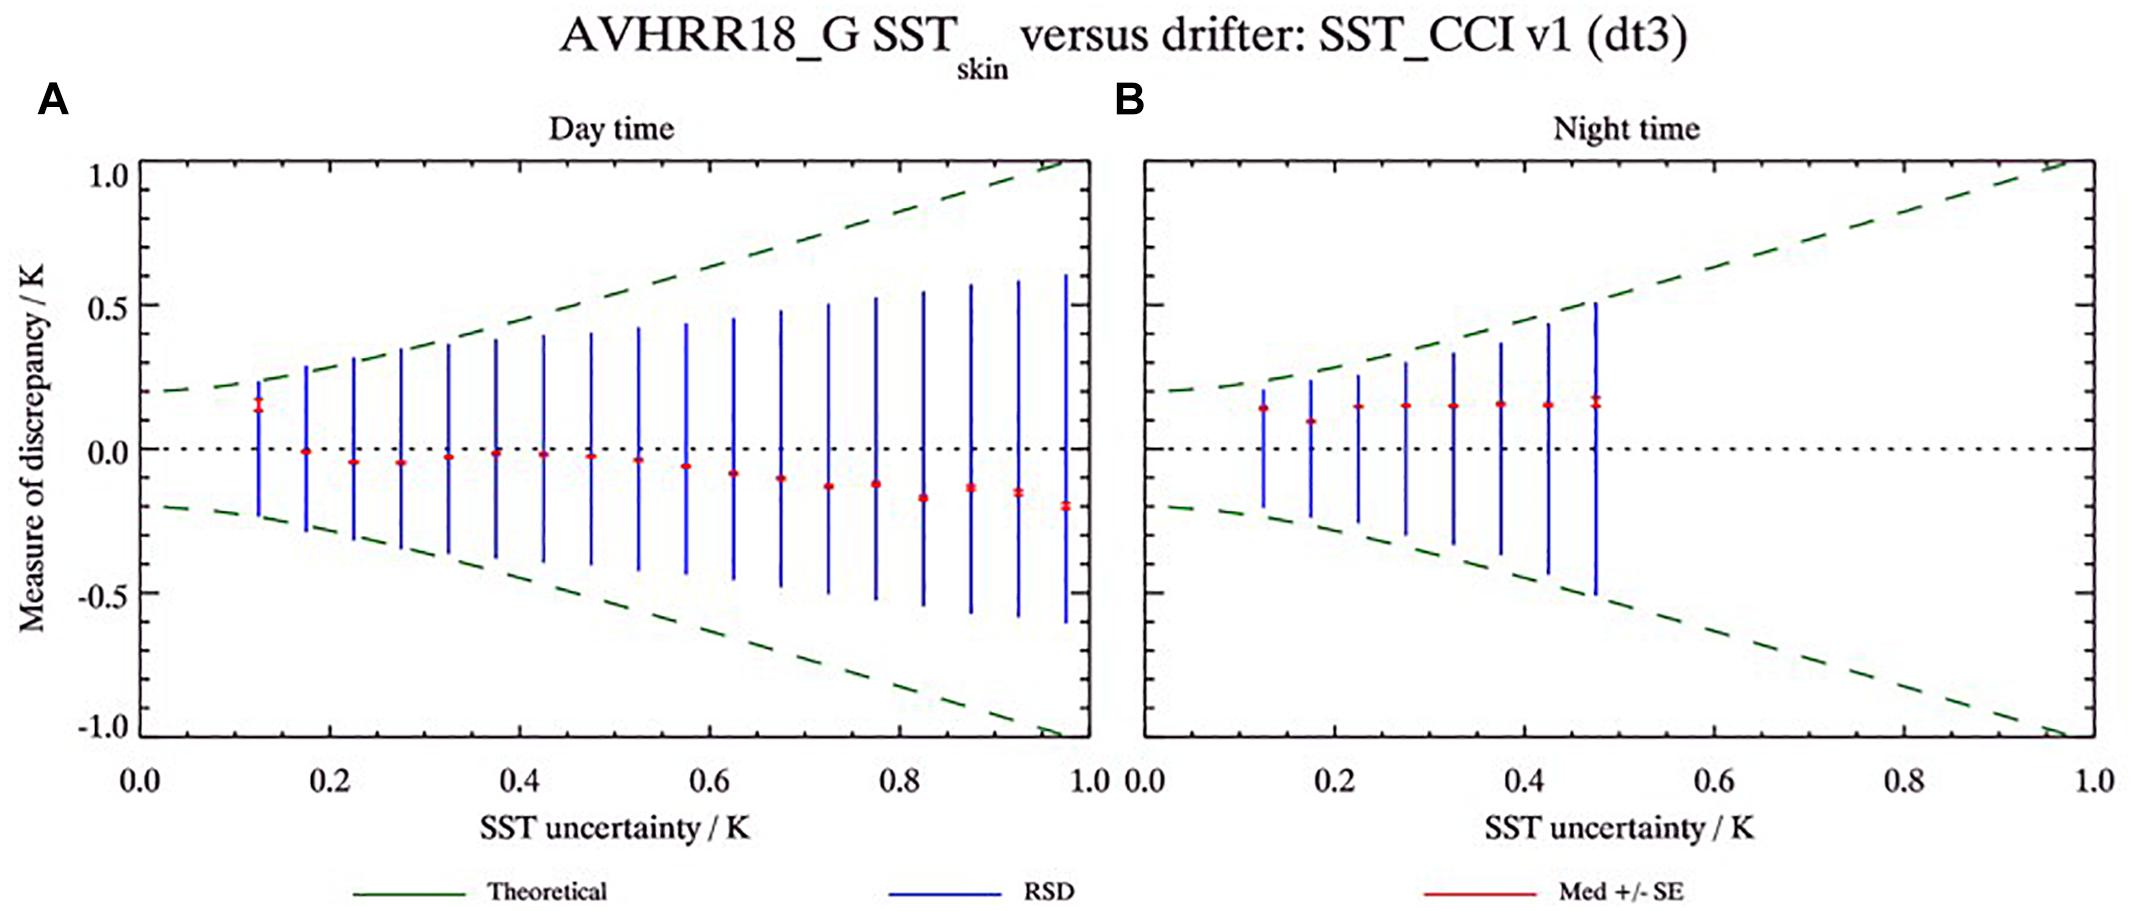
Figure 5. Example of validation of an uncertainty model for an SST product. Here, SST uncertainty is defined per datum in an SST product, and varies over a range of 0.0–1.0 K. Matches to drifting buoys are binned in terms of the SST uncertainty, and the mean and standard deviation of the difference calculated per bin (indicated by the red and blue bars respectively). Accounting for an estimate of in situ uncertainty, the green dashed line is the envelope expected if the uncertainty estimates are accurate. As we can see from this example, the agreement at night time (A) is very good. However, for day time match-ups (B) the blue bars are within the theoretical envelope, indicating they are over estimated as the calculated standard deviation is smaller than the theoretical for much of the distribution. (Reproduced by permission under CC BY 4.0 from https://doi.org/10.6084/m9.figshare.7286168.v2).
Better Practical Quantification of Diurnal Variability
Progress in understanding and quantifying diurnal variability using hourly GEO IR SSTs over European seas and the Atlantic Ocean (Gentemann et al., 2008; Bellenger and Duvel, 2009; Marullo et al., 2010, 2016; Eastwood et al., 2011; Karagali et al., 2012; Karagali and Høyer, 2013), and the Tropical Warm Pool (Marullo et al., 2010; Zhang et al., 2016a, b), revealed consistent features regarding the frequency of all such events, their timing during the day and seasonal patterns. The difference between a daytime hourly SST value and the corresponding foundation temperature of the previous night is defined as diurnal warming (or anomaly), indicated by δSST. Figure 6 shows the number of observations with δSST ≥ 1 K estimated from hourly SEVIRI SST retrievals between 2006 and 2011. Areas with increased occurrences of δSST exceeding 1K include the Mediterranean, Red and Baltic Sea, the region of the Malvinas/Brazil currents (SW Atlantic), the Benguela Current offshore from Namibia and Angola (SE Atlantic) and the Mozambique Channel (Indian Ocean).
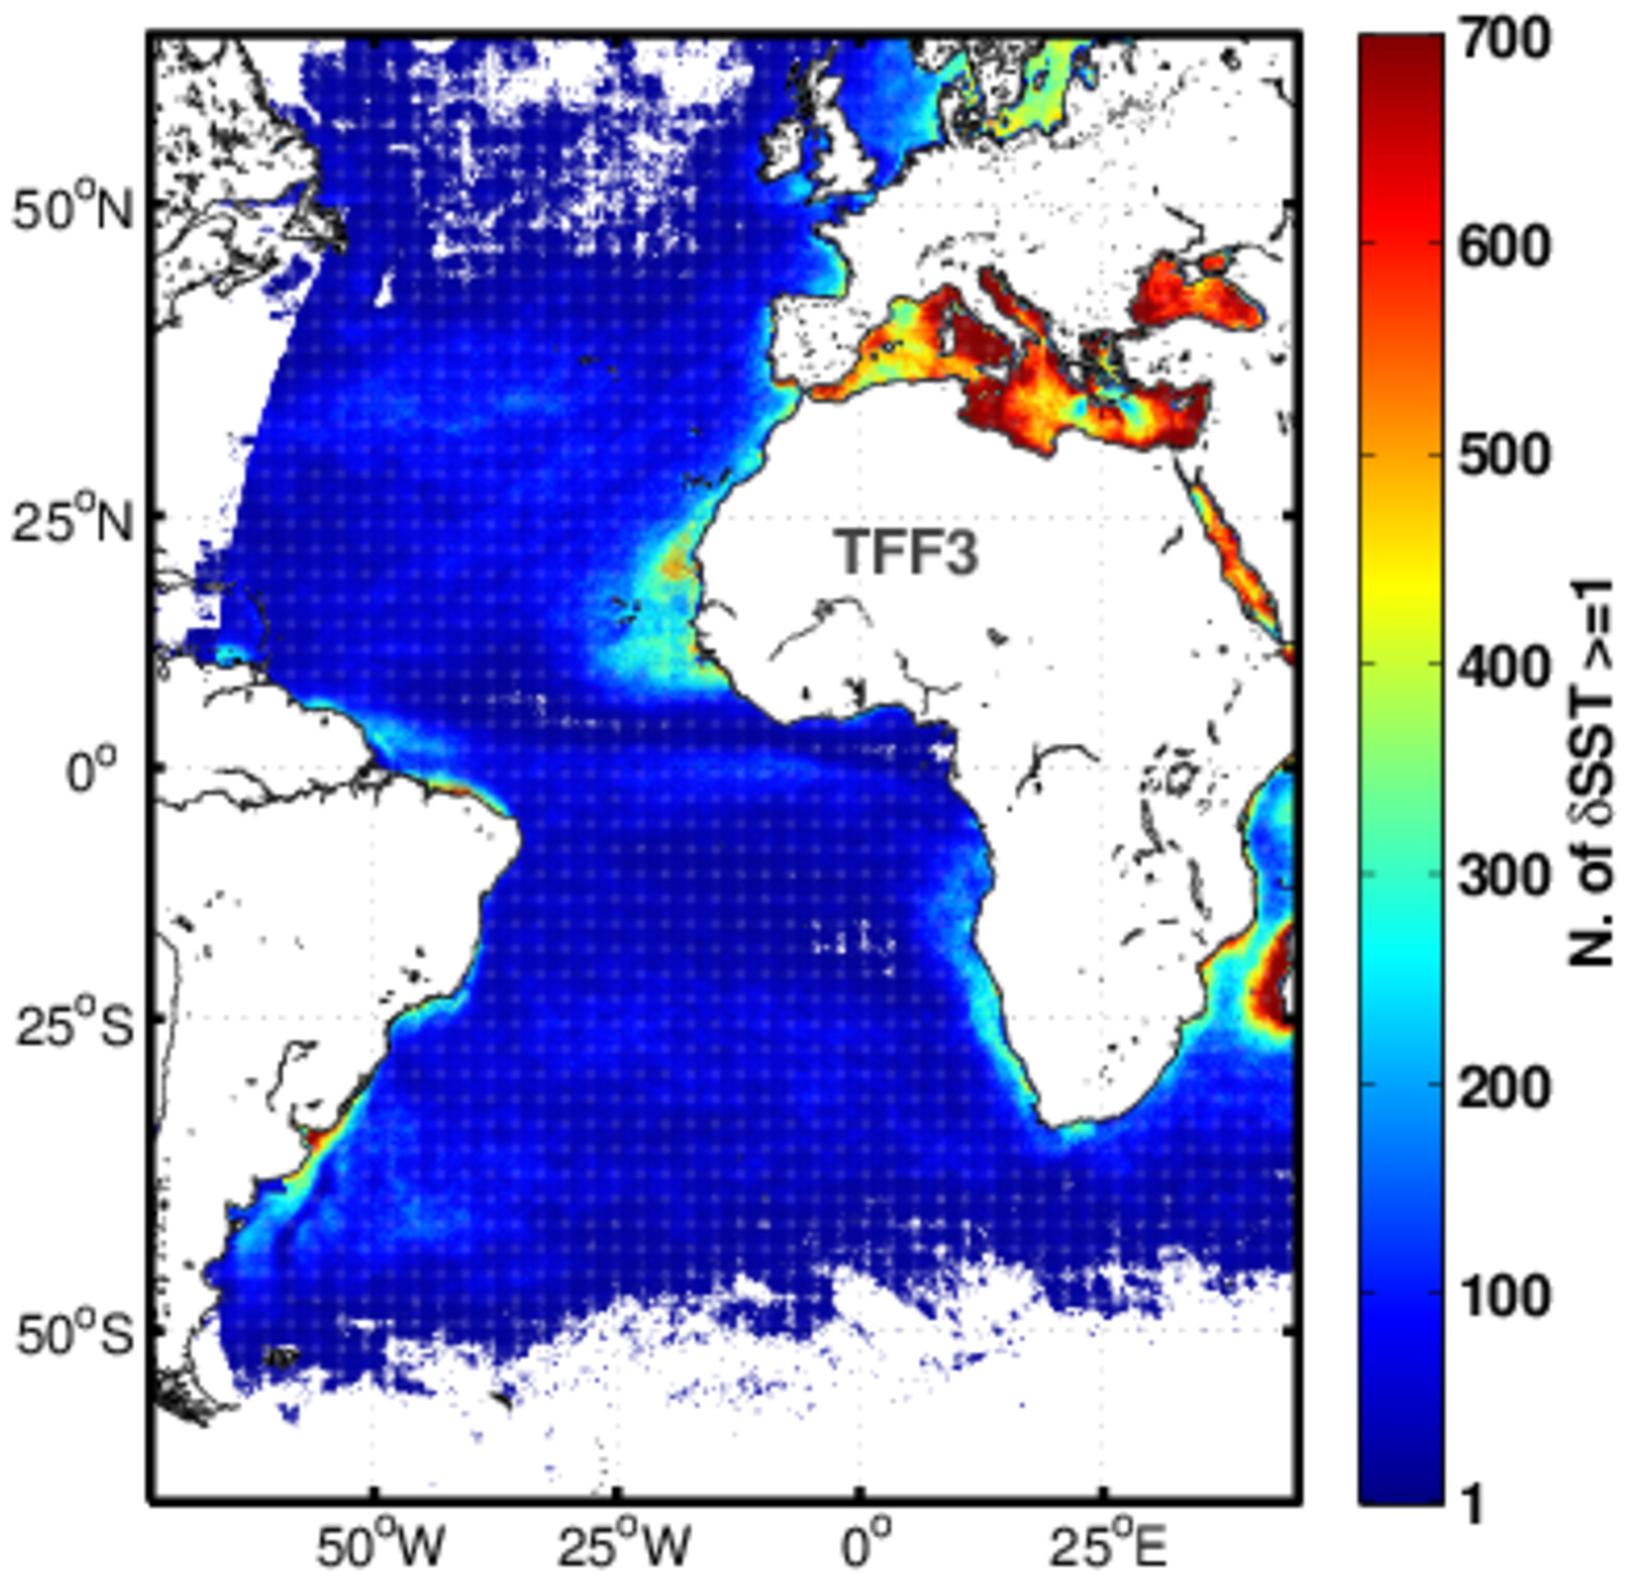
Figure 6. Occurrences of diurnal warming of 1 K and larger, estimated from hourly SEVIRI SST retrievals between 2006 and 2011. (Reproduced by permission under CC BY 3.0 from https://doi.org/10.5194/os-10-745-2014).
Different models of diurnal variability have been proposed (e.g., Filipiak et al., 2010) and evaluated (e.g., Karagali and Høyer, 2013, 2014; Karagali et al., 2017; While et al., 2017; Zhang et al., 2018). Diurnal SST variability has been quantified by satellite (Gentemann et al., 2008) and in situ (Morak-Bozzo et al., 2016) observations, yet it is not fully resolved by forced ocean and coupled ocean-atmosphere models. Only some of the important diurnal variability and cool skin effects are parameterized or explicitly represented in models (e.g., Zeng and Beljaars, 2005; Fallmann et al., 2017). The diurnal cycle is represented in several operational GCMs that distribute hourly products. Here, the mean annual diurnal cycle is well reproduced but extreme events such as diurnal warming that exceed 1 K are always underestimated (Marullo et al., 2014). The implications associated with the lack of a properly resolved SST daily cycle in atmospheric, oceanic and climate models have been quantified in terms of heat budget errors in the Tropics (Clayson and Bogdanoff, 2012) and the Mediterranean Sea (Marullo et al., 2016). The community and users will benefit in the future if consistent methodology is developed, and a global study performed to cross-evaluate and validate against in situ data, the diurnal variability as seen in various geostationary products (SEVIRIs, GOES, etc.) over the longest period.
Improved Methods of Validation
The traditional approach to determine errors in satellite SSTs is comparison to in situ thermometers (e.g., Llewellyn-Jones et al., 1984; Strong and McClain, 1984; Kilpatrick et al., 2001; Reynolds et al., 2010; Gentemann and Hilburn, 2015) or shipboard radiometers (Kearns et al., 2000; Wimmer et al., 2012; Kilpatrick et al., 2015). GHRSST has supported efforts over the past 10 years to unify in situ data for satellite validation (e.g., in situ SST Quality Monitor, iQuam; Xu and Ignatov, 2014). However, the heritage approach to validation does not account for real physical differences between the two measurements and therefore may not correctly describe the error distribution in satellite SSTs. For example, Figure 7 shows the temporal dependence of differences between match-ups from AATSR and four different in situ datasets. The spread of values shown in Figure 7 contributes to the overall standard deviation of the match-ups if not minimized. Also, the uncertainty of the in situ measurement should be considered, which has been shown to be larger than expected for drifting buoys (∼0.2 K) from 3-way analysis methods (O’Carroll et al., 2008; Gentemann, 2014; Xu and Ignatov, 2016).
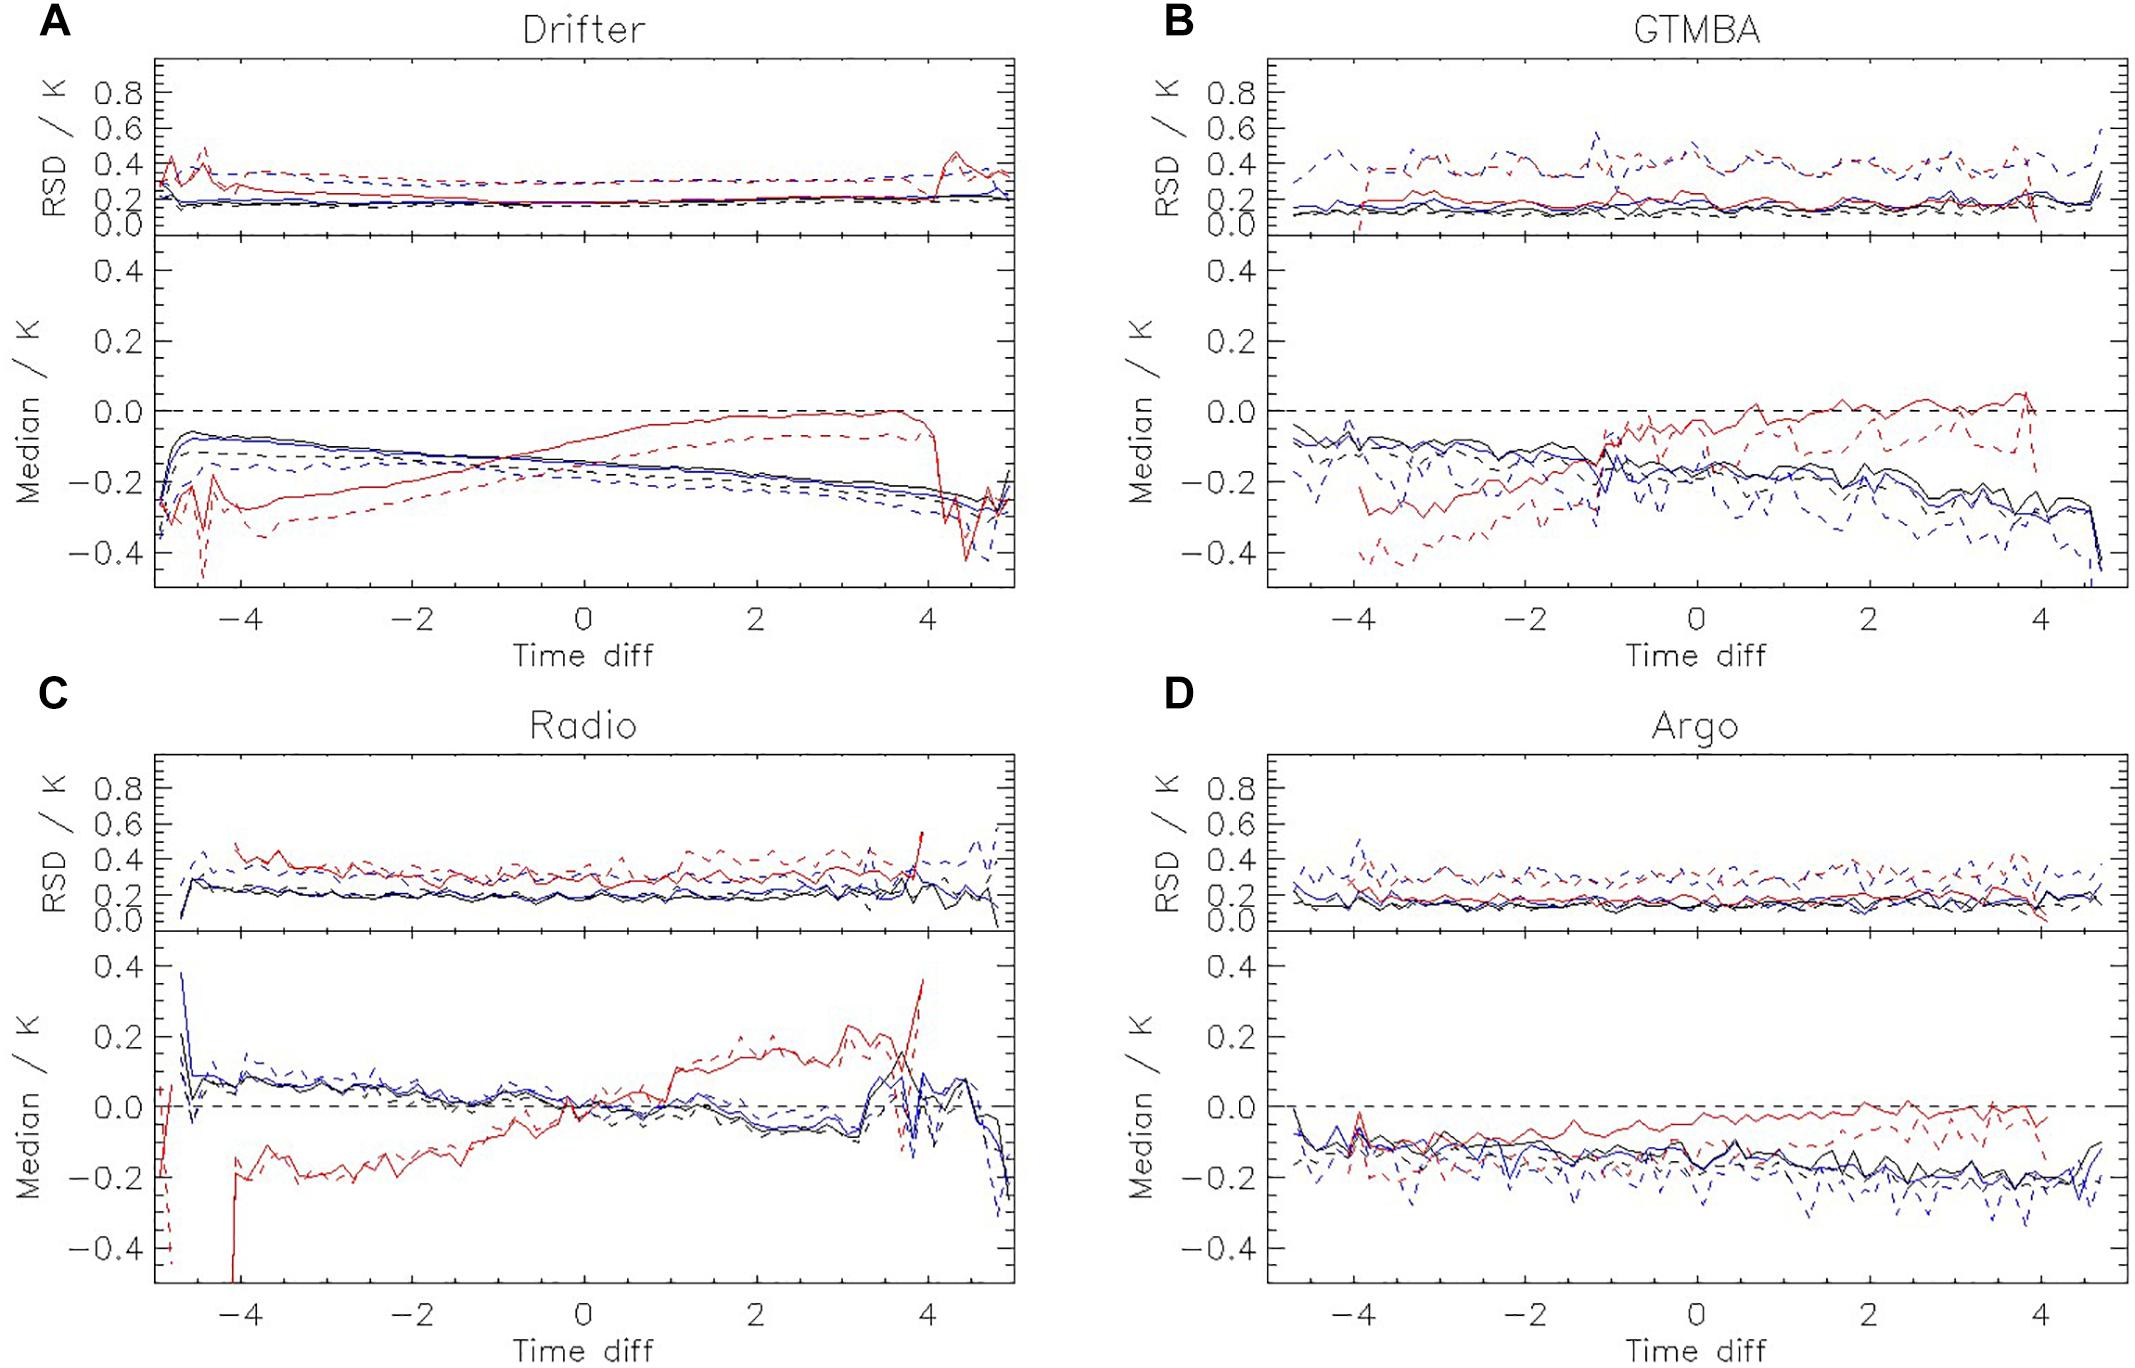
Figure 7. Median (top) and robust standard deviation (bottom) for match-ups between AATSR and (A) drifters, (B) GTMBA, and (C,D) radiometers and Argo floats. Daytime results are shown in red, nighttime in blue and black; solid lines indicate AATSR dual-view retrievals, dashed lines indicate nadir-only. (Reproduced by permission under CC BY 4.0 from https://doi.org/10.6084/m9.figshare.7286216.v1).
Corlett et al. (2014) proposed a new approach to satellite SST validation, by adapting the method of Wimmer et al. (2012) to cover all in situ measurement types and represent contributing terms as uncertainties rather than absolute errors. A benefit of the Corlett et al. (2014) approach is that it also offers validation of the satellite SST uncertainty (see section “Better Uncertainty and Error Estimation” and Figure 5; Lean and Saunders, 2013; Bulgin et al., 2016; Nielsen-Englyst et al., 2018). A continuing challenge is to understand the spatial variability within a satellite SST pixel (Castro et al., 2010) in order to justify assumptions in the treatment of spatial differences between the satellite and in situ data. Minnett (1991) estimated the variability within a pixel to be ∼0.2 K for AVHRR (which has 1.1 km spatial resolution at nadir) and more recently Castro et al. (2017) estimated a mean value of O(0–0.1) K for MODIS (which has 1 km spatial resolution in the thermal IR bands).
Evolving the International SST Service to Users
GHRSST began coordination of operational production and distribution of satellite SST datasets in 2005 governed by the foundational system of shared roles and responsibilities known as the Regional/Global Task Sharing (R/GTS). This framework has been highly successful and continues to operate today. However, the international GHRSST community, in response to ever-growing data volumes, improved national capabilities, and provider-specific data access policies, has established plans to evolve the R/GTS to become a more distributed and federated framework.
In the evolved R/GTS, multiple organizations around the globe will adhere to an agreed-upon set of data discovery, archive, and access standards, to enable the GHRSST Project Office to maintain a consolidated one-stop catalog and data discovery portal, while eliminating the need to physically consolidate the large and growing data volumes. In this new architecture existing systems will collaborate to migrate and evolve existing data, metadata and discovery systems toward this new, distributed system serving the entire community, and to ensure that current and future GHRSST format datasets maintain the required level of interoperability, discoverability, and metadata compliance.
Much of what this new architecture will require in terms of data cataloging, discovery, and access services had already been implemented using open source software and specifications. For example, the NASA Physical Oceanography Distributed Active Archive Center (PO.DAAC) and the NOAA National Centers for Environmental Information (NCEI) have implemented dataset and granule web services using the ESIP Opensearch specification for constructing web service discovery URLs. These services can be “chained” so that dataset to specific granule discoveries can be used as entry points to further data extraction, sub-setting, or visualization via additional web service calls. In addition, well established web services to access both gridded and non-gridded data via THREDDS and OPeNDAP have been implemented.
Users are also able to access a comprehensive tool set for GHRSST format data visualization, extraction and quality monitoring. For example, the PO.DAAC has developed the State Of The Ocean (SOTO8) for rapid data visualization, overlay, and animation and the HiTide9 Level 2 subsetting service for extracting spatial and temporal subset of orbital swath data (see Figure 8). Examples of inter-comparison and data quality tools include SQUAM, iQuam, ARMS and Felyx, previously mentioned in this paper.
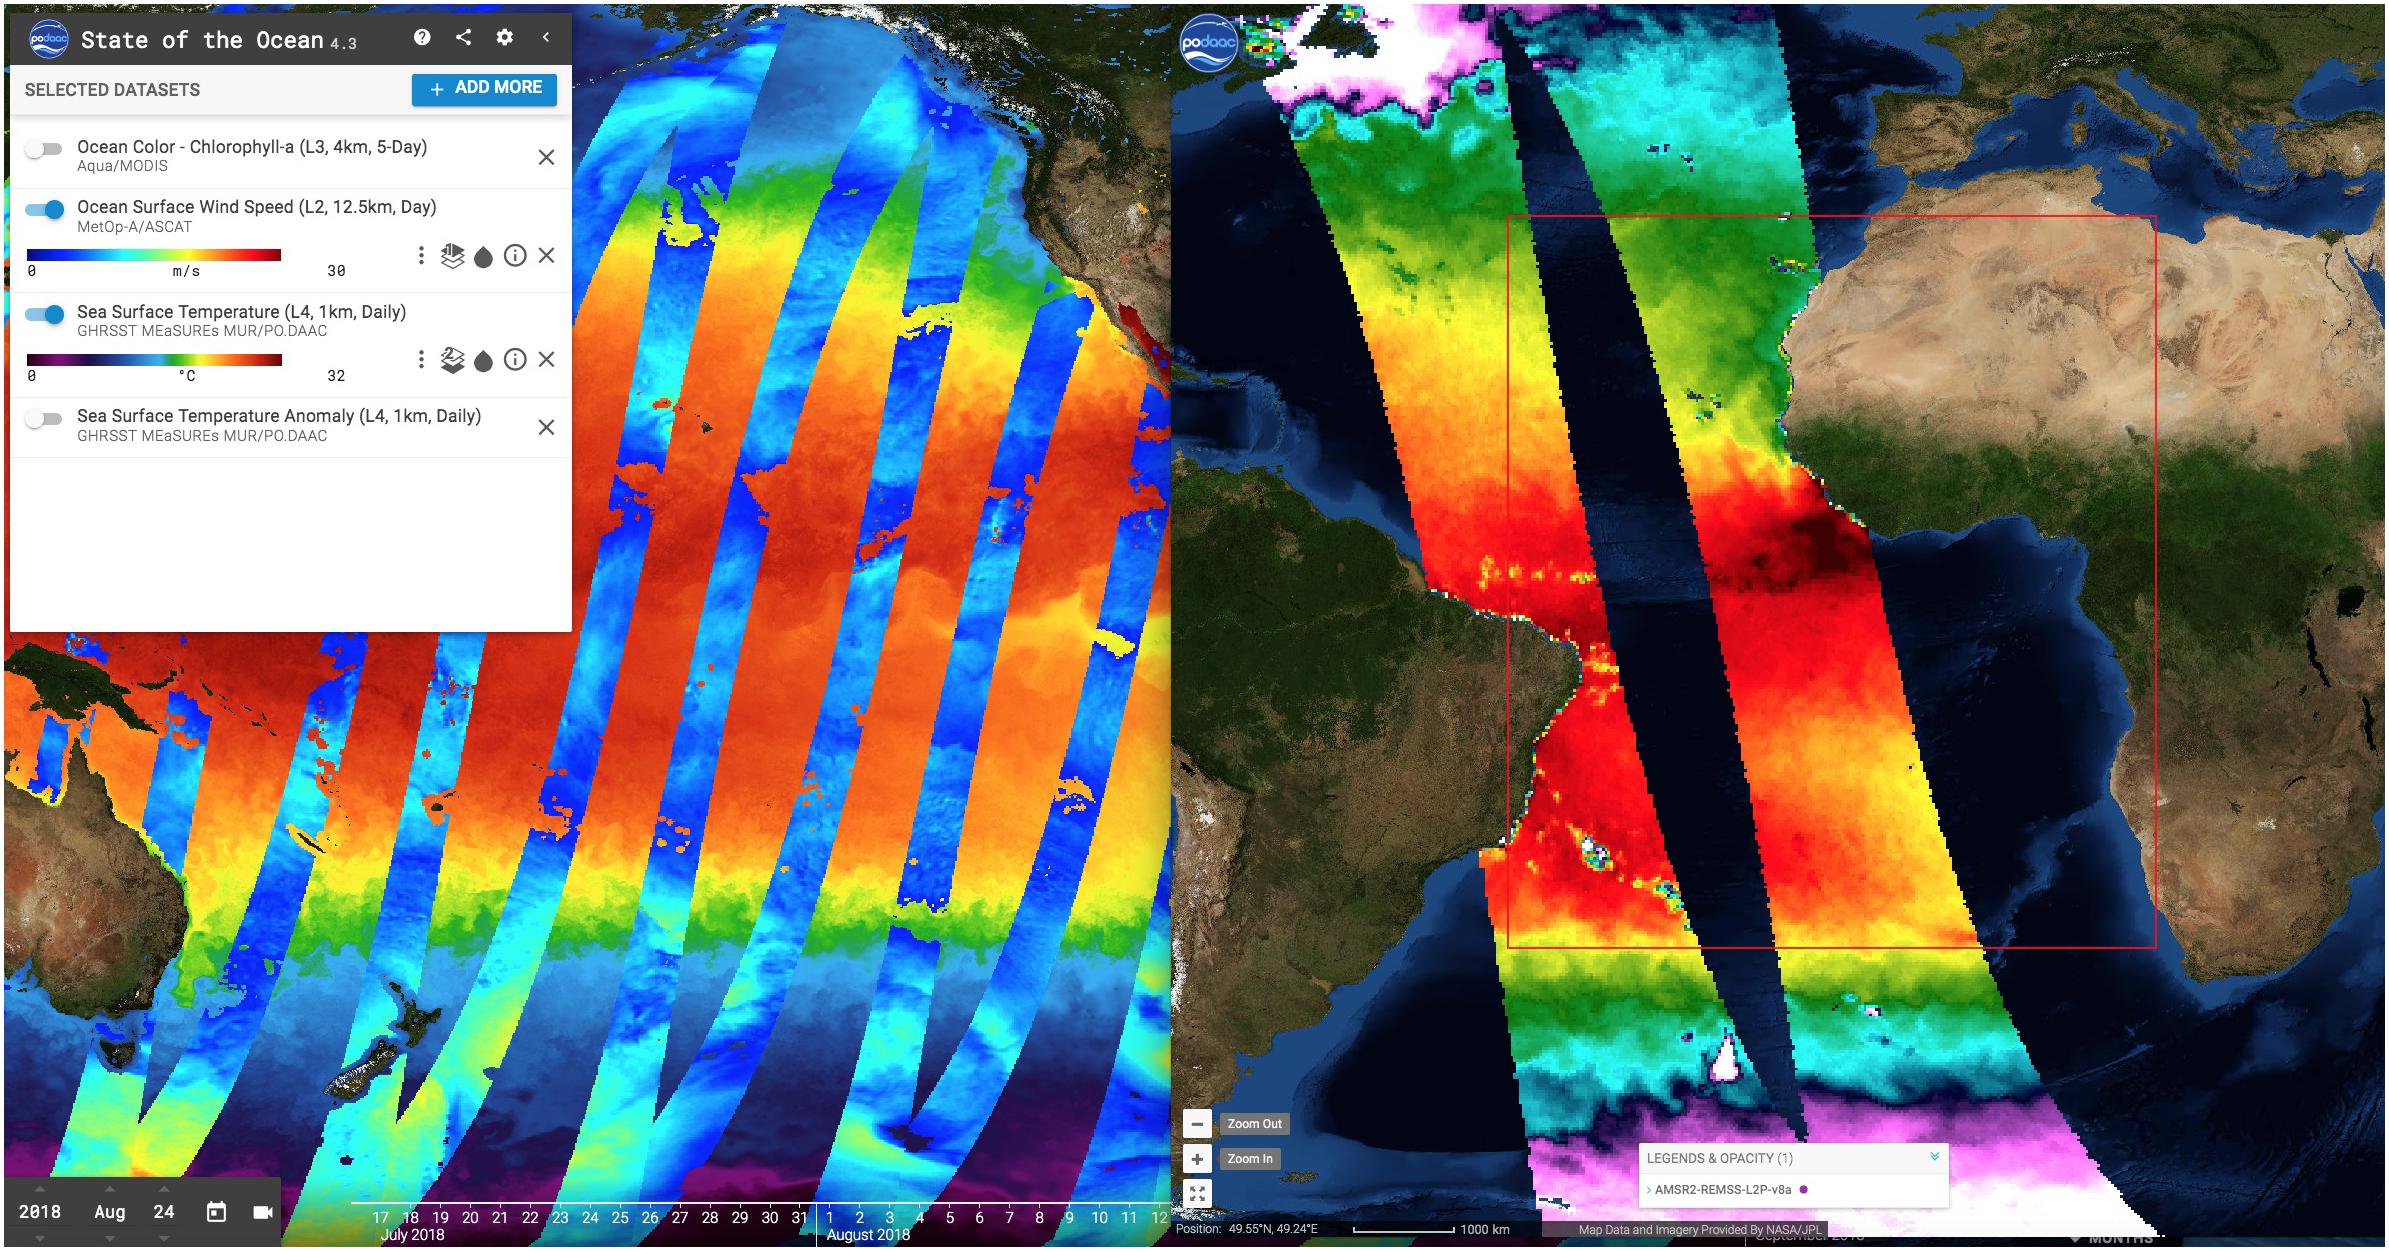
Figure 8. The SOTO visualization tool (left) showing an overlay of ocean wind satellite tracks over a global Level 4 daily SST map juxtaposed with output from the HiTide Level 2 subsetter (right) showing two AMSR2 SST swaths overlapping a region of interest off Africa.
Looking forward to the next decade, given the ever-growing data volumes and need to utilize SST alongside other large volume datasets, the international SST service must also evolve to include cloud computing, storage and access capabilities as well. Users increasingly seek to bring their algorithms and applications to the data, rather than following the traditional model of downloading data and processing it locally. Numerous groups are actively experimenting with or deploying cloud-based SST services, which are expected to become the new normal over the course of the coming decade.
Applications of SST
Satellite derived SST products are used in applications encompassing a wide range of temporal (diurnal to decadal) and spatial (sub-km to global) scales and are required by many user communities with an interest in ocean processes. Daily global high-resolution (<10 km) products are now easily accessible in support of operational forecast systems (Donlon et al., 2009). The ability to resolve mesoscale and submesoscale features is facilitating new applications in coastal regions and frontal detection (e.g., García-Morales et al., 2017; Vazquez-Cuervo et al., 2017). As a result of their rapid sampling, data from GEO satellites facilitates detecting temperature changes on sub-daily timescales (Wick et al., 2002). Long-term SST records (some now approaching 40-years in duration) can be used to observe inter-annual to decadal scale variability (e.g., Liu and Minnett, 2015; Ferster et al., 2018).
A full review of all applications of SST would be a review paper itself. So, in this section we first focus on two of the more established application areas of SST, in support of (1) operational forecast systems and (2) understanding changes to the Earth’s climate over time. Then, we look at three evolving user-driven application areas, which are driving much of the required SST research and development activities for the next 10 years and where SST will play an increasingly more important role.
Application Example 1: Use of SST Observations in Operational Forecast Systems
Understanding the three-dimensional structure of the oceans requires the combined use of satellite observations, in situ observations and ocean numerical models through assimilation techniques. Due to limited coverage of in situ measurements, and assumed systematic errors in numerical weather and seasonal prediction models, satellite observations are required to constrain SST. Together with near-surface wind vectors and ice cover observations, satellite SST can be used to model heat and momentum exchange to characterize the ocean surface and the energy fluxes through it.
Sea surface temperature observations provide boundary conditions for Numerical Weather Prediction (NWP) models, are assimilated into general circulation ocean models, and are used to initialize air–sea coupled models from short (days) to seasonal or multi-year scales. This section summarizes existing and emerging requirements for operational forecast systems for SST.
Numerical Weather Prediction (NWP)
Numerical Weather Prediction uses current conditions as input into mathematical models of the atmosphere to predict the weather. SST affects the behavior of the overlying atmosphere and vice versa and so daily analyses of SST are required by many operational NWP systems (Beggs, 2010). Historically, NWP systems have used gap-free Level 4 SSTs equivalent to ocean temperatures at around 10 m depth (e.g., Puri et al., 2013). This takes no account of the temperature gradient between the air–sea interface and in the upper 10 m and may introduce errors into forecasts (Beggs, 2010). New techniques apply cool-skin and warm-layer models on top of the standard ocean model configuration to predict the actual ocean skin temperature (Gentemann and Akella, 2018). Two-way air–sea coupled weather prediction models have been developed, such as the ECMWF Integrated Forecasting System (IFS)10 and the Met Office Unified Model Global Coupled Model 2.0 (Williams et al., 2015). Satellite SST data are assimilated into an ocean model in coupled systems, which then exchanges data with the atmospheric model, including the dynamic evolution of the SST. In the case of the ECMWF IFS system, the 5 km OSTIA SST analysis (Donlon et al., 2012) is used to initialize the coupled model.
Although the highest spatial resolution global SST analysis used as a boundary condition for NWP is 5 km OSTIA (Donlon et al., 2012), it’s observation correlation length scale is ∼40 km, and unable to resolve meso-scale coastal ocean features. Regional SST analyses have smaller observation correlation length scales (e.g., 12 km for RAMSSA; Beggs et al., 2011), but suffer from a lack of high resolution IR observations in cloudy regions. Impact studies are needed to show whether the prediction of extreme meteorological events over the ocean or land might be improved by using either SST analyses that resolve ocean features at <20 km spatial scales to constrain high-resolution (1–2 km) NWP models, or coupled models at high resolution.
Ocean Forecasting
Marine forecasting is important for defense, public safety and transportation. National forecast centers and naval agencies use SST as input into their marine high seas models, providing forecasts of currents, temperature and salinity fields. These fields are then used for a variety of operational applications (Beggs, 2010). The ocean models range from regional high resolution systems that include tides, and may be updated as frequently as hourly, to global eddy-resolving systems that provide estimates of the ocean state, updated regularly (from daily to monthly), providing forecasts from a few days to one month in advance (Dombrowsky et al., 2009). An example of a forecast from an operational, eddy-resolving, ocean model is shown in Figure 9. For 2018, with respect to drifting buoy observations typical RMS errors of forecast SST from operational ocean models ranged from 0.45 K at forecast day 1 to 0.55 K at day 611.
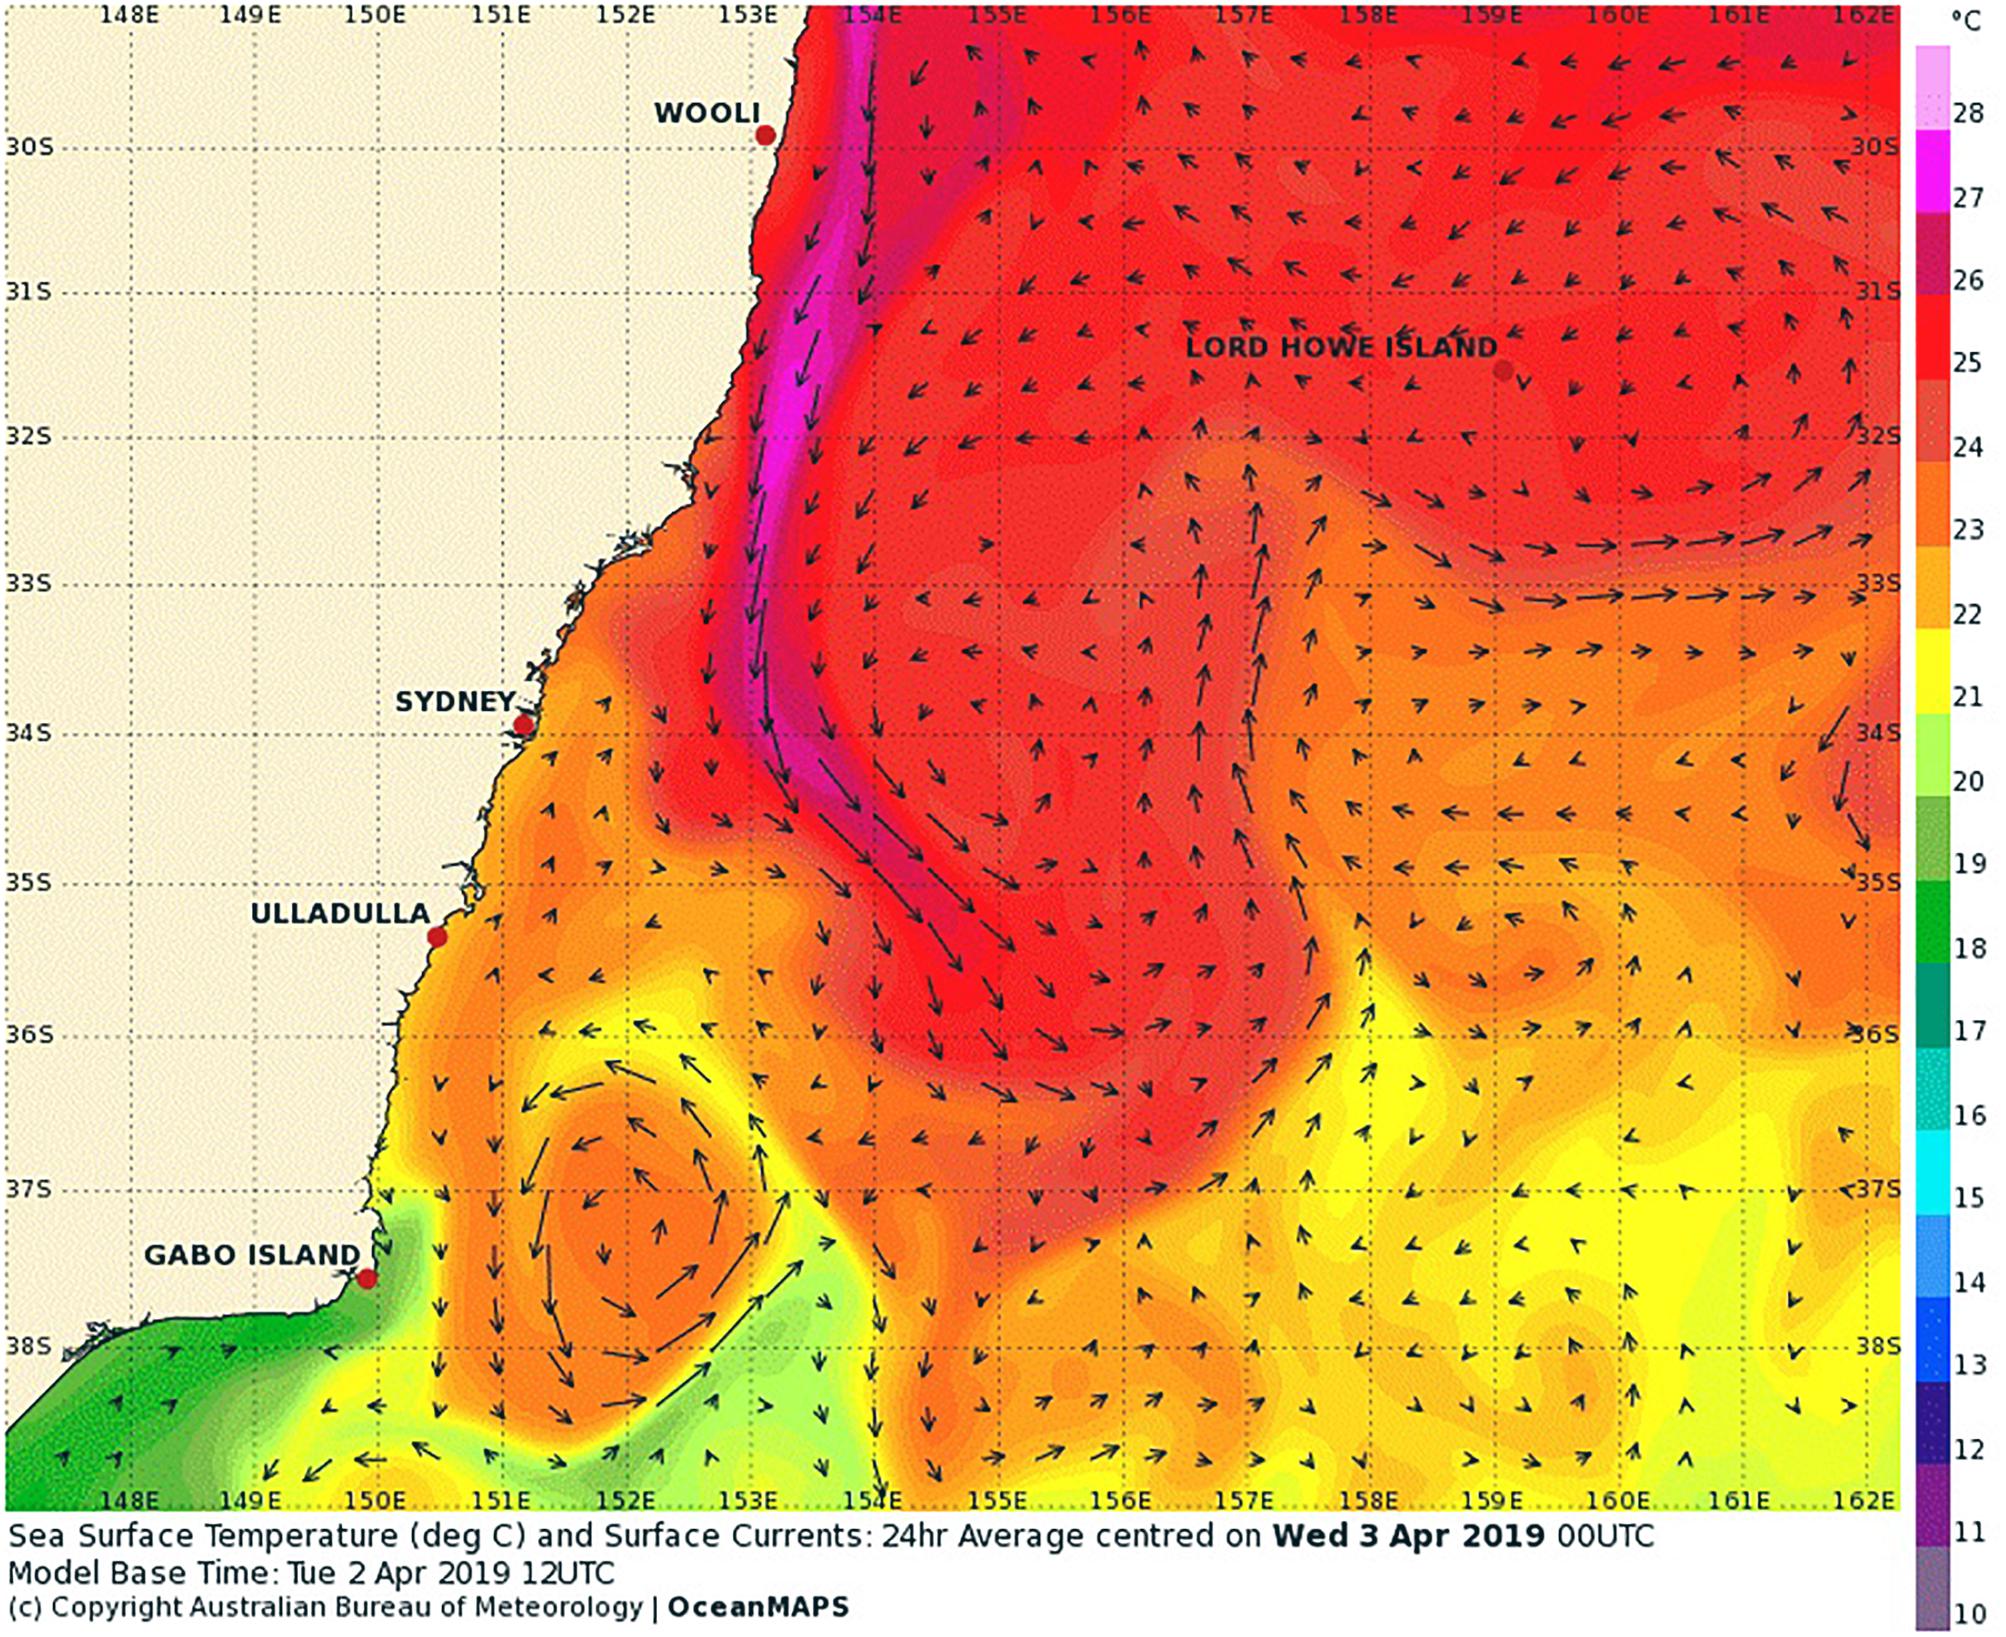
Figure 9. Daily averaged forecast SST and surface currents in the East Australian Current, centered on April 03, 2019, obtained from the Bureau of Meteorology’s operational OceanMAPS ocean model, with a model base time of April 02, 2019 12 UTC. (Sourced from http://www.bom.gov.au/oceanography/forecasts/, accessed on April 03, 2019; reproduced by permission of Bureau of Meteorology, © 2019 Commonwealth of Australia).
SST strongly co-varies with the ocean temperature over the ocean mixed layer depth, of the order 50–100 m, and complements altimetry data in multi-variate ocean analyses (Brassington, 2009). Short-range ocean forecast systems assimilate satellite SST data; high resolution coastal ocean models require geostationary data. Long time series satellite SST are also assimilated by global and regional forecasting systems to produce ocean re-analyses (Palmer et al., 2017) and to provide information on the state of marine environment for policy and decision-makers (von Schuckmann et al., 2016). The forecast performance of operational ocean models is now critically dependent on satellite-derived SST observations having excellent coverage, high accuracy and low latency. The reduction in errors following assimilating NPP VIIRS SST into ocean models has demonstrated the significance of accurate SST, and the dependence of ocean prediction on this instrument (Gary Brassington, pers. com.) Ocean forecasting will also benefit from improvements in satellite SST cloud clearing algorithms to preserve cool ocean features, such as coastal upwelling. Reducing the footprint from microwave instruments and improving their SST accuracy will significantly benefit ocean forecasts, particularly in coastal and tropical regions. Improving temporal coverage and accuracy of SSTs from geostationary satellites will help to constrain diurnal processes in higher resolution ocean models.
Seasonal and Inter-Annual Forecasting
Operational centers also issue seasonal forecasts out to several weeks to months (Balmaseda et al., 2009). Most seasonal forecasting systems are based on coupled ocean-atmosphere general circulation models that predict SSTs and their impact on atmospheric circulation, and assimilate SST as part of their initial conditions. The aim of seasonal forecasts is to predict anomalies from the historical average for the forthcoming seasons (Balmaseda et al., 2009). The strongest relationship between SST patterns and seasonal weather trends are found in tropical regions (Beggs, 2010). Although most operational seasonal prediction models have horizontal spatial resolutions over the ocean of the order of 100 to 200 km, recently, higher resolution coupled models have forecast the ocean state at weekly temporal resolution and 25 km spatial resolution (e.g., MacLachlan et al., 2014; Hudson et al., 2017). Seasonal forecasts from coupled ocean-atmosphere models can be used to predict anomalous SST several months in advance12.
Application Example 2: The Modern Era and Historical SST Climate Data Records
Linking the satellite SST record to the historical in situ SST record is important to develop coherent CDRs. This is complicated by changes over time in both measurement systems. Early (e.g., 1800s) in situ measurements are from sailing ships and now the in situ system is comprised of measurements from ships, drifting and moored buoys, profiling floats and some other elements. Long-term satellite SST records are affected by constellation changes (sensors may be replaced, instrument calibration and satellite orbits may drift and instrument channels may fail). To assess any impact of variations between sensors on the overall long-term satellite record the GCOS recommends that “continuity of satellite measurements through appropriate launch and orbital strategies should be ensured” (GCOS, 2011) with at least 6-months overlap between successive sensors in order to develop homogeneity adjustments. Available satellite data holdings have not always met this minimum, and a full annual cycle of overlap would always be more robust. CDR requirements (Ohring et al., 2005) are very demanding to achieve and as is demonstrating whether the goals have been met (Merchant et al., 2017).
The long-term satellite SST record known as “Pathfinder” (Casey et al., 2010) utilizes empirical regression algorithms (Kilpatrick et al., 2001) tuned to drifting buoys to provide a self-consistent approach across the series of AVHRRs from NOAA-7 onward. Although there have been some sensor overlaps in the series, Pathfinder is constructed from a single AVHRR sensor at any one time, and the tuning to in situ data is primarily to account for the many instrumental issues observed in the series, including errors in calibration (Mittaz et al., 2009). The latest version of Pathfinder is Version 5.3 and future developments of Pathfinder will be found in the version 6.0 dataset, including latitudinal banded coefficients to reduce latitudinal biases (Merchant et al., 2009a). In addition to Pathfinder, other AVHRR-only SST time-series include the NOAA science quality AVHRR GAC Reanalysis-1 (RAN1; Ignatov et al., 2016) and a regional Mediterranean product (Pisano et al., 2016).
The ATSR Reprocessing for Climate (ARC) project (Merchant et al., 2012) utilized the ATSR series of sensors, which were designed for providing SST suitable for climate studies. ARC differs from Pathfinder and AVHRR RAN in that it maintains independence from in situ measurements, has performed a careful harmonization of the BTs from successive sensors, and employs a physics-based retrieval of SSTskin using a Radiative Transfer Model (RTM) (Embury et al., 2012a, b). This then allows independent validation of the dataset using in situ measurements, accounting for depth and diurnal effects, both before (Embury et al., 2012b) and after harmonization of the ATSR BTs. Merchant et al. (2012) demonstrated how ARC is capable of quantifying inter-annual variability in SST and identifying major SST anomalies. However, the timespan of the ATSR series (1991–2012) compared to the AVHRRs is a limitation. The ESA SST_CCI project (Merchant et al., 2014) has pioneered using the ATSRs to reduce BT errors in the AVHRRs and in derived SSTs, providing a stabilized dataset of both ATSR and AVHRR for the period they co-exist (1991–2012). The next version product from SST CCI will extend backward and forward from the ATSR period using consistent physically based retrievals for all AVHRRs.
The possibilities for long-term satellite SST records will increase over the next 10 years, as new sensors such as VIIRS provide a capability to extend existing data records from the MODIS series (Kilpatrick et al., 2015). These more recent satellite records can then be linked to the longer term records from AVHRR (Figure 10). In addition, new high spatio-temporal resolution climatologies are required in order to fully understand air–sea interactions across all relevant scales, for which an attractive approach will be to combine polar and geostationary observations consistently. While research will be required on newer sensors, the total length of record is a key parameter of CDR users, and can be maximized by work to extend the satellite SST record back to 1978 (the earliest feasible time). It is essential that this early record be addressed with well-characterized uncertainty and stability, taking advantage of advances in inter-satellite re-calibration techniques, the full SST-relevant historic observing system and advances in radiative transfer and numerical weather reanalysis.
Figure 10. Annual median and interquartile range of satellite SSTskin versus SSTdepth from drifting buoys for a combined timeseries of AVHRR Pathfinder SSTs from NOAA-7 to -19, MODIS on Terra and Aqua, and S-NPP VIIRS.
User-Driven Priorities for SST Observations Over the Next Decade
In this section, we summarize three application areas identified by SST users as being of high priority for SST developments in the next decade and focus on one specific priority in each area that requires research and development. The application areas are:
(1) Improving SST data quality in the Arctic: Arctic Amplification of the climate change signal requires understanding its cause and improving our ability to make more accurate predictions, including quantification of feedback processes operating in the Arctic Ocean. Included in the Arctic system is a temperature feedback (Pithan and Mauritsen, 2014), and better understanding of this requires more accurate SSTs. Coverage from IR sensors is poor mainly due to persistent cloud, so a priority is to improve PMW data coverage at high latitudes.
(2) Improving coastal SST data quality: Coastlines and coastal communities are under threat so improved understanding of coastal marine processes is of vital importance, and high resolution SST that can reveal mesoscale and sub-mesoscale features will make an increasingly important contribution. A priority is to use other satellite datasets (e.g., from ocean color or very high spatial resolution from Landsat) to help address limitations of SST products owing to severely limited in situ data.
(3) Improving SST feature resolution: Identification of ocean fronts for understanding air–sea exchanges (e.g., Cronin et al., 2019) requires better measurements, including high-resolution SST. Also, understanding changes in small scale ocean features such as coral reefs, requires improved high-resolution SSTs. The lack of high-resolution SST features is due to most SST analysis systems smoothing features as their original heritage is to support NWP, so a priority is to develop new methods to retain high resolution features in analyses.
The Challenges of SST Provision in High Latitude Regions
SST retrievals at high latitudes are difficult for a number of reasons. IR and PMW SSTs require in situ datasets for algorithm development, validation, and fine-tuning, and measurements of in situ SST are sparse at high latitudes, and often lack coincident atmospheric observations critical for algorithm development. Without adequate sampling of the variable atmospheric and oceanic conditions, IR and PMW algorithms rely on the data that is too sparse in time and space, creating unknown errors in conditions outside the relatively narrow range of existing observations. There are additional complications, for example, recent PMW missions lack a 6.9 GHz channel that retains useful sensitivity below 13°C, which includes most regions poleward of 60° latitudes. Without a 6.9 GHz channel, errors increase by 0.5°C (Gentemann et al., 2010). Additionally, accurate identification of sea ice can be difficult. Thin sea ice can form quickly, over large areas, and may not be accurately mapped by daily sea ice maps (Kwok et al., 2003). Identification of floating icebergs can also be difficult as some are sub-grid scale. Sea ice remains an issue for both IR and PMW data, with the PMW having the further complication of sidelobe contamination when sea ice is present near the observation footprint. A further complication comes from Arctic dynamics. River and sea-ice melt freshwater input to the Arctic can result in strong salinity gradients adding to errors in SST retrievals. The long high latitude night time can result in difficulty identifying cloud contaminated pixels and results in a seasonal dependence in the accuracy of IR retrievals. Figure 11 shows an example of the data coverage of all available infrared satellites during one day for the sea ice minimum in September 2012, together with simulated Copernicus Imaging Microwave Radiometry (CIMR) coverage for the same period.
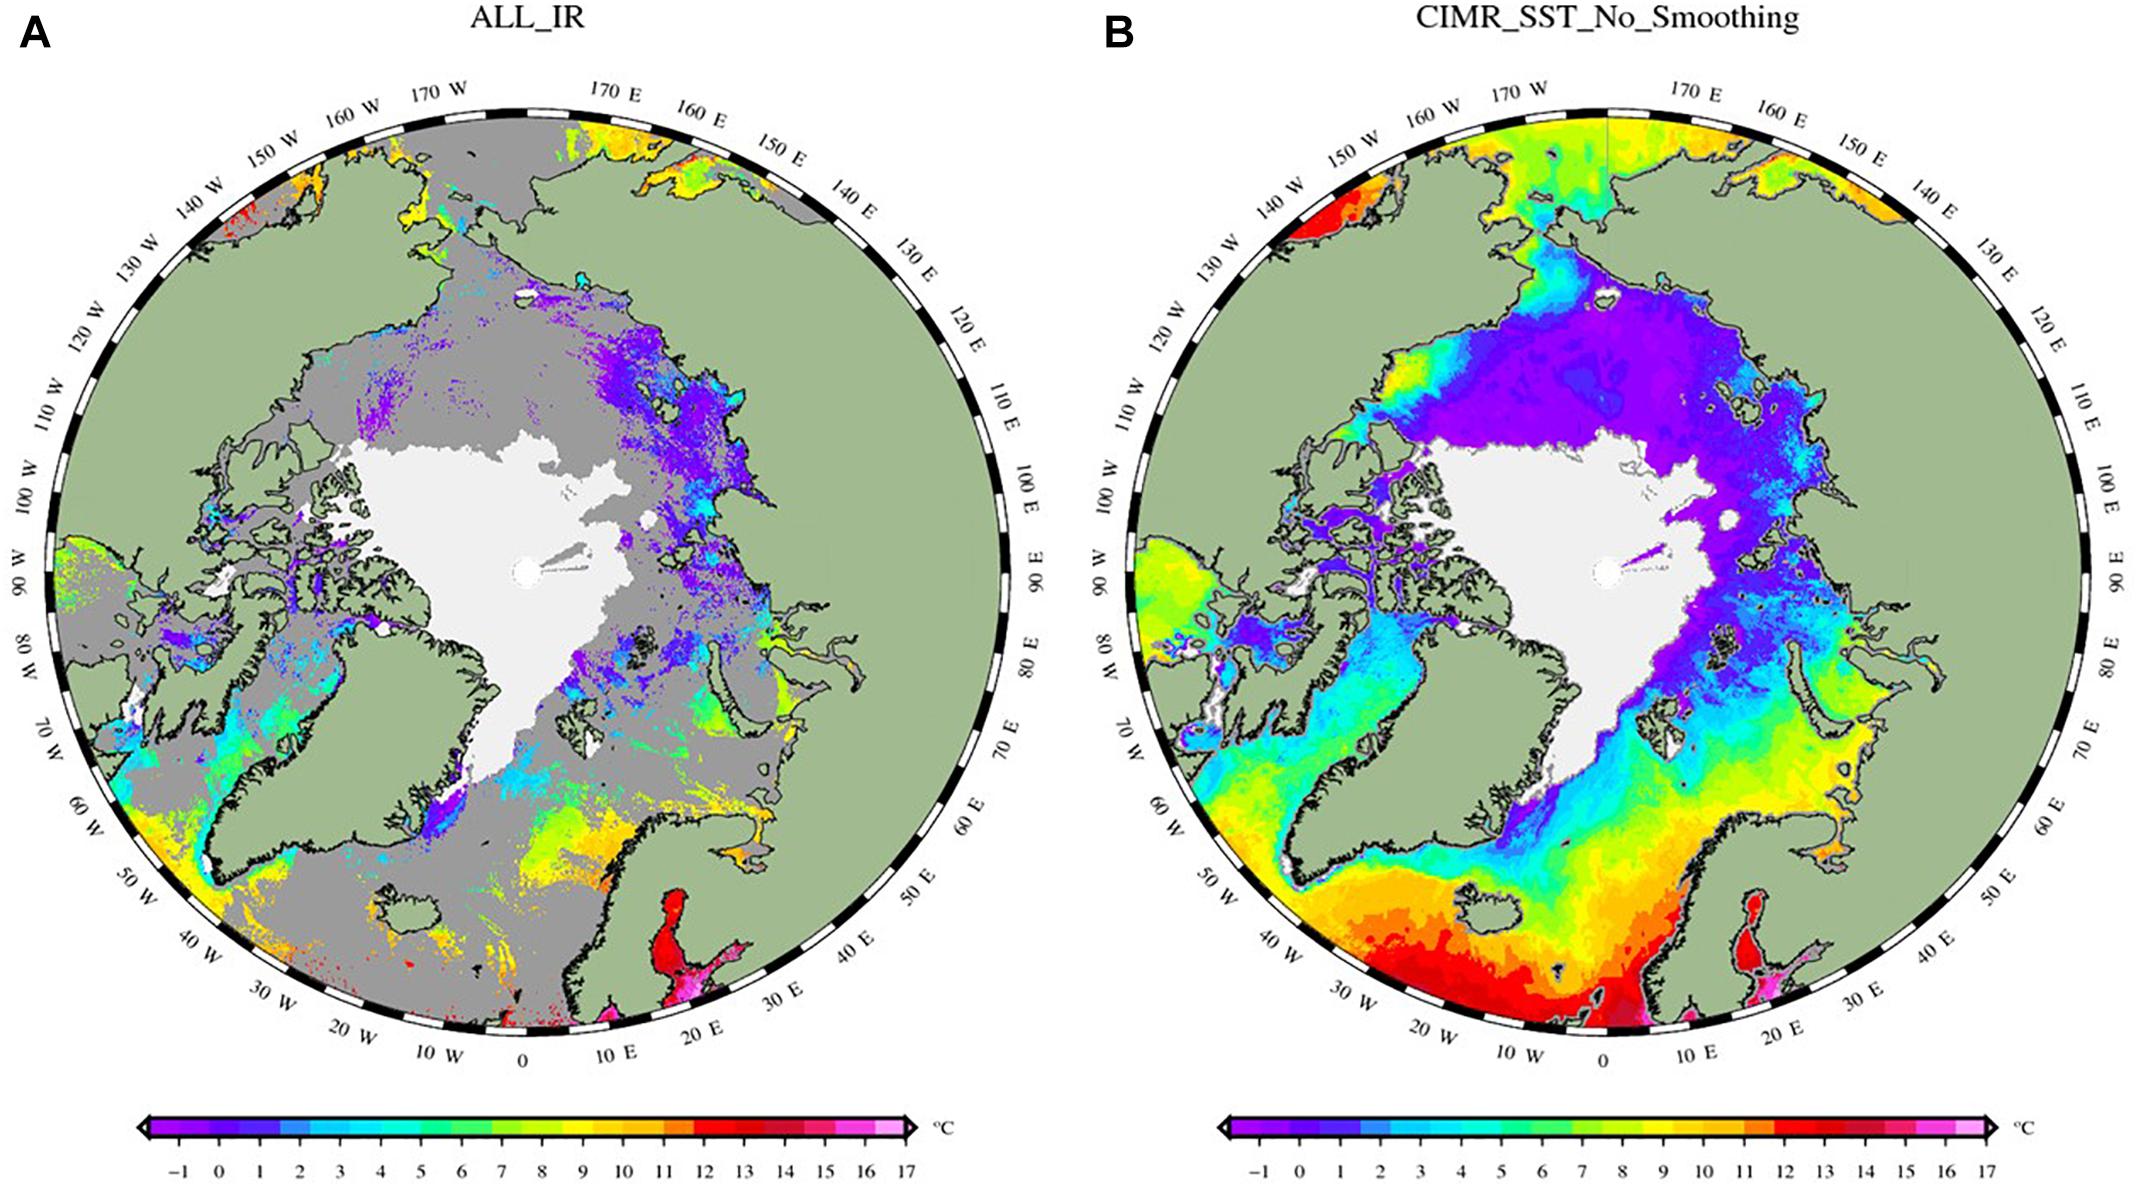
Figure 11. Data coverage of (A) all available Infrared satellites during the sea ice minimum in September 2012 (taken from Copernicus Marine Environmental Services (CMEMS) data production). (B) Simulated CIMR coverage for the same period. (Reproduced by permission under CC-BY 4.0 from https://doi.org/10.6084/m9.figshare.6969422.v1
User case study 1: improved PMW observations at high latitudes
Frequent observations of SST and other related variables in the Arctic and Antarctic Oceans are only practical via microwave imaging instruments. SST and other measurements are crucial to describe the seasonal and long-term variation of the polar sea ice caps. The long-term decline of sea ice has been monitored and quantified by satellite MW radiometer measurements over the past 30 years.
The continuation of PMW imagers that can be used to derive global SST is currently a major concern. SST under all weather conditions (except precipitation) can be derived from 6–10 GHz channels. The challenge is to provide such measurements at higher spatial resolution and with high radiometric fidelity to serve modern operational needs. As of 2019, the Chinese Microwave Radiometer Imager (MWRI) onboard the HaiYang-2B (HY-2B) is the only approved future PMW imager that has a 6.9 GHz channel. The Chinese FengYun-3 series (FY-3D and FY-3F) also has a 10.65 GHz channel. Those two missions may fill possible gaps in microwave SSTs, but their spatial resolutions are three times coarser than for AMSR2: 150 × 90 km for HY-2B, and 51 × 35 km for FY-3. Another possibility to fill this gap is the JAXA GOSAT3 satellite which will carry the AMSR2 follow-on, AMSR3, and is currently a pre-project phase (Phase A) and expected to become “project” later in 2019. The orbit of GOSAT-3 satellite will be 666 km altitude (same as GOSAT-1) at 13:30 local time (same as GCOM-W). AMSR3 is almost equivalent to AMSR2 (antenna size, channels) with additional higher frequency channels of 166 and 183 GHz for snowfall retrievals and water vapor analysis.
A new radiometer, CIMR, is currently being studied by the European Space Agency (ESA), responding to the need to expand the Copernicus satellite fleet driven by user requirements. CIMR addresses requirements to monitor the rapidly changing Arctic environment, providing evidence to underpin the Integrated European Union Policy for the Arctic. The CIMR mission would deploy a wide-swath (>1900 km) conically scanning multi-frequency microwave radiometer. CIMR measurements will be made using a forward scan arc followed ∼260 s later by a second measurement of the same location using a backward scan arc. Full Stokes channels centered at 1.414, 6.925, 10.65, 18.7 and 36.5 GHz are included in the mission design. The real-aperture resolution of the 6.925/10.65 GHz channels is <15 km, 5 and <5 km for the 18.7/36.5 GHz channels respectively. The 1.414 GHz channel will have a real-aperture resolution of <60 km (fundamentally limited by the size of the ∼8 m deployable mesh reflector). However, channels will be oversampled allowing gridded products to be generated at much better spatial resolution. Channel NEdT is 0.2–0.8 K with an absolute radiometric accuracy goal of ∼0.5 K. CIMR will fly in a 06:00/18:00 dawn-dusk orbit providing access to the foundation SST. With one satellite, ∼95% global coverage every day (except for rain conditions), better than daily coverage poleward of 55° N and S, and no gap at the pole itself. The mission will operate in synergy with EPS-SG mission so that in regions >65° N and S, collocated and contemporaneous measurements between CIMR and complementary sensors on EPS-SG measurements will be available within ±10 min. The mission is currently completing Phase B1 and is expected to initiate Phase B2 in 2020 for a planned launch of the first of two satellites in 2026+.
The combination of both the AMSR2 follow-on and CIMR missions are highly complementary and would provide an unprecedented coverage and revisit time of the global ocean.
The Challenges of Systematic SST Observations Over Inland Seas, Lakes and in the Coastal Zones
Challenges of systematic water temperature observations over the inland seas, lakes and in the ocean coastal zones include: greater variability in atmospheric water vapor, temperature and aerosol than over most of the ocean; avoiding (or accounting for) land contamination since most lakes and rivers are of scales not resolved or not well resolved by SST sensors; water surface contaminants and any modification of surface emissivity; and turbidity in interaction with cloud detection. Regarding the latter, products are prone to over-masking during crucial Spring-Summer warming phase, and to screening of cold, clear water, leading to systematic observation bias (Crosman et al., 2017). Problems in satellite-based lake temperature products arise when applying “global” cloud detection and SST retrieval algorithms (optimized for the open ocean, where the atmosphere is usually close to equilibrium with the water surface). Inland water-specific methodologies are promising for derivation of Lake Surface Water Temperatures (LSWT) (e.g., MacCallum and Merchant, 2012; Crosman et al., 2017; Woolway and Merchant, 2018) although their application to rivers has been less well explored.
Satellite-derived LSWT can be assimilated into coupled models to produce more accurate local weather forecasts. The opportunity exists to evaluate LSWT products in regional models, which should enhance our ability to account for strong local effects exerted on the forecast. Possible ways are proposed to improve products, such as tailored QC filters to mitigate effects of increased retrieval error with a relaxed cloud mask. Such effects are likely to be regional and seasonal. Prospects for reducing error due to anomalous atmospheres (e.g., cool lake surrounded by warm land, or vice versa), emissivity differences, diurnal warming (water turbidity, wind speed, insolation) focus on retrievals informed by prior information used in a physical method, such as Modified Total Least Squares (MTLS; Koner et al., 2015) or optimal estimation (MacCallum and Merchant, 2012). These methods account for background variability, MTLS doing so via dynamic estimation of the regularization of the inversion. Both provide mechanisms for additional QC and pixel-level uncertainty estimation.
User case study 2: the impact of pollution on sea surface temperature (SST) along the coast of the Gulf of Guinea of West Africa
The Gulf of Guinea (GOG) is a maritime area located off Western Africa covering ten countries – Togo, Ghana, Benin, Nigeria, Cameroun, Gabon, Equatorial Guinea, Sao Tome and Principe, Congo and Angola. The area of the GOG is about 2.35 million km2 and has its major contributing freshwater inputs from the Volta and Niger rivers. The GOG is recognized for its economic importance. However, its vast resources, especially of the coastal ocean, have been heavily affected by rapid development of human activity (Scheren et al., 2002). Hazardous discharges of liquid and solid waste into the coastal oceans from urban expansion and developments, agriculture and sewage, oil exploration activities, dredging of channel, seismic surveys and pipelines (Spalding et al., 2010), have left the natural coastal zone of the GOG unsuitable to support its economic activities. This has resulted in significant eutrophication and heavy metal contamination. Polidoro et al. (2017) estimate that out of the 125 species of fish in the GOG, 33% are affected by pollution, leading to a significant impact as significant as unsustainable fishing. Solid waste entering the GOG annually is estimated at 3.8 million T/year according to research by Scheren et al. (2002). The dominant items are plastics comprising about 62% of the waste related to fishing activities, including plastic carrier bags and packaging materials. About 80% of industrial effluents directly into the lagoon systems through pits, gutters and trenches (Scheren et al., 2002). Research conducted by Eriksen et al. (2014) has shown that plastic pollution is another key challenge for the oceans.
In order to properly model the distribution of ocean pollutants across the GOG and to be able to aid the identification and understanding of the evolution of such features, access to high spatial resolution satellite imagery is needed from multiple sources. It is expected that Chlorophyll-a will be a useful proxy in areas closer to the sources of pollutants and that SST will be a suitable proxy to track the evolution of the discharge across the GOG. Figure 12 shows the variation of both SST and Chlorophyll-a (Chl-a) variations over the period 2000–2017 from annual averages. Maximum values of Chl-a are located in coastal zones where concentrated discharges of pollutants occur. However, SST maps in the same region show significant variability across all years. Consequently, little correlation between the SST/Chl-a maps and the evolution of the plastics is found. Access to time-series of higher spatial resolution satellite imagery of these regions will help to better distinguish sub mesoscale ocean features and better understand the limited correlations seen in the products as a way to track the evolution of pollutants.
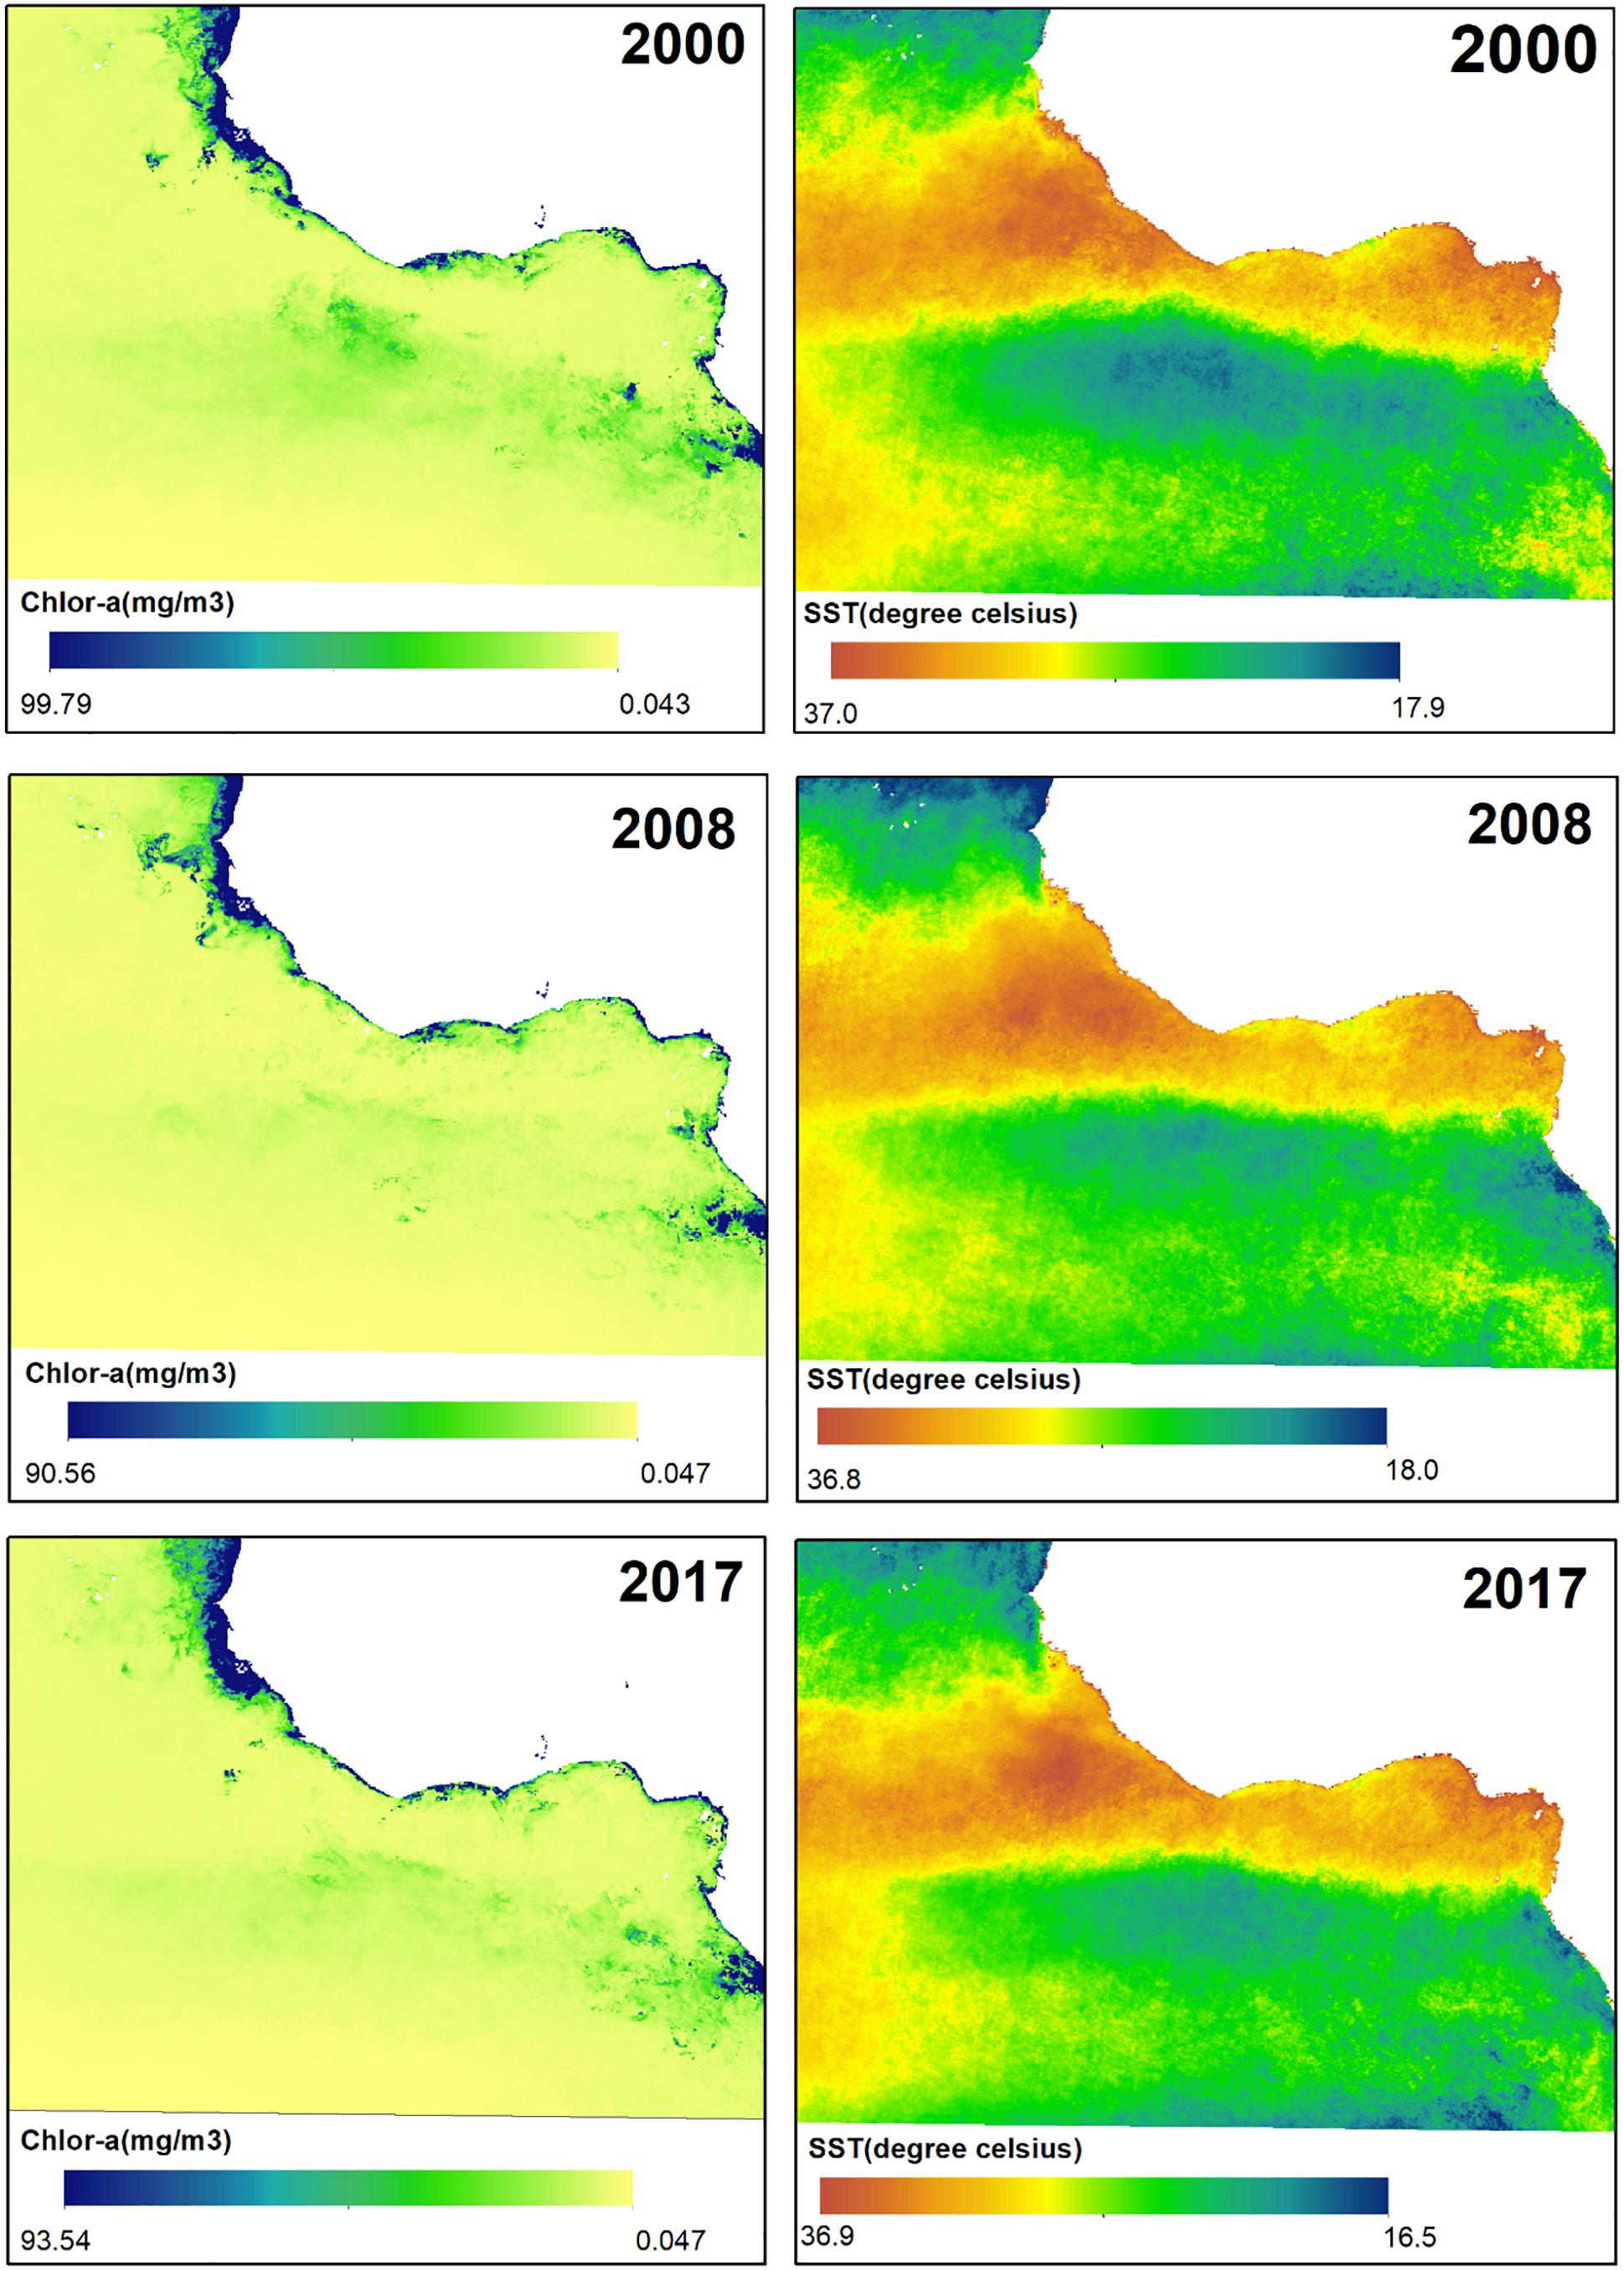
Figure 12. Variations of Chl a and SST from 2000 to 2017.
The Challenges of Providing Global High Resolution SSTs
Increased modeling and observational efforts from the physical oceanography community have recently been dedicated to the study of ocean sub-mesoscale dynamics. This is due to the growing evidence that processes occurring at small spatial and temporal scales [i.e., O(∼1 km and ∼1 day)] are relevant for large scale ocean dynamics and thus affect weather and climate variability (Ferrari, 2011; Levy et al., 2012). This includes significant interest in the sub-mesoscale from potential biological and biogeochemical impacts on primary production, planktonic ecosystems and ocean carbon transport (Levy et al., 2012; Woodson and Litvin, 2015). Despite the major benefit of near global coverage, low spatial resolution SST fields derived from PMW instruments do not allow the observation of geometrical structures associated with sub-mesoscale processes. Such features are commonly seen in images acquired from GEO and LEO IR sensors provided clear-sky conditions are met. A spectral analysis of SST analyses is required to relate the true ocean variability, including methods to discriminate between signal and noise in these data with high spatio-temporal frequencies.
The impact of persistent clouds in IR SST datasets in SST analyses can be partly overcome through the additional ingestion of PMW SST (Donlon et al., 2011), multi-scale techniques (Buongiorno Nardelli et al., 2013) or the use of high-resolution data within a larger time window (Haines et al., 2007). However, the resulting multi-sensor gap free SST fields usually suffer from at least one of the following limitations: over-smoothed SST fields due to the spatio-temporal interpolation, with smoothing scales varying both in space and time (Lekouara, 2013); processing artifacts in the form of spatial patchiness due to imperfect bias correction, retrieval errors, or errors in masking erroneous retrievals (rain, clouds, sea ice or radio-frequency-interference). While these drawbacks do not directly affect the statistics of SST, the analysis of SST gradients and the detection of fronts in optimally interpolated SST analyses is greatly affected.
User case study 3: reconstruction of daily cloud free MODIS SST over South Eastern Arabian Sea
High resolution SST products rely on IR sensors more than PMW due to the latter’s larger footprint, relatively lower accuracy, and inability to derive SST close to coasts; IR sensors are themselves limited by cloud cover that results in significant data loss and poor data quality. The effect is largest in the tropics where cloud cover is more persistent even compared to higher latitude regions (NASA, 2018). Optimal Interpolation (OI) and data assimilation techniques are traditionally used to provide gap-free datasets. These approaches are often complex and based on a number of assumptions and parameterizations (Miles and He, 2010; Zhao and He, 2012; Fablet et al., 2018). An alternate approach is to use Data Interpolation Empirical Orthogonal functions (DINEOF) (Beckers and Rixen, 2003; Alvera-Azcárate et al., 2005, 2007), which can fill gaps in SST fields even if major portions of an image are cloudy. An example is shown for before and after the DINEOF in Figure 13, respectively, showing Aqua MODIS daytime SST data for the south eastern parts of Arabian Sea from 2006 to 2015. Following Alvera-Azcárate et al. (2007), the images with more than 95% cloud cover were discarded. For the entire period, 77.7% data was missing due to cloud.
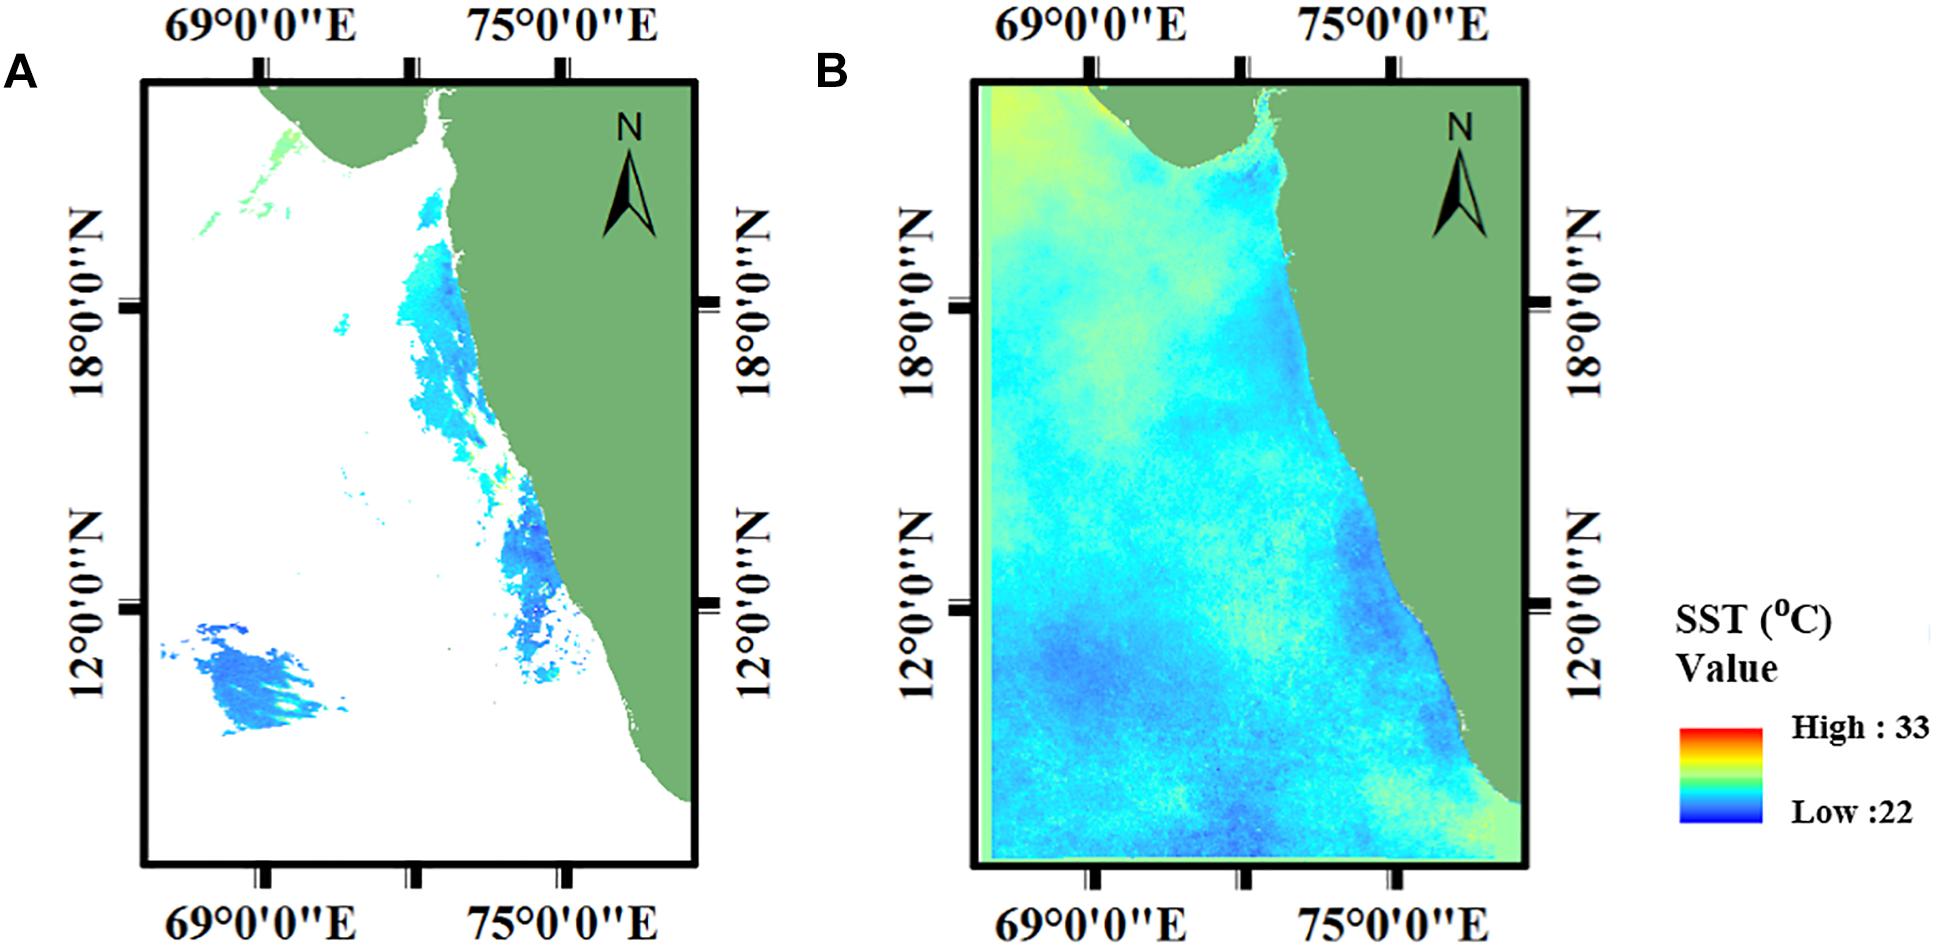
Figure 13. Illustrative example for user case study 3 (A) The MODIS Aqua image with gaps. (B) Reconstructed SST image using DINEOF, both corresponding to the date November 30, 2015.
Validation statistics of the reconstructed DINEOF cloud free images have a coefficient of determination is 0.62 and an RMSE of 0.79°C when compared to in situ data, as shown in Figure 14. No adjustments have been made to account for differences in the depth and time of the satellite and in situ SSTs, which will contribute to the observed differences, as well as differences due to the spatial offsets between the in situ data points and the footprints of the satellite image (Zhao and He, 2012). DINEOF based reconstructed SST datasets perform well and can be used to fill gaps in IR SST datasets due to persistent cloud. Further research is required to use this method as a pre-processing step into an SST analysis.
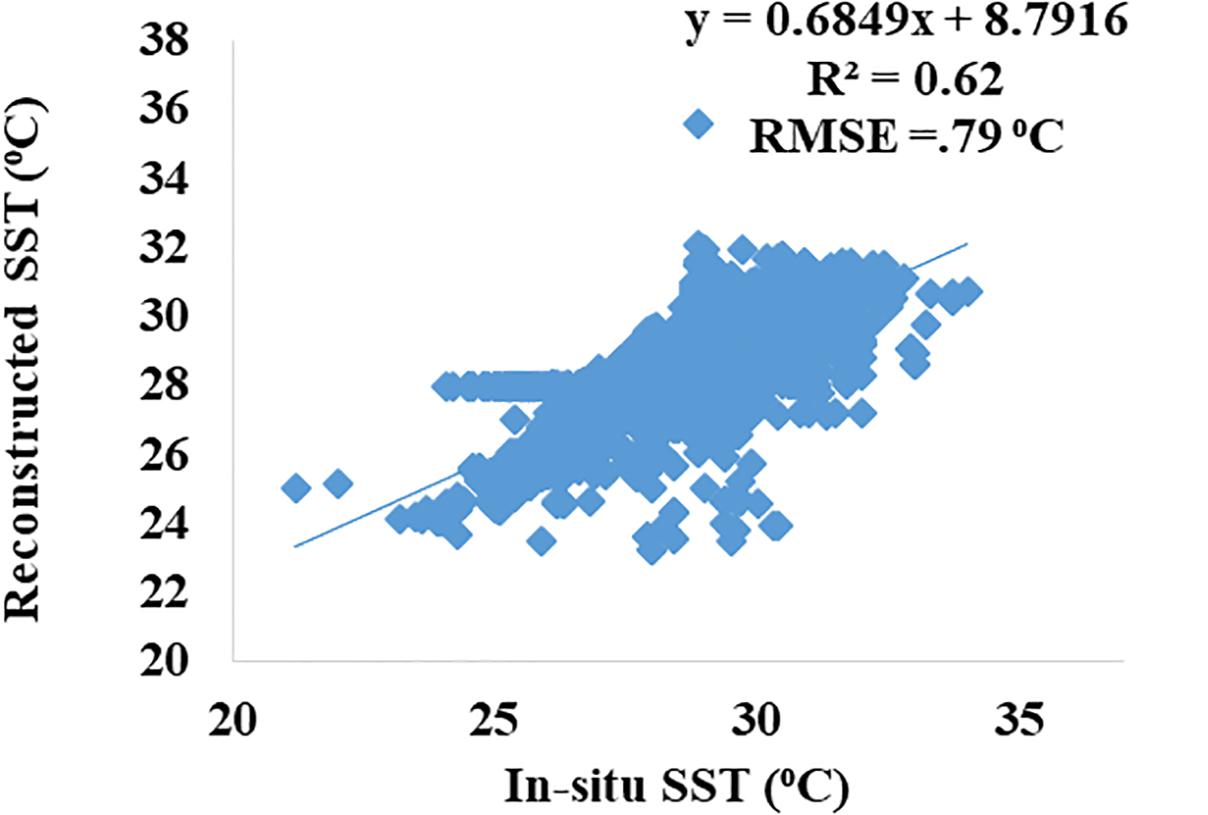
Figure 14. The scatter plot between in situ data and reconstructed SST using DINEOF and in situ validation data for user case study 3 during the period 2006–2015.
Conclusion
This full-review community white paper “Observational Needs of Sea Surface Temperature” provides a core contribution to OceanObs’19. It overviews the current SST observing systems, describes progress and challenges over the past decade and into the next, and overviews the forward-looking vision over the next decade and beyond. User requirements for SST products in the next decade need a complementary blend of satellites and in situ measurements. The establishment of a framework for the exchange and management of international SST data has been successfully implemented and is operating on a daily basis coordinated by GHRSST. A thriving user community has developed in which integrated SST data sets are being used at scientific institutions and operational agencies. Tools and data services have been developed and implemented to serve this user community. Through the activities of GHRSST, many lessons have been learned that provide the basis for an optimal configuration for the SST observing system in the next 10 years. Additional challenges and opportunities will emerge as datasets are migrated onto cloud processing environments. Open source software policies will help this process.
The following priority recommendations are made:
(a) Ensure continuity and redundancy of the multi-frequency Passive Microwave (PMW) Radiometry constellation for SST including 6.9 GHz V & H channel capability, with resilience to radio frequency interference.
(b) Make further developments and support projects toward provision of innovative FRM and in situ SST data, particularly at high-latitudes and in marginal ice zones.
(c) Enhance SST algorithms and improve SST products and data quality (including cloud screening, aerosol-screening and correction, retrievals, uncertainty assessment, analysis and inter-sensor harmonization), with focus on coastal, dynamic, polar and upwelling regions, and regions subject to persistent atmospheric aerosols.
(d) In climate applications, follow a rigorous approach to SST data quality, and the Fiducial Reference Measurement (FRM) and in situ SST data used in SST validation should have estimates of the uncertainty of those measurements.
(e) In response to ever-growing data volumes of SST data, improved regional and national capabilities, and provider-specific data access policies, establish plans to evolve the GHRSST Regional/Global Task Sharing framework to become a more distributed and federated system for data and information distribution and archiving.
Detailed recommendations are given following the themes of constellation, validation and FRM, algorithms and cloud-screening, climate, assimilation and merged products and user applications.
Constellation:
(1) For a range of applications including NWP, climate and research, it is imperative that satellite derived SST time-series are improved and sustained into the next decade and beyond. This encompasses SST from polar-orbiting and geostationary, using both infrared and microwave sensors, with continued research vital to improve the resolution and accuracy of the SST fields.
(2) There is an increased need for SST sensors with high spatial resolution and high radiometric fidelity to serve modern operational services for sea-ice and SST analysis, and services for modeling and prediction of ocean and weather.
(3) Future satellite infrared radiometers targeting SST should include channels centered at 4.05, 3.7/3.9, and 8.6 μm, in addition to the window channels of 10.8/11 and 12 μm, to improve clear-sky determination and SST uncertainty under aerosol. A day–night band (as on VIIRS) would be beneficial for night-time cloud detection.
(4) There should be continuation of dual-view infrared capability with redundancy, particularly to act as a satellite reference for the operational constellation, including resilience to extreme stratospheric aerosol events, through planned continuation of these missions in the long-term.
(5) There should be a constellation of at least six geostationary platforms (with operational redundancy) with high-quality sensors designed for SST retrieval.
(6) Improved accuracy and spatial resolution of SST observations derived from PMW radiometer data are needed, particularly for coastal and sea-ice regions.
(7) More research and international collaboration is recommended to improve and harmonize BT calibration across all available microwave missions, and to better constrain the quantification of sea surface emissivity under varying conditions over SST-relevant frequencies. This should include the potential for harmonization research for infrared BTs calibration using dual-view radiometers as a reference.
(8) The highly complementary CIMR and AMSR2 follow-on missions should be both pursued, to provide unprecedented coverage, redundancy and revisit of the global ocean and high latitude sea-ice conditions.
Validation and FRM:
(9) There should be increased further research and activities into estimating and documenting the uncertainties of SST FRM, including improved uncertainty models, data and research into understanding of the sampling errors introduced during validation inter-comparison exercises, to facilitate SI-traceability of satellite SSTs.
(10) Further developments of the drifting buoy network are needed to improve the calibration and resolution of SST measurements (achieving uncertainties better than <0.05 K), provide improved uncertainty information per drifting buoy, understand the depth of the sensor and how it behaves in the near-surface, and improved metadata, to aid satellite inter-comparisons, and progress toward SI-traceable drifting buoy SSTs to facilitate the SI-traceability of satellite SSTs in a way comparable to that currently done with ship radiometers with SI-traceable calibration.
(11) All FRM and/in situ SST data should be provided with complete metadata including depth of measurement. Efforts should be made to further expand the FRM available for satellite SST validation including those at high-latitudes and those capable of giving estimates of spatial variability such as Saildrone.
(12) Methodologies on the use of satellite-derived SST as a reference for performing automatic quality control of in situ observations should be extended and continued.
(13) The way uncertainties are communicated to users should be improved in response to the increasing number of users and data products, to address context sensitive uncertainties provided at the appropriate scale, ranging from noise at the pixel-level to correlated or systematic uncertainties per file. Documentation should be improved, including to define the traceability chain and efforts made for the uptake of this information by users.
(14) Uncertainty estimates of satellite SST should be developed using uncertainty modeling validated by empirical means against uncertainty-quantified in situ references, establishing that the joint satellite-in situ error budget explains observed discrepancies.
(15) Satellite SST uncertainty validation using in situ SST needs to consider the geophysical contribution to satellite-in situ collocated differences in addition to the uncertainty of the in situ data.
(16) Improved uncertainty models of SST data, and uncertainty models used for CDRs should be the basis for all satellite SST products in general. Uncertainty representations need to be developed that can supply uncertainty information across all scales of application, including providing observing-system stability estimates, which need a continuation of consistent in situ sources such as the GTMBA.
Algorithms and cloud-screening:
(17) Further studies and research are needed on cloud-identification at high-latitudes and sea-ice regions, such as the Marginal Ice Zone.
(18) New generation geostationary SST data should be further exploited and researched to understand SST diurnal variability characteristics and provide information to users on the SST diurnal cycle, SST spatial contrasts and temporal variability, with consistent methodologies for estimating the diurnal variability.
(19) There should be further research and development into new approaches for cloud detection methods, as a major contributor to uncertainties on the derived SST. These should fully exploit the new generation of sensors including those with more channels, improved calibration, lower uncertainties, and improved spatial and temporal resolution; assess the potential for pattern recognition and temporal collation techniques; and use the repeated sampling of all observations.
(20) There should be further research and studies toward ensuring robustness of SST algorithms to stratospheric volcanic aerosol conditions, and desert dust aerosol conditions, for all infrared satellite observations with the necessary spectral and/or dual-view channels, and particularly to fully exploit the approximate 3.9 and 8.7 μm channel capability on VIIRS and eventually METimage.
(21) Further research is needed to improve operational Lake Surface Water Temperature products, addressing the additional challenges of cloud screening and surface temperature retrieval in the contexts of inland and coastal waters.
(22) To respond to the greater availability of high-resolution high-quality sensors, further research is needed on the potential for machine-learning techniques to improve the accuracy of SST algorithms.
Climate:
(23) Maximizing the benefit of the SST CDR involves increasing the length of the stable record, requiring ongoing focus on the early AVHRR record (1978–1995), exploiting recent improvements in inter-satellite re-calibration techniques, radiative transfer and earth observation metrology.
(24) Climatologies with high spatial and temporal resolution are needed to fully understand the relevant scales and diurnal cycle on long-term CDRs by combining both polar orbiting and geostationary data from PMW and infrared radiometers.
(25) Ship-based infrared radiometer SST data are crucial for the assessment and qualification of a satellite SST CDR, as they provide a means for providing SI-traceable FRM, and should be extended and continued globally, with regular inter-comparison exercises.
(26) Further research into analyzing the different CDRs from IR and PMW and in harmonizing the CDRs from IR and PMW missions through the use of radiative transfer techniques to obtain more accurate and consistent CDRs.
Assimilation and merged products:
(27) The use of satellite SST is important for assimilation into global and regional ocean models to improve the estimation of the ocean state over the past decades and to aid the understanding of ocean variability and trends, and further effort should be made to ensure long-times series data are used and sustained.
(28) The power spectrum properties of SST analyses need to be understood in relation to the true geophysical spectrum from ocean variability, including methods to discriminate analysis noise and real signal at high spatio-temporal frequencies.
(29) Impact studies are needed to show whether the prediction of extreme meteorological events over the ocean or land, including coastal regions, might be improved by using either SST analyses that resolve ocean features at less than 20 km scales to constrain high resolution NWP models of less than 2 km, or coupled models at high resolution.
User needs:
(30) To respond to the rapidly growing number and volume of GHRSST products there is a need for a comprehensive, one-stop catalog for data discovery and access now that data providers are distributing their own datasets.
(31) User tools for GHRSST data visualization, extraction and quality monitoring should continue to be supported, developed and expanded, for example: The SOTO; HiTide; satellite SST inter-comparison tools (such as NOAA SQUAM) and matchup datasets/tools to ocean-surface SST measurements (such as Felyx and NOAA iQuam).
Author Contributions
AO’C, GC, AI, and PM involved in overall editing and wrote the sections “Introduction,” “SST’s Role in an Integrated Ocean Observing System,” and “Conclusion.” SS wrote the section “Polar-Orbit IR SST Capability”. MP and AI wrote the sections “Geostationary-Orbit Infrared SST Capability” and “Improved Cloud Masking of IR Imagery.” WW wrote the section “The Evolving in situ SST Observing System.” CM wrote the sections “More Accurate SST Retrieval Through Aerosol-Laden Atmospheres,” “Better Uncertainty and Error Estimation,” and “The Challenges of Systematic SST Observations Over Inland Seas, Lakes and in the Coastal Zones” along with EM. IK, RS, and SM wrote the section “Better Practical Quantification of Diurnal Variability.” GC wrote the sections “Improved Methods of Validation” and “Application Example 2: The Modern Era and Historical SST Climate Data Records.” JV-C, JH, and HB wrote the sections “Evolving the International SST Service to Users” and “Application Example 1: Use of SST Observations in Operational Forecast Systems.” KC, PD, and EA wrote the section “Evolving the International SST Service to Users.” CD, CG, MK, and YK wrote the sections “Passive MW Polar-Orbiters and Low Inclination Orbiting SST Capability” and “The Challenges of SST Provision in High Latitude Regions.” MB wrote the section “The Challenges of Providing Global High Resolution SSTs.” KK wrote the section “User Case Study 2: The Impact of Pollution on Sea Surface Temperature (SST) Along the Coast of the Gulf of Guinea of West Africa.” SS, BR, and RR wrote the section “User Case Study 3: Reconstruction of Daily Cloud Free MODIS SST Over South Eastern Arabian Sea.” All authors contributed to the writing of section “Conclusion.”
Funding
CG was supported in this work by the NASA Grant 80NSSC18K0837. All other authors were supported by their institutes in preparing this review article.
Conflict of Interest Statement
The authors declare that the research was conducted in the absence of any commercial or financial relationships that could be construed as a potential conflict of interest.
Acknowledgments
SS, BR, and RR acknowledge the GHER Group at the University of Liège and the NASA OBPG. AI and MP acknowledge support from JPSS, GOES-R, and ORS Programs (their views expressed in this report are their own and should not be construed as an official NOAA or U.S. Government Position or Policy). JV-C and EA acknowledge support from NASA JPL.
Footnotes
- ^ https://www.ghrsst.org/quick-start-guide/
- ^ http://www.star.nesdis.noaa.gov/sod/sst/squam
- ^ http://www.star.nesdis.noaa.gov/sod/sst/iquam
- ^ http://www.star.nesdis.noaa.gov/sod/sst/arms/
- ^ http://hrdds.ifremer.fr/
- ^ http://www.wmo.int/pages/prog/sat/globalplanning_en.php
- ^ http://www.wmo.int/pages/prog/gcos/index.php?name=EssentialClimateVariables
- ^ http://podaac-tools.jpl.nasa.gov/soto
- ^ http://podaac-tools.jpl.nasa.gov/hitide
- ^ http://www.ecmwf.int
- ^ http://130.56.244.252/monitoring/index.php?pg=class4_stats
- ^ http://www.bom.gov.au/oceanography/oceantemp/sst-outlook-map.shtml
References
Albiñana, A. P., Battles, D., Monteiro, D., Lambeck, R. W., Alemán, R., and Jackson, C. (2007). “The performance of the AVHRR, HIRS, and AMSU-A instruments on board Metop-A,” in Proceedings of the Optical Engineering + Applications, (Bellingham, WA: SPIE), 13. doi: 10.1117/12.730839
Alvera-Azcárate, A., Barth, A., Beckers, J.-M., and Weisberg, R. H. (2007). Multivariate reconstruction of missing data in sea surface temperature, chlorophyll, and wind satellite fields. J. Geophys. Res. Oceans 112, 1–11.
Alvera-Azcárate, A., Barth, A., Rixen, M., and Beckers, J. M. (2005). Reconstruction of incomplete oceanographic data sets using empirical orthogonal functions: application to the Adriatic Sea surface temperature. Ocean Model. 9, 325–346.
Atkinson, C., Kennedy, J., and Rayner, N. (2015). ESA SST CCI Phase 2 Climate Assessment Report. Available at: http://www.esa-sst-cci.org (accessed November, 2015).
Atkinson, C. P., Rayner, N. A., Roberts-Jones, J., and Smith, R. O. (2013). Assessing the quality of sea surface temperature observations from drifting buoys and ships on a platform-by-platform basis. J. Geophys. Res. Oceans 118, 3507–3529. doi: 10.1002/jgrc.20257
Balmaseda, M. A., Alves, O. J., Arribas, A., Awaji, T., Behringer, D. W., Ferry, N., et al. (2009). Ocean initialization for seasonal forecasts. Oceanography 22, 154–159. doi: 10.1002/2017MS001204
Barker, A., Banks, A., Bell, W., Dowell, M., Fox, N. P., Green, P., et al. (2015). “Metrology for climate,” in Metrology Priorities for the Earth Observation and Climate Community, eds A. Barker, et al. (Brussels: European Commission), 36.
Barton, I. J., Minnett, P. J., Donlon, C. J., Hook, S. J., Jessup, A. T., Maillet, K. A., et al. (2004). The Miami2001 infrared radiometer calibration and inter-comparison: 2. Ship comparisons. J. Atmos. Ocean. Technol. 21, 268–283. doi: 10.1175/1520-0426(2004)021<0268:tmirca>2.0.co;2
Beckers, J. M., and Rixen, M. (2003). EOF calculations and data filling from incomplete oceanographic datasets. J. Atmos. Ocean. Technol. 20, 1839–1856. doi: 10.1175/1520-0426(2003)020<1839:ecadff>2.0.co;2
Beggs, H. (2010). “Use of TIR from Space in Operational Systems,” in Oceanography from Space Revisited, eds V. Barale, J. F. R. Gower, and L. Alberotanza (Berlin: Springer), 249–271. doi: 10.1007/978-90-481-8681-5_15
Beggs, H., Verein, R., Paltoglou, G., Kippo, H., and Underwood, M. (2012). Enhancing ship of opportunity sea surface temperature observations in the Australian region. J. Operat. Oceanogr. 5, 59–73. doi: 10.1080/1755876x.2012.11020132
Beggs, H., Zhong, A., Warren, G., Alves, O., Brassington, G., and Pugh, T. (2011). RAMSSA - an operational, high-resolution, regional Australian multi-sensor sea surface temperature analysis over the Australian region. Aust. Meteorol. Oceanogr. J. 61, 1–22. doi: 10.22499/2.6101.001
Bell, M. J., Lefèbvre, M., le Traon, P.-Y., Smith, N., and Wilmer-Becker, K. (2009). GODAE the global ocean data assimilation experiment. Oceanography 22, 14–21. doi: 10.1016/j.marpolbul.2011.06.026
Bellenger, H., and Duvel, J.-P. (2009). An analysis of tropical ocean diurnal warm layers. J. Clim. 20, 3629–3646. doi: 10.1175/2008jcli2598.1
Berry, D. I., and Kent, E. C. (2017). Assessing the health of the in situ global surface marine climate observing system. Int. J. Climatol. 37, 2248–2259. doi: 10.1002/joc.4914
Bessho, K., Date, K., Hayashi, M., Ikeda, A., Imai, T., Inoue, H., et al. (2016). An introductionIntroduction to Himawari-8/9 – Japan’s- Japan’s new-generation geostationary meteorological satellites. J. Meteorol. Soc. Jpn. 94, 151–183. doi: 10.2151/jmsj.2016-2019
Blackmore, T., O’Carroll, A. G., Fennig, K., and Saunders, R. W. (2012). Correction of AVHRR Pathfinder SST data for volcanic aerosol effects using ATSR SSTs and TOMS aerosol optical depth. Remote Sens. Environ. 116, 107–117. doi: 10.1016/j.rse.2011.04.040
Bojinski, S. (2014). The concept of essential climate variables in support of climate research, applications, and policy, BAMS, September 2014. Bull. Am. Meteorol. Soc. 95, 1431–1443. doi: 10.1175/BAMS-D-13-00047.1
Brassington, G. B. (2009). Ocean Prediction Issues Related to Weather and Climate Prediction, Pre-CAS Public Web Consultation: Vision Paper (Agenda Item 8.5). Seoul: WMO CAS.
Bulgin, C. E., Embury, O., Corlett, G., and Merchant, C. J. (2016). Independent uncertainty estimates for coefficient based sea surface temperature retrieval from the along-track scanning radiometer instruments. Remote Sens. Environ. 178, 213–222. doi: 10.1016/j.rse.2016.02.022
Buongiorno Nardelli, B., Tronconi, C., Pisano, A., and Santoleri, R. (2013). High and ultra-high resolution processing of satellite Sea Surface temperature data over Southern European Seas in the framework of MyOcean project. Remote Sens. Environ. 129, 1–16. doi: 10.1016/j.rse.2012.10.012
Casey, K. S., Brandon, T. B., Cornillon, P., and Evans, R. (2010). “The past, present, and future of the AVHRR pathfinder SST program,” in Oceanography from Space, eds V. Barale, J. Gower, and L. Alberotanza (Dordrecht: Springer), 273–287. doi: 10.1007/978-90-481-8681-5_16
Castro, S., Wick, G., and Emery, W. (2012). Evaluation of the relative performance of SST measurements from different types of drifting and moored buoys using satellite-derived reference products. J. Geophys. Res. 117:C02029. doi: 10.1029/2011JC007472
Castro, S., Wick, G., Jackson, D., and Emery, W. (2008). Error characterization of infrared and microwave sea surface temperature products for merging and analysis. J. Geophys. Res. 113:C03010. doi: 10.1029/2006JC003829
Castro, S. L., Emery, W. J., Tandy, W. Jr., and Good, W. S. (2017). Submesoscale sea surface temperature variability from UAV and satellite measurements. Remote Sens. 9:1089. doi: 10.3390/rs9111089
Castro, S. L., Wick, G. A., Minnett, P. J., Jessup, A. T., and Emery, W. J. (2010). The impact of measurement uncertainty and spatial variability on the accuracy of skin and subsurface regression-based sea surface temperature algorithms. Remote Sens. Environ. 114, 2666–2678. doi: 10.1016/j.rse.2010.06.003
Centurioni, L. R., Turton, J. D., Lumpkin, R., Braasch, L., Brassington, G., Chao, Y., et al. (2019). Multidisciplinary global in-situ observations of essential climate and ocean variables at the air-sea interface in support of climate variability and change studies and to improve weather forecasting, pollution, hazard and maritime safety assessments. Front. Mar. Sci.
Chelton, D. B., Esbensen, S. K., Schlax, M. G., Thum, N., Freilich, M. H., Wentz, F., et al. (2001). Observations of coupling between surface wind stress and sea surface temperature in the eastern tropical pacific. J. Clim. 14, 1479–1498. doi: 10.1175/1520-0442(2001)014<1479:oocbsw>2.0.co;2
Chin, T. M., Vazquez-Cuervo, J., and Armstrong, E. M. (2017). A multi-scale high-resolution analysis of global sea surface temperature. Remote Sens. Environ. 200, 154–169. doi: 10.1039/b911677j
Choi, Y.-S., and Ho, C.-H. (2015). Earth and environmental remote sensing community in South Korea: a review. Remote Sens. Appl. Soc. Environ. 2, 66–76. doi: 10.1016/j.rsase.2015.11.003
Clayson, C. A., and Bogdanoff, A. S. (2012). The effect of diurnal sea surface temperature warming on climatological air–sea fluxes. J. Clim. 26, 2546–2556. doi: 10.1175/jcli-d-12-00062.1
Corlett, G. K., Merchant, C. J., Minnett, P. J., and Donlon, C. J. (2014). “Assessment of long-term satellite derived sea surface temperature records,” in Experimental Methods in the Physical Sciences Optical Radiometry for Ocean Climate Measurements, Vol. 47, eds G. Zibordi, C. J. Donlon, and A. C. Parr (Cambridge: Academic Press), 639–677. doi: 10.1016/b978-0-12-417011-7.00021-0
Cornillon, P. (1986). The effect of the new england seamounts on gulf stream meandering as observed from satellite IR imagery. J. Phys. Oceanogr. 16, 386–389. doi: 10.1175/1520-0485(1986)016<0386:teotne>2.0.co;2
Cronin, M. F., Gentemann, C. L., Edson, J., Ueki, I., Ando, K., Bourassa, M., et al. (2019). Air-sea fluxes with a focus on heat and momentum. Front. Mar. Sci. doi: 10.3389/fmars.2019.00430
Crosman, E., Vazquez-Cuervo, J., and Chin, T. M. (2017). Evaluation of the multi-scale ultra-high resolution (MUR) analysis of lake surface temperature. Remote Sens. 9:723. doi: 10.3390/rs9070723
Dash, P., Ignatov, A., Kihai, Y., and Sapper, J. (2010). The SST quality monitor (SQUAM). J. Atmos. Ocean. Technol. 27, 1899–1917. doi: 10.1175/2010JTECHO756.1
Dombrowsky, E., Bertino, L., Brassington, G. B., Chassignet, E. P., Davidson, F., Hurlburt, H. E., et al. (2009). GODAE systems in operation. Oceanography 22, 80–95. doi: 10.5670/oceanog.2009.68
Dong, C., Yang, J., Zhang, W., Yang, Z., Lu, N., Shi, J., et al. (2009). An overview of a new chinese weather satellite FY-3A. Bull. Am. Meteorol. Soc. 90, 1531–1544. doi: 10.1175/2009bams2798.1
Donlon, C., Berruti, B., Buongiorno, A., Ferreira, M. H., Féménias, P., Frerick, J., et al. (2012). The global monitoring for environment and security (GMES) sentinel-3 mission. Remote Sens. Environ. 120, 37–57. doi: 10.1016/j.rse.2011.07.024
Donlon, C., Robinson, I. S., Reynolds, M., Wimmer, W., Fisher, G., Edwards, R., et al. (2008). An infrared sea surface temperature autonomous radiometer (ISAR) for deployment aboard volunteer observing ships (VOS). J. Atmos. Ocean. Technol. 25, 93–113. doi: 10.1175/2007jtecho505.1
Donlon, C. J., Casey, K. S., Robinson, I. S., Gentemann, C. L., Reynolds, R. W., Barton, I., et al. (2009). The GODAE high-resolution sea surface temperature pilot project. Oceanography 22, 34–45. doi: 10.5670/oceanog.2009.64
Donlon, C. J., Martin, M., Stark, J. D., Roberts-Jones, J., Fiedler, E., and Wimmer, W. (2011). The operational sea surface temperature and sea ice analysis (OSTIA). Remote Sens. Environ. 116, 140–158. doi: 10.1016/j.rse.2010.10.017
Donlon, C. J., Minnett, P. J., Fox, N., and Wimmer, W. (2015). “Strategies for the Laboratory and Field Deployment of Ship-Borne Fiducial Reference Thermal Infrared Radiometers in Support of Satellite-Derived Sea Surface Temperature Climate Data Records,” in Optical Radiometry for Oceans Climate Measurements: Experimental Methods in Sciences, eds G. Zibordi, C. Donlon, and A. Parr (Amsterdam: Elsivier).
Donlon, C. J., Minnett, P. J., Gentemann, C., Nightingale, T. J., Barton, I. J., Ward, B., et al. (2002). Toward improved validation of satellite sea surface skin temperature measurements for climate research. J. Clim. 15, 353–369. doi: 10.1175/1520-0442(2002)015<0353:tivoss>2.0.co;2
Durand, Y., Hallibert, P., Wilson, M., Lekouara, M., Grabarnik, S., Aminou, D., et al. (2015). “The flexible combined imager onboard MTG: from design to calibration,” in Proceedings of the SPIE Remote Sensing, (Bellingham, WA: SPIE), doi: 10.1117/12.2196644
Eastwood, S., Le Borgne, P., Préré, S., and Poulter, D. (2011). Diurnal variability in sea surface in the Arctic. Remote Sens. Environ. 115, 2594–2602. doi: 10.1016/j.rse.2011.05.015
ECMWF Workshop Report (2018). Observations and Analysis of Sea-Surface Temperature and Sea-ice for Numerical Weather Prediction and Climate Applications. Available at: https://www.ecmwf.int/sites/default/files/elibrary/2018/18157-observations-and-analysis-sea-surface-temperature-and-sea-ice-nwp-and-climate-applications-ws.pdf (accessed January, 2018).
Embury, O., Merchant, C. J., and Filipiak, M. J. (2012a). A reprocessing for climate of sea surface temperature from the along-track scanning radiometers: basis in radiative transfer. Remote Sens. Environ. 116, 32–46. doi: 10.1016/j.rse.2010.10.016
Embury, O., Merchant, C. J., and Corlett, G. K. (2012b). A reprocessing for climate of sea surface temperature from the along-track scanning radiometers: initial validation, accounting for skin and diurnal variability effects. Remote Sens. Environ. 116, 62–78. doi: 10.1016/j.rse.2011.02.028
Eriksen, M., Lebreton, L. C. M., Carson, H. S., Theil, M., Moore, C. J., Borerro, J. C., et al. (2014). Plastic pollution in the World’s oceans: more than 5 trillion plastic pieces weighing over 250,000 tons afloat at Sea. PLoS One 9:e111913. doi: 10.1371/journal.pone.0111913
Esaias, W. E., Abbott, M. R., Barton, I., Brown, O. B., Campbell, J. W., Carder, K. L., et al. (1998). An overview of MODIS capabilities for ocean science observations. IEEE Trans. Geosci. Remote Sens. 36, 1250–1265. doi: 10.1109/36.701076
Fablet, R., Phi, V., Redouane, L., Pierre-Henri, H., and Bertrand, C. (2018). Spatio-temporal interpolation of cloudy SST fields using conditional analog data assimilation. Remote Sens. 10:310. doi: 10.3390/rs10020310
Fairall, C. W., Bradley, E. F., Hare, J. E., Grachev, A. A., and Edson, J. B. (2003). Bulk parameterization of air-sea fluxes: updates and verification for the COARE algorithm. J. Clim. 16, 571–591. doi: 10.1175/1520-0442(2003)016<0571:bpoasf>2.0.co;2
Fallmann, J., Lewis, H., Castillo, J. M., Arnold, A., and Ramsdale, S. (2017). Impact of sea surface temperature on stratiform cloud formation over the North Sea. Geophys. Res. Lett. 44, 4296–4303. doi: 10.1002/2017gl073105
Ferrari, R. (2011). A frontal challenge for climate models. Science 332, 316–317. doi: 10.1126/science.1203632
Ferster, B. S., Subrahmanyam, B., and Macdonald, A. M. (2018). Confirmation of ENSO-southern ocean teleconnections using Satellite-Derived SST. Remote Sens. 10:331. doi: 10.3390/rs10020331
Filipiak, M. J., Merchant, C. J., Kettle, H., and Le Borgne, P. (2010). A statistical model for sea surface diurnal warming driven by numerical weather prediction fluxes and winds. Ocean Sci. Discuss. 7, 1497–1532. doi: 10.5194/osd-7-1497-2010
Folland, C. (2005). Assessing bias corrections in historical sea surface temperature using a climate model. Int. J. Climatol. 25, 895–911. doi: 10.1002/joc.1171
Freeman, E., Woodruff, S. D., Worley, S. J., Lubker, S. J., Kent, E. C., Angel, W. E., et al. (2017). ICOADS Release 3.0: a major update to the historical marine climate record. Int. J. Climatol. 37, 2211–2232. doi: 10.1002/joc.4775
García-Morales, R., López-Martínez, J., Valdez-Holguin, J. E., Herrera-Cervantes, H., and Espinosa-Chaurana, L. D. (2017). Environmental variability and oceanographic dynamics of the central and southern coastal zone of sonora in the Gulf of California. Remote Sens. 9:925. doi: 10.3390/rs9090925
GCOS (2009). Guideline for the Generation of Satellite-based Datasets and Products Meeting GCOS Requirements. Paris: GCOS.
GCOS (2010). Guideline for the Generation of Datasets and Products Meeting GCOS Requirements. Paris: GCOS.
GCOS (2011). Systematic Observation Requirements for Satellite-Based Products for Climate. Supplemental Details to the Satellite-Based Component of the Implementation Plan for the Global Observing System for Climate in Support of the UNFCC. Geneva: UNFCC.
Gentemann, C. L. (2014). Three way validation of MODIS and AMSR-E sea surface temperatures. J. Geophys. Res. Oceans 119, 2583–2598. doi: 10.1002/2013jc009716
Gentemann, C. L., and Akella, S. (2018). Evaluation of NASA GEOS-ADAS modeled diurnal warming through comparisons to SEVIRI and AMSR2 SST observations. J. Geophys. Res. Oceans 123, 1364–1375. doi: 10.1002/2017jc013186
Gentemann, C. L., and Hilburn, K. A. (2015). In situ validation of sea surface temperatures from the GCOM-W1 AMSR2 RSS calibrated brightness temperatures. J. Geophys. Res. Oceans 120, 3567–3585. doi: 10.1002/2014jc010574
Gentemann, C. L., Meissner, T., and Wentz, F. J. (2010). Accuracy of satellite sea surface temperatures at 7 and 11 GHz. IEEE Trans. Geosci. Remote Sens. 48, 1009–1018. doi: 10.1109/tgrs.2009.2030322
Gentemann, C. L., Minnett, P. J., LeBorgne, P., and Merchant, C. J. (2008). Multi-satellite measurements of large diurnal warming events. Geophys. Res. Lett. 35:L22602.
Gladkova, I., Ignatov, A., Pennybacker, M., and Kihai, Y. (2019). “Towards high-resolution multi-sensor gridded ACSPO SST Product,” in Proceedings of the SPIE, Ocean Sensing and Monitoring XI, Bellingham.
Gladkova, I., Kihai, Y., Ignatov, A., Shahriar, F., and Petrenko, B. (2015). SST pattern test in ACSPO clear-sky mask for VIIRS. Remote Sens. Environ. 160, 87–98. doi: 10.1016/j.rse.2015.01.003
Haines, S. L., Jedlovec, G. J., and Lazarus, S. M. (2007). A MODIS sea surface temperature composite for regional applications. IEEE Trans. Geosci. Remote Sens. 45, 2919–2927. doi: 10.1109/tgrs.2007.898274
Hirahara, S., Ishii, M., and Fukuda, Y. (2014). Centennial-Scale sea surface temperature analysis and its uncertainty. J. Clim. 27, 57–75. doi: 10.1175/jcli-d-12-00837.1
Hudson, D., Alves, O., Hendon, H. H., Lim, E., Liu, G., Luo, J.-J., et al. (2017). ACCESS-S1: the new bureau of meteorology multi-week to seasonal prediction system. J. South. Hemisphere Earth Syst. Sci. 67, 132–159. doi: 10.22499/3.6703.001
Ignatov, A., Zhou, X., Petrenko, B., Liang, X., Kihai, Y., Dash, P., et al. (2016). AVHRR GAC SST reanalysis version 1 (RAN1). Remote Sens. 8:315. doi: 10.3390/rs8040315
JAXA (2017). AMSR2 Products Update. Available at: https://suzaku.eorc.jaxa.jp/GCOM_W/materials/product/170222_Ver3.0_release_e.pdf (accessed March, 2017).
JCGM (2008). Evaluation of Measurement Data - Guide to the Expression of Uncertainty in Measurement. Available at: https://www.bipm.org/utils/common/documents/jcgm/JCGM_100_2008_E.pdf (accessed September, 2008).
Kara, A. B., Hurlburt, H. E., and Wallcraft, A. J. (2005). Stability-Dependent exchange coefficients for Air–Sea fluxes. J. Atmos. Ocean. Technol. 22, 1080–1094. doi: 10.1175/jtech1747.1
Karagali, I., and Høyer, J. L. (2013). Observations and modeling of the diurnal SST cycle in the North and Baltic Seas. J. Geophys. Res. Oceans 118:4488. doi: 10.1002/jgrc.20320
Karagali, I., and Høyer, J. L. (2014). Characterisation and quantification of regional diurnal SST cycles from SEVIRI. Ocean Sci. Discuss. 11, 1093–1128. doi: 10.5194/osd-11-1093-2014
Karagali, I., Høyer, J. L., and Donlon, C. J. (2017). Using a 1-D model to reproduce the diurnal variability of SST. J. Geophys. Res. Oceans 122, 2945–2959. doi: 10.1002/2016jc012542
Karagali, I., Høyer, J. L., and Hasager, C. B. (2012). SST diurnal variability in the North and the Baltic Sea. Rem. Sens. Envinron. 121, 159–170. doi: 10.1016/j.rse.2012.01.016
Kawanishi, T., Sezai, T., Ito, Y., Imaoka, K., Takeshima, T., Ishido, Y., et al. (2003). The advanced microwave scanning radiometer for the earth observing system (AMSR-E), NASDA’s contribution to the EOS for global energy and water cycle studies. IEEE Trans. Geosci. Remote Sens. 41, 184–194. doi: 10.1109/tgrs.2002.808331
Kearns, E. J., Hanafin, J. A., Evans, R. H., Minnett, P. J., and Brown, O. B. (2000). An independent assessment of Pathfinder AVHRR sea surface temperature accuracy using the Marine-Atmosphere emitted radiance interferometer (M-AERI). Bull. Am. Meteorol. Soc. 81, 1525–1536. doi: 10.1175/1520-0477(2000)081<1525:aiaopa>2.3.co;2
Kennedy, J. J. (2014). A review of uncertainty in in situ measurements and data sets of sea surface temperature. Rev. Geophys. 52, 1–32. doi: 10.1002/2013RG000434
Kennedy, J. J., Smith, R. O., and Rayner, N. A. (2012). Using AATSR data to assess the quality of in situ sea-surface temperature observations for climate studies. Remote Sens. Environ. 116, 79–92. doi: 10.1016/j.rse.2010.11.021
Kent, E. C., Rayner, N. A., Berry, D. I., Huang, B., Kennedy, J. J., and Wilkinson, C. (2019). Observing requirements for long-term climate records at the ocean surface. Front. Mar. Sci. 6:441, doi: 10.3389/fmars.2019.00441
Kilpatrick, K. A., Podestá, G., Walsh, S., Williams, E., Halliwell, V., Szczodrak, M., et al. (2015). A decade of sea surface temperature from MODIS. Remote Sens. Environ. 165, 27–41. doi: 10.1016/j.rse.2015.04.023
Kilpatrick, K. A., Podestá, G., Williams, E., Walsh, S., and Minnett, P. J. (2019). Alternating decision trees for cloud masking MODIS and VIIRS NASA SST products. J. Atmos. Ocean. Technol. 36, 387–407. doi: 10.1175/jtech-d-18-0103.1
Kilpatrick, K. A., Podestá, G. P., and Evans, R. H. (2001). Overview of the NOAA/NASA pathfinder algorithm for sea surface temperature and associated matchup database. J. Geophys. Res. 106, 9179–9198.
Kim, H., Kim, H., Lim, H., and Choi, H. (2015). Space-Based earth observation activities in south korea. IEEE Geosci. Remote Sens. Mag. 3, 34–39. doi: 10.1109/MGRS.2014.2382652
Koner, P., and Harris, A. (2016). Improved quality of MODIS sea surface temperature retrieval and data coverage using physical deterministic methods. Remote Sens. 8:454. doi: 10.3390/rs8060454
Koner, P. K., Harris, A. R., and Maturi, E. M. (2015). A physical deterministic inverse method for operational satellite remote sensing: an application for sea surface temperature retrievals. IEEE Trans. Geosci. Rem. Sens. 53, 5872–5888. doi: 10.1109/tgrs.2015.2424219
Kwok, R., Cunningham, G. F., and Hibler, W. D. I. I. I. (2003). Sub-daily sea ice motion and deformation from RADARSAT observations. Geophys. Res. Lett. 30:2218. doi: 10.1029/2003GL018723
Lean, K., and Saunders, R. (2013). Validation of the ATSR reprocessing for climate (ARC) dataset using data from drifting buoys and a three-way error analysis. J. Clim. 26, 4758–4772. doi: 10.1175/JCLI-D-12-00206.1
Legeckis, R. (1977). Long waves in the eastern equatorial pacific ocean: a view from a geostationary satellite. Science 197, 1179–1181. doi: 10.1126/science.197.4309.1179
Lekouara, M. (2013). Exploring Frontogenesis Processes in New Satellite Sea Surface Temperature Data Sets. Doctoral thesis, University of Southampton, Southampton.
Levitus, S., Antonov, J. I., Boyer, T. P., Baranova, O. K., Garcia, H. E., Locarnini, R. A., et al. (2012). World ocean heat content and thermosteric sea level change (0–2000 m), 1955–2010. Geophys. Res. Lett. 39:L10603. doi: 10.1029/2012GL051106
Levy, M., Raffaele, F., Franks, P. J. S., Martin, A. P., and Pascal, R. (2012). Bringing physics to life at the submesoscale. Geophys. Res. Lett. 39:L14602.
Lindzen, R. S., and Nigam, S. (1987). On the role of sea surface temperature gradients in forcing low-level winds and convergence in the tropics. J. Atmos. Sci. 44, 2418–2436. doi: 10.1175/1520-0469(1987)044<2418:otross>2.0.co;2
Liu, Y., and Minnett, P. J. (2015). Evidence linking satellite-derived sea-surface temperature signals to changes in the Atlantic meridional overturning circulation. Remote Sens. Environ. 169, 150–162. doi: 10.1016/j.rse.2015.08.014
Llewellyn-Jones, D., Minnett, P., Saunders, R., and Zavody, A. (1984). Satellite multi-channel infrared measurements of sea surface temperature of the N.E. Atlantic Ocean using AVHRR/2. Q. J. R. Meteorol. Sci. 110, 613–631. doi: 10.1256/smsqj.46503
Llewellyn-Jones, D., and Remedios, J. (2012). The advanced along track scanning radiometer (AATSR) and its predecessors ATSR-1 and ATSR-2: an introduction to the special issue. Remote Sens. Environ. 116, 1–3. doi: 10.1016/j.rse.2011.06.002
Luo, B., Minnett, P. J., Gentemann, C., and Szczodrak, G. (2019). Improving satellite retrieved night-time infrared sea surface temperatures in aerosol contaminated regions. Remote Sens. Environ. 223, 8–20. doi: 10.1016/j.rse.2019.01.009
MacCallum, S. N., and Merchant, C. J. (2012). Surface water temperature observations of large lakes by optimal estimation. Can. J. Remote Sens. 38, 25–45. doi: 10.5589/m12-010
MacLachlan, C., Arribas, A., Peterson, K. A., Maidens, A., Fereday, D., Scaife, A. A., et al. (2014). Global Seasonal forecast system version 5 (GloSea5): a high-resolution seasonal forecast system. Q. J. R. Met. Soc. 141:689. doi: 10.1002/qj.2396
Marsouin, A., Le Borgne, P., Legendre, G., Péré, S., and Roquet, H. (2015). Six years of OSI-SAF METOP-A AVHRR sea surface temperature. Remote Sens. Environ. 159, 288–306. doi: 10.1016/j.rse.2014.12.018
Marullo, S., Minnett, P. J., Santoleri, R., and Tonani, M. (2016). The diurnal cycle of sea-surface temperature and estimation of the heat budget of the Mediterranean Sea. J. Geophys. Res. Oceans. 121, 8351–8367. doi: 10.1002/2016JC012192
Marullo, S., Santoleri, R., Banzon, V., Evans, R. H., and Guarracino, M. (2010). A diurnal-cycle resolving sea surface temperature product for the tropical Atlantic. J. Geophys. Res. Oceans 115:C05011. doi: 10.1029/2009JC005466
Marullo, S., Santoleri, R., Ciani, D., Le Borgne, P., Pere, S., Pinardi, N., et al. (2014). Combining model and geostationary satellite data to reconstruct hourly SST field over the Mediterranean Sea. Remote Sens. Environ. 146, 11–23. doi: 10.1016/j.rse.2013.11.001
McPhaden, M. J., Ando, K., Bourlès, B., Freitag, H. P., Lumpkin, R., Masumoto, Y., et al. (2010). “The global tropical moored buoy array,” in Proceedings of the OceanObs’09:Sustained Ocean Observations and Information for Society Conference, Vol. 2, eds J. Hall, D. E. Harrison, and D. Stammer (Venice: ESA Publication WPP-306).
Merchant, C. J., Embury, O., Le Borgne, P., and Bellec, B. (2006). Saharan dust in night-time thermal imagery: detection and reduction of related biases in retrieved sea surface temperature. Remote Sens. Environ. 104, 15–30. doi: 10.1016/j.rse.2006.03.007
Merchant, C. J., Embury, O., Rayner, N. A., Berry, D. I., Corlett, G., Lean, K., et al. (2012). A twenty-year independent record of sea surface temperature for climate from along-track scanning radiometers. J. Geophys. Res. 117:C12013. doi: 10.1029/2012JC008400
Merchant, C. J., Embury, O., Roberts-Jones, J., Fiedler, E., Bulgin, C. E., Corlett, G. K., et al. (2014). Sea surface temperature datasets for climate applications from Phase 1 of the european space agency climate change initiative (SST CCI). Geosci. Data J. 1, 179–191. doi: 10.1002/gdj3.20
Merchant, C. J., Harris, A. R., Maturi, E., and MacCallum, S. (2005). Probabilistic physically based cloud screening of satellite infrared imagery for operational sea surface temperature retrieval. Q. J. R. Meteorol. Soc. 131, 2735–2755. doi: 10.1256/qj.05.15
Merchant, C. J., Harris, A. R., Murray, M. J., and Zavody, A. M. (1999). Toward the elimination of bias in satellite retrievals of skin sea surface temperature 1. Theory, modeling and inter-algorithm comparison. J. Geophys. Res. 104, 23565–23578. doi: 10.1029/1999JC900105
Merchant, C. J., Harris, A. R., Roquet, H., and Le Borgne, P. (2009a). Retrieval characteristics of non-linear sea surface temperature from the advanced very high resolution radiometer. Geophys. Res. Lett. 36:L17604. doi: 10.1029/2009GL039843
Merchant, C. J., Le Borgne, P., Roquet, H., and Marsouin, A. (2009b). Sea surface temperature from a geostationary satellite by optimal estimation. Remote Sens. Environ. 113, 445–457. doi: 10.1016/j.rse.2008.10.012
Merchant, C. J., Paul, F., Popp, T., Ablain, M., Bontemps, S., Defourny, P., et al. (2017). Uncertainty information in climate data records from Earth observation. Earth Syst. Sci. Data 9, 511–527. doi: 10.5194/essd-9-511-2017
Miles, T. N., and He, R. (2010). Temporal and spatial variability of Chl-a and SST on the south atlantic bight: revisiting with cloud-free reconstructions of MODIS satellite imagery. Cont. Shelf Res. 30, 1951–1962. doi: 10.1016/j.csr.2010.08.016
Minnett, P. J. (1991). Consequences of sea surface temperature variability on the validation and applications of satellite measurements. J. Geophys. Res. 96, 18475–18489.
Minnett, P. J. (2010). “The validation of sea surface temperature retrievals from spaceborne infrared radiometers,” in Oceanography from Space, eds V. Barale, J. F. R. Gower, and L. Alberotanza (Berlin: Springer), 273–295.
Minnett, P. J., and Corlett, G. K. (2012). A pathway to generating climate data records of sea-surface temperature from satellite measurements. Deep Sea Res. Part II Top. Stud. Oceanogr. 77–80, 44–51. doi: 10.1016/j.dsr2.2012.04.003
Minnett, P. J., Smith, M., and Ward, B. (2011). Measurements of the oceanic thermal skin effect. Deep Sea Res. Part II Top. Stud. Oceanogr. 58, 861–868. doi: 10.1016/j.dsr2.2010.10.024
Mittaz, J. P. D., Harris, A. R., and Sullivan, J. T. (2009). A physical method for the calibration of the AVHRR/3 thermal IR Channels 1: the prelaunch calibration data. J. Atmos. Ocean. Technol. 26:996. doi: 10.1175/2008JTECHO636.1
Morak-Bozzo, S., Merchant, C. J., Kent, E. C., Berry, D. I., and Carella, G. (2016). Climatological diurnal variability in sea surface temperature characterized from drifting buoy data. Geosci. Data J. 3, 20–28. doi: 10.1002/gdj3.35
NASA (2018). Cloud Climatology, Global Distribution and Character of Clouds. Available at: https://www.giss.nasa.gov/research/briefs/rossow_01/distrib.html (accessed April, 2018).
Nielsen-Englyst, P., Høyer, J. L., Toudal Pedersen, L., Gentemann, C., Alerskans, E., Block, T., et al. (2018). Optimal estimation of sea surface temperature from AMSR-E. Remote Sens. 10:229. doi: 10.3390/rs10020229
O’Carroll, A. G., Eyre, J. R., and Saunders, R. W. (2008). Three-Way error analysis between AATSR, AMSR-E, and in situ sea surface temperature observations. J. Atmos. Oceanic Technol. 25, 1197–1207. doi: 10.1175/2007jtecho542.1
Ohring, G., Wielicki, B., Spencer, R., Emery, B., and Datla, R. (2005). Satellite instrument calibration for measuring global climate change: report of a workshop. Bull. Am. Meteorol. Soc. 86, 1303–1313.
O’Neill, L. W., Chelton, D. B., and Esbensen, S. K. (2012). Covariability of surface wind and stress responses to sea surface temperature fronts. J. Clim. 25, 5916–5942. doi: 10.1175/jcli-d-11-00230.1
Palmer, M. D., Roberts, C. D., Balmaseda, M., Chang, Y.-S., Gennady, A., Chepurin, N. F., et al. (2017). Ocean heat content variability and change in an ensemble of ocean reanalyses. Clim. Dyn. 49, 909–930. doi: 10.1007/s00382-015-2801-2800
Petrenko, B., Ignatov, A., Kihai, Y., and Dash, P. (2016). Sensor-specific error statistics for SST in the advanced clear-sky processor for ocean. J. Atmos. Ocean. Tech. 27, 345–359. doi: 10.1175/JTECH-D-15-0166.1
Petrenko, B., Ignatov, A., Kihai, Y., and Heidinger, A. (2010). Clear-Sky mask for the advanced clear-sky processor for ocean. J. Atmos. Ocean. Tech. 27, 1609–1623. doi: 10.1175/2010JTECHA1413.1
Petrenko, B., Ignatov, A., Kihai, Y., Stroup, J., and Dash, P. (2014). Evaluation and selection of SST regression algorithms for JPSS VIIRS. J. Geophys. Res. 119, 4580–4599. doi: 10.1002/2013JD020637
Pisano, A., Buongiorno Nardelliab, B., Tronconia, C., and Santoleri, R. (2016). The new mediterranean optimally interpolated pathfinder AVHRR SST Dataset (1982–2012). Remote Sens. Environ. 176, 107–116. doi: 10.1016/j.rse.2016.01.019
Pithan, F., and Mauritsen, T. (2014). Arctic amplification dominated by temperature feedbacks in contemporary climate models. Nat. Geosci. 7:181. doi: 10.1038/ngeo2071
Poli, P., Lucas, M., O’Carroll, A., Le Menn, M., David, A., Corlett, G. K., et al. (2019). The copernicus surface velocity platform drifter with barometer and reference sensor for temperature (SVP-BRST): genesis, design, and initial results. Ocean Sci. 15, 199–214. doi: 10.5194/os-15-199-2019
Polidoro, B., Ralph, G., Strongin, K., Harvey, M., Carpenter, K. E., Arnold, R., et al. (2017). The status of marine biodiversity in the eastern central atlantic (West and Central Africa). Aquat. Conserv. 27, 1021–1034. doi: 10.1002/aqc.2744
Puri, K., Dietachmayer, G., Steinle, P., Dix, M., Rikus, L., Logan, L., et al. (2013). Implementation of the initial ACCESS numerical weather prediction system. Aust. Meteorol. Oceanogr. J. 63, 265–284.
Rayner, N., Kennedy, J., Titchner, H., and Kent, E. (2018). Observations of sea-Surface Temperature Made in Situ: Evolution, Uncertainties and Considerations on Their Use. Available at: https://www.ecmwf.int/en/elibrary/17967-observations-sea-surface-temperature-made-situ-evolution-uncertainties-and (accessed January, 2018).
Reynolds, R. W., Gentemann, C. L., and Corlett, G. K. (2010). Evaluation of AATSR and TMI Satellite SST Data. J. Clim. 23, 152–165. doi: 10.1175/2009jcli3252.1
Rice, J. P., Butler, J. J., Johnson, B. C., Minnett, P. J., Maillet, K. A., Nightingale, T. J., et al. (2004). The Miami2001 infrared radiometer calibration and intercomparison: 1. Laboratory characterization of blackbody targets. J. Atmos. Ocean. Technol. 21, 258–267. doi: 10.1175/1520-0426(2004)021<0258:tmirca>2.0.co;2
Roberts-Jones, J., Fiedler, E. K., and Martin, M. J. (2012). Daily, global, high-resolution SST and sea ice reanalysis for 1985-2007 Using the OSTIA system. J. Clim. 25, 6215–6232. doi: 10.1175/JCLI-D-11-00648.1
Robinson, I., Piolle, J.-F., Le Borgne, P., Poulter, D., Donlon, C., and Arino, O. (2012). Widening the application of AATSR SST data to operational tasks through the medspiration service. Remote Sens. Environ. 116, 126–139. doi: 10.1016/j.rse.2010.12.019
Saunders, R. W., and Kriebel, K. T. (1988). An improved method for detecting clear sky and cloudy radiances from AVHRR data. Int. J. Remote Sens. 9, 123–150. doi: 10.1080/01431168808954841
Scheren, P., Ibe, A. C., Jansenn, F. J., and Lemmens, A. M. (2002). Environmental pollution in the Gulf of Guinea – A regional approach. Mar. Pollut. Bull. 44, 633–641. doi: 10.1016/s0025-326x(01)00305-8
Schmit, T. J., Griffith, P., Gunshor, M. M., Daniels, J. M., Goodman, S. J., and Lebair, W. J. (2017). A closer look at the ABI on the GOES-R Series. Bull. Am. Meteorol. Soc. 98, 681–698. doi: 10.1175/bams-d-15-00230.1
Schmit, T. J., Gunshor, M. M., Menzel, P. W., Gurka, J. J., Li, J., and Bachmeier, A. S. (2005). Introducing the next-generation advanced baseline imager on GOES-R. Bull. Am. Meteorol. Soc. 86, 1079–1097. doi: 10.1175/BAMS-86-8-1079
Smith, G. C., Allard, R., Babin, M., Bertino, L., Chevallier, M., Corlett, G. K., et al. (2019). Polar ocean observations: a critical gap in the observing system and its effect on environmental prediction. Front. Mar. Sci.
Smith, N. R., and Koblinsky, C. J. (2001). “The ocean observing system for the 21st Century: a consensus statement,” in Observing the Oceans in the 21st Century, eds C. Koblinsky and N. R. Smith (Melbourne: Bureau of Meteorology).
Strong, A., and McClain, P. (1984). Improved ocean surface temperatures from space – comparisons with drifting buoys. Bull. Am. Met. Soc 65, 138–142. doi: 10.1175/1520-0477(1984)065<0138:iostfs>2.0.co;2
Theocharous, E., Fox, N. P., Barker-Snook, I., Niclos, R., Garcia Santos, V., Minnett, P. J., et al. (2016). The 2016 CEOS infrared radiometer comparison: Part II: laboratory comparison of radiation thermometers. J. Atmos. Ocean. Technol. 36:6.
Urabe, T., Okamura, Y., Tanaka, K., and Mokuno, M. (2018). “In-orbit commissioning activities results of GCOM-C/SGLI,” in Proceedings of the SPIE Remote Sensing, (Bellingham, WA: SPIE), doi: 10.1117/12.2325572
Vazquez-Cuervo, J., Torres, H. S., Menemenlis, D., Chin, T. M., and Armstrong, E. M. (2017). Relationship between SST gradients and upwelling off Peru and Chile: model/satellite data analysis. Int. J. Remote Sens. 38, 6599–6622. doi: 10.1080/01431161.2017.1362130
von Schuckmann, K., Palmer, M. D., Trenberth, K. E., Cazenave, A., Chambers, D., Champollion, N., et al. (2016). An imperative to monitor Earth’s energy imbalance. Nat. Clim. Change 6, 138–144. doi: 10.1038/nclimate2876
Wallner, O., Reinert, T., and Straif, C. (2017). “METIMAGE: a spectro-radiometer for the VII mission onboard METOP-SG,” in Proceedings of International Conference on Space Optics — ICSO 2016, eds B. Cugny, N. Karafolas, and Z. Sodnik (Biarritz: SPIE), doi: 10.1117/12.2296103
Walton, C. C., Pichel, W. G., Sapper, J. F., and May, D. A. (1998). The development and operational application of nonlinear algorithms for the measurement of sea surface temperatures with the NOAA polar-orbiting environmental satellites. J. Geophys. Res. 103, 27999–28012. doi: 10.1029/98jc02370
Wang, H., Guan, L., and Chen, G. (2016). Evaluation of Sea surface temperature from FY-3C VIRR Data in the Arctic. IEEE Geosci. Remote Sens. Lett. 13, 292–296. doi: 10.1109/LGRS.2015.2511184
Wentz, F. J., Gentemann, C., Smith, D., and Chelton, D. (2000). Satellite measurements of sea surface temperature through clouds. Science 288, 847–850. doi: 10.1126/science.288.5467.847
While, J., Mao, C., Martin, M. J., Roberts-Jones, J., Sykes, P. A., Good, S. A., et al. (2017). An operational analysis system for the global diurnal cycle of sea surface temperature: implementation and validation. Q. J. R. Meteorol. Soc. 143, 1787–1803. doi: 10.1002/qj.3036
Wick, G. A., Bates, J. J., and Scott, D. J. (2002). Satellite and skin-layer effects on the accuracy of sea surface temperature measurements from the GOES satellites. J. Atmos. Ocean. Technol. 19, 1834–1848. doi: 10.1175/1520-0426(2002)019<1834:sasleo>2.0.co;2
Williams, K. D., Harris, C. M., Bodas-Salcedo, A., Camp, J., Comer, R. E., Copsey, D., et al. (2015). The met office global coupled model 2.0 (GC2) configuration. Geosci. Model. Dev. 8, 1509–1524. doi: 10.5194/gmd-8-1509-2015
Wimmer, W., and Robinson, I. S. (2016). The ISAR instrument uncertainty model. J. Atmos. Ocean. Technol. 33, 2415–2433. doi: 10.1175/JTECH-D-16-0096.1
Wimmer, W., Robinson, I. S., and Donlon, C. J. (2012). Long-term validation of AATSR SST data products using shipborne radiometry in the Bay of Biscay and English Channel. Remote Sens. Environ. 116, 17–31. doi: 10.1016/j.rse.2011.03.022
Woodson, C. B., and Litvin, S. Y. (2015). Ocean fronts drive marine fishery production and biogeochemical cycling. Proc. Natl. Acad. Sci. U.S.A. 112, 1710–1715. doi: 10.1073/pnas.1417143112
Woolway, R. I., and Merchant, C. J. (2018). Intralake heterogeneity of thermal responses to climate change: a study of large northern hemisphere lakes. J. Geophys. Res. Atmos. 123, 3087–3098. doi: 10.1002/2017JD027661
Xu, F., and Ignatov, A. (2014). In situ SST Quality Monitor (iQuam). J. Atmos. Ocean. Tech. 31, 164–180. doi: 10.1175/JTECH-D-13-00121.1
Xu, F., and Ignatov, A. (2016). Error characterization in iQuam SSTs using triple collocations with satellite measurements. Geophys. Res. Lett. 43, 10826–10834. doi: 10.1002/2016GL070287
Yang, A., Zhong, B., Wu, S., and Liu, Q. (2017). Evaluation on radiometric capability of chinese optical satellite sensors. Sensors 17:204. doi: 10.3390/s17010204
Yang, J., Zhang, Z., Wei, C., Lu, F., and Guo, Q. (2017). Introducing the new generation of chinese geostationary weather satellites, Fengyun-4. BAMS. Bull. Am. Meteorol. Soc. 98, 1637–1658. doi: 10.1175/BAMS-Dbams-d-16-0065.1
Zeng, X., and Beljaars, A. (2005). A prognostic scheme of sea surface skin temperature for modeling and data assimilation. Geophys. Res. Lett. 32:L14605. doi: 10.1029/2005GL023030
Zhang, H., Beggs, H., Majewski, L., Wang, X. H., and Kiss, A. (2016a). Investigating sea surface temperature diurnal variation over the tropical warm pool using MTSAT-1R data. Remote Sens. Environ. 183, 1–12. doi: 10.1016/j.rse.2016.05.002
Zhang, H., Beggs, H., Wang, X. H., Kiss, A. E., and Griffin, C. (2016b). Seasonal patterns of SST diurnal variation over the Tropical Warm Pool region. J. Geophys. Res. Oceans 121, 8077–8094. doi: 10.1002/2016jc012210
Zhang, H., Beggs, H., Merchant, C. J., Wang, X. H., Majewski, L., Kiss, A. E., et al. (2018). Comparison of SST diurnal variation models over the tropical warm pool region. J. Geophys. Res. Oceans 123, 3467–3488. doi: 10.1029/2017jc013517
Keywords: sea surface temperature, observations, GHRSST, satellite, in situ, Fiducial Reference Measurements, operational oceanography, climate data records
Citation: O’Carroll AG, Armstrong EM, Beggs HM, Bouali M, Casey KS, Corlett GK, Dash P, Donlon CJ, Gentemann CL, Høyer JL, Ignatov A, Kabobah K, Kachi M, Kurihara Y, Karagali I, Maturi E, Merchant CJ, Marullo S, Minnett PJ, Pennybacker M, Ramakrishnan B, Ramsankaran R, Santoleri R, Sunder S, Saux Picart S, Vázquez-Cuervo J and Wimmer W (2019) Observational Needs of Sea Surface Temperature. Front. Mar. Sci. 6:420. doi: 10.3389/fmars.2019.00420
Received: 31 October 2018; Accepted: 05 July 2019;
Published: 20 August 2019.
Edited by:
Sabrina Speich, École Normale Supérieure, FranceReviewed by:
Gilles Reverdin, Centre National de la Recherche Scientifique (CNRS), FranceAlberto Ricardo Piola, Naval Hydrographic Service, Argentina
Copyright © 2019 O’Carroll, Armstrong, Beggs, Bouali, Casey, Corlett, Dash, Donlon, Gentemann, Høyer, Ignatov, Kabobah, Kachi, Kurihara, Karagali, Maturi, Merchant, Marullo, Minnett, Pennybacker, Ramakrishnan, Ramsankaran, Santoleri, Sunder, Saux Picart, Vázquez-Cuervo and Wimmer. This is an open-access article distributed under the terms of the Creative Commons Attribution License (CC BY). The use, distribution or reproduction in other forums is permitted, provided the original author(s) and the copyright owner(s) are credited and that the original publication in this journal is cited, in accordance with accepted academic practice. No use, distribution or reproduction is permitted which does not comply with these terms.
*Correspondence: Anne G.O’Carroll, YW5uZS5vY2Fycm9sbEBldW1ldHNhdC5pbnQ=