 Christian K. Fender1*
 Thomas B. Kelly1,2
 Lionel Guidi3
 Mark D. Ohman4
 Matthew C. Smith1
 Michael R. Stukel1,2
- 1Department of Earth, Ocean, and Atmospheric Science, Florida State University, Tallahassee, FL, United States
- 2Center for Ocean-Atmospheric Prediction Studies, Florida State University, Tallahassee, FL, United States
- 3Observatoire Océanologique, Laboratoire d’Océanographie de Villefranche, Sorbonne Université, Villefranche-sur-Mer, France
- 4Integrative Oceanography Division, Scripps Institution of Oceanography, La Jolla, CA, United States
Sinking particles transport organic carbon produced in the surface ocean to the ocean interior, leading to net storage of atmospheric CO2 in the deep ocean. The rapid growth of in situ imaging technology has the potential to revolutionize our understanding of particle flux attenuation in the ocean; however, estimating particle flux from particle size and abundance (measured directly by in situ cameras) is challenging. Sinking rates are dependent on several factors, including particle excess density and porosity, which vary based on particle origin and type. Additionally, particle characteristics are transformed while sinking. We compare optically measured particle size spectra profiles (Underwater Vision Profiler 5, UVP) with contemporaneous measurements of particle flux made using sediment traps and 234Th:238U disequilibrium on six process cruises from the California Current Ecosystem (CCE) LTER Program. These measurements allow us to assess the efficacy of size-flux relationships for estimating fluxes from optical particle size measurements. We find that previously published parameterizations that estimate carbon flux from UVP profiles are a poor fit to direct flux measurements in the CCE. This discrepancy is found to result primarily from the important role of fecal pellets in particle flux. These pellets are primarily in a size range (i.e., 100–400 μm) that is not well-resolved as images by the UVP due to the resolution of the sensor. We develop new, CCE-optimized parameters for use in an algorithm estimating carbon flux from UVP data in the southern California Current (Flux = ), with A = 15.4, B = 1.05, d = particle diameter (mm) and Flux in units of mg C m–2 d–1. We caution, however, that increased accuracy in flux estimates derived from optical instruments will require devices with greater resolution, the ability to differentiate fecal pellets from low porosity marine snow aggregates, and improved sampling of rapidly sinking fecal pellets. We also find that the particle size-flux relationships may be different within the euphotic zone than in the shallow twilight zone and hypothesize that the changing nature of sinking particles with depth must be considered when investigating the remineralization length scale of sinking particles in the ocean.
Introduction
Each year, approximately 40–50 Pg of carbon dioxide (CO2) is fixed into organic matter in the ocean via photosynthesis (Le Quéré et al., 2018). The majority of this fixed carbon fuels the surface ecosystem and is quickly respired back into CO2, which then equilibrates with the atmosphere. A small fraction of the organic matter produced by primary productivity escapes the euphotic zone and is transported to depth, primarily as sinking particles (Ducklow et al., 2001; Siegel et al., 2016). This process, known as the biological carbon pump (BCP), isolates carbon from the atmosphere for decades to centuries (Volk and Hoffert, 1985), and is estimated to transport between 5 and 13 Pg C from the euphotic zone each year (Henson et al., 2011; Laws et al., 2011; Siegel et al., 2014). Since marine photosynthesis accounts for about half of global photosynthesis (Field et al., 1998), the BCP is a key component in determining global and regional carbon budgets, which in turn are important for understanding climate change and for predicting environmental changes in future climate scenarios. Unfortunately, due to the numerous and complex processes that contribute to and influence the BCP, predicting its responses to climate change remains difficult (Passow and Carlson, 2012; Boyd, 2015; Burd et al., 2016).
The BCP is comprised of a suite of processes including active transport by vertically migrating zooplankton and nekton (Steinberg et al., 2000; Hannides et al., 2009; Stukel et al., 2013; Davison et al., 2015; Kelly et al., 2019), subduction of refractory dissolved organic carbon (Carlson et al., 1994; Hansell et al., 1997), and subduction of particulate organic matter (Levy et al., 2013; Omand et al., 2015; Stukel and Ducklow, 2017; Llort et al., 2018), in addition to the flux of sinking particles (Martin et al., 1987; Buesseler and Boyd, 2009). However, sinking particles are typically assumed to dominate vertical flux relative to these other pathways of carbon transport (Turner, 2015; Stukel et al., 2018b; Archibald et al., 2019). Quantifying the responses of the BCP to predicted changes in temperature, stratification, and surface wind stress thus requires sustained measurements of sinking particle flux across a wide range of marine ecosystems.
Sinking particle flux has traditionally been measured using sediment traps (Martin et al., 1987; Buesseler, 1991; McDonnell et al., 2015). These instruments have known issues associated with hydrodynamic biases, particle dissolution, and contamination by swimming zooplankton (Knauer et al., 1984; Baker et al., 1988; Lee et al., 1992; Buesseler et al., 2007). However, short-term deployments using surface-tethered traps with a large aspect ratio (height:diameter) and free-floating, neutrally buoyant sediment traps seem to give accurate estimates of particle flux from the euphotic zone. Unfortunately, these short-term deployments require a substantial ship-time investment, because they typically require that a large research vessel remain in the vicinity of deployment for a period of days. This substantial cost has limited such time-series to only a few oceanic regions (Church et al., 2013; Lomas et al., 2013). Large, conical time-series traps, by contrast, offer an affordable approach to quantifying annual fluxes in the deep ocean (Honjo et al., 2008), but may exhibit extreme biases when deployed at shallow depths (Buesseler et al., 2010).
Clearly additional approaches are necessary in order to measure interannual variability in the global magnitude of the BCP. Radionuclide disequilibrium techniques (especially 238U-234Th) provide one approach that requires substantially less ship-time investment (Buesseler et al., 1995; Van der Loeff et al., 2006; Waples et al., 2006). These methods exploit differences in activity between a conservative parent radionuclide and a particle-reactive, shorter-lived daughter isotope (Cochran et al., 2006; Waples et al., 2006). When the daughter particle is removed from the surface ocean through scavenging onto sinking particles a disequilibrium between parent and daughter is created. Measurement of this disequilibrium provides an estimate of radionuclide flux during a period of time related to the half-life of the daughter particle (Savoye et al., 2006). Radionuclide approaches are a powerful tool, because they measure a property (disequilibrium) that is directly created via particle flux and measurements can typically be made from a single CTD-Niskin rosette cast (Benitez-Nelson et al., 2001). However, substantial uncertainty can be introduced into carbon flux estimates from radionuclide disequilibrium due to high variability in carbon:radionuclide ratios over even relatively small distances (Buesseler et al., 2006; Hung and Gong, 2010; Stukel and Kelly, 2019). Furthermore, radionuclide disequilibrium approaches are a moderately costly and time-intensive approach (at sea and post-cruise) and not suitable for autonomous measurements.
In recent years, the evolution of in situ optical/imaging approaches has opened up an indirect method for estimating particle flux (Jackson et al., 1997; Checkley et al., 2008; Picheral et al., 2010; Boss et al., 2015). These optical approaches permit high resolution sampling and are fully compatible with short station occupations. They enable particle flux estimation through either prolonged sampling durations that permit the observation of pulses of particles settling through the water column (Jackson et al., 2015), or, more commonly, through assumptions about the relationship between particle size and flux (Guidi et al., 2008; Iversen et al., 2010; Guidi et al., 2016; Ramondenc et al., 2016). However, there are substantial limitations associated with such approaches. Although theoretical arguments suggest a strong correlation between sinking speed and particle size, in situ measurements typically produce equivocal results (McDonnell and Buesseler, 2010; Jouandet et al., 2011). The poor correlation between sinking speed and size when measured in situ may result from the flux of <100-μm particles that are often not observed by optical instruments (Durkin et al., 2015) or as a result of the heterogeneity of sinking particles in the ocean and correspondingly different particle excess densities (Armstrong et al., 2009; Turner, 2015). Indeed, fecal pellets typically sink substantially faster than similarly sized marine snow aggregates (Stukel et al., 2014). Experimental results even show for a single particle class (abandoned appendicularian houses) that the aggregate size-sinking speed relationship changes with aggregate age (Lombard and Kiørboe, 2010; Lombard et al., 2013). There is thus good reason to believe that relationships between particle size and flux may be variable in time and space (Iversen et al., 2010; McDonnell and Buesseler, 2012).
In this study, we analyze results from six approximately month-long cruises in the California Current Ecosystem (CCE), during which we consistently deployed surface-tethered drifting sediment traps, quantified flux using 238U-234Th disequilibrium, and measured profiles of particle size and abundance using the Underwater Vision Profiler 5 (UVP, Picheral et al., 2010). The CCE is an ideal study site because it offers a wide range of ecosystem conditions and plankton communities with commensurate impacts on the composition of sinking particles (Stukel et al., 2012; Ohman et al., 2013; Goericke and Ohman, 2015). By microscopically quantifying fecal pellet flux and analyzing sinking particles and aggregates collected in polyacrylamide gels we further investigate the processes that alter the particle size-flux relationship. We then develop an algorithm, or more specifically a set of parameters to be used in an algorithm, optimized for the CCE that can potentially be used to estimate particle flux using both the UVP and fully autonomous instruments such as the Zooglider (Ohman et al., 2018). We present evidence that as our dataset encompasses a decade’s worth of data in the CCE, including various frontal regimes, mesoscale, and submesoscale phenomena, these parameterizations are far more accurate to the region than values previously published. We caution, however, that more accurate quantification of flux from optical measurements likely requires additional information beyond particle size spectra, including characteristics related to the composition and identification of the particle or aggregate.
Materials and Methods
Data Collection
Data for this study come from seven process cruises for the CCE Long Term Ecological Research (LTER) program (P0704, April 2007; P0810, October 2008; P1106, June 2006; P1208, August 2012; P1408, August 2014; P1604, April 2016; P1706, June 2017; Figure 1). Each cruise was organized into quasi-Lagrangian experimental cycles (hereafter ‘cycles’) lasting 2–5 days (Figure 1). Cycle locations were chosen after an initial hydrographic survey of the epipelagic zone using a Moving Vessel Profiler (Ohman et al., 2012). Cycles were then initiated by the deployment of a surface-tethered drifting sediment trap (Stukel et al., 2013). This sediment trap and/or an independent array used for incubation of in situ experiments was then used as a moving frame of reference to enable prolonged study of the chosen water parcel (Landry et al., 2009). During the duration of the experiment, a suite of measurements was made including 14C primary productivity (daily in situ incubations at 6–8 depths, Morrow et al., 2018), day-night paired net tows for mesozooplankton biomass and grazing (Landry et al., 2009), UVP measurements for zooplankton and particle vertical profiles (∼10 casts per cycle, beginning with the P0810 cruise, Ohman et al., 2012; Biard et al., 2018), and 238U-234Th disequilibrium (Stukel et al., 2019a). A total of 33 different cycles were conducted as a part of this study, although 3 cycles did not include UVP data and 4 cycles do not have 234Th data.
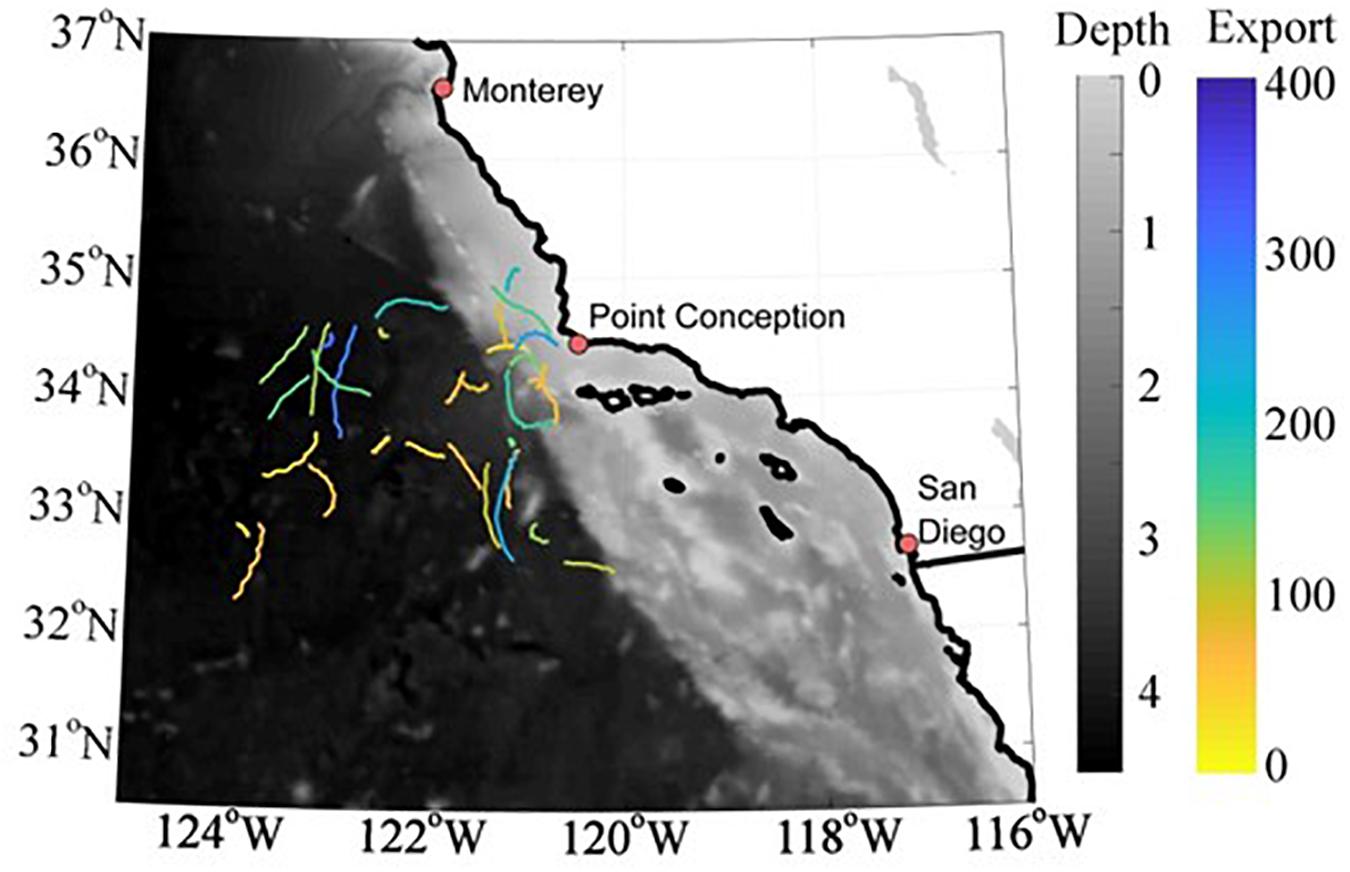
Figure 1. Map of study region with bathymetry shown in gray scale and Lagrangian cycle tracks colored based on sediment trap measured export at a depth of 100 m (mg C m– 2 d– 1).
Although we used identical methods on all cruises, the research foci of individual cruises varied leading to slightly different sampling strategies. During the P0704, P0810, P1408, and P1604 cruises our goal was to quantify ecosystem variability during El Niño neutral conditions (P0704 and P0810, Landry et al., 2012; Stukel et al., 2013) and during the anomalous 2014 warm conditions in the North Pacific and ensuing El Niño (P1408 and P1604, respectively; Kelly et al., 2018; Nickels and Ohman, 2018). On these cruises we thus sampled over a wide geographic region from water parcels near the Point Conception upwelling center to oligotrophic, offshore regions >400 km from shore. On the P1106 and P1208 cruises our focus was to investigate the impact of mesoscale fronts on ecological and biogeochemical dynamics (Krause et al., 2015; Stukel et al., 2017). Consequently, cycles were conducted over a more geographically restricted region, although ecosystem properties (phytoplankton biomass, primary productivity, mesozooplankton abundance, carbon export) varied substantially between the offshore side, coastal side, and core of these fronts. On the P1706 cruise our goal was to elucidate the role of mesoscale filaments in offshore transport of nutrients, carbon, and plankton communities. Cycles on this cruise were conducted over a reasonably large geographical area, as a result of the large spatial extent of the filament. However, these cycles can be considered a relatively coherent analysis of the temporal progression of a water parcel that is upwelled near the coast and ages over a period of weeks as it is advected from shore.
Sediment Traps
We used VERTEX-style drifting sediment traps with 69.85-mm inner diameter and an 8:1 aspect ratio (height:diameter) topped by a baffle constructed from smaller beveled tubes with a similar aspect ratio (Knauer et al., 1979). During P0704, cross frames consisting of 8 or 12 trap tubes were deployed at 100 m depth. On P0810, P1106, and P1208 cruises, traps were deployed at 100 m depth and also just below the base of the euphotic zone (if the euphotic zone was shallower than 75 m). On P1408, P1604, and P1706 cruises traps were deployed at the base of the euphotic zone, 100 m, and 150 m. Trap tubes were filled with a hypersaline, poisoned brine solution (0.4% formaldehyde final concentration). Upon recovery, the overlying seawater was gently siphoned before the samples were gravity filtered through a 200-μm filter. This filter was then examined under a stereomicroscope to enable manual removal of swimming mesozooplankton taxa. After swimmer removal the <200-μm and >200-μm size fractions were recombined and samples were split for multiple analyses using a Folsom splitter. Samples for particulate organic carbon (POC) and nitrogen were filtered through pre-combusted glass fiber filters and frozen prior to fumigation with HCl and analysis with a CHN analyzer or isotope ratio mass spectrometer. Samples for C:234Th ratios were filtered through pre-combusted quartz (QMA) filters and analyzed as below. Chl-a and phaeopigments were measured by the acidification method (Strickland and Parsons, 1972). Samples for biogenic silica were filtered through a 0.6-μm polycarbonate filter and analyzed using a NaOH digestion procedure (Krause et al., 2015). A total of 33 different sediment trap deployments are included in this study and when individual depths are included, a total of 72 independent measurements of POC flux were made using sediment traps. See Stukel et al. (2013) and Morrow et al. (2018) for more details on sediment trap deployments and analyses.
On the P0704, P0810, and P1604 cruises, samples (typically ∼1/2 tube) were stored in the trap brine (kept in the dark) and analyzed under stereomicroscope on land to enumerate and size mesozooplankton fecal pellets. Samples were placed in a settling chamber and fecal pellets were allowed to sink to the bottom for >6 h. Water was then gently decanted through a 60-μm filter to ensure that none remained in the overlying water. Pellets were then transferred to a gridded petri dish and random grids were selected for analysis. Fecal pellets were identified by eye and imaged with a dedicated digital camera. From calibrated images, the length and width of each fecal pellet was recorded and a shape-specific volume and ESD were calculated. A shape-specific carbon to volume relationship (determined from CCE fecal pellet samples, Stukel et al., 2013) was applied in order to calculate the carbon content of each pellet.
On the P1706 cruise we also deployed sediment trap tubes containing a polyacrylamide gel designed to enable imaging of intact aggregates (Ebersbach and Trull, 2008; McDonnell and Buesseler, 2010). These trap tubes were identical to tubes used for other analyses, except that they were unbaffled to ensure that there was no bias against > 1-cm aggregates. The gel was contained in a custom-made acrylic chamber with an 82.55-mm inner diameter (i.e., slightly larger than the trap tube above it), because on previous cruises we found that material often clustered near the edge of the gel. Immediately after the cruise, a series of images covering the entire gel was taken under both bright field and dark field at 7.5X magnification (effective resolution 11.6 μm/pixel) with a Zeiss Discovery V20 stereomicroscope. 7.5X magnification bright field images were manually stitched together using Photoshop software. Particles were then manually circled and length, width, and area were extracted using Image J processing software (dark field images were simultaneously viewed to aid in particle and aggregate identification). A random set of locations on the gel was also imaged at 20X and 40X magnification. These higher magnification images were used only for qualitative analysis of smaller particles, because non-uniform loading of particles across the gel traps limited our ability to compute abundances from these images. Because the P1706 cruise had considerably higher particle flux than measured on previous cruises (beneath a coastal filament), particle loading at times obscured portions of the gel. Hence we were not able to image all of the particles on the gel and do not consider our analyses to give accurate estimates of the total flux of particles in any given size bin. Nevertheless, manual inspection of the images suggests no bias toward or against any particle size classes, so we believe that the slope of the particle size spectrum determined from the 7X magnification images of the acrylamide gels is accurate, although the intercept will not be.
234Th:238U Disequilibrium
Watercolumn 234Th activity was measured using standard small volume methods (Pike et al., 2005). 4-L samples were drawn from Niskin bottles at typically 10–12 depths spanning the upper 200 m of the water column, with vertical resolution chosen to give higher resolution in the upper euphotic zone and/or near the deep chlorophyll maximum depending on water column structure. Samples were immediately acidified and spiked with a 230Th tracer. After an equilibration period, NH4OH was added to adjust to a pH of 8–9 and manganese chloride and potassium permanganate were added. >8 h later, manganese oxide precipitate was vacuum filtered onto a QMA filter, which was dried and mounted on a RISO sample holder. Beta activity was then measured with a RISO low background beta counter. After a final beta activity measurement > 6 half-lives after collection, filters were digested in an 8M HNO3/10% H2O2 solution, spiked with 229Th, and sonicated for 20 min. Th was then selectively isolated by ion chromatography, and isotope ratios (229:230Th) were determined by inductively coupled plasma mass spectroscopy (at the Woods Hole Oceanographic Institution Analytical Lab or the National High Magnetic Field Laboratory) and used to determine 234Th yield. We determined 238U-234Th deficiency after estimating 238U activity from a linear salinity-uranium relationship (Owens et al., 2011). To quantify sediment trap sampling efficiency, we applied a one-dimensional steady-state equation without upwelling (Savoye et al., 2006). We then compared estimates of 234Th flux from the 238U-234Th disequilibrium approach to direct measurements of 234Th flux into sediment traps. C:234Th ratios determined from particles collected directly from sediment traps were then used in conjunction with the steady-state equation to derive carbon fluxes for the sediment trap depths.
Blended Flux Attenuation
Comparisons of sediment trap and 234Th results suggested no substantial over- or under-estimation of flux by either methodology (see Results section “Comparison of Sediment Trap and 238U-234Th Deficiency Estimates”). However, we note that the time-scale of flux measured by sediment traps (2–5 days) was matched with the time-scale of flux estimated via UVP (average of profiles determined over the same 2–5 days), while the time-scale of flux estimated by 234Th is approximately 1 month. Unlike sediment traps, the 234Th measurements can be used to determine continuous profiles of vertical flux equivalent to the vertical profiles of flux estimated by UVP. Consequently, we chose to create a blended export flux estimate that is equal to the sediment trap-derived flux at the deployment depths, while 234Th measurements are used to extrapolate between sediment trap depths, above the shallowest trap deployment depth, and below the deepest deployment depth.
Assuming steady-state conditions without upwelling, carbon flux as a function of depth can be calculated from 234Th-238U deficiency using the equation:
Thus carbon flux attenuation (CFA) can be calculated as:
where CTh(D) is the C:234Th ratio of sinking particles at the depth horizon D, λ234 is the decay constant for 234Th, and Def(z) is the 238U-234Th deficiency at depth z. Stukel et al. (2019a) developed a robust algorithm for estimating the C:234Th ratio of sinking particles in the CCE from the ratio of vertically integrated POC to vertically integrated watercolumn 234Th (vC:234Thtot):
Combining Equations 1 and 2 allows us to quantify CFA and hence create smooth profiles of carbon flux above and below sediment trap depths. When sediment traps were deployed on two or more depths for the same cycle, we used C:234Th ratio measurements from those cycles to define the slope (m) in Equation 3. When sediment traps were deployed at only a single depth, we used the CCE average slope calculated by Stukel et al. (2019a): m = 0.43 ± 0.03. In between sediment trap deployment depths, we stretched the CFA profiles (i.e., multiplied Equation 2 by a constant) to ensure that the blended profiles exactly matched sediment trap-derived flux. Throughout the manuscript we are careful to differentiate between direct POC flux estimates made by sediment traps and blended POC flux estimates determined as above. For more details on calculating these blended profiles see Stukel et al. (2019b).
UVP Measurements and Data Processing
The UVP was attached downward facing on the CTD Niskin-rosette, allowing for contemporaneous particle imaging and water column characterization, typically on 10 casts per cycle. For P0810, P1208, P1408, and P1604 the UVP5 standard definition model was used while for P1106 and P1706 a zooming version and HD model were deployed respectively. Each instrument was cross-calibrated in the lab prior to deployment. The UVP images a volume of ∼1 L with each image and takes 6 images per second. It was typically deployed to a depth of 500 m. Post-cruise, data were processed using published Matlab scripts and uploaded to the Ecotaxa website1.
Particle data were obtained from the Particle Module of the Ecotaxa website. While the UVP reliably images organisms with a size > 600-μm by converting the pixel border length to metric dimensions, it can also be used to quantify particle size and abundance down to the calibrated pixel size of the sensor, though for such small particles this is not as straight-forward a task. As a result of light-scattering, the relationship between the pixel area of particles and their corresponding metric area is non-linear and follows a power law function (Picheral et al., 2010). This equation may be defined as Sm = α⋅(Sp)β where Sp is the surface of the particle in pixels, Sm is particle area in squared millimeters, and α and β are calibration constants for the UVP that were determined every year prior to deployment. Equivalent spherical diameter (ESD) was then calculated for each particle using this relationship. The unfiltered size range of particles measured by the UVP ranged from 42 μm to 81 mm, but to be consistent with previous literature we kept the upper size limit for flux calculations of 1.5 mm used by Guidi et al. (2008). As for the lower size limit, in addition to the limits imposed by camera resolution many of the exceptionally small signals were likely the result of noise or otherwise could not be reliably distinguished as actual particles, therefore raw particles were aggregated based on sampling year and used to plot particle size spectra (Supplementary Figure 1). From these spectra the point at which the particle abundance relationship no longer followed a power law function was determined. However, because the camera and calibrations varied between cruises, there was no consistent size range at which the slope of the power law function changed, yet it was necessary to apply a uniform cutoff in order to determine a single parameter set representative of the entire dataset. Two hundred μm was chosen as the minimum particle size as it represented a reasonable compromise when comparing the particle spectra and considering the importance of ∼200 μm fecal pellets in sediment trap derived export (discussed further in Section “Sinking Particle Size Spectrum”). However, we note that, particularly for the 2008 cruise, the UVP is likely underestimating the abundance of 200–400 μm particles as the smallest particles detected were of 240 μm ESD. The remaining particles were then grouped into 5-m depth bins and one of 19 logarithmically spaced size bins based on their ESD. The volume sampled per image was multiplied by the number of unique values per depth bin (and therefore images) to get the total volume imaged, then divided by the range of the size class to obtain number of particles per liter.
Since both the mass and sinking speed of a marine snow aggregates can be related to the ESD of the aggregate by power law relationships (Alldredge and Gotschalk, 1988; Alldredge, 1998; Lombard and Kiørboe, 2010), Guidi et al. (2008) suggested that total particle mass flux (F [mg C m–2 d–1]) can be calculated from the particle size distribution using the equation:
where ni [L–1 mm–1] is the particle number spectrum (i.e., the concentration of particles in bin i, divided by the bin width of bin i), di [mm] is the mid-point diameter of bin i, and A and B are constants related to the power law relationships that relate particle size to mass and settling velocity. Guidi et al. (2008) estimated values of A = 12.5 ± 3.4 and B = 3.81 ± 0.70 from 11 paired deployments of UVP and large conical sediment traps (typically two depths per deployment, with depths ranging from 100 to 1000 m, for a total of 23 independent flux measurements). Iversen et al. (2010) used a smaller number of deployments of similar large conical traps deployed at depths ranging from 1204–1866 m in the Mauritanian upwelling region and calculated different values for the constants in Equation 2: A = 273.8 and B = 4.27. They suggested that these values may vary regionally.
We calculated flux from Equation 4 based on the A and B values suggested by Guidi et al. (2008) and Iversen et al. (2010). In each instance, we averaged the flux estimates from the ∼10 casts per Lagrangian cycle and compared this flux estimate to the sediment trap-derived POC flux measurements (a total of 69 independent sediment trap-derived flux POC were made on cycles with associated UVP profiles). We also compared the UVP flux measurements to our blended flux profiles (separated into 5-m vertical bins from 50 to 200 m depth), which yielded 780 matchups between cycle average UVP flux and measured POC flux. In order to improve the model’s predictive capability for the CCE we calculated values of A and B specific to our dataset using a grid search method (to avoid the possibility of finding local, rather than global, minima). Following Guidi et al. (2008) and Iversen et al. (2010), we used a cost function equal to the square of the log-transformed differences between measurement and UVP-estimate:
where FUVP,i is the flux estimate for the ith sediment trap measurement (note that this is an average of all the UVP measurements at that depth for a specific Lagrangian cycle), FST,i is the flux measurement for sediment trap i, and n is the number of paired measurements (n = 69 for sediment trap-UVP comparisons). Although Guidi et al. (2008) and Iversen et al. (2010) used a lower threshold for particle size of 250 and 150 μm respectively (and we applied this limit when computing flux using their A and B values), we extended our particle size lower limit to 100 μm, when computing a CCE-optimized algorithm, because we found that small particles are particularly important to flux in the CCE.
Algorithm-Data Comparisons
In assessing the accuracy with which the UVP-dependent algorithms (i.e., models) approximate flux in the CCE, we treat sediment trap and sediment trap-234Th blended in situ measurements as “truth,” but fully acknowledge that error also exists in these data (Lynch et al., 2009). Where possible, measurement uncertainty is included in figures as ±1 standard deviation of the measurements, unless otherwise stated. Many different indices have been utilized to quantify model-data misfit (Stow et al., 2009). Following Guidi et al. (2008) and Iversen et al. (2010), we minimize the root mean log-transformed error (Equation 5) when determining a CCE-optimized UVP flux algorithm. However, we also routinely report the average error [], the average absolute error [], the average normalized absolute error [], and the Spearman’s rank correlation (ρ). AE provides an estimate of the overall bias for a model. AAE gives an estimate of how far a model estimate typically is from reality, but is heavily dependent on uncertainty during high flux periods. The ANAE gives an estimate of the typical misfit divided by the model estimate and hence gives relatively equal weight to high and low flux conditions, while the MNAE gives an estimate of how far from the true value a typical model estimate is likely to be. Spearman’s ρ quantifies how well the model and data covary.
Results
Comparison of Flux Estimates
Comparison of Sediment Trap and 238U-234Th Deficiency Estimates
There was agreement between flux estimates made using sediment trap and 238U-234Th deficiency approaches (Figure 2). When comparing 234Th flux estimates made using 238U-234Th deficiency and a one-dimensional steady-state approximation to 234Th flux directly measured in sediment traps, we found strong agreement in the mean, with sediment trap measurements across all cycles and depths averaging 1% greater 234Th flux than simultaneous 238U-234Th measurements. The median of the ratio of sediment trap-derived flux to 238U-234Th derived flux was 0.89. The sum of the squared log-transformed misfit between sediment trap and 238U-234Th deficiency-derived flux was 0.086. (Note that since two values of 238U-234Th deficiency-derived flux were negative and hence could not be log transformed, we replaced them with a value equal to 10% of the lowest positive 238U-234Th deficiency-derived flux measurement). The AE was −21 mg C m–2 d–1 and the ANAE was 0.19. The non-parametric Pearson’s correlation coefficient (r) between sediment trap and 238U-234Th deficiency-derived flux was 0.64 (p < 0.001). The weakest correlations between measurements occurred during the P1106 and P1208 cruises. This was not surprising, because on these cruises we focused on measurements within and immediately adjacent to strong mesoscale fronts. Residence time of water in these fronts (days) was substantially shorter than the temporal integration time-scale of 234Th measurements (∼1 month), but similar to the time-scale of sediment trap measurements (2–4 days). Cruise-average measurements determined by sediment traps and 234Th were, however, in close agreement for these two cruises (Figure 2B). When these cruise averages were used for P1106 and P1208 instead of the individual cycle averages, r increased to 0.76 (p = 5.2 × 10⁻⁸). This overall agreement gives us confidence that the sediment traps were accurately collecting sinking particles and that the mismatch between sediment traps and 238U-234Th deficiency were primarily caused by differences in time scales and by occasional invalidation of the no-upwelling assumption in the 238U-234Th deficiency calculations. However, we cannot rule out the possibility of a sampling bias for any specific deployment.
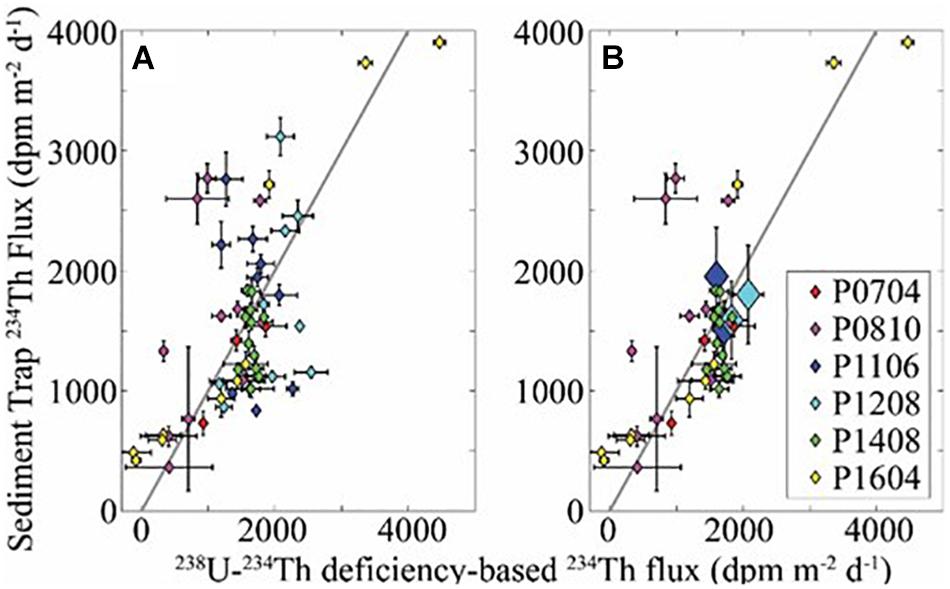
Figure 2. (A) Comparison of sediment trap and 238U-234Th-based measurements of 234Th flux for all Lagrangian cycles for cruises P0704, P0810, P1408, and P1604. Black line is 1:1 line. Non-parametric Spearman’s ρ = 0.51 (p = 4.9 × 10– 5). (B) Same as (A) but uses cruise averages for P1106 and P1208. Non-parametric Spearman’s ρ = 0.60 (p = 5.5 × 10– 5).
Comparison of Sediment Trap and UVP-Flux Estimates
In contrast to the sediment trap-thorium comparisons, we expect no mismatch in time scales between sediment trap and UVP-flux estimates. While the sediment traps integrate flux over the 2.25–5.25 days period of each Lagrangian experiment, the UVP estimates instantaneous flux during an individual profile. However, our UVP-derived flux measurements were based on approximately 10 casts per cycle, the first of which typically occurred less than 1 h after sediment trap deployment and the last of which typically occurred ∼4 h prior to sediment trap recovery. Nevertheless, the sediment trap–UVP flux misfit was substantially greater than the sediment trap-thorium misfits, whether using the Guidi et al. (2008) or the Iversen et al. (2010) parameterizations (Figure 3). The Guidi et al. (2008) parameterization yields estimates substantially below the expected sediment trap flux, often by an order of magnitude. The AE for this algorithm was −119.5 mg C m–2 d–1. This is a very large bias, considering that the average flux estimate from the algorithm was 42.1 mg C m–2 d–1. Indeed, the median flux estimated by this algorithm suggested a typical flux of 13 mg C m–2 d–1, which was lower than the minimum sediment trap-measured carbon flux (27 mg C m–2 d–1). This led to an ANAE equal to 6.0, suggesting that the true value was often 6-fold higher than that estimated by the Guidi et al. (2008) parameterization. In contrast, the Iversen et al. (2010) algorithm led to substantial overestimates of flux with AE = 754.3 mg C m–2 d–1. Both the mean (916 mg C m–2 d–1) and the median (600 mg C m–2 d–1) flux estimates from the Iversen algorithm were higher than the carbon flux quantified during any of our sediment trap deployments.
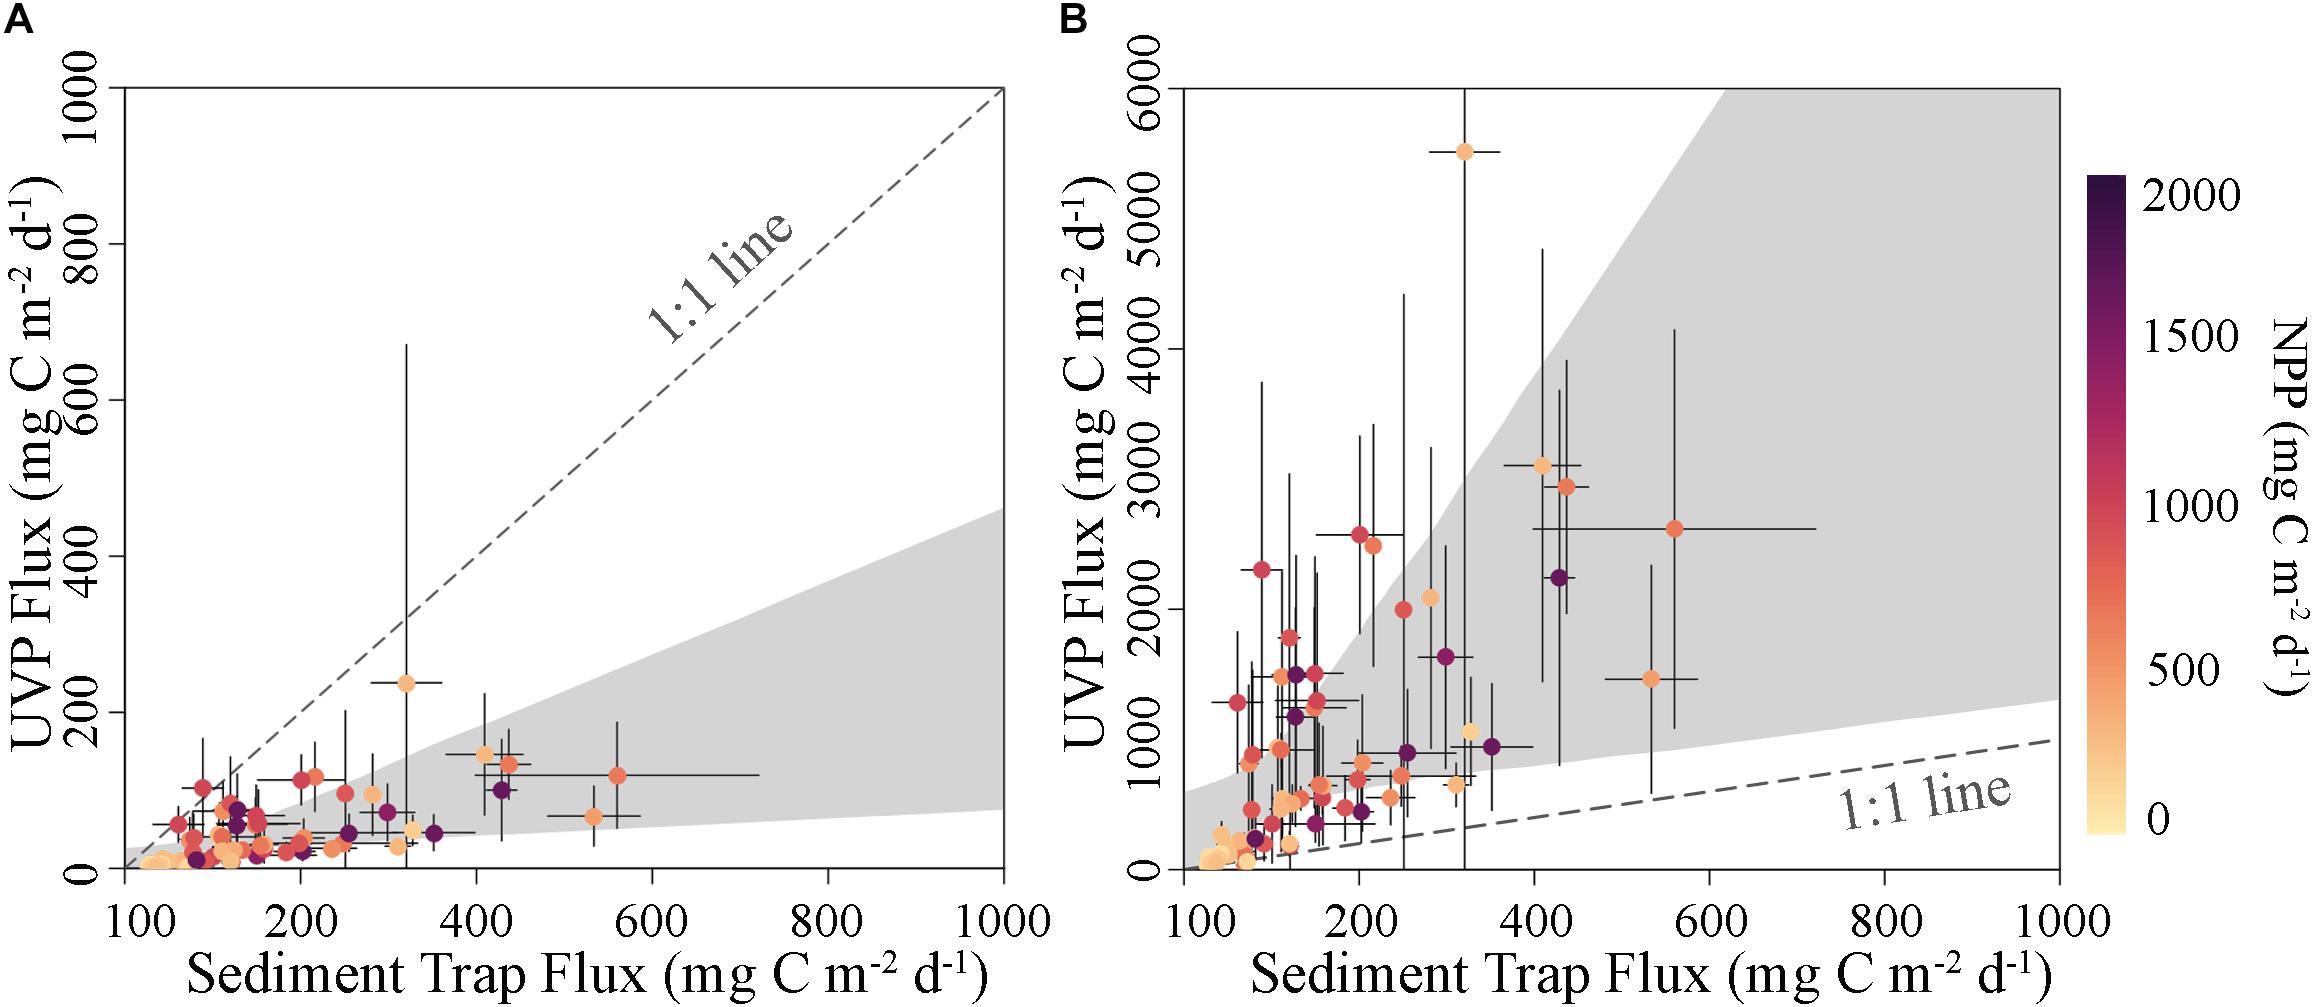
Figure 3. Comparison of flux estimates derived from sediment trap deployments and UVP algorithms using parameter values from (A) Guidi et al. (2008) and (B) Iversen et al. (2010) with shaded areas as the 95% confidence interval of an OLS regression determined via non-parametric bootstrapping. Each point is cycle averaged. Colors indicate vertically integrated NPP. Gray dashed lines are 1:1.
Sinking Particle Size Spectrum
To investigate particle size variability and its relationship to flux, we computed the spectral slope of the modeled particle size spectrum for the mixed layer (to elucidate the relationship between mixed layer dynamics and sediment trap-derived flux) and for the specific depths of sediment trap deployments (to compare particle size at trap depth to sediment trap-derived flux directly). We found a slight though statistically insignificant positive trend in the mixed layer (0–20 m) between mean spectral slope and mean particle abundance (ρ = 0.335, p = 0.081; Figure 4A), potentially indicating that mean particle size increases when particle abundance increases. This is likely the result of the dominance of large phytoplankton, particularly diatoms, during bloom conditions (Goericke, 2011a, b), which promote the presence of large zooplankton, large fecal pellets, and large aggregates that can all be detected by the UVP. Particle flux at 100 m depth was generally elevated when particle abundance and size spectral slope in the mixed layer were high. A weak potential trend was also seen when examining mean spectral slope as a function of mean particle abundance specifically for the depths at which sediment traps were deployed (ρ = 0.242, p = 0.075; Figure 4B). Interestingly, no relationship between mean spectral slope and sediment trap flux at corresponding depths was observed. However, particle flux was correlated with particle abundance at the same depth.
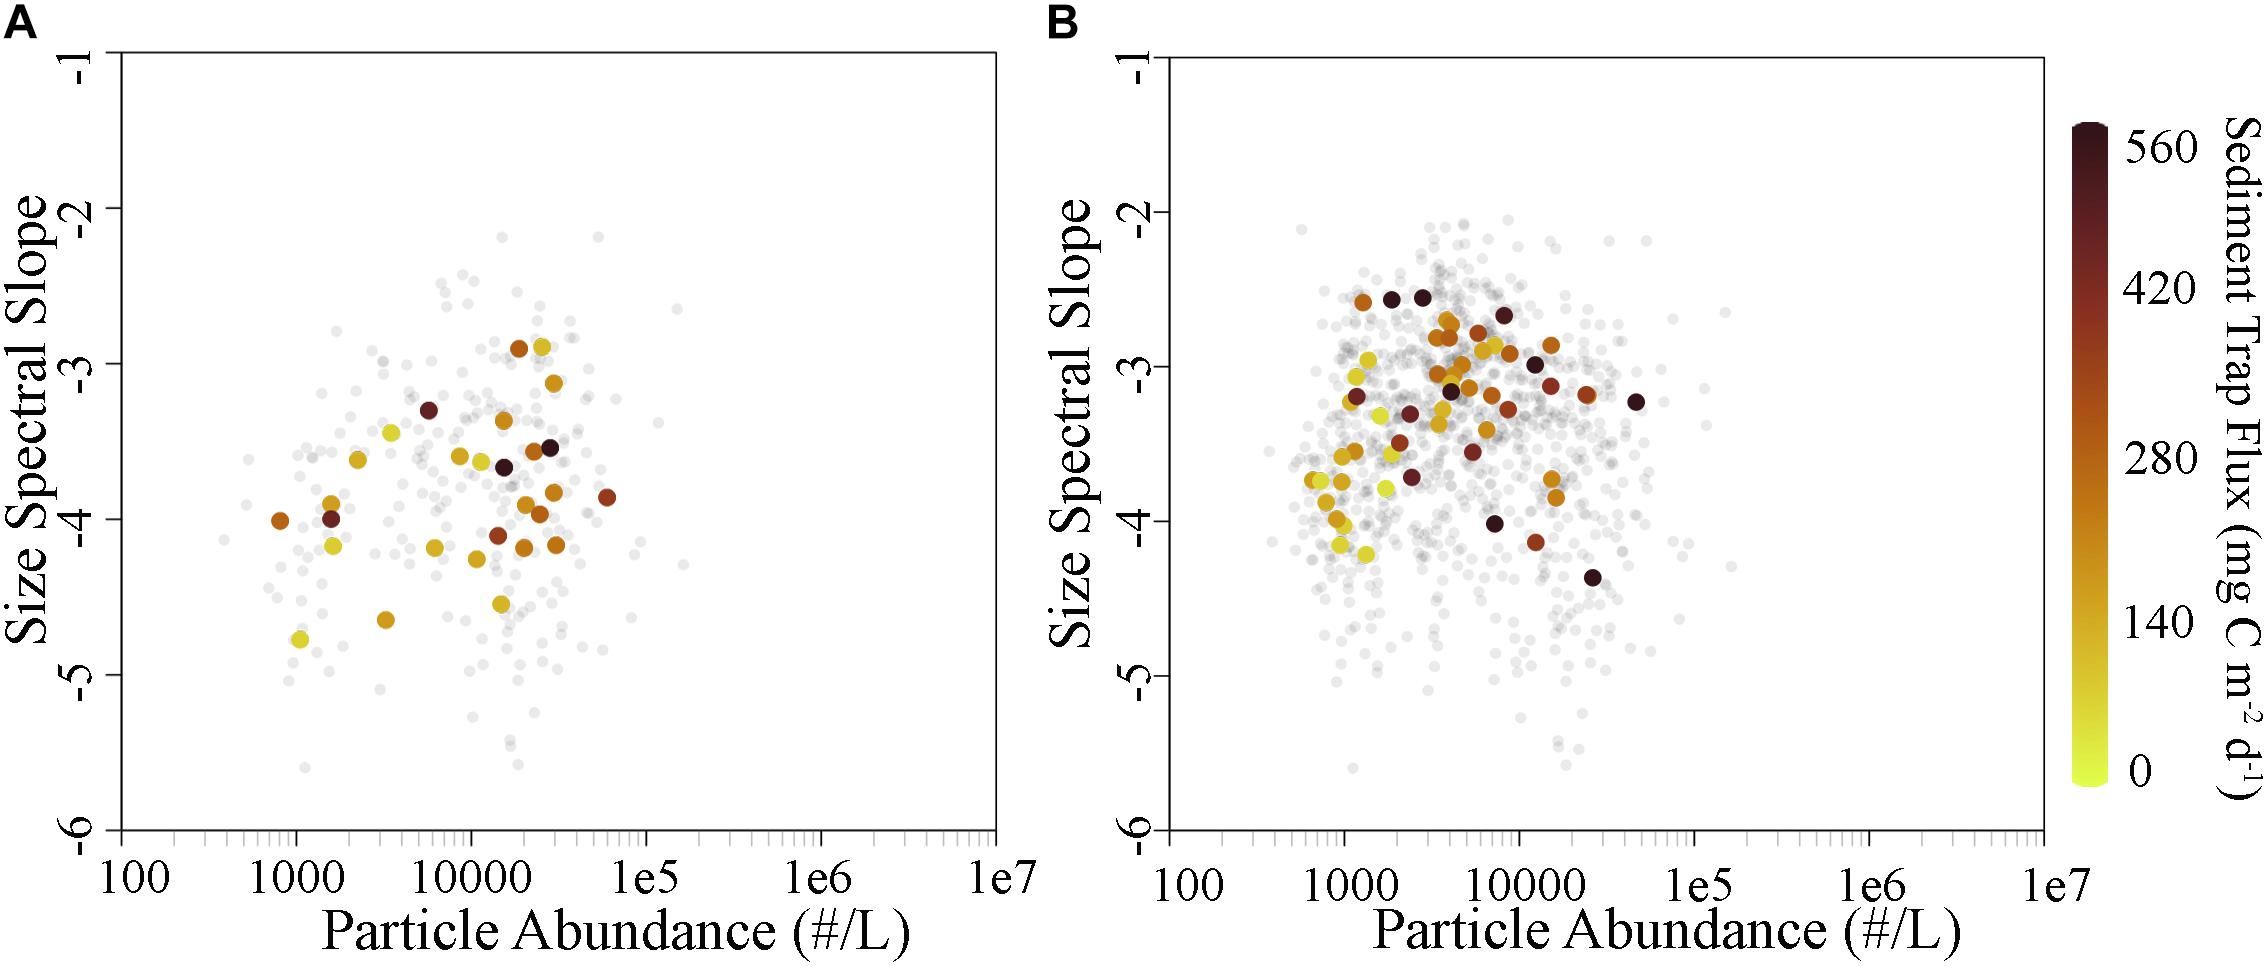
Figure 4. (A) Size spectral slope of particles for the mixed layer (0–20 m) colored by sediment trap flux at 100 m. (B) Same as (A) at each sediment trap deployment depth colored by the flux at that corresponding depth. Gray points are individual cast measurements, while colored points are cycle averages.
To compare the particle flux size spectrum estimated by UVP to the sinking particles collected directly by sediment trap, we quantified the abundance and size of recognizable fecal pellets collected in sediment traps on the P0704, P0810, and P1604 cruises (Stukel et al., 2013, 2018a; Morrow et al., 2018). This estimate of recognizable fecal pellets is an underestimate of total fecal flux, because it excludes pellets that had been degraded such that their original dimensions could not be determined, as well as pellets that were smaller than ∼60-μm. However, we also note that it is possible that some of these pellets were transported to depth within larger aggregates that would register as large marine snow particles in the UVP. Across all cruises and cycles, 50% of fecal pellet carbon flux was mediated by fecal pellets <272 μm in ESD. This is notable for two reasons. First, fecal pellets often dominated flux into the sediment traps, particularly during high flux periods (Morrow et al., 2018). Second, the Guidi et al. (2008) and Iversen et al. (2010) algorithms explicitly exclude particles with an ESD less than 250 and 150 μm, respectively, and find a relatively insignificant contribution to flux for all particles less than 500 μm. This inherent mismatch is due to the assumption built into previous applications of the UVP-flux approach that large particles such as marine snow aggregates dominate carbon flux. Indeed, some studies have found that a substantial portion of carbon flux was dominated by <64-μm particles (Hung et al., 2010; Durkin et al., 2015). In our study, 32% of the fecal pellet fluxes was derived from pellets with an ESD < 200-μm, while 63% was derived from pellets with a width of <200-μm. We find that if the flux of fecal pellets is added to the aggregate flux estimated by the Guidi et al. (2008) algorithm, we achieve a much better fit than if the Guidi et al. (2008) algorithm is used alone (Figure 5). While such an addition is surely an oversimplification and double-counts the >250 μm fecal pellets that are accounted for under the Guidi et al. (2008) algorithm, it illustrates the beginnings of a potential avenue for alleviating the apparent underestimation of flux. Furthermore, because of the large exponent found in the Guidi et al. (2008) algorithm, that algorithm assigns very little flux to particles in the size range of even large fecal pellets. There is, however, still a substantial misfit for cycles with low total flux. Despite the fact that recognizable fecal pellets were relatively few in these samples, the Guidi et al. (2008) algorithm substantially underestimated flux. These samples typically had a more negative size spectral slope (Figure 4). Hence it is possible that <60 μm fecal pellets were an important contributor to flux in these cycles or that smaller aggregates are more important than predicted by the Guidi et al. (2008) algorithm.
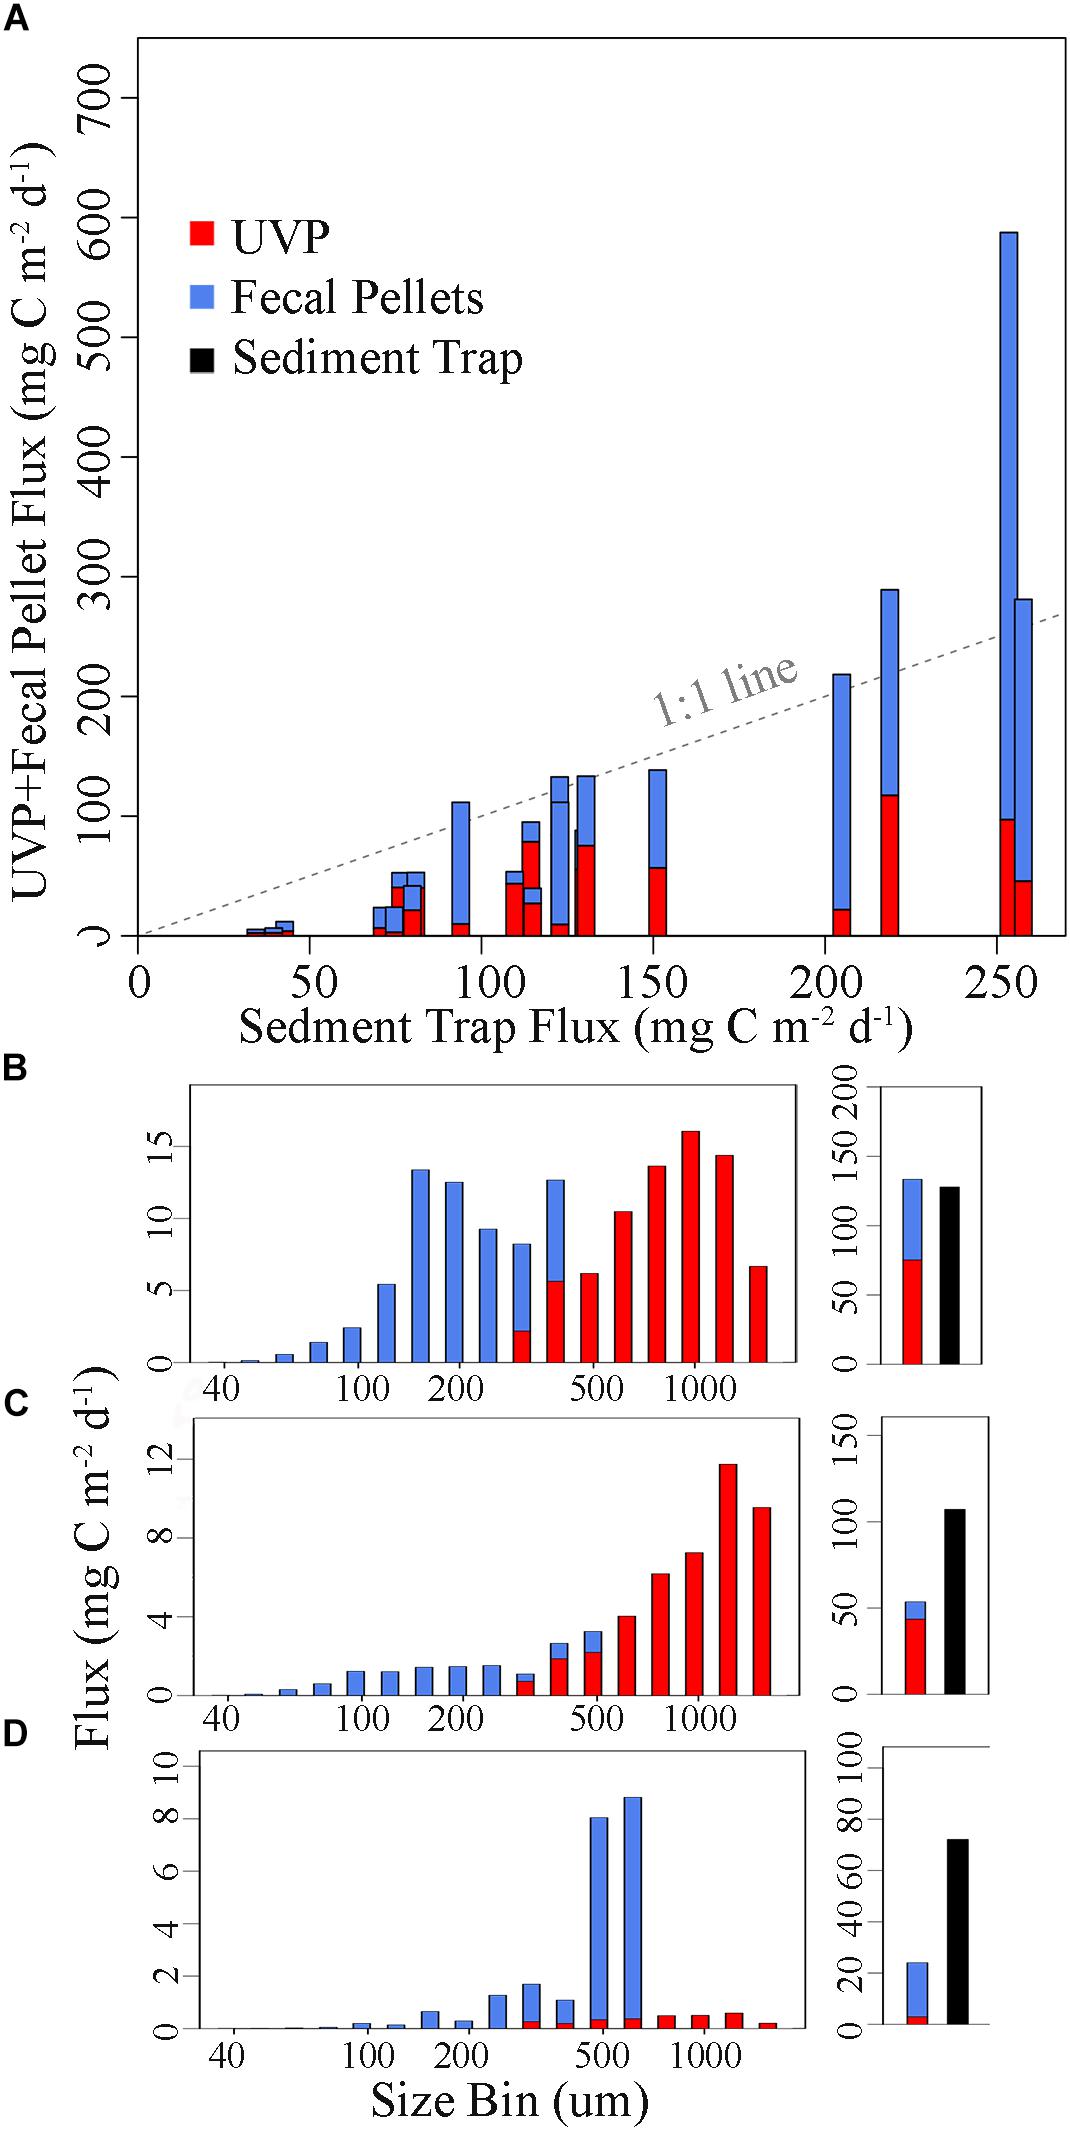
Figure 5. Relative contribution of different particle sizes to flux if it is assumed that the Guidi et al. (2008) algorithm measures marine snow flux (red) and the experimentally measured recognizable fecal pellet flux (blue) is an additional flux term. (A) Cycle averaged UVP (Guidi) + fecal pellet flux estimates for CCEP0810 and CCEP1604, plotted against sediment trap flux. UVP (Guidi) + Fecal pellet flux as a function of particle size for (B) P0810-5 at 60 m, (C) P0810-6 at 100 m, and (D) P1604-2 at 100 m. (B–D) Subplot on the right shows the sum of UVP and fecal pellet flux (red and blue, respectively) compared to sediment trap flux (black).
To further investigate the size-flux relationship, on the P1706 cruise we utilized polyacrylamide gels located in the bottom of sediment trap tubes to collect particles and aggregates without destroying the structure of marine snow during sediment trap recovery (Figure 6). Materials seen in the gels were primarily of fecal pellet origin and had primarily sunk as independent pellets, rather than within marine snow particles. Total volume flux was typically dominated by particles in the <600 μm size range (Figure 7). In one sample (Cycle P1706-1, 150 m depth), >50% of volume flux was dominated by greater than 1 mm particles (Figures 6a,b); however, these large particles were not marine snow. They were identified as fish (likely anchovy) fecal pellets. In three samples (P1706-2, 50 m; P1706-3, 60 m; and P1706-4, 50 m) marine snow aggregates were also noted in the samples. However, they appeared to be less dense than the acrylamide gel and hence were not in the same focal plane as the rest of the particles. Therefore they were not included in the data assembled in Figure 6, but their impact will be further considered in the Section “Discussion.” For P1706-2, three marine snow aggregates (equating to flux of 218 aggregates m–2 d–1) were noted with an average ESD of 2.3 mm. For P1706-3, 24 marine snow aggregates (1958 m–2 d–1) were noted with ESD ranging from 1.6 to 7.1 mm. For P1706-4, an estimated 57 marine snow aggregates (6550 m–2 d–1) with typical ESD of 2.5 mm were noted. However, in this sample, the aggregates were clumped together making it difficult to get an accurate count. In all samples, these marine snow aggregates appear to be approximately spherical and highly porous (Figures 6g,h). Some contained phytoplankters and a few contained small fecal pellets. However, their contribution to total fecal pellet flux into the samples was negligible (likely < 1%), and we cannot rule out the possibility that the fecal pellets only became attached to the aggregates after sinking into the traps. Regardless, the high porosity of the aggregates, relative dearth of phytoplankton and fecal debris associated with them, and the high abundance of fecal pellets elsewhere in the samples, suggested that these marine snow particles were only minor contributors to the total carbon flux in all samples. No such marine snow aggregates were noticed in the acrylamide gel traps deployed at 150 m.
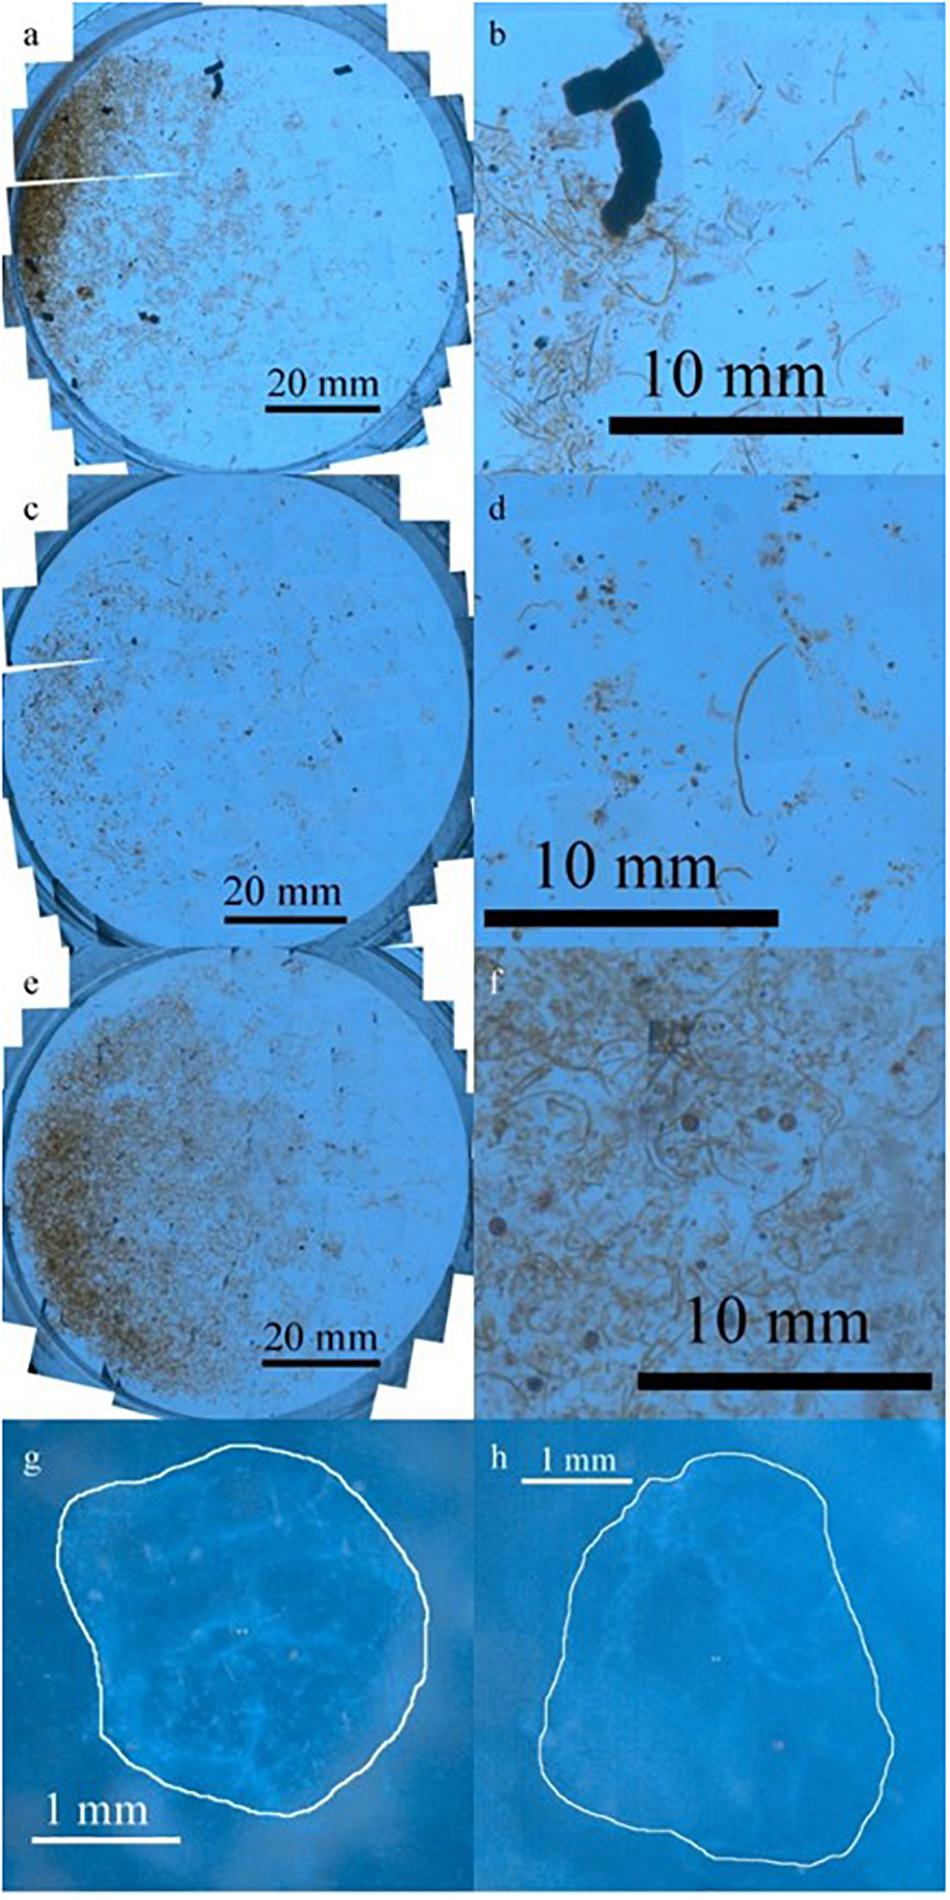
Figure 6. Representative images of particles collected in acrylamide gel sediment traps showing all particles (a,c,e), or magnified images of a subset of the particles (b,d,f). Images are from P1706-1, 150 m (a,b); P1706-3, 150 m (c,d); P1706-4, 50 m (e,f). (g,h) Show representative images of the porous marine snow aggregates that were seen floating on top of the gels.
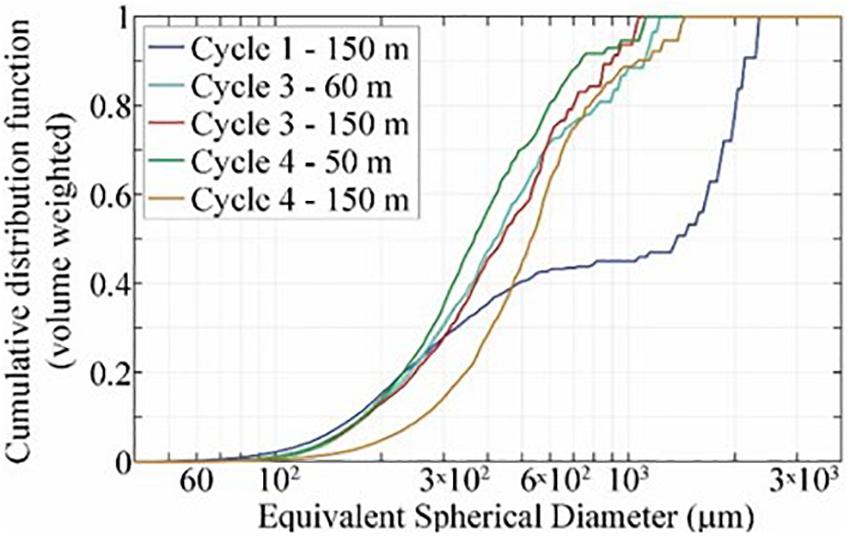
Figure 7. Volume-weighted cumulative distribution function for particles that sank into acrylamide gel sediment traps on the P1706 cruise. Note that these do not include several large, porous marine snow aggregates that did not penetrate the gels.
Although there is a notable difference between the size relationships of volume-weighted flux estimates determined using acrylamide gels (mid-point of volume flux at ∼500 μm) and the carbon-weighted flux estimates based on analyses of fecal pellets only (mid-point of mass flux at ∼270 μm) we suspect that this discrepancy is derived from the different carbon:volume ratios of different classes of fecal pellets (large krill fecal pellets had lower carbon density than small copepod and appendicularian pellets), rather than any other difference resulting from the different methodologies. We caution, however, that all cycles of the P1706 cruise were associated with either the early, middle, or decline phases of a coastal diatom bloom and had above average carbon flux. Hence, these results do not inform the question of what may be the source or size of sinking particles during low flux periods.
An Optimized UVP Algorithm for Estimating Flux in the CCE
Development of a CCE-Optimized Algorithm
We calculated CCE-optimized values for A and B in Equation 4 that minimize the misfit to our sediment trap data as quantified in Equation 5. Results suggest values of A = 15.4 and B = 1.05. Notably, our value for B is substantially lower than the values of 3.81 and 4.27 calculated by Guidi et al. (2008) and Iversen et al. (2010), respectively. B reflects the relative contributions of large and small particles to mass flux. Large values for B imply that large particles have a commensurately greater impact on mass flux relative to their standing stock as a result of increased mass, increased settling velocities, or a combination of the two. Since particle volume increases with ESD3, a value of B < 3 suggests that either the density or sinking speed of particles is inversely correlated with particle ESD.
The AE of our parameterization compared to sediment trap derived flux was 43.5 mg C m–2 d–1, with a median misfit of −0.142 mg C m–2 d–1, suggesting that the algorithm had relatively low bias. The AAE and ANAE were 97.4 mg C m–2 d–1 and 0.6, respectively. Thus the CCE-optimized algorithm can be expected to under- or over-estimate flux by 97.4 mg C m–2 d–1 and the true value of flux should be expected to be within ±60% of the estimated value. These values suggest reasonably good model-data agreement, considering that the sediment trap estimates of carbon flux varied by a factor of 21 (from 27 to 560 mg C m–2 d–1), and that with the previously published algorithms, median export estimates were 77% lower (with the Guidi et al., 2008 algorithm) or 433% higher (with the Iversen et al., 2010 algorithm) than measured flux, while the CCE-optimized algorithm typically overestimated flux by only 16%.
Algorithm-Data Misfits
After the UVP carbon export estimates were obtained using the fitted parameters, the misfit (defined as UVP-ST flux) was examined against a variety of environmental parameters including primary productivity, depth, the slope of the size spectra, and the ratios of biogenic silicon, chlorophyll, phaeopigments, and nitrogen to organic carbon sinking material in order to evaluate covariance (Figure 8). In most cases these relationships were not significant. However, misfits were typically lower (i.e., UVP algorithm underestimated flux) when Si:C ratios were low (ρ = 0.46, p = 0.004; Figure 8B). This is the opposite of the effect we would expect if discrepancies were driven by increased silica-ballasting causing an increase in sinking speeds of similarly sized particles. This misfit also tended to be negative during cycles with the lowest primary production (ρ = 0.312, p = 0.026; Figure 8D).
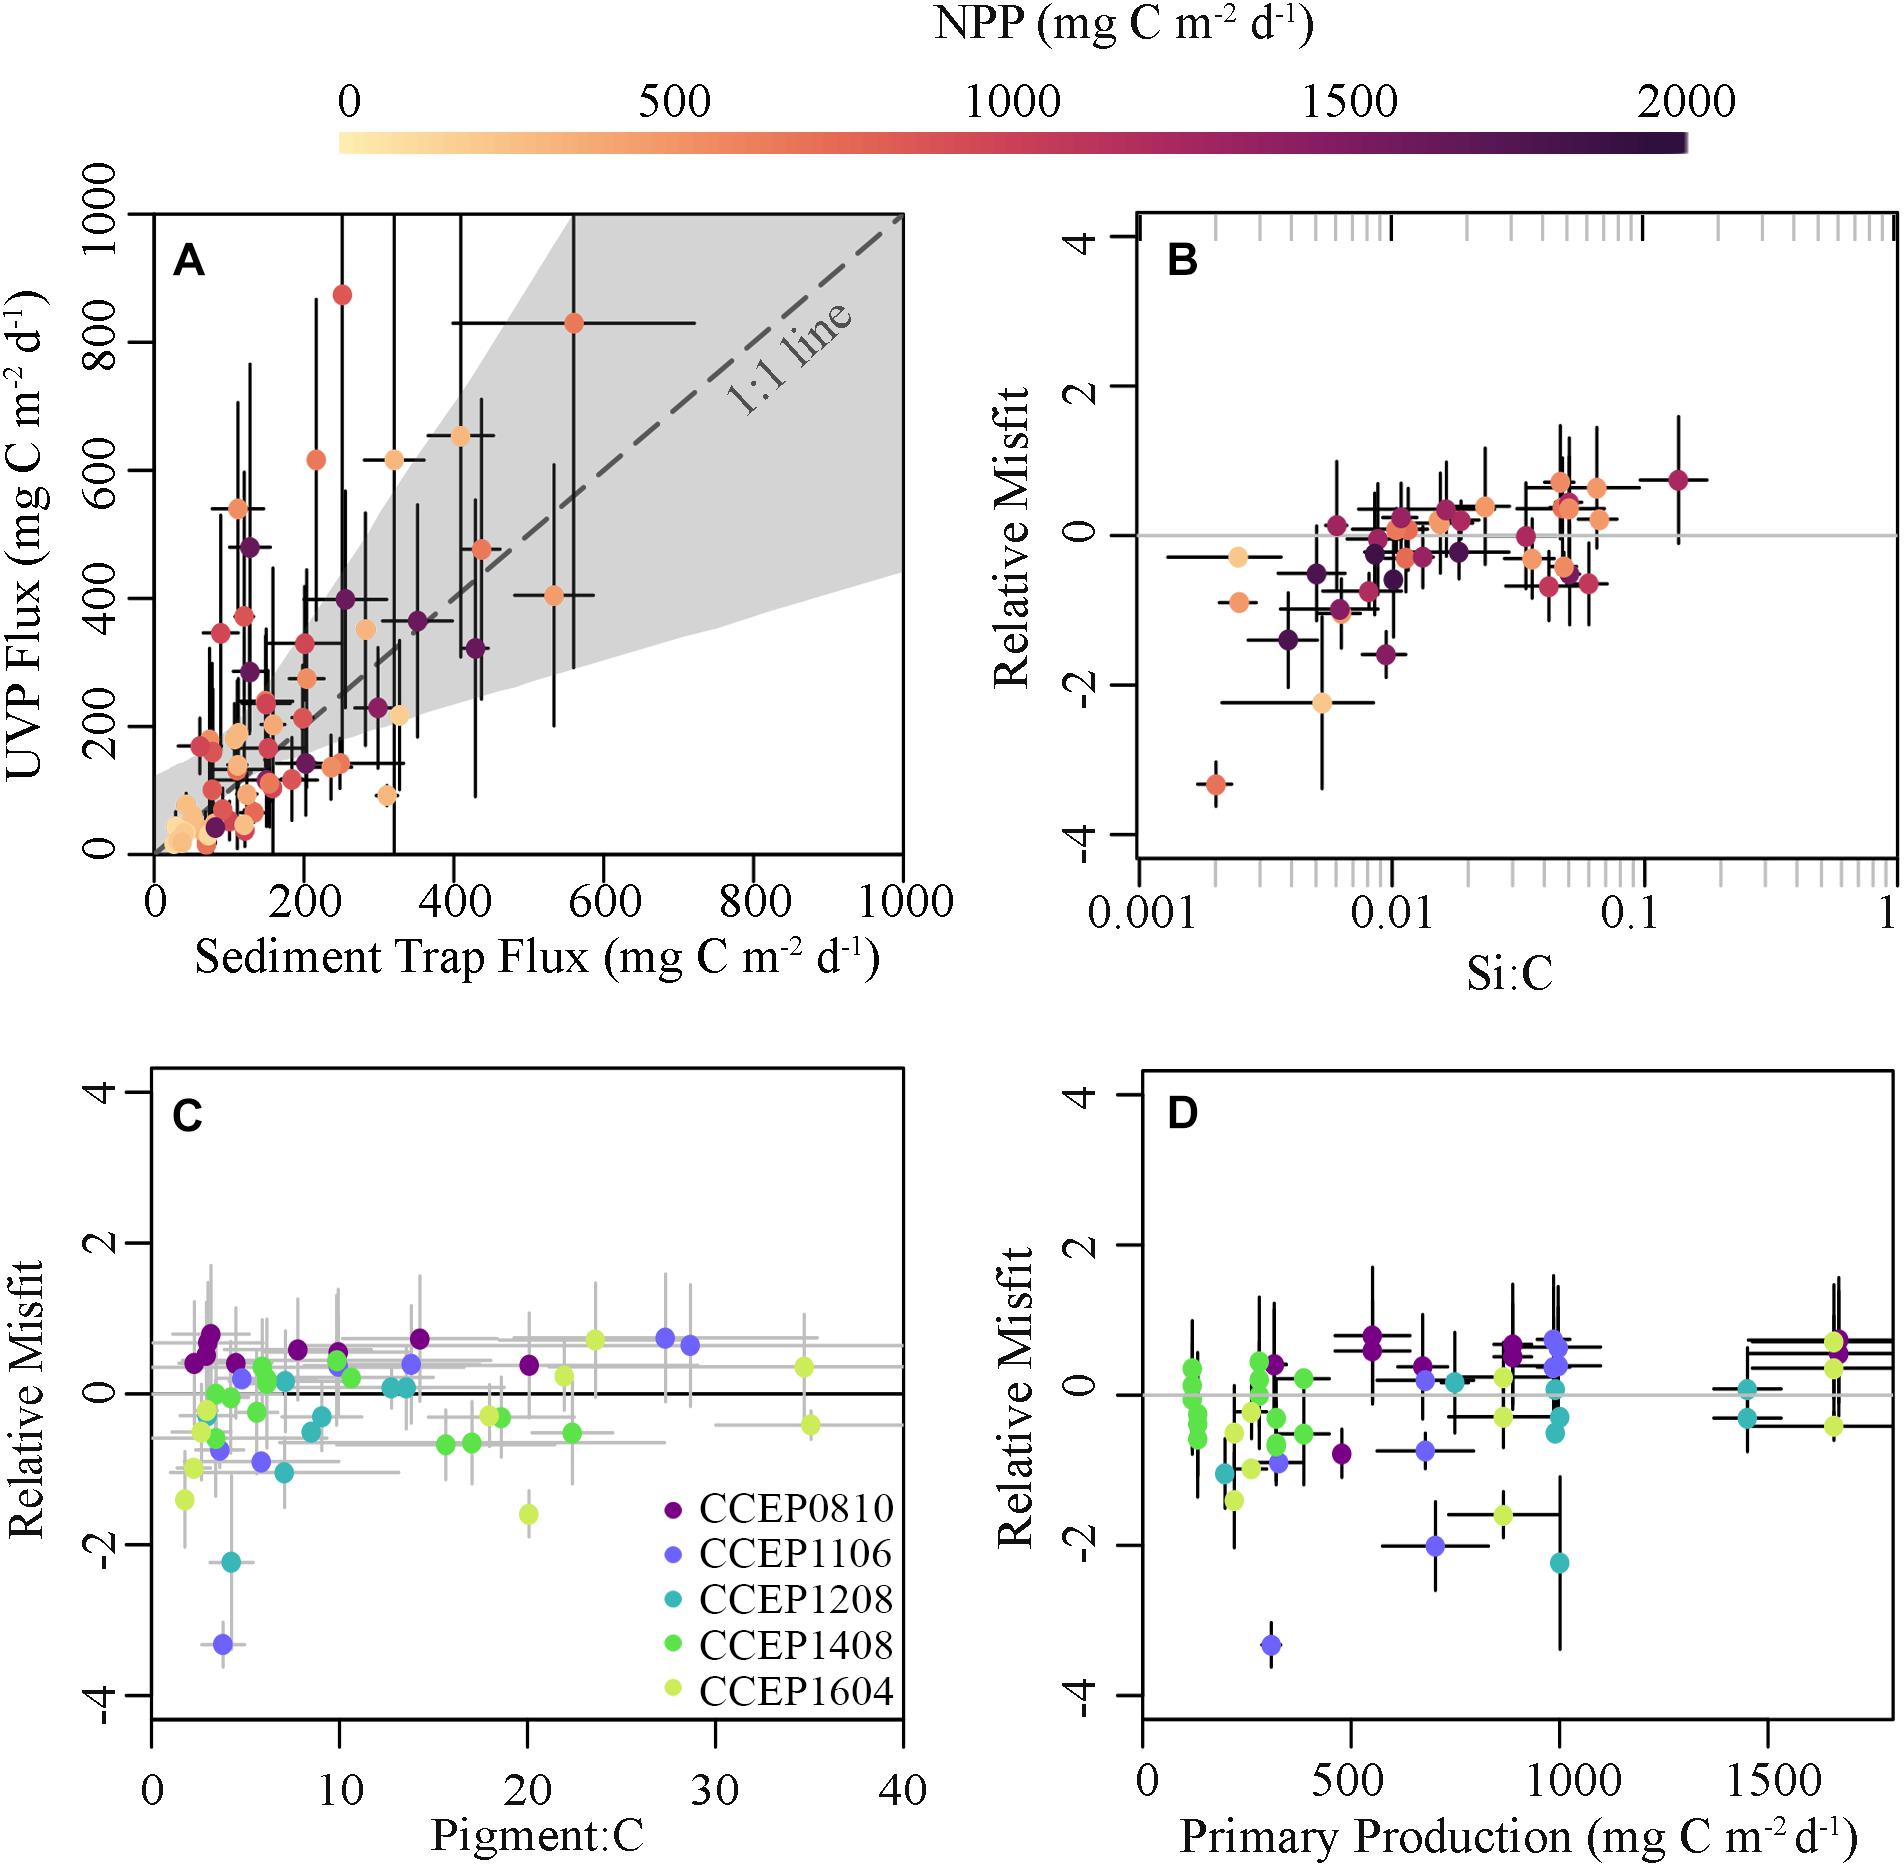
Figure 8. (A) Comparison of cycle averaged flux estimates derived from sediment trap deployments and the CCE-optimized UVP algorithm using fitted A and B values of 15.4 and 1.05 respectively with points colored based on primary productivity. The calculated relative misfit [i.e., (FUVP – FST)/FUVP] plotted against (B) the Si:C ratio of sinking material, (C) the pigment:carbon ratio of sinking material, and (D) NPP.
Particle Flux Vertical Profiles
Comparison of our CCE-optimized UVP-derived flux estimates to flux profiles determined using a blended sediment trap-234Th approach (from 50–200 m depth) showed relatively good agreement (Figure 9A). There was a strong correlation between the two measurements (Spearman’s ρ = 0.59, p < 0.001). The AE was 28.6 mg C m–2 d–1, showing no substantial bias in the data overall, while the ANAE was 0.68. However, over the 50–200 m depth range we did find a slight difference in algorithm accuracy with depth (Figure 9B). The AE was 112.5 mg C m–2 d–1 at 50 m, 39.9 mg C m–2 d–1 at 100 m, 12.5 mg C m–2 d–1 at 150 m, and 108.9 mg C m–2 d–1 at 200 m. This suggests that (at least over the limited depth range of the upper twilight zone) changing relationships between particle size and flux do not lead to major biases in profiles of vertical flux. However, manual inspection of profiles showed that for most cycles there was a depth near the base of the euphotic zone at which UVP-derived particle flux estimates substantially overestimated measured flux (Figure 10). Since UVP flux estimates were based on particle size and abundance, this suggests that near the base of the euphotic zone there is a large abundance of particles that are sinking more slowly than similarly sized particles deeper in the euphotic zone.
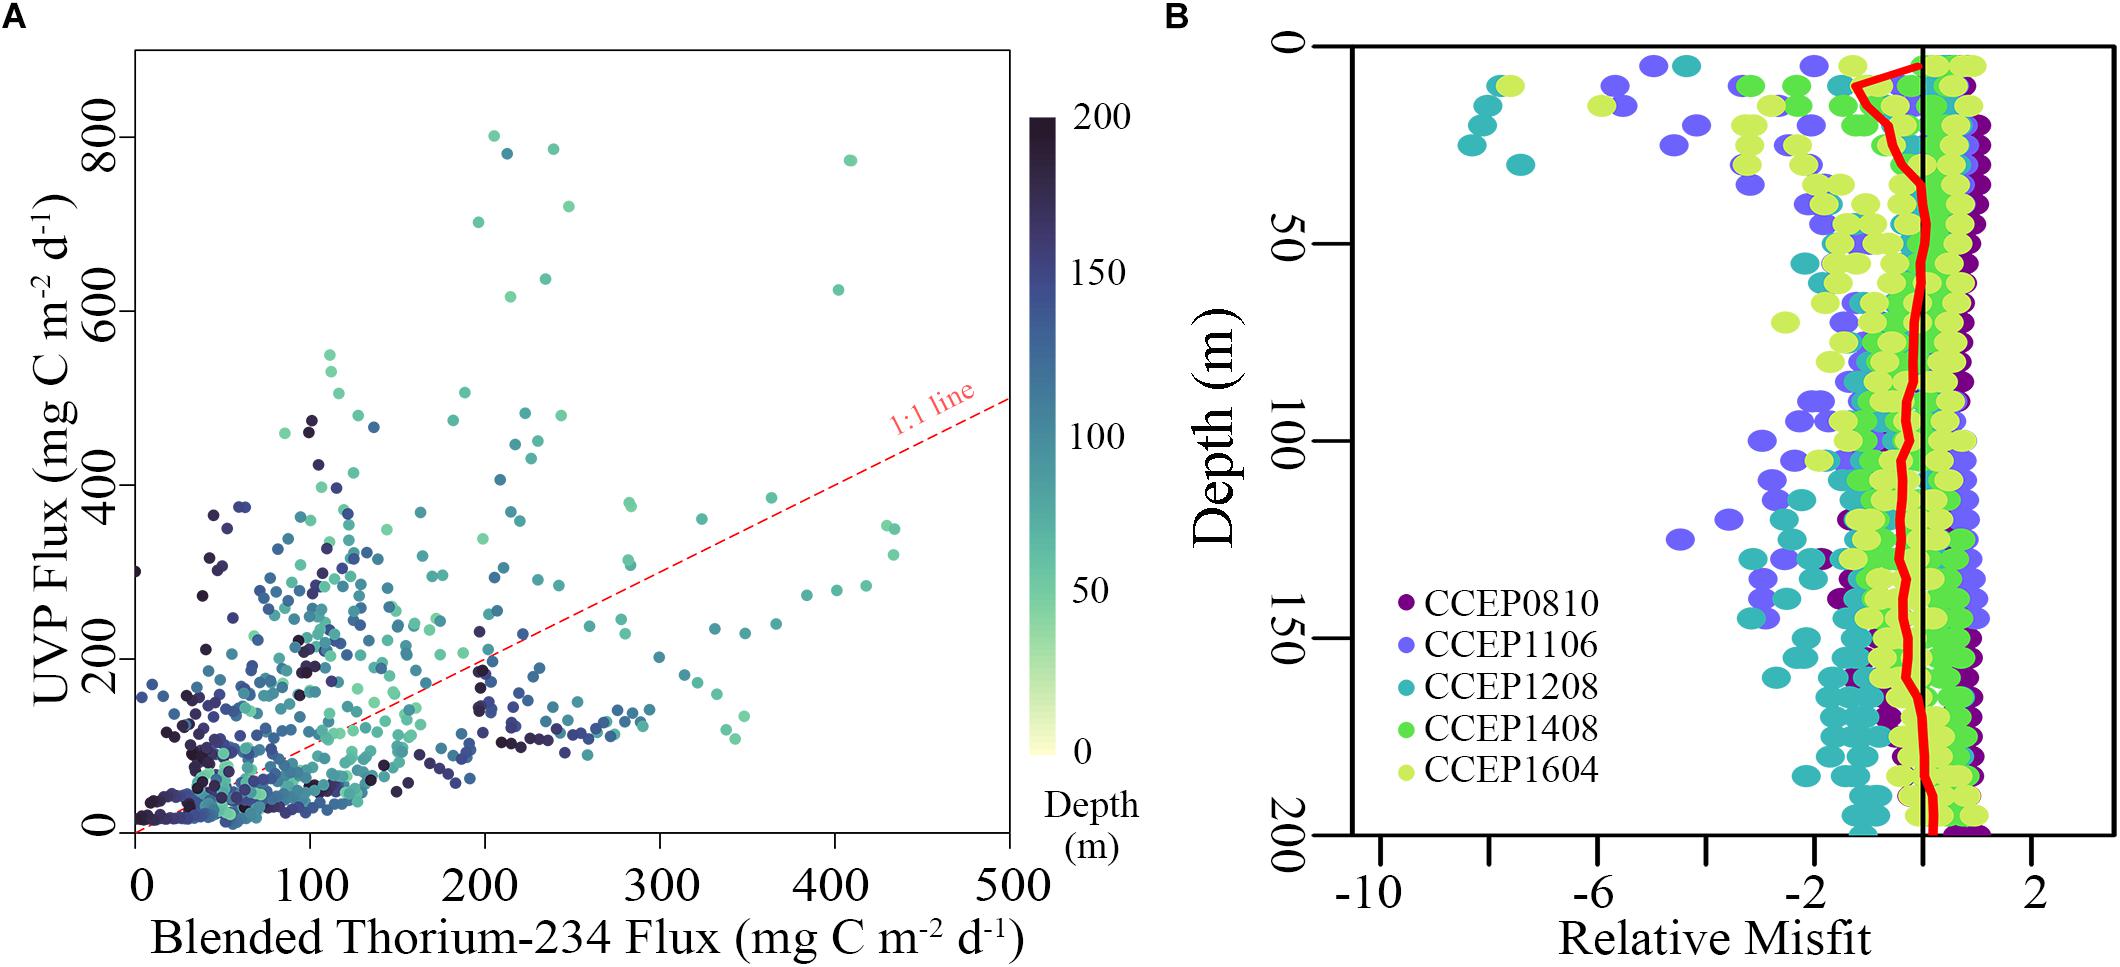
Figure 9. (A) Blended 234Th-sediment trap flux estimates from 50 to 200 m compared to estimates predicted by the UVP algorithm using the optimized A and B values of 15.4 and 1.05 respectively. Points are colored by depth and the red dashed line is 1:1. (B) Misfit between the UVP flux estimate and the blended 234Th-method [i.e., (FUVP – FTh)] plotted against depth, with a red line denoting the mean relative misfit (equivalent to AE) across all cruises.
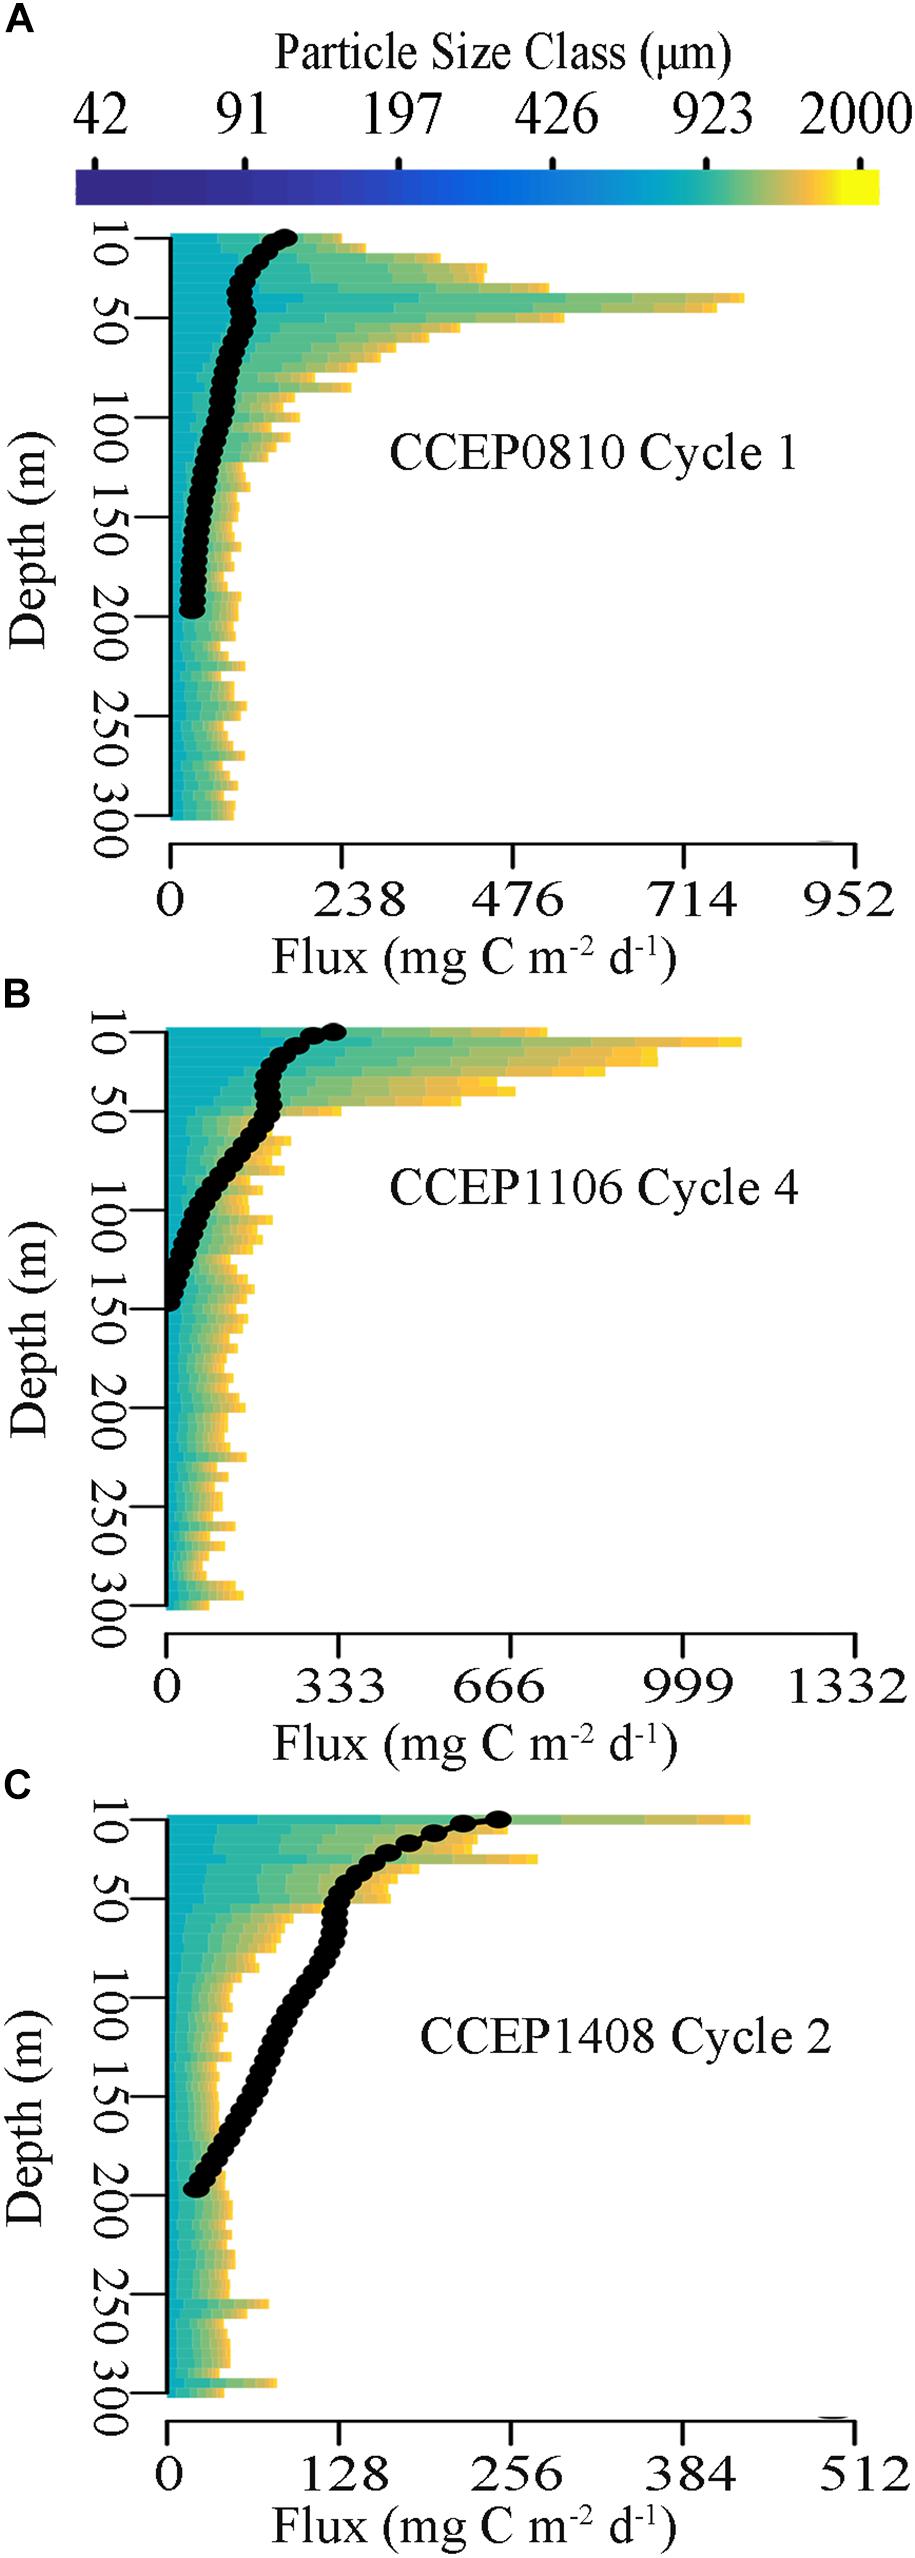
Figure 10. Representative profiles of cycle averaged partial flux due to each particle size bin from 0–300 m depth. Black dots represent Blended Th-ST flux estimates from 0–200 m from cycles (A) P0810-1, (B) P1106-4, and (C) P1408-2.
Discussion
Quantifying Vertical Carbon Flux
Many marine ecosystems are rapidly responding to a changing climate (Behrenfeld et al., 2006; Doney et al., 2012; Asch, 2015). Whether these changes will lead to increased or decreased efficiency of the BCP ultimately depends on changes in nutrient supply (Bakun, 1990; Garcia-Reyes and Largier, 2010; Rykaczewski and Dunne, 2010; Capotondi et al., 2012; Sydeman et al., 2014) and the ways in which plankton communities adapt to altered physical forcing (Richardson and Schoeman, 2004; Montes-Hugo et al., 2009; Boyd, 2015; Cael et al., 2017). The complex interactions of different components of the BCP make predictions of future changes in the BCP highly uncertain. As a result, sustained large-scale measurements of carbon flux are a research priority. Unfortunately, the most direct approach for measuring sinking particles (i.e., sediment traps) is not well suited to long-term deployments in the upper water column, where moored time-series traps may be unreliable (Buesseler et al., 2010), and surface-tethered or neutrally buoyant traps require sustained research vessel presence.
The development of methods appropriate for use on survey or monitoring cruises and/or autonomous deployments is thus an important research focus (McDonnell et al., 2015). Our results suggest that 238U-234Th deficiency measurements provide a more robust approach for estimating particle flux than UVP-based estimates. Despite not being calibrated to the CCE region, the thorium approach showed no significant bias with respect to estimation of particulate 234Th fluxes [although we note that in situ pump values of the C:234Th ratio, as would normally be used to convert to carbon fluxes on a survey cruise, underestimated sinking particle C:234Th ratios in the CCE by an average of 44% (Stukel et al., 2019a)]. The greater accuracy of the 238U-234Th deficiency approach is not surprising, since it estimates carbon flux from a direct flux measurement (i.e., 234Th flux), while the UVP-based approach infers flux from measurements of particle standing stock. Nevertheless, the increased cost, required expertise, and added water budget requirements of 234Th measurements suggest that they are not likely to be as widely used as optical particle measurements. Furthermore the suitability of optical sensor deployment for autonomous deployments highlights the utility of algorithms that can quantify flux from such measurements, even if these results require careful (and potentially sustained) tuning and validation.
Most optical approaches rely on a strong covariance between particle size (or a proxy for particle size) and the property of interest, which for carbon export is mass flux. Previous work has demonstrated trends between particle size and sinking velocity (Smayda, 1971; Alldredge and Gotschalk, 1988; Stamieszkin et al., 2015), as well as particle size and mass (Alldredge, 1998). Therefore a reasonable approach was undertaken in Guidi et al. (2008) to couple these properties into mass flux for the UVP platform. However, the use of previously published parameterizations for estimating flux from UVP data led to substantial misfits with our measurement data. With the Guidi et al. (2008) global algorithm, the UVP flux estimate was biased low, often underestimating actual flux by ∼90%. The misfit was particularly stark during low-biomass, low-flux periods when the UVP often predicted flux <7 mg C m–2 d–1, even though sediment trap measured flux was never <26 mg C m–2 d–1. In contrast, the Iversen et al. (2010) parameterization led to substantial overestimates of flux often by a 10:1 ratio, with misfits that were greatest when particle loading was highest. This parameterization suggested that carbon flux should exceed 1000 mg C m–2 d–1 for 21 (out of a total of 69) paired sediment trap-UVP measurements. Measured sediment trap flux never exceeded 560 mg C m–2 d–1. These results echo the conclusions of Iversen et al. (2010) that UVP-flux estimates need to be tuned to specific regions. This suggests that extreme caution should be utilized when attempting to quantify flux from UVP-profiles using a global algorithm. Although Iversen et al. (2010) suggested that the Guidi et al. (2008) algorithm may work better in offshore regions than coastal environments, we actually find the greatest mismatch to occur during oligotrophic conditions.
When optimizing Equation 4 to the CCE domain, we found a much lower exponent (B = 1.05) than that obtained by either Guidi et al. (2008) and Iversen et al. (2010). This B value is similar to the theoretical B value calculated by Iversen et al. (2010) from relationships between aggregate size-mass and size-settling velocity relationships published in Alldredge and Gotschalk (1988). Nevertheless, this exponent is surprisingly low for a system in which fecal pellets are a dominant contributor to flux and for which limited evidence suggests that carbon density decreases only slightly with volume (Stukel et al., 2013). Indeed, given reasonable exponents for the scaling relationship between fecal pellet ESD and mass (>2), a value of B = 1.05, would imply that larger pellets sink more slowly than smaller pellets. This result would be in stark contrast with multiple theoretical and experimental studies suggesting that larger fecal pellets sink faster (Small et al., 1979; Turner, 2002; Giesecke et al., 2010). Instead, we suspect this small exponent may reflect the fact that flux was dominated by particles with sizes near the lower size detection limit of the UVP (i.e., 42 μm – 125 μm depending on calibration). If 200–300 μm particles are dominating flux, the UVP will struggle to accurately differentiate their sizes. This difficulty is exacerbated by the non-spherical shape of fecal pellets, which had typical length:width ratios ranging from 2:1 to 10:1 (Stukel et al., 2018a). Thus the abundance of such particles (rather than slight differences in their sizes that may not be accurately recorded by the UVP) becomes a dominant predictor of flux. The fecal pellet data presented here illustrate an important caveat for imaging systems. Imaging systems are well suited to observing objects over a range of approximately 3 orders of magnitude (i.e., 10 pixels to ∼1,000 pixels in length), yet particles within the water column often range over 5 orders of magnitude from <1 μm to >10 cm. The pixel size on the UVP5 thus results in coarse granularity of particles in regions where fecal pellets are abundant and important to mass flux. One potential solution to this that is increasingly being implemented in the field is the use of multiple instruments with varying resolutions to adequately cover the full size range of marine particles (e.g., Jackson et al., 1997). Such increased resolution would allow accurate particle shape (and potentially color) information to be used in classifying particles and more accurately determining volume and carbon content.
Our results thus suggest that, in a region dominated by fecal pellet flux, more accurate estimates of flux will require optical profiling instruments with finer resolution at small particle sizes. Furthermore, in regions where the relative contribution of different particle classes (e.g., phytodetritus, fecal pellets, mucous feeding webs, or marine snow of mixed origin) can vary substantially, optical approaches may need to incorporate information other than size (shape, color, porosity) into flux calculations. Alternately, the use of autonomous ‘optical sediment traps’ may provide a feasible approach for estimating flux driven by heterogeneous particle classes, because the ability of such approaches to actually quantify particle flux onto a glass plate obviates the need for an assumed particle size-settling velocity relationship (Estapa et al., 2013, 2019; Bishop et al., 2016). However, such approaches still rely on accurate determination of carbon density from particle optical properties (Estapa et al., 2017).
Vertical Particle Flux and Attenuation
Our results shed light on the processes driving patterns in vertical POC flux in the CCE. Fecal pellets in the ∼100–400 μm size range appear to be the dominant contributors to export flux in the shallow twilight zone (Figures 5–7). Flux of these pellets shows substantial spatial variability, with greater fecal pellet (and total carbon) flux beneath coastal, bloom water parcels than beneath the oligotrophic waters typically found offshore. The prevalence of small particles in flux leads to a low exponent (B = 1.05) for the relationship between particle size and mass flux. This stands in marked contrast to exponents determined in other regions, such as the Mauritanian Upwelling region, where B values > 3 (and in situ estimates of the particle size-spectrum) suggest a greater importance for mm-sized marine snow aggregates (Iversen et al., 2010). Notably, the Mauritanian Upwelling region is subject to substantial Saharan dust deposition, which may contribute to mineral ballasting and higher settling velocities (Iversen et al., 2010; Van der Jagt et al., 2018).
Such large aggregates were in fact found in acrylamide gels placed in the bottom of sediment traps on our P1706 cruise. They would have contributed a substantial amount of the volume of sinking material in the samples if they had penetrated the gels sufficiently to enable their quantitative analysis. However, their density appeared to be less than that of the acrylamide gel, resulting in them essentially floating atop the gel. Despite their volume, however, visual inspection of this marine snow suggested that they had only a marginal contribution to carbon flux, as a result of high porosity and a paucity of visible material (fecal pellets and phytodetritus) within the aggregates. These marine snow particles were only seen in acrylamide gel traps deployed at a depth of 50–60 m, however, and were absent from traps at 150 m. Taken together this suggests that: (1) these aggregates likely have only moderate sinking rates as a result of high porosity and correspondingly low excess density, (2) these aggregates are likely a substantial contributor to volume flux near the base of the euphotic zone, but only minor contributors to carbon flux at this depth, and (3) these marine snow aggregates experience substantial flux attenuation in the shallow euphotic zone.
The results above provide an interesting interpretation of contrasting results determined using alternate approaches to quantify export in the CCE region. Jackson and Checkley (2011) used an autonomous laser optical plankton counter to quantify particle abundance, volume, and flux (assuming Stokes’ Law relationships and constant carbon:volume ratios). They concluded that flux near the base of the euphotic zone was quite high (with maximum values near 800 mg C m–2 d–1), but that flux attenuation was exceedingly rapid in the shallow twilight zone, and decreased to ∼10% (sometimes substantially less) by a depth of 100 m. From these results, the authors concluded that the base of the euphotic zone was a region where zooplankton play a key role as gatekeepers of flux into the mesopelagic. Our sediment trap and 234Th measurements, however, show no such zone of high carbon flux attenuation (Figure 10). Rather, our combination of direct flux measurements and in situ particle imaging paint a more nuanced picture of particle transformations in this dynamic depth domain. We find that these depths are precisely the depths where our CCE-optimized algorithm consistently overestimates flux relative to sediment traps and 234Th. This result strongly suggests that the relationship between size and sinking speed shifts near the base of the euphotic zone, with rapidly sinking particles (within any given size range) contributing more to flux at deeper depths than slowly sinking particles. Indeed, Guidi et al. (2008) utilized sediment trap deployments between 150 and 1000 m for their parameterizations as opposed to the present study which relied on data from 50 to 150 m, which may in part explain their drastically different values of B.
There are many potential possibilities for explaining such discrepancies. As hypothesized by Jackson and Checkley (2011), zooplankton may play an important role at this depth, particularly if they are suspension-feeders with high clearance rates that remove most of the slowly sinking particles before they reach deeper depths (Stukel et al., 2019b). Sinking rates of low excess density marine snow may also be retarded at density gradients found near the base of the mixed layer (Macintyre et al., 1995; Prairie et al., 2015). Aggregate shape, size, and sinking speed can also change with age due to physical and biotic forces (Ploug et al., 2008; Lombard and Kiørboe, 2010). Particles are also continually being consumed by different organisms throughout the mesopelagic and either disaggregated or re-combined into different fecal pellets (Poulsen and Kiørboe, 2005; Wilson et al., 2008; Robinson et al., 2010). Incorporating such transformations into conceptual and numerical models of particle flux through the euphotic zone is needed to explain and predict changes in the ocean’s remineralization length scale and ability to sequester carbon dioxide (Iversen and Poulsen, 2007; Poulsen and Iversen, 2008; Kwon et al., 2009; Lomas et al., 2010; Burd et al., 2016).
Conclusion
Our paired measurements of particle size and volume using UVP optical measurements compared with carbon flux determined with sediment traps and 238U-234Th disequilibrium clearly show that previously published algorithms for estimating particle flux from UVP data do not perform well in the CCE. This adds to a growing body of literature suggesting that particle size-flux relationships are highly variable in the ocean and that such variability must be taken into account when applying optically derived estimates of flux. A CCE-optimized parameterization leads to a relatively low exponent (B = 1.05) for the size-flux relationship. This low exponent likely results from the important role of 100–400 μm fecal pellets in vertical carbon flux in the CCE, a carbon source that is poorly resolved in optical profiles. Further improvements in optical estimates of carbon flux will require imaging systems with a higher resolution at small particle size, the ability to discriminate between different classes of particles (e.g., fecal pellets and marine snow), and accurate representation of rapidly sinking fecal pellets and other sources of organic matter. Until such advancements are made it is advisable that future UVP derived estimates be paired with other direct methods of flux estimation as has previously been suggested.
Data Availability Statement
Data used in this manuscript can be found on the CCE LTER DataZoo website: https://oceaninformatics.ucsd.edu/datazoo/catalogs/ccelter/datasets and on the EcoTaxa website: https://ecotaxa.obs-vlfr.fr/. The R code used to compile and analyze the data is available open-source on GitHub: https://github.com/tbrycekelly/CCE-UVP.
Author Contributions
MO was responsible for the UVP deployments. MRS was responsible for the sediment trap and thorium data. MCS was responsible for the acrylamide gel analyses. LG assisted in the interpretation of UVP data. TK and CF were responsible for the quantitative comparisons between UVP and in situ export estimates. MRS and CF wrote the manuscript. All authors contributed to the editing of the manuscript.
Funding
This work was funded by NSF grants to the CCE LTER Program: OCE-0417616, OCE-1026607, OCE-1637632, and OCE-1614359. A portion of this work was performed at the National High Magnetic Field Laboratory, which is supported by the National Science Foundation Cooperative Agreement No. DMR-1644779 and the State of Florida.
Conflict of Interest
The authors declare that the research was conducted in the absence of any commercial or financial relationships that could be construed as a potential conflict of interest.
Acknowledgments
We would like to thank the captains and crews of the RVs Melville, Thompson, Sikuliaq, and Revelle as well as our many collaborators in the CCE LTER Program, without whom this study would not have been possible.
Supplementary Material
The Supplementary Material for this article can be found online at: https://www.frontiersin.org/articles/10.3389/fmars.2019.00603/full#supplementary-material
Footnotes
References
Alldredge, A. (1998). The carbon, nitrogen and mass content of marine snow as a function of aggregate size. Deep Sea Res. I 45, 529–541. doi: 10.1016/s0967-0637(97)00048-4
Alldredge, A. L., and Gotschalk, C. (1988). In situ settling behavior of marine snow. Limnol. Oceanogr. 33, 339–351. doi: 10.1016/j.scitotenv.2016.09.115
Archibald, K. M., Siegel, D. A., and Doney, S. C. (2019). Modeling the impact of zooplankton diel vertical migration on the carbon export flux of the biological pump. Global Biogeochem. Cycles. 33, 181–199. doi: 10.1029/2018gb005983
Armstrong, R. A., Peterson, M. L., Lee, C., and Wakeham, S. G. (2009). Settling velocity spectra and the ballast ratio hypothesis. Deep Sea Res. II 56, 1470–1478. doi: 10.1016/j.dsr2.2008.11.032
Asch, R. G. (2015). Climate change and decadal shifts in the phenology of larval fishes in the california current ecosystem. Proc. Natl. Acad. Sci. U.S.A. 112, E4065–E4074. doi: 10.1073/pnas.1421946112
Baker, E. T., Milburn, H. B., and Tennant, D. A. (1988). Field assessment of sediment trap efficiency under varying flow conditions. J. Mar. Res. 46, 573–592. doi: 10.1357/002224088785113522
Bakun, A. (1990). Global climate change and intensification of coastal ocean upwelling. Science 247, 198–201.
Behrenfeld, M. J., O’malley, R. T., Siegel, D. A., Mcclain, C. R., Sarmiento, J. L., Feldman, G. C., et al. (2006). Climate-driven trends in contemporary ocean productivity. Nature 444, 752–755. doi: 10.1038/nature05317
Benitez-Nelson, C. R., Buesseler, K. O., Van Der Loeff, M. R., Andrews, J., Ball, L., Crossin, G., et al. (2001). Testing a new small-volume technique for determining Th-234 in seawater. J. Radioanal. Nucl. Chem. 248, 795–799.
Biard, T., Krause, J. W., Stukel, M. R., and Ohman, M. D. (2018). The significance of giant phaeodarians (Rhizaria) to biogenic silica export in the california current ecosystem. Global Biogeochem. Cycles 32, 987–1004. doi: 10.1029/2018gb005877
Bishop, J., Fong, M., and Wood, T. (2016). Robotic observations of high wintertime carbon export in california coastal waters. Biogeosciences 13, 3109–3129. doi: 10.5194/bg-13-3109-2016
Boss, E., Guidi, L., Richardson, M. J., Stemmann, L., Gardner, W., Bishop, J. K., et al. (2015). Optical techniques for remote and in-situ characterization of particles pertinent to GEOTRACES. Prog. Oceanogr. 133, 43–54. doi: 10.1016/j.pocean.2014.09.007
Boyd, P. W. (2015). Toward quantifying the response of the oceans’ biological pump to climate change. Front. Mar. Sci. 2:77.
Buesseler, K. O. (1991). Do upper-ocean sediment traps provide an accurate record of particle flux? Nature 353, 420–423. doi: 10.1038/353420a0
Buesseler, K. O., Andrews, J. A., Hartman, M. C., Belastock, R., and Chai, F. (1995). Regional estimates of the export flux of particulate organic carbon derived from thorium-234 during the JGOFS EqPac Program. Deep Sea Res. II 42, 777–804. doi: 10.1016/0967-0645(95)00043-p
Buesseler, K. O., Antia, A. N., Chen, M., Fowler, S. W., Gardner, W. D., Gustafsson, O., et al. (2007). An assessment of the use of sediment traps for estimating upper ocean particle fluxes. J. Mar. Res. 65, 345–416. doi: 10.1357/002224007781567621
Buesseler, K. O., Benitez-Nelson, C. R., Moran, S. B., Burd, A., Charette, M., Cochran, J. K., et al. (2006). An assessment of particulate organic carbon to thorium-234 ratios in the ocean and their impact on the application of 234Th as a POC flux proxy. Mar. Chem. 100, 213–233. doi: 10.1016/j.marchem.2005.10.013
Buesseler, K. O., and Boyd, P. W. (2009). Shedding light on processes that control particle export and flux attenuation in the twilight zone of the open ocean. Limnol. Oceanogr. 54, 1210–1232. doi: 10.4319/lo.2009.54.4.1210
Buesseler, K. O., Mcdonnell, A. M. P., Schofield, O. M. E., Steinberg, D. K., and Ducklow, H. W. (2010). High particle export over the continental shelf of the west Antarctic Peninsula. Geophys. Res. Lett. 37, 1–5.
Burd, A., Buchan, A., Church, M., Landry, M., Mcdonnell, A., Passow, U., et al. (2016). “Towards a transformative understanding of the ocean’s biological pump: Priorities for future research,” in Report of the NSF Biology of the Biological Pump Workshop, (New Orleans, LA: Hyatt Place New Orleans), 19–20.
Cael, B. B., Bisson, K., and Follows, M. J. (2017). How have recent temperature changes affected the efficiency of ocean biological carbon export? Limnol. Oceanogr. Lett. 2, 113–118. doi: 10.1002/lol2.10042
Capotondi, A., Alexander, M. A., Bond, N. A., Curchitser, E. N., and Scott, J. D. (2012). Enhanced upper ocean stratification with climate change in the CMIP3 models. J. Geophys. Res.: Oceans 117, C04031.
Carlson, C. A., Ducklow, H. W., and Michaels, A. F. (1994). Annual flux of dissolved organic carbon from the euphotic zone in the northwestern Sargasso Sea. Nature 371, 405–408. doi: 10.1038/371405a0
Checkley, D. M., Davis, R. E., Herman, A. W., Jackson, G. A., Beanlands, B., and Regier, L. A. (2008). Assessing plankton and other particles in situ with the SOLOPC. Limnol. Oceanogr. 43, 2123–2136. doi: 10.4319/lo.2008.53.5_part_2.2123
Church, M. J., Lomas, M. W., and Muller-Karger, F. (2013). Sea change: charting the course for biogeochemical ocean time-series research in a new millennium. Deep Sea Res. II 93, 2–15. doi: 10.1016/j.dsr2.2013.01.035
Cochran, J. K., Feng, H., Amiel, D., and Beck, A. (2006). Natural radionuclides as tracers of coastal biogeochemical processes. J. Geochem. Exp. 88, 376–379. doi: 10.1016/j.jenvrad.2018.02.001
Davison, P., Lara-Lopez, A., and Anthony Koslow, J. (2015). Mesopelagic fish biomass in the southern california current ecosystem. Deep Sea Res. II 112, 129–142. doi: 10.1016/j.dsr2.2014.10.007
Doney, S. C., Ruckelshaus, M., Duffy, J. E., Barry, J. P., Chan, F., English, C. A., et al. (2012). “Climate Change Impacts on Marine Ecosystems,” in Annual Review of Marine Science, Vol. 4, eds C. A. Carlson, and S. J. Giovannoni, (Palo Alto: Annual Reviews), 11–37.
Ducklow, H. W., Steinberg, D. K., and Buesseler, K. O. (2001). Upper ocean carbon export and the biological pump. Oceanography 14, 50–58. doi: 10.5670/oceanog.2001.06
Durkin, C. A., Estapa, M. L., and Buesseler, K. O. (2015). Observations of carbon export by small sinking particles in the upper mesopelagic. Mar. Chem. 175, 72–81. doi: 10.1016/j.marchem.2015.02.011
Ebersbach, F., and Trull, T. W. (2008). Sinking particle properties from polyacrylamide gels during the KErguelen Ocean and plateau compared study (KEOPS): zooplankton control of carbon export in an area of persistent natural iron inputs in the Southern Ocean. Limnol. Oceanogr. 53, 212–224. doi: 10.4319/lo.2008.53.1.0212
Estapa, M., Durkin, C., Buesseler, K., Johnson, R., and Feen, M. (2017). Carbon flux from bio-optical profiling floats: calibrating transmissometers for use as optical sediment traps. Deep Sea Res. Part I Oceanogr. Res. Pap. 120, 100–111. doi: 10.1016/j.dsr.2016.12.003
Estapa, M. L., Buesseler, K., Boss, E., and Gerbi, G. (2013). Autonomous, high-resolution observations of particle flux in the oligotrophic ocean. Biogeosciences 10, 5517–5531. doi: 10.5194/bg-10-5517-2013
Estapa, M. L., Feen, M. L., and Breves, E. (2019). Direct observations of biological carbon export from profiling floats in the subtropical North Atlantic. Global Biogeochem. Cycles 33, 282–300. doi: 10.1029/2018gb006098
Field, C. B., Behrenfeld, M. J., Randerson, J. T., and Falkowski, P. (1998). Primary production of the biosphere: integrating terrestrial and oceanic components. Science 281, 237–240. doi: 10.1126/science.281.5374.237
Garcia-Reyes, M., and Largier, J. (2010). Observations of increased wind-driven coastal upwelling off central California. J. Geophys. Res. Oceans 115, C04011.
Giesecke, R., Gonzalez, H. E., and Bathmann, U. (2010). The role of the chaetognath Sagitta gazellae in the vertical carbon flux of the Southern Ocean. Polar Biol. 33, 293–304. doi: 10.1007/s00300-009-0704-4
Goericke, R. (2011a). The size structure of marine phytoplankton - What are the rules? California Coop. Oceanic Fish. Investig. Rep. 52, 198–204.
Goericke, R. (2011b). The structure of marine phytoplankton communities- Patterns, rules, and mechanisms. California Coop. Oceanic Fish. Investig. Rep. 52, 182–197.
Goericke, R., and Ohman, M. D. (2015). Introduction to CCE-LTER: responses of the California Current Ecosystem to climate forcing. Deep Sea Res. II 112, 1–5. doi: 10.1016/j.dsr2.2014.12.001
Guidi, L., Chaffron, S., Bittner, L., Eveillard, D., Larhlimi, A., Roux, S., et al. (2016). Plankton networks driving carbon export in the oligotrophic ocean. Nature 532, 465–470. doi: 10.1038/nature16942
Guidi, L., Jackson, G. A., Stemmann, L., Miquel, J. C., Picheral, M., and Gorsky, G. (2008). Relationship between particle size distribution and flux in the mesopelagic zone. Deep Sea Res. I 55, 1364–1374. doi: 10.1016/j.dsr.2008.05.014
Hannides, C. C. S., Landry, M. R., Benitez-Nelson, C. R., Styles, R. M., Montoya, J. P., and Karl, D. M. (2009). Export stoichiometry and migrant-mediated flux of phosphorus in the North Pacific Subtropical Gyre. Deep Sea Res. I 56, 73–88. doi: 10.1016/j.dsr.2008.08.003
Hansell, D. A., Carlson, C. A., Bates, N. R., and Poisson, A. (1997). Horizontal and vertical removal of organic carbon in the equatorial Pacific Ocean: a mass balance assessment. Deep Sea Res. II 44, 2115–2130. doi: 10.1016/s0967-0645(97)00021-0
Henson, S. A., Sanders, R., Madsen, E., Morris, P. J., Le Moigne, F., and Quartly, G. D. (2011). A reduced estimate of the strength of the ocean’s biological carbon pump. Geophys. Res. Lett. 38:L04606.
Honjo, S., Manganini, S. J., Krishfield, R. A., and Francois, R. (2008). Particulate organic carbon fluxes to the ocean interior and factors controlling the biological pump: a synthesis of global sediment trap programs since 1983. Prog. Oceanogr. 76, 217–285. doi: 10.1016/j.pocean.2007.11.003
Hung, C. C., and Gong, G. C. (2010). POC/234Th ratios in particles collected in sediment traps in the northern South China Sea. Estuar. Coast. Shelf Sci. 88, 303–310. doi: 10.1016/j.ecss.2010.04.008
Hung, C. C., Xu, C., Santschi, P. H., Zhang, S. J., Schwehr, K. A., Quigg, A., et al. (2010). Comparative evaluation of sediment trap and Th-234-derived POC fluxes from the upper oligotrophic waters of the Gulf of Mexico and the subtropical northwestern Pacific Ocean. Mar. Chem. 121, 132–144. doi: 10.1016/j.marchem.2010.03.011
Iversen, M. H., Nowald, N., Ploug, H., Jackson, G. A., and Fischer, G. (2010). High resolution profiles of vertical particulate organic matter export off cape blanc, mauritania: degradation processes and ballasting effects. Deep Sea Res. I 57, 771–784. doi: 10.1016/j.dsr.2010.03.007
Iversen, M. H., and Poulsen, L. K. (2007). Coprorhexy, coprophagy, and coprochaly in the copepods Calanus helgolandicus, Pseudocalanus elongatus, and Oithona similis. Mar. Ecol. Prog. Ser. 350, 79–89. doi: 10.1021/acs.est.5b05905
Jackson, G. A., Checkley, D. M. Jr., and Dagg, M. (2015). Settling of particles in the upper 100 m of the ocean detected with autonomous profiling floats off california. Deep Sea Res. I 99, 75–86. doi: 10.1016/j.dsr.2015.02.001
Jackson, G. A., and Checkley, D. M. (2011). Particle size distributions in the upper 100 m water column and their implications for animal feeding in the plankton. Deep Sea Res.arch I 58, 283–297. doi: 10.1016/j.dsr.2010.12.008
Jackson, G. A., Maffione, R., Costello, D. K., Alldredge, A. L., Logan, B. E., and Dam, H. G. (1997). Particle size spectra between 1 μm and 1 cm at monterey bay determined using multiple instruments. Deep Sea Res. I 44, 1739–1767. doi: 10.1016/s0967-0637(97)00029-0
Jouandet, M.-P., Trull, T. W., Guidi, L., Picheral, M., Ebersbach, F., Stemmann, L., et al. (2011). Optical imaging of mesopelagic particles indicates deep carbon flux beneath a natural iron-fertilized bloom in the Southern Ocean. Limnol. Oceanogr. 56, 1130–1140. doi: 10.4319/lo.2011.56.3.1130
Kelly, T. B., Davison, P. C., Goericke, R., Landry, M. R., Ohman, M. D., and Stukel, M. R. (2019). The importance of mesozooplankton diel vertical migration for sustaining a mesopelagic food web. Front. Mar. Sci. 6:508.
Kelly, T. B., Goericke, R., Kahru, M., Song, H., and Stukel, M. R. (2018). CCE II: spatial and interannual variability in export efficiency and the biological pump in an eastern boundary current upwelling system with substantial lateral advection. Deep Sea Res. I 140, 14–25. doi: 10.1016/j.dsr.2018.08.007
Knauer, G. A., Karl, D. M., Martin, J. H., and Hunter, C. N. (1984). In situ effects of selected preservatives on total carbon, nitrogen and metals collected in sediment traps. J. Mari. Res. 42, 445–462. doi: 10.1357/002224084788502710
Knauer, G. A., Martin, J. H., and Bruland, K. W. (1979). Fluxes of particulate carbon, nitrogen, and phosphorus in the upper water column of the Northeast Pacific. Deep Sea Res. 26, 97–108. doi: 10.1016/0198-0149(79)90089-x
Krause, J. W., Brzezinski, M. A., Goericke, R., Landry, M. R., Ohman, M. D., Stukel, M. R., et al. (2015). Variability in diatom contributions to biomass, organic matter production and export across a frontal gradient in the california current ecosystem. J. Geophys. Res. Oceans 120, 1032–1047. doi: 10.1002/2014jc010472
Kwon, E. Y., Primeau, F., and Sarmiento, J. L. (2009). The impact of remineralization depth on the air-sea carbon balance. Nat. Geosci. 2, 630–635. doi: 10.1038/ngeo612
Landry, M. R., Ohman, M. D., Goericke, R., Stukel, M. R., Barbeau, K. A., Bundy, R., et al. (2012). Pelagic community responses to a deep-water front in the California Current Ecosystem: overview of the A-Front Study. J. Plankton Res. 34, 739–748. doi: 10.1093/plankt/fbs025
Landry, M. R., Ohman, M. D., Goericke, R., Stukel, M. R., and Tsyrklevich, K. (2009). Lagrangian studies of phytoplankton growth and grazing relationships in a coastal upwelling ecosystem off southern california. Prog. Oceanogr. 83, 208–216. doi: 10.1016/j.pocean.2009.07.026
Laws, E. A., D’sa, E., and Naik, P. (2011). Simple equations to estimate ratios of new or export production to total production from satellite-derived estimates of sea surface temperature and primary production. Limnol. Oceanogr. -Methods 9, 593–601. doi: 10.4319/lom.2011.9.593
Le Quéré, C., Andrew, R. M., Friedlingstein, P., Sitch, S., Pongratz, J., Manning, A. C., et al. (2018). Global Carbon Budget 2017. Earth Syst. Sci. Data 10, 405–448.
Lee, C., Hedges, J. I., Wakeham, S. G., and Zhu, N. (1992). Effectiveness of various treatments in retarding microbial activity in sediment trap material and their effects on the collection of swimmers. Limnol. Oceanogr. 37, 117–130. doi: 10.4319/lo.1992.37.1.0117
Levy, M., Bopp, L., Karleskind, P., Resplandy, L., Ethe, C., and Pinsard, F. (2013). Physical pathways for carbon transfers between the surface mixed layer and the ocean interior. Global Biogeochem. Cycles 27, 1001–1012. doi: 10.1002/gbc.20092
Llort, J., Langlais, C., Matear, R., Moreau, S., Lenton, A., and Strutton, P. G. (2018). Evaluating southern ocean carbon eddy-pump from biogeochemical-argo floats. J. Geophys. Res Oceans 123, 971–984. doi: 10.1002/2017jc012861
Lomas, M., Steinberg, D. K., Dickey, T., Carlson, C., Nelson, N., Condon, R. H., et al. (2010). Increased ocean carbon export in the Sargasso Sea linked to climate variability is countered by its enhanced mesopelagic attenuation. Biogeosciences 7, 57–70. doi: 10.5194/bg-7-57-2010
Lomas, M. W., Bates, N. R., Johnson, R. J., Knap, A. H., Steinberg, D. K., and Carlson, C. A. (2013). Two decades and counting: 24-years of sustained open ocean biogeochemical measurements in the Sargasso Sea. Deep Sea Res. II 93, 16–32. doi: 10.1016/j.dsr2.2013.01.008
Lombard, F., Guidi, L., and Kiørboe, T. (2013). Effect of Type and concentration of ballasting particles on sinking rate of marine snow produced by the appendicularian oikopleura dioica. PLoS One 8:9. doi: 10.1371/journal.pone.0075676
Lombard, F., and Kiørboe, T. (2010). Marine snow originating from appendicularian houses: age-dependent settling characteristics. Deep Sea Res. I 57, 1304–1313. doi: 10.1016/j.dsr.2010.06.008
Lynch, D. R., Mcgillicuddy, D. J., and Werner, F. E. (2009). Skill assessment for coupled biological/physical models of marine systems Preface. J. Mar. Syst. 76, 1–3. doi: 10.1016/j.jmarsys.2008.05.002
Macintyre, S., Alldredge, A. L., and Gotschalk, C. C. (1995). Accumulation of marines now at density discontinuities in the water column. Limnol. Oceanogr. 40, 449–468. doi: 10.4319/lo.1995.40.3.0449
Martin, J. H., Knauer, G. A., Karl, D. M., and Broenkow, W. W. (1987). Vertex: carbon cycling in the northeast Pacific. Deep Sea Res. 34, 267–285. doi: 10.1016/0198-0149(87)90086-0
McDonnell, A. M. P., and Buesseler, K. O. (2010). Variability in the average sinking velocity of marine particles. Limnol. Oceanogr. 55, 2085–2096. doi: 10.4319/lo.2010.55.5.2085
McDonnell, A. M. P., and Buesseler, K. O. (2012). A new method for the estimation of sinking particle fluxes from measurements of the particle size distribution, average sinking velocity, and carbon content. Limnol. Oceanogr. Methods 10, 329–346. doi: 10.4319/lom.2012.10.329
McDonnell, A. M. P., Lam, P. J., Lamborg, C. H., Buesseler, K. O., Sanders, R., Riley, J. S., et al. (2015). The oceanographic toolbox for the collection of sinking and suspended marine particles. Prog. Oceanogr. 133, 17–31. doi: 10.1016/j.pocean.2015.01.007
Montes-Hugo, M., Doney, S. C., Ducklow, H. W., Fraser, W., Martinson, D., Stammerjohn, S. E., et al. (2009). Recent changes in phytoplankton communities associated with rapid regional climate change along the western antarctic peninsula. Science 323, 1470–1473. doi: 10.1126/science.1164533
Morrow, R. M., Ohman, M. D., Goericke, R., Kelly, T. B., Stephens, B. M., and Stukel, M. R. (2018). Primary productivity, mesozooplankton grazing, and the biological pump in the california current ecosystem: variability and response to El niño. Deep Sea Res. I 140, 52–62. doi: 10.1016/j.dsr.2018.07.012
Nickels, C. F., and Ohman, M. D. (2018). CCEIII: persistent functional relationships between copepod egg production rates and food concentration through anomalously warm conditions in the california current ecosystem. Deep Sea Res. I 140, 26–35. doi: 10.1016/j.dsr.2018.07.001
Ohman, M. D., Barbeau, K., Franks, P. J. S., Goericke, R., Landry, M. R., and Miller, A. J. (2013). Ecological transitions in a coastal upwelling ecosystem. Oceanography 26, 210–219. doi: 10.1371/journal.pone.0121392
Ohman, M. D., Davis, R. E., Sherman, J. T., Grindley, K. R., Whitmore, B. M., Nickels, C. F., et al. (2018). Zooglider: an autonomous vehicle for optical and acoustic sensing of zooplankton. Limnol. Oceanogr.: Methods 17, 69–86. doi: 10.1002/lom3.10301
Ohman, M. D., Powell, J. R., Picheral, M., and Jensen, D. W. (2012). Mesozooplankton and particulate matter responses to a deep-water frontal system in the southern California Current System. J. Plankton Res. 34, 815–827. doi: 10.1093/plankt/fbs028
Omand, M. M., D’asaro, E. A., Lee, C. M., Perry, M. J., Briggs, N., Cetiniæ, I., et al. (2015). Eddy-driven subduction exports particulate organic carbon from the spring bloom. Science 348, 222–225. doi: 10.1126/science.1260062
Owens, S. A., Buesseler, K. O., and Sims, K. W. W. (2011). Re-evaluating the 238U-salinity relationship in seawater: implications for the 238U-234Th disequilibrium method. Mar. Chem. 127, 31–39. doi: 10.1016/j.marchem.2011.07.005
Passow, U., and Carlson, C. A. (2012). The biological pump in a high CO2 world. Mar. Ecol. Prog. Ser. 470, 249–271. doi: 10.1073/pnas.1410480111
Picheral, M., Guidi, L., Stemmann, L., Karl, D. M., Iddaoud, G., and Gorsky, G. (2010). The underwater vision profiler 5: an advanced instrument for high spatial resolution studies of particle size spectra and zooplankton. Limnol. Oceanogr. Methods 8, 462–473. doi: 10.4319/lom.2010.8.462
Pike, S. M., Buesseler, K. O., Andrews, J., and Savoye, N. (2005). Quantification of 234Th recovery in small volume sea water samples by inductively coupled plasma-mass spectrometry. J. Radioanal. Nucl. Chem. 263, 355–360. doi: 10.1007/s10967-005-0594-z
Ploug, H., Iversen, M. H., and Fischer, G. (2008). Ballast, sinking velocity, and apparent diffusivity within marine snow and zooplankton fecal pellets: implications for substrate turnover by attached bacteria. Limnol. Oceanogr. 53, 1878–1886. doi: 10.4319/lo.2008.53.5.1878
Poulsen, L. K., and Iversen, M. H. (2008). Degradation of copepod fecal pellets: key role of protozooplankton. Mar. Ecol. Prog. Ser. 367, 1–13. doi: 10.3354/meps07611
Poulsen, L. K., and Kiørboe, T. (2005). Coprophagy and coprorhexy in the copepods Acartia tonsa and Temora longicornis: clearance rates and feeding behaviour. Mar. Ecol. Prog. Ser. 299, 217–227. doi: 10.3354/meps299217
Prairie, J. C., Ziervogel, K., Camassa, R., Mclaughlin, R. M., White, B. L., Dewald, C., et al. (2015). Delayed settling of marine snow: effects of density gradient and particle properties and implications for carbon cycling. Mar. Chem. 175, 28–38. doi: 10.1016/j.marchem.2015.04.006
Ramondenc, S., Madeleine, G., Lombard, F., Santinelli, C., Stemmann, L., Gorsky, G., et al. (2016). An initial carbon export assessment in the Mediterranean Sea based on drifting sediment traps and the underwater vision profiler data sets. Deep Sea Res. I 117, 107–119. doi: 10.1016/j.dsr.2016.08.015
Richardson, A. J., and Schoeman, D. S. (2004). Climate impact on plankton ecosystems in the Northeast Atlantic. Science 305, 1609–1612. doi: 10.1126/science.1100958
Robinson, C., Steinberg, D. K., Anderson, T. R., Arístegui, J., Carlson, C. A., Frost, J. R., et al. (2010). Mesopelagic zone ecology and biogeochemistry – a synthesis. Deep Sea Res. II 57, 1504–1518. doi: 10.1016/j.dsr2.2010.02.018
Rykaczewski, R. R., and Dunne, J. P. (2010). Enhanced nutrient supply to the California Current Ecosystem with global warming and increased stratification in an earth system model. Geophys. Res. Lett. 37:L21606.
Savoye, N., Benitez-Nelson, C., Burd, A. B., Cochran, J. K., Charette, M., Buesseler, K. O., et al. (2006). 234Th sorption and export models in the water column: a review. Mar. Chem. 100, 234–249. doi: 10.1016/j.marchem.2005.10.014
Siegel, D. A., Buesseler, K. O., Behrenfeld, M. J., Benitez-Nelson, C. R., Boss, E., Brzezinski, M. A., et al. (2016). Prediction of the export and fate of global ocean net primary production: the EXPORTS science plan. Front. Mar. Sci. 3:22.
Siegel, D. A., Buesseler, K. O., Doney, S. C., Sailley, S. F., Behrenfeld, M. J., and Boyd, P. W. (2014). Global assessment of ocean carbon export by combining satellite obervations and food-web models. Global Biogeochem. Cycles 28, 181–196. doi: 10.1002/2013gb004743
Small, L. F., Fowler, S. W., and Unlu, M. Y. (1979). Sinking rates of natural copepod fecal pellets. Mar. Biol. 51, 233–241. doi: 10.1021/acs.est.5b05905
Smayda, T. J. (1971). Normal and accelerated sinking of phytoplankton in Sea. Mar. Geol. 11, 105–122. doi: 10.1016/0025-3227(71)90070-3
Stamieszkin, K., Pershing, A. J., Record, N. R., Pilskaln, C. H., Dam, H. G., and Feinberg, L. R. (2015). Size as the master trait in modeled copepod fecal pellet carbon flux. Limnol. Oceanogr. 60, 2090–2107. doi: 10.1002/lno.10156
Steinberg, D. K., Carlson, C. A., Bates, N. R., Goldthwait, S. A., Madin, L. P., and Michaels, A. F. (2000). Zooplankton vertical migration and the active transport of dissolved organic and inorganic carbon in the Sargasso Sea. Deep Sea Res. I 47, 137–158. doi: 10.1016/s0967-0637(99)00052-7
Stow, C. A., Jolliff, J., Mcgillicuddy, D. J., Doney, S. C., Allen, J. I., Friedrichs, M. A. M., et al. (2009). Skill assessment for coupled biological/physical models of marine systems. J. Mar. Syst. 76, 4–15. doi: 10.1016/j.jmarsys.2008.03.011
Strickland, J. D., and Parsons, T. R. (1972). A Practical Handbook of Seawater Analysis, 2 Edn. Ottawa: Bulletin of the Fisheries Research Board of Canada, 167.
Stukel, M. R., Aluwihare, L. I., Barbeau, K. A., Chekalyuk, A. M., Goericke, R., Miller, A. J., et al. (2017). Mesoscale ocean fronts enhance carbon export due to gravitational sinking and subduction. Proc. Natl. Acad. Sci. U.S.A. 114, 1252–1257. doi: 10.1073/pnas.1609435114
Stukel, M. R., Biard, T., Krause, J. W., and Ohman, M. D. (2018a). Large phaeodaria in the twilight zone: their role in the carbon cycle. Limnol. Oceanogr. 63, 2579–2594. doi: 10.1002/lno.10961
Stukel, M. R., Song, H., Goericke, R., and Miller, A. J. (2018b). The role of subduction and gravitational sinking in particle export, carbon sequestration, and the remineralization length scale in the California Current Ecosystem. Limnol. Oceanogr. 63, 363–383. doi: 10.1002/lno.10636
Stukel, M. R., and Ducklow, H. W. (2017). Stirring up the biological pump: vertical mixing and carbon export in the Southern Ocean. Global Biogeochem. Cycles 31, 1420–1434. doi: 10.1002/2017gb005652
Stukel, M. R., and Kelly, T. B. (2019). The Carbon:234Thorium ratios of sinking particles in the California Current Ecosystem 2: examination of a thorium sorption, desorption, and particle transport model. Mar. Chem. 211, 37–51. doi: 10.1016/j.marchem.2019.03.005
Stukel, M. R., Kelly, T. B., Aluwihare, L. I., Barbeau, K. A., Goericke, R., Krause, J. W., et al. (2019a). The Carbon:234Thorium ratios of sinking particles in the california current ecosystem 1: relationships with plankton ecosystem dynamics. Mar. Chem. 212, 1–15. doi: 10.1016/j.marchem.2019.01.003
Stukel, M. R., Ohman, M. D., Kelly, T. B., Bednaršek, N., and Biard, T. (2019b). The roles of filter-feeding and flux-feeding zooplankton as gatekeepers of particle flux into the mesopelagic ocean. Front. Mar. Sci. 6:397.
Stukel, M. R., Landry, M. R., Ohman, M. D., Goericke, R., Samo, T., and Benitez-Nelson, C. R. (2012). Do inverse ecosystem models accurately reconstruct plankton trophic flows? Comparing two solution methods using field data from the california current. J. Mar. Syst. 91, 20–33. doi: 10.1016/j.jmarsys.2011.09.004
Stukel, M. R., Mislan, K. A. S., Décima, M., and Hmelo, L. (2014). “Detritus in the pelagic ocean,” in Eco-DAS IX Symposium Proceedings, ed. P. F. Kemp, (Waco, TX: Association for the Sciences of Limnology and Oceanography), 49–76.
Stukel, M. R., Ohman, M. D., Benitez-Nelson, C. R., and Landry, M. R. (2013). Contributions of mesozooplankton to vertical carbon export in a coastal upwelling system. Mar. Ecol. Prog. Ser. 491, 47–65. doi: 10.3354/meps10453
Sydeman, W. J., García-Reyes, M., Schoeman, D. S., Rykaczewski, R. R., Thompson, S. A., Black, B. A., et al. (2014). Climate change and wind intensification in coastal upwelling ecosystems. Science 345, 77–80. doi: 10.1126/science.1251635
Turner, J. T. (2002). Zooplankton fecal pellets, marine snow and sinking phytoplankton blooms. Aquat. Microb. Ecol. 27, 57–102. doi: 10.3354/ame027057
Turner, J. T. (2015). Zooplankton fecal pellets, marine snow, phytodetritus and the ocean’s biological pump. Prog. Oceanogr. 130, 205–248. doi: 10.1016/j.pocean.2014.08.005
Van der Jagt, H., Friese, C., Stuut, J. W., Fischer, G., and Iversen, M. H. (2018). The ballasting effect of Saharan dust deposition on aggregate dynamics and carbon export: aggregation, settling, and scavenging potential of marine snow. Limnol. Oceanogr. 63, 1386–1394. doi: 10.1002/lno.10779
Van der Loeff, M. R., Sarin, M. M., Baskaran, M., Benitez-Nelson, C., Buesseler, K. O., Charette, M., et al. (2006). A review of present techniques and methodological advances in analyzing Th-234 in aquatic systems. Mar. Chem. 100, 190–212. doi: 10.1016/j.marchem.2005.10.012
Volk, T., and Hoffert, M. I. (1985). “Ocean carbon pumps: analysis of relative strengths and efficiencies in ocean-driven atmospheric CO2 changes,” in The Carbon Cycle and Atmospheric CO2: Natural Variations Archean to Present, eds E. T. Sundquist, and W. S. Broeker, (Washington, D.C: American Geophysical Union), 99–110. doi: 10.1029/gm032p0099
Waples, J. T., Benitez-Nelson, C., Savoye, N., Rutgers Van Der Loeff, M., Baskaran, M., and Gustaffson, Ö. (2006). An introduction to the application and future use of 234Th in aquatic systems. Mar. Chem. 100, 166–189. doi: 10.1016/j.marchem.2005.10.011
Wilson, S. E., Steinberg, D. K., and Buesseler, K. O. (2008). Changes in fecal pellet characteristics with depth as indicators of zooplankton repackaging of particles in the mesopelagic zone of the subtropical and subarctic North Pacific Ocean. Deep Sea Res. II 55, 1636–1647. doi: 10.1016/j.dsr2.2008.04.019
Keywords: carbon export, optical imaging, biological carbon pump, California Current, export production, particulate organic carbon, fecal pellet, biogeochemistry
Citation: Fender CK, Kelly TB, Guidi L, Ohman MD, Smith MC and Stukel MR (2019) Investigating Particle Size-Flux Relationships and the Biological Pump Across a Range of Plankton Ecosystem States From Coastal to Oligotrophic. Front. Mar. Sci. 6:603. doi: 10.3389/fmars.2019.00603
Received: 29 March 2019; Accepted: 11 September 2019;
Published: 01 October 2019.
Edited by:
Andrew M. P. McDonnell, University of Alaska Fairbanks, United StatesReviewed by:
Morten Hvitfeldt Iversen, Alfred Wegener Institute, Helmholtz Centre for Polar and Marine Research (AWI), GermanyColleen Andrea Durkin, Moss Landing Marine Laboratories, United States
Copyright © 2019 Fender, Kelly, Guidi, Ohman, Smith and Stukel. This is an open-access article distributed under the terms of the Creative Commons Attribution License (CC BY). The use, distribution or reproduction in other forums is permitted, provided the original author(s) and the copyright owner(s) are credited and that the original publication in this journal is cited, in accordance with accepted academic practice. No use, distribution or reproduction is permitted which does not comply with these terms.
*Correspondence: Christian K. Fender, Y2tmMThiQG15LmZzdS5lZHU=