 Mario Esposito1,2*
 Eric P. Achterberg1,2
 Lennart T. Bach1,3
 Douglas P. Connelly2
 Ulf Riebesell1
 Jan Taucher1
- 1Marine Biogeochemistry, Biological Oceanography, GEOMAR Helmholtz Centre for Ocean Research Kiel, Kiel, Germany
- 2National Oceanography Centre Southampton, Southampton, United Kingdom
- 3Institute for Marine and Antarctic Studies, University of Tasmania, Hobart, TAS, Australia
Stable isotope ratio analysis offers a unique opportunity to obtain information on ecosystem processes. The increase in atmospheric CO2 as a consequence of fossil fuel combustion and land-use change is altering the stable carbon isotope composition (δ13C) of the atmosphere and ocean. This work investigates the application of using δ13C measurements of seawater samples to explore the biogeochemical responses of marine ecosystems to anthropogenic CO2 perturbations. The combination of isotopic and non-isotopic measurements from a subtropical North-Atlantic mesocosm experiment provided a holistic view of the biogeochemical mechanisms that affect carbon dynamics under a gradient of pCO2 ranging from ~350 up to ~1,000 μatm during a phytoplankton succession. A clear CO2 response was detected in the isotopic datasets with 13C shifts of up to ~5%0, but increased CO2 levels only had a subtle effect on the concentrations of the dissolved and particulate organic carbon pools. Distinctive δ13C signatures of the particulate organic carbon pools in the water column and sediment traps were detectable for the different CO2 treatments after a nutrient stimulated phytoplankton bloom. These signatures were strongly correlated (p < 0.05) with the δ13C signatures of the inorganic carbon but not with the δ13C of the dissolved organic carbon pools (p > 0.05). Fractionation of carbon isotopes in phytoplankton was positively affected (9.6 < ε < 16.5%0) by high CO2 levels either because of the higher CO2 availability or because of a shift in phytoplankton community composition. Nevertheless, phytoplankton bloom intensity and development was independent of CO2 concentrations, and higher CO2 levels had no significant effect on inorganic nutrient uptake. Results from this mesocosm experiment showed that variations in the carbon isotopic signature of the carbon pools depend on both physical (air-sea exchange) and biological (community composition) drivers opening the door to new approaches for investigations of carbon cycling in marine ecosystems.
Introduction
Since the beginning of the industrial revolution, the concentration of carbon dioxide (CO2) in the atmosphere has increased by circa 40% from about 280 ppm to values above 400 ppm (http://www.esrl.noaa.gov). Atmospheric levels of CO2 are expected to rise further and if no effective mitigation activities are initiated they could reach levels between 750 and more than 1,300 ppm by the end of this century (IPCC, 2014). The global ocean is attenuating this increase by absorbing about 25% of the CO2 emitted by human activities (Le Quéré et al., 2016). However, the current rate of CO2 uptake is leading to perturbations in the carbonate system (ocean acidification, OA) with potentially adverse consequences for marine ecosystems. The flux of CO2 between the atmosphere and the ocean is mainly controlled by physical processes (Couldrey et al., 2016); however biological processes also affect the air-sea CO2 transfer: phytoplankton assimilate inorganic carbon dissolved in seawater and convert it into organic forms via photosynthesis. As a consequence, surface water CO2 concentrations decrease promoting further CO2 transfer from the atmosphere. In general, it is assumed that primary production and sinking of organic matter to depth (export) contribute to increase ocean CO2 sequestration from the atmosphere while community respiration tends to decrease it (Volk and Hoffert, 1985).
Over recent years, a wide range of research activities have been conducted to improve our understanding of the effects of rising atmospheric CO2 levels on carbon fixation and cycling in the marine environment. Mesocosms offer an intermediate scale between laboratory and natural conditions, representing near natural ecosystems in which environmental factors can be manipulated and closely monitored (Riebesell et al., 2013). Over the last few years, several mesocosm studies have been conducted aimed at investigating the effects of elevated CO2 on marine ecosystems. They have provided comprehensive datasets, although interpretation has been highly complex.
In a mesocosm experiment carried out in the subpolar waters of the Raunefjord, Norway in 2005, high CO2 levels enhanced inorganic carbon consumption relative to nutrient uptake (Riebesell et al., 2007), however no increased levels of organic material were observed in the water column suggesting a rapid export to the bottom of the mesocosm (Schulz et al., 2008). Interestingly, in the same experiment, labeled 13C measurements showed increased biomass of green algae and diatoms under high CO2 levels, but no indication of enhanced sinking during the bloom phase (De Kluijver et al., 2010). In order to gain further insights into carbon transfer mechanisms, an additional mesocosm study was carried out in the polar region at Ny Ålesund, Svalbard in 2010, and through the use of labeled 13C, carbon fluxes were assessed. Elevated CO2 concentrations had no direct effect on primary production and bacterial activity, however an increase in sedimentation of fresh organic material was observed (De Kluijver et al., 2013). In a recent long-term mesocosm experiment in the Swedish Gullmar Fjord, enhanced CO2 concentrations had non-detectable effects on plankton community composition (Bach et al., 2016) or on the molecular composition of organic matter (Zark et al., 2017).
The use of a 13C labeling technique in past mesocosm experiments has given indications on the direct coupling between phytoplankton and bacteria. However, tracer addition experiments are limited when the product is saturated with the labeled 13C as further incorporation of substrate would not change the signature of the product. In the case of phytoplankton and bacteria, the fast turnover rates of 2–6 days (Field et al., 1998) limit the use of the labeled 13C incorporation method for a long term assessment of carbon fluxes. Moreover, as carbon cycling in the marine system involves many active exchanges not only between the phytoplankton and bacteria compartments, interactions among all of the carbon pools must be assessed. Here, we explore the feasibility of using stable carbon isotope analysis as a tool for tracing the natural carbon component through the marine system in a long-term mesocosm study. The isotopic signal propagation was “traced” through the various carbon compartments, from the dissolved inorganic pool to the organic pools (dissolved and particulate), as well as the sinking particulate pool collected in sediment traps. The mechanisms driving the partitioning of 13C were linked to biogeochemical processes such as photosynthesis, organic matter oxidation and/or export. The main research objective was to investigate how CO2 additions can be used to trace changes in the isotopic signatures in the various carbon pools. In contrast to previous studies, labeled bicarbonate was not used here. Instead, the processes that control the distribution of stable carbon isotopes within the water column were identified and quantified under different CO2 levels. To the best of our knowledge, this is the first time that this approach is used to determine the effects and fate of increasing levels of natural carbon in a phytoplankton succession.
Materials and Methods
The Study Site and Mesocosm Experiment Description
The study was conducted in the coastal waters of Gran Canaria (Spain) between the 23rd of September and the 27th of November 2014. The Canary Island location represents a transitional zone between the northwest African coastal upwelling region and the open ocean oligotrophic waters of the North Atlantic subtropical gyre (González-Dávila et al., 2003). The islands are characterized by a relatively weak surface current (Canary Current) flowing southwestwards and driven by north-easterly trade winds. The experiment was carried out in Gando Bay (Figure 1) in order to ensure wind and wave protection from predominant north easterly wind swells. The experimental setup and mesocosm characteristics are described in detail in Taucher et al. (2017). Briefly, nine Kiel Off-Shore Mesocosms for Future Ocean Simulation (KOSMOS) were deployed and moored in clusters of three at 27° 55′N, 15° 21′W about 4.5 nautical miles (nmi) from Taliarte harbor. A very strong eastward current event (t25–t27) damaged one of the mesocosms (M6) and no more sampling was performed from this unit until the end of experiment. Data from mesocosm M6 were therefore excluded from the analyses. Only four (M5, M7, M8, and M9) of the nine mesocosms were sampled for isotopic analysis and therefore considered herein. The water depth at the deployment site was between 18 and 22 m. The bottom ends of the mesocosm bags were lowered to a depth of 15 m below the surface enclosing a volume of about 35 m3 of seawater. A 3 mm size mesh was attached to the top and bottom of the bags in order to exclude patchily distributed large organisms such as fish larvae or jellyfish from the enclosed water bodies. Free exchange of water and plankton (<3 mm) was allowed for 4 days until divers replaced the bottom mesh with the sediment trap. Attachment of the sediment trap and simultaneous pulling of the upper part of the bags above the sea surface level marked the beginning of the experiment (27th of September 2014) defined as time t-4 with t0 marking the day of the initial CO2 manipulation. The main CO2 addition was performed in four steps over 6 days by adding calculated amounts (from 77 L in M5 to 382 L in M8) of CO2-saturated seawater to each mesocosm as described in Riebesell et al. (2013), in order to yield a pCO2 gradient from ambient to concentrations corresponding to year 2150 (~1,480 μatm) according to RCP8.5 scenario (IPCC, 2014). The CO2-saturated seawater was prepared by aerating about 1,500 L of Melenara Bay filtered seawater with pure CO2 gas for at least one hour to reach pH value of ~4. The water was collected from a depth of 10 m using a pipe and pre-filtration system. Nutrient levels were low with nitrate concentrations equal to 1.8 μM, phosphate 0.1 μM, silicate 2.1 μM, and ammonium 0.1 μM. The CO2 manipulation was performed by pumping CO2-saturated seawater directly into the mesocosm bags by using a special distribution device that assured uniform distribution within a radius of ~1 m (Riebesell et al., 2013). No CO2 addition was performed on mesocosm M9 which was used as a control (ambient pCO2). Two further CO2 additions (t21 and t38) were performed during the course of the experiment to account for CO2 loss related to outgassing.
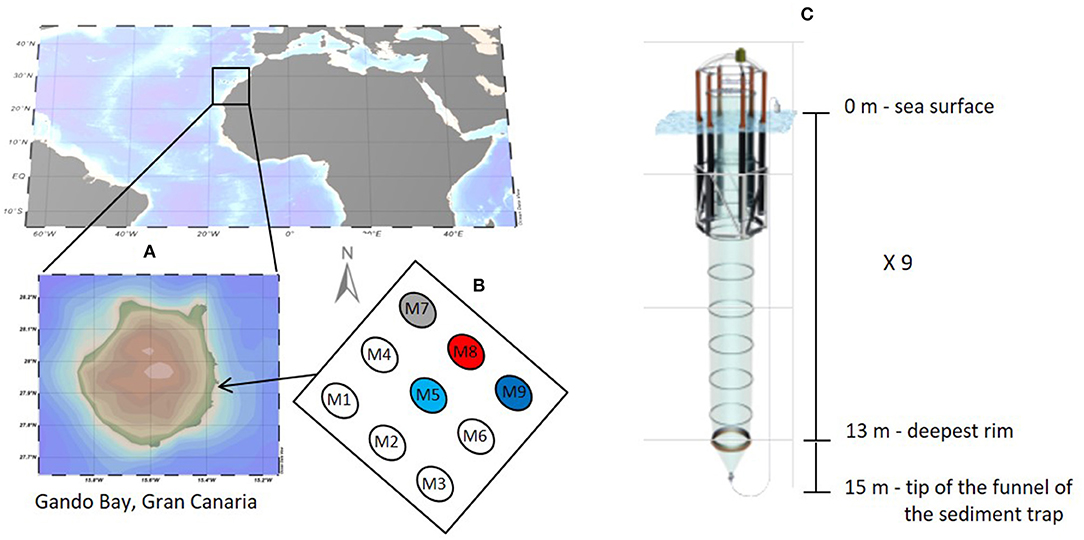
Figure 1. Study site (A) with mesocosm positioning (B) and characteristics (C), September-November 2014. Numbers show mesocosm arrangement while colors indicate the sampled mesocosms with different CO2 concentrations (blue, control at ambient pCO2; light blue, pCO2 ≈ 450 ppm; gray, pCO2 ≈ 700 ppm; and red, pCO2 ≈ 1,000 ppm).
At day t24, aliquots of deep water (~8 m3) obtained from a depth of 650 m located about 4 nautical miles north-east from the study site were added to each mesocosm to promote a phytoplankton bloom. The experiment was terminated about 15 days after the decline of the bloom at t55. The whole experiment was divided in three phases (Taucher et al., 2017) based on chlorophyll a (chl a) and nutrient dynamics: an oligotrophic phase I (t0–t23), a phytoplankton bloom phase II (t25–t35) and a post bloom phase III (t37–t55).
Sampling Strategy
Sampling was carried out every second day. The particles that settled in the mesocosm sediment traps were removed through a silicon hose connected at one side to the bottom of the sediment trap and at the other side to a vacuum-pum system. Sediment samples were collected before water column sampling directly into a 5 L Schott Duran® glass bottle, following the procedure described in Boxhammer et al. (2016), in order to avoid possible resuspension of the settled material in the mesocosm water column. Subsamples for stable carbon isotope analysis of the sedimented material (δ13CSed) were collected every other sampling day (every 4 days) from the homogenized collected sediment material. Sampling for δ13CSed was conducted by gentle vacuum (<200 mbar) filtration of 3 ml of homogenized sediment particle suspension on pre-combusted (450°C for 12 h) 25 mm, 0.7 μm pore size glass microfiber Whatman GF/F filters. The filters were stored frozen (−20°C) immediately after sampling for later analysis.
Water column samples were collected every sampling day using a depth integrating water sampler (IWS, Hydro-Bios) that allows evenly collection of 5 l of seawater over the entire depth (13 m) of the mesocosm. Separate sampling bottles were used to withdraw precise aliquots of seawater from the IWS for specific analysis types. These included samples for inorganic nutrients (nitrate, silicate, phosphate, and ammonium), dissolved inorganic and organic carbon (DIC and DOC, respectively) and pigments. Every other sampling day, the chosen mesocosms were sampled for isotope analysis in the forms of dissolved and particulate inorganic and organic carbon (Figure 2). Samples for stable isotopic analyses of dissolved inorganic carbon (δ13CDIC) were collected into 100 ml borosilicate glass bottles (Pyrex) with a glass stopper. Sample preservation was performed by spiking the samples with 20 μl of saturated mercuric chloride solution (Dickson et al., 2007). For analyses of stable isotopes of dissolved organic carbon (δ13CDOC), samples were collected into 30 ml acid-washed (HCl, 10%) and pre-combusted (at 450°C for 12 h) TOC glass vials after filtration through a pre-combusted 25 mm carbon cleaned glass-fiber filters (GF/F; Whatmann) (Farmer et al., 2007). Samples were acidified to pH <2 with 100 μl of 4 M hydrochloric acid solution for preservation. Samples for isotopic analysis of particulate organic carbon (δ13CPOC) were collected on 0.7 μm pore size pre-combusted (at 450°C for 12 h) GF/F filters by filtration of 1 L of seawater collected into 1 L narrow mouth (Nalgene, HDPE) sampling bottles. The filters were stored frozen (−20°C) immediately after sampling for later analysis.
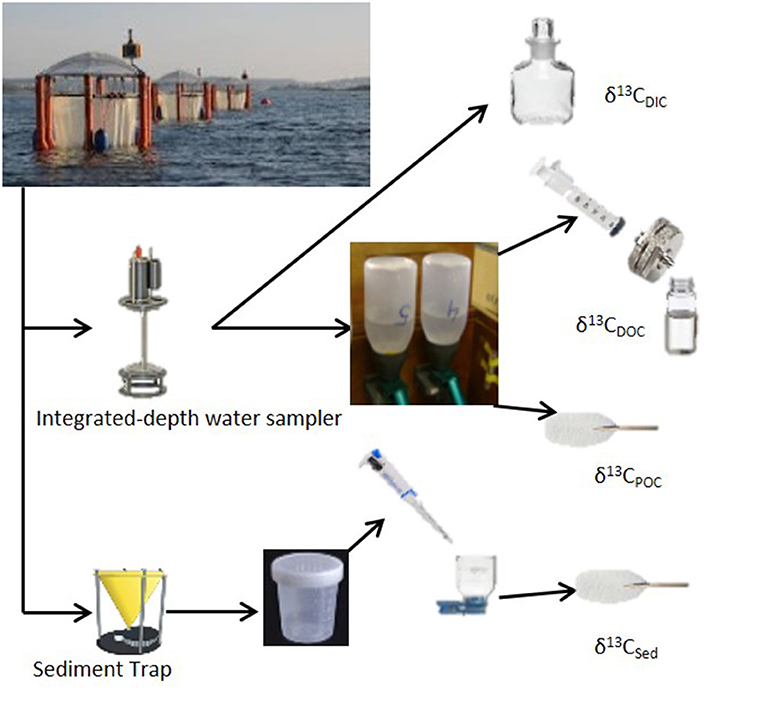
Figure 2. Sampling strategy for stable carbon isotope analysis for Gran Canaria 2014 mesocosm experiment.
Every sampling day after sediment and water column sampling, a sensor unit (CTD60M; Sea & Sun Technologies) was used to determine vertical profiles of salinity, temperature, pH, chl a, and photosynthetically active radiation (PAR) in every mesocosm and in the surrounding water.
Analytical Methods
In most cases, analysis of the collected samples followed standard procedures. Inorganic nutrients were filtered (0.45 μm cellulose acetate filters, Whatman) directly after sampling and analyzed on the same day to avoid concentration changes due to biological growth or decay. Measurements were performed using a SEAL Analytical QuAAtro AutoAnalyzer connected to JASCO Model FP-2020 Intelligent Fluorescence Detector and a SEAL Analytical XY2 autosampler. AACE v.6.04 software was used to control the system. The measurement approach is based on spectrophotometric techniques according to Hansen and Koroleff (2007) for the determination of nitrate and silicate, Murphy and Riley (1962) for the determination of phosphate and Holmes et al. (1999) for the determination of ammonium. Carbonate chemistry (DIC and TA) samples were sterile-filtered (0.2 μm) through a syringe and stored at 4°C in the dark for a maximum of 3 days until infrared absorption and potentiometric titration for the determination of DIC and TA, respectively (Taucher et al., 2017). Phytoplankton pigments were extracted in acetone (90%) to determine chl a concentrations using reverse phase high performance liquid chromatography (HPLC) as described by Bach et al. (2016) and Taucher et al. (2017).
Stable Carbon Isotope Analysis
Stable carbon isotope measurements of DIC (δ13CDIC) were performed on a GasBench II preparation device connected to a Delta V Advantage isotope ratio mass spectrometer (both Thermo Fisher Scientific). Samples were analyzed in two batches consisting of 88 and 79 measurements each. A total of 27 vials (12 ml Exetainer®Labco Ltd, High Wycombe, UK) per batch were used for calibration and quality control standards, while the rest were used for seawater samples (52 plus 4 CO2-saturated seawater). Three in-house calibration standards (Marble-MAB, NaHCO3-NA, and Na2CO3-NS) were run at the beginning and at the end of the analytical sequence, while quality control samples (blanks, Na2CO3-NSL and Dickson CRMs) were placed every 12–14 seawater samples. All the samples were run in duplicate.
Measurements of δ13CPOC and δ13CSed were performed on a Flash 2000 Elemental Analyser (EA) connected to a Delta V Advantage IRMS through a ConFlo IV interface device (all Thermo Fisher Scientific). For the determination of δ13CPOC, one set of samples was acidified for 2 h with 4 M HCl in a dessicator under vacuum to remove calcium carbonate followed by drying overnight at 50°C. The second set was only dried. A total of 104 samples (52 from the water column and 52 from the sediment traps) were analyzed in duplicate over 10 analytical runs. Each run consisted of three initial blank measurements (tin capsule and pre-combusted blank filters), duplicate measurements of calibrated urea, caffeine, and sucrose standards, followed by a set of mesocosm samples. In the case of sediment samples, dilution (78% helium) was activated in order to avoid IRMS signal intensity saturation. It must be noted that during the isotopic analysis of POC in the sediment samples technical problems occurred and only total particulate carbon data could be used. Standard materials were accurately weighed (readability of 0.01 mg) between 0.1 and 1.0 mg in order to bracket the marine particulate carbon concentration range and used both for isotopic calibration and sample concentration determination in terms of POC and TPC. Sediment trap data were converted to daily fluxes normalized by mesocosm volumes determined as described in Taucher et al. (2017).
Measurements of δ13CDOC were carried out using an in-house combined Shimadzu 5000A TOC-IRMS system. A total of 52 samples were analyzed over 5 runs. Each analytical sequence consisted of initial background and ultrapure water blank measurements, followed by calibration standards (phthalate, urea, glutamic acid, and sucrose) and a variable set of seawater samples. Standards were accurately prepared with concentrations ranging between 30 and 600 μM of carbon and used both for isotopic calibration and sample concentration determination, in terms of DOC. Deep seawater consensus reference material (Lot No. 8-08) distributed from the laboratory of D. Hansell (University of Miami) and additional urea or sucrose standards were analyzed between samples in order to check for accuracy and consistency of the measurements.
Stable Carbon Isotopes Measurement Processing
The three different instrument configurations used to perform stable carbon isotope analysis were calibrated by cross check measurements of the same standard compounds. Raw δ13C results were processed following the same procedure: removal of anomalous measurements, linearity correction, blank correction, calibration to V-PDB and average of duplicates. Anomalies were assessed based on peak area height and when the intensity of the signal fell outside of the calibration range, the data point was removed. Only 0.8% of the total number of measurements was eliminated. Linearity correction was performed by quantification of the relationship between the δ values of repeated measurements of standards with increasing concentrations vs. the respective signal intensities. The mean gradient for each standard was calculated and used for linearity correction. Variation among gradients was 0.0083%0. Instrument background, reagent blank intensities and isotopic ratios were stable for all the analytical methods with average total variation of about 2 ± 1.2%. Calibration of the samples to the V-PDB international standards was performed by three-point linear regression fits using standards of known isotopic ratios. Average r2 was 0.9998 ± 0.00017. Final δ13C values were reported as the average of both analytical replicates and sample duplicates, when available. Calculated uncertainties (2σ) were 0.03, 0.12, and 1.42%0 for δ13CDIC, δ13CPOC, and δ13CDOC measurements, respectively.
Data Analysis
Stable isotope data were expressed in the delta notation (δ13C) relative to the VPDB standard according to
where R represents the ratio of the heavy carbon isotope (13C) to the light isotope (12C). The isotopic incorporation of CO2-saturated water into mesocosm systems was calculated as relative changes in the 13C fraction of the samples. Relative changes were calculated as a delta difference (Δδ13C) between the isotopic signature of the samples and the initial carbon isotopic signatures (before CO2 additions) according to
The impact of the different CO2 additions on the δ13CDIC of the individual mesocosms was quantified with a theoretical mix using the following isotope mixing equation
where δ13CDICinitial and DICinitial are the average initial carbon isotopic signature and concentration before any CO2 addition, respectively, δ13CDICadded is the carbon isotope ratio of the added CO2 and DICadded correspond to the measured DIC differences on each day from the initial DIC concentration. Air-sea gas exchange was calculated both as total flux (FC) and as outgassing of the 13C fraction (F13C) in mmol m−2 s−1. The ratio between each mesocosm volume and the mesocosm surface area (3.14 m2) was used to normalize the air-sea gas exchange rates to units of water and to convert the rates into daily CO2 fluxes (in μmol l−1 d−1). Fluxes were calculated for phase I and III only, when biological activity was low (Chl a <0.3 μg l-1). The total flux was determined as
where Csample is the aqueous CO2 concentration of the samples, Csat is the saturation concentration corresponding to an atmospheric CO2 partial pressure of 394 ppm (ftp://aftp.cmdl.noaa.gov/data/trace_gases/co2/flask/surface). The parameter k is the gas transfer velocity in m s−1, which depends on wind speed and sea surface temperature and it was calculated according to Wanninkhof et al. (2009) by using the following equation:
where u is the wind speed, Sc is the sea surface temperature (T) dependent Schmidt number, Sc = 2073.1 – 125.62·T + 3.6276·T2 – 0.043219·T3 for CO2 (Schmittner et al., 2013) and 660 is the Schmidt number of CO2 in seawater at 20 C. Wave motion was able to transfer through the mesocosms bags inducing roughness of the surface layer inside the mesocosms. From here the choice of −0.5 as exponent in Equation 5 which is commonly applied for wavy conditions (Jähne et al., 1984; Nightingale et al., 2000). The median wind speed, recorded a few nautical miles away at 10 m height, was 5.0 m s−1, and because mesocosm surface waters were sheltered by the enclosure bags (about 1.5 m above the water level) a lower wind stress was present. A constant wind speed of 2 m s−1 was chosen and used for air-sea exchange calculations. The air-sea flux of 13CO2 (F13C) was calculated according to Zhang et al. (1995) by using the equation:
where k is the piston velocity in m s−1 and αk is a constant kinetic fractionation factor (αk = 0.99915) adapted from Schmittner et al. (2013). The terms αaq←g and αDIC←g are the temperature dependent isotopic fractionation factors from gaseous to aqueous CO2 and from gaseous CO2 to DIC, respectively. RDIC and RA correspond to the heavy to total isotope ratios of DIC and atmospheric CO2, respectively, and they were determined from 13C fractions as RDIC = 13CDIC/(12CDIC + 13CDIC) and RA = 13CA/(12CA + 13CA). The RA was derived from the isotopic signature of the atmospheric CO2 which was assumed to have a fixed δ13C value of −8.2%0 according to the reported monthly average isotopic air measurements for the Canary Islands area (ftp://aftp.cmdl.noaa.gov/data/trace_gases/co2c13/flask/).
The effect of air-sea fluxes on δ13CDIC distributions was calculated as a difference (ΔF13C) between the F13C (divided by isotope ratio of the standard, Rstandard = 0.0112) and the total carbon flux according to Schmittner et al. (2013) by using the following equation:
To estimate carbon uptake by phytoplankton during photosynthesis a mass balance approach was used. The net changes within the various carbon pools were calculated for Phase II and III only as differences relative to initial conditions. The average DOC and POC values measured over the period before deep water addition were used as initial reference conditions. The net community production (NCP) was estimated from the build-up of biogenic carbon as an accumulation (in μmol l−1) rather than a rate according to
Photosynthetic isotope fractionation (ε) between CO2 and phytoplankton during the uptake process was calculated as
where is the isotopic signature of aqueous CO2 calculated from δ13CDIC values using the equilibrium fractionation factors between DIC and CO2(aq) according to Zhang et al. (1995), and δ13CPOC is the isotope ratio of particulate organic carbon assumed to represent the phytoplankton fraction in the water column. Dissolved CO2 and not bicarbonate was considered as the main form of carbon assimilated by phytoplankton during growth due to its low energy costs associated with passive intracellular transport (Burkhardt et al., 1999; Marty and Planas, 2008) and to its generally high availability (CO2(aq) = 10–14 μmol l−1) found in geographically proximate areas previously reported for the same time of year (Santana-Casiano et al., 2001; González-Dávila et al., 2003). Comparison with fractionation values calculated vs. total DIC rather than vs. the isotopic composition of dissolved CO2 are also reported.
The NCP was used to estimate the fraction (f) of inorganic carbon (DIC) converted into organic matter. The latter was used to build an isotope fractionation model to assess the isotopic changes of the POC pool according to the substrate (DIC) uptake during the bloom phase. The model predicts the progress of the accumulated product (δP) and the residual substrate (δRS) according to
and
where α = (1,000 + Δ)/1,000 and the term δInput represent the isotopic signatures of DIC of each mesocosm before the onset of the bloom. A fixed fractionation factor (Δ) of 20%0 was used.
Statistical Analysis
The isotopic data reported are average values between duplicate samples (when available) with standard deviations (1σ) within the analytical error. The dataset was tested for normality distribution using the online Grubbs test (http://graphpad.com/quickcalcs/grubbs1/) and eventual outliers were removed and/or mathematically interpolated. Linear regression analyses were used to determine the relationship between pCO2 and average response of the variables to each CO2 addition phase. Significance was accepted for p-values < 0.05. The potential effect of the added CO2 on the various parameters was also calculated by subtracting observations of the control mesocosm from the treated mesocosms for the specific sampling day.
Results
Mesocosm Performance and Mesocosm Phases
A total of 9 mesocosms were deployed in Gando Bay, but only four of them (M5, M7, M8, and M9) were sampled for stable carbon isotope analysis. The water inside the mesocosms was allowed to exchange with the surrounding water for a total of 4 days before isolation of the mesocosms water body from the surrounding water. Initial salinity, temperature, density, chl a and nutrient concentrations between the mesocosms were comparable. Average initial salinity in the mesocosms was 37.08 ± 0.01 and gradually increased throughout the experiment to reach final values of 38.03 ± 0.02. The reason for the change was mostly due to evaporation although the addition of less saline deep water halfway through the experiment tempered the increase. Temperatures decreased gradually from 24.31 ± 0.02°C to 22.22 ± 0.01°C during the course of the experiment. According to CTD profiles, no halocline or thermocline developed during the experiment and all mesocosm parameters were relatively homogeneous through the water column. Injections of CO2-saturated seawater into the designated mesocosms formed a concentration gradient with average pCO2 values of 473.9 ± 22.6 μatm (M5), 776.8 ± 42.8 μatm (M7), and 1311.7 ± 105.3 μatm (M8) determined after each CO2 addition (t5, t23, and t39). Mesocosm M9 was not treated (control) and exhibited average pCO2 concentrations of 364.4 ± 64.0 μatm measured over the same periods. Additions of CO2-saturated seawater increased mesocosm DIC concentrations proportionally and linear regression analysis confirmed the significant differences (p < 0.05) among treatments. However, no significant differences among mesocosms were observed overall for other physical parameters or nutrient data when CO2 treatments were compared (Table 1).
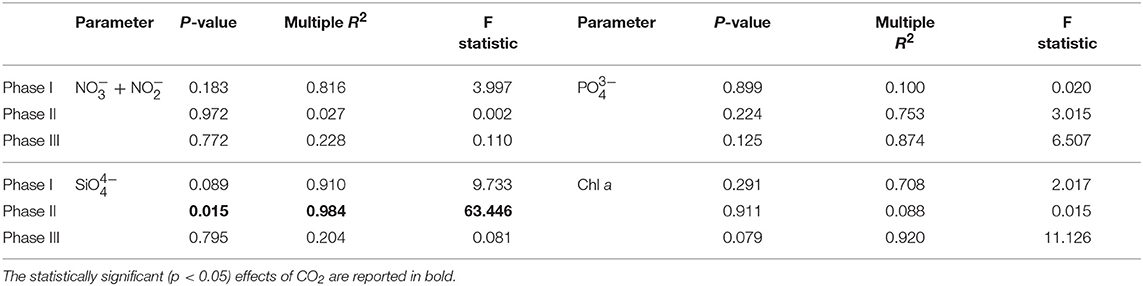
Table 1. Results of linear regression analyses testing for statistical significance of pCO2 effect on mesocosm nutrients and chlorophyll a for each experimental phase.
Nutrient concentrations as well as chl a variations and CO2 manipulation were used to define the different experimental phases (Figure 3). Initial concentrations of inorganic nitrate plus nitrite ( + ) were between 0.06 and 0.15 μM, inorganic phosphate () ranged between 0.01 and 0.07 μM, silicic acid () was on average 0.23 ± 0.054 μM and ammonium was variable between 0.04 and 0.34 μM for all mesocosms until the day of deep water addition. On day t24 about 8 m3 of deep seawater were added per mesocosm bringing nutrient concentrations to 3.19 ± 0.02, 0.17 ± 0.01, and 1.61 ± 0.11 μM for + , , and , respectively. Ammonium levels were not affected by the addition of deep seawater and exhibited concentrations around 0.07 ± 0.03 μM for all mesocosms. The simulated upwelling event triggered a phytoplankton bloom that lasted circa 10 days after which inorganic nutrients stabilized back to initial levels (Figure 3). Measurements of chl a confirmed the progression of the three phases (Figure 3). During the initial oligotrophic phase, chl a values ranged between 0.18 and 0.24 μg l−1. With the development of the bloom phase chl a values increased and on t31 the average concentration was 2.95 ± 0.67 μg l−1. The maximum value (5.62 μg l−1) was recorded for mesocosm M9 on t28. In the post bloom phase chl a concentrations dropped although they were on average higher (0.57 < chl a <1.10 μg l−1) than the initial concentrations. No statistically significant differences in chl a concentrations were observed between pCO2 treatments (Table 1).
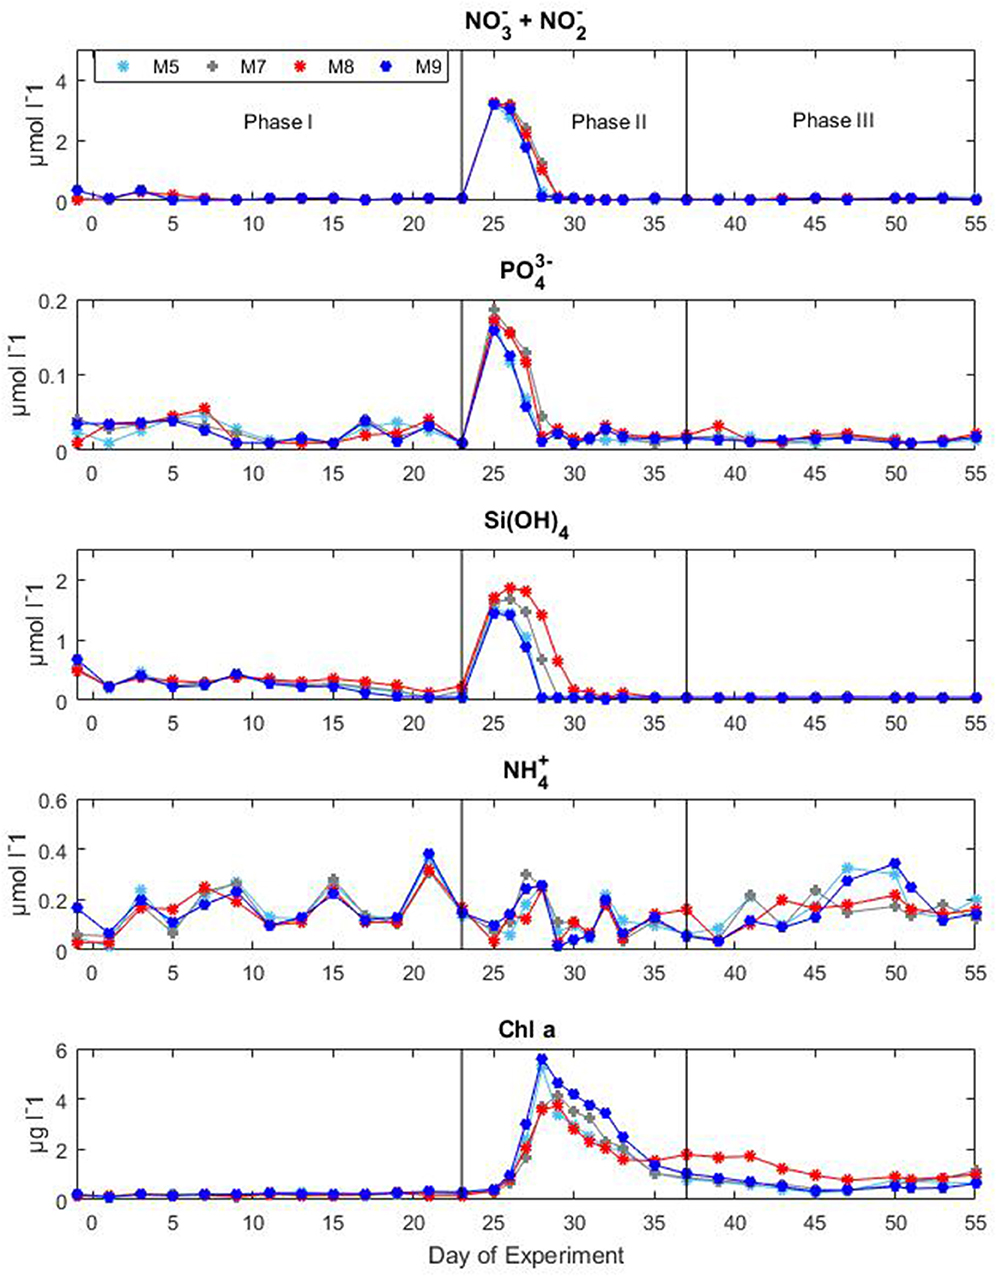
Figure 3. Concentrations of inorganic nutrients and chlorophyll a during the Gran Canaria mesocosm experiment (2014). Sampling days (t-days) and main experimental manipulations are shown on the x-axis. Vertical lines define the experimental phases.
During the oligotrophic phase, the mesocosm communities were mainly consisting of pico- and nano-phytoplankton with cyanobacteria constituting the predominant group. The phytoplankton bloom in phase II, fuelled by deep water addition, was dominated by diatoms which accounted for more than 70% of the total chl a. Following the bloom, the microphytoplankton communities in the mesocosms were mainly dominated by large dinoflagellates (Taucher et al., 2017). The mesozooplankton community was dominated by copepods (~90% of the total mesozoplankton abundance) throughout the whole experiment. During the oligotrophic phase zooplankton abundances were comparable among the different mesocosms, however after deep water addition, generally higher zooplankton abundances were observed in the high CO2 treatments. However, a surprising temporal delay in zooplankton abundance was observed in the high pCO2 mesocosms compared to the low and medium pCO2 conditions (Algueró-Muñiz et al., 2019).
Mesocosm Carbon Dynamics: Concentrations and Stable Isotopes
In most of the cases, carbon trends agreed well with the phases defined by nutrients and chl a dynamics: oligotrophic phase I, phytoplankton bloom phase II and post bloom phase III. Before any CO2 addition, on t-1, the δ13CDIC of the water was 1.06%0. Analysis of aliquots of CO2-saturated seawater showed that the isotopic signature (δ13CDIC) of the added seawater was −35.64 ± 0.43%0 (n = 10) for the first batch and −36.28 ± 0.06%0 (n = 12) for the second batch. Samples from the third batch were not taken therefore no measurements are available. The effects of the added CO2 on mesocosm carbon species are summarized in Table 2 where statistical significance of pCO2 treatments on each of the carbon system parameters for each experimental phase is reported.
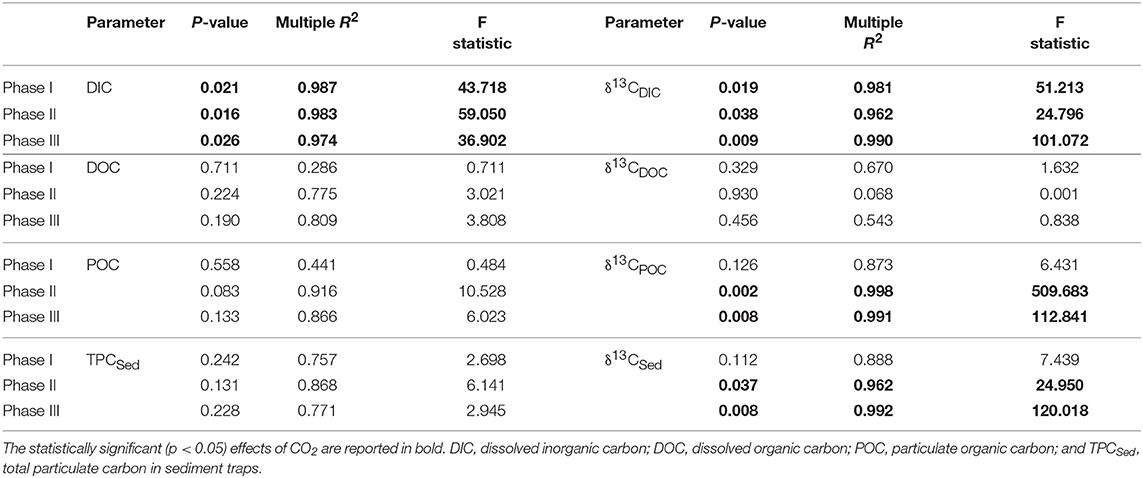
Table 2. Results of linear regression analyses testing for statistical significance of pCO2 effect on mesocosm carbon system parameters for each experimental phase.
Oligotrophic Phase I
Following the first CO2 addition, the δ13CDIC of the mesocosms decreased significantly (Table 2 and Figure 4) in proportion to the added amount with average 13C depletion of 1.4, 2.9, and 4.8%0 for mesocosm M5, M7, and M8, respectively, throughout the whole oligotrophic phase. A slight isotopic enrichment (0.2%0) combined with a decrease in DIC concentrations over time was observed in the treated mesocosms M7 and M8. The tendency to isotopic enrichment (greater amount of heavy isotope 13C) of surface water DIC for the higher CO2 level mesocosms was confirmed by the positive values of ΔF13C in mesocosm M7 and M8 (Table 3). This trend was mostly driven by outgassing indicated by the negative values of Fc and F13c calculated for these mesocosms (Table 3). Average CO2 efflux was 0.9 and 2.6 μmol l−1 d−1 for mesocosm M7 and M8, respectively, while an average daily CO2 influx of 0.4 ± 0.04 μmol l−1 was observed for the ambient pCO2 control mesocosm M9. Mesocosm M5 exhibited variable daily fluxes with an overall CO2 influx of 0.07 ± 0.05 μmol l−1 d−1 throughout the oligotrophic phase I. The average isotopic signature of the particulate carbon in the water column and in the sediment traps was −22.8 ± 0.72%0 and −21.1 ± 1.71%0 from t-1 to t13 for all mesocosms. A small decrease in δ13CPOC was observed at t19 in the treated mesocosms. An explanation for this small drop could be related to the Saharan dust event which occurred between t16 and t22. The dust event induced an increase of diatom biomass (Taucher et al., 2017), mainly composed of nanopythoplankton (Hernández-Hernández et al., 2018) that could have contributed to decrease the isotopic signature of POC in the water column at t19 due to an initial uptake of the added lighter carbon. Dissolved organic carbon concentrations gradually increased in all mesocosms from an average initial value of 98 ± 2.4 μmol l−1 on t5 to a mean value of 108 ± 0.4 μmol l−1 on t19. Ammonium concentrations, although highly variable, corroborate the DOC trend showing a general increase from 0.04 ± 0.02 μM at t1 to 0.13 ± 0.01 μM on t19 (Figure 3). The δ13C of the DOC pool was highly variable with observed ratios between −25.8 and −21.1%0. At first glance the CO2 treatments appeared to lower 13C of the DOC component, however isotopic ratios of DOC in mesocosm M9 (control) were similar to the high treatment mesocosm with an average δ13CDOC value of −23.9 ± 1.06%0. Linear regression analysis confirmed there was no significant effect of pCO2 treatment on δ13CDOC dynamics (Table 2).
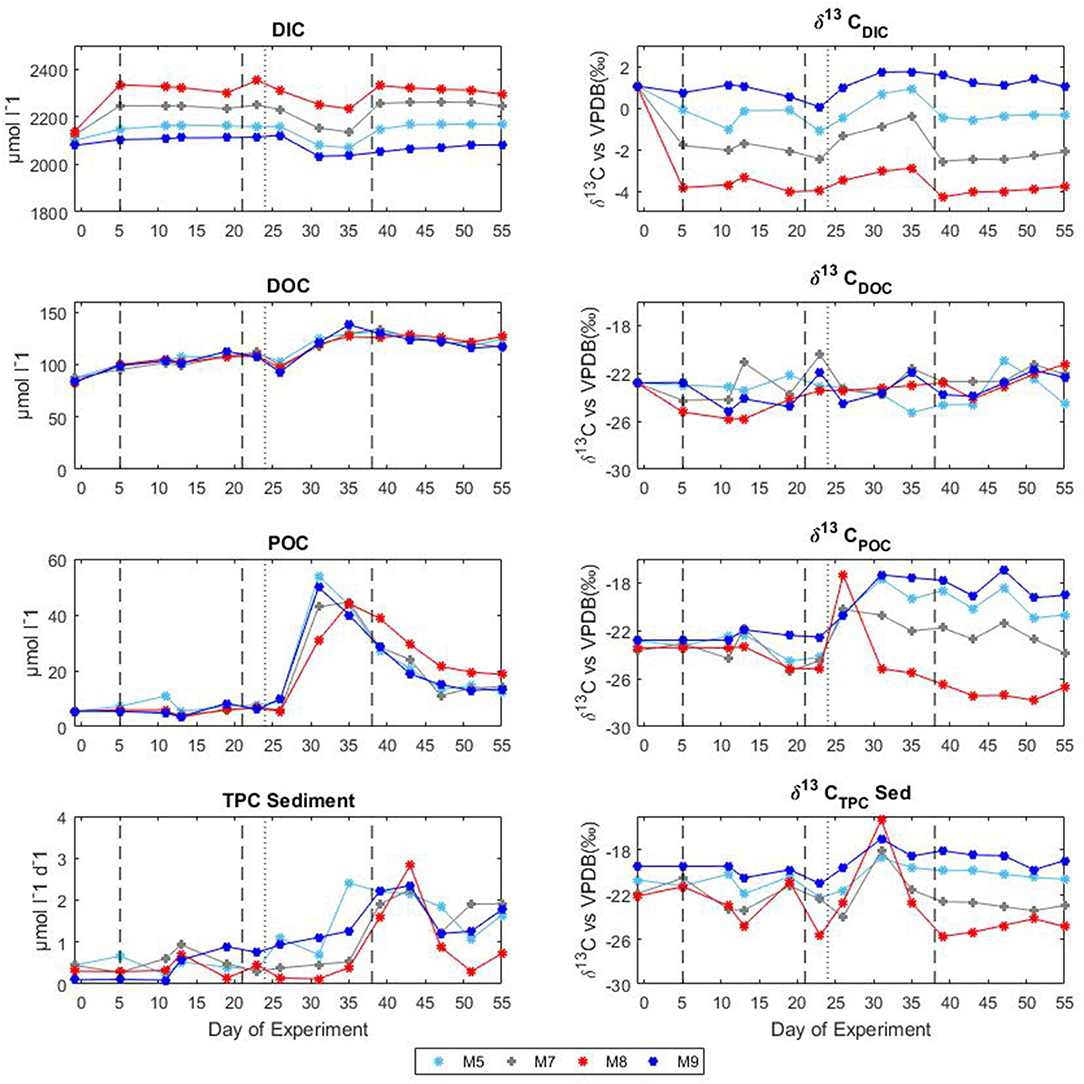
Figure 4. Temporal development of concentrations and stable isotopes of carbon during the mesocosm experiment in Gran Canaria 2014. The vertical dashed lines denote the timing of CO2 additions, the vertical dotted lines indicate deep water addition. DIC, dissolved inorganic carbon; DOC, dissolved organic carbon; POC, particulate organic carbon; and TPC, total particulate carbon.
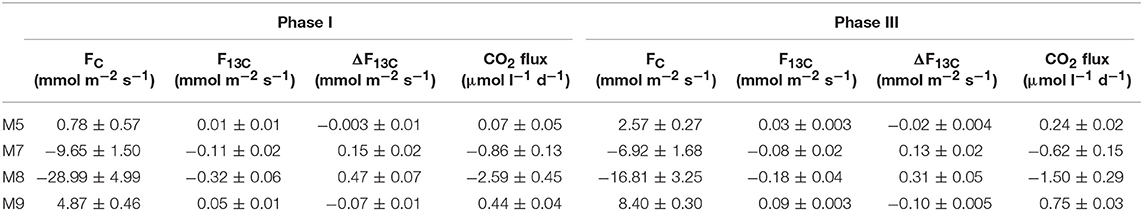
Table 3. Air-sea CO2 fluxes for the mesocosm M5, M7, M8, and M9 during Phase I and Phase III.
Phytoplankton Bloom Phase II
The second CO2 addition (t21) in general tended to stabilize DIC concentrations to target levels without causing any major effect on the isotopic signature of the inorganic carbon pool. The addition of deep water stimulated a phytoplankton bloom which characterized the second phase (t25–t35). With the development of the bloom, the DIC concentrations decreased on average by 5% with a corresponding isotopic enrichment of about 2%0 for all mesocosms. The DOC concentrations decreased soon after the addition (average DOC = 98 ± 4.2 μmol/l at t26) possibly due to dilution with deepwater of lower DOC concentration. An increase in DOC of about 25% (mean value of 131 ± 4.9 μmol l−1) followed and was noticed in all mesocosms. Measurements of δ13CDOC samples showed reduced variation among mesocosms during the bloom period with an average value of −23.4 ± 0.49%0. Particulate organic carbon in general mirrored chl a dynamics showing a rapid increase in all mesocosms to concentrations up to 53.9 μmol l−1 (M5 at t31). The sediment counterpart showed a slight delay with TPCSed fluxes starting to increase at the end of phase II. The particulate carbon in the water column showed a rapid isotopic enrichment (about 4%0) following deep water addition, however with the development of the phytoplankton bloom, the isotopic ratios of POC in individual mesocosms tended to significantly diverge (Table 2 and Figure 4) according to the added CO2 levels (lower ratios for higher pCO2 treatments). A similar trend was observed for δ13CSed samples although the corresponding isotopic response was detected on the successive sampling day (temporal shift).
Post Bloom Phase III
The last CO2 addition on t38 brought concentrations and isotopic ratios of DIC close to pre-bloom levels. Over the entire post bloom phase, DIC concentrations in mesocosm M8 and M7 decreased by 1.5 and 0.5%, respectively, while an increase of 0.9 and 1.5% was observed in mesocosms M5 and M9, respectively. This trend suggested that air-sea gas exchange was driving seawater pCO2 toward the equilibrium with the overlaying atmosphere. Similarly to Phase I the gas exchange had little effect on the δ13CDIC distribution with isotopic variations within mesocosms lower than 0.2%0 for the duration of the entire phase III. The tendency to isotopic enrichment of surface water DIC for the higher CO2 level mesocosms was confirmed by the positive values of ΔF13C in mesocosms M7 and M8 while isotopic DIC depletion was suggested for M5 and M9 according to the calculated negative ΔF13C values (Table 3). Compared to phase I there was a general tendency to hold more CO2 in the mesocosm waters and this was possibly due to the lower temperatures (ΔT = 2°C) observed during phase III. The DOC levels remained stable with average concentrations of 123.8 ± 5.02 μmol l−1 and the δ13CDOC showed no significant differences (Table 2) among treatments. The measured δ13C of the DOC pool was reasonably similar for all the mesocosms with a slight increase over time from an average of −23.6 ± 0.82%0 at t39 to −21.9 ± 0.57%0 at t55 (excluding M5). In mesocosm M5, the last sample (at t55) had a δ13CDOC value of −24.6%0. In the water column, concentrations of particulate carbon decreased by more than a half compared to the bloom period for all mesocosms. In the sediment traps, maximum fluxes (2.83 ± 0.30 μmol l−1 d−1) were recorded at the beginning of phase III on t43 as a consequence of the phytoplankton bloom decline and subsequent settling, until they stabilized to final TPC values of 1.32 ± 0.59 μmol l−1 d−1. A second sedimentation event occurred on the last sampling day at t55 when divers scraped off the benthic microalgae layer that had grown on the side walls of the sediment trap funnel in order to collect all the material, clean the mesocosm bags, and conclude the experiment. Compared to the other mesocosms, at the end of the experiment, M8 had higher POC concentrations (18.6 μmol l−1) in the water column and consequently lower TPC flux (0.73 μmol l−1 per day) in the sediment trap. Isotopic signatures of the particulate carbon reflected the isotopic trend of δ13CDIC both in the water column and in the sediment traps showing significant correlations (Table 2) with the pCO2 treatments. The measured isotopic values of POC were on average −19.8 ± 1.17, −22.5 ± 0.97, −27.2 ± 0.55, and −18.4 ± 1.02%0, for mesocosm M5, M7, M8, and M9, respectively, from t39 to t55 (Figure 4). Average δ13CSed values over the same period were −20.2 ± 0.35, −22.9 ± 0.32, −24.9 ± 0.60, and −18.7 ± 0.65%0, for mesocosm M5, M7, M8, and M9, respectively (Figure 4).
Discussion
Impacts of CO2 Addition on the Stable Carbon Isotope Composition of Mesocosm Waters
The increasing anthropogenic CO2 emissions and the consequent oceanic uptake are altering the marine environment. One line of evidence of this CO2-induced change is a reduction of the isotopic ratio of surface ocean waters known as the 13C Suess effect (Keeling, 1979). In this study, the addition of isotopically light CO2 to the mesocosm systems simulated the oceanic CO2 accumulation and therefore the evaluation of any CO2 derived effect could improve our understanding of future ecosystem responses. The CO2 manipulation formed a DIC concentration gradient among the considered mesocosms which was indicative of the potential atmospheric CO2 increases expected over the next few decades without substantial emission reductions. The CO2 treatment gradient was reflected in the isotopic signature of DIC (Figure 4) indicating the added lighter carbon (δ13CDIC = −35.96 ± 0.45%0) mixed homogeneously in the water columns of the mesocosms. Comparison of the measured δ13CDIC with theoretical mixing values gave an indication of the true isotopic variability within each mesocom (Figure 5). The theoretical δ13CDIC values vs. the inverse of the DIC concentrations defined the true isotopic response to CO2 additions for each mesocosm. The binary mixing line confirmed the establishment of a linear correlation with the various CO2 additions although a slight underestimation of the theoretical isotopic response compared to the measured values was observed (Figure 5). Higher deviations from the theoretical values were observed mainly in the higher treatment mesocosms M8 and M7, probably because of the higher degassing rate of the samples during analysis. The mixing model allowed also for the extrapolation of the isotopic composition of the added CO2 defined by the y-intercept. The extrapolated value of −36%0 agrees well with the measured δ13CDIC of the added CO2 rich water.
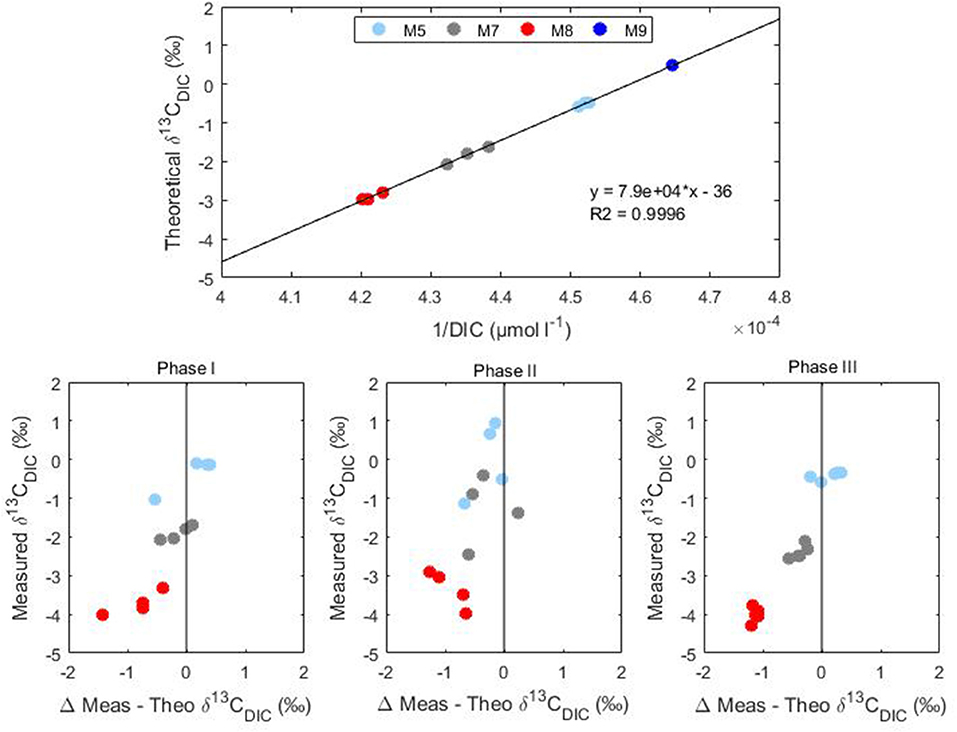
Figure 5. Conservative binary mixing plot of theoretical δ13CDIC vs. the inverse of DIC concentrations and measured stable carbon isotopic signatures (δ13CDIC) vs. differences between theoretical and measured values during Phase I, II, and III of Gran Canaria mesocosm experiment (2014).
The small isotopic effect (about 0.2%0 enrichment) due to air-sea gas exchange was discernible both during Phase I and Phase III were a slight increase in δ13CDIC was observed (Figure 5). Compared to DIC variations δ13CDIC variations were substantially smaller with rather constant isotopic composition of DIC observed in the treated mesocosms. This trend was most likely due to the longer times required by carbon isotopes compared to concentrations to reach the equilibrium with the atmosphere. Equilibration times for δ13CCO2 are estimated to be 10–20 times longer compared to the total CO2 (Lynch-Stieglitz et al., 1995). This effect is confirmed by the substantially smaller values observed for F13C compared to FC in all mesocosms during Phase I and III (Table 3).
The influence of isotopic equilibration on δ13CDIC depends not only on physical gas exchange, but also on biological processes. During the bloom phase, the gas exchange effect was “masked” by the biological uptake which sharply raised the isotopic composition of DIC in the mesocosm waters. The transfer from DIC to phytoplankton during phase II was rapid with an average phytoplankton carbon uptake of 52.9 ± 8.83 μmol l−1 per day, between t26 and t35. Comparable rates of primary production were reported by Hernández-Hernández et al. (2018) for this study. With the development of the bloom, the δ13CPOC values rapidly decreased with consequent associated increase of δ13CDIC in the residual seawater according to uptake.
Effects of CO2 Addition on the Dissolved Organic Carbon Pool
No significant differences in DOC concentrations and isotopic composition (Table 2) were observed among the mesocosms during the course of the experiment. In agreement with our results, in the same study, Zark et al. (2017) could not find a detectable imprint in the molecular composition of organic matter suggesting a universal microbial transformation of freshly produced dissolved organic matter despite the presence of different phytoplankton species and CO2 concentrations. Unlike the study by De Kluijver et al. (2010), in this study, direct phytoplankton to bacteria transfer dynamics could not be revealed as group specific labeled biomarkers were not used. However, the combination of DOC measurements with δ13CDOC, could give indirect indication of bacterial behavior. The rapid increase in DOC concentrations following the phytoplankton bloom, and the successive slow DOC build-up following the collapse, could be partly associated with bacterial biomass dynamics. Bulk δ13CDOC measurements, could instead be used to define phytoplankton-bacteria interactions. Bacterial production is significantly correlated with planktonic primary production as phytoplankton derived organic matter forms an important food source for heterotrophic bacteria (Cole et al., 1988). The weak response observed in the δ13CDOC signal might indicate that bacteria utilized the freshly produced DOC and transferred it back into the DIC pool before it could accumulate into a more refractory DOC pool. On the other hand, the increase in DOC concentration could be explained by intensive exudation of DOC by phytoplankton. The absence of a strong DOC isotopic signal could also have originated from organic matter such as dying zooplankton which were present before any isotopically light CO2 addition. Similar results were obtained in incubation (Norrman et al., 1995) and past mesocosm experiments (De Kluijver et al., 2010, 2013) where bacterial δ13C never fully reached the signature of the labeled 13C value of the corresponding algal POC, although a stronger isotopic signal was measured in these studies. It must be noted that the uncertainties associated with δ13CDOC measurements in the present study were relatively high (σ = 0.71%0) and this might have masked some underlying signal. Moreover, contrary to previous studies in which the isotopic signal was intensified through the use of labeled 13C, here the small difference in the isotopic signature of the two organic carbon pools, might have constrained further the quantification of potential isotopic incorporation into the DOC pool.
Net Community Production and Settled Biomass
Mesocosm water columns were homogeneously mixed without formation of any thermo- or halocline that could cause stratification. This situation facilitated particle mixing throughout the full water column. Prior to the phytoplankton bloom, autotrophic activity, and sedimentation rates were generally low reflecting the low biomass in the water column (Figures 4, 6). During the bloom phase autotrophic activity was contributing for more than 60% to the total NCP. From t35 until the end of the experiment, the contribution of heterotrophic activity was about 40% for all mesocosms (Figure 6). It must be mentioned that neither bacterial nor zooplankton biomass were taken into account for the calculation of the NCP so that uncertainties in the total transfer and storage of carbon might be present. Sedimentation of particulate matter and build-up of dissolved carbon started to increase toward the end of the bloom phase. Highest sedimentation rates were observed at the end of the bloom peak, implying a temporal delay between primary production and sinking particle flux. During the post bloom phase, the mesocosm (M8) with highest CO2 level showed higher build-up of particulate matter in the water column compared to the other treatments even though Chl a levels were relatively low. Interestingly, slower sedimentation rates were observed in the sediment trap of M8 and this was also reflected in a more pronounced isotopic enrichment of the particulate carbon compared to the low CO2 level mesocosms (Figures 4, 6). This situation suggests a highly efficient transfer of autotrophic into non-sinking phytodetritus accumulating in the water column. In shallow sediment traps zooplankton can largely contribute to the settling material either by production of sinking detrital carbon (feeding products and fecal pellets) or by actively swimming into the trap (Buesseler et al., 2007). In a previous mesocosm experiment (De Kluijver et al., 2013), high mesozooplankton biomass was observed and zooplankton products were estimated to have contributed for 82% to the carbon isotopic signature of the sediment material. According to their findings, the observed decreased export in mesocosm M8 compared to the other mesocosms could be related to the fact that the high CO2 level mesocosm showed a temporal delay in zooplankton development (Algueró-Muñiz et al., 2019) resulting in less degradation and consequent sinking of organic material. This was confirmed by Stange et al. (2018) where in the same study, based on changes in the C:N ratio of sediment trap material, they attributed the increased retention of water column POM under elevated levels of CO2 to the lower abundance of micro- and mesozooplankton. In terms of isotopic composition of the exported material, in general, during and after the phytoplankton bloom, a good agreement between the carbon isotopic signature in the mesocosm sediment traps and the isotopic signature of POC in the water column was observed. The match confirmed the sinking material was formed of freshly produced aggregates although a temporal decoupling was observed.
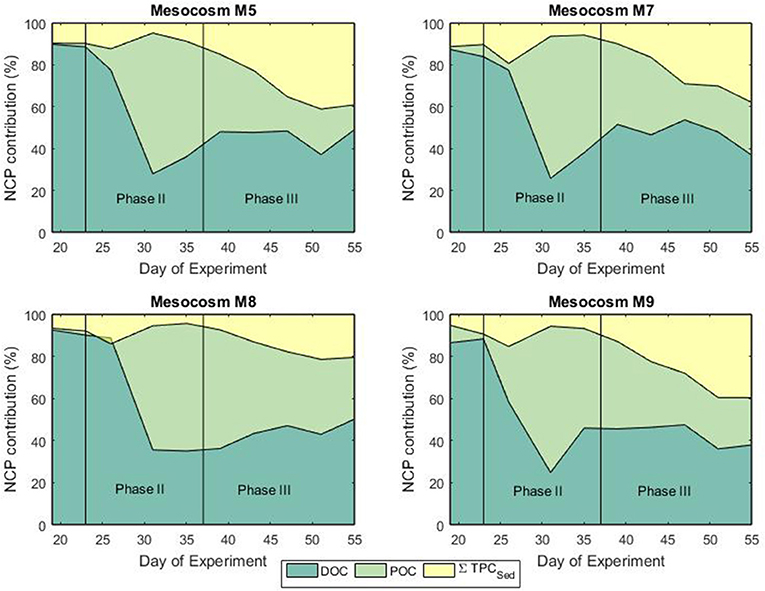
Figure 6. Fractional contribution (%) of DOC, POC, and sedimentation to the net community production during the bloom (phase II) and post-bloom (phase III) phases.
Phytoplankton Fractionation Response to CO2 Additions
During photosynthesis, the lighter isotope of carbon, 12C, is preferentially taken up relative to the heavier isotope, 13C (O'Leary, 1981; Gruber et al., 1999). The inorganic carbon source utilized by phytoplankton either diffuses or is actively transported across the membrane into the cell. Once in the cell, carbon is fixed by an enzymatic reaction mainly driven by the enzyme ribulose-1,5-bisphosphate Carboxylase/Oxygenase (RubisCO) to produce phytoplankton biomass or diffuses back into the environment (Farquhar et al., 1982). Overall, the carbon isotopic composition of phytoplankton is determined by the isotopic composition of the source of inorganic carbon (CO2 or ), isotope fractionation during transport into the cell, leakage of CO2 out of the cell and isotopic discrimination during enzymatic carboxylation (Hayes, 1993). In our experiment, the isotopic signature of the particulate organic carbon in the water column of all mesocosms sharply increased (on t26) following deep water addition (Figure 4). Stable carbon isotopic measurements of the collected deep water were not performed however it is possible that the added deep water had a more positive δ13CPOC value compared to the one inside the mesocosms that contributed to increase the δ13CPOC signatures of the mesocosm waters. The breakdown of large isotopically heavy particles originating in or above the pycnocline and the transformation of DOC into POC have been considered to be responsible for reported isotopically heavier signatures of particulate carbon at depths compared to the surface for several study areas including the equatorial Atlantic Ocean (Jeffrey et al., 1983).
Over the past decades, many studies have shown that carbon isotope fractionation in marine phytoplankton varies according to the CO2 concentrations of surface water (Hinga et al., 1994; Rau et al., 1996; Burkhardt et al., 1999) with a general increase in 13C fractionation under higher CO2 levels. One of the major factors controlling the fractionation of carbon into phytoplankton is the availability of aqueous CO2. In this study the calculated phytoplankton fractionation (ε) ranged between 9.6 and 16.5%0 with higher values observed in the high CO2 treatment mesocosm (mean ε = 15.6%0 in mesocosm M8). Average fractionation values of 11.9, 12.8 and 12.0%0 were calculated for mesocosms M5, M7, and M9, respectively (Figure 7). In agreement with previous laboratory based work (Hinga et al., 1994; Laws et al., 1997; Kukert and Riebesell, 1998; Burkhardt et al., 1999), in our study, isotope fractionation between CO2 and phytoplankton was higher in the communities grown under higher CO2, however, the response did not follow a linear concentration gradient but was mainly detected in the highest CO2 treatment mesocosm M8 suggesting the possible presence of a threshold level. Interestingly, all the calculated ε for the high CO2 treatment mesocosm M8 showed also a narrower range compared to the control and the other treatments.
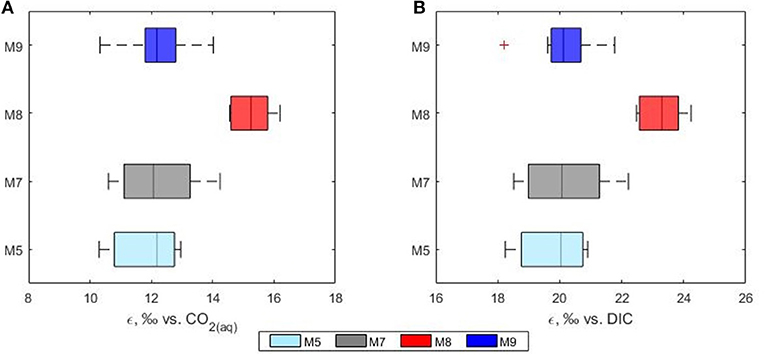
Figure 7. Phytoplankton discrimination values (ε) calculated relative to the isotopic composition of (A) CO2(aq) and (B) total DIC. Mesocosms. M5 (light blue), 450 ppm; M7 (gray), 700 ppm; and M8 (red), 1,000 ppm; M9 (blue), control mesocosm at ambient pCO2 concentrations.
In this study the net community production was used to estimate the fraction of DIC consumed by the phytoplankton hence fixed as biomass during the development of the bloom. In this case, the fraction could serve as an indication of growth and be used to simulate the theoretical progress of the bloom in terms of isotopic change in the DIC and POC. The use of a fixed fractionation factor value allowed for the assessment of the relationship between the signature of the substrate and the POC pool. In our model, the substrate pool (DIC) splits into a product (POC) according to the fractionation value of 20%0 and into a residual substrate (DIC left in the pool). According to the model, the resulting isotopic variations in the formed product and residual substrate agreed well with the measured values of both δ13CPOC and δ13CDIC, respectively (Figure 8). No significant differences between modeled and measured values could be observed in mesocosm M5, M7 and M9. On the contrary the isotopic signatures of POC in mesocosm M8 diverged from the model suggesting again a higher fractionation value for this mesocosm. A plausible explanation for the smaller range and higher fractionation values found in mesocosm M8 could be linked to a shift in phytoplankton community composition. It has been shown that isotopic fractionation by autotrophic phytoplankton can be taxon-specific (Pagani et al., 2002; Vuorio et al., 2006). According to Chemtax analyses, the mesocosms were dominated by diatoms with high abundance of bacillariophyta (diatoms) and almost complete absence of chlorophyte (green alga) (Taucher et al., 2017). Mesocosms M8 developed a bloom of a Dictyocha-like toxic microscopic alga (Vicicitus globosus) which affected the phytoplankton community structure (Riebesell et al., 2013). Autotrophic dinoflagellates did not develop in the high CO2 treatment mesocosm M8 until the post bloom phase (t43) when v. globosus abundance decreased. Whether it was the high CO2 availability, the dominance of a specific planktonic group or a combination of both, in this mesocosm experiment elevated CO2 concentrations positively affected the stable carbon isotope fractionation in phytoplankton.
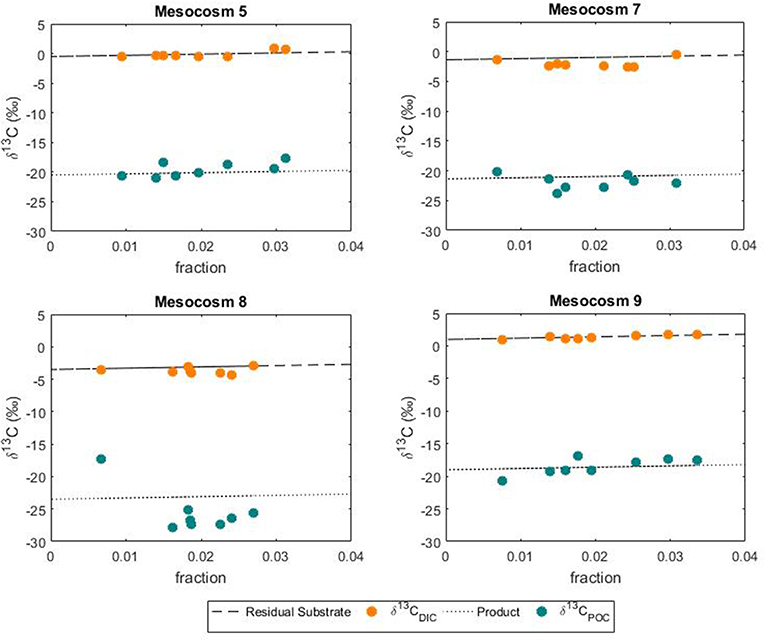
Figure 8. Variations in the POC pool according to substrate uptake. Comparison between modeled changes and measured isotopic signatures of DIC and POC during the phytoplankton bloom.
Conclusion
The close-to-natural conditions in mesocosm compared to laboratory experiments, make mesocosms ideal platforms to investigate carbon dynamics whilst allowing the study of the effects of CO2 on phytoplankton species and composition. This study was the first to employ stable isotope analysis of unlabelled natural carbon in order to examine carbon transfer mechanisms and dynamics during a phytoplankton succession. Additions of isotopically light CO2 from the CO2 manipulation, established an isotopic gradient in the DIC pool which, following the nutrient-induced phytoplankton bloom, mirrored the isotopic signature of the organic carbon pools in both the water column and sediment traps. No significant CO2 effects were observed in the either particulate or dissolved organic carbon stocks. High CO2 conditions decreased the export of material to the deeper layer during the post bloom phase, however the response was not gradual but was only found for the highest CO2 treatment (~1,000 ppm) mesocosm. A CO2 effect on phytoplankton fractionation was observed and similarly, the response was predominantly noticed in the highest CO2 treatment mesocosm. High CO2 concentrations affected fractionation values either directly as a consequence of the higher CO2 availability or indirectly as a consequence of the phytoplankton community composition change observed in the highest CO2 treatment mesocosm.
In general, results from this mesocosm experiment showed that stable isotope analysis of each of the individual carbon system pools within the marine environment is aiding the assessment of carbon dynamics in an oceanic system. However, when stable carbon isotopes are applied to estimate future oceanic interactions that are relevant for our climate, careful evaluation of the underlying processes is needed. Stable isotopic analysis confirmed that the material accumulating in the sediment trap was similar to that in the water column, an observation that is widely assumed when estimations of past natural changes in oceanic and atmospheric CO2 are performed. However, in this study we found that other factors (allochthonous carbon, phytoplankton fractionation, and community composition) rather than CO2 alone can influence the isotopic signature of the water column and the sediment material, therefore it is important to identify and understand the processes driving these changes in order to hindcast past and forecasts future oceanic CO2-driven effects.
Author Contributions
UR conceived, initiated, and organized the mesocosm study. JT and LB were involved in conceiving and performing the mesocosm experiment. ME performed the carbon isotope experiment, analyzed the data, and wrote the paper with comments and inputs from all co-authors.
Funding
The mesocosm project was funded by the German Federal Ministry of Education and Research (BMBF) in the framework of the coordinated project BIOACID—Biological Impacts of Ocean Acidification, phase 2 (FKZ 03F06550). UR received additional funding from the Leibniz Award 2012 by the German Research Foundation (DFG). Financial support for the stable carbon isotope study was provided by the Natural Environment Research Council as part of the UK Ocean Acidification Programme (NE/H017348/1).
Conflict of Interest
The authors declare that the research was conducted in the absence of any commercial or financial relationships that could be construed as a potential conflict of interest.
Acknowledgments
We would like to thank the KOSMOS team and all of the participants for their contribution during the Gran Canaria mesocosm campaign. In particular we would like to thank UR for giving us the opportunity to join the mesocosm projects and A. Ludwig for the magnificent coordination of the campaign logistics. We thank M. Martinez Cabanas for the help with data processing. We also thank the team of the Plataforma Oceanica de Canarias (PLOCAN) for their hospitality, research facilities and technical support. The authors would like to thank the reviewers of this work who provided insightful and constructive comments that improved the paper.
References
Algueró-Muñiz, M., Horn, H. G., Alvarez-Fernandez, S., Spisla, C., Aberle, N., Bach, L. T., et al. (2019). Analyzing the impacts of elevated-CO2 levels on the development of a subtropical zooplankton community during oligotrophic conditions and simulated upwelling. Front. Mar. Sci. 6, 1–18. doi: 10.3389/fmars.2019.00061
Bach, L. T., Taucher, J., Boxhammer, T., Ludwig, A., Aberle-Malzahn, N., Achterberg, E. P., et al. (2016). Influence of ocean acidification on a natural winter-to-summer plankton succession: first insights from a long-term mesocosm study draw attention to periods of low nutrient concentrations. PLoS ONE 11:e0159068. doi: 10.1371/journal.pone.0159068
Boxhammer, T., Bach, L. T., Czerny, J., and Riebesell, U. (2016). Technical note: sampling and processing of mesocosm sediment trap material for quantitative biogeochemical analysis. Biogeosciences 13, 2849–2858. doi: 10.5194/bg-13-2849-2016
Buesseler, K. O., Antia, A. N., Chen, M., Fowler, S. W., Gardner, W. D., Gustafsson, O., et al. (2007). An assessment of the use of sediment traps for estimating upper ocean particle fluxes. J. Mar. Res. 65, 345–416. doi: 10.1357/002224007781567621
Burkhardt, S., Riebesell, U., and Zondervan, I. (1999). Stable carbon isotope fractionation by marine phytoplankton in response to daylength, growth rate, and CO2 availability. Mar. Ecol. Prog. Ser. 184, 31–41. doi: 10.3354/meps184031
Cole, J., Findlay, S., and Pace, M. (1988). Bacterial production in fresh and saltwater ecosystems: a cross-system overview. Mar. Ecol. Prog. Ser. 43, 1–10. doi: 10.3354/meps043001
Couldrey, M. P., Oliver, K. I. C., Yool, A., Halloran, P. R., and Achterberg, E. P. (2016). On which timescales do gas transfer velocities control North Atlantic CO2 flux variability? Glob. Biogeochem. Cycles 30, 787–802. doi: 10.1002/2015GB005267
De Kluijver, A., Soetaert, K., Czerny, J., Schulz, K. G., Boxhammer, T., Riebesell, U., et al. (2013). A 13C labelling study on carbon fluxes in Arctic plankton communities under elevated CO2 levels. Biogeosciences 10, 1425–1440. doi: 10.5194/bg-10-1425-2013
De Kluijver, A., Soetaert, K., Schulz, K. G., Riebesell, U., Bellerby, R. G. J. J., and Middelburg, J. J. (2010). Phytoplankton-bacteria coupling under elevated CO2 levels: a stable isotope labelling study. Biogeosciences 7, 3783–3797. doi: 10.5194/bg-7-3783-2010
Dickson, A. G., Sabine, C. L., and Christian, J. R. (eds.). (2007). Guide to Best Practice for Ocean CO2 Measurements. PICES Special Publication, Vol. 3. Sidney, BC: North Pacific Marine Science Organization. Retrieved from: https://www.nodc.noaa.gov/ocads/oceans/Handbook_2007.html
Farmer, C., Hansell, D. A., Dickson, A. G., Savine, C. L., and Christian, J. R. (2007). “Determination of dissolved organic carbon and total dissolved nitrogen in sea water,” in Guide to Best Practices for Ocean CO2 Measurements, Vol. 3 PICES Special Publication, eds A. G. Dickson, C. L. Sabine, and J. R. Christian, 191. Retrieved from: http://cdiac.ornl.gov/ftp/oceans/Handbook_2007/sop07.pdf
Farquhar, G., O'Leary, M., and Berry, J. (1982). On the relationship between carbon isotope discrimination and the intercellular carbon dioxide concentration in leaves. Funct. Plant Biol. 9:121. doi: 10.1071/PP9820121
Field, C. B., Behrenfeld, M. J., Randerson, J. T., and Falkowski, P. (1998). Primary production of the biosphere: integrating terrestrial and oceanic components. Science 281, 237–240. doi: 10.1126/science.281.5374.237
González-Dávila, M., Santana-Casiano, J. M., Rueda, M.-J., Llinás, O., and González-Dávila, E.-F. (2003). Seasonal and interannual variability of sea-surface carbon dioxide species at the European Station for Time Series in the Ocean at the Canary Islands (ESTOC) between 1996 and 2000. Global Biogeochem. Cycles 17, 2–1. doi: 10.1029/2002GB001993
Gruber, N., Keeling, D., Bacastow, R. B., Guenther, P. R., Lueker, T. J., Wahlen, M., et al. (1999). Spatiotemporal patterns of carbon-13 in the global surface oceans and the oceanic Suess effect. Global Biogeochem. Cycles 13, 307–335. doi: 10.1029/1999GB900019
Hansen, H. P., and Koroleff, F. (2007). “Determination of nutrients,” in Methods of Seawater Analysis (Weinheim: Wiley-VCH Verlag GmbH), 159–228. doi: 10.1002/9783527613984.ch10
Hayes, J. M. (1993). Factors controlling 13C contents of sedimentary organic compounds: principles and evidence. Mar. Geol. 113, 111–125. doi: 10.1016/0025-3227(93)90153-M
Hernández-Hernández, N., Bach, L. T., Montero, M. F., Taucher, J., Baños, I., Guan, W., et al. (2018). High CO2 under nutrient fertilization increases primary production and biomass in subtropical phytoplankton communities: a mesocosm approach. Front. Mar. Sci. 5:213. doi: 10.3389/fmars.2018.00213
Hinga, K. R., Arthur, M. A., Pilson, M. E. Q., and Whitaker, D. (1994). Carbon isotope fractionation by marine phytoplankton in culture: the effects of CO 2 concentration, pH, temperature, and species. Glob. Biogeochem. Cycles 8, 91–102. doi: 10.1029/93GB03393
Holmes, R. M., Aminot, A., Kérouel, R., Hooker, B. A., and Peterson, B. J. (1999). A simple and precise method for measuring ammonium in marine and freshwater ecosystems. Can. J. Fish. Aquatic Sci. 56, 1801–1808. doi: 10.1139/f99-128
IPCC (2014). “Climate change 2014: impacts, adaption, and vulnerability. Part A: global and sectoral aspects,” in Contribution of Working Group II to the Fifth Assement Report of the Intergovernmental Panel on Climate Change (Cambridge; New York, NY: Cambridge University Press).
Jähne, B., Huber, W., Dutzi, A., Wais, T., and Ilmberger, J. (1984). “Wind/wave-tunnel experiment on the schmidt number-and wave field dependence of air/water gas exchange,” in Gas Transfer at Water Surfaces, eds W. Brutsaert and G. Jirka (Dordrecht: Springer), 303–309. doi: 10.1007/978-94-017-1660-4_28
Jeffrey, A. W. A., Pflaum, R. C., Brooks, J. M., and Sackett, W. M. (1983). Vertical trends in particulate organic carbon 13C: 12C ratios in the upper water column. Deep Sea Res. Part A Oceanogr. Res. Pap. 30, 971–983. doi: 10.1016/0198-0149(83)90052-3
Keeling, C. D. (1979). The suess effect: 13Carbon-14Carbon interrelations. Environ. Int. 2, 229–300. doi: 10.1016/0160-4120(79)90005-9
Kukert, H., and Riebesell, U. (1998). Phytoplankton carbon isotope fractionation during a diatom spring bloom in a Norwegian fjord. Mar. Ecol. Prog. Ser. 173, 127–138. doi: 10.3354/meps173127
Laws, E. A., Bidigare, R. R., and Popp, B. N. (1997). Effect of growth rate and CO2 concentration on carbon isotopic fractionation by the marine diatom Phaeodactylum tricornutum. Limnol. Oceanogr. 42, 1552–1560. doi: 10.4319/lo.1997.42.7.1552
Le Quéré, C., Andrew, R. M., Canadell, J. G., Sitch, S., Ivar Korsbakken, J., Peters, G. P., et al. (2016). Global carbon budget 2016. Earth Syst. Sci. Data 8, 605–649. doi: 10.5194/essd-8-605-2016
Lynch-Stieglitz, J., Stocker, T. F., Broecker, W. S., and Fairbanks, R. G. (1995). The influence of air- sea exchange on the isotopic composition of oceanic carbon: observations and modeling. Global Biogeochem. Cycles 9, 653–665. doi: 10.1029/95GB02574
Marty, J., and Planas, D. (2008). Comparison of methods to determine algal δ 13 C in freshwater. Limnol. Oceanogr. Methods 6, 51–63. doi: 10.4319/lom.2008.6.51
Murphy, J., and Riley, J. P. (1962). A modified single solution method for the determination of phosphate in natural waters. Anal. Chim. Acta 27, 31–36. doi: 10.1016/S0003-2670(00)88444-5
Nightingale, P. D., Malin, G., Law, C. S., Watson, A. J., Liss, P. S., Liddicoat, M. I., et al. (2000). In situ evaluation of air-sea gas exchange parameterizations using novel conservative and volatile tracers. Glob. Biogeochem. Cycles 14, 373–387. doi: 10.1029/1999GB900091
Norrman, B., Zwelfel, U. L., Hopkinson, C. S., and Fry, B. (1995). Production and utilization of dissolved organic carbon during an experimental diatom bloom. Limnol. Oceanogr, 40, 898–907. doi: 10.4319/lo.1995.40.5.0898
O'Leary, M. H. (1981). Carbon isotope fractionation in plants. Phytochemistry 20, 553–567. doi: 10.1016/0031-9422(81)85134-5
Pagani, M., Freeman, K. H., Ohkouchi, N., and Caldeira, K. (2002). Comparison of water column [CO2aq] with sedimentary alkenone-based estimates: a test of the alkenone-CO 2 proxy. Paleoceanography 17, 21-1–21–12. doi: 10.1029/2002PA000756
Rau, G., Riebesell, U., and Wolf-Gladrow, D. (1996). A model of photosynthetic 13C fractionation by marine phytoplankton based on diffusive molecular CO2 uptake. Mar. Ecol. Progress Ser. 133, 275–285. doi: 10.3354/meps133275
Riebesell, U., Czerny, J., von Bröckel, K., Boxhammer, T., Büdenbender, J., Deckelnick, M., et al. (2013). Technical Note: a mobile sea-going mesocosm system - new opportunities for ocean change research. Biogeosciences 10, 1835–1847. doi: 10.5194/bg-10-1835-2013
Riebesell, U., Czerny, J., Von Bröckel, K., Boxhammer, T., Büdenbender, J., Deckelnick, M., et al. (2013). Technical note: a mobile sea-going mesocosm system - new opportunities for ocean change research. Biogeosciences. doi: 10.5194/bg-10-1835-2013
Riebesell, U., Schulz, K. G., Bellerby, R. G., Botros, M., Fritsche, P., Meyerhöfer, M., et al. (2007). Enhanced biological carbon consumption in a high CO2 ocean. Nature 450, 545–548. doi: 10.1038/nature06267
Santana-Casiano, J. M., González-Dávila, M., Laglera Baquer, L. M., and Rodríguez Somoza, M. J. (2001). Carbon dioxide system in the Canary region during October 1995. Sci. Mar. 65, 41–50. doi: 10.3989/scimar.2001.65s141
Schmittner, A., Gruber, N., Mix, A. C., Key, R. M., Tagliabue, A., and Westberry, T. K. (2013). Biology and air-sea gas exchange controls on the distribution of carbon isotope ratios (δ13C) in the ocean. Biogeosciences 10, 5793–5816. doi: 10.5194/bg-10-5793-2013
Schulz, K. G., Riebesell, U., Bellerby, R. G. J., Biswas, H., Meyerhöfer, M., Uller, M. N., et al. (2008). Build-up and decline of organic matter during PeECE III. Biogeosciences 5, 707–718. doi: 10.5194/bg-5-707-2008
Stange, P., Taucher, J., Bach, L. T., Algueró-Muñiz, M., Horn, H. G., Krebs, L., et al. (2018). Ocean acidification-induced restructuring of the plankton food web can influence the degradation of sinking particles. Front. Mar. Sci. 5:140. doi: 10.3389/fmars.2018.00140
Taucher, J., Bach, L. T., Boxhammer, T., Nauendorf, A., Achterberg, E. P., Algueró-Muñiz, M., et al. (2017). Influence of ocean acidification and deep water upwelling on oligotrophic plankton communities in the subtropical north atlantic: insights from an in situ mesocosm study. Front. Mar. Sci. 4:85. doi: 10.3389/fmars.2017.00085
Volk, T., and Hoffert, M. I. (1985). Ocean carbon pumps: analysis of relative strengths and efficiencies in ocean-driven atmospheric CO2 changes. 99–110.
Vuorio, K., Meili, M., and Sarvala, J. (2006). Taxon-specific variation in the stable isotopic signatures (delta13C and delta15N) of lake phytoplankton. Freshw. Biol. 51, 807–822. doi: 10.1111/j.1365-2427.2006.01529.x
Wanninkhof, R., Asher, W. E., Ho, D. T., Sweeney, C., and McGillis, W. R. (2009). Advances in quantifying air-sea gas exchange and environmental forcing. Ann. Rev. Mar. Sci. 1, 213–244. doi: 10.1146/annurev.marine.010908.163742
Zark, M., Broda, N. K., Hornick, T., Grossart, H.-P., Riebesell, U., and Dittmar, T. (2017). Ocean acidification experiments in large-scale mesocosms reveal similar dynamics of dissolved organic matter production and biotransformation. Front. Mar. Sci. 4, 1–11. doi: 10.3389/fmars.2017.00271
Keywords: ocean acidification, mesocosm experiment, stable carbon isotopes, marine biogeochemistry, carbon cycle
Citation: Esposito M, Achterberg EP, Bach LT, Connelly DP, Riebesell U and Taucher J (2019) Application of Stable Carbon Isotopes in a Subtropical North Atlantic MesocosmStudy: A New Approach to Assess CO2 Effects on the Marine Carbon Cycle. Front. Mar. Sci. 6:616. doi: 10.3389/fmars.2019.00616
Received: 16 October 2018; Accepted: 18 September 2019;
Published: 02 October 2019.
Edited by:
Il-Nam Kim, Incheon National University, South KoreaReviewed by:
Sun-Yong Ha, Korea Polar Research Institute, South KoreaFrank Dehairs, Vrije University Brussel, Belgium
Copyright © 2019 Esposito, Achterberg, Bach, Connelly, Riebesell and Taucher. This is an open-access article distributed under the terms of the Creative Commons Attribution License (CC BY). The use, distribution or reproduction in other forums is permitted, provided the original author(s) and the copyright owner(s) are credited and that the original publication in this journal is cited, in accordance with accepted academic practice. No use, distribution or reproduction is permitted which does not comply with these terms.
*Correspondence: Mario Esposito, bWVzcG9zaXRvQGdlb21hci5kZQ==