 Evert de Froe1*
 Lorenzo Rovelli2†
 Ronnie N. Glud2,3
 Sandra R. Maier4
 Gerard Duineveld1
 Furu Mienis1Marc Lavaleye1
 Dick van Oevelen4
- 1Department of Ocean Systems, NIOZ Royal Netherlands Institute for Sea Research and Utrecht University, Den Burg, Netherlands
- 2Nordcee, Department of Biology University of Southern Denmark, Odense, Denmark
- 3Department of Ocean and Environmental Sciences, Tokyo University of Marine Science and Technology, Tokyo, Japan
- 4Department of Estuarine and Delta Systems, NIOZ Royal Netherlands Institute for Sea Research and Utrecht University, Yerseke, Netherlands
Cold-water coral (CWC) reefs are distributed globally and form complex three-dimensional structures on the deep seafloor, providing habitat for numerous species. Here, we measured the community O2 and dissolved inorganic nitrogen (DIN) flux of CWC reef habitats with different coral cover and bare sediment (acting as reference site) in the Logachev mound area (NE Atlantic). Two methodologies were applied: the non-invasive in situ aquatic eddy co-variance (AEC) technique, and ex situ whole box core (BC) incubations. The AEC system was deployed twice per coral mound (69 h in total), providing an integral estimate of the O2 flux from a total reef area of up to 500 m2, with mean O2 consumption rates ranging from 11.6 ± 3.9 to 45.3 ± 11.7 mmol O2 m–2 d–1 (mean ± SE). CWC reef community O2 fluxes obtained from the BC incubations ranged from 5.7 ± 0.3 to 28.4 ± 2.4 mmol O2 m–2 d–1 (mean ± SD) while the O2 flux measured by BC incubations on the bare sediment reference site reported 1.9 ± 1.3 mmol O2 m–2 d–1 (mean ± SD). Overall, O2 fluxes measured with AEC and BC showed reasonable agreement, except for one station with high habitat heterogeneity. Our results suggest O2 fluxes of CWC reef communities in the North East Atlantic are around five times higher than of sediments from comparable depths and living CWCs are driving the increased metabolism. DIN flux measurements by the BC incubations also revealed around two times higher DIN fluxes at the CWC reef (1.17 ± 0.87 mmol DIN m–2 d–1), compared to the bare sediment reference site (0.49 ± 0.32 mmol DIN m–2 d–1), due to intensified benthic release of NH4+. Our data indicate that the amount of living corals and dead coral framework largely contributes to the observed variability in O2 fluxes on CWC reefs. A conservative estimate, based on the measured O2 and DIN fluxes, indicates that CWC reefs process 20 to 35% of the total benthic respiration on the southeasterly Rockall Bank area, which demonstrates that CWC reefs are important to carbon and nitrogen mineralization at the habitat scale.
Introduction
Benthic solute exchange and carbon mineralization have been studied extensively in the past decades (e.g., Glud, 2008). However, the importance of reef structures, including cold-water corals (CWCs), for benthic carbon and nitrogen cycling is still poorly resolved. CWC reefs are topographically complex structures supporting high biomass and species richness of macro- and megafauna (Jonsson et al., 2004; Roberts et al., 2006). These CWC reefs can trap and mineralize large amounts of particulate organic matter (POM) and are presumed to act as carbon cycling hotspots (van Oevelen et al., 2009; Cathalot et al., 2015). However, quantification of mineralization rates remain few due to the complications of sampling and incubation intact CWC communities.
Most studies on the metabolism and nitrogen cycling of CWCs investigate individuals or nubbins of corals that are incubated ex situ in experimental chambers (Purser et al., 2010; Maier et al., 2011; Orejas et al., 2011). These approaches have concluded that CWCs act as a deep-sea source of dissolved inorganic nitrogen (DIN) as NH4+ and, presumably due to an active nitrifying community associated with the CWC microbiome, NO3– (Khripounoff et al., 2014; Middelburg et al., 2015). These observations hint at the presence of a dynamic nitrogen cycle on CWC reefs, especially given the identification of archaea in the microbial assemblage of CWCs (Van Bleijswijk et al., 2015). Assessments of community-based nitrogen fluxes in these habitats, however, have yet to be performed.
Upscaling results from laboratory incubations to the scale of CWC reefs is problematic given (i) the natural complexity and the spatial heterogeneity in faunal density and biomass distribution, and (ii) potential recovery/sampling effects on community performance. Only three quantitative studies on O2 fluxes at CWC reefs have been conducted, and these were focused on relatively shallow CWC communities at ∼100–200 m depth (White et al., 2012; Cathalot et al., 2015; Rovelli et al., 2015). These studies have suggested that the organic carbon turnover at CWC reefs is enhanced compared to soft-sediment habitats at equivalent depths, but also show extensive variations in reef activity. The drivers of such variability are still poorly constrained, and it is currently unknown to what extent the resolved range can be extrapolated to other and deeper CWC reef communities.
Here, we combine two methodologies to quantify the O2 and DIN flux of CWC reef communities, located in the North East Atlantic between 500 – 900 m depth. We used the non-invasive Aquatic Eddy Covariance (AEC) technique to quantify the in situ O2 flux at CWC reef communities and ex situ whole-box core incubations to measure the O2 and DIN flux of CWC reef communities and at a bare sediment reference site. Our primary aims are to (i) provide robust measurements of the O2 flux of a CWC reef community, (ii) compare the invasive versus the non-invasive methodology (iii) provide a first estimate of DIN solute exchange of a CWC reef community and iv) quantify the importance of sediment, dead coral framework and living CWC in driving the whole CWC reef community O2 and DIN flux.
Materials and Methods
Study Site and Sampling
The Logachev mound province is located on the SE slope of Rockall Bank, approximately 500 km NW of Ireland (N 55.55, W 15.80, Figure 1A). In this area, coral mounds are present in a 90 km × 60 km area between 500 and 1000 m water depth (Kenyon et al., 2003; Mienis et al., 2006). The CWC communities on the mound consist of framework-building Lophelia pertusa and Madrepora oculata with associated macrofaunal such as polychaetes (e.g., Eunice norvegica), sponges (e.g., Hexadella dedritifera), and crinoids (Van Weering et al., 2003; Van Soest and Lavaleye, 2005). Ambient bottom water temperatures on the coral mounds vary between 7–9°C. The area is characterized by high bottom current velocities, internal tidal waves and hydraulic jumps (Mohn et al., 2014; Van Haren et al., 2014; Cyr et al., 2016).
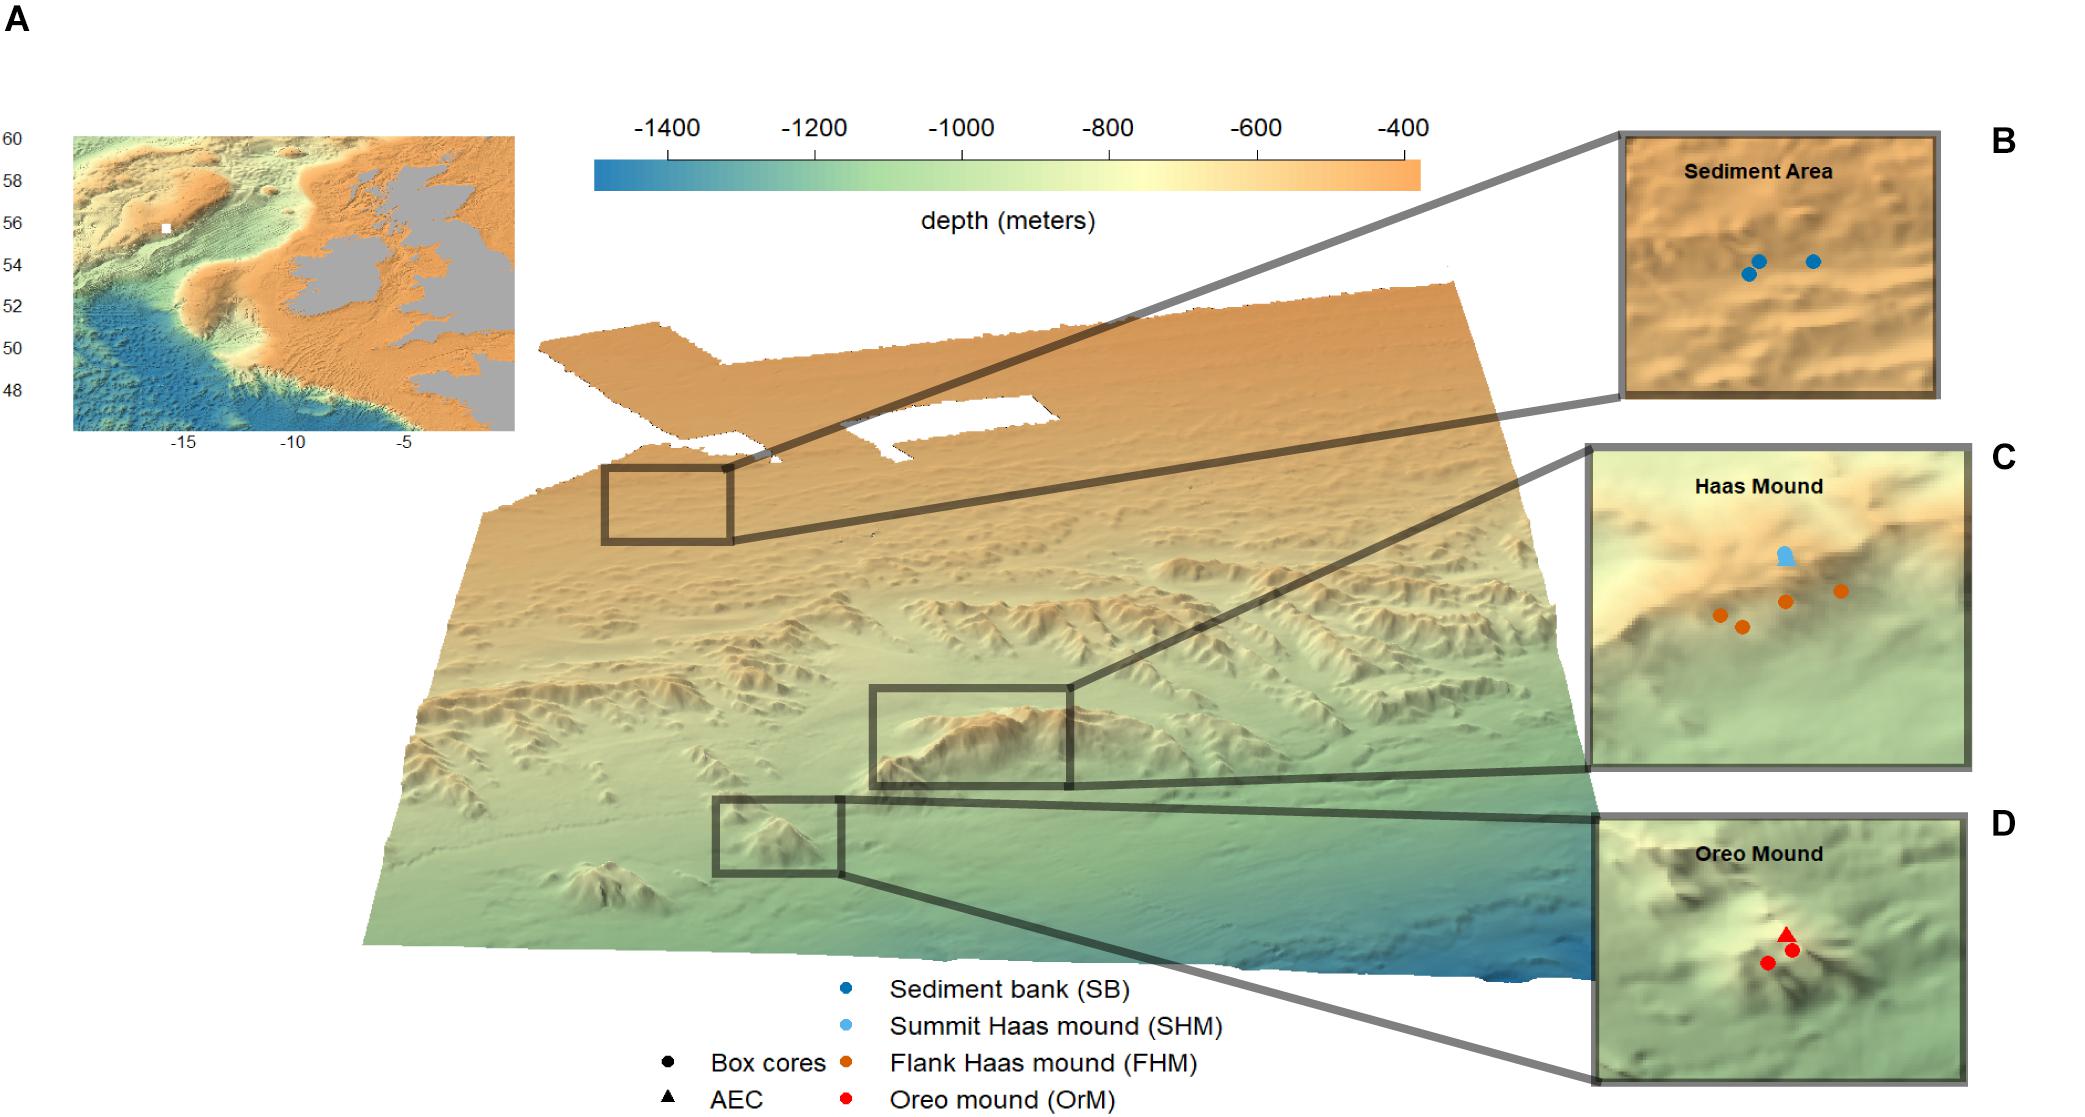
Figure 1. Multibeam map of the Logachev mound province with as insets: (A) Location of Logachev mound province at the SE Rockall Bank, NE Atlantic (GEBCO, 2013), (B) sampling locations at the bare sediment reference site, (C) sampling locations at Haas mound, (D) sampling locations at Oreo mound. Plot produced with R package plot3D (Soetaert, 2017).
This study targeted three sites: the Haas mound, which is 360 m high and the largest carbonate mound in the region; the Oreo mound, a smaller carbonate mound SW of the Haas mound with the summit at 750 m water depth; and an off-mound bare sediment reference site at 500-m water depth further upslope Rockall Bank (Figures 1B–D; Mienis et al., 2006). Previous work on the Logachev mound province showed a large habitat heterogeneity on the CWC reefs; with patchy distribution of live coral, bare sediments and coral rubble on the summit of the Haas mound, and a dense thriving CWC reef on the southern flank of the Haas- and Oreo mound (Duineveld et al., 2007; de Haas et al., 2009; Van Bleijswijk et al., 2015).
During the R/V Pelagia research cruise 64PE4201 (30/04/2017 to 07/05/2017), twelve box cores were collected along with two parallel deployments of the NIOZ ALBEX lander (Duineveld et al., 2004), equipped with the AEC system. To cover the above-mentioned habitat heterogeneity of the CWC reef communities in the region, AEC deployment and box core sampling was performed at the following sites (Table 1): (i) two box cores and one AEC deployment at the summit of the Haas mound, (ii) four box cores and no AEC deployment at Southern flank of the Haas mound, (iii) three box cores and one AEC deployment at the summit of the Oreo mound and (iv) three box cores at the bare sediment reference site (Figures 1B–D). Eight of the eleven box cores were used for the incubation experiments, while six were subsampled to characterize the surface sediment. Table 1 provides an overview of the applied methodological approaches at the respective stations.
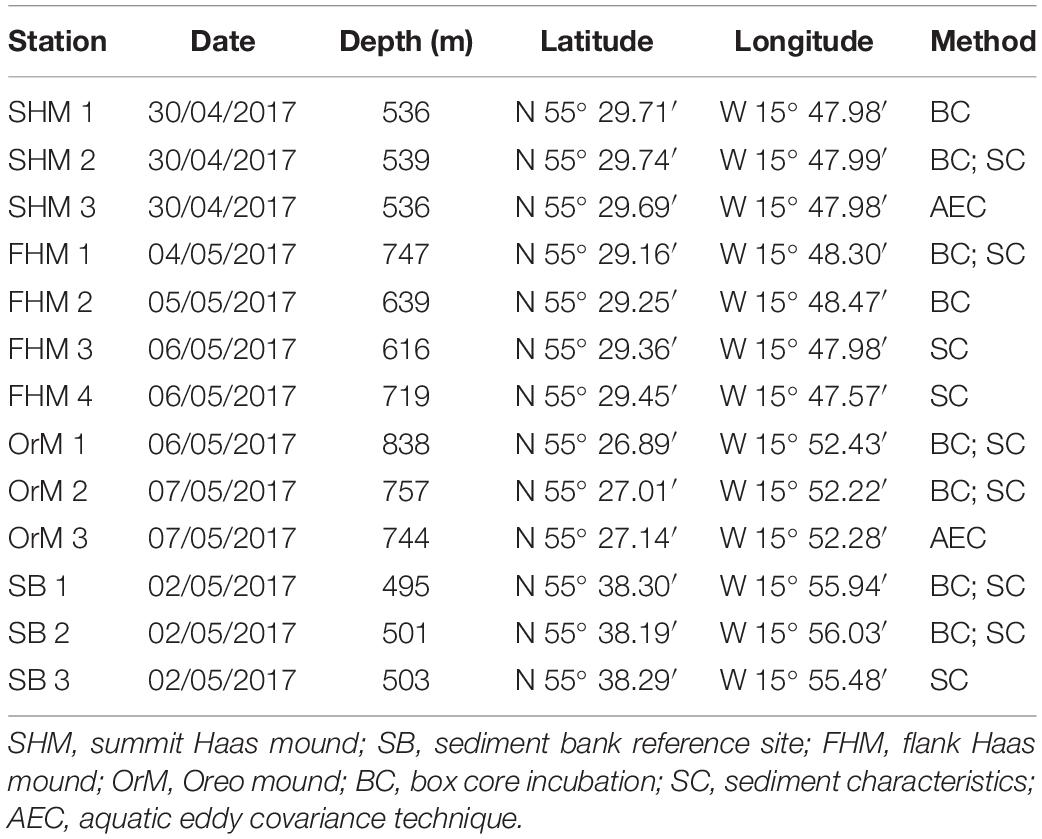
Table 1. Station characteristics; date, depth, latitude, longitude, and applied methods.
Aquatic Eddy Covariance (AEC) Technique
The AEC system consisted of an Acoustic Doppler Velocimeter (ADV Vector, Nortek, Norway), an underwater amplifier (see McGinnis et al., 2011) with two fast Clark-type O2 microelectrodes and a dedicated battery canister allowing up to 5 days of continuous sampling at 64 Hz. The AEC system was mounted on a leg of the NIOZ ALBEX lander using a metal extension (Figure 2). This design ensured that the system was positioned 0.5 m outside the lander frame to minimize any potential flow disturbance by the frame itself. To protect the AEC system, an aluminum caging was mounted around the ADV (Figure 2). The ADV sampling volume was positioned at a measurement height (h) of 80 – 86 cm above the sea bed. This ensured that AEC measurements were performed well above large coral patches which could otherwise damage the sensors and lead to local disturbance of the flow field.
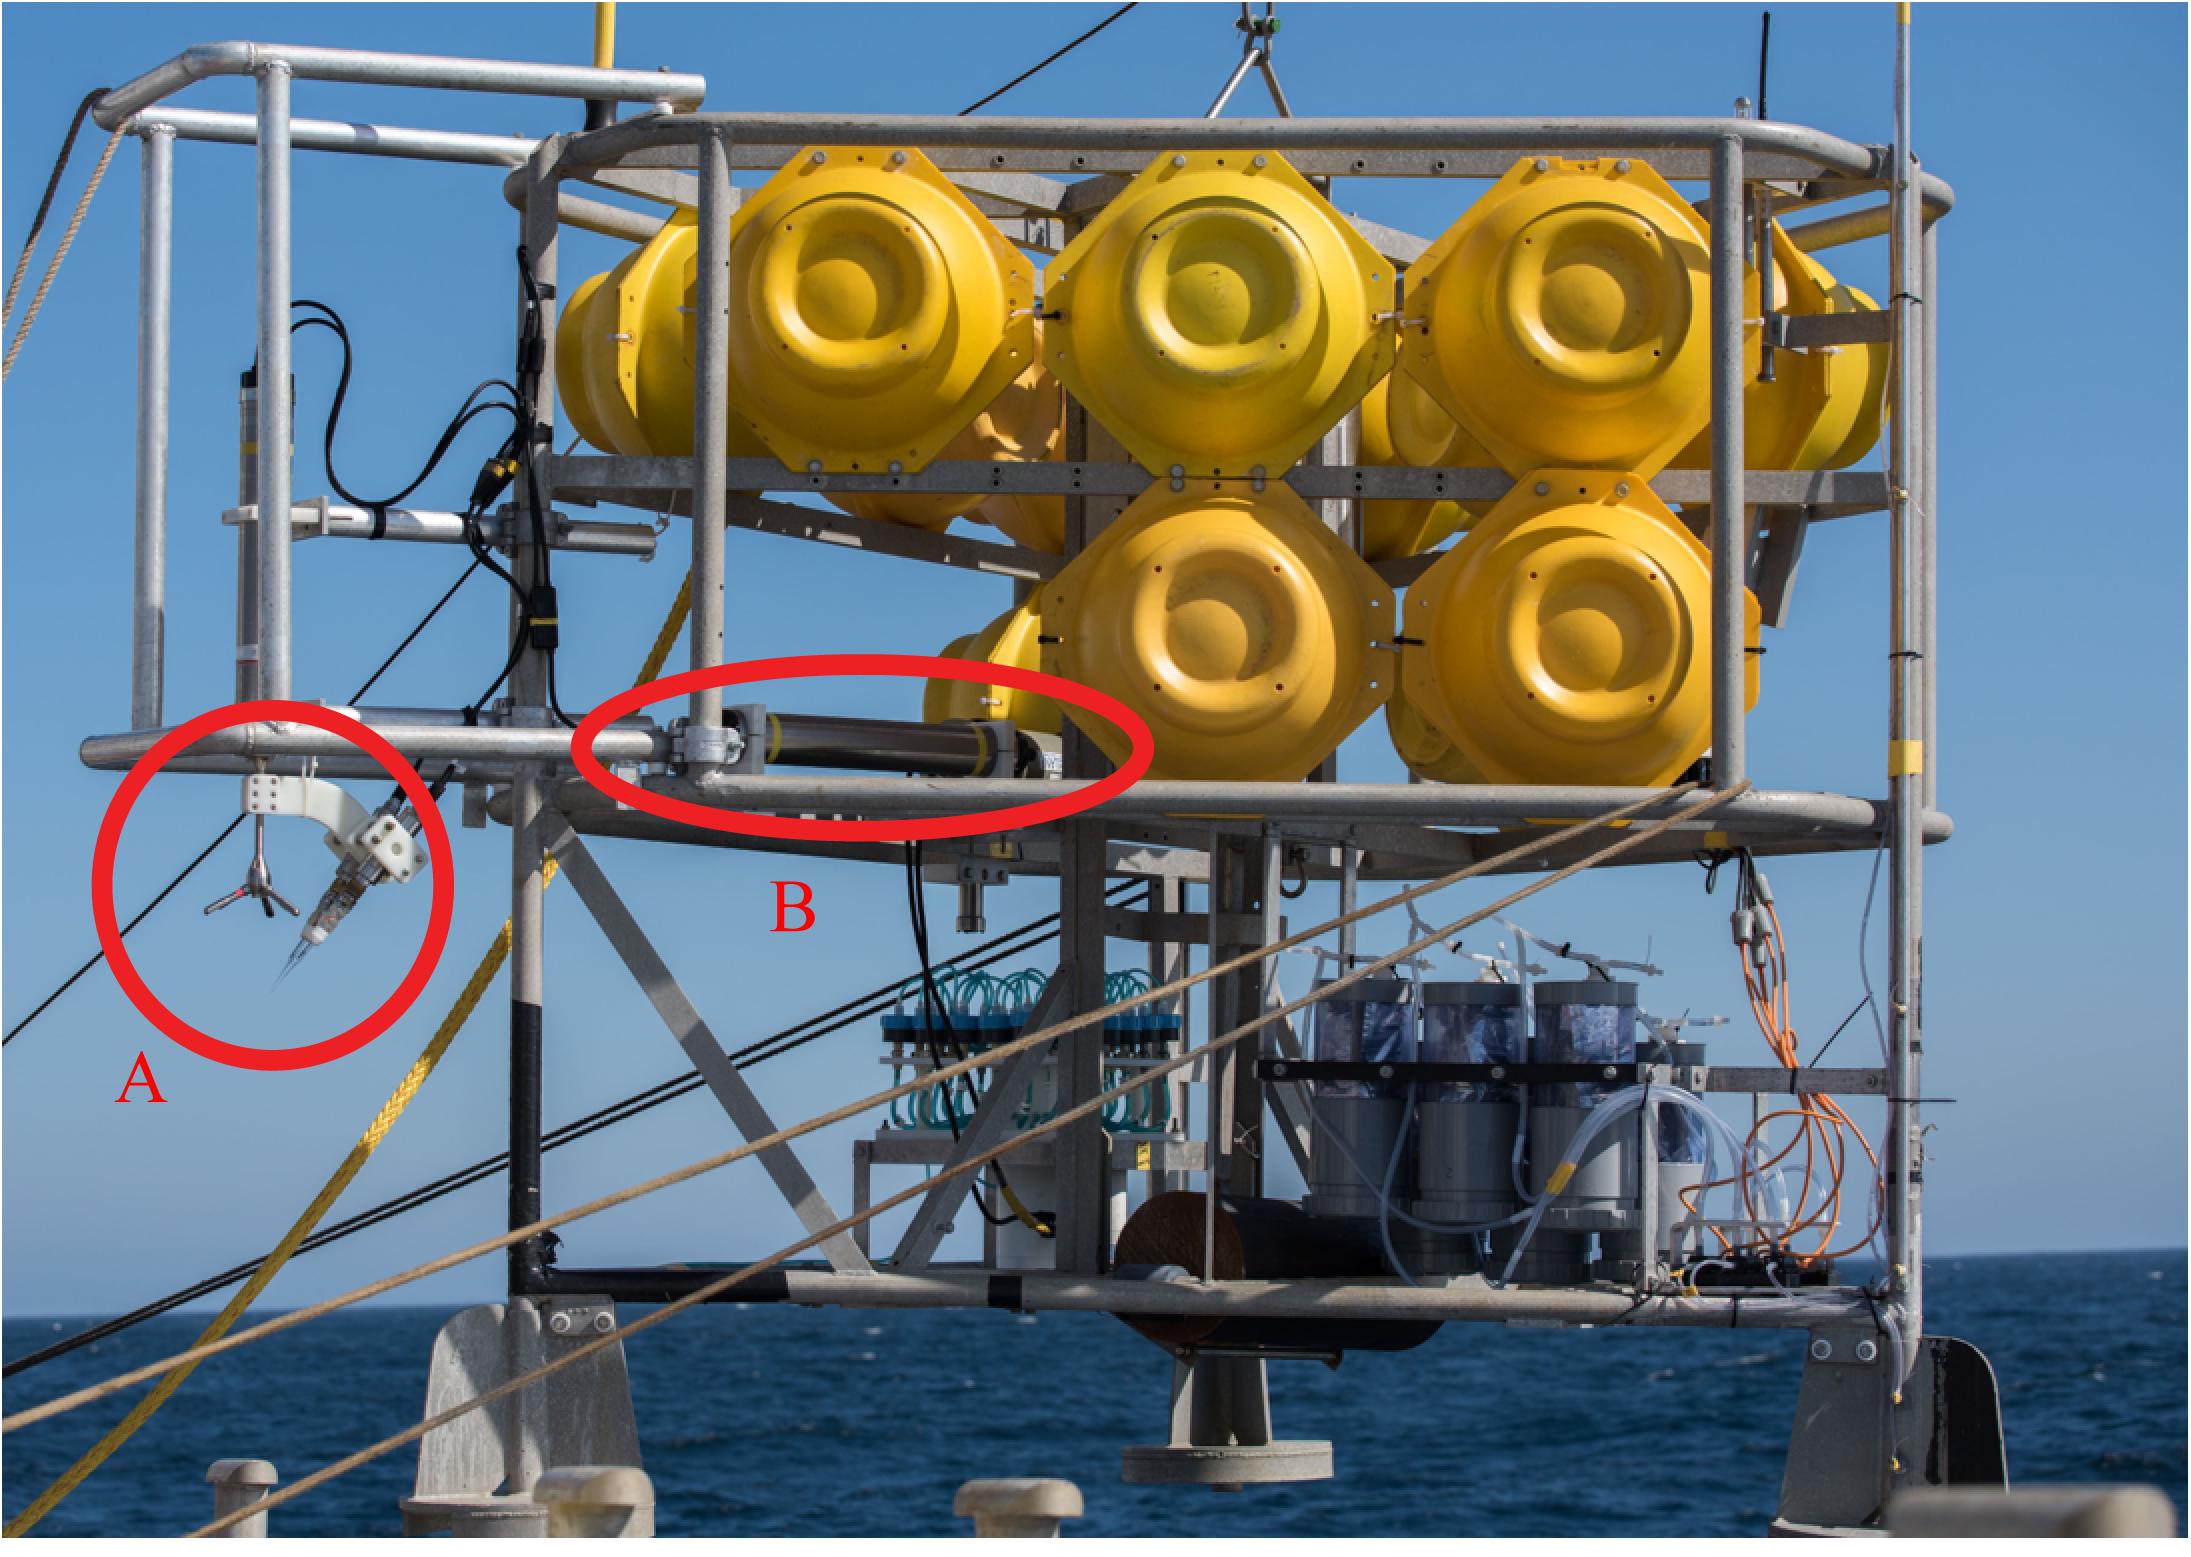
Figure 2. The ALBEX lander (Duineveld et al., 2004) equipped with (A) the AEC instrument; (B) fluorescence sensor.
The O2 and velocity time series were processed following established AEC protocols as outlined in detail in Attard et al. (2014) and Rovelli et al. (2015). Key steps included (i) sensor reading calibration, (ii) data averaging and despiking, (iii) rotation of the flow velocity coordinate system, (iv) computation of the turbulent fluctuations, (v) alignment of the O2 and vertical velocity fluctuations, and (vi) quantification of O2 fluxes. Raw readings from the O2 microelectrodes were in situ calibrated based on concurrent O2 measurements from a factory-calibrated Rinko optical dissolved O2 meter (JFE Advantech Co., Ltd., Japan). Each flow velocity time series was screened to identify periods where the ambient flow measured by the AEC had been disturbed by the lander frame and these were removed from subsequent processing. Turbulent fluctuations of O2 and vertical velocity were obtained over a time interval of 5 min using linear detrending, which was found to be the most suitable for the given bottom roughness. Both fluctuation time series and O2 fluxes were computed using the Fortran program suite Sulfide-Oxygen-Heat Flux Eddy Analysis (SOHFEA) version 2.0 (available from www.dfmcginnis.com/SOHFEA; McGinnis et al., 2014). To relate the O2 flux rates to the respective benthic communities and their heterogeneity, the footprint area of the AEC was estimated for each deployment based on h and the bottom roughness length scale (z0) (Berg et al., 2007). Mean values for z0 were derived assuming Law-of-the-Wall as described in Inoue et al. (2011).
Box Core (BC) Incubations
Box cores (BCs) were taken from the reef framework and bare sediment with a NIOZ- designed box corer (Figure 3A). The BC consisted of a cylindrical barrel of 50 cm diameter and 55 cm height and sampled an area of 0.2 m2. A camera was mounted on the BC and recorded the seafloor just before sampling. After collection, the cores, with reef community and bottom water, were sealed with plexiglass lids, placed in a temperature-controlled water reservoir to maintain in situ temperature, covered in black plastic sheets, and subsequently incubated after an acclimatization period of ∼2 h (Figures 3A,B). In situ temperatures were recorded by repeated CTD casts during the cruise. PreSens© O2 and temperature sensors were installed in the lid, along with a magnetic stirrer (Figure 3C). The mixing efficiency of the stirring device was tested prior to the cruise by adding ∼10 ml of a uranine solution (1 g L–1) to a BC with dead coral framework. Uranine fluorescence was measured with a Cyclops® seven fluorescence sensor (Turner Designs, Inc.) and revealed homogeneous mixing already after ∼3 min (data not shown). The BCs taken at the bare sediment reference site were subsampled with a 12 cm diameter- plexiglass incubation core, and incubated in a temperature-controlled room (8–10°C). The use of smaller subsampled incubation cores for bare sediment reference site was preferred since the porous marine sediment caused problems in closing the base of the large BCs during incubation.
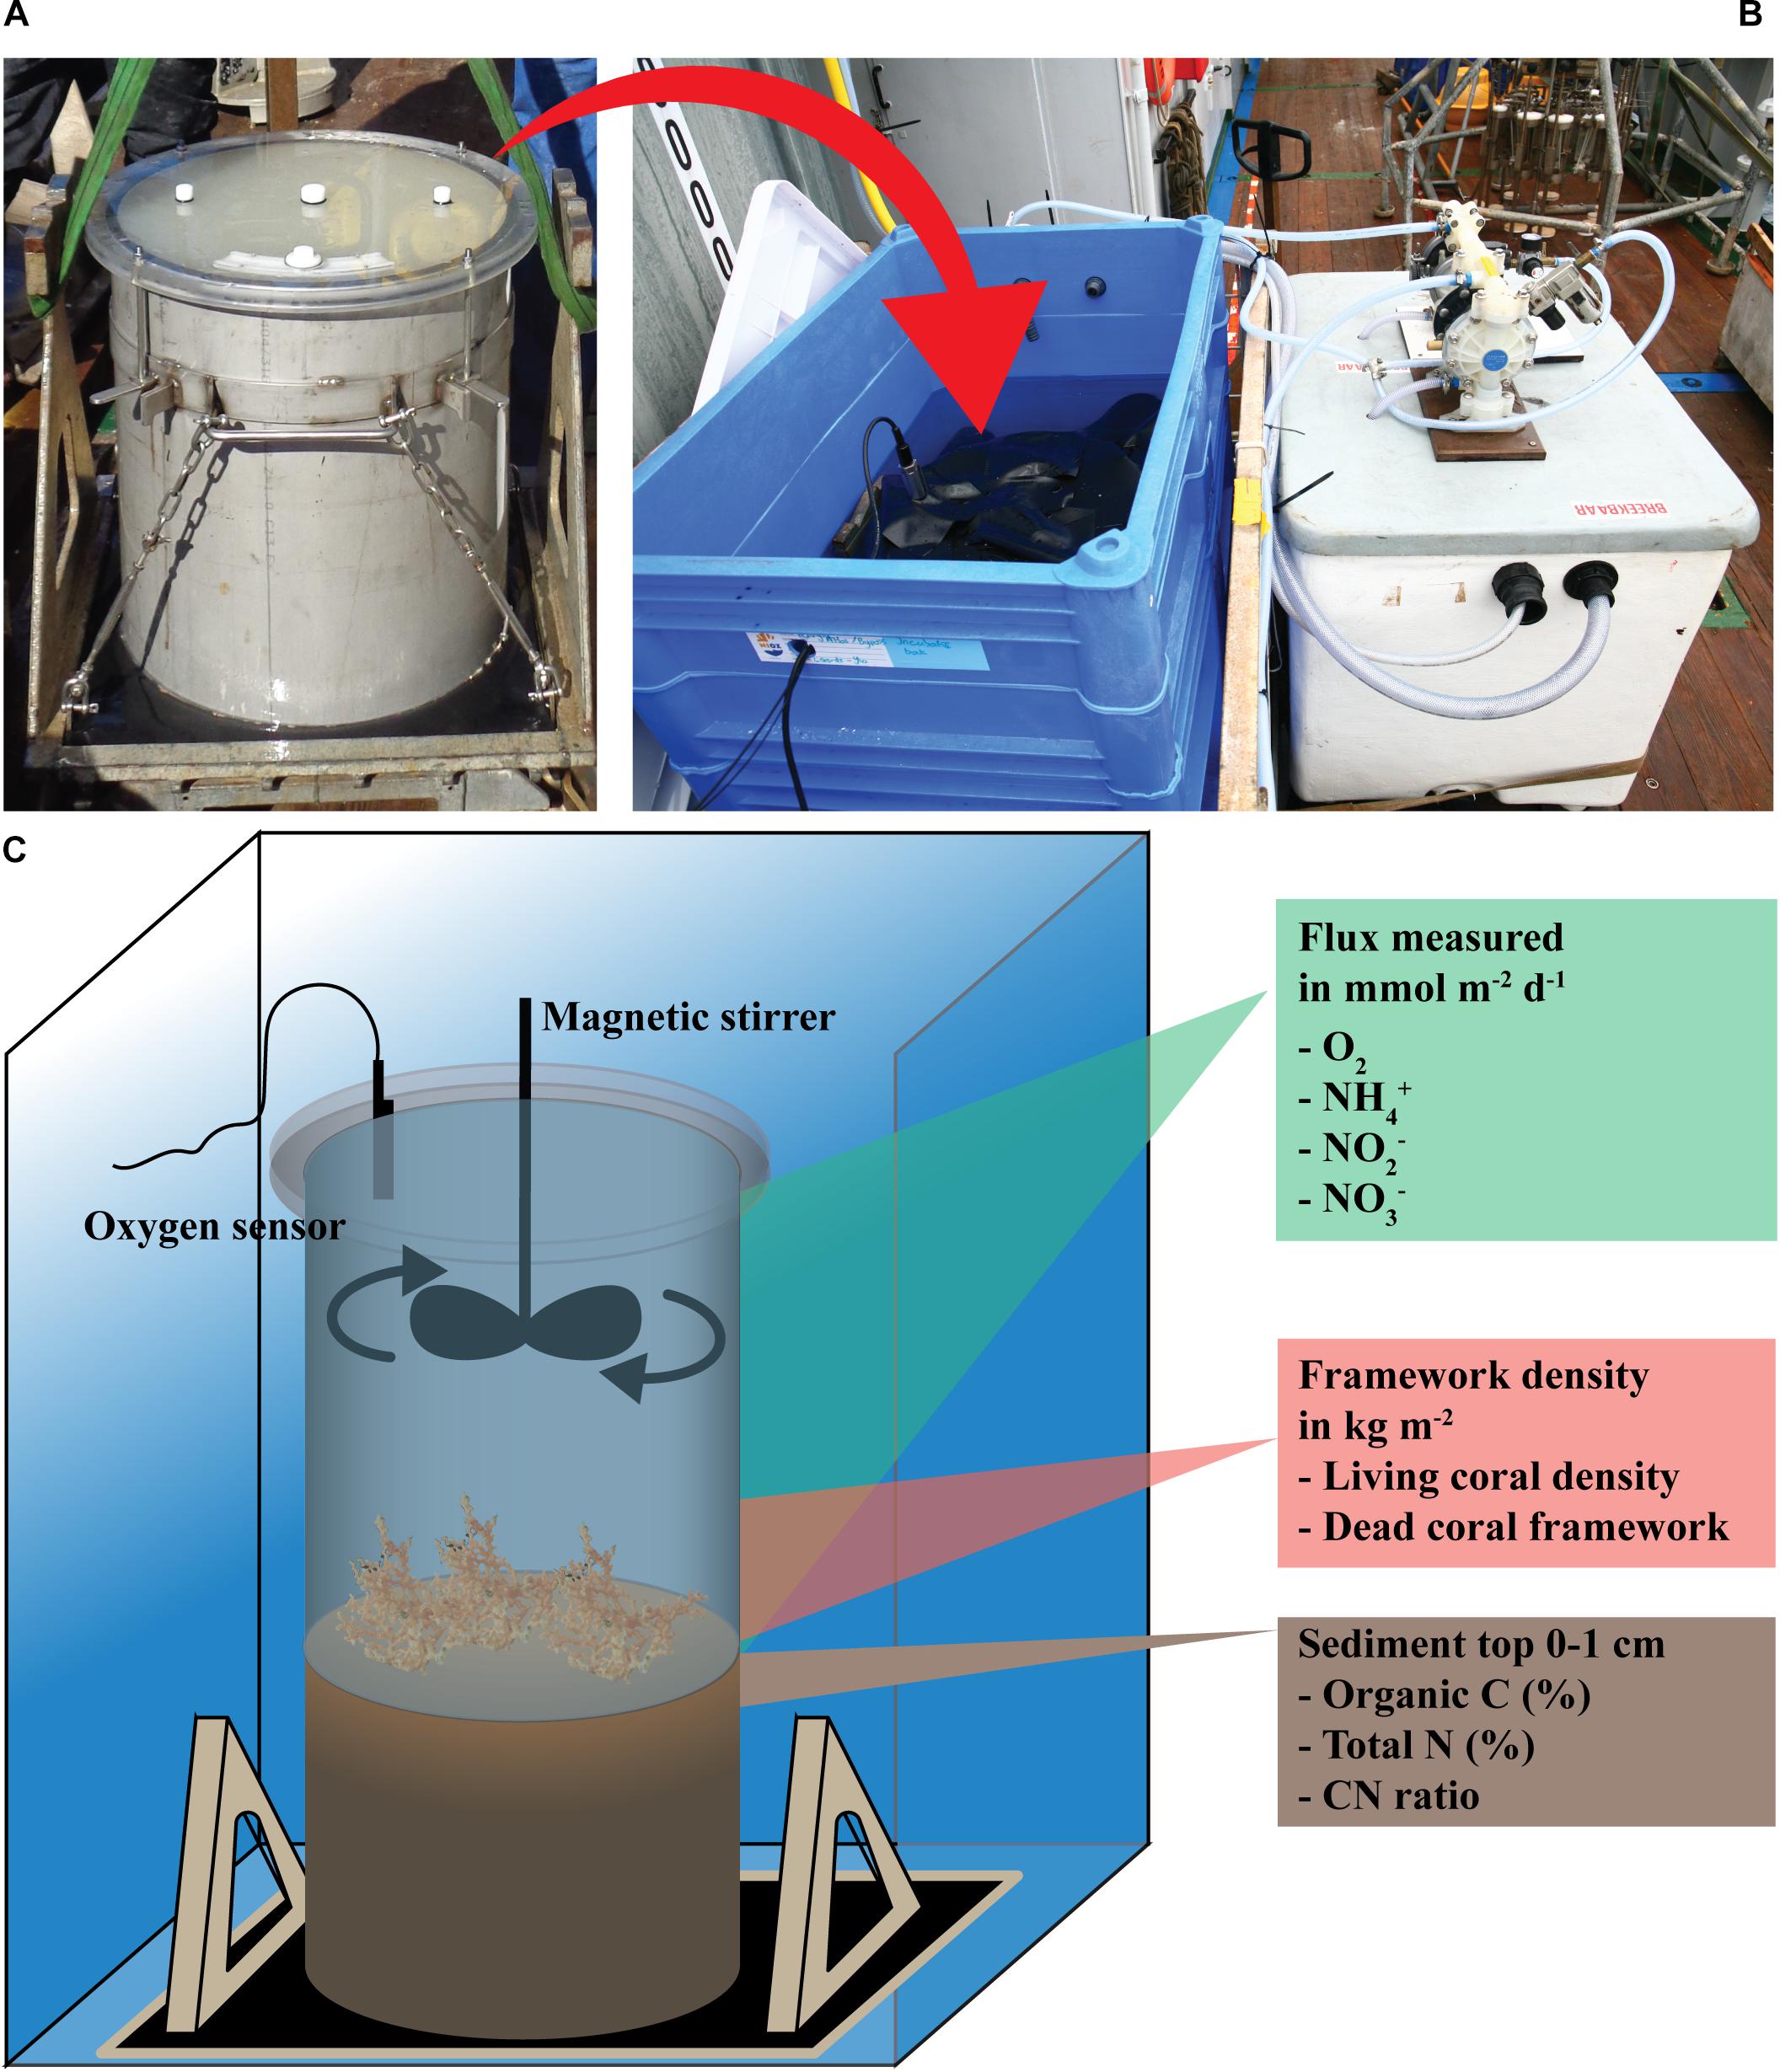
Figure 3. (A) Box core after closure with lid, (B) incubation set-up, (C) schematic view of incubation set-up and measured variables.
In both procedures the O2 concentration of the overlying water was measured continuously at 30 s intervals. The O2 saturation did not drop by more than 20% of the start O2 value during the incubation. Samples for DIN, i.e., NH4+, NO3– and NO2–, were taken in triplicate by 10 ml syringes through a sampling port in the lid at the start and at the end (∼24 h later) of each incubation. In six of the nine incubations a third intermittent measuring point was included. DIN samples were filtered through 0.45 μm cellulose membranes filters (Acrodisc® 25 mm filter, 0.45 μm HT Tuffryn® membrane) and frozen (−20°C) until analysis 8 weeks later in the laboratory at NIOZ. Sampled water was replaced by bottom water retrieved with the CTD rosette from the respective sampling station. After the incubation, the water was drained, and the living CWC and dead coral framework stored frozen (−20°C). Dead coral framework is here defined as dead coral branches with associated biofilm, epifauna and endofauna. A sediment sample of the top cm layer was taken by a plastic liner (i.d. 5 cm) for analysis of grain size and organic carbon and nitrogen content (Figure 3C). Due to large amounts of coral fragments in the sediment layer, it was not possible to sample the sediment of stations SHM 1 and FHM 2.
Concentration of DIN was measured using a SEAL QuAAtro analyzer (Bran + Luebbe, Norderstedt, Germany). Corals were freeze-dried, and dead coral framework was oven-dried at 55°C, to constant weight. Corals and dead coral framework were weighed (i.e., dry weight) and subsampled for organic carbon analysis. Subsamples (∼2 g, 3 per incubation) were ground and homogenized to fine powder using a ball mill at a 30 s–1 frequency (MM301, Retsch). About 20 mg of coral powder was subsampled into silver measuring cups, exposed to hydrochloric acid fume (HCl, 37%) for 3 days, and subsequently acidified with increasing levels of concentrated HCl (2, 5, and 30%) until all inorganic carbon was removed (Maier et al., 2019). Another set of tin cups was filled with ∼20 mg of coral powder for total organic nitrogen analysis and was not acidified. The acidified and non-acidified cups were pinch closed and, respectively, analyzed for total organic carbon and total organic nitrogen with an element analyzer (Thermo Electron Flash EA 1112 Analyzer). To determine the sediment grain size distribution, sediment samples were freeze-dried, sieved through a 2 mm mesh to remove small coral fragments, and analyzed by laser diffraction technique (Mastersizer 2000; Malvern Instruments Ltd., Malvern, United Kingdom; measurement range 0.02–2000 μm). In addition, ground sediment samples were analyzed for organic carbon and nitrogen content as described above.
Absolute O2 concentrations were calculated with the marelac R package from the percent O2 air saturation measured by the O2 sensors (Weiss, 1970; Soetaert et al., 2016). The O2 and DIN fluxes (mmol m–2 d–1) were subsequently calculated from the slope of a linear regression fitted to the observed concentration change and corrected for box core volume and surface area (Glud, 2008). To unravel the contribution of living corals, dead coral framework and sediment to the total O2 and DIN flux, we performed a planar regression of the observed benthic flux from the box core incubations against the predictor variables “living coral biomass” (kg dry weight m–2) and “dead coral framework” (kg dry weight m–2) (n = 6), of which the intercept is interpreted as sedimentary benthic flux. Specifically, we resolved the regression model: flux = a ⋅ CWC + b ⋅ Framework + c, in which flux is the measured flux of O2 or DIN (mmol m–2 d–1), a is the parameter representing the dry-mass-specific benthic flux for living corals (i.e., mmol kg DW–1 d–1), CWC is the dry weight of living CWCs in the box core scaled up to m–2 (kg DW m–2), b is the dry-mass-specific flux for dead coral framework (mmol kg DW–1 d–1), Framework is the dead coral framework density (kg DW m–2), and c is the sediment flux (mmol m–2 d–1). Hence, we actually used the differences in the living coral biomass and dead coral framework in each box core to quantify the contribution of “living coral biomass”, “dead coral framework” and “sediment” to the total flux in each incubation. All statistics were performed in the statistical software program R (R Development Core team, 2018). Plotting methodology mentioned in caption of the respectful plot.
Results
Site Description
The bare sediment sites were characterized by a smooth surface with occasional drop stones (Figure 4A). In contrast, recordings at the summit of the Haas mound showed a patchy distribution of coral colonies, dead coral framework and bare sediment patches (Figure 4B). On the southern flank of the Haas and Oreo mounds, a thick framework of thriving coral reef was observed (Figures 4C,D).
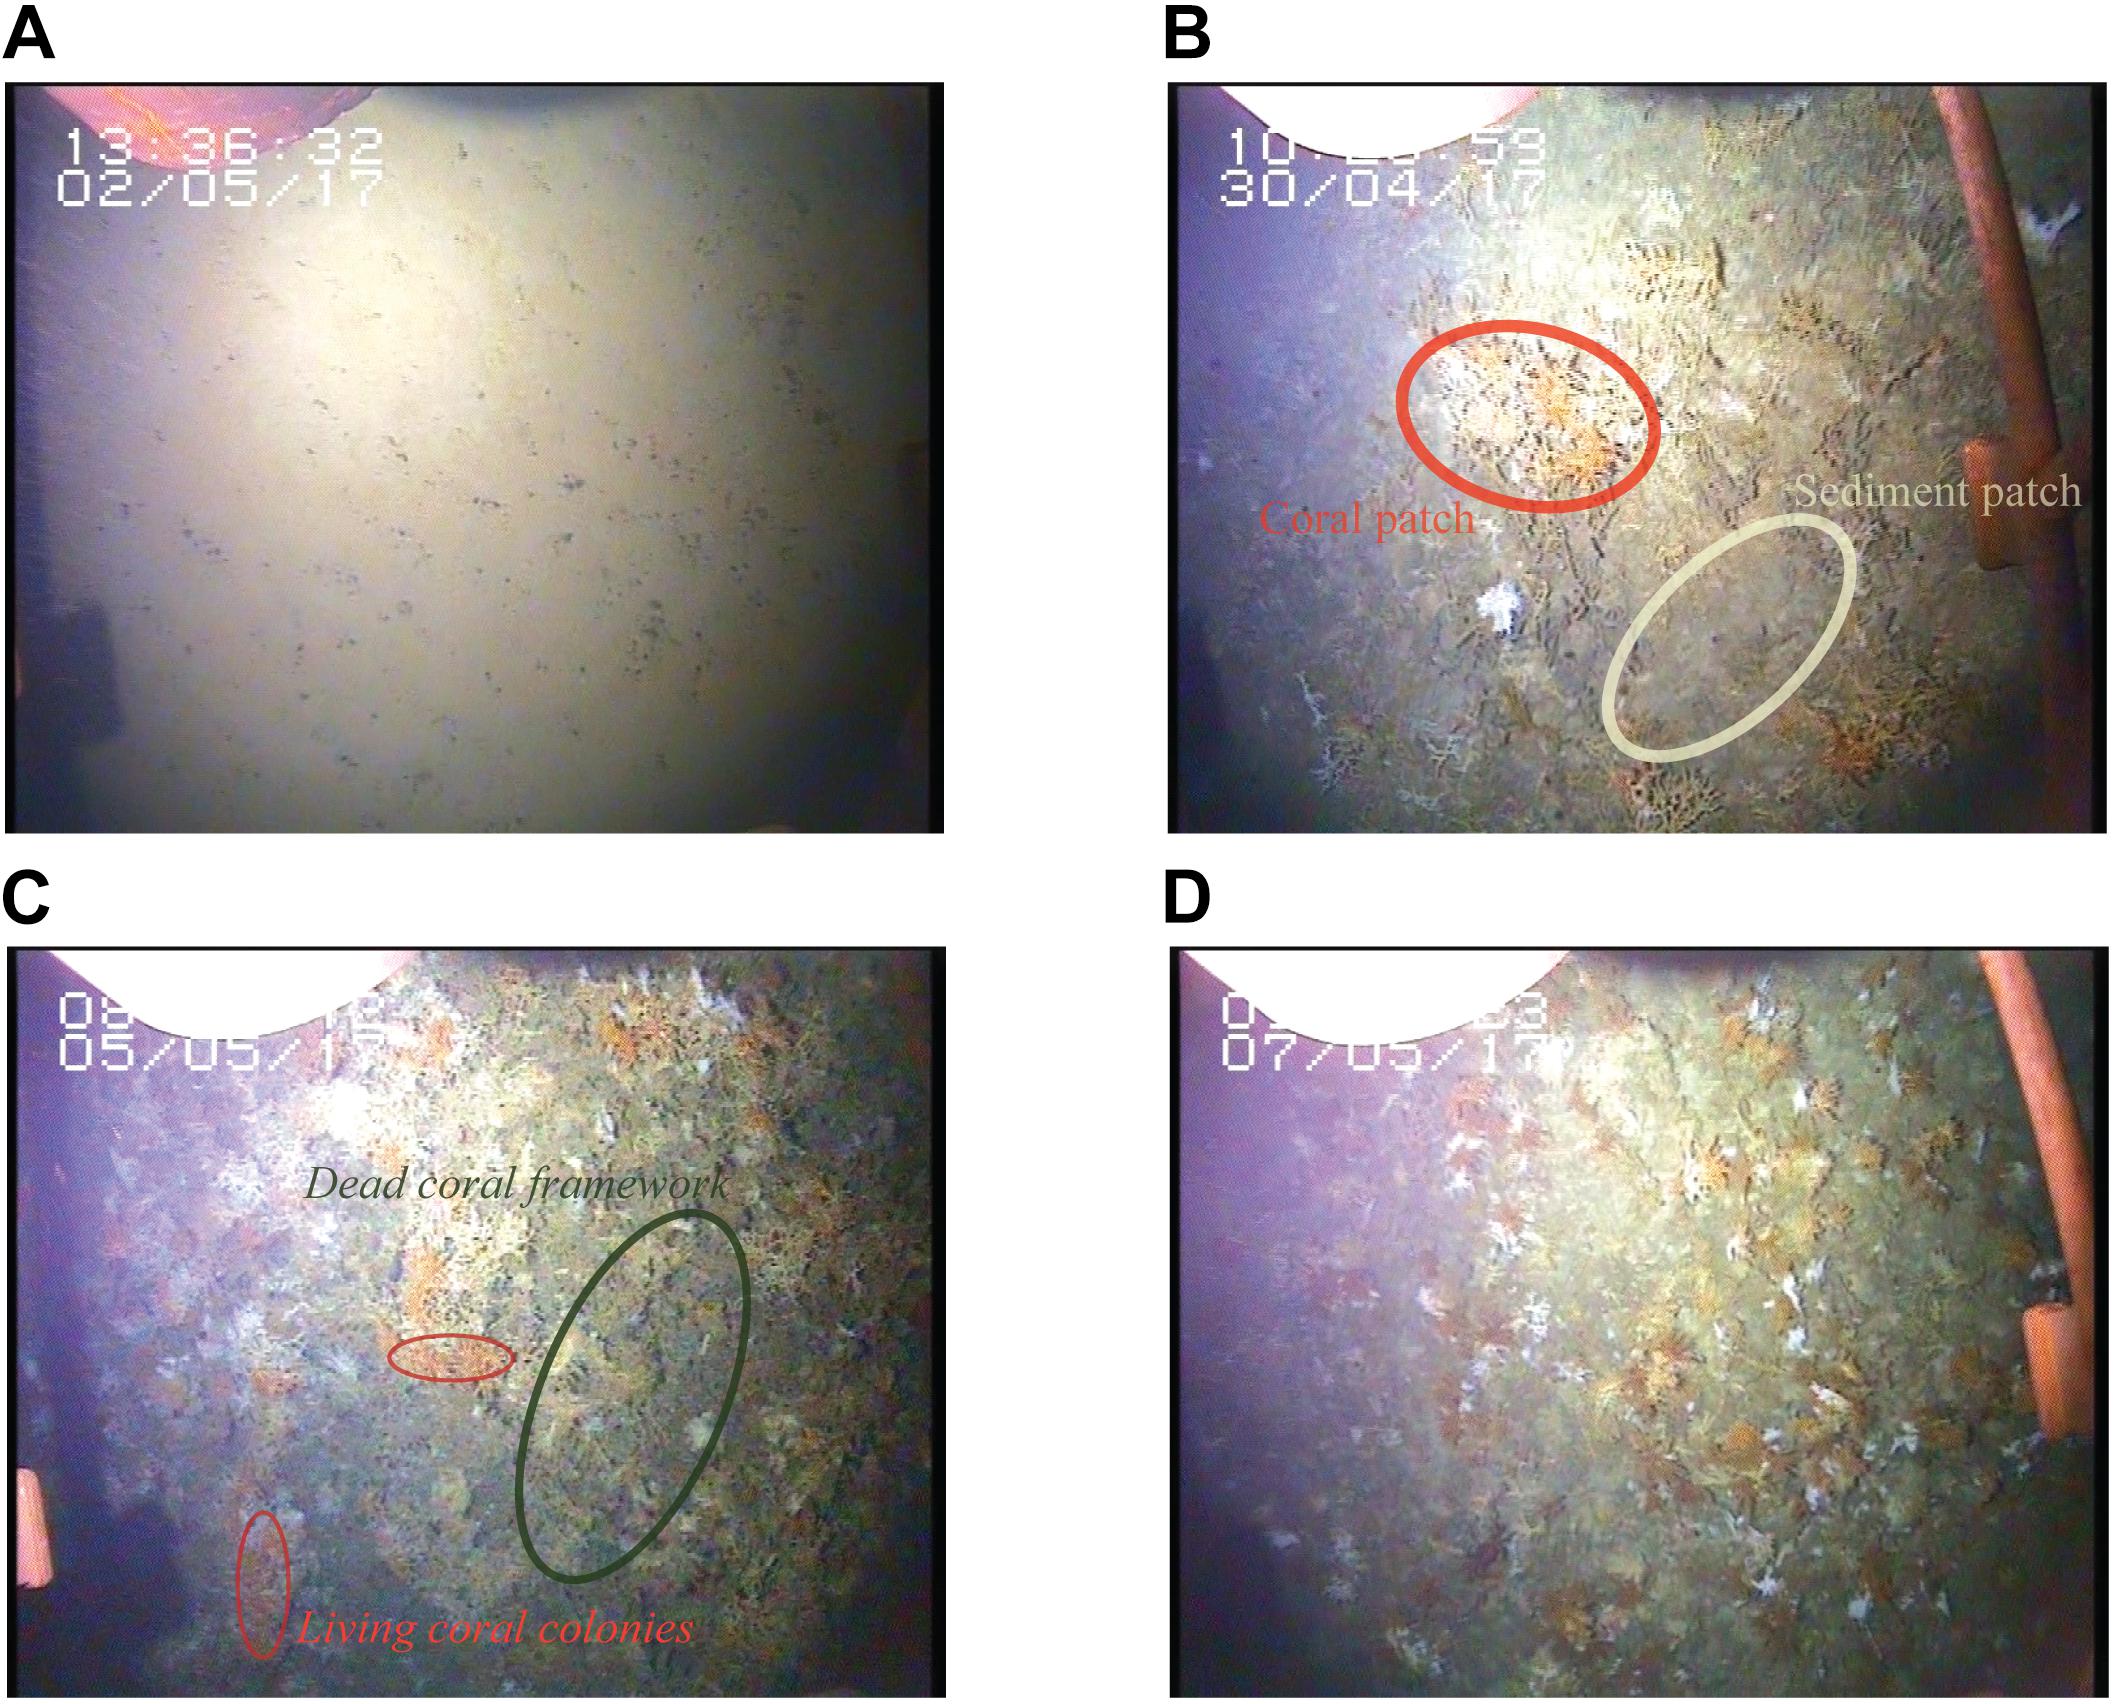
Figure 4. Stills extracted from the video that was mounted on the boxcore displaying the four habitats sampled by box core. (A) Reference site on Rockall Bank, (B) the summit of Haas mound, note the patchy distribution of coral framework and sediment and (C,D) southern flank of Haas and Oreo mound, respectively, showing a thick layer of living coral and dead coral framework.
Sediment Characteristics and Coral Density of Box Core Incubations
The surface sediment at the reference site was mainly composed of fine to medium sand (grain size between 63 – 630 μm), with a low organic matter content (i.e., 0.19% organic carbon and 0.03% organic nitrogen) (Table 2). Surface sediment on the coral mounds was substantially finer than at the reference site and was composed mainly of silt and very fine sand (grain size between 2–200 μm). Consistent with the finer particle sizes, the organic nitrogen and carbon content was higher on the mounds as compared to the reference site. The [molar] CN ratio of the sediments was similar among the four sampling sites (Table 2).
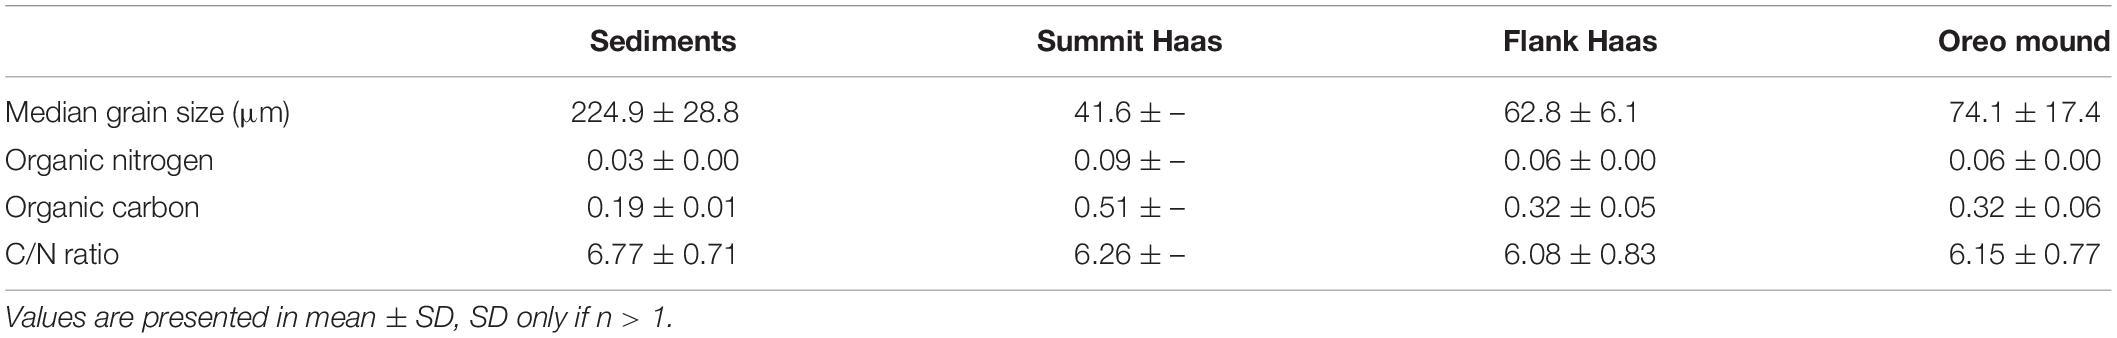
Table 2. The sediment characteristics median grain size (μm), organic nitrogen content (%), organic carbon content (%) and molar C/N ratio.
In all box cores used for incubations, the density of dead coral framework was substantially (on average 27 times) higher than the density of living coral (Table 3). Three scleractinian CWC species were present in the six box cores: two colonial species of Lophelia pertusa and Madrepora oculata; and the solitary Desmophyllum dianthus. The organic carbon and nitrogen content of the dead coral framework was three to four times lower as compared to the living corals. The Haas mound summit showed the largest range of living coral density (0.01 – 3.31 kg DW m–2). The Haas mound flank was characterized by a low living coral density (0.00 – 0.08 kg DW m–2) and comparatively high dead framework (19.59 – 85.97 kg DW m–2). On the Oreo mound, only living corals of the species M. oculata and small amounts of D. dianthus were found (0.45 – 0.98 kg and 0.01 – 0.05 kg DW m–2, respectively). The amount of dead coral framework on the Oreo mound (5.00 to 9.54 kg DW m–2) was comparable to that of the summit of the Haas mound.
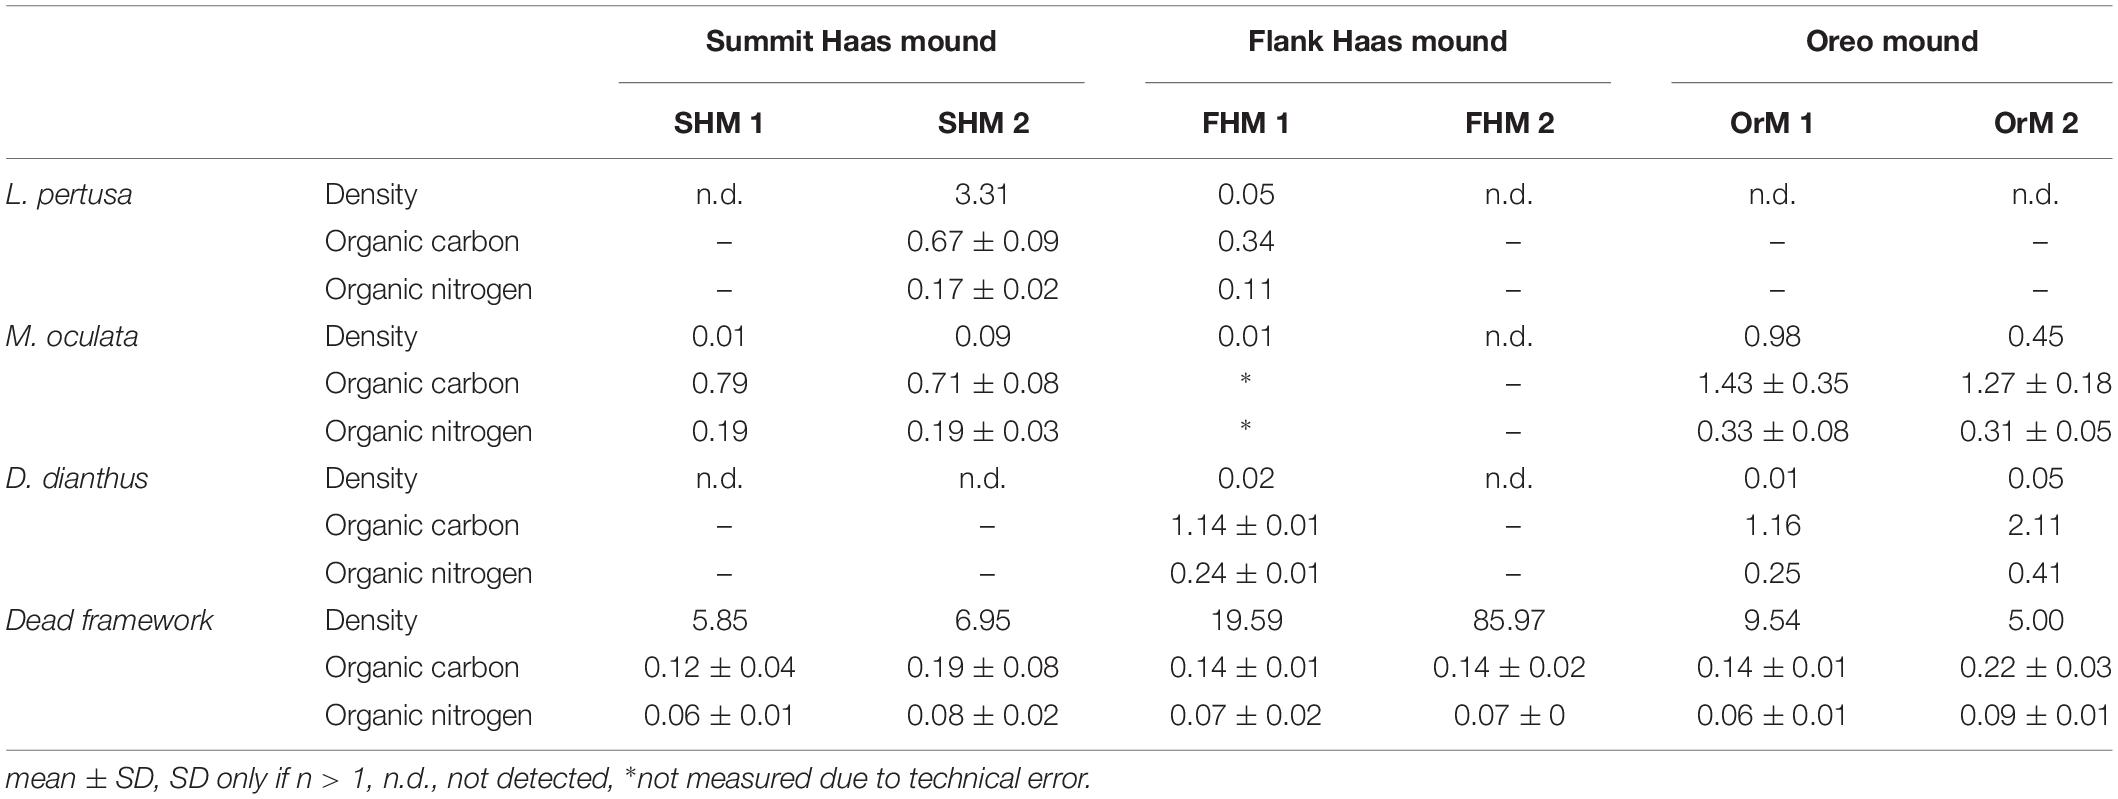
Table 3. The density (kg dry weight m–2), organic carbon content (%) and organic nitrogen content (%) of the living corals and dead coral framework for box core.
O2 Fluxes Measured by the AEC Technique
The two AEC deployments provided a total of 28 h and 41 h of unobstructed useful measurements, respectively. During the 28-h deployment on the summit of Haas mound (i.e., SHM3, Table 1), the lander was deployed diagonally to the main flow axis and the lander structure affected 25% of the measurements, which were therefore excluded from the analysis. Undisturbed flow velocities ranged between 0 and 23 cm s–1 (average 9.8 cm s–1). The dominant flow direction changed during the deployment (Figure 5A), suggesting that the O2 flux measured with the AEC technique is representative of different CWC community patches. This was confirmed by particle path analysis (data not shown), and by the fact that the cumulative flux analysis found distinctly different integrated O2 fluxes [11.5 ± 3.6 (mean ± SE) and 22.35 ± 5.6 mmol m–2 d–1, respectively] for the different footprints (Figure 5B). The site-representative bottom roughness length scale (z0) was 3.1 cm for both AEC footprints.
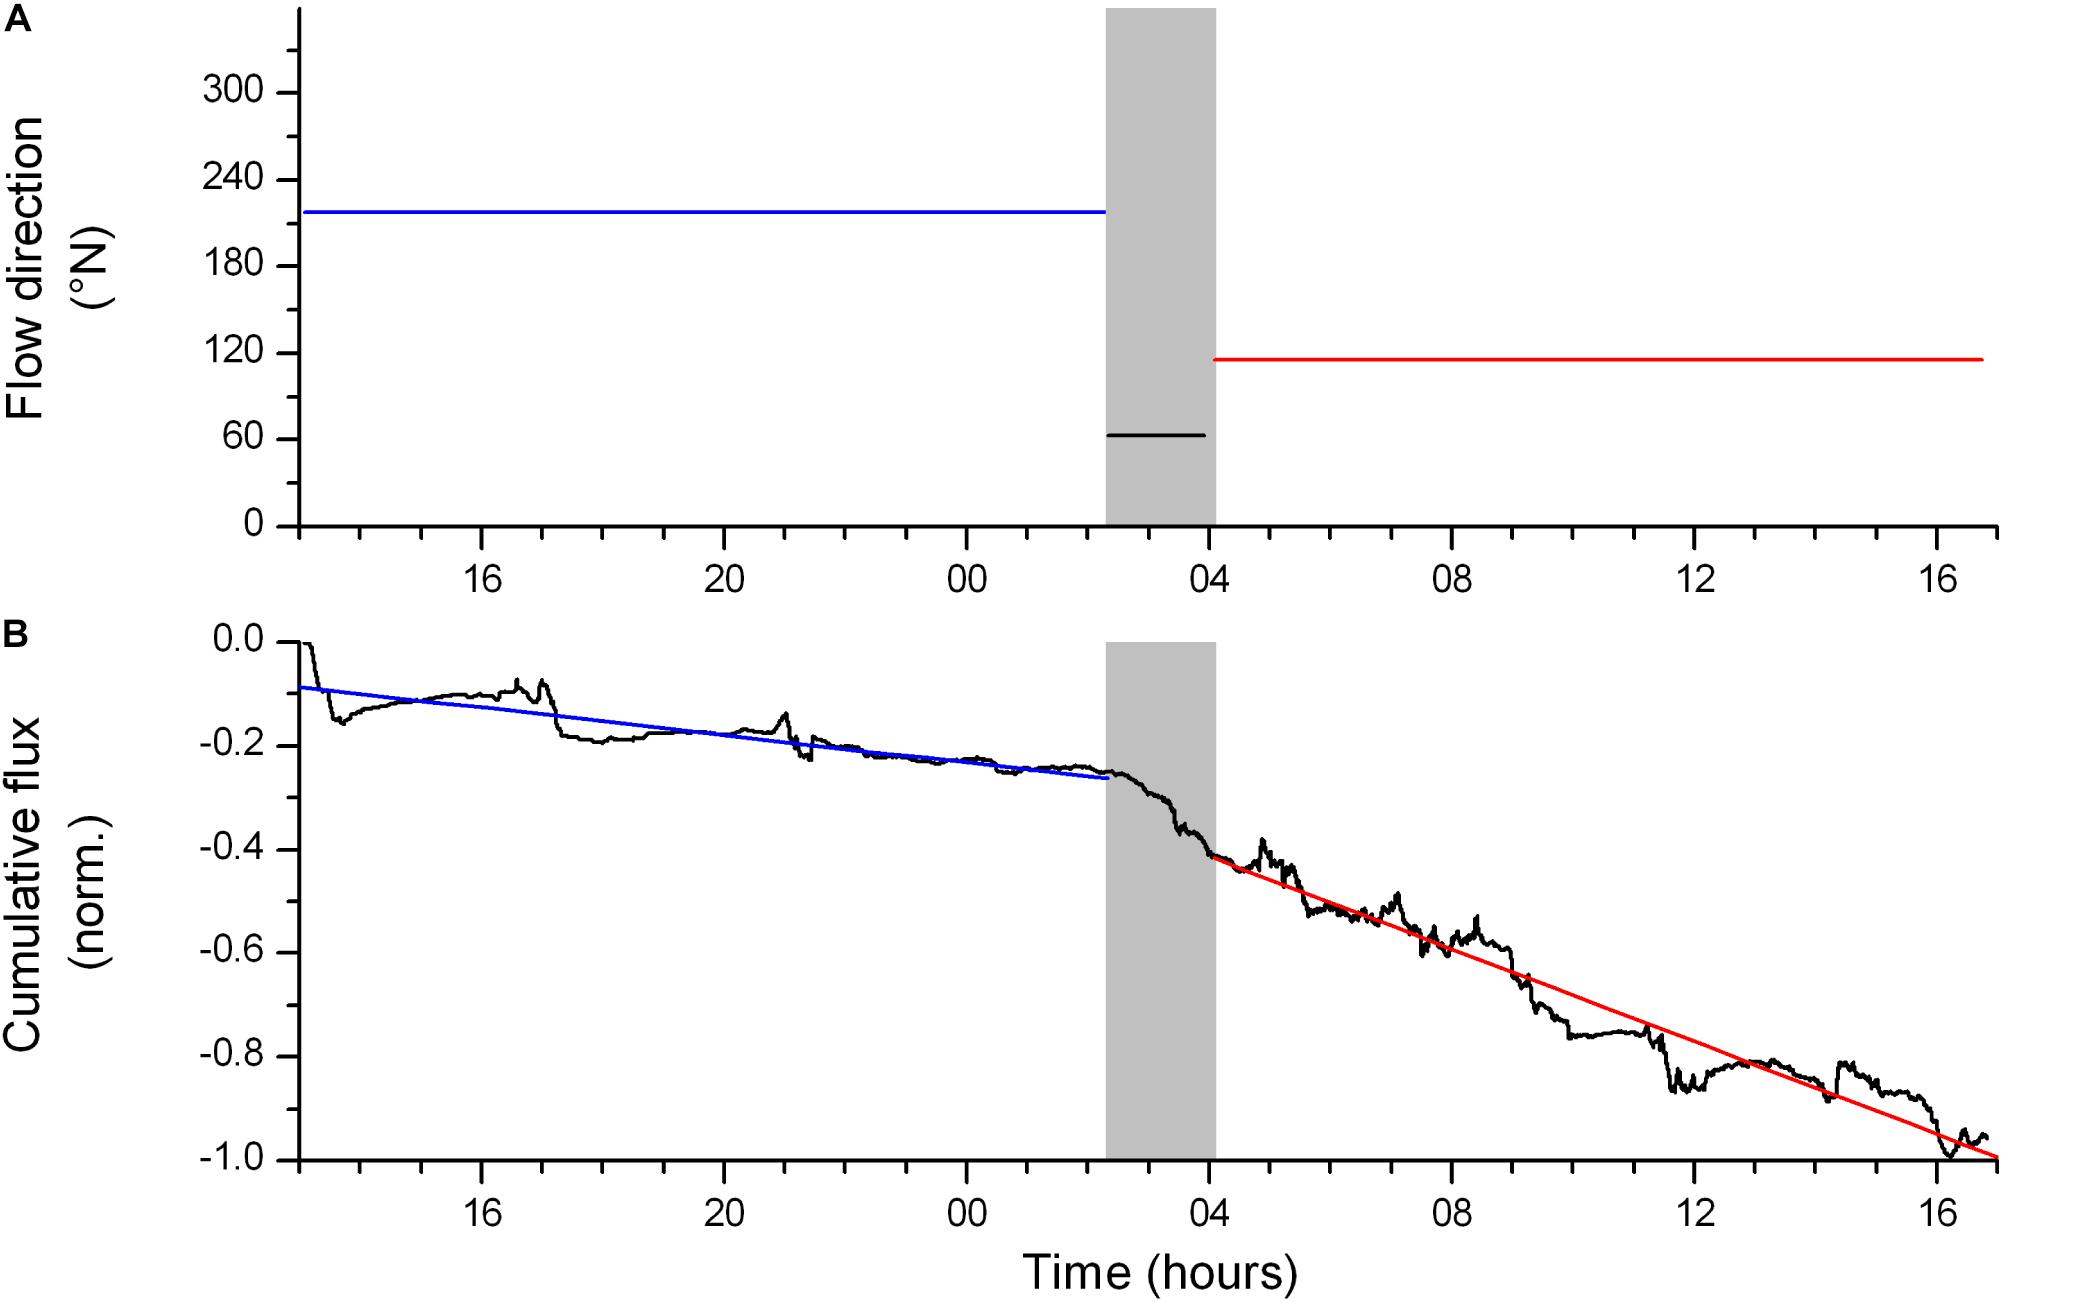
Figure 5. (A) Dominant flow direction during the deployment at summit of Haas mound (i.e., SHM3), (B) normalized cumulative O2 flux at summit of Haas mound (SHM3). Note that a linear change of the cumulative flux over time indicates stable conditions and thus well-developed fluxes. Linear sections (red and blue lines) indicate the main flux contributions from the two AEC footprints. The shaded time frame represents a transitional period in the flow direction which resulted in flow disturbances by the lander structure and overall unstable flux conditions. Deployment time is in hours after 30-Apr 00:00 UTC.
The AEC deployment on top of Oreo mound (OrM 3, Table 1) revealed a strong directional flow with velocities ranging from 0.047 m s–1 up to 1.8 m s–1 (average 0.89 m s–1). The lander structure affected 42% of the measurements, but the values obtained during unobstructed flow came from one distinct AEC footprint and gave an O2 flux of 45.3 ± 11.7 mmol m–2 d–1. The site-representative z0 was 5.1 cm, reflecting a rougher benthic surface than at the summit of Haas mound.
O2 Fluxes Measured by BC Incubations
Temperature during the box core incubations ranged between 7.6 and 9.4°C, which corresponds well to the range of in situ water temperature (8.7 – 9.0°C). Leakage at the base of the box corer created an occasional air bubble under the lid of the core, and the ship movement caused the air bubble to mix with the incubation water, and induced periods of O2 perturbation (Figure 6). When an air bubble was observed, it was eliminated by adding bottom water. The period during which the O2 concentration was visually perturbed was omitted from the linear regression. After removal of the air bubble, the O2 decreased continued in a comparable way to before the presence of the air bubble (Figure 6).
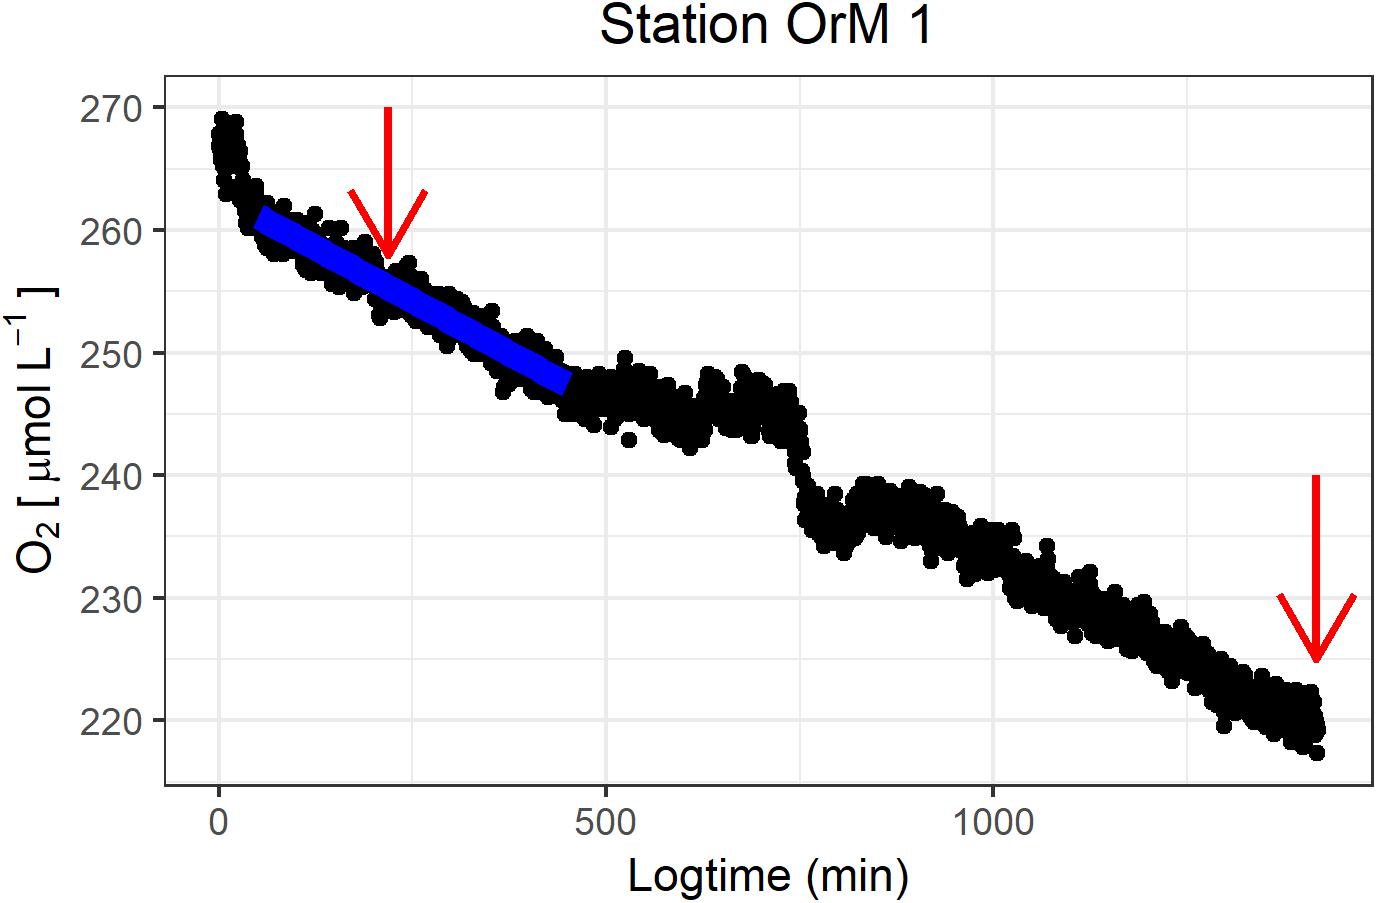
Figure 6. Representative O2 concentration series during a boxcore incubation (OrM 2), with the black dots representing the O2 concentration (μmol L–1) and the blue line the resulting linear regression which was used to calculate the O2 flux. The red arrows indicate sampling of DIN. The disturbance caused by air bubble development is visible between minute 500 and 800. Plot produced with R package ggplot2 (Wickham, 2016).
The O2 flux at the reference sediment site ranged from 0.6 to 3.2 mmol O2 m–2 d–1 (mean ± SD: 1.9 ± 1.4 mmol O2 m–2 d–1) (Table 4). The O2 flux of the CWC reef communities ranged from 5.7 to 28.4 mmol O2 m–2 d–1 (mean ± SD: 14.6 ± 8.4 mmol O2 m–2 d–1). The variability in CWC reef community O2 flux was higher on the summit of the Haas mound than on the flank and at Oreo mound (Summit Haas = 17.0 ± 16.0 mmol O2 m–2 d–1, Flank Haas = 15.5 ± 6.9 mmol O2 m–2 d–1, Oreo = 11.2 ± 2.8 mmol O2 m–2 d–1) (Table 4).
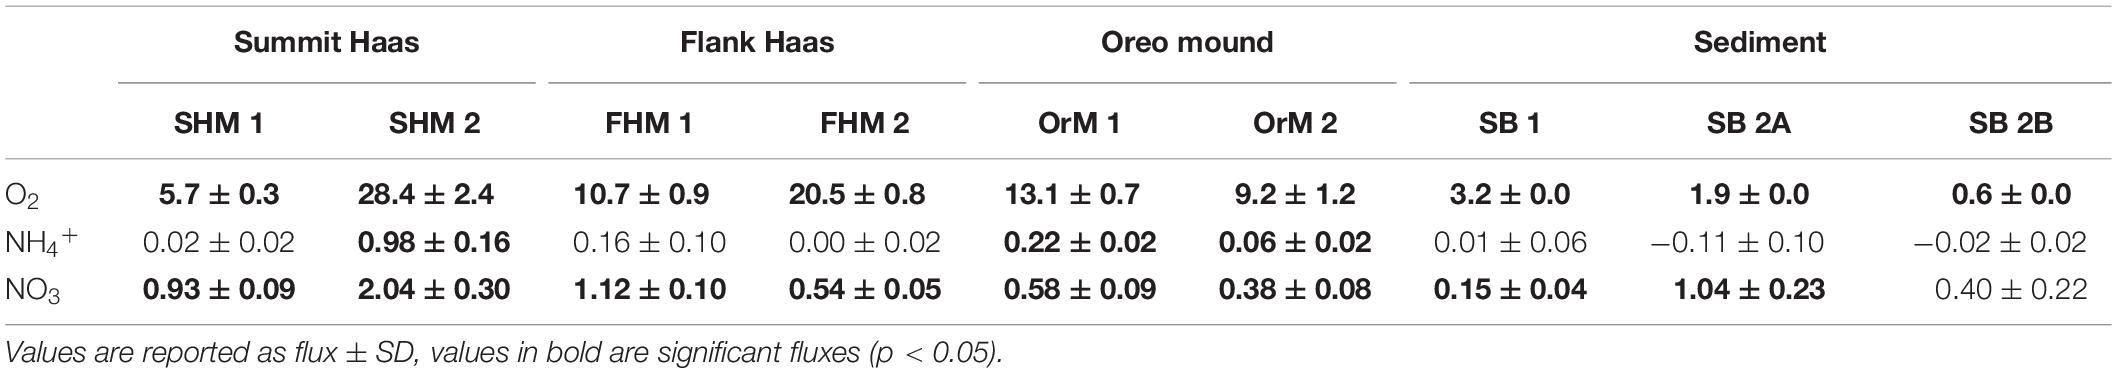
Table 4. Benthic O2 and DIN fluxes measured from the BC incubation experiments expressed in mmol m–2 d–1.
Nitrogen Fluxes Measured by BC Incubations
During all incubations, the concentration and flux of NO2– were negligible, hence we present only the results for NH4+ and NO3–. The initial NH4+ concentrations ranged from 0.3 to 0.5 μmol L–1 while values at the end of incubation were between 0.3 and 2.0 μmol L–1 and NO3– concentrations during incubations increased from 10.0 – 17.0 μmol L–1 to 11 – 20 μmol L–1. Due to the occasionally high variation within the triplicate samples, the calculated fluxes were not always significant (Table 4). However, the average DIN (NO3– + NH4+) flux of CWC reef communities (1.17 ± 0.87 mmol N m–2 d–1) was around two times higher than that of bare sediment reference site (0.49 ± 0.32 mmol N m–2 d–1). At the bare sediment reference site, NO3– fluxes were relatively more important than the NH4+ fluxes for the overall DIN flux. Generally, the DIN fluxes of box core incubations were mainly driven by NO3– except for incubations containing CWC colonies, in these cores the NH4+ fluxes were a significant part of the DIN fluxes.
Unraveling the Biogeochemical Fluxes
Planar regression of the box core O2 fluxes against living coral and dead coral framework, with the intercept representing the contribution of the sediment, showed a robust relation (R2-adj: 0.99, Figure 7 and Table 5), indicating that the dry-mass-specific O2 flux of living coral is >30 times higher than that of the coral framework. For the NH4+ flux, living coral density was the only significant descriptor (R2-adj = 0.94, Table 5) and contributions from the sediment and dead coral framework were non-significant. The NOx flux was not significantly related to the amount of live or dead coral framework, and only the intercept (i.e., sediment activity) was significant. Note that the regression could only be based on the box core incubations, as data on the coral and dead coral framework density in the AEC footprint are lacking.
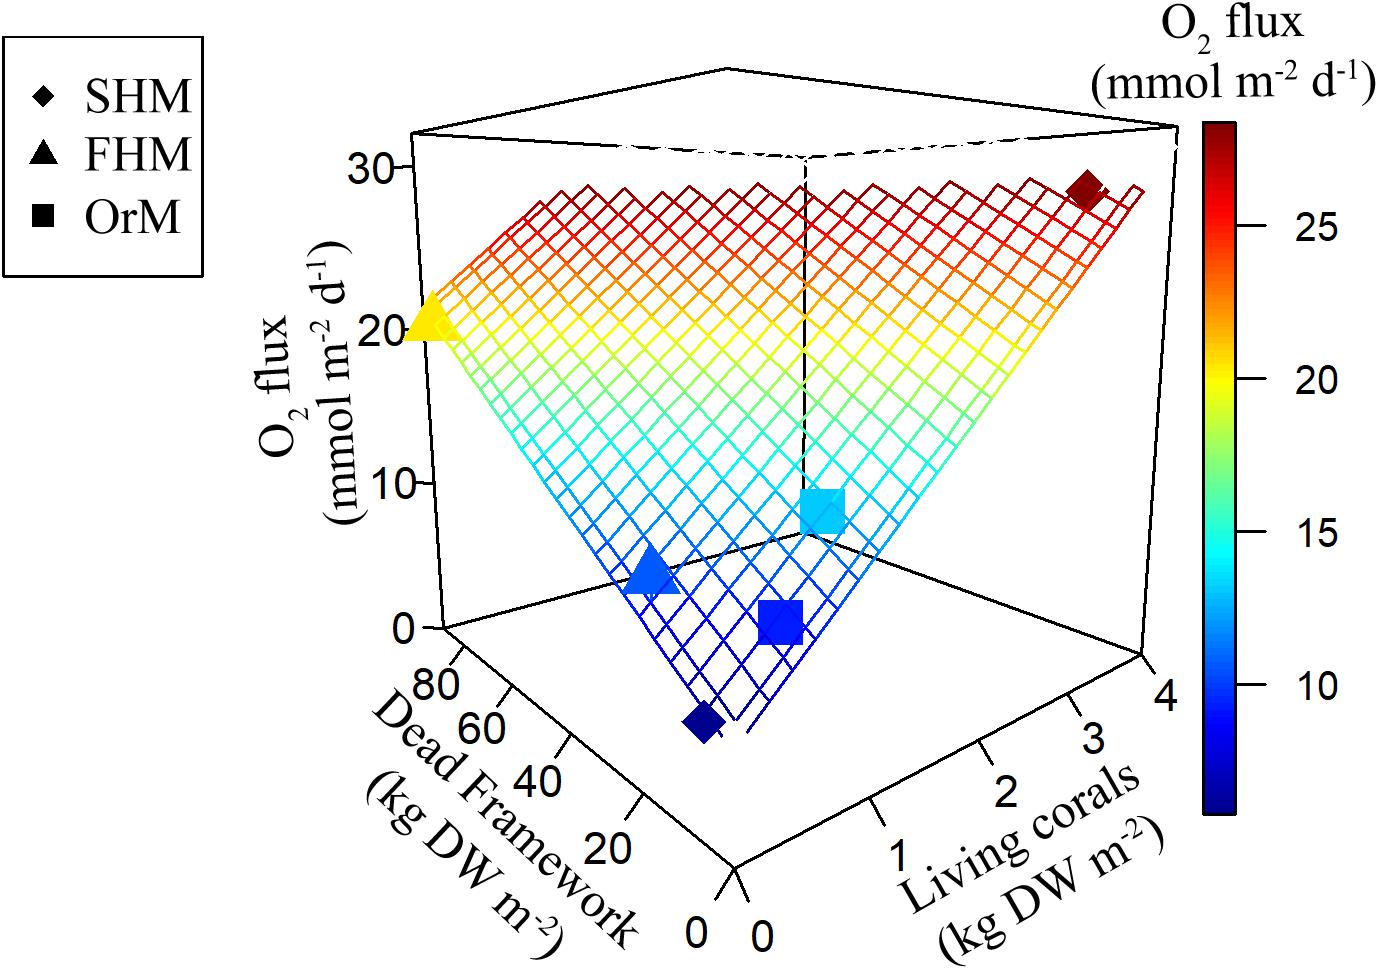
Figure 7. Planar regression of the O2 flux (mmol m–2 d–1) against the predictor variables living coral density (kg dry weight m–2) and dead coral framework density (kg dry weight m–2), of which the intercept is interpreted as sedimentary O2 flux. The six incubated boxcores are plotted as individual datapoints and plane represents results of the regression model. Note that the symbols in the plot are shape according to their location (see legend) and colored according to the observed O2 flux. Plot produced with R package plot3D (Soetaert, 2017).
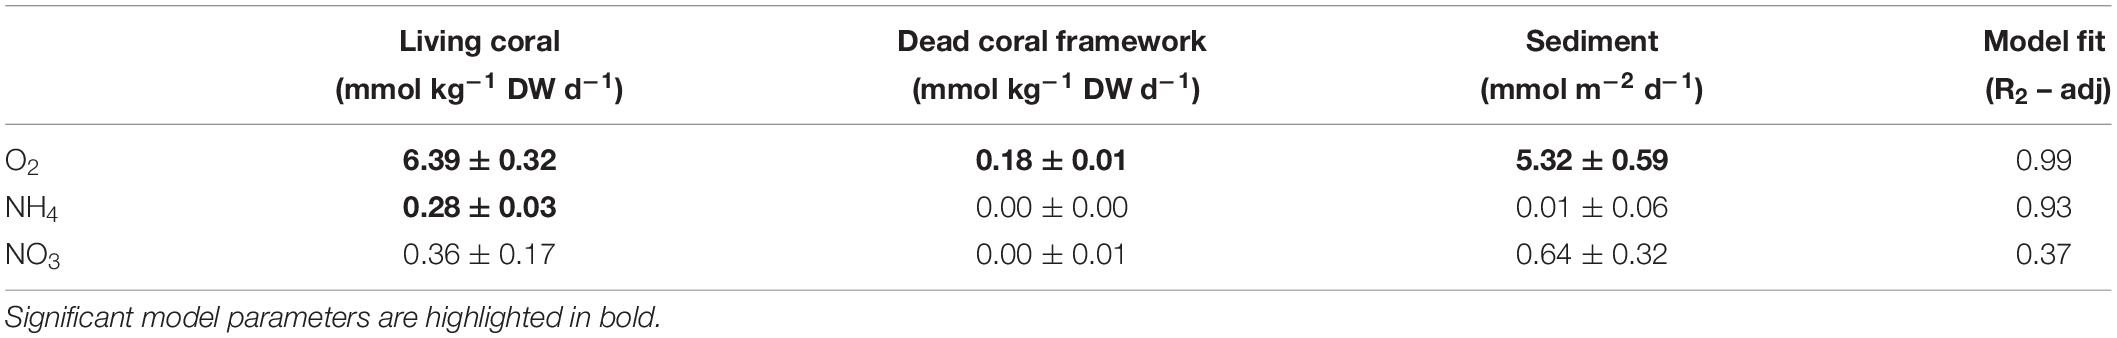
Table 5. Planar regression of the benthic flux, i.e., flux = a ⋅ CWC + b ⋅ Framework + c (n = 6), with a, “Living coral” rate, b, “Dead coral framework” rate and c, “Sediment” rate.
Discussion
Constraining O2 Exchange Rates at CWC Reefs
This study provides the first concurrent O2 flux measurements from box core (BC) incubations and aquatic eddy-covariance (AEC) and contributes to the small database for O2 fluxes of whole CWC reef communities (Table 6). The mean O2 flux derived by AEC generally aligns well with the flux derived by chamber incubations for homogenous cohesive sediments in shallow water and deep sea settings (Berg et al., 2003, 2009; Glud et al., 2016). In complex benthic habitats such as permeable sand, maerl beds, reefs or megafauna enriched sediments, the O2 exchange obtained by the two approaches often diverges (Glud et al., 2010; Attard et al., 2014, 2016). This discrepancy has been ascribed to mesoscale heterogeneity that might be poorly represented during chamber deployments, or to changes of flow characteristics or food availability during chamber enclosure (Attard et al., 2015). However, deep water AEC deployments in complex habitats such as CWC reefs come with logistical challenges and often require access to a work-class remotely operated vehicle for accurate positioning (Rovelli et al., 2015), which limits the applicability of the approach. Moreover, in dynamic settings such as CWC reefs, the AEC approach requires a relatively long deployment time of 12 – 24 h to integrate the inherent short-term variations associated to changes in flow direction and velocity (Holtappels et al., 2013; Glud et al., 2016).
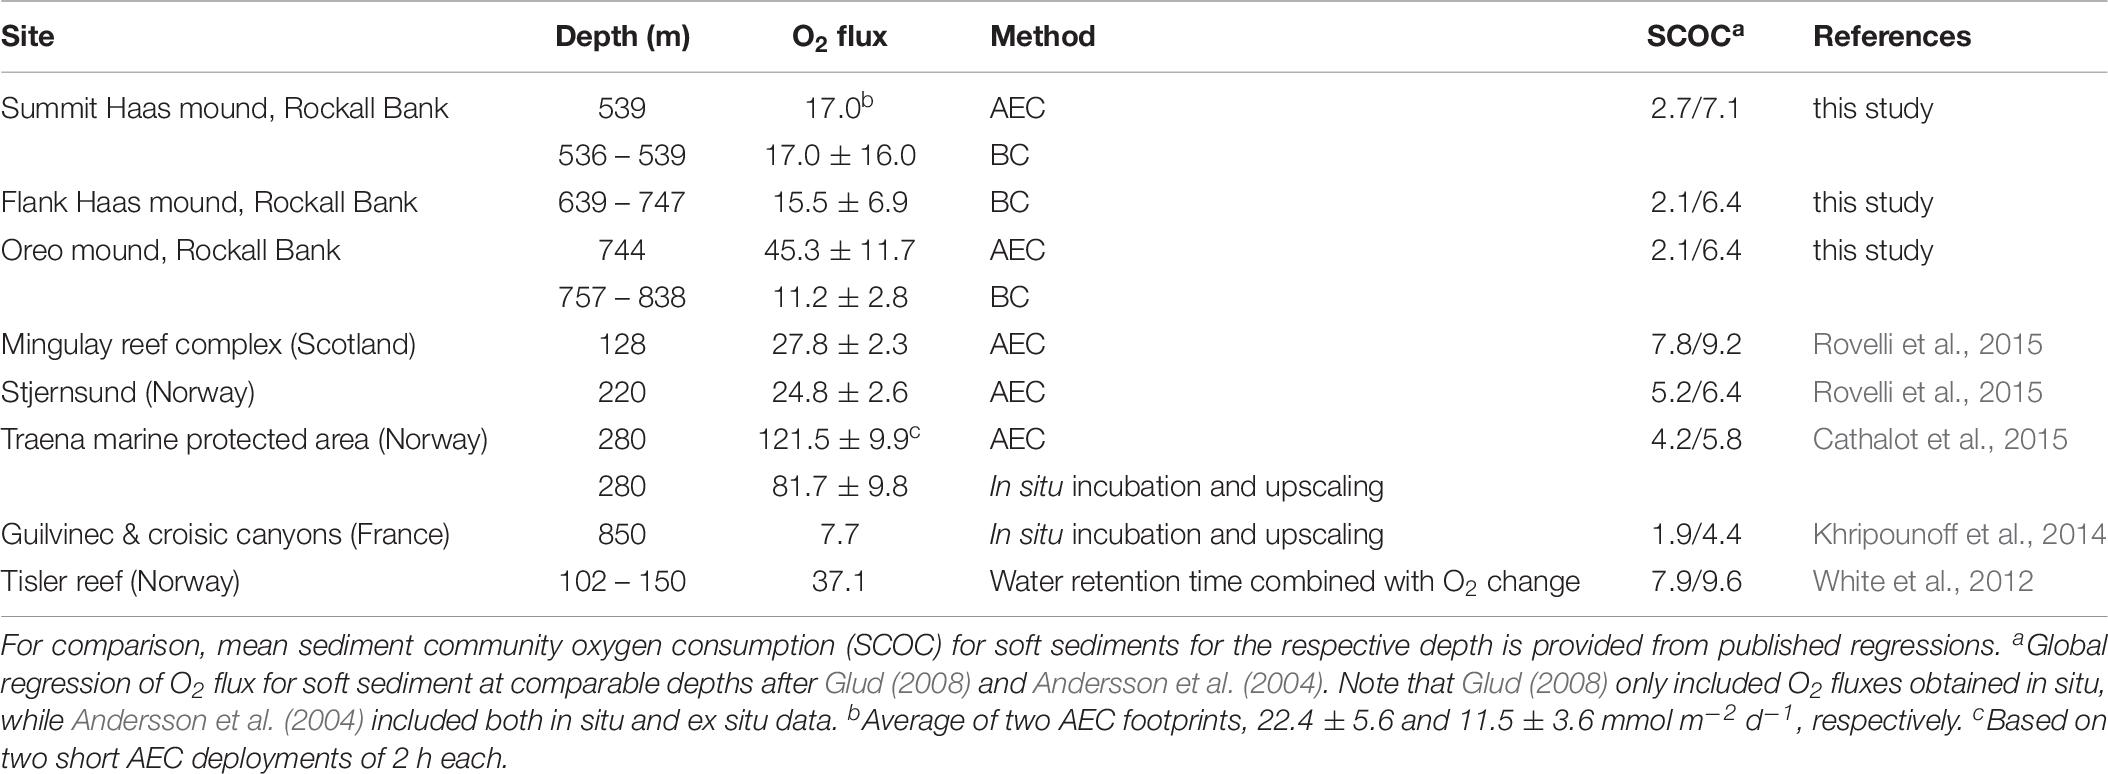
Table 6. Overview of O2 fluxes (mmol m–2 d–1) of CWC communities based on various methods.
Our study measured the O2 flux at sites that visually differed in their density of living coral and dead coral framework. While the BC incubations showed no site differences, the regression analysis showed that two variables, namely the quantity of living coral and dead coral framework, explained most variability in the O2 flux at all three investigated coral sites. The congruence of the O2 fluxes by the AEC and BC method for the summit of Haas mound, which showed a patchy distribution of living corals and bare sediment, suggests that the habitat variability of the ∼500 m2 large AEC footprint was reasonably represented by the replicate ∼0.2 m2 large BC incubations. In contrast, at the deeper (∼750 m) Oreo mound we encountered a higher near-bottom flow velocity, and the average O2 flux derived by the AEC technique was four times higher than that obtained with the BC incubations. Data on the density of living coral and dead framework in the AEC footprint is unfortunately not available, so it remains difficult to judge what caused the high AEC O2 flux at Oreo mound. As the AEC data from Oreo mound were of high quality and represented a large footprint (∼500 m2), we believe that the AEC value presumably provides the more robust O2 flux estimate on a CWC community scale and that the two box core incubations poorly represented the natural habitat variability or compromised the natural flow conditions. It should also be noted, that a higher O2 flux at Oreo mound was a priori anticipated given the higher coral density previously observed on video transects and on the boxcore videos (Figures 4B–D).
The measured O2 fluxes of the summit of Haas mound compare well with those reported for the shallower CWC communities at the Mingulay Reef Complex and Stjernsund (Norwegian glacial sound) (Rovelli et al., 2015). The AEC-based O2 flux at Oreo mound is, however, ∼3 times higher, which underlines the large spatial metabolic variability that may exist between mounds of the same mound province. The highest O2 flux reported for CWC reefs was reported for a “cigar-shaped” reef at the Traena marine protected area in Norway (Cathalot et al., 2015). That O2 flux, however, is representative for the head section of these reefs, which are known for having a very dense cover of live Lophelia pertusa (Cathalot et al., 2015) and this may not be directly comparable to the other CWC mounds. Furthermore, the measurements at the Traena marine protected area were based on a short measuring period of a few hours (∼2 h) and may thus not fully represent average flux conditions at the measuring site. Excluding that value, the available AEC-based O2 uptake rates of CWC communities converge toward 28.7 mmol m–2 d–1, which is a factor of 5 higher than the O2 uptake for soft bottom systems at similar depths (Andersson et al., 2004; Glud, 2008).
The dry-mass-specific O2 flux for living corals (inferred from planar regression model) of 6.39 ± 0.32 mmol O2 kg–1 DW d–1 compares well with O2 fluxes measured for L. pertusa or M. oculata obtained during laboratory incubations (Dodds et al., 2007; Larsson et al., 2013; Khripounoff et al., 2014), suggesting limited disturbance induced by the sampling. The coral framework consists of eroding dead branches that provide a substrate for biofilm, consisting of microbial biomass, and sessile and mobile fauna. Fauna encountered in the box cores (data not shown) belonged to the classes/phyla: Echinoidea, Polychaeta, Porifera, Crustacea, Actiniaria, which also previously have been identified as dominant in NE Atlantic CWC communities (e.g., Duineveld et al., 2007; Henry and Roberts, 2007). The inferred dry-mass-specific O2 flux for dead coral framework (0.2 mmol O2 kg–1 DW d–1) was more than 30 times lower than the flux for living corals. However, as all box cores contained substantially more framework than living corals, especially at the southern flank of the Haas mound, the framework still contributed significantly, ranging from 10 to 75% of the total benthic O2 flux.
The organic carbon content (∼0.35%) and median grain size (∼ 63 μm) of sediment on the coral mounds is in line with previous work in the same area (Mienis et al., 2009a, b), while being slightly lower than found in sediments underneath a CWC reef in Norway (Wehrmann et al., 2009). The dominance of fine and comparatively organic-rich sediment below the CWC framework is presumably caused by baffling of the water flow by the coral branches that leads to the accumulation of fine sediment particles between the coral framework (Dorschel et al., 2005; de Haas et al., 2009). Mienis et al. (2019) recently showed with a laboratory flume study that the current velocity was strongly reduced within and behind (i.e., wake effect) coral framework patches, inducing the settlement of inorganic and organic particles. In addition, the enhanced trapping of suspended organic matter by the filter-feeding faunal community, and subsequent deposition as (pseudo)feces, may additionally enrich the organic carbon concentration on coral mounds (Maier et al., in review). The reference site in contrast, lacks the baffling effect of the framework and (most of) the filter-feeding activity, which leaves a coarser sediment with lower organic carbon content.
To date, little is known on O2 flux mediated by the sediment underneath a CWC reef. Microbially mediated processes are presumably more active in sediment underlying a CWC reef as compared to bare sediments (Wehrmann et al., 2009). Our findings support this idea in two ways. Firstly, the sediment on the coral mounds consists of finer and more organically rich material than the reference site, likely due to the baffling effect of the coral framework discussed above, suggesting that mineralization will be higher. Secondly, from the planar regression we inferred an O2 flux of 5.3 mmol m–2 d–1 for the sediment underlying the coral framework, which is indeed a factor ∼3 higher than the average O2 flux measured at reference site. The O2 flux of the CWC-sediment inferred in this study is substantially lower than the O2 flux of 33.2 ± 10 mmol m–2 d–1 (mean ± SD) that was measured in a food web model of the CWC community at Rockall Bank (van Oevelen et al., 2009). This might reflect a true difference among sites, but in addition to spatial and temporal variability, methodological differences may contribute to this difference, as the latter authors measured the O2 flux in a core that was taken from a box core after the overlying coral and dead framework was removed.
Cold-water coral reef communities appear to be hotspots of carbon mineralization on the seafloor. A habitat suitability model suggest a CWC habitat cover of 4.7% for the Logachev mound province (areal extent of 60 × 90 km) (Rengstorf et al., 2014). Assuming the remaining 95.3% in the area consists of soft-sediments, we can calculate the benthic soft-sediment respiration with the depth-dependent power equation developed by Glud (2008). Using the median CWC community O2 uptake rate obtained from the BC incubations (11.9 mmol O2 m–2 d–1), and the AEC technique (24.8 mmol O2 m–2 d–1), we estimate that CWC reefs are responsible for 20 to 35% of the total benthic respiration in the Logachev mound province, depending on which median O2 uptake rate is used. This percentage is in line with calculations of the relative importance of CWC reefs in benthic OM cycling on the Norwegian Margin (36% of total benthic respiration; Cathalot et al., 2015) and indicates that the CWC mounds in the Logachev mound province play an important role in regional carbon cycling.
Nitrogen Fluxes of a CWC Reef Community
The present study reports the first nitrogen flux measurements of intact CWC communities and allows a comparison with sediment communities. The nitrogen fluxes measured from the bare sediment reference site incubations showed a variable release of NO3– into the overlying water and negligible NH4+ efflux. This pattern is consistent with many earlier studies on nitrogen cycling in deep water, aerobic sediments, which have shown that NH4+ produced by organic matter mineralization generally is oxidized by different nitrifying microorganisms to NO2– and subsequently to NO3– which diffuses out of the sediment (Thamdrup and Dalsgaard, 2008; Libes, 2009).
The inorganic nitrogen fluxes from the incubations including a CWC reef community are markedly different. Firstly, the 2.4 times higher NO3– efflux by the CWC reef community, compared to the sediment, is consistent with its higher O2 flux/consumption. The significant production of NH4+ by the CWC reef community indicates that the NH4+ typically produced by the reef fauna (Wright, 1995), like sponges (Hoffmann et al., 2009; Leys et al., 2017) and Lophelia pertusa (Middelburg et al., 2015), is only partly nitrified, presumably by reef-associated micro-organisms including archaea (Van Bleijswijk et al., 2015). CWC reef communities, in contrast to soft sediment communities, hence increase the NH4+ concentration of the bottom water. This modification of the nitrogen cycle by CWC reef communities is consistent with the observations of elevated NH4+ concentrations in the water column above the CWC mounds at Rockall Bank (Findlay et al., 2014).
The inferred dry-mass-specific NH4+ release rate for living corals in our study (0.29 ± 0.03 mmol NH4+ kg–1 DW d–1) compares favorably with the reported in situ values and ex situ rates of 0.10 – 0.40 mmol NH4+ kg–1 DW d–1 (Khripounoff et al., 2014; Middelburg et al., 2015; Maier et al., 2019). Our results also show that the living CWCs are primarily responsible for the observed NH4+ release, as the dry-mass-specific dead coral framework DIN fluxes are found to be negligible. This is consistent with the planar regression of the O2 flux data, which showed that the dry-mass-specific O2 flux of living corals is >30 times higher than that of dead coral framework.
Conclusion
In conclusion, we show that the O2 flux of CWC reef communities in the North-East Atlantic Ocean is on average ∼5 times higher than that of soft sediments from comparable depths. This implies that also deep CWC reefs, in addition to earlier findings for relatively shallow (<200 m depth) CWC reefs, are hotspots of carbon cycling on continental margins. Moreover, despite a dominance of dead coral framework in the reef community, the living CWCs appeared to be the major driver of this high O2 flux. The first CWC reef community-based DIN fluxes to-date show that the CWC reef community, specifically the living CWCs, alter benthic nitrogen cycling compared to bare sediment, by largely circumventing nitrification and releasing NH4+ directly into the ambient water. This implies that CWC reefs are not only hotspot of carbon cycling, but are also hotspots of nitrogen cycling.
Data Availability Statement
The datasets generated for this study are available on request to the corresponding author.
Author Contributions
DO, GD, FM, ML, LR, and RG designed the study. DO, GD, FM, and LR coordinated the lander deployment and box core sampling. EF and SM ran the on-board incubations and processed samples. All authors contributed to the data analysis and writing of the manuscript.
Funding
This research was supported by the European Union’s Horizon 2020 Research and Innovation Programme under grant agreement no. 678760 (ATLAS). FM and DO were financially supported by the Innovational Research Incentives Scheme of the Netherlands Organisation for Scientific Research (NWO), respectively, under grant agreement nos. 016.161.360 and 864.13.007. This output reflects only the author’s view and the European Union cannot be held responsible for any use that may be made of the information contained therein. The funders had no role in study design, data collection, and analysis, decision to publish, or preparation of the manuscript.
Conflict of Interest
The authors declare that the research was conducted in the absence of any commercial or financial relationships that could be construed as a potential conflict of interest.
Acknowledgments
We gratefully thank Yvo Witte and the skillful crew and technicians on board the RV Pelagia for their support prior and during the field campaign. We would also like to thank Jan Peene for analyzing the nitrogen samples, Peter van Breugel for analyzing the sediment samples, and Pieter van Rijswijk for his help analyzing the framework. We also thank the two reviewers for their constructive comments on the manuscript.
Footnotes
- ^ Cruise report doi: 10.5281/zenodo.1454465.
References
Andersson, J. H., Wijsman, J. W. M., Herman, P. M. J., Middelburg, J. J., Soetaert, K., and Heip, C. (2004). Respiration patterns in the deep ocean. Geophys. Res. Lett. 31:L03304. doi: 10.1029/2003GL018756
Attard, K. M., Glud, R. N., McGinnis, D. F., and Rysgaard, S. (2014). Seasonal rates of benthic primary production in a Greenland fjord measured by aquatic eddy correlation. Limnol. Oceanogr. 59, 1555–1569. doi: 10.4319/lo.2014.59.5.1555
Attard, K. M., Hancke, K., Sejr, M. K., and Glud, R. N. (2016). Benthic primary production and mineralization in a high Arctic fjord: in situ assessments by aquatic eddy covariance. Mar. Ecol. Prog. Ser. 554, 35–50. doi: 10.3354/meps11780
Attard, K. M., Stahl, H., Kamenos, N. A., Turner, G., Burdett, H. L., and Glud, R. N. (2015). Benthic oxygen exchange in a live coralline algal bed and an adjacent sandy habitat: an eddy covariance study. Mar. Ecol. Prog. Ser. 535, 99–115. doi: 10.3354/meps11413
Berg, P., Glud, R. N., Hume, A., Stahl, H., Oguri, K., Meyer, V., et al. (2009). Eddy correlation measurements of oxygen uptake in deep ocean sediments. Limnol. Oceanogr. Methods 7, 576–584. doi: 10.4319/lom.2009.7.576
Berg, P., Roy, H., Janssen, F., Meyer, V., Jorgensen, B. B., Huettel, M., et al. (2003). Oxygen uptake by aquatic sediments measured with a novel non-invasive eddy-correlation technique. Mar. Ecol. Prog. Ser. 261, 75–83. doi: 10.3354/meps261075
Berg, P., Roy, H., and Wiberg, P. L. (2007). Eddy correlation flux measurements: the sediment surface area that contributes to the flux. Limnol. Oceanogr. 52, 1672–1684. doi: 10.4319/lo.2007.52.4.1672
Cathalot, C. C., Van Oevelen, D., Cox, T. J. S., Kutti, T., Lavaleye, M. S. S., Duineveld, G. C. A., et al. (2015). Cold-water coral reefs and adjacent sponge grounds: hotspots of benthic respiration and organic carbon cycling in the deep sea. Front. Mar. Sci. 2:37. doi: 10.3389/fmars.2015.00037
Cyr, F., Van Haren, H., Mienis, F., Duineveld, G. C. A., and Bourgault, D. (2016). On the influence of cold-water coral mound size on flow hydrodynamics, and vice versa. Geophys. Res. Lett. 43, 775–783. doi: 10.1002/2015GL067038
de Haas, H., Mienis, F., Frank, N., Richter, T. O., Steinacher, R., De Stigter, H., et al. (2009). Morphology and sedimentology of (clustered) cold-water coral mounds at the south Rockall Trough margins, NE Atlantic Ocean. Facies 55, 1–26. doi: 10.1007/s10347-008-0157-1
Dodds, L. A., Roberts, J. M., Taylor, A. C., and Marubini, F. (2007). Metabolic tolerance of the cold-water coral Lophelia pertusa (Scleractinia) to temperature and dissolved oxygen change. J. Exp. Mar. Bio. Ecol. 349, 205–214. doi: 10.1016/J.Jembe.2007.05.013
Dorschel, B., Hebbeln, D., Rüggeberg, A., Dullo, W. C., and Freiwald, A. (2005). Growth and erosion of a cold-water coral covered carbonate mound in the Northeast Atlantic during the late Pleistocene and Holocene. Earth Planet. Sci. Lett. 233, 33–44. doi: 10.1016/j.epsl.2005.01.035
Duineveld, G. C. A., Lavaleye, M. S. S., and Berghuis, E. M. (2004). Particle flux and food supply to a seamount cold-water coral community (Galicia Bank, NW Spain). Mar. Ecol. Prog. Ser. 277, 13–23. doi: 10.3354/meps277013
Duineveld, G. C. A., Lavaleye, M. S. S., Bergman, M. J. N., De Stigter, H., and Mienis, F. (2007). Trophic structure of a cold-water coral mound community (Rockall Bank, NE Atlantic) in relation to the near-bottom particle supply and current regime. Bull. Mar. Sci. 81, 449–467.
Findlay, H. S., Hennige, S. J., Wicks, L. C., Navas, J. M., Woodward, E. M. S., and Roberts, J. M. (2014). Fine-scale nutrient and carbonate system dynamics around cold-water coral reefs in the northeast Atlantic. Sci. Rep. 4:3671. doi: 10.1038/srep03671
GEBCO (2013). GEBCO_2013. Available at: http://www.gebco.net/data_and_products/gridded_bathymetry_data/ (accessed October 23, 2018).
Glud, R. N. (2008). Oxygen dynamics of marine sediments. Mar. Biol. Res. 4, 243–289. doi: 10.1080/17451000801888726
Glud, R. N., Berg, P., Hume, A., Batty, P., Blicher, M. E., Lennert, K., et al. (2010). Benthic O2 exchange across hard-bottom substrates quantified by eddy correlation in a sub-Arctic fjord. Mar. Ecol. Prog. Ser. 417, 1–12. doi: 10.3354/meps08795
Glud, R. N., Berg, P., Stahl, H., Hume, A., Larsen, M., Eyre, B. D., et al. (2016). Benthic carbon mineralization and nutrient turnover in a scottish sea loch: an integrative in situ study. Aquat. Geochem. 22, 443–467. doi: 10.1007/s10498-016-9300-8
Henry, L. A., and Roberts, J. M. (2007). Biodiversity and ecological composition of macrobenthos on cold-water coral mounds and adjacent off-mound habitat in the bathyal Porcupine Seabight, NE Atlantic. Deep Res. Part I Oceanogr. Res. Pap. 54, 654–672. doi: 10.1016/j.dsr.2007.01.005
Hoffmann, F., Radax, R., Woebken, D., Holtappels, M., Lavik, G., Rapp, H. T., et al. (2009). Complex nitrogen cycling in the sponge Geodia barretti. Environ. Microbiol. 11, 2228–2243. doi: 10.1111/j.1462-2920.2009.01944.x
Holtappels, M., Glud, R. N., Donis, D., Liu, B., Hume, A., Wenzhöfer, F., et al. (2013). Effects of transient bottom water currents and oxygen concentrations on benthic exchange rates as assessed by eddy correlation measurements. J. Geophys. Res. Ocean 118, 1157–1169. doi: 10.1002/jgrc.20112
Inoue, T., Glud, R. N., Stahl, H., and Hume, A. (2011). Comparison of three different methods for assessing in situ friction velocity: a case study from Loch Etive, Scotland. Limnol. Oceanogr. Methods 9, 275–287. doi: 10.4319/lom.2011.9.275
Jonsson, L. G., Nilsson, P. G., Floruta, F., and Lundälv, T. (2004). Distributional patterns of macro- and megafauna associated with a reef of the cold-water coral Lophelia pertusa on the Swedish west coast. Mar. Ecol. Prog. Ser. 284, 163–171. doi: 10.3354/meps284163
Kenyon, N. H., Akhmetzhanov, A. M., Wheeler, A. J., Van Weering, T. C. E., De Haas, H., and Ivanov, M. K. (2003). Giant carbonate mud mounds in the southern rockall trough. Mar. Geol. 195, 5–30. doi: 10.1016/S0025-3227(02)00680-1
Khripounoff, A., Caprais, J.-C., Le Bruchec, J., Rodier, P., Noel, P., and Cathalot, C. (2014). Deep cold-water coral ecosystems in the Brittany submarine canyons (Northeast Atlantic): hydrodynamics, particle supply, respiration, and carbon cycling. Limnol. Oceanogr. 59, 87–98. doi: 10.4319/lo.2014.59.01.0087
Larsson, A. I., Lundälv, T., and van Oevelen, D. (2013). Skeletal growth, respiration rate and fatty acid composition in the cold-water coral Lophelia pertusa under varying food conditions. Mar. Ecol. Prog. Ser. 483, 169–184. doi: 10.3354/meps10284
Leys, S. P., Kahn, A. S., Fang, J. K. H., Kutti, T., and Bannister, R. J. (2017). Phagocytosis of microbial symbionts balances the carbon and nitrogen budget for the deep-water boreal sponge Geodia barretti. Limnol. Oceanogr. 63, 187–202. doi: 10.1002/lno.10623
Maier, C., De Kluijver, A., Agis, M., Brussaard, C. P. D., Van Duyl, F. C., and Weinbauer, M. G. (2011). Dynamics of nutrients, total organic carbon, prokaryotes and viruses in onboard incubations of cold-water corals. Biogeosciences 8, 2609–2620. doi: 10.5194/bg-8-2609-2011
Maier, S. R., Kutti, T., Bannister, R. J., van Breugel, P., van Rijswijk, P., and van Oevelen, D. (2019). Survival under conditions of variable food availability: resource utilization and storage in the cold-water coral Lophelia pertusa. Limnol. Oceanogr. 0, 1–21. doi: 10.1002/lno.11142
McGinnis, D. F., Cherednichenko, S., Sommer, S., Berg, P., Rovelli, L., Schwarz, R., et al. (2011). Simple, robust eddy correlation amplifier for aquatic dissolved oxygen and hydrogen sulfide flux measurements. Limnol. Oceanogr. Methods 9, 340–347. doi: 10.4319/lom.2011.9.340
McGinnis, D. F., Sommer, S., Lorke, A., Glud, R. N., and Linke, P. (2014). Quantifying tidally driven benthic oxygen exchange across permeable sediments: an aquatic eddy correlation study. J. Geophys. Res. Oceans 119, 6918–6932. doi: 10.1002/2014JC010303
Middelburg, J. J., Mueller, C. E., Veuger, B., Larsson, A. I., Form, A., and van Oevelen, D. (2015). Discovery of symbiotic nitrogen fixation and chemoautotrophy in cold-water corals. Sci. Rep. 5:17962. doi: 10.1038/srep17962
Mienis, F., Bouma, T. J., Witbaard, R., Van Oevelen, D., and Duineveld, G. C. A. (2019). Experimental assessment of the effects of cold-water coral patches on water flow. Mar. Ecol. Prog. Ser. 609, 101–117. doi: 10.3354/meps12815
Mienis, F., de Stigter, H. C., de Haas, H., and van Weering, T. C. E. (2009a). Near-bed particle deposition and resuspension in a cold-water coral mound area at the Southwest Rockall Trough margin, NE Atlantic. Deep Res. Part I Oceanogr. Res. Pap. 56, 1026–1038. doi: 10.1016/j.dsr.2009.01.006
Mienis, F., van der Land, C., de Stigter, H. C., van de Vorstenbosch, M., de Haas, H., Richter, T., et al. (2009b). Sediment accumulation on a cold-water carbonate mound at the Southwest Rockall Trough margin. Mar. Geol. 265, 40–50. doi: 10.1016/j.margeo.2009.06.014
Mienis, F., van Weering, T., de Haas, H., de Stigter, H., Huvenne, V., and Wheeler, A. (2006). Carbonate mound development at the SW Rockall Trough margin based on high resolution TOBI and seismic recording. Mar. Geol. 233, 1–19. doi: 10.1016/j.margeo.2006.08.003
Mohn, C., Rengstorf, A., White, M., Duineveld, G. C. A., Mienis, F., Soetaert, K., et al. (2014). Linking benthic hydrodynamics and cold-water coral occurrences: a high-resolution model study at three cold-water coral provinces in the NE Atlantic. Prog. Oceanogr. 122, 92–104. doi: 10.1016/j.pocean.2013.12.003
Orejas, C., Ferrier-Pagès, C., Reynaud, S., Tsounis, G., Allemand, D., and Gili, J. M. (2011). Experimental comparison of skeletal growth rates in the cold-water coral Madrepora oculata Linnaeus, 1758 and three tropical scleractinian corals. J. Exp. Mar. Bio. Ecol. 405, 1–5. doi: 10.1016/j.jembe.2011.05.008
Purser, A., Larsson, A. I., Thomsen, L., and van Oevelen, D. (2010). The influence of flow velocity and food concentration on Lophelia pertusa (Scleractinia) zooplankton capture rates. J. Exp. Mar. Bio. Ecol. 395, 55–62. doi: 10.1016/j.jembe.2010.08.013
R Development Core team (2018). R: A Language and Environment for Statistical Computing. Vienna: R Core team.
Rengstorf, A. M., Mohn, C., Brown, C., Wisz, M. S., and Grehan, A. J. (2014). Predicting the distribution of deep-sea vulnerable marine ecosystems using high-resolution data: considerations and novel approaches. Deep Res. Part I Oceanogr. Res. Pap. 93, 72–82. doi: 10.1016/j.dsr.2014.07.007
Roberts, J. M., Wheeler, A. J., and Freiwald, A. (2006). Reefs of the deep: the biology and geology of cold-water coral ecosystems. Science 312, 543–547. doi: 10.1126/science.1119861
Rovelli, L., Attard, K. M., Bryant, L. D., Flögel, S., Stahl, H., Roberts, J. M., et al. (2015). Benthic O2 uptake of two cold-water coral communities estimated with the non-invasive eddy correlation technique. Mar. Ecol. Prog. Ser. 525, 97–104. doi: 10.3354/meps11211
Soetaert, K. (2017). plot3D: Plotting Multi-Dimensional Data. Available at: https://cran.r-project.org/package=plot3D (accessed November 08, 2018).
Soetaert, K., Petzoldt, T., and Meysman, F. (2016). marelac: Tools for Aquatic Sciences. R Package Version 2.1.6.
Thamdrup, B., and Dalsgaard, T. (2008). “Nitrogen cycling in sediments,” in Microbial Ecology of the Oceans, ed. D. L. Kirchman (Hoboken, NJ: John Wiley & Sons, Inc.), 527–567.
Van Bleijswijk, J. D. L., Whalen, C., Duineveld, G. C. A., Lavaleye, M. S. S., Witte, H. J., and Mienis, F. (2015). Microbial assemblages on a cold-water coral mound at the SE Rockall Bank (NE Atlantic): interactions with hydrography and topography. Biogeosciences 12, 4483–4496. doi: 10.5194/bg-12-4483-2015
Van Haren, H., Mienis, F., Duineveld, G. C. A., and Lavaleye, M. S. S. (2014). High-resolution temperature observations of a trapped nonlinear diurnal tide influencing cold-water corals on the Logachev mounds. Prog. Oceanogr. 125, 16–25. doi: 10.1016/j.pocean.2014.04.021
van Oevelen, D., Duineveld, G. C. A., Lavaleye, M. S. S., Mienis, F., Soetaert, K., and Heip, C. H. R. (2009). The cold-water coral community as hotspot of carbon cycling on continental margins: a food-web analysis from Rockall Bank (northeast Atlantic). Limnol. Oceanogr. 54, 1829–1844. doi: 10.4319/lo.2009.54.6.1829
Van Soest, R. W. M., and Lavaleye, M. S. S. (2005). Diversity and abundance of sponges in bathyal coral reefs of Rockall Bank, NE Atlantic, from boxcore samples Published in collaboration with the University of Bergen and the Institute of Marine Research, Norway, and the Marine Biological Laboratory, University of Copenhagen, Denmark. Mar. Biol. Res. 1, 338–349. doi: 10.1080/17451000500380322
Van Weering, T. C. E., De Haas, H., De Stigter, H. C., Lykke-Andersen, H., and Kouvaev, I. (2003). Structure and development of giant carbonate mounds at the SW and SE Rockall Trough margins, NE Atlantic Ocean. Mar. Geol. 198, 67–81. doi: 10.1016/S0025-3227(03)00095-1
Wehrmann, L. M., Knab, N. J., Pirlet, H., Unnithan, V., Wild, C., and Ferdelman, T. G. (2009). Carbon mineralization and carbonate preservation in modern cold-water coral reef sediments on the Norwegian shelf. Biogeosciences 6, 663–680. doi: 10.5194/bg-6-663-2009
Weiss, R. F. (1970). The solubility of nitrogen, oxygen and argon in water and seawater. Deep Sea Res 17, 721–735. doi: 10.1016/0011-7471(70)90037-9
White, M., Wolff, G. A., Lundälv, T., Guihen, D., Kiriakoulakis, K., Lavaleye, M. S. S., et al. (2012). Cold-water coral ecosystem (Tisler Reef, Norwegian shelf) may be a hotspot for carbon cycling. Mar. Ecol. Prog. Ser. 465, 11–23. doi: 10.3354/meps09888
Keywords: cold-water coral, biogeochemistry, benthic respiration, nitrogen cycling, carbon cycling
Citation: de Froe E, Rovelli L, Glud RN, Maier SR, Duineveld G, Mienis F, Lavaleye M and van Oevelen D (2019) Benthic Oxygen and Nitrogen Exchange on a Cold-Water Coral Reef in the North-East Atlantic Ocean. Front. Mar. Sci. 6:665. doi: 10.3389/fmars.2019.00665
Received: 04 July 2019; Accepted: 10 October 2019;
Published: 25 October 2019.
Edited by:
J. Murray Roberts, The University of Edinburgh, United KingdomReviewed by:
Paul Snelgrove, Memorial University of Newfoundland, CanadaIan David Tuck, National Institute of Water and Atmospheric Research (NIWA), New Zealand
Copyright © 2019 de Froe, Rovelli, Glud, Maier, Duineveld, Mienis, Lavaleye and van Oevelen. This is an open-access article distributed under the terms of the Creative Commons Attribution License (CC BY). The use, distribution or reproduction in other forums is permitted, provided the original author(s) and the copyright owner(s) are credited and that the original publication in this journal is cited, in accordance with accepted academic practice. No use, distribution or reproduction is permitted which does not comply with these terms.
*Correspondence: Evert de Froe, ZXZlcnQuZGUuZnJvZUBuaW96Lm5s
†Present address: Lorenzo Rovelli, Institute for Environmental Sciences, University of Koblenz-Landau, Landau, Germany