 Jonas E. Vasconcelos-Filho1,2
 Felix S. L. Thomsen3
 Borko Stosic1,4Antonio C. D. Antonino5Daniel A. Duarte5Richard J. Heck6
 Rosangela P. T. Lessa7Francisco M. Santana8
 Beatrice P. Ferreira2
 Paulo J. Duarte-Neto1,4*
- 1Graduate Program in Biometry and Applied Statistics, Federal Rural University of Pernambuco, Recife, Brazil
- 2Department of Oceanography, Federal University of Pernambuco, Recife, Brazil
- 3Department of Electrical and Computer Engineering, National University of the South, Buenos Aires, Argentina
- 4Department of Statistics and Informatics, Federal Rural University of Pernambuco, Recife, Brazil
- 5Department of Nuclear Energy, Federal University of Pernambuco, Recife, Brazil
- 6School of Environmental Sciences, University of Guelph, Guelph, ON, Canada
- 7Department of Fisheries and Aquaculture, Federal Rural University of Pernambuco, Recife, Brazil
- 8Academic Unit of Serra Talhada, Federal Rural University of Pernambuco, Recife, Brazil
In this paper, we aim to provide optimal parameters for micro-computed tomography scans of fish otoliths. We tested fifteen different combinations to sagittae. The images were scaled to Hounsfield units, and segmented in two distinct volumes-of-interest (external and internal). The strategy we applied, for identifying optimum scan settings for otoliths, included analyses of the sinogram, the distribution of the Hounsfield units and the signal-to-noise ratio. Based on these tests, the optimum sets of parameters for the acquisition of tomographic images of sagittal otoilths were 80 kV, 220 μA, and 0.5 mm aluminum filter. The method allowed 3D shape analysis, internal and external density distribution, layer-by-layer density segmentation, and a potential objective method to count growth rings in otoliths. It was possible to compare mean densities between species, and we observed a significant difference among them. In addition, there are ontogenic changes, which could be increasing or decreasing the density. In this study, we applied tomography for several otolith analysis, that could be of great interest for future studies in diverse areas that use otoliths as the basic structure of analysis, or represents a new research line called eco-densitometry of otoliths, where tomography could be applied to explore the density within an ecological perspective.
1. Introduction
Over recent years, x-ray computed tomography (CT) has evolved from an exclusive tool of medicine into a widely accepted technique for analyzing the internal structure of objects in a non-destructive way (Schoepf and Costello, 2004; Budoff and Shinbane, 2016; Jalaguier-Coudray et al., 2016). The ability to quantify the distribution of the internal radiodensity of samples has found applications in many fields, including material engineering (Velichko et al., 2007), biology (including in vivo research) (Postnov et al., 2002, 2003; Fürst et al., 2008; Lowe et al., 2013), soil science (Taina et al., 2008), and archeology (Noever et al., 2015).
A micro-computed tomography (micro-CT) scan involves digitally reconstructing a set of projections formed by the transmitted x-ray beam through the sample (Kak and Slaney, 2001). These projections are two-dimensional images with micrometric pixel resolution, and the gray-scale of the pixels reflects the mean of the attenuation coefficient of the material, caused by the scattering and/or absorption of photons due to interactions with the object (Grodstein, 1957). Therefore, materials with greater density generally present greater attenuation and the representative pixel is closer to white, by convention.
The instrumental parameters, notably x-ray tube voltage (kV), current (μA) and beam filtering are fundamental for proper image acquisition. In conventional tomography, during the photons production, the X-ray beam contains different energy values. This spectrum of values is called poly-energetic beam and this energy variation leads to an error in the attenuation coefficients. Then, filters are used to reduce this error, blocking the emission of photons of less energy. Low voltages generate low energy photons, which may not penetrate the object, while high voltages result in images with low contrast. Electric current controls the number of photons produced, while an increased number of photons produces an enormous amount of information catches by a detector. Thus, finding an optimal combination of these parameters is a process required for each type of structure (Kak and Slaney, 2001; Hsieh, 2009).
Computed tomography is one of the emerging techniques with perhaps the greatest potential for the study of fish otoliths (Starrs et al., 2014), which are calcified structures found in the inner ear of bony fish, responsible for hearing and balance (Popper and Fay, 1993). These structures are used in studies regarding age, migration, population structure, phylogeny, feeding ecology, and life histories, constituting an important tool in diverse fields of ichthyology and fishery science (Panfili et al., 2002; Duarte-Neto et al., 2008; Green et al., 2009). The pioneering approach presented three-dimensional (3D) images of the otoliths from the Atlantic Cod (Gadus morhua), by Hamrin et al. (1999), demonstrating the promising use of such images in the identification of stocks based on otolith shape. Subsequently, the Fish Ageing by Otolith Shape Analysis (FAbOSA) group have tried to improve the procedure using prolonged exposure, ionic solution and different organic solvents (Arneri et al., 2002), however, they have not found any internal structures.
Several possibilities arised from the potential use of micro-CT analysis for otoliths. Yan et al. (2009) tried to relate otolith CT values to different water pollution degrees. Browning et al. (2012) also used CT to analyze morphology changes as consequence of a stressful condition in Red Drum (Sciaenops ocellatus) and Bignami et al. (2013) to see how ocean acidification influence on Cobia (Rachycentron canadum) otoliths. More recently, Mapp et al. (2016) used a non-conventional tomography, the synchrotron radiation, to render an otolith of Plaice (Pleuronectes platessa) and shown growth rings.
Although the use of CT on otoliths dated back from the late 1990s, general advances in this field are more recent. Those were due to advances in instrumentation, which resulted in a significant improvement in spatial resolution and the capability of generating images with voxel sizes of three μm. This allows observing tiny details, such as annual growth structures with a thickness of about 20 μm (Jenkins, 1990; Waldron and Kerstan, 2001; Santana et al., 2006; Lessa et al., 2008).
Though many of these studies (except for FAbOSA) have succeeded in their objectives, they do not present the methodological aspects behind this new experimental procedure, which may be considered a relatively costly time and expensive technique, mainly the one used by Mapp et al. (2016). In the present work, we describe a protocol developed for the optimal acquisition of conventional micro-CT images of sagittal otoliths, considering different species and a spectrum of CT parameters. We then explored several applicabilities of this new procedure and discuss their advantages.
2. Materials and Methods
2.1. Imaging
Thirty left sagittae from six species were investigated: seven from Acanthocybium solandri (Cuvier, 1829); eight from Acanthurus coeruleus (Bloch and Schneider, 1801); three from Haemulon plumierii (Lacepéde, 1801); three from Opisthonema oglinum (Lesueur, 1818); two from Thunnus albacares (Bonnaterre, 1788); and seven from T. obesus (Lowe, 1839) (Table 1). We choose these species to include a wide range of patterns of habitats, biological parameters, taxonomic groups and age-class.
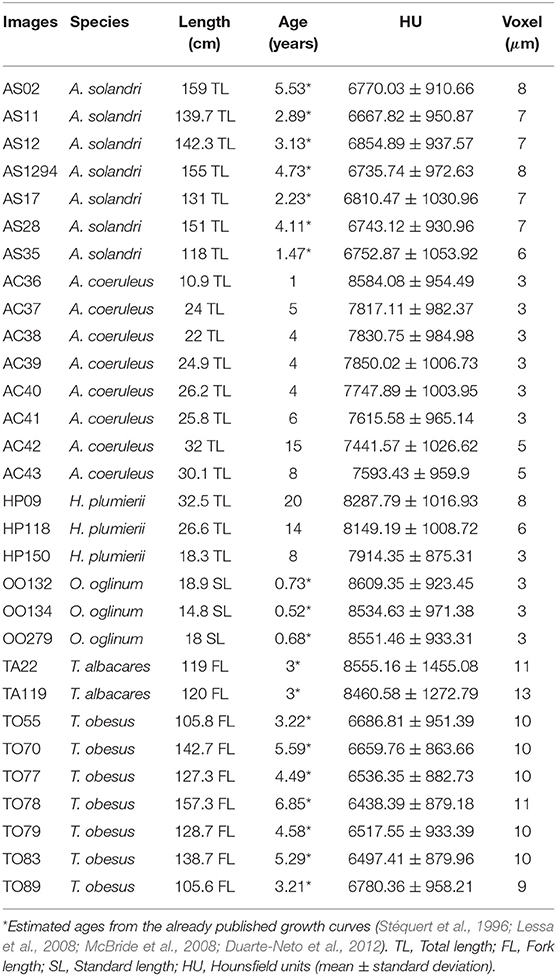
Table 1. Lengths and observed ages of the individuals used in the present study.
The otoliths were embedded in a styrofoam cube (Figures 1A,B) and scanned vertically in a Nikon Metrology model XT H 225 ST scanner (Figure 1C), maintained by the X-ray Computed Tomography Laboratory of the Department of Nuclear Energy, Federal University of Pernambuco, Brazil. The larger axis was placed perpendicular to the support base (Figure 1A) to minimize the Feret diameter and consequently to maximize the resolution of the resulting volume, yielding an isotropic image resolution. This procedure is important to increase the richness of detail and information and, consequently, each image has a voxel size that optimizes the acquisition, respecting the size of the otolith.
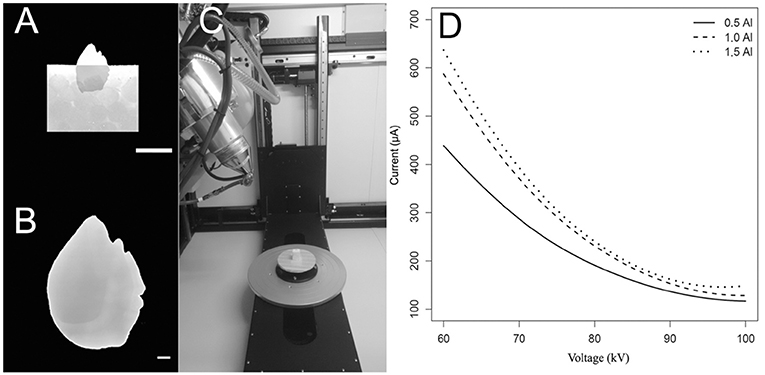
Figure 1. Procedure of tomographic images acquisition of sagittae. (A) Sagittal otolith of Haemulon plumierii vertically positioned in a styrofoam cube. Scalebar = 10 mm. (B) Tomographic image of respective otolith in grayscale after acquisition. Scale bar = 1 mm. (C) Otolith on base support previous scanning. (D) Relationship of voltage and current supported by machine for three filters used (0.5, 1.0, 1.5 mm).
We varied the voltage from 60 to 100 kV in steps of 10 kV, with maximum electrical current based on the voltage vs. current relationship that always reaches 50,000 detected photons in 500 ms (Figure 1D). We executed this process with three aluminum filters of 0.5, 1.0, and 1.5 mm thickness, generating fifteen different scans.
2.2. Calibration, Segmentation, and Analysis
An otolith scanned with different parameter settings, will result in imagery with different apparent attenuation coefficient values. We converted these coefficients to an arbitrary scale called the Hounsfield scale, where its measure is the Hounsfield unit (HU), where the air is zero HU, and distilled water is 1000 HU, according to the linear equation:
where μx and μwater are the linear attenuation coefficients of the material and water, respectively. This transformation is necessary to represent the radiodensity in a dimensionless scale for purposes of comparisons with other studies (Buzug, 2008).
Four specific analyses were performed to diagnose the parameters. First, histograms of the sinograms were computed. The sinogram is a graph that compiles of all projections, taken at different angles in a single image. Thus, the distribution of the detected photons allows to analyze the saturation of the CT detector; only values in the interval of 0.2 and 0.8 were considered as appropriate. Second, the reconstructed volumes have been segmented into two volumes-of-interest. We labeled the voxels as the inner region and exterior shell. We then smoothed and removed disconnected regions from the initial volumes-of-interest using 3D morphological operations and registered the smoothed volumes-of-interest to all remaining scans of the same otolith. At the end of this process, the histograms of the interior and exterior volumes of interest have been computed to analyze the possible overlap between them. Third, we computed statistical measures: the contrast of the signal as the standard deviation of the inner region σin and the magnitude of the noise as the standard deviation on a homogenous void region outside the otolith σout, composed by air or the styrofoam fixture. The signal-to-noise ratio (SNR) compares the object signal to the background noise within an image and reads SNR = σin / σout. A final post-hoc analysis was performed after finding the optimum parameter set and was conducted to determine the feasibility of detecting the expected yearly growth rings.
For the 3D visualization, an R script was first written to extract the contour pixel of the otolith from each 2D projection. Based on these x, y and z coordinates of each pixel, the color scaled reconstruction and iterative 3D visualization of otolith images was carried out using MeshLab software (Cignoni et al., 2008). Descriptive statistics of the image density were estimated and five lines were drawn starting from the nucleus toward the edge, following the reading axes indicated in previous age and growth studies of each species using R language (R Core Team, 2018). Each row was smoothed using a five-point moving average. After the smoothing, the means of these lines were plotted to verify the alternation of densities relative to the formation of the growth rings.
We evaluated the possible correlation between the mean radiodensity of each otolith and the respective fish length, using simple linear correlation analysis, in order to detect ontogenetic trends for each species. The mean values of HU among species were also compared using the Kruskal-Wallis test followed by Dunn's post-hoc. All statistical analyses were performed in R, with a significance level of 0.05.
3. Results and Discussion
3.1. Protocol for the Optimal Acquisition
All sets of parameters resulted in high-quality external imagery with varying tonalities. It was possible to discern external structures such as the sulcus acusticus, ostium, rostrum, cauda and excisura, as well as the fluctuations of the margins and the depth of the sulcus acusticus (Figures 2, 3). Finally, 3D imagery enables analysis of the whole otolith surface, curvature between faces and the deepness of sulcus acusticus.
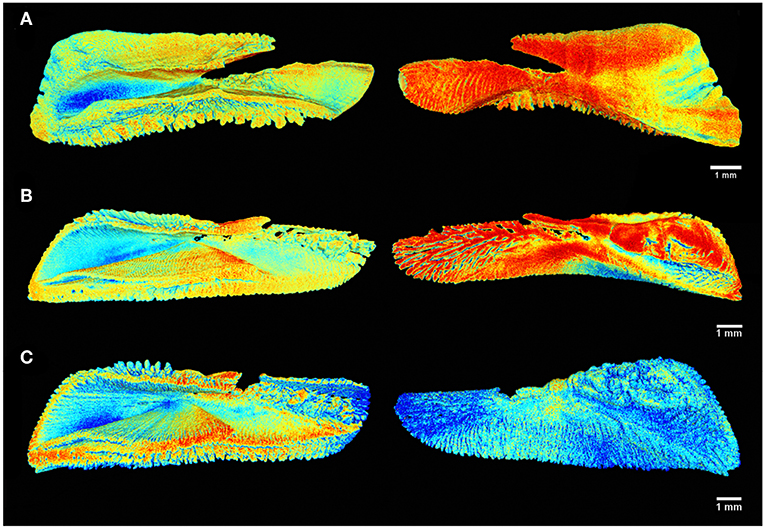
Figure 2. Tomographic imagery of the external and inner face of the sagittal otoliths of (A) Acanthocybium solandri, (B) Thunnus albacares, and (C) Thunnus obesus using Meshlab, where in red are denser regions and in blue the surfaces of lower density values.
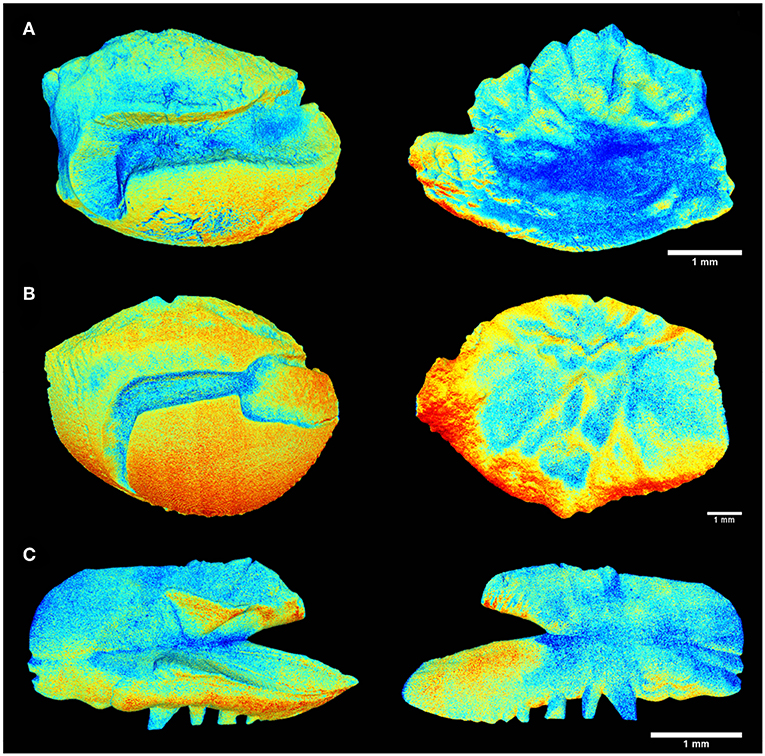
Figure 3. Tomographic imagery of the external and inner face of the sagittal otoliths of (A) Acanthurus coeruleus, (B) Haemulon plumierii, and (C) Opisthonema oglinum using Meshlab, where in red are denser regions and in blue the surfaces of lower density values.
In Figure 4A, the black curves represent the exterior volume and the gray curves represent the interior volume. These curves overlapped in the scans with voltages of 60 kV, 100 kV and filter of 1.5 mm aluminum. Therefore, these parameters were not considered suitable from this point of view. However, analysis of the signal-to-noise ratio showed that the combination of 60 kV and 0.5 mm aluminum filter yields a better relationship between real signal and noise, in contrast with higher voltages or thicker filters (Table 2). Thus, we did not discard the possible use of 60 kV, however, 70 and 80 kV with 0.5 mm filter were considered the most appropriate parameters since they presented good results in all analysis. Both satisfy the Rose criterion (Rose, 1948), that classifies images with SNR > 5 as adequate. The sinogram analysis confirms the quality of the choice of parameters (Figure 4B), i.e., the detector did not saturate for any of the configurations. More precisely, lower voltage yields lower density contrast.
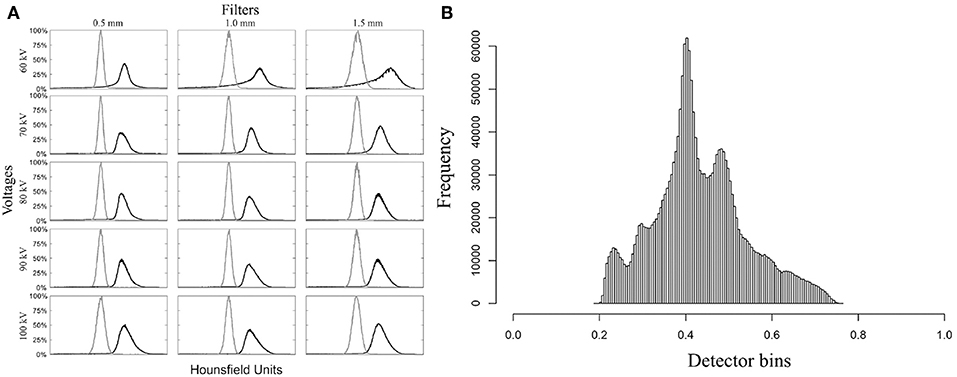
Figure 4. Diagnostic graphs of optimum set micro-CT parameters evaluation. (A) Mosaic of histograms used to segment inner part (gray curve) from external part (black curve). (B) Example of detector response for the parameter set 80 kV with 0.5 mm aluminum filter for Haemulon plumierii.
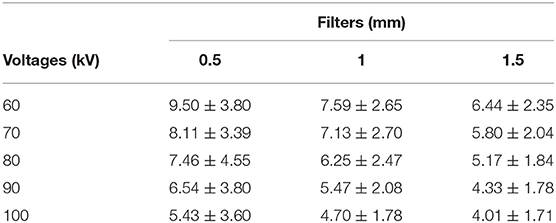
Table 2. Signal-to-noise ratio (mean ± standard deviation) of sagittal otoliths.
Combining these factors, the best images were achieved with medium voltages (70 and 80 kV) and a 0.5 mm aluminum filter. The worst images were achieved when using a 1.5 mm aluminum filter, as it was either not possible to capture information on density or artifacts were formed. The term artifact here refers to any systematic discrepancy between CT numbers in a reconstructed image, and the true attenuation coefficients of the object (Barrett and Keat, 2004).
FAbOSA group, in 2000, also used 80 kV and aluminum filter, but they obtained lower resolution and noisier images, possibly due to an outdated machine and lack of necessary computational power. Consequently, it was not possible to observe the growth rings. More recently, Yan et al. (2009) used a high voltage (130 kV) and low current (30 μA), where higher photon energies penetrated the otolith and no information on density was captured. Mapp et al. (2016) using monochromatic X-ray with 53 kV and no filter, rendered 3D imagery highlighting the growth rings. Although those authors considered that the objective proposed was reached, they reported some artifacts and did not experiment with other tomography settings. To reduce artifacts and improve SNR, therefore, our results suggested inner structures as a function of density are better visualized using the following parameters: 80 kV, 220 μA and 0.5 mm aluminum filter. From this, all the following procedures were conducted on samples imaged using only this configuration. It is important to emphasize that these set parameters are optimal for this micro-CT device model. The current would be unique to our configuration and the voltage and filtering are critical, and would be relevant to any instrument. Also, after calibration to Hounsfield unit scale, it is perfectly possible to compare values between machines, samples material or parameters.
3.2. Exploring Otolith Density Variation
Micro-CT imagery can provide shape, density distribution and structures of the otolith. The present investigation is the first study to present tomography images of entire otoliths with a discernible of internal and external density distributions using a conventional micro-CT. Using the correct set of parameters and appropriate voxel size (resolution), one can correctly represent the mean attenuation coefficient of the otolith material and obtain rich details regarding density.
The linear attenuation coefficients were converted in Hounsfield units (HU), with the minimum value of 2,941.94 for T. obesus and the maximum of 11,839 for T. albacares, but the highest mean radiodensity was 8,609.35 HU for O. oglinum (Table 1). Yan et al. (2009) found an HU between 2,500 and 4,600 for asteriscus and lapillus of the carp otolith, respectively. Mapp et al. (2016) and FAbOSA group (2002) did not present HU values. Nevertheless, other calcified structures are out of this range, e.g., scallop shells (744 HU) (Diez et al., 2013) and ureteral stone (1,350 HU) (Hameed et al., 2013).
The density is one of the relevant properties to the functional role of otoliths, and it is defined by the modifications of the crystalline forms of calcium carbonate (CaCO3) (Schulz-Mirbach et al., 2019). Saccular otoliths are composed by aragonite (Carlström, 1963; Schulz-Mirbach et al., 2019), with a density equal to 2.93 g/cm3. There are other forms with different densities and as well could be found in otolith: calcite, with rhombohedral crystals, which characterizes its density (2.71 g/cm3) and higher stability (Lippmann, 1973); and vaterite (2.56 g/cm3), which presents a hexagonal crystal, less stable and, consequently, more scarce in nature (Northwood and Lewis, 1968). Thus, the chemical proportion between those polymorphs could lead to distinct Hounsfield units, and, then, different values for asteriscus and lapillus. However, the values presented by Yan et al. (2009) seems to be reasonable and consistent for these structures.
The distribution of otolith radiodensity can be visualized using the linear conversion of the attenuation coefficient on RGB scale, in which blue corresponds to lowest density regions and red corresponds to regions of higher density (Figures 2, 3). Externally, the deeper region of the sulcus acusticus exhibits the lowest densities, increasing toward the surface in all species. Gauldie and Nelson (1990) also describe this pattern for other species, suggesting that contact with hair cells and the macula causes a reduction in the calcium deposition rate in this region.
A strong correlation between radiodensity and fish length was observed (Figure 5). However, there is not a unique pattern: a linear and positive correlation for H. plumierii and O. oglinum, a linear and negative correlation for A. coeruleus and T. obesus, and non-linear correlation for O. oglinum, which is considered a fast-growing and short-lived species (Lessa et al., 2008). No correlation was observed for A. solandri. This could be related to the fact that all individuals in this sample have reached the stationary growth phase, or two linear patterns could exist related to different sexes. McBride et al. (2008) suggested a difference in growth between males and females for this species. Unfortunately, we do not have information on sex definition to evaluate the second hypothesis.
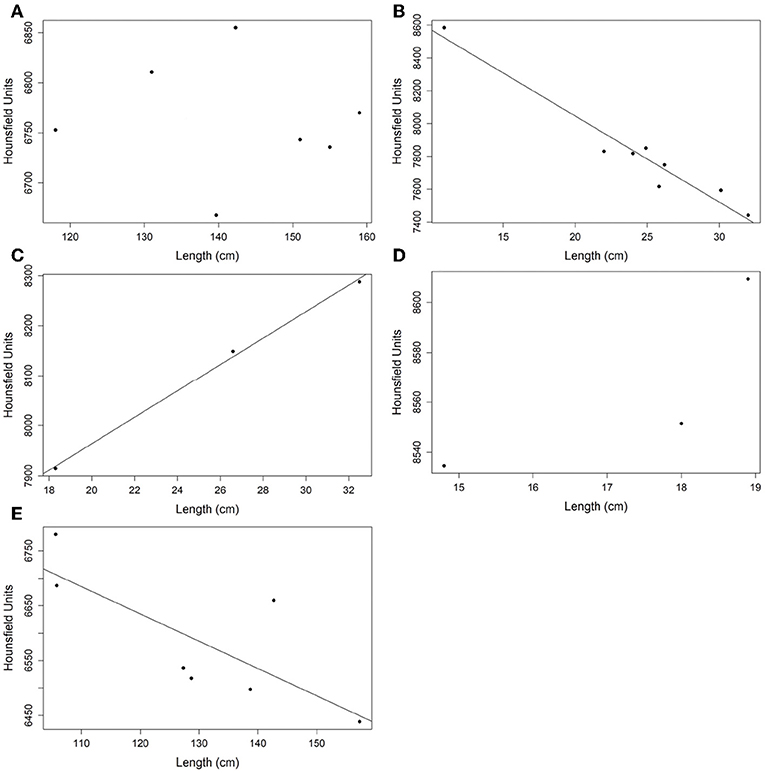
Figure 5. Correlation analysis between the mean radiodensity of otoliths and fish length. (A) Acanthocybium solandri; (B) Acanthurus coeruleus; (C) Haemulon plumierii; (D) Opisthonema oglinum; and (E) Thunnus obesus.
There was a significant difference among mean radiodensities of studied species (Table 3), Dunn's post-hoc pointed out that T. obesus and A. solandri had Hounsfield units different from the other species (Figure 6). Both belong to the Scombridae family but from a different genus. Further, although they also belonged to the same genus Thunnus, the T. albacares otoliths had radiodensities greater than T. obesus, which in turn showed to be very similar to A. solandri (same family). Since these two tuna species are very close species, including their behaviors, we were expecting to find very similar results. Perhaps, the radiodensity of otoliths is not a phylogenetic response. An outlier was observed for A. coeruleus which can be explained by the age difference between this individual (AC36, 1-year-old) and the others (>4 years).
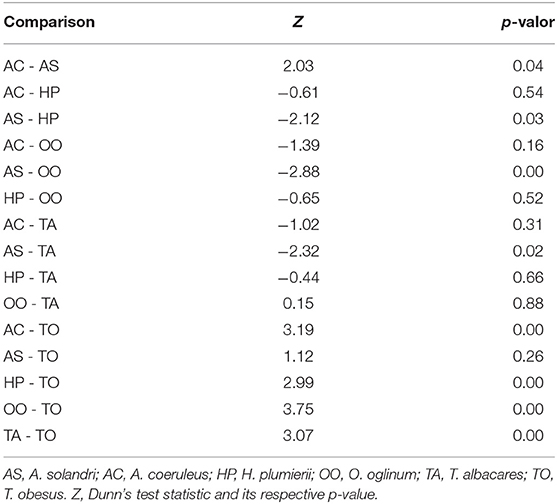
Table 3. Paired comparison of radiodensities of otoliths by species using Kruskal-Wallis (Kruskal-Wallis = 25,403, df = 5, p-value < 0.05) followed by post-hoc Dunn test.
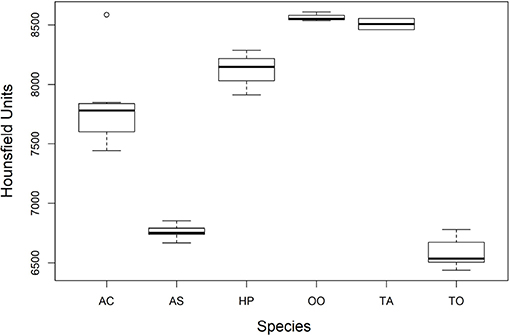
Figure 6. Comparison of the average radiodensities of the otoliths of the studied species. AS, A. solandri; AC, A. coeruleus; HP, H. plumierii; OO, O. oglinum; TA, T. albacares; TO, T. obesus. The elements of the box plot correspond to median, interquartile range (IQR) and upper and lower extremes (± 1.5IQR).
Internally, empty cavities were observed for tuna otoliths (both species) (Figure 7). In some cases, it seems like a tunnel with an entrance but no exit and in other cases, there is no connection to the surface. These empty spaces are likely encased during the calcification process and, probably, are filled by endolymph. In addition, they reduce the otolith mass. However, whether their occurrence represents just a random process, or there is any related functional, or ecological reason needs to be clarified.
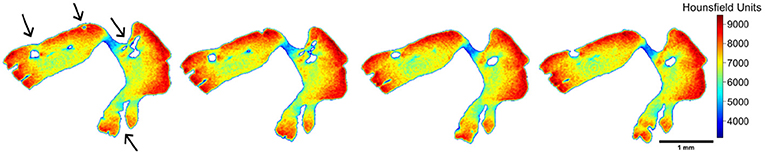
Figure 7. A sequence of images along the z-axis, illustrating the opening and closing of internal spaces found in individuals of Thunnus albacares and T. obesus. The black arrows indicate the regions where these processes occurred.
It was possible to extract a cross-section of the otolith (as usually done in age and growth studies using a metallographic saw) and observe the variation in density from the core toward the edges (Figure 8). The otolith formation consists of an alternation of the concentric bands of L- and D-zones, for mineral- and matrix-rich layers, respectively, which appear light and dark when viewed under transmitted light (Wainwrigth, 1963). Green et al. (2009) defined that the mineral-rich zone is denser than the mineral-deficient region. Thus, in Figure 8 case, as we use transmitted light, the dashed lines indicate the end of dark bands (D-zones), where protein is more abundant and, consequently, less dense (valley).
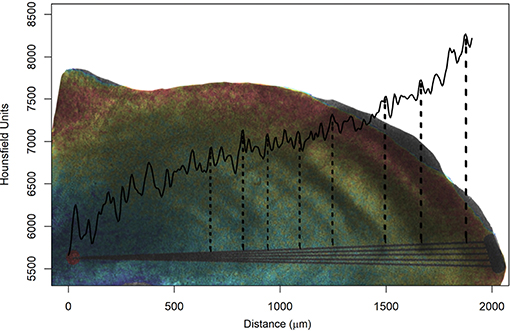
Figure 8. Medium radiodensity (continuous black line) of the five lines drawn from the nucleus (red point) to the edge of the otolith, simulating the reading axis of Acanthurus coeruleus. The figure is composed by overlapping the photograph of the sectioned blade with a metallographic saw and its respective digital representation made by micro-computed tomography, where the highest values of radiodensity are represented in red and the smallest in blue. The vertical and dashed lines correspond to the observed growth rings and indicate their respective Hounsfield unit valleys. This image correspond to individual AC43 (see Table 1) with eight rings counted using a microscope and transmitted light.
The sections closest to the nucleus were selected, where five lines were traced from the nucleus to the edge of the otolith simulating reading axes used in age and growth studies (Figure 8). The same procedure was replicated for all otoliths and, in particular, A. coeruleus (Figure 9) and H. plumierii (Figure 10) showed a decrease in HU values with the aging of the animals. In addition, the three samples AC38, AC39, and AC40, which are the same age, exhibited similar behavior among themselves (Figure 9). The same was found for the two samples of T. obesus (3 years old) and the specimens of T. albacares (3 years old).
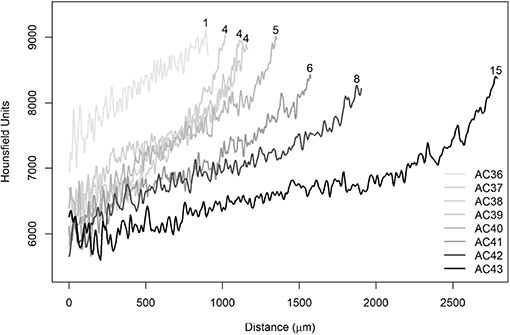
Figure 9. Average radiodensities of the five lines, simulating the reading axis of Acanthurus coeruleus. The numbers at the end of the curves refer to the observed ages (years).
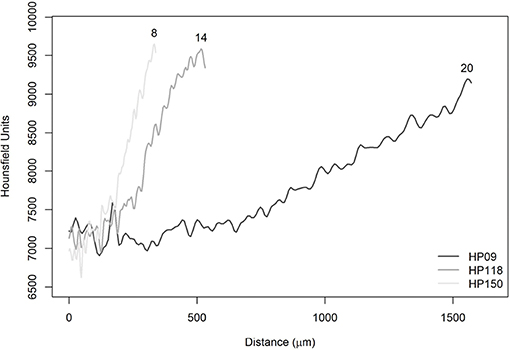
Figure 10. Average radiodensities of the five lines, simulating the reading axis of Haemulon plumierii. The numbers at the end of the curves refer to the observed ages (years).
In Figure 10, it was observed that the curves showed the same behavior in the initial phase between 0 and 200 μm. In this specific section, it is possible to observe the effect of voxel size differences. The HP09 sample had a resolution equal to 8 μm and, therefore, could not capture the variation on the same scale as the other images (HP118 and HP150). Furthermore, it has been found that there is no effect of voxel size on the displacement of the curves since six images of A. coeruleus that have a resolution equal to 3 μm showed the same pattern, as well as those with resolution equal to 5 μm (Figure 9). Actually, the reason for the displacements is attributed to ontogenetic variations.
The three O. oglinum specimens presented the same pattern (Figure 11) with coincident peaks and valleys since their estimated ages were less than 1 year. In addition, the region between 0 and 150 μm showed great variation. This corroborates the study by Lessa et al. (2008), where it was possible to measure the thickness of the micro-increments (daily) and observed the occurrence of two zones with distinct patterns, as shown in Figure 11. In the paper, the authors associated the first zone to marks of life history events at beginning of fish life, such as the opening of the mouth, migration, and settlement. It reinforces the idea that the radiodensity fluctuations observed in the present work could also be associated with the occurrence of growth marks represented by these events.
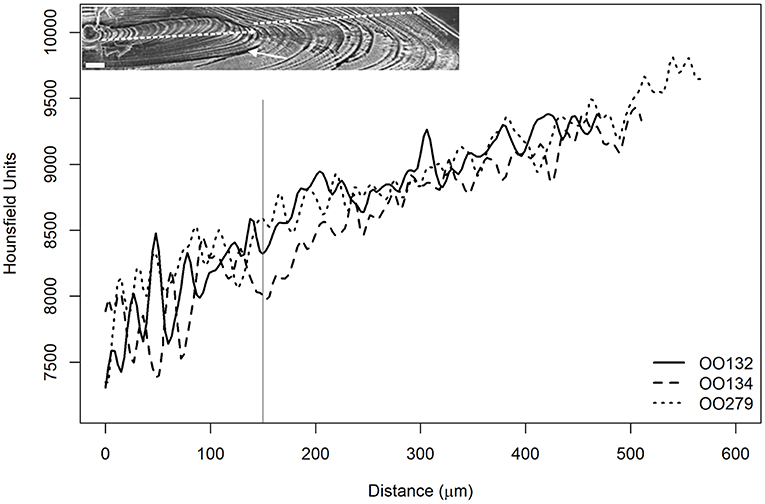
Figure 11. Average radiodensities of the five lines, simulating the reading axis of O. oglinum. The estimated ages for the three samples were less than 1 year and similar behavior was observed for both curves of mean Hounsfield units. The vertical, gray and continuous line indicates the core distance of 150 μm, where the authors of the present study related to the change in growth phase explained by Lessa et al. (2008). The inset depicts a sectioned otolith of O. oglinum photographed with a scanning electron microscope, showing the growth rings. The two dashed lines indicate the two phases described by Lessa et al. (2008).
These results indicate that the number of peaks and valleys is related to the micro or macrostructures, which could be related to age or life history events. Besides, it is important to emphasize that, in the future, this procedure could be made automatic, removing the inter-rater error omnipresent in the conventional approach. Using the difference between them, we could segment layer-by-layer reconstructing thus the previous form, therefore “peeling” the otolith. In addition, Limburg and Elfman (2017) mapped the trace elements and they found composition variations due to differences in crystallization, growth or other factors. Such heterogeneity influence the radiodensity. So, the combination of these methods would provide a better ecological inference of otolith density variations.
During otolith formation, the core (otolith nucleus) is the first part to be formed and has the lowest density due to its chemical composition made primarily by glycoproteins (Sasagawa and Mugiya, 1996) and other organic material (Fermin et al., 1998; Borelli et al., 2001; Pisam et al., 2002). In age and growth studies, knowing the position of the otolith nucleus and type of cut used (cross-sectional or longitudinal) is fundamental.
In the current work, we described a protocol that can be applied for otoliths of a wide range of species, with a detailed yet non-destructive procedure that fully preserves samples for other uses. The determination of voxel size and machine resolution are important first steps that were achieved in our study. With high-resolution instrumentation, it will be truly possible to distinguish features such as overlapping growth bands in the edge of otoliths of older individuals, which often result in longevity underestimation. Finally, in extreme cases, where a unique sample is available, as deep-sea fishes and critically endangered species, non-destructive methods are the best alternative.
Data Availability Statement
The datasets generated for this study are available on request to the corresponding author.
Ethics Statement
Ethical review and approval was not required for the animal study because the samples used in the present study were obtained from existing otoliths collections in laboratories.
Author Contributions
All authors contributed equally to the development of the research project, sections of the text, editing, feedback, and discussion throughout the development of this manuscript. JV-F and DD conducted experimental procedures. JV-F, FT, and PD-N performed the analysis.
Funding
The Brazilian authors were supported by the Brazilian fostering agencies FACEPE (APQ-0178 - 1.08/14), FINEP (0798/10), CAPES (174/2012), and CNPq (312218/2013-3 and 457387/2014-9 MCTI/CNPQ/Universal 14/2014). FT acknowledges the Argentine National Agency for promotion of science and technology ANPCyT (PICT 2017-1731).
Conflict of Interest
The authors declare that the research was conducted in the absence of any commercial or financial relationships that could be construed as a potential conflict of interest.
Acknowledgments
The authors are grateful to Dr. Guelson Batista for the otolith samples from Thunnus albacares, all staff members of the Computed Tomography Laboratory of the Federal University of Pernambuco. The present manuscript is a part of the following Ph.D. thesis (Vasconcelos, 2019).
References
Arneri, E., Bergström, N., Cardinale, M., Claes, E., Clevestam, P., de Clerck, N., et al. (2002). Fish Ageing by Otolith Shape Analysis (FAbOSA): Final Report to the European Commission. FAIR CT97 3402 report.
Barrett, J. F., and Keat, N. (2004). Artifacts in CT: recognition and avoidance 1. Radiographics 24, 1679–1691. doi: 10.1148/rg.246045065
Bignami, S., Enochs, I. C., Manzello, D. P., Sponaugle, S., and Cowen, R. K. (2013). Ocean acidification alters the otoliths of a pantropical fish species with implications for sensory function. Proc. Natl. Acad. Sci. U.S.A. 110, 7366–7370. doi: 10.1073/pnas.1301365110
Borelli, G., Mayer-Gostan, N., De Pontual, H., Boeuf, G., and Payan, P. (2001). Biochemical relationships between endolymph and otolith matrix in the trout (Oncorhynchus mykiss) and turbot (Psetta maxima). Calcif. Tissue Int. 69, 356–364. doi: 10.1007/s00223-001-2016-8
Browning, Z. S., Wilkes, A. A., Moore, E. J., Lancon, T. W., and Clubb, F. J. (2012). The effect of otolith malformation on behavior and cortisol levels in juvenile red drum fish (Sciaenops ocellatus). Comparat. Med. 62, 251–256.
Budoff, M. J., and Shinbane, J. S. (2016). Cardiac CT Imaging: Diagnosis of Cardiovascular Disease. London: Springer International Publishing.
Buzug, T. M. (2008). Computed Tomography: From Photon Statistics to Modern Cone-Beam CT. Berlin: Springer Science & Business Media.
Carlström, D. (1963). A crystallographic study of vertebrate otoliths. Biol. Bull. 125, 441–463. doi: 10.2307/1539358
Cignoni, P., Callieri, M., Corsini, M., Dellepiane, M., Ganovelli, F., and Ranzuglia, G. (2008). “MeshLab: an open-source mesh processing tool,” in Eurographics Italian Chapter Conference, eds V. Scarano, R. De Chiara, and U. Erra (Salerno: The Eurographics Association).
Diez, M. E., Orensanz, J. M., Márquez, F., and Cremonte, F. (2013). Shell damage in the tehuelche scallop aequipecten tehuelchus caused by Polydora rickettsi (polychaeta: Spionidae) infestation. J. Inverteb. Pathol. 114, 107–113. doi: 10.1016/j.jip.2013.07.001
Duarte-Neto, P., Higa, F. M., and Lessa, R. P. (2012). Age and growth estimation of bigeye tuna, Thunnus obesus (teleostei: Scombridae) in the Southwestern Atlantic. Neotrop. Ichthyol. 10, 148–158. doi: 10.1590/S1679-62252012000100014
Duarte-Neto, P., Lessa, R., Stosic, B., and Morize, E. (2008). The use of sagittal otoliths in discriminating stocks of common dolphinfish (Coryphaena hippurus) off Northeastern Brazil using multishape descriptors. ICES J. Mar. Sci. 65, 1144–1152. doi: 10.1093/icesjms/fsn090
Fermin, C., Lychakov, D., Campos, A., Hara, H., Sondag, E., Jones, T., et al. (1998). Otoconia biogenesis, phylogeny, composition and functional attributes. Histol. Histopathol. 13, 1103–1154.
Fürst, A., Meier, D., Michel, S., Schmidlin, A., Held, L., and Laib, A. (2008). Effect of age on bone mineral density and micro architecture in the radius and tibia of horses: an xtreme computed tomographic study. BMC Vet. Res. 4:3. doi: 10.1186/1746-6148-4-3
Gauldie, R., and Nelson, D. (1990). Otolith growth in fishes. Comparat. Biochem. Physiol. A Physiol. 97, 119–135. doi: 10.1016/0300-9629(90)90159-P
Green, B. S., Mapstone, B. D., Carlos, G., and Begg, G. A., (eds.). (2009). “Introduction to otoliths and fisheries in the tropics,” in Tropical Fish Otoliths: Information for Assessment, Management and Ecology (Springer Science & Business Media), 1–22. doi: 10.1007/978-1-4020-5775-5_1
Grodstein, G. W. (1957). X-ray Attenuation Coefficients From 10 kev to 100 mev. Technical report, DTIC Document.
Hameed, D. A., Elgammal, M. A., ElGanainy, E. O., Hageb, A., Mohammed, K., El-Taher, A. M., et al. (2013). Comparing non contrast computerized tomography criteria versus dual x-ray absorptiometry as predictors of radio-opaque upper urinary tract stone fragmentation after electromagnetic shockwave lithotripsy. Urolithiasis 41, 511–515. doi: 10.1007/s00240-013-0596-1
Hamrin, S., Arneri, E., Doering-Arjes, P., Mosegaard, H., Patwardhan, A., Sasov, A., et al. (1999). A new method for three-dimensional otolith analysis. J. Fish Biol. 54, 223–225. doi: 10.1111/j.1095-8649.1999.tb00627.x
Hsieh, J. (2009). Computed Tomography: Principles, Design, Artifacts, and Recent Advances. Bellingham, WA: SPIE.
Jalaguier-Coudray, A., Delarbre, B., Brenot-Rossi, I., Houvenaeghel, G., Villard-Mahjoub, R., Viens, P., et al. (2016). Contribution of FDG PET/CT for the optimization of the management of additional lesions detected on local staging breast MRI. Am. J. Roentgenol. 206, 891–900. doi: 10.2214/AJR.15.14656
Jenkins, G. (1990). Age, growth rate, and growth trajectory determined from otolith microstructure of Southern bluefin tuna Thunnus maccoyii larvae. Mar. Ecol. Prog. Ser. 63, 93–104. doi: 10.3354/meps063093
Kak, A., and Slaney, M. (2001). Principles of Computerized Tomographic Imaging. Philadelphia, PA: Society for Industrial and Applied Mathematics.
Lessa, R., Duarte-Neto, P., Morize, E., and Maciel, R. (2008). Otolith microstructure analysis with OTC validation confirms age overestimation in Atlantic thread herring Opisthonema oglinum from North-Eastern Brazil. J. Fish Biol. 73, 1690–1700. doi: 10.1111/j.1095-8649.2008.02043.x
Limburg, K. E., and Elfman, M. (2017). Insights from two-dimensional mapping of otolith chemistry. J. Fish Biol. 90, 480–491. doi: 10.1111/jfb.13048
Lippmann, F., (ed.). (1973). “Crystal chemistry of sedimentary carbonate minerals,” in Sedimentary Carbonate Minerals (Springer), 5–96.
Lowe, T., Garwood, R. J., Simonsen, T. J., Bradley, R. S., and Withers, P. J. (2013). Metamorphosis revealed: time-lapse three-dimensional imaging inside a living chrysalis. J. R. Soc. Interf. 10:20130304. doi: 10.1098/rsif.2013.0304
Mapp, J., Fisher, M., Atwood, R., Bell, G., Greco, M., Songer, S., et al. (2016). Three-dimensional rendering of otolith growth using phase contrast synchrotron tomography. J. Fish Biol. 88, 2075–2080. doi: 10.1111/jfb.12949
McBride, R. S., Richardson, A. K., and Maki, K. L. (2008). Age, growth, and mortality of wahoo, Acanthocybium solandri, from the Atlantic coast of Florida and the Bahamas. Mar. Freshw. Res. 59, 799–807. doi: 10.1071/MF08021
Noever, C., Keiler, J., and Glenner, H. (2015). First 3D reconstruction of the rhizocephalan root system using MicroCT. J. Sea Res. 113, 58–64. doi: 10.1016/j.seares.2015.08.002
Northwood, D. O., and Lewis, D. (1968). Transformation of vaterite to calcite during grinding. Am. Mineral. 53, 2089–2092.
Panfili, J., De Pontual, H., Troadec, H., and Wrigh, P. J. (2002). Manual of Fish Sclerochronology. Brest: IFREMER-IRD.
Pisam, M., Jammet, C., and Laurent, D. (2002). First steps of otolith formation of the zebrafish: role of glycogen? Cell Tissue Res. 310, 163–168. doi: 10.1007/s00441-002-0622-z
Popper, A. N., and Fay, R. R. (1993). Sound detection and processing by fish: critical review and major research questions (part 1 of 2). Brain Behav. Evol. 41, 14–25. doi: 10.1159/000113821
Postnov, A., De Clerck, N., Sasov, A., and Van Dyck, D. (2002). 3D in-vivo x-ray microtomography of living snails. J. Microsc. 205, 201–204. doi: 10.1046/j.0022-2720.2001.00986.x
Postnov, A., Vinogradov, A., Van Dyck, D., Saveliev, S., and De Clerck, N. (2003). Quantitative analysis of bone mineral content by x-ray microtomography. Physiol. Meas. 24:165. doi: 10.1088/0967-3334/24/1/312
R Core Team (2018). R: A Language and Environment for Statistical Computing. Vienna: R Foundation for Statistical Computing.
Rose, A. (1948). The sensitivity performance of the human eye on an absolute scale. JOSA 38, 196–208. doi: 10.1364/JOSA.38.000196
Santana, F., Morize, E., and Lessa, R. (2006). Age and growth of the spotted goatfish, Pseudupeneus maculatus (bloch, 1793) in Brazil, validated through marginal increment and oxytetracycline dyes in the sagittae. J. Appl. Ichthyol. 22, 132–137. doi: 10.1111/j.1439-0426.2006.00724.x
Sasagawa, T., and Mugiya, Y. (1996). Biochemical properties of water-soluble otolith proteins and the immunobiochemical detection of the proteins in serum and various tissues in the tilapia Oreochromis niloticus. Fish. Sci. 62, 970–976. doi: 10.2331/fishsci.62.970
Schoepf, U. J., and Costello, P. (2004). CT angiography for diagnosis of pulmonary embolism: state of the art 1. Radiology 230, 329–337. doi: 10.1148/radiol.2302021489
Schulz-Mirbach, T., Ladich, F., Plath, M., and Heß, M. (2019). Enigmatic ear stones: what we know about the functional role and evolution of fish otoliths. Biol. Rev. 94, 457–482. doi: 10.1111/brv.12463
Starrs, D., Ebner, B. C., and Fulton, C. J. (2014). All in the ears: unlocking the early life history biology and spatial ecology of fishes. Biol. Rev. 91, 86–105. doi: 10.1111/brv.12162
Stéquert, B., Panfili, J., and Dean, J. (1996). Age and growth of yellowfin tuna, Thunnus albacares, from the Western Indian Ocean, based on otolith microstructure. Oceanogr. Literat. Rev. 12:1275.
Taina, I. A., Heck, R. J., and Elliot, T. R. (2008). Application of x-ray computed tomography to soil science: a literature review. Can. J. Soil Sci. 88, 1–19. doi: 10.4141/CJSS06027
Vasconcelos, J. (2019). Tomografia computadorizada aplicada a otólitos em 3D. (Ph.D. thesis). Federal Rural University of Pernambuco, Recife, Brazil.
Velichko, A., Holzapfel, C., and Mücklich, F. (2007). 3d characterization of graphite morphologies in cast iron. Adv. Eng. Mater. 9, 39–45. doi: 10.1002/adem.200600175
Wainwrigth, S. A. (1963). Skeletal organization in the coral, Pocillopora damicornis. J. Cell Sci. 3, 169–183.
Waldron, M. E., and Kerstan, M. (2001). Age validation in horse mackerel (Trachurus trachurus) otoliths. ICES J. Mar. Sci. 58, 806–813. doi: 10.1006/jmsc.2001.1071
Keywords: eco-densitometry, fishery biology, Hounsfield units, Meshlab, radiodensity, 3D otoliths
Citation: Vasconcelos-Filho JE, Thomsen FSL, Stosic B, Antonino ACD, Duarte DA, Heck RJ, Lessa RPT, Santana FM, Ferreira BP and Duarte-Neto PJ (2019) Peeling the Otolith of Fish: Optimal Parameterization for Micro-CT Scanning. Front. Mar. Sci. 6:728. doi: 10.3389/fmars.2019.00728
Received: 16 August 2019; Accepted: 08 November 2019;
Published: 26 November 2019.
Edited by:
Alejandra Vanina Volpedo, University of Buenos Aires, ArgentinaReviewed by:
Tanja Schulz-Mirbach, Ludwig Maximilian University of Munich, GermanyRalf Anken, Institute of Aerospace Medicine, German Aerospace Center (DLR), Germany
Copyright © 2019 Vasconcelos-Filho, Thomsen, Stosic, Antonino, Duarte, Heck, Lessa, Santana, Ferreira and Duarte-Neto. This is an open-access article distributed under the terms of the Creative Commons Attribution License (CC BY). The use, distribution or reproduction in other forums is permitted, provided the original author(s) and the copyright owner(s) are credited and that the original publication in this journal is cited, in accordance with accepted academic practice. No use, distribution or reproduction is permitted which does not comply with these terms.
*Correspondence: Paulo J. Duarte-Neto, cGpkdWFydGVuZXRvQGdtYWlsLmNvbQ==