 Elena Lo Giudice Cappelli
 William E. N. Austin
- 1School of Geography and Sustainable Development, University of St Andrews, St Andrews, United Kingdom
- 2Scottish Association for Marine Science, Scottish Marine Institute, Oban, United Kingdom
Benthic foraminiferal assemblages are the object of numerous studies spanning from (palaeo)environmental reconstructions to biomonitoring; however, the establishment of a procedure to standardize these studies remains a recent achievement. Not all studies based on benthic foraminiferal assemblages adopt the same methodology, which potentially hinders the use and comparison of samples prepared prior to the creation of a standard protocol or, indeed, without the knowledge of it. One of the main issues is to understand and possibly quantify the influence of different size fractions on foraminiferal biodiversity and richness. In this study, we analyzed benthic foraminiferal assemblages from the west coast of Shetland (Scotland), which were deliberately prepared without following the standard procedure, and were instead picked from the size fractions 63–150 μm and >150 μm. Based on assemblage composition, biodiversity indices and multivariate analyses of the data, we assessed the quality and precision of the environmental information that could be extrapolated from these samples. We found that general biodiversity trends remain the same regardless of size fraction, whereas the assemblage internal composition is significantly different between size fractions, with the small fraction retaining a greater degree of environmental sensitivity. We recommend compiling the two sample sets to produce a more holistic and detailed picture of environmental change and generate high-resolution environmental reconstructions. Nevertheless, we conclude that benthic foraminiferal assemblages picked from the large size fraction (>150 μm) still provide useful information on prevailing environmental conditions and remain useful for an overview of environmental change in these coastal settings.
Introduction
In the past few decades, benthic foraminiferal assemblages have been extensively used to reconstruct current and past environmental conditions based on their composition, species diversity and richness, using a range of indices, statistical tests and transfer functions (e.g., Buzas, 1969, 1970; Gibson and Buzas, 1973; Schroeder et al., 1987; Poole et al., 1994; Austin and Kroon, 1996; Lei et al., 2017; Weinkauf and Milker, 2018). The literature is peppered with records discussing the influence of size fraction on benthic foraminiferal analyses and to what extent this may affect environmental reconstructions (Jonkers, 1984; Schroeder et al., 1987; Jennings and Helgadottir, 1994; Knudsen and Austin, 1995; Bouchet et al., 2012; Weinkauf and Milker, 2018). On one hand, studies report that focusing on the larger size fraction only (>150 μm) might result in a loss of information on species richness, biodiversity and species composition compared to studies based on the smaller size fraction (e.g., >63 μm). On the other hand, it is argued that analyzing the smaller size fraction is much more labor intense and requires specialist taxonomic skills, with higher chances of misidentification of specimens and/or a higher proportion of undetermined specimens than obtained from the larger fraction. Recently, a protocol has been designed to standardize the study of benthic foraminiferal assemblages in biomonitoring (Schönfeld et al., 2012), which resulted in the suggestion of the routine use of the >125 μm size fraction, with the recommendation of analyzing the smaller size fraction (63–125 μm) only to cases where the >125 μm fraction is insufficiently informative. Applying this size “threshold” at 125 μm has a twofold effect; first, it allows, where necessary, for smaller species that are absent in the larger size fractions (125–150 μm) to be accounted (Weinkauf and Milker, 2018), thus improving the representation of the entire assemblage. Second, in most cases, it optimizes the time spent at the microscope by avoiding the need to pick and identifying very small specimens of benthic foraminifera, often juvenile and propagule stages, which are common below 125 μm. Therefore, despite this protocol being primarily intended for biomonitoring studies, it can readily be adopted for its consideration of size threshold when benthic foraminiferal assemblages are applied more widely. However, the question remains regarding how best to treat valuable samples that were processed either prior to the establishment of this protocol or without the knowledge of the protocol to enable their use; for example in (palaeo)environmental reconstructions the 125 μm mesh size is by no means standard (Jian et al., 1999; Fontanier et al., 2002; Goineau et al., 2011; Lei et al., 2017).
In this brief report, we use assemblage composition, biodiversity and multivariate analyses of foraminiferal data to compare benthic foraminiferal assemblages from two size fractions 63–150 μm and >150 μm to understand the similarities between the two sample sets and assess what type of environmental information can be extracted from each size fraction. Samples were collected from six fjords (voes) on the west coast of Shetland (Scotland, United Kingdom), providing valuable new information on the biogeography of benthic foraminifera in Scotland, which is currently limited to a handful of studies (e.g., Klitgaard-Kristensen et al., 2002; Murray, 2003a, b; Nørgaard-Pedersen et al., 2006). Additionally, these samples help to shed light on the response of benthic foraminifera to environmental stressors such as organic carbon enrichment in coastal sediments (e.g., Lo Giudice Cappelli et al., 2019).
Materials and Methods
Sampling and Preparation
The MV Moder Dy cruise in west Shetland surveyed six voes in August 2015: Clift Sound, Sand Sound, Olna Firth, Aith Voe, Busta Voe, and Vaila Sound. Marine surface sediments were sampled using a Duncan and Associates Van Veen grab with a sampling area of 0.1 m2; 23 surface samples were obtained by sub-sampling the top layer of each grab (∼1 cm thick) and samples were then stored in a cold-box in sealed plastic bottles. At two sites, MD15-01 and MD15-05, replicate samples were taken (-01A and -01B, -05A and -05B, respectively) to check measurement reproducibility and seafloor heterogeneity [for more detailed information on sample locations and regional setting please refer to Lo Giudice Cappelli et al. (2019)].
For foraminiferal analysis, aliquots of surface sediments were stained with Rose Bengal to allow the identification of living foraminifera. These samples were then wet sieved over a 63 μm mesh, the residues oven-dried at <60°C, weighed and sieved into 63–150 μm and >150 μm size fractions. In an early unpublished study, only the larger size fraction was analyzed, and depending on sample volume, samples were subdivided into a number of splits using a standard splitter and ∼100 specimens were picked and counted. In this study, we built on this unpublished work and analyzed both size fractions, picked at least 300 specimens from each sample and size fraction to ensure statistical significance when discussing benthic foraminiferal assemblages’ diversity and composition. Please note that picking 300 specimens from each size fraction does not equate to picking the same proportion of specimens from each size fraction; the latter would depend on the composition of the sediment sample, namely its percentage of sand, silt, and clays. Our overall aim was to follow the standard protocol described in Schönfeld et al. (2012) in its parts that more generally apply to benthic foraminiferal assemblage studies and thus provide an opportunity for data comparisons. We acknowledge that oven-drying our samples may have had a negative effect on the preservation of more fragile agglutinated species (Scott and Vilks, 1991); however, it has been exclusively adopted in previous studies of Scottish fauna (e.g., Klitgaard-Kristensen et al., 2002; Murray, 2003a, b; Nørgaard-Pedersen et al., 2006).
Benthic Foraminiferal Counts
Foraminiferal counts are “total” (live + dead) because the sampling technique may lead to underrepresentation of “live” foraminifera. Additionally, using total assemblages provides a more integrated picture of population dynamics and thus prevailing (long-term) environmental conditions than focusing only on living fauna which is more sensitive to short-term and seasonal variability (e.g., Conradsen, 1993). When possible, we identified specimens to species level following Austin (1991). However, in a few instances, we combined species under their genus to avoid misrepresentation and/or misidentification of rare species especially from the small size fraction. We also grouped under the name Elphidium excavatum both forma selseyense and forma clavata despite their recognition as genetically and morphologically distinct species (Darling et al., 2016), as we were unable to consistently identify the two species. Relative benthic foraminiferal abundances were calculated for both sample sets.
Biodiversity Indices
The Palaeontological Statistics software package PAST (version 3.16, Hammer et al., 2001) was used to analyze relationships between benthic foraminiferal assemblages through a comparison of diversity indices. To discuss biodiversity, we used the Shannon-Wiener index (H′) calculated as
where n is the total number of specimens in the sample, and ni is the number of specimens of taxon i. Therefore, the Shannon-Wiener index took into account both the number of specimens and the number of taxa, varying from 0 for assemblages with only a single taxon to high values for assemblages with many taxa. We compared biodiversity based on the Shannon-Wiener index with the Simpson (S) index calculated as
which is a measure of the “evenness” of the assemblage ranging from 0 (one taxon dominates the assemblage) to 1 (taxa are equally represented). Additionally, we evaluated species richness based on the Margalef index (M) calculated as
where S is the total number of taxa. Assemblages similarity was also assessed using the Morisita-Horn index (M-H) that calculates the compositional similarity of paired assemblages (same site-different size fraction) based on the relative abundance of each species (Morisita, 1959; Horn, 1966). M-H values range from 0 in paired samples that are completely different to 1 in paired samples that are identical.
Multivariate Analyses
PAST was also used to run multivariate analyses of the two sample sets (small and large size fraction) based on the Bray-Curtis similarity index and non-metric multidimensional scaling (MDS), ANOSIM, Mantel and SIMPER tests. Non-metric MDS (Taguchi and Oono, 2005) was used to illustrate (dis)similarities in the internal composition of benthic foraminiferal assemblages between the two sample sets. Additionally, we compared the MDS solutions for both size fractions after applying Procrustes transformations (translation, scaling, and rotation of the ordinations) to remove all arbitrary differences in the spatial distribution of samples. This means that any observed difference between paired samples that remains after these transformations is true and can be quantified to compare the relative positions of the 23 paired samples (Rohlf and Slice, 1990; Rudemo, 2000). The ANOSIM test was used to discuss similarities between paired samples (same site – different size fraction), where large positive R-values (up to 1) meant significant dissimilarities between assemblages (Clarke, 1993). The Mantel test reflects how taxonomically similar paired samples are, and the resulting R-value is the Pearson’s correlation coefficient ranging from −1 to +1 (Mantel, 1967; Mantel and Valand, 1970). The SIMPER test is a method to assess which taxa are primarily responsible for the observed difference in assemblage composition between sample sets and provides an estimate of the overall average dissimilarity (Clarke, 1993).
Results and Discussion
Assemblages’ Composition
Together, the two sample sets contain 57 taxa of benthic foraminifera, with 46 taxa present in the larger size fraction and 48 in the smaller fraction. In the small size fraction, benthic foraminiferal assemblages are on average composed of 86% hyaline species, 9% agglutinated, and 1% porcelaneous species. In the large size fraction, benthic foraminiferal assemblages comprise on average 69% hyaline, 26% agglutinated, and 1% porcelaneous species, indicating that the proportions of agglutinated species increase while hyaline species decrease from the smaller to the larger size fraction.
Based on relative abundance data, taxa must appear in at least one size fraction of one sample with relative abundances greater than 10% to be scored as abundant, between 5 and 10% as common and below 5% as rare. Additionally, nine taxa are absent in the small size fraction but present in the large fraction: Ammoscalaria runiana, Connemarella rudis, Elphidium crispum, Paromalina, Planorbulina distoma, Quinqueloculina bicornis, Leptohalysis fusiformis, Spirillina vivipara, and Spiroloculina rotunda. However, all these taxa are rare and sparse in the large size fraction, suggesting that their absence in the smaller fraction is probably a matter of chance. The only exception is E. crispum, which is common at one site (MD15-21) while rare and sparse in all other samples. Conversely, ten taxa were absent in the large size fraction, but present in the small size fraction: Astrononion, Bolivina skagerrakensis, Bolivina spathulata, Cornuspira, Epistominella, Fissurina, Globobulimina affinis, Lamarckina haliotidea, Leptohalysis scottii, and Trifarina angulosa. Of these, B. skagerrakensis and Epistominella are common taxa and L. scottii is an abundant species in the small size fraction, highlighting that their absence in the large size fraction cannot be attributed solely to chance. However, L. scottii specimens in the small size fraction are rather long and narrow, and they could have easily fallen through the larger mesh size along their long axis so that their relative abundance calculations in the small size fraction might be biased. The remaining taxa are rare and sparse in the small size fraction meaning that their absence in the large fraction is negligible.
Overall, 12 taxa of benthic foraminifera are deemed abundant (Table 1). Two of these taxa are abundant only in the larger size fraction: Ammonia and Bulimina marginata. Five are abundant only in the smaller size fraction: Buliminella elegantissima, Cassidulina laevigata, Rosalina, L. scottii, and Stainforthia fusiformis, while five are abundant in both size fractions: Cibicidoides, Elphidium excavatum, Elphidium gerthi, Elphidium margaritaceum, and Eggerelloides scaber. Altogether, these 12 taxa account for more than 83% of the total assemblage in the large size fraction and more than 60% in the small size fraction (Table 1), which points to a potentially significant difference in the biodiversity between the two sample sets. Additionally, eleven taxa are identified as common. Nine of these taxa are common only in the small size fraction while rare or absent in the larger one: B. skagerrakensis, Bolivina pseudopunctata, Bolivina variabilis, Buccella frigida, Buccella tenerrima, Cassidulina obtusa, Elphidium albiumbelicatum, Epistominella, and Trochammina. Conversely, Spiroplectammina wrightii is common in the large size fraction, while rare in the small fraction; Haynesina germanica is common in both size fractions. Altogether, these eleven taxa on average make up 16% of the total assemblage in the small size fraction and only 2.5% in the large size fraction. Therefore, common species have a greater impact on the composition of benthic assemblages in the small size fraction than in the large size fraction.
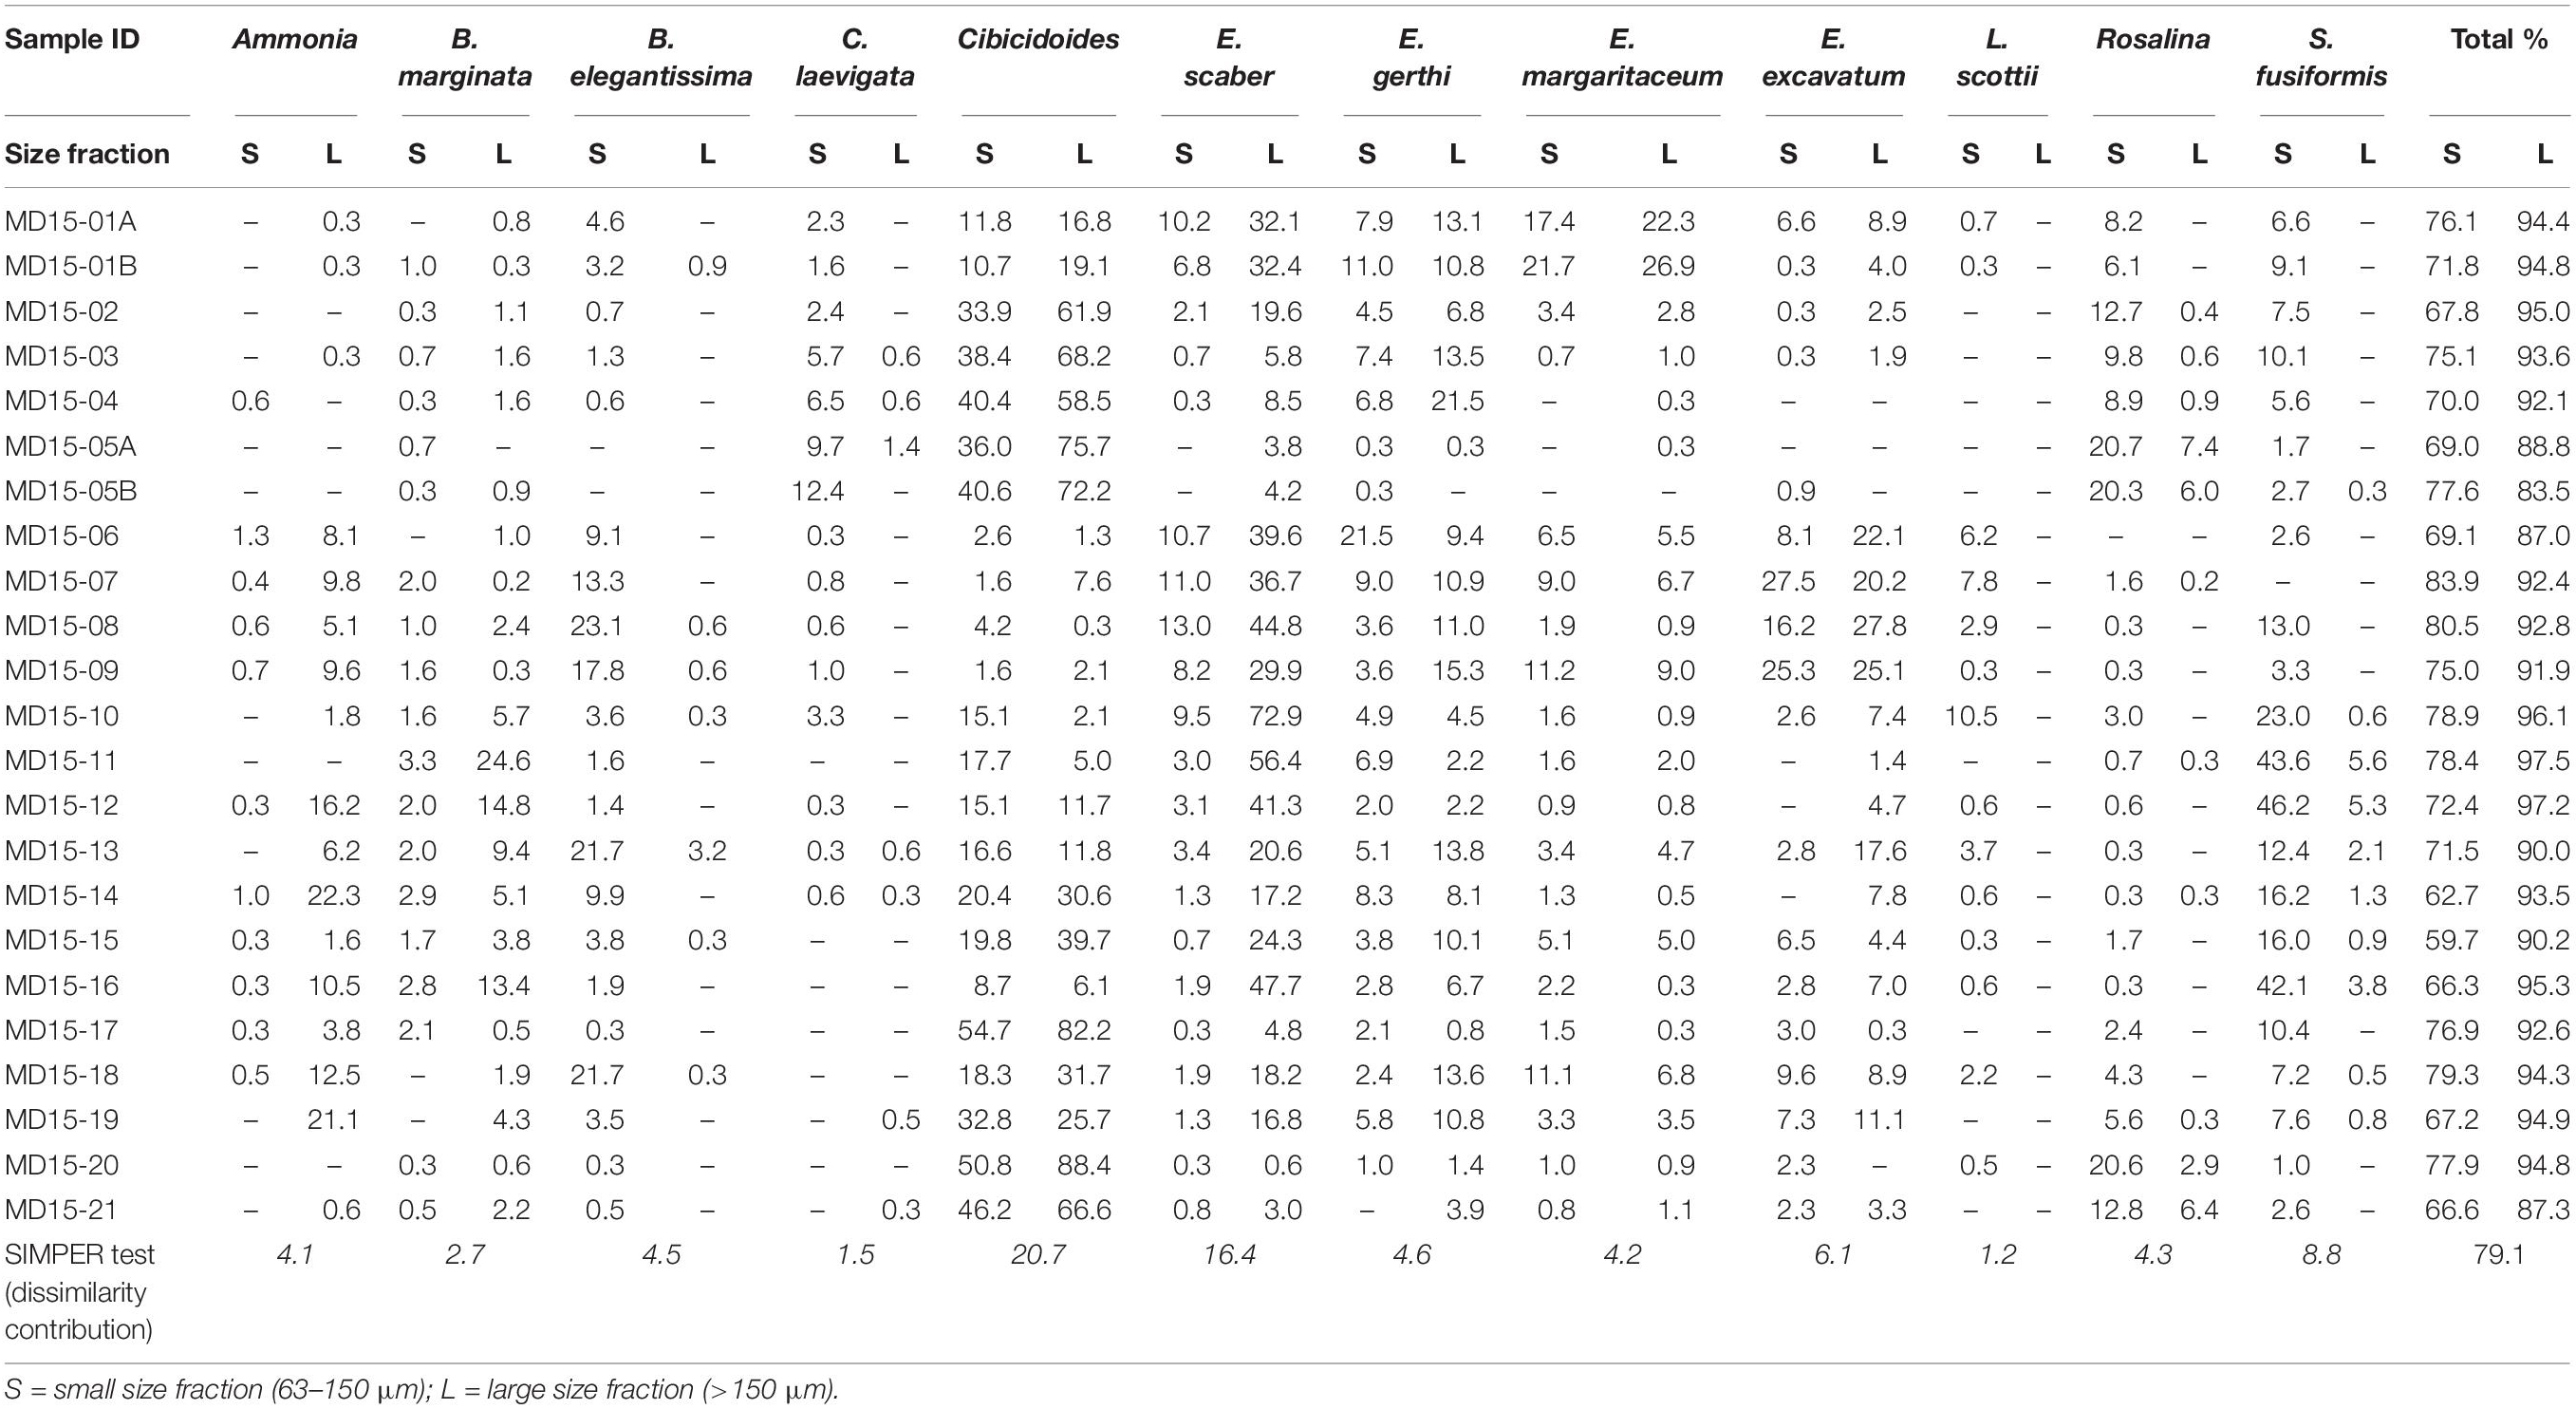
Table 1. Relative abundance of the 12 abundant taxa and, in italic, output of the SIMPER test.
Biodiversity Analyses
Based on the Shannon-Wiener index, biodiversity in benthic foraminiferal assemblages is higher in the smaller than in the larger size fraction (Figure 1A). However, both size fractions show a similar trend with high values in samples MD15-06 to 10 (Sand Sound) and MD15-13 and -14 (Aith Voe), as well as at sites proximal to land like samples MD15-15 (Busta Voe) and MD15-18 and 19 (Vaila Sound). The average value of the Shannon-Wiener index for the small size fraction is H′ = 2.4, ranging from 1.7 to 2.8, while the average value for the large size fraction is H′ = 1.6, varying between 0.6 and 2.4. In the large size fraction, minima correspond to assemblages dominated by one taxon: Cibicidoides accounts for 73% of the total assemblage in MD15-05, ∼82% in MD1-17 and ∼88% MD15-20, whereas E. scaber dominates at station MD15-10 at ∼73%. We further assessed the biodiversity of benthic foraminiferal assemblages using the Simpson index and found a pattern like that obtained with the Shannon-Wiener index (Figure 1B). Based on the Margalef index, species richness is higher in the small size fraction than in the larger one (Figure 1C). The average value of the Margalef index for the small fraction is 4.4, varying between 3.8 and 5.1, while the average value for the large size fraction is 2.7, ranging between 1.9 and 3.7. Two maxima are evident in the large size fraction, which correspond to the only two samples that do not have a clear taxon dominating their assemblages (Figure 1C). The most abundant taxon in these two samples accounts for ∼ 23% of total variability, whereas in other samples the most abundant taxon usually accounts for more than 50% of total variability.
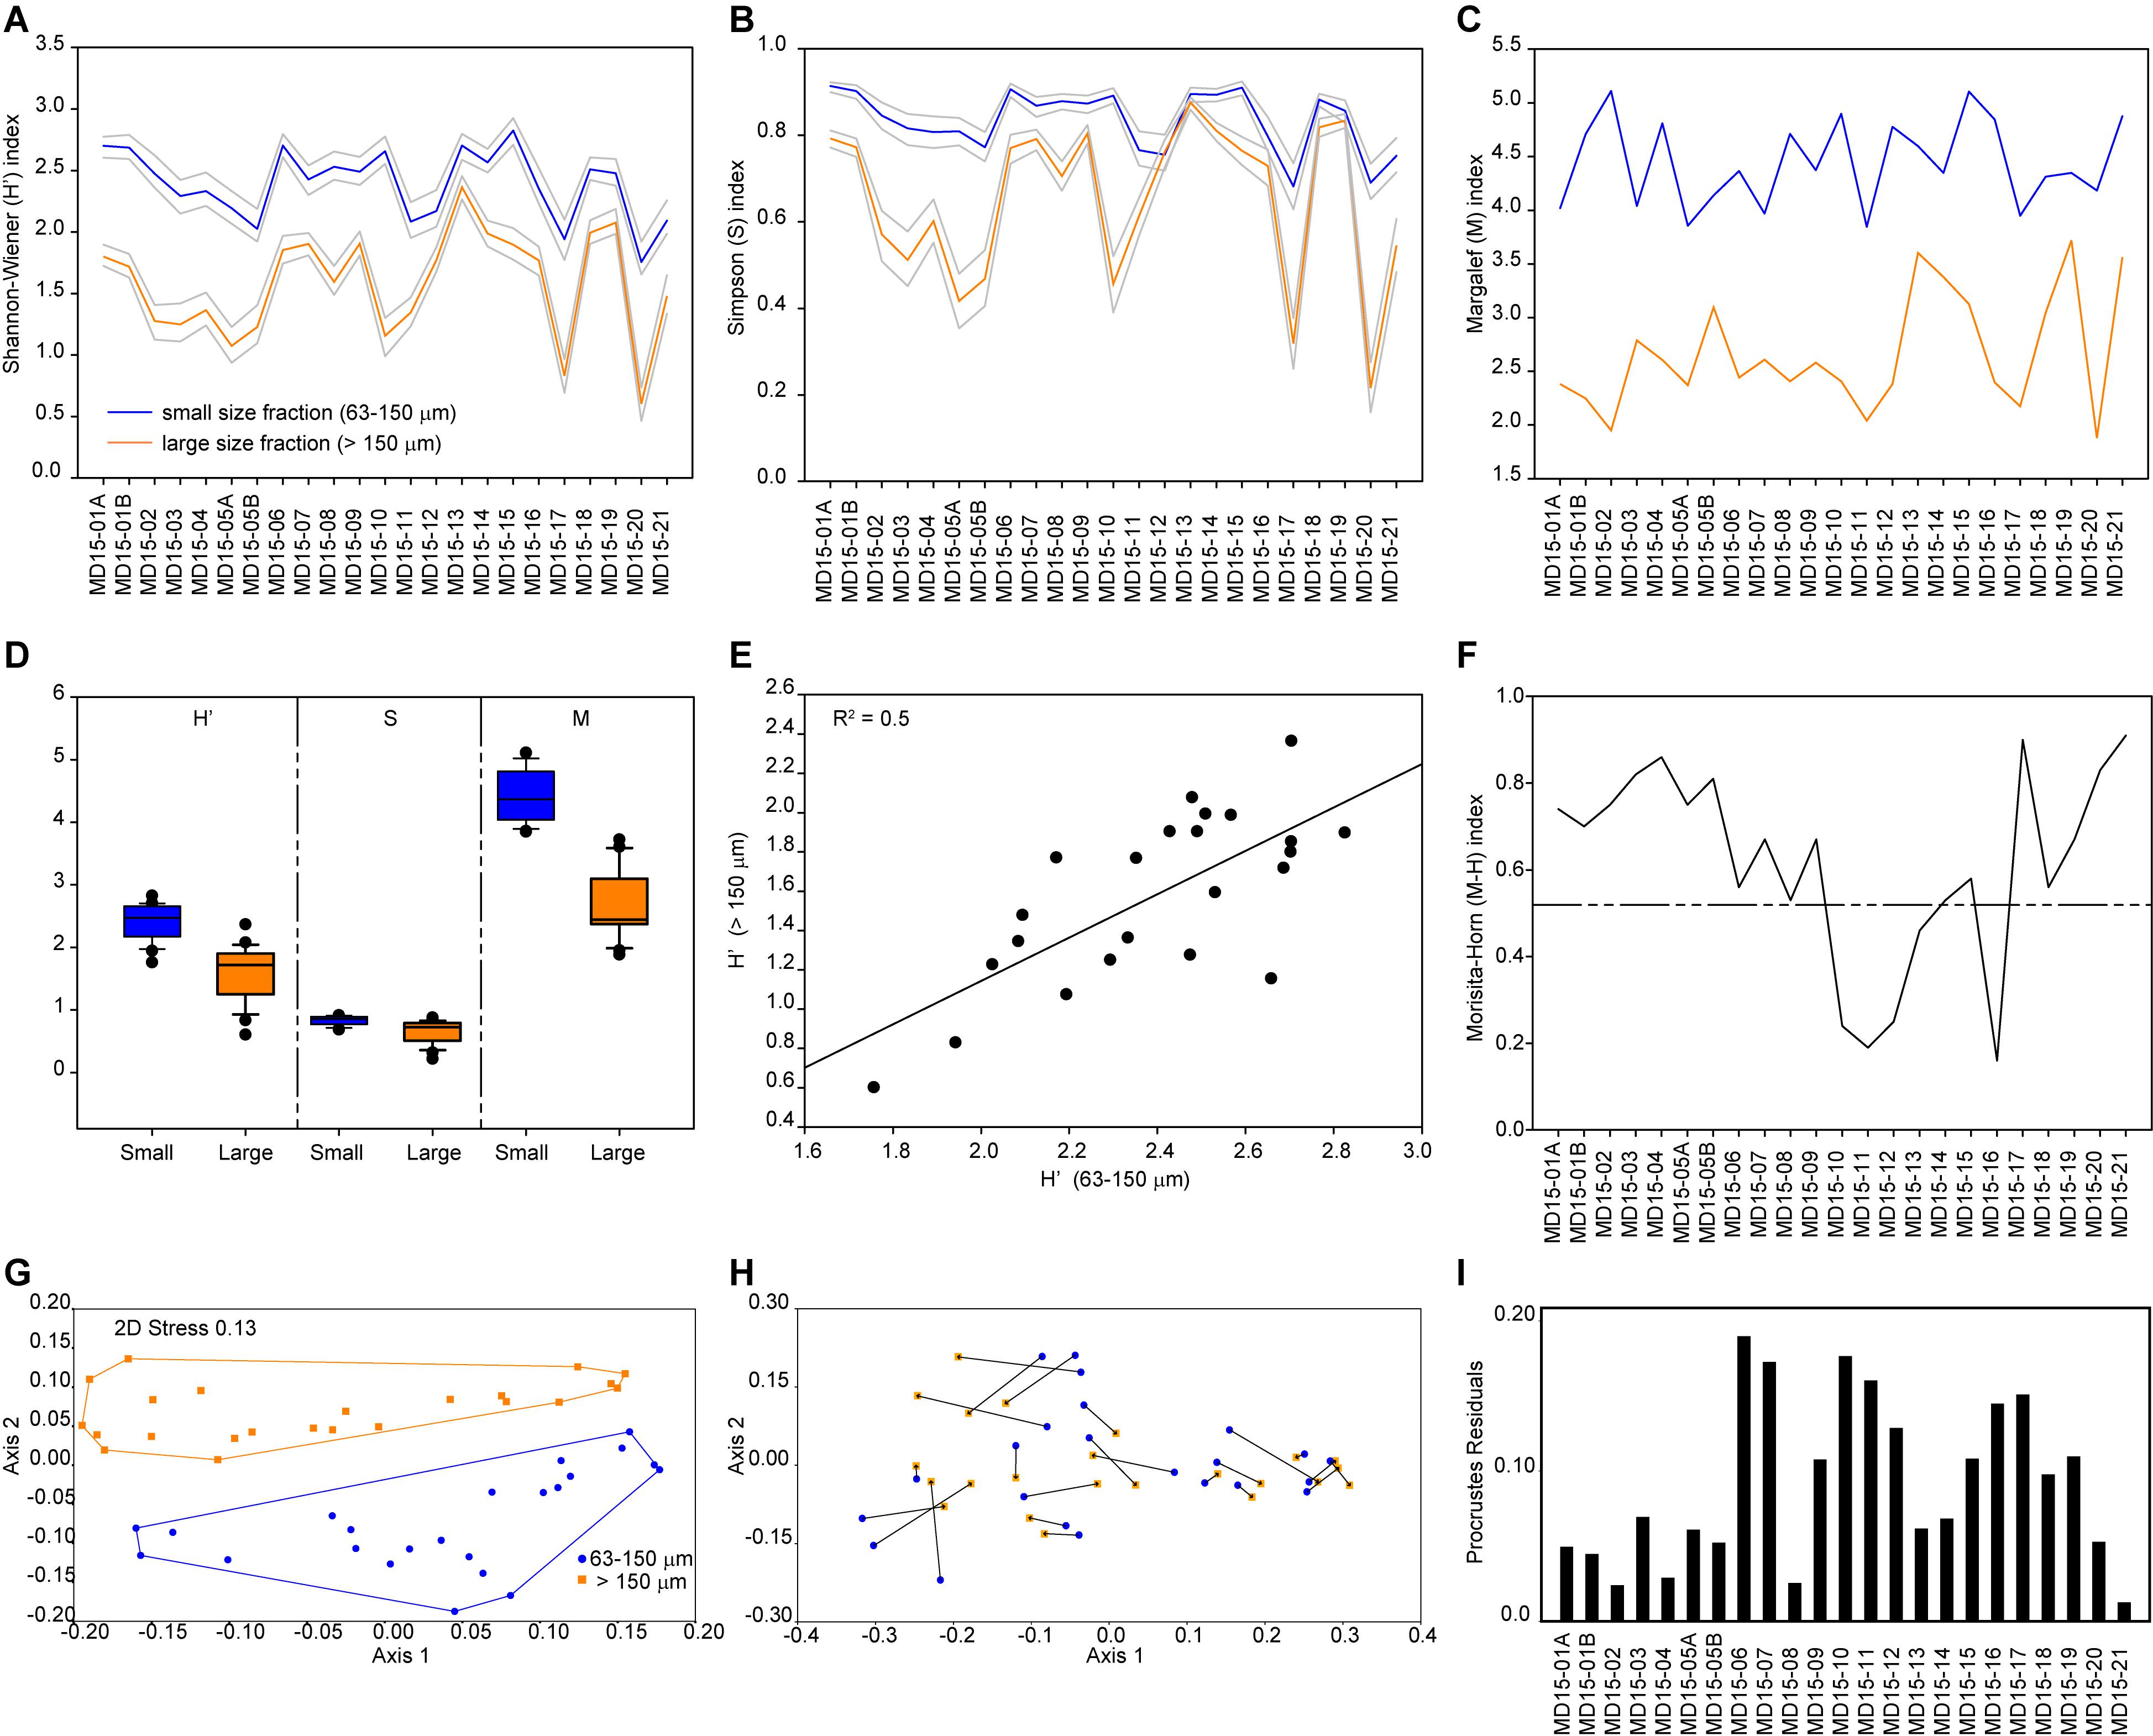
Figure 1. Analyses of benthic foraminiferal assemblages. (A) Shannon-Wiener index. (B) Simpson index. (C) Margalef index. (D) Biodiversity and richness box plots. (E) Correlation between Shannon-Wiener index values from the two size fractions. (F) Morisita-Horn index. (G) Non-metric multidimensional scaling of benthic foraminiferal assemblages from the small (blue) and large (orange) size fractions based on Bray–Curtis similarity and relative abundance data. Note that axis 1 explains 60% of the total variability between sample sets. (H) Procrustes transformation on the MDS ordinations of both size fractions (small to large). (I) Procrustes residuals.
In general, diversity indices reveal that both diversity (Shannon-Wiener and Simpson indices) and richness (Margalef index) are higher in the smaller size fraction than in the large size fraction and that differences in biodiversities and richness between sample sets are statistically significant (Figure 1D). This confirms observations of the assemblages’ composition, in agreement with previous studies (Schroeder et al., 1987; Jennings and Helgadottir, 1994; Schönfeld et al., 2012; Weinkauf and Milker, 2018). Nevertheless, both sample sets show similar diversity trends despite the considerable differences in absolute values, as shown by the positive correlation (R2 = 0.5) between the Shannon-Wiener index values calculated for both size fractions (Figure 1E). Additionally, compositional similarity based on the Morisita-Horn index is >0.75 in 8 samples, between 0.5 and 0.75 in 10 samples, and <0.5 in 5 samples, which means that 18 out of 23 paired samples share at least 50% similarity in their assemblage composition (Figure 1F). The main differences in species composition (lowest values of the Morisita-Horn index) are recorded in assemblages dominated by E. scaber, with B. marginata and S. fusiformis as associated species, as E. scaber and B. marginata only occur in high numbers in the large size fraction (Figure 1F and Table 1).
Multivariate Analyses
Significant differences in the assemblages’ internal composition are evident in the MDS ordination plot, which shows no overlapping between the two size fractions (Figure 1G); notably, the first axis explains 60% of the total variability between sample sets. This is better illustrated after Procrustes transformations are applied to the MDS ordinations of each size fraction (Figure 1H). The Procrustes residuals, the distances between paired samples, indicate the true differences between size fractions. Residuals are highly variable, ranging between 0.01 and 0.19 with an average value of 0.09, which results in an error of 5.9% in the ordination of samples depending on the size fraction used. Additionally, residuals are unevenly distributed between paired samples, with a standard deviation of ± 0.05, hindering the development of a size fraction correction-factor (Figure 1H). The SIMPER test indicates an overall average dissimilarity of 79.1 with ten out of the 12 abundant taxa explaining about 75% of dissimilarity between size fractions (Table 1). Among the abundant taxa, C. laevigata and L. scottii play a minor role in contributing to the average dissimilarity between the two samples sets (<1.5%) owing their overall patchy distribution within and between size fractions. Conversely, ANOSIM and Mantel tests detect significant similarities between the two sample sets. The ANOSIM test has an R = 0.4 and p = 0.0001 which means that the two size fractions share a certain level of similarity between paired samples, albeit small, considering that an R close to 1 would indicate dissimilarity between samples. The Mantel test resulted in an R = 0.7 and p = 0.0001, pointing to a strong positive correlation between paired samples despite the significant differences in the internal composition of benthic foraminiferal assemblages. In summary, multivariate analyses reflect significant differences in the internal composition of benthic foraminiferal assemblage between the two size fractions (non-metric MDS and SIMPER); however, diversity trends stay the same between the two size fractions (ANOSIM and Mantel tests), as also confirmed by the Morisita-Horn index and the positive correlation between Shannon-Wiener indices (Figure 1).
Data Interpretation in an Ecological-Environmental Context
It is crucial to have a clear understanding of the relative abundance of ecologically diagnostic species within and between the assemblages of the two size fractions to reconstruct environmental conditions reliably. Based on benthic foraminiferal relative abundance data, we found that five of the abundant taxa are present in the small size fraction but generally rare in the large size fraction. Specifically, B. elegantissima favors organic rich sediments; C. laevigata thrives in marine conditions as well as Rosalina, which is also often found in high-energy environments; L. scottii is an opportunistic species with an affinity for labile organic matter; and S. fusiformis can live in low oxygen concentrations following high organic matter gradients (Jonkers, 1984; Alve, 1994; Klitgaard-Kristensen et al., 2002; Murray, 2003b; Scott et al., 2005). Environmental reconstructions based only on the large size fraction would result in the loss of this information and in lower-precision environmental reconstructions. Additionally, nine of the eleven common species are only present in the small size fraction; once again, negatively influencing environmental reconstructions based only on the large size fraction and resulting in underestimated assemblage diversity. Figure 1H illustrates these differences quite clearly, after Procrustes transformations were applied to the MDS ordinations of both size fractions. None of the paired samples overlap and only a few fall relatively close to each other (residues <0.02), whereas most samples plot in significantly different positions depending on the chosen size fraction. Therefore, we recommend that size fractions should be combined (>63 μm) to achieve high-resolution, precise and accurate environmental reconstructions. Further details concerning the interpretation of the compiled dataset to reconstruct local environmental gradients in west Shetland are available in Lo Giudice Cappelli et al. (2019). Alternatively, it is possible to focus only on the large size fraction, but we suggest that the abundant taxa category should be redefined to include species with relative abundances >5%, in agreement with Lei et al. (2017). In this way, more diagnostic taxa would be included in the discussion of environmental and ecological trends minimizing the loss of information, while in turn avoiding the labor-intensive challenge of identifying small specimens. In our sample sets, by lowering the abundant taxa “threshold” from 10 to 5% in the large size fraction, Rosalina and S. fusiformis become included in the list of abundant taxa, thus enabling more statistically robust environmental reconstructions. Conversely, C. laevigata, and L. scottii, are not included in the abundant taxa list after this “threshold adjustment”; however, based on the SIMPER test results, these two taxa play a minor contribution to the dissimilarity between size fractions (Table 1). In general, care should be taken not to over interpret changes in benthic foraminiferal assemblages, especially when the distribution of certain taxa are patchy or sparse, and instead we recommend a focus on the prevailing (long-term) environmental forcing that could be responsible for the overall observed variability.
Conclusion
Our results indicate that the small size fraction (63–150 μm) provides the largest range of diagnostic species and contains the highest species diversity and richness, which provide a more robust statistical base for high-resolution environmental reconstructions, despite the inherent difficulties to define the taxonomic identity of small specimens. We also show that benthic foraminiferal assemblages picked from the large size fraction (>150 μm) represent prevailing, long-term environmental trends as long as they contain enough ecologically diagnostic taxa (relative abundance higher than 5%) consistently distributed across sampling sites. In general, our results highlight the importance of following a standardized methodology for benthic foraminiferal assemblage studies to enable the comparison of different data sets, extending the recommendations of Schönfeld et al. (2012) in this regard beyond biomonitoring studies. Nevertheless, we conclude that it is still possible to extrapolate important environmental information from benthic foraminiferal assemblages of historical samples or samples that did not follow a protocol. For high-resolution environmental reconstructions, data from different size fractions should be combined together to optimize the number of diagnostic species (>63 μm) and thus provide statistically more robust reconstructions. Alternatively, we suggest focusing on the large size fraction (>150 μm) and making a considered choice in the definition and characterization of abundant taxa, and the identification of diagnostic species in the assemblages as these will significantly affect the quality, precision and accuracy of the resulting environmental reconstructions.
Data Availability Statement
The datasets generated for this study can be found in PANGAEA at https://doi.pangaea.de/10.1594/PANGAEA.909438.
Author Contributions
WA collected the samples, reviewed, and edited the manuscript. EL processed the sediment samples, designed and performed the analysis with input from WA, and wrote the initial draft. EL and WA identified all specimens.
Funding
This project was supported by the BBSRC/NERC (ref. BB/M026620/01).
Conflict of Interest
The authors declare that the research was conducted in the absence of any commercial or financial relationships that could be construed as a potential conflict of interest.
Acknowledgments
The crew of the MV Moder Dy were gratefully acknowledged for support of the work during the sampling around Shetland. We are grateful to Laura Smith and Kathy Winterton for assisting WA with the field collection. We acknowledge Laura’s help in the laboratory, assisting with benthic foraminiferal picking. We thank referees, the Specialty Chief Editor Dr. Angel Borja, and the Associate Editor Dr. Heliana Teixeira for valuable and constructive comments that improved the manuscript.
References
Alve, E. (1994). Opportunistic features of the foraminifer Stainforthia fusiformis (Williamson): evidence from Frierfjord, Norway. J. Micropalaeontol. 13, 24–24. doi: 10.1144/jm.13.1.24
Austin, W. E. N. (1991). Late Quaternary Benthonic Foraminiferal Stratigraphy of the Western U.K. Continental Shelf. Available at: http://e.bangor.ac.uk/4081/1/DX096566_1.pdf
Austin, W. E. N., and Kroon, D. (1996). Late glacial sedimentology, foraminifera and stable isotope stratigraphy of the Hebridean Continental Shelf, northwest Scotland. Geol. Soc. 111, 187–213. doi: 10.1144/gsl.sp.1996.111.01.13
Bouchet, V. M. P., Alve, E., Rygg, B., and Telford, R. J. (2012). Benthic foraminifera provide a promising tool for ecological quality assessment of marine waters. Ecol. Indic. 23, 66–75. doi: 10.1016/j.ecolind.2012.03.011
Buzas, M. A. (1969). Foraminiferal species densities and environmental variables in an estuary. Limnol. Oceanogr. 14, 411–422. doi: 10.4319/lo.1969.14.3.0411
Buzas, M. A. (1970). Spatial homogeneity: statistical analyses of unispecies and multispecies populations of foraminifera. Ecology 51, 874–879. doi: 10.2307/1933980
Clarke, K. R. (1993). Non-parametric multivariate analyses of changes in community structure. Aust. Ecol. 18, 117–143. doi: 10.1111/j.1442-9993.1993.tb00438.x
Conradsen, K. (1993). Recent benthic foraminifera in the southern Kattegat, Scandinavia: distributional pattern and controlling parameters. Boreas 22, 367–382. doi: 10.1111/j.1502-3885.1993.tb00200.x
Darling, K. F., Schweizer, M., Knudsen, K. L., Evans, K. M., Bird, C., Roberts, A., et al. (2016). The genetic diversity, phylogeography and morphology of Elphidiidae (Foraminifera) in the Northeast Atlantic. Mar. Micropaleontol. 129, 1–23. doi: 10.1016/j.marmicro.2016.09.001
Fontanier, C., Jorissen, F. J., Licari, L., Alexandre, A., Anschutz, P., and Carbonel, P. (2002). Live benthic foraminiferal faunas from the Bay of Biscay: faunal density, composition, and microhabitats. Deep. Res. Part I Oceanogr. Res. Pap. 49, 751–785. doi: 10.1016/S0967-0637(01)00078-74
Gibson, T. G., and Buzas, M. A. (1973). Species diversity: patterns in modern and miocene foraminifera of the eastern margin of North America. Bull. Geol. Soc. Am. 84, 217–238. doi: 10.1130/0016-7606197384
Goineau, A., Fontanier, C., Jorissen, F. J., Lansard, B., Buscail, R., Mouret, A., et al. (2011). Live (stained) benthic foraminifera from the Rhône prodelta (Gulf of Lion, NW Mediterranean): environmental controls on a river-dominated shelf. J. Sea Res. 65, 58–75 doi: 10.1016/j.seares.2010.07.007
Hammer, Ø., Harper, D. A. T., and Ryan, P. D. (2001). PAST: paleontological statistics software package for education and data analysis. Palaeontol. Electron. 4, 1–9. doi: 10.1016/j.bcp.2008.05.025
Horn, H. S. (1966). Measurement of “Overlap” in comparative ecological studies. Am. Nat. 100, 419–424. doi: 10.1086/282436
Jennings, A. E., and Helgadottir, G. (1994). Foraminiferal assemblages from the fjords and shelf of eastern Greenland. J. Foraminifer. Res. 24, 123–144. doi: 10.2113/gsjfr.24.2.123
Jian, Z., Wang, L., Kienast, M., Sarnthein, M., Kuhnt, W., Lin, H., et al. (1999). Benthic foraminiferal paleoceanography of the South China Sea over the last 40,000 years. Mar. Geol. 156, 159–186. doi: 10.1016/S0025-3227(98)00177-177
Jonkers, H. A. (1984). Pliocene benthonic foraminifera from homogeneous and laminated marls on Crete. Utrecht Micropaleontol. Bull. 31:179.
Klitgaard-Kristensen, D., Fetter Sejrup, H., and Haflidason, H. (2002). Distribution of recent calcareous benthic foraminifera in the northern North Sea and relation to the environment. Polar Res. 21, 275–282. doi: 10.3402/polar.v21i2.6488
Knudsen, K.-L., and Austin, W. E. N. (1995). “Late glacial foraminifera,” Foraminiferal Workshop Late Quaternary Palaeoceanography of the North Atlantic Margins. Palaeoecology 111, 7–10. doi: 10.1144/GSL.SP.1996.111.01.02
Lei, Y., Li, T., Jian, Z., and Nigam, R. (2017). Taxonomy and distribution of benthic foraminifera in an intertidal zone of the Yellow Sea, PR China: correlations with sediment temperature and salinity. Mar. Micropaleontol. 133, 1–20. doi: 10.1016/j.marmicro.2017.04.005
Lo Giudice Cappelli, E., Clarke, J. L., Smeaton, C., Davidson, K., and Austin, W. E. N. (2019). Organic carbon rich sediments: benthic foraminifera as bio-indicators of depositional environments. Biogeosciences 16, 4183–4199. doi: 10.5194/bg-16-4183-2019
Mantel, N. (1967). The detection of disease clustering and a generalized regression approach. Cancer Res. 27, 209–220.
Mantel, N., and Valand, R. S. (1970). A technique of nonparametric multivariate analysis. Biometrics 26, 547–558. doi: 10.2307/2529108
Morisita, M. (1959). Measuring of interspecific association and similarity between communities. Jpn. J. Ecol. 11, 252. doi: 10.18960/seitai.11.6_252_4
Murray, J. W. (2003a). An illustrated guide to the benthic foraminifera of the Hebridean Shelf, west of Scotland, with notes on their mode of life. Palaeontol. Electron. 5:31.
Murray, J. W. (2003b). Foraminiferal assemblage formation in depositional sinks on the continental shelf west of Scotland. J. Foraminifer. Res. 33, 101–121. doi: 10.2113/0330101
Nørgaard-Pedersen, N., Austin, W. E. N., Howe, J. A., and Shimmield, T. (2006). The holocene record of loch etive, western scotland: influence of catchment and relative sea level changes. Mar. Geol. 228, 55–71. doi: 10.1016/j.margeo.2006.01.001
Poole, D. A. R., Skitem, J., and Vorren, T. O. (1994). Foraminiferal stratigraphy, palaeoenvironments and sedimentation of the glacigenic sequence southwest of Bjørrnøya. Boreas 23, 122–138. doi: 10.1111/j.1502-3885.1994.tb00593.x
Rohlf, F. J., and Slice, D. (1990). Extensions of the Procrustes method for the optimal superimposition of landmarks. Syst. Biol. 39, 40–59. doi: 10.2307/2992207
Rudemo, M. (2000). Statistical shape analysis. I. L. Dryden and K. V. Mardia, Wiley, Chichester 1998. No. of pages: xvii+347. Price: €60.00. ISBN 0-471-95816-6. Stat. Med. 19, 2716–2717. doi: 10.1002/1097-0258(20001015)19:19
Schönfeld, J., Alve, E., Geslin, E., Jorissen, F., Korsun, S., Spezzaferri, S., et al. (2012). The FOBIMO (FOraminiferal BIo-MOnitoring) initiative-towards a standardised protocol for soft-bottom benthic foraminiferal monitoring studies. Mar. Micropaleontol. 9, 1–13. doi: 10.1016/j.marmicro.2012.06.001
Schroeder, C. J., Scott, D. B., and Medioli, F. S. (1987). Can smaller benthic foraminifera be ignored in paleoenvironmental analyses? J. Foraminifer. Res. 17, 101–105. doi: 10.2113/gsjfr.17.2.101
Scott, D. B., Tobin, R., Williamson, M., Medioli, F. S., Latimer, J. S., Boothman, W. A., et al. (2005). Pollution monitoring in two North American estuaries: historical reconstructions using benthic foraminifera. J. Foraminifer. Res. 35, 65–82. doi: 10.2113/35.1.65
Scott, D. B., and Vilks, G. (1991). Benthic foraminifera in the surface sediments of the deep-sea Arctic Ocean. J. Foraminifer. Res. 21, 20–38. doi: 10.2113/gsjfr.21.1.20
Taguchi, Y. H., and Oono, Y. (2005). Relational patterns of gene expression via non-metric multidimensional scaling analysis. Bioinformatics 21, 730–740. doi: 10.1093/bioinformatics/bti067
Keywords: benthic foraminifera, shell size, assemblages, environmental reconstructions, standard protocol
Citation: Lo Giudice Cappelli E and Austin WEN (2019) Size Matters: Analyses of Benthic Foraminiferal Assemblages Across Differing Size Fractions. Front. Mar. Sci. 6:752. doi: 10.3389/fmars.2019.00752
Received: 21 May 2019; Accepted: 19 November 2019;
Published: 10 December 2019.
Edited by:
Heliana Teixeira, University of Aveiro, PortugalReviewed by:
Rebecca Jackson, Geological Survey of Denmark and Greenland, DenmarkPamela Hallock, University of South Florida, United States
Copyright © 2019 Lo Giudice Cappelli and Austin. This is an open-access article distributed under the terms of the Creative Commons Attribution License (CC BY). The use, distribution or reproduction in other forums is permitted, provided the original author(s) and the copyright owner(s) are credited and that the original publication in this journal is cited, in accordance with accepted academic practice. No use, distribution or reproduction is permitted which does not comply with these terms.
*Correspondence: Elena Lo Giudice Cappelli, ZWxlbmEubG9naXVkaWNlLmNhcHBlbGxpQGdtYWlsLmNvbQ==