 Kirsten J. Harper1,2*
 Kelly D. Goodwin
 Peter H. Dutton
- 1The Cooperative Institute for Marine and Atmospheric Studies, University of Miami, Miami, FL, United States
- 2Ocean Chemistry and Ecosystems Division, Atlantic Oceanographic and Meteorological Laboratory, National Oceanic and Atmospheric Administration, Stationed at Southwest Fisheries Science Center, La Jolla, CA, United States
- 3Illinois Natural History Survey, Prairie Research Institute, University of Illinois at Urbana-Champaign, Champaign, IL, United States
- 4Marine Mammal and Turtle Division, Southwest Fisheries Science Center, National Marine Fisheries Service, National Oceanic and Atmospheric Administration, La Jolla, CA, United States
Environmental DNA (eDNA) analysis is a rapid, non-invasive method for species detection and distribution assessment using DNA released into the surrounding environment by an organism. eDNA analysis is recognised as a powerful tool for detecting endangered or rare species in a range of ecosystems. Although the number of studies using eDNA analysis in marine systems is continually increasing, there appears to be no published studies investigating the use of eDNA analysis to detect sea turtles in natural conditions. We tested the efficacy of two primer pairs known to amplify DNA fragments of differing lengths (488 and 253 bp) from Chelonia mydas tissues for detecting C. mydas eDNA in water samples. The capture, extraction, and amplification of C. mydas eDNA from aquaria (Sea World, San Diego, CA, United States) and natural water (San Diego Bay, CA, United States) were successful using either primer set. The primer pair providing the shorter amplicon, LCMint2/H950g, demonstrated the ability to distinguish cross-reactive species by melt curve analysis and provided superior amplification metrics compared to the other primer set (LTCM2/HDCM2); although primer dimer was observed, warranting future design refinement. Results indicated that water samples taken from deeper depths might improve detection frequency, consistent with C. mydas behaviour. Overall, this pilot study suggests that with refinement of sampling methodology and further assay optimisation, eDNA analysis represents a promising tool to monitor C. mydas. Potential applications include rapid assessment across broad geographical areas to pinpoint promising locations for further evaluation with traditional methods.
Introduction
All sea turtles are threatened species (IUCN, 2019), but there is a fundamental lack of understanding of their biology and distribution that can be attributed primarily to the logistical challenges associated with study in open ocean environments (Hamann et al., 2010). Sea turtles are highly migratory and characterised by a complex life history which includes nesting, developmental, and foraging populations. They tend to be present in low numbers and elusive, making them difficult to physically locate. These challenges have resulted in sea turtle population assessments being typically limited to surveys of females and their activity on nesting beaches (National Research Council et al., 2010), instead of surveys in the marine environment where they spend the majority of their time (Hamann et al., 2010; Rees et al., 2016). There is a need to assess all life stages of this endangered marine species which are not addressed by conventional approaches. Conventional methods to locate and monitor sea turtles include aerial, satellite tagging, and boat-based capture-recapture surveys (Jackson et al., 2015; Rees et al., 2018), but such methods are laborious, expensive, and in some cases invasive. Development of new assessment methods for sea turtles is becoming increasingly urgent given concern over how changing oceanographic conditions may shift their distribution and habitat use. Greater occurrence of sea turtles within urbanised environments can result in more interactions with humans and associated risks, including drowning from entanglement (National Oceanic and Atmospheric Administration Marine Debris Program, 2014; Godoy and Stockin, 2018), ship strikes (Hazel and Gyuris, 2006), and exposure to toxins (Komoroske et al., 2011).
Green sea turtles Chelonia mydas in San Diego Bay, CA, United States represent an endangered population with shifting demographics in an urbanised marine setting. This is a local resident population that historically represents the northernmost sizable foraging population for C. mydas in the Northeast Pacific, consisting primarily of the Revillagigedo Islands and Michoacán breeding populations in Mexico (Dutton et al., 2019). In the past, C. mydas has been largely absent or rare in coastal waters along the US West coast, but the species appears to be increasingly present at foraging areas north of their historic range in Baja California, Mexico and the US Border region of San Diego (Crear et al., 2016; Crear et al., 2017; Dutton et al., 2019; personal observation). This change in distribution has created a need to incorporate the detection of C. mydas into habitat surveys in ways that were previously not considered.
San Diego Bay is the largest open water bay in the Southern California Bight, with open waters covering 4262 ha and tidelands covering 1788 ha (Eguchi et al., 2010; Turner-Tomaszewicz and Seminoff, 2012). C. mydas have been documented in the bay since the 1800s; however, ongoing research did not begin until the 1970s (Stinson, 1984; McDonald et al., 1994; MacDonald et al., 2012; Madrak et al., 2016). Since monitoring began, C. mydas have almost always been observed aggregating in the South Bay near the San Diego Bay Power Plant (SBPP) effluent area (Figure 1), where during years of operation (1960–2010) the SBPP artificially warmed waters through the direct release of warm effluent water (Eguchi et al., 2010; Lemons et al., 2011). In addition to aggregating near the SBPP, adjacent eelgrass beds also drew C. mydas to this location (Figure 1; MacDonald et al., 2012; Madrak et al., 2016). This provided a site where traditional sampling methods could be applied, but it has not been practical nor cost-effective to survey the majority of the area with these methods given the low density of C. mydas and restricted access to some areas. Increased urbanisation of San Diego Bay coupled with shifting habitat use has sparked growing interest from managers and stakeholders (including Federal, State and local agencies such as the US Navy, NOAA-Fisheries, US Fish and Wildlife Services, CA Resources Agency, and the Port of San Diego) to identify areas that C. mydas frequent. In this respect, environmental DNA (eDNA) analysis is a potentially useful tool for C. mydas distribution assessment.
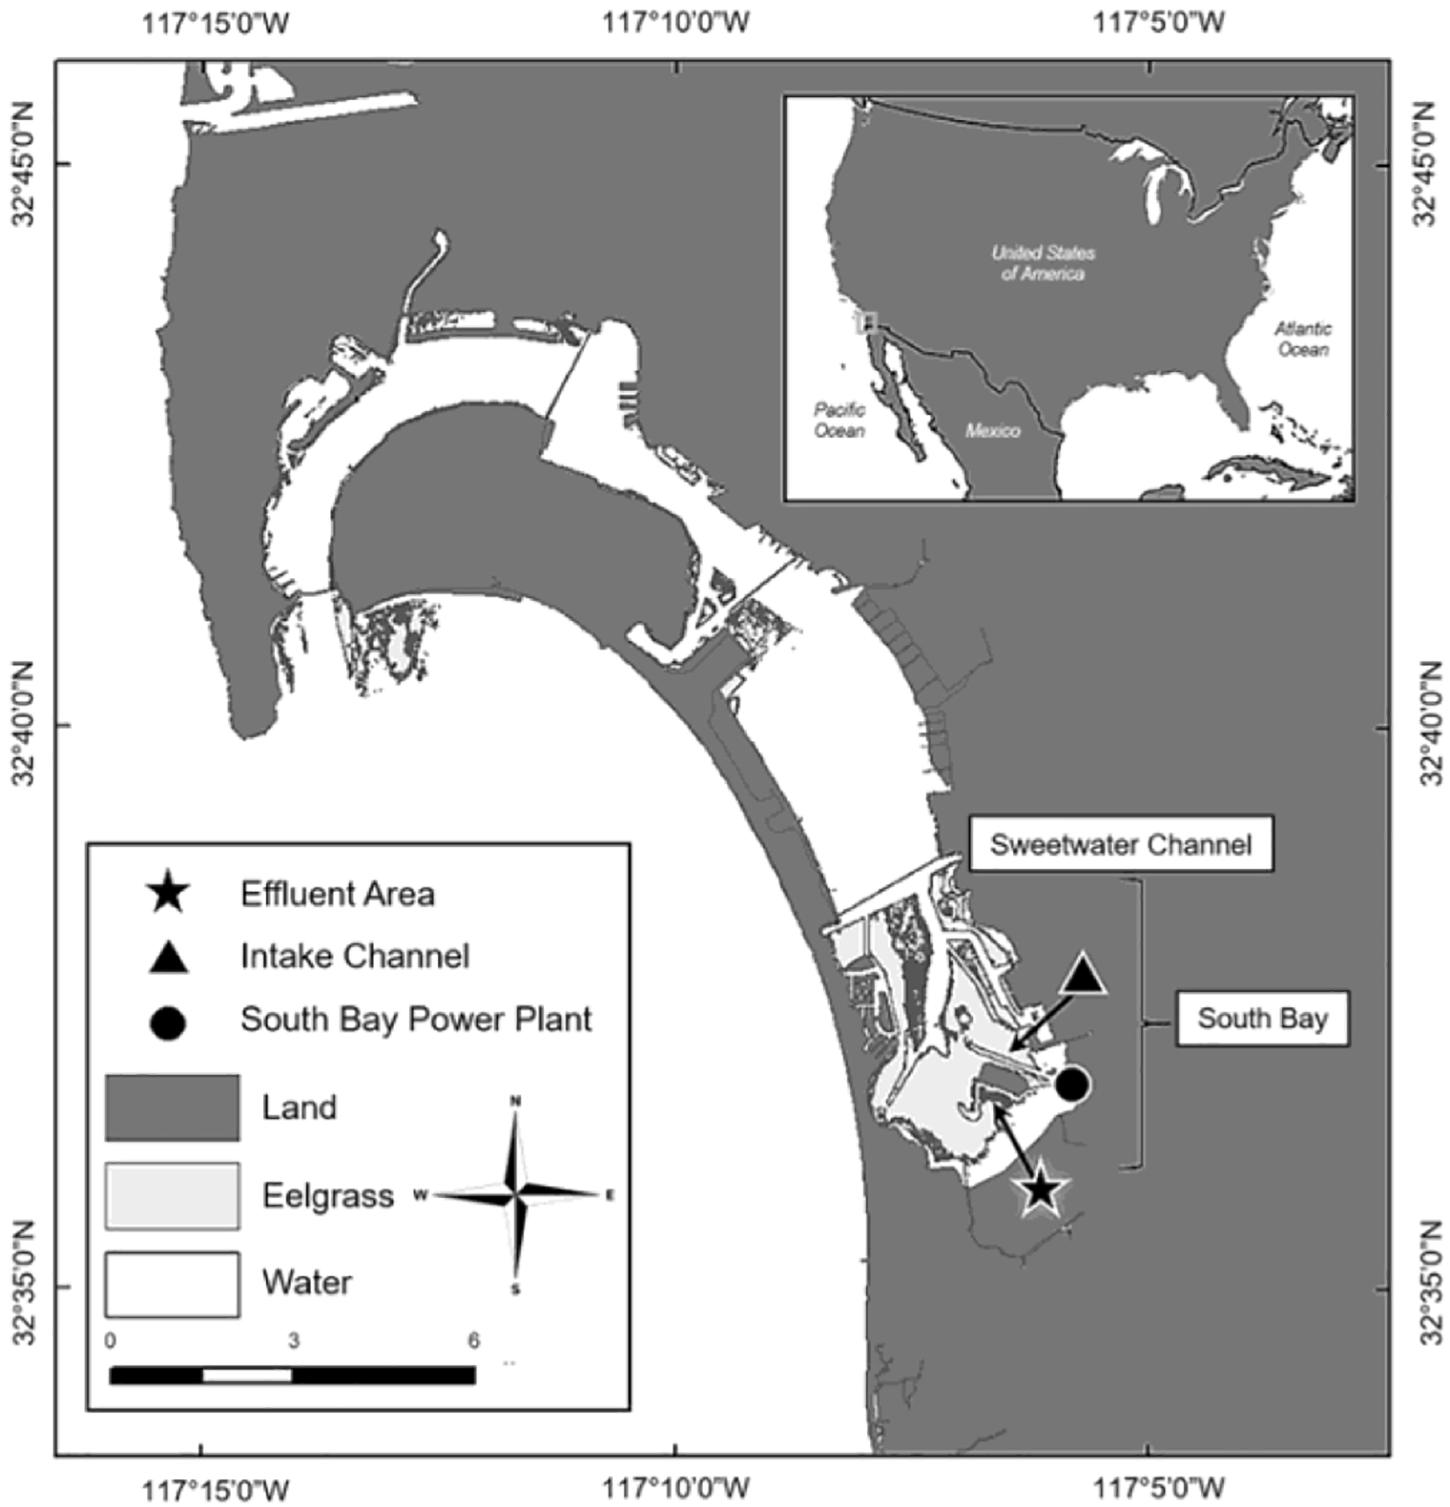
Figure 1. San Diego Bay is located in Southern California, close to the US-Mexico Border (inset). Chelonia mydas primarily inhabit the Intake Channel located south of the Sweetwater Channel, in an area known as South Bay (Madrak et al., 2016).
eDNA analysis is a rapidly evolving, cost-efficient, non-invasive method that can be used to monitor cryptic, low density, and/or elusive species (Hunter et al., 2018). eDNA is deposited into the environment by organisms via skin cells, gametes, faeces, urine, saliva, as well as decomposing individuals, and can be extracted from various sample types including water, soil and air (Thomsen and Willerslev, 2015; Taberlet et al., 2018). Popularity of eDNA methods to determine species presence and relative abundance/biomass has been increasing since Ficetola et al. (2008) first used eDNA to detect the invasive American Bullfrog Rana catesbeiana in French wetlands. However, eDNA studies have largely focused on freshwater systems (Roussel et al., 2015), likely due to the challenges posed by marine environments, including increased mixing, higher salinity, and greater dilution (Cristescu and Hebert, 2018).
In marine waters, eDNA analysis was first used to detect the harbour porpoise Phocoena phocoena (Foote et al., 2012). Other studies have since moved to determine the effectiveness of using eDNA to detect a wide array of marine taxonomic groups, from orcas Orcinus orca (Baker et al., 2018) and great white sharks Carcharodon carcharias (Lafferty et al., 2018) to coral genera and estimates of coral cover (Nichols and Marko, 2019). Nonetheless, fish remain the group most studied with eDNA analysis in both freshwater and marine environments (Hansen et al., 2018). Few eDNA studies have investigated aquatic reptiles (Roussel et al., 2015), and those that did focused on freshwater turtles (Davy et al., 2015; de Souza et al., 2016; Lacoursière-Roussel et al., 2016; Feist et al., 2018; Kundu et al., 2018; Raemy and Ursenbacher, 2018; Wilson et al., 2018; Adams et al., 2019; Akre et al., 2019; Ficetola et al., 2019). Only Kelly et al. (2014) used eDNA analysis to detect sea turtles and their study was conducted in a mesocosm to census marine fishes, not specifically designed for sea turtles. Furthermore, the assay was not tested in natural conditions.
Detection of aquatic reptiles may be more difficult than fish and amphibians due to their lack of mucous structures. Instead, turtles possess horny or bony plates called scutes which may prevent eDNA release akin to organisms that possess a hard chitin exoskeleton (Tréguier et al., 2014; Harper et al., 2018; Raemy and Ursenbacher, 2018). Additionally, freshwater turtle excretions are more concentrated, less frequent, and subsequently lower volume than those of fish and amphibians (Raemy and Ursenbacher, 2018; Akre et al., 2019). Accordingly, sea turtles may exhibit lower shedding rates than other vertebrate species, which could potentially make eDNA detection more challenging.
We set out to develop, validate, and field test an eDNA assay to detect the presence of C. mydas in our study area, motivated by demand from managers and stakeholders. We developed qPCR assays that were first tested under controlled aquaria conditions and then at a field site were C. mydas are known to be present. This pilot study provides a basis for developing the capacity to use eDNA analysis for rapid habitat assessments for sea turtle presence.
Materials And Methods
Assay Development
Two primer pairs, previously designed and well characterised for sea turtle population and phylogenetic studies (Komoroske et al., 2017) to amplify segments of differing lengths from the mtDNA control region (D-loop) in C. mydas, were applied in this study (Table 1 and Figures 2, 3). Primer pairs were tested in silico using ecoPCR (Ficetola et al., 2010; Taberlet et al., 2018) against a custom reference database constructed for all marine and freshwater turtles potentially found in North America using D-loop sequences available on GenBank (Supplementary Information S2). Parameters set allowed a 450–500 bp fragment for LTCM2/HDCM2 and a 200–300 bp fragment for LCMint2/H950g, with a maximum of three mismatches between each primer and each sequence in the reference database. The specificity of each primer pair was also tested against the full NCBI nucleotide (nt) database using Primer-BLAST (Ye et al., 2012) with default settings. Primer pairs were validated in vitro using quantitative PCR (qPCR) with tissue-derived DNA (1 ng/μl) from C. mydas and three other non-target sea turtle species: olive ridley Lepidochelys olivacea, hawksbill Eretmochelys imbricata and loggerhead Caretta caretta. Tissue-derived DNA samples were obtained from the National Marine Mammal and Sea Turtle Research (MMASTR) Collection at the Southwest Fisheries Science Center, La Jolla, CA, United States, and consisted of one individual from each of the species listed above.
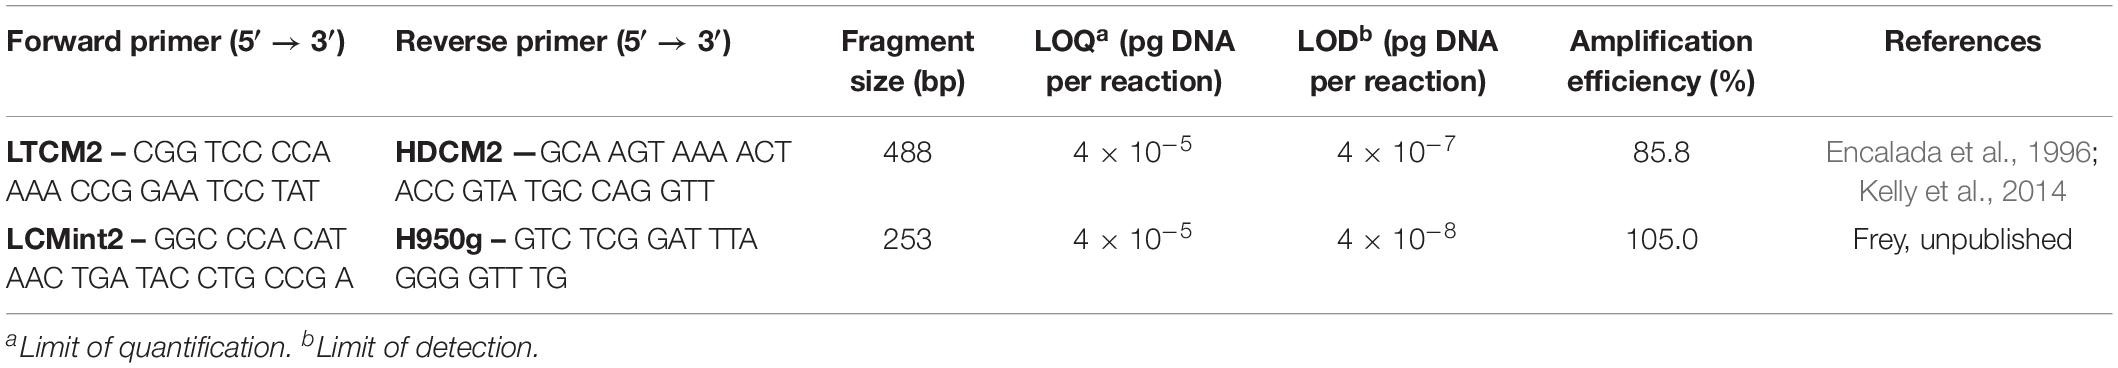
Table 1. Characteristics of primer pairs selected for assay development.
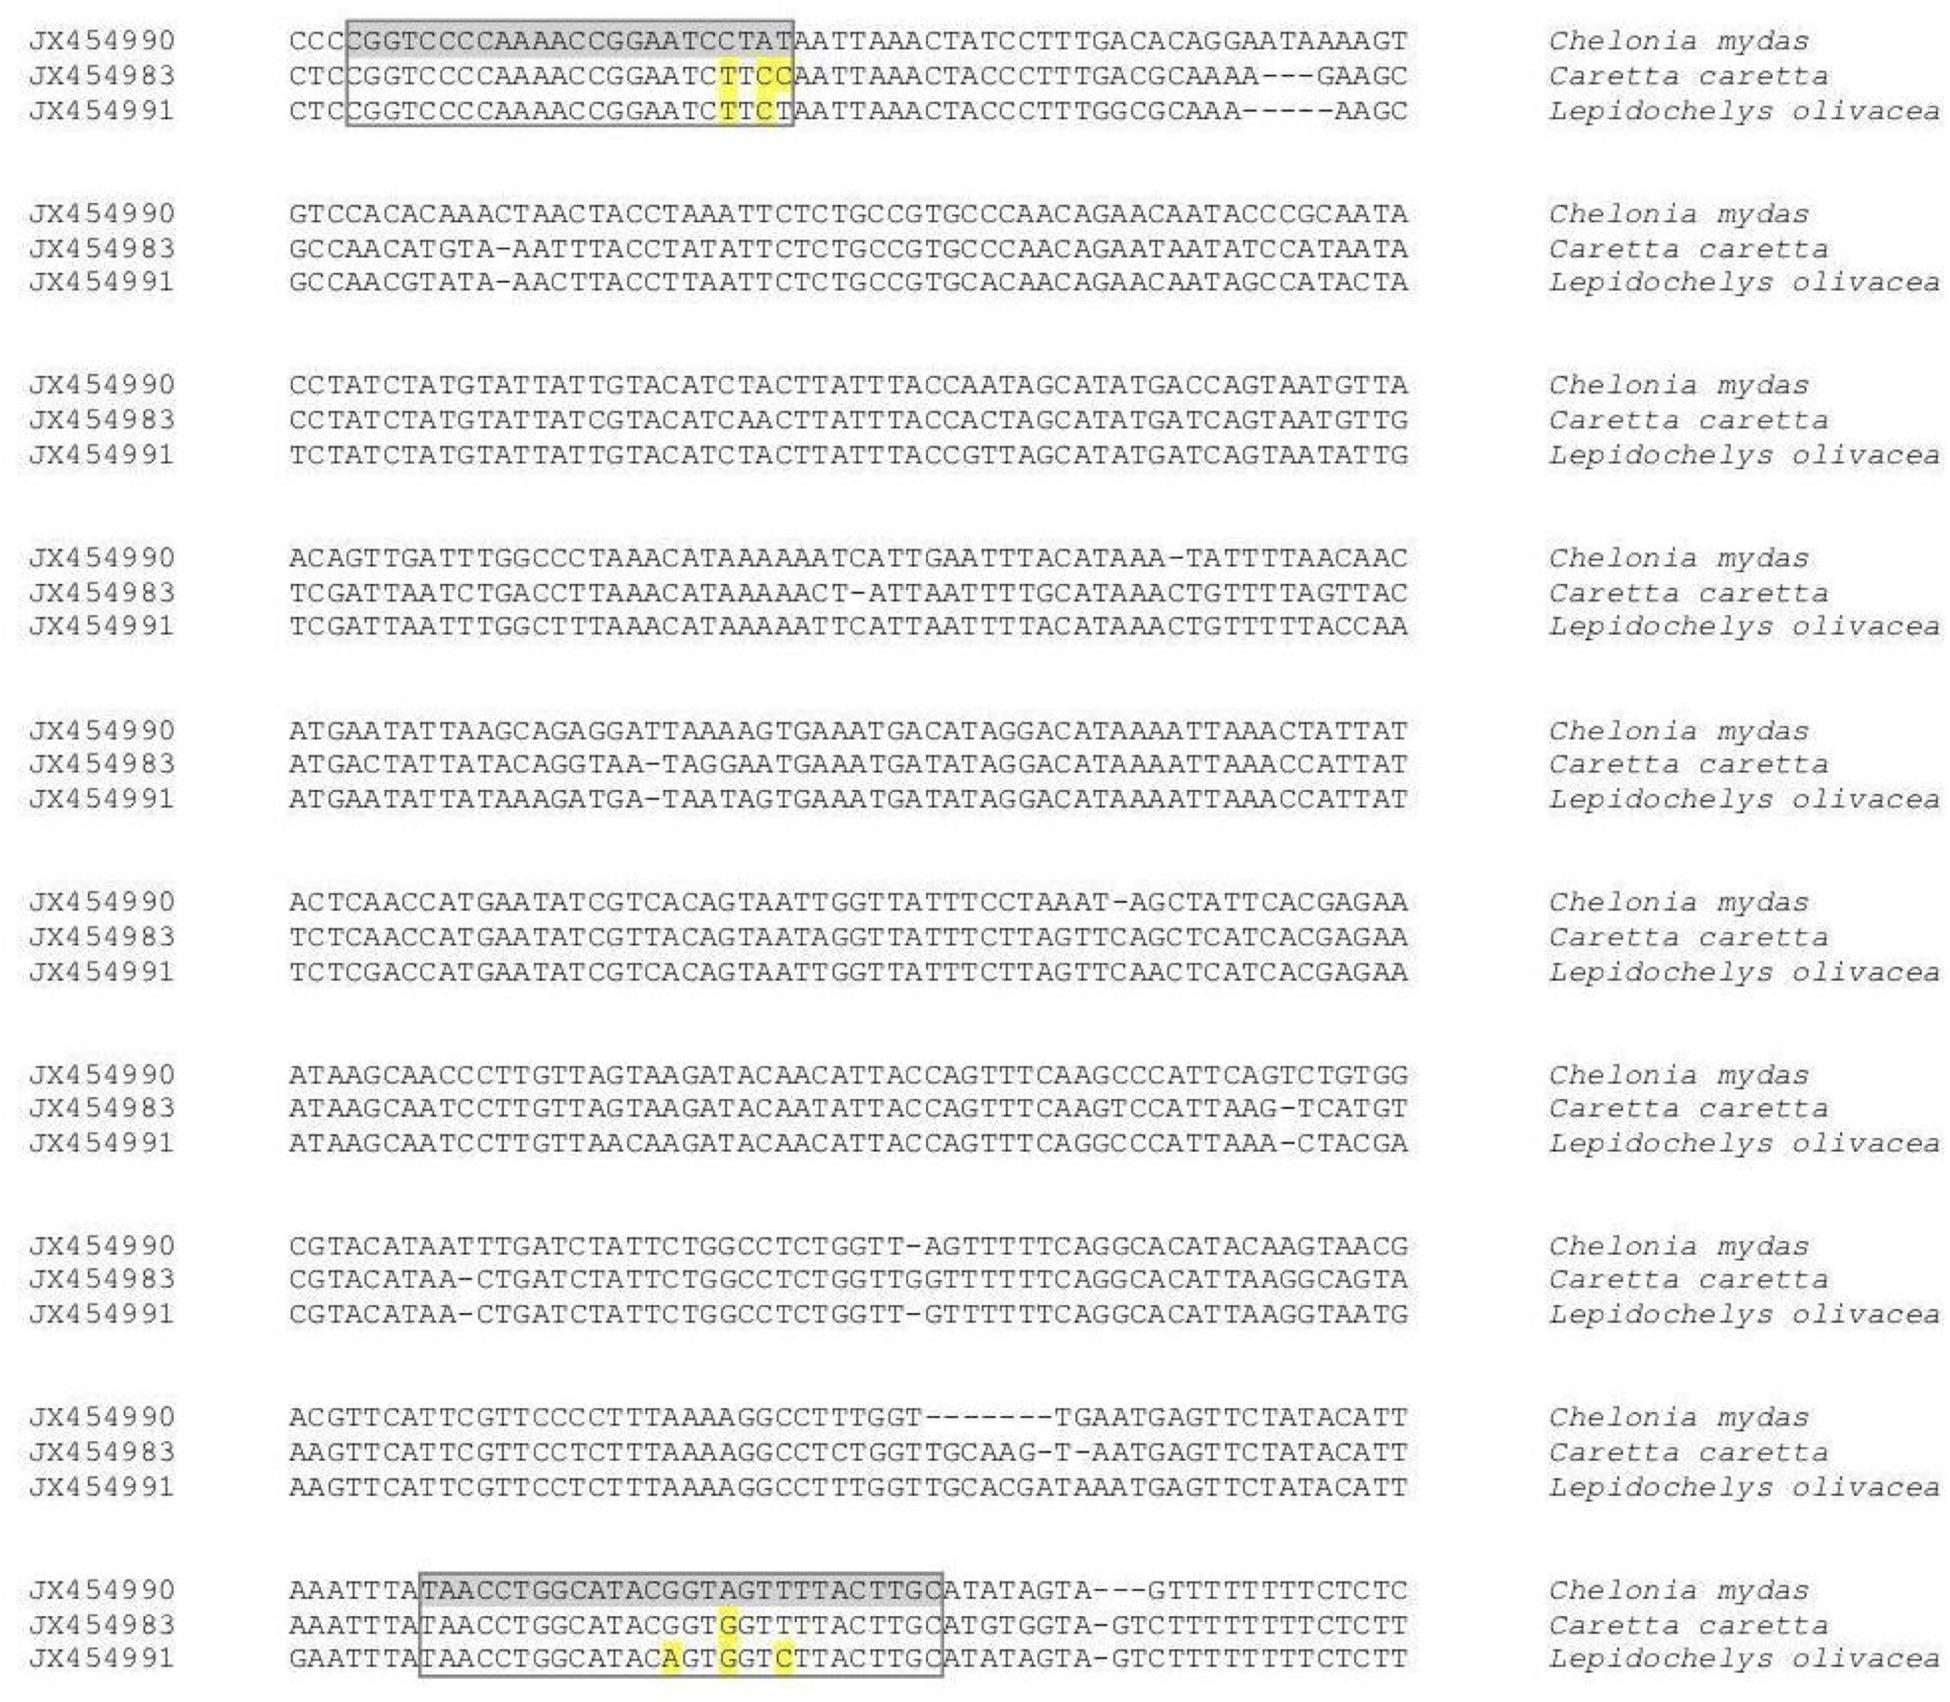
Figure 2. The Chelonia mydas D-loop target region for the primer pair LTCM2/HDCM2. Forward and reverse primers for LTCM2/HDCM2 are highlighted in grey on a representative D-loop region for Chelonia mydas. In addition, representative D-loop target regions for other sea turtle species with mismatches on either the forward or reverse primers produced by ecoPCR are given. Highlighted nucleotides represent positions where the sequence of any entry differs from the primer (yellow highlight). Species shown: Caretta caretta and Lepidochelys olivacea.
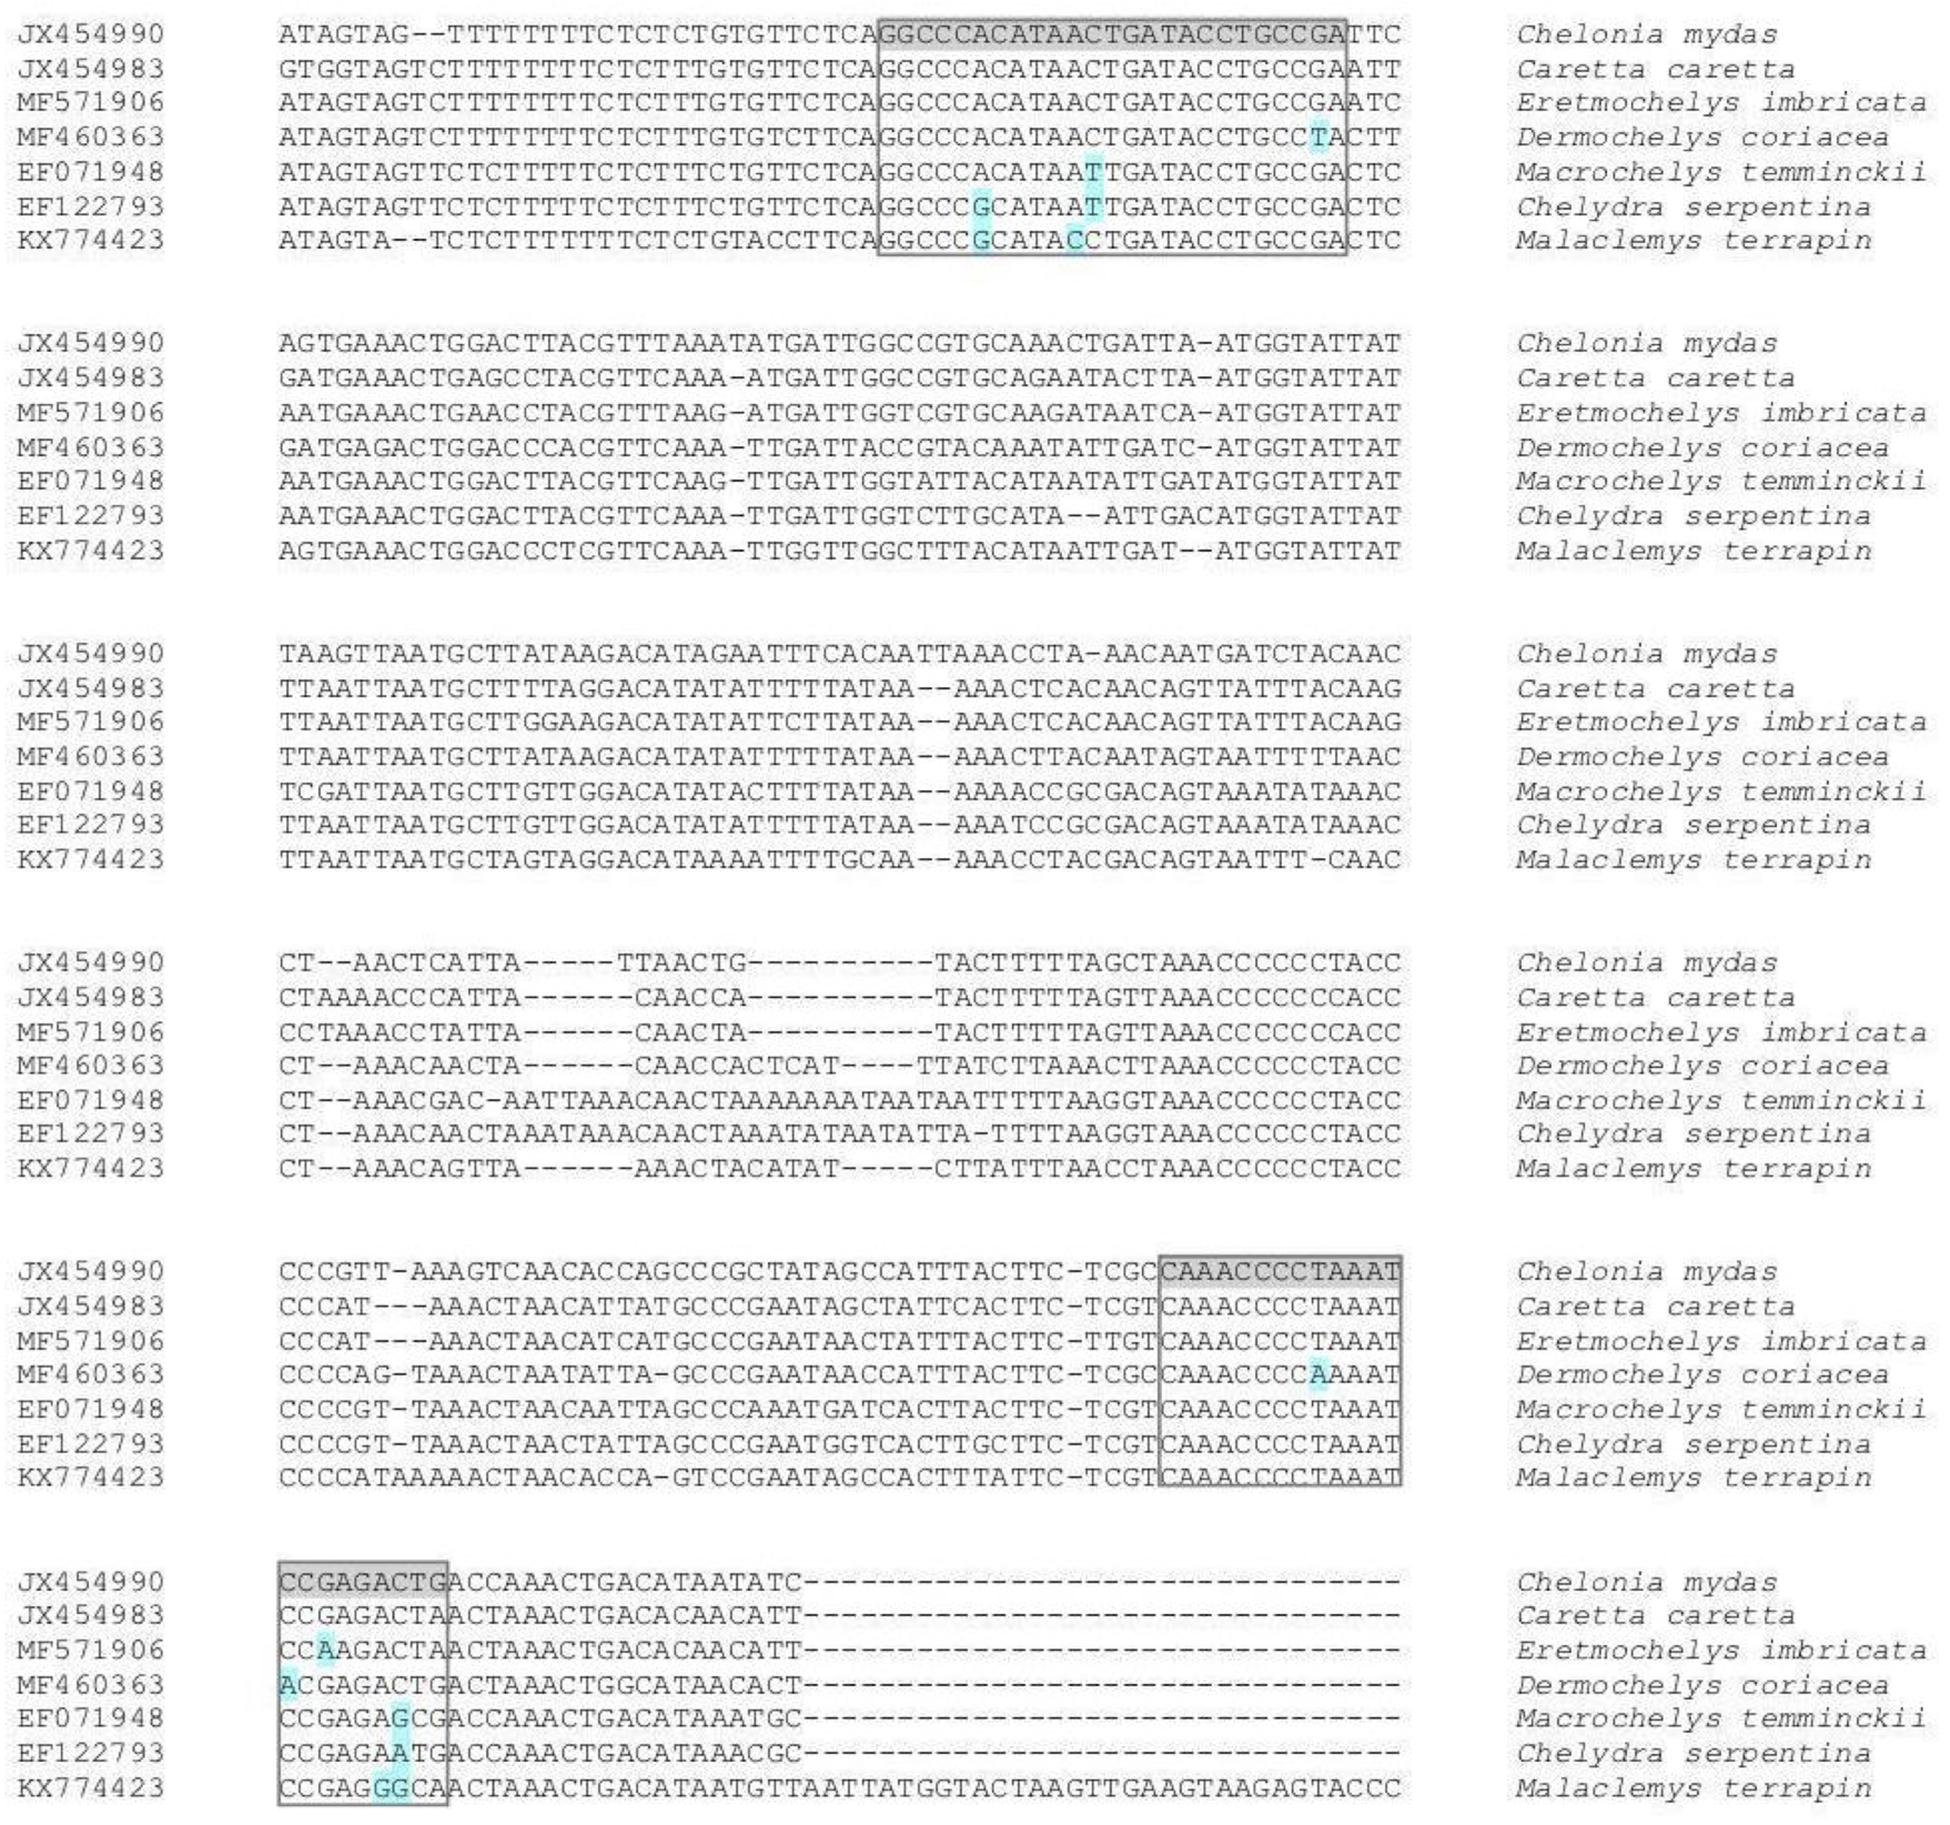
Figure 3. The Chelonia mydas D-loop target region for the primer pair LCMint2/H950g. Forward and reverse primers for LCMint2/H950g are highlighted in grey on a representative D-loop region for Chelonia mydas. In addition, representative D-loop target regions for other sea turtle species with mismatches on either the forward or reverse primers produced by ecoPCR are given. Highlighted nucleotides represent positions where the sequence of any entry differs from the primer (blue highlight). Species shown: Caretta caretta, Eretmochelys imbricata, Dermochelys coriacea, Macrochelys temminckii, Chelydra serpentina, and Malaclemys terrapin.
The Limit of Detection (LOD) and Limit of Quantification (LOQ) were estimated using a 10-fold serial dilution of tissue DNA extract ranging from 4 × 10⁻¹ to 4 × 10⁻⁹ pg C. mydas DNA per qPCR reaction for both the LTCM2/HDCM2 and the LCMint2/H950g primer sets. Five technical replicates were performed for each dilution concentration. Following Agersnap et al. (2017), the LOD was defined as the lowest concentration where at least one technical replicate amplified target DNA, and the LOQ was defined as the concentration where all technical replicates amplified target DNA. qPCR metrics were calculated based on the standard curve. Amplification efficiency for LCMint2/H950g was calculated for the range of 4 × 10⁻¹ to 4 × 10⁻⁵ pg C. mydas DNA per qPCR reaction; lower concentrations showing non-specific amplification presumably due to primer dimer were not included in the analysis.
Sample Collection and Processing
Samples were collected from aquaria tanks and field sites, as detailed below. In all cases, sampling equipment was disinfected with a solution of 10% household bleach for 10 min and rinsed thoroughly with deionised water prior to use. Samples (1 L each) were collected using sterile 1 L GosselinTM HDPE plastic bottles (Fisher Scientific) while wearing disposable gloves. After collection, water samples were immediately placed in a sterile cool box containing ice and transported to the laboratory at Southwest Fisheries Science Center (SWFSC), La Jolla. Water samples were stored at 4°C until water filtering could be completed, and all water samples were vacuum filtered within 24 h of collection. A field blank (1 L MilliQ) was taken into the field and stored in a cool box with samples to monitor for potential contamination during water sampling and transportation. The field blank was filtered and extracted alongside the other collected water samples and subjected to the same qPCR conditions. Surface samples (≈0.5 m depth) were collected by hand. Deeper samples (≈2.5 m depth) were collected using a piece of disinfected PVC pipe with a sample bottle attached. For field sampling, water depths average <5 m below Mean Lower Low Water (Turner-Tomaszewicz and Seminoff, 2012), thus care was taken to avoid disturbing the sediment to prevent the release of “ancient” DNA fragments into the water column (Tréguier et al., 2014).
Aquaria Sampling
A total of ten surface water samples were collected from two aquaria housing C. mydas at SeaWorld San Diego (32.76477, −117.22661) on August 29, 2018. Eight samples were collected from an aquaria (1,097,669 L) housing between 35 and 40 C. mydas individuals, hereafter referred to as Tank A. Within Tank A, six 1 L water samples were taken from the left side of the tank (Tank A-1) where turtles were congregated, and two 1 L water samples were collected from the right side (Tank A-2) where no turtles were observed at the time of sampling. The remaining two 1 L water samples were taken from a second smaller tank (18,927 L) housing three C. mydas individuals, and hereafter referred to as Tank B.
Field Sampling in San Diego Bay
The following field missions were conducted in the study area of San Diego Bay:
(1) Within the Intake Channel in the South Bay (Figure 1), three seawater samples (1 L) were collected at depths of ≈0.5 and ≈2.5 m) (n = 6) on November 19, 2017. To efficiently provide spatial coverage of the Intake Channel, point samples were collected at the following co-ordinates within the channel: 32.61442, −117.09864; 32.61518, −117.10174; 32.61728, −117.10403. No net capture operations were ongoing during this field mission, and no sea turtles were sighted during water sampling.
(2) During routine monitoring operations on May 15, 2018, surface water samples were collected near a net-captured turtle (Supplementary Table S3). The sea turtle was captured within the Intake Channel in the South Bay (Figure 1; 32.61407, −117.09802). Water samples (1 L) for eDNA analysis were collected at several time intervals after the turtle was removed from the water (0, 30, 90, 145 min). Three samples were collected at each time point at the capture location (n = 12).
(3) During a stranding response, surface seawater was collected during an ebb tide near a deceased C. mydas individual that was stranded on a rocky shore within the Intake Channel in the South Bay (Figure 1; 32.61472, −117.09833) on April 10, 2018. The deceased turtle had been at the site for at least 24 hrs and seawater would have contacted it during the prior high tide, but the animal was located above the tide line at the time of sampling. Surface seawater samples were collected in a transect at approximately 1, 20, 50, 100, and 150 m in a direct line of sight from the deceased sea turtle (n = 10). A 1 and 2 L water sample was collected at each of the five distances (n = 5 for 1 L; n = 5 for 2 L).
Water Filtration
Prior to vacuum filtration, laboratory surfaces were disinfected with a solution of 50% household bleach followed by 70% ethanol. Filtration equipment was soaked in a 10% bleach solution for 10 min, immersed in a 5% detergent solution, and rinsed thoroughly with purified water. Samples collected from aquaria (1 L tank water, n = 10) and San Diego Bay (1 L seawater, n = 23), field blanks (1 L MilliQ, n = 4), and laboratory blanks (1 L MilliQ, n = 4) were filtered through 0.45 μm Whatman cellulose nitrate membrane filters. Seawater collected near a stranded and deceased turtle was additionally filtered (2 L, n = 5) through 5.0 μm Whatman cellulose nitrate membrane filters. Filters were transferred to sterile 47 mm petri dishes using sterile tweezers and sealed with parafilm. Filters were stored at −20°C until DNA extraction (within 1 week).
DNA Extraction
Prior to DNA extraction, frozen filters (n = 46) were transferred to sterile 2 ml microcentrifuge tubes using tweezers treated with 10% bleach and MilliQ water between samples to avoid potential cross-contamination. DNA was isolated from filters using a DNeasy Blood and Tissue Kit (Qiagen, United States). The manufacturer’s protocol was followed with modifications from Renshaw et al. (2015). Briefly, filters were initially immersed in 567 μl Buffer ATL and 63 μl Proteinase K and incubated overnight at 56°C. Following incubation, 630 μl Buffer AL and 630 μl ethanol (100%) were added to the 2 ml tube. A total of four centrifuge iterations were used to load the entire contents of the 2 ml tube onto the spin column, instead of the three stipulated by Renshaw et al. (2015). DNA was eluted in a total of 150 μl of Buffer AE in two elution steps (100 μl Buffer AE with 5 min room temperature incubation, spun according to manufacturer’s instructions; 50 μl Buffer AE with 1 min incubation at room temperature, also spun according to manufacturer’s instructions). DNA extracts were stored at −80°C until further analysis.
DNA Amplification
All qPCR reactions were prepared in a bleach and UV-treated laminar flow hood in a pre-PCR room (i.e., a room not exposed to amplified DNA). Reaction mixtures included Bovine Serum Albumin (BSA) to tackle potential inhibition in samples (Strand et al., 2011; Jane et al., 2015). The qPCR reaction mixtures were identical for each primer pair and performed in a total volume of 10 μl: 5 μl iTaqTM Universal SYBR® Green Supermix (Bio-Rad); 0.3 μM of each primer; 0.5 μl BSA (Thermo Scientific); 1.9 μl milliQ water; 2 μl DNA template. Each 96-well plate contained three technical replicates per sample, three replicates of a positive control containing C. mydas DNA (1 ng/μl), and three no template controls (NTCs), in which 2 μl DNA template was replaced with 2 μl milliQ water in the reaction mixture. The plate was sealed and transported to a separate room, where qPCR was performed on a Stratagene Mx3000P. Thermal cycling conditions, based on manufacturer’s guidelines, were identical for each primer pair, except for the duration of the annealing step. Conditions were as follows: an initial denaturation step at 95°C for 2 min, followed by 40 cycles at 95°C for 5 s, and annealing step of 60°C for 45 s for LTCM2/HDCM2 or 30 s for LCMint2/H950g. The identities of qPCR products were confirmed by comparing melt curve profiles against species-specific qPCR products (tissue-derived C. mydas DNA) (Davy et al., 2015), and verified by sequencing as described below.
DNA Sequencing
Species identity of amplified products was confirmed by Sanger sequencing. qPCR products were purified using 2 μl ExoSap combined with 5 μl of qPCR product. Following purification, both strands were sequenced using BigDye Terminator v3.1 (Applied Biosystems) on an automated 3730 genetic analyser (Applied Biosystems Inc.). Obtained sequences were analysed and edited using Geneious v 11.1.5 (Biomatters). Sequences were input to NCBI BLASTn and compared against the full NCBI nt database using default settings. Negative controls were included in sequencing reactions.
Results
Assay Development
LOD and LOQ testing (Agersnap et al., 2017) with C. mydas tissue-derived DNA showed the primer pair generating the longer amplicon (LTCM2/HDCM2, 488 bp) to be less sensitive compared to the primer generating the shorter amplicon (253 bp, LCMint2/H950g). The estimated LOD of LTCM2/HDCM2 was 4 × 10⁻⁷ pg DNA per reaction compared to 4 × 10⁻⁸ pg DNA per reaction for LCMint2/H950g, based on 10-fold serial dilutions. The calculated LOQ for both LTCM2/HDCM2 and LCMint2/H950g qPCR reactions was 4 × 10⁻⁵ pg DNA per reaction. Primer pair LTCM2/HDCM2 also had lower amplification efficiency (85.8%, Table 1) compared to LCMint2/H950g (105.0%, Table 1), which was within the accepted range of 90–110% (Bustin et al., 2009).
Results of Primer-BLAST showed that LTCM2/HDCM2 was specific to C. mydas when analysed against the entire NCBI nt database (data not shown), and ecoPCR analysis showed LTCM2/HDCM2 to be specific to C. mydas with up to two mismatches on each primer, although cross-reactivity with C. caretta and L. olivacea was predicted at three mismatches on each primer (Supplementary Table S1). In comparison, LCMint2/H950g fared poorly when tested for specificity in silico using both Primer-BLAST and ecoPCR (Supplementary Table S2), with both types of analysis returning multiple non-target species. Specifically, LCMint2/H950g had no nucleotide mismatches within the forward or reverse primer for both C. mydas and C. caretta, in addition to predicted amplification of multiple marine and freshwater non-target species.
The specificity predicted for LTCM2/HDCM2 in silico was generally consistent with laboratory testing. Amplification was predicted for L. olivacea and C. caretta, but not for E. imbricata (Supplementary Table S1) and these results were found in laboratory testing (Supplementary Table S4 and Supplementary Figure S1A). Average Ct values were lower for C. mydas, indicating preferential amplification for the target species (Supplementary Table S4). However, melt curve profiles were similar for all sea turtle species amplified (Supplementary Figure S1A), indicating that melt curve analysis could not be relied upon to distinguish between the tested species (Winder et al., 2011).
For LCMint2/H950g, all non-target species analysed during laboratory specificity testing showed amplification (Supplementary Table S5). These results were generally consistent with ecoPCR analysis, except for L. olivacea which was not predicted to amplify (Supplementary Table S2). However unlike for LTCM2/HDCM2, species could be discriminated by melt curve profiles (Supplementary Figure S1B and Supplementary Table S5). Therefore, this primer pair could potentially provide species-specific detection of C. mydas. In addition, Sanger sequencing confirmed the presence of C. mydas and showed the formation of primer dimer ranging from 5 to 40 bp in length (data not shown). Primer dimer, when observed, was well separated from target amplification with a melting temperature of ∼74°C compared to ∼80.5°C for the target amplicon (Supplementary Table S5).
Assay Application
DNA amplified from water samples was confirmed as C. mydas with Sanger sequencing, consistent with the specificity testing described above. All positive and negative controls (field blanks, laboratory blanks, NTCs) performed as expected. Positive controls amplified C. mydas DNA, and no DNA amplification was observed in any of the included negative controls. A qPCR replicate with a Tm value within ± 2°C of the mean Tm value of the positive control was considered positive (Berry and Sarre, 2006).
Aquaria Trials
C. mydas eDNA was successfully amplified from all aquaria samples using both primer pairs. Primer pair LCMint2/H950g amplified 100% of the reactions, and primer pair LTCM2/HDCM2 amplified 98% of the reactions with one replicate returning a non-detect (“no Ct” value) (Table 2). Differences in the concentration of C. mydas eDNA were observed between water samples collected from Tank A-1, Tank A-2, and Tank B using both primer pairs. The greatest quantity of eDNA was observed from Tank B, followed by Tank A-2 and Tank A-1 (Table 2), consistent with observed C. mydas occupancy, behaviour, and tank volume. Tank B held fewer turtles but was substantially smaller than Tank A; therefore, turtle density was higher (Tank A = 1 turtle to 27,441 L; Tank B = 1 turtle to 6,309 L). Within Tank A, C. mydas were observed to congregate in the Tank A-1 region, consistent with qPCR results.
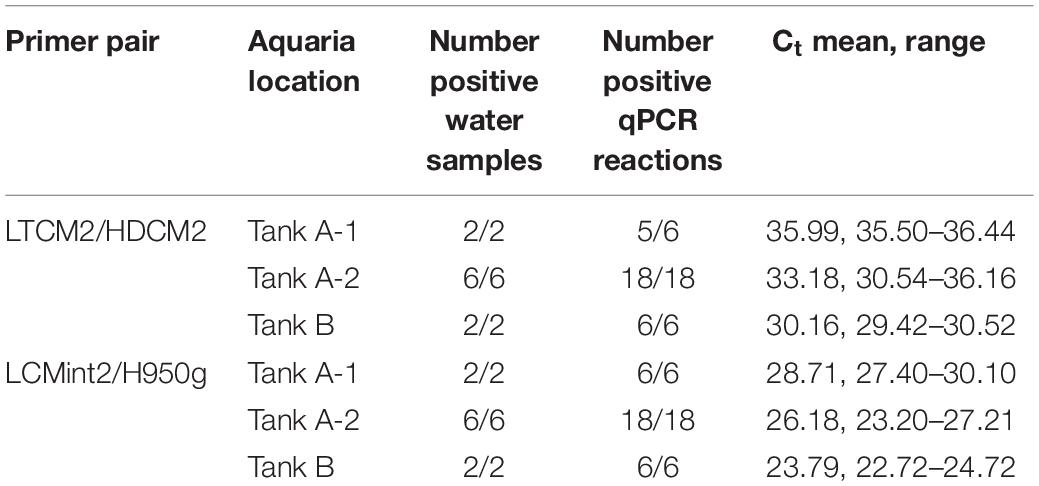
Table 2. Detection of eDNA in aquaria containing Chelonia mydas.
Field Sampling in San Diego Bay
C. mydas eDNA was successfully detected during field sampling in San Diego Bay using both primer pairs. Both sets provided a similar pattern of presence/absence results (Tables 3–5). Overall, the primer pair amplifying the shorter fragment (LCMint2/H950g) tended to provide a greater rate of detection, having more positive reactions for water samples taken close to the bottom (≈2.5 m) (Table 3) and immediately after the removal of a C. mydas from a net (Table 4).
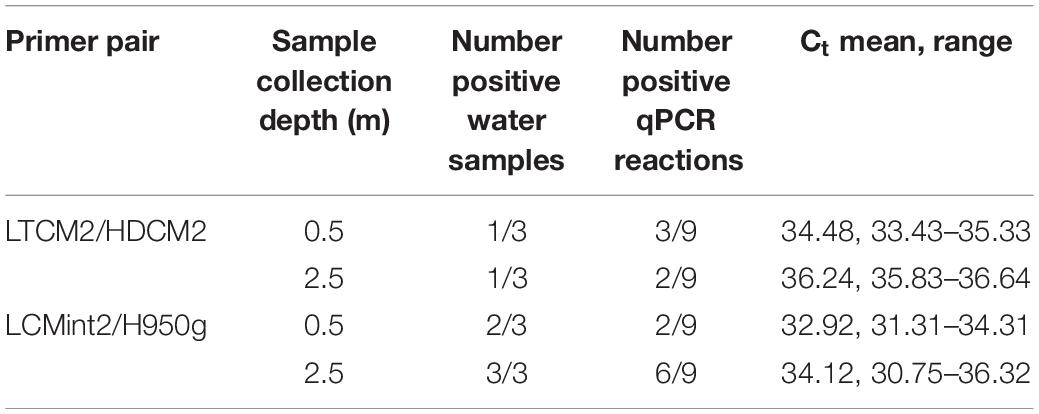
Table 3. Chelonia mydas eDNA detection in the Intake Channel of San Diego Bay with sampling depth.
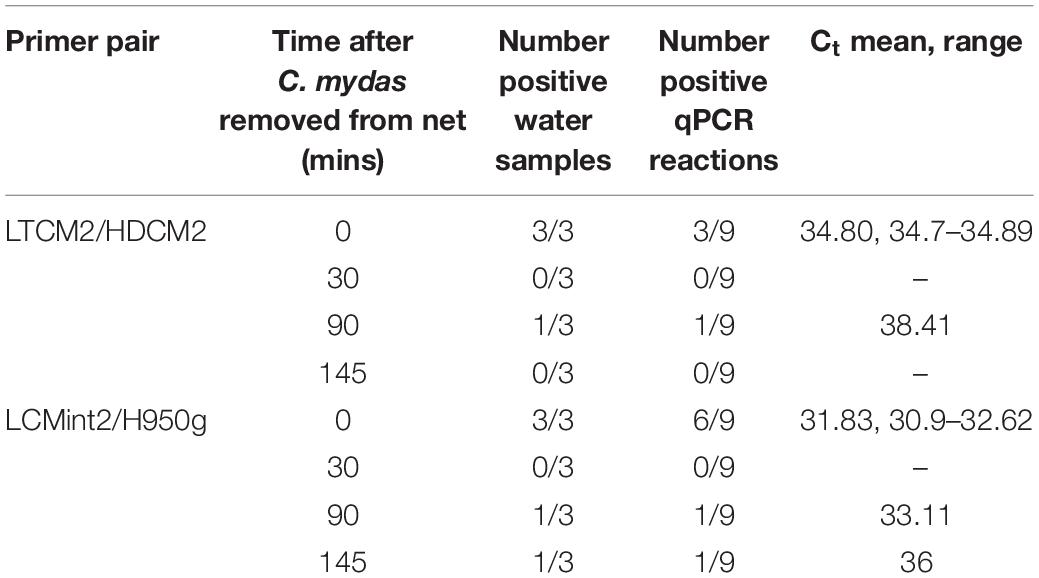
Table 4. Time series of detection of Chelonia mydas eDNA in the Intake Channel of San Diego Bay after a sea turtle was removed from a net.
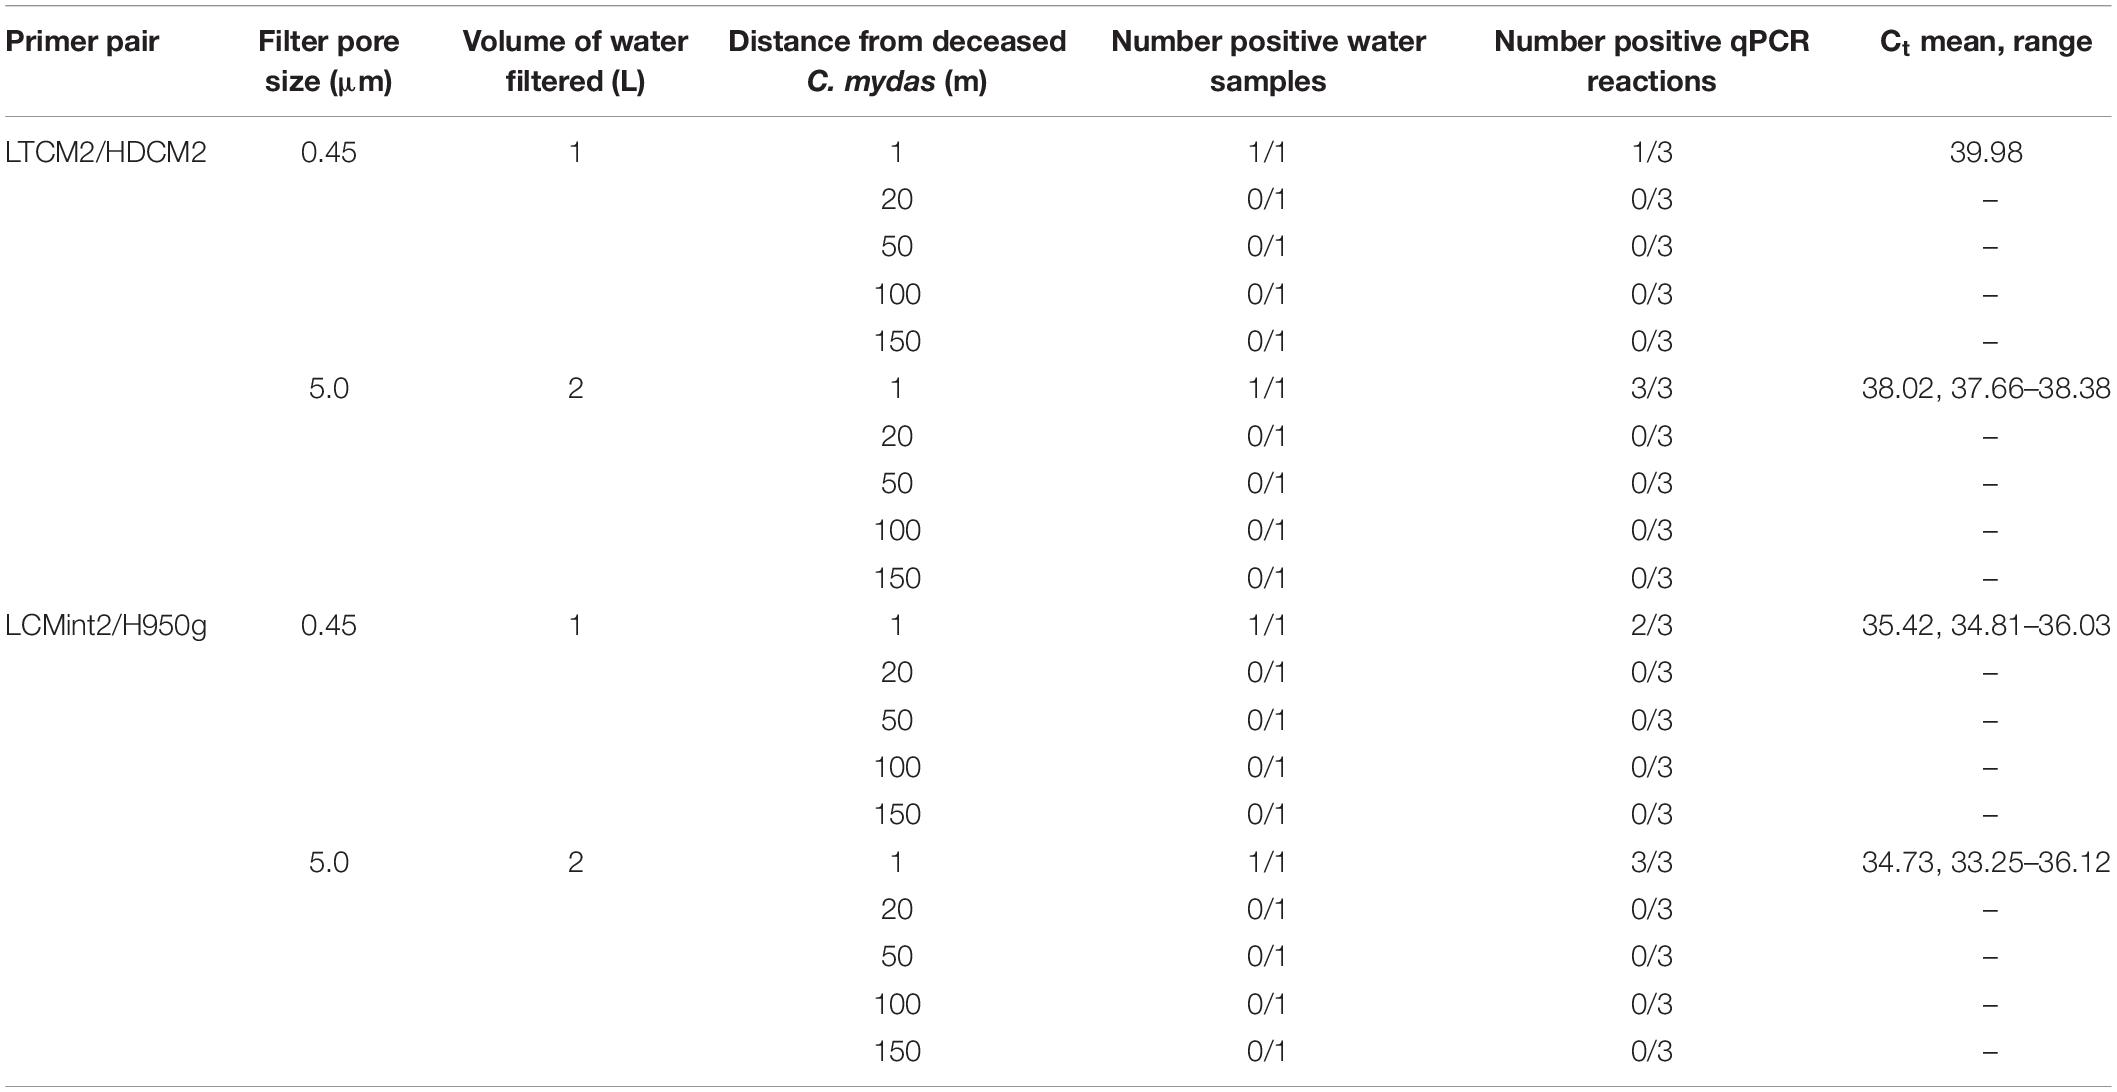
Table 5. Comparison of Chelonia mydas eDNA detection in San Diego Bay with distance from a deceased turtle present on shore.
In the first field test, visual observations of C. mydas were not available to provide comparison to C. mydas qPCR results (Table 3). The second field test provided the opportunity to collect water samples near where a captured animal was removed from the water. Immediately after the removal of C. mydas from the net (0 min), eDNA was detected by both LTCM2/HDCM2 and LCMint2/H950g primer pairs. However, the shorter primer pair LCMint2/H950g exhibited a greater number of positive qPCR replicates (Table 4). C. mydas eDNA was detected up to 145 min after removal of the individual from the net when primer pair LCMint2/H950g was used, whereas C. mydas eDNA was detected only up to 90 min after the individual was removed from the net with primer pair LTCM2/HDCM2 (Table 4). Both primer pairs failed to detect C. mydas eDNA at 30 min after the individual was removed from the net (Table 4).
The third field test provided water samples near a C. mydas carcass that was located on shore just above the water line. eDNA was detected from seawater taken in the immediate vicinity (1 m) of the C. mydas carcass. Detection was achieved by both primer pairs for both sample volumes and pore sizes (Table 5). Detection rate (i.e., number of positive qPCR replicate reactions) was higher when a larger filtration volume (2 L) and filter pore size (5.0 μm) was used (Table 5), although no biological replicates were taken. eDNA was not detected in samples collected beyond the immediate vicinity of the carcass (20, 50, 100, and 150 m from shore).
Discussion
We have demonstrated the potential to detect C. mydas from seawater without animal capture. The two eDNA assays described here employed primers known to amplify C. mydas mtDNA fragments of differing lengths. The primers were developed and optimised for population genetics studies, which typically supply relatively high yields of DNA from tissue samples. Therefore, it was unclear whether these primers would be appropriate for eDNA assays. Indeed, it was unknown whether sea turtles in the wild could actually be detected by eDNA analysis. We observed detection of C. mydas eDNA in a natural environment with the LTCM2/HDCM2 primers, reinforcing results reported previously for a mesocosm study (Kelly et al., 2014). In addition, we show for the first time the feasibility of using the LCMint2/H950g primer set for eDNA analysis.
The results of our study provide a validated approach for using eDNA to assess the presence of C. mydas. However, further study is required to optimise the assay for C. mydas eDNA detection and investigate the potential for relative abundance/biomass estimation as has been demonstrated for other assays targeting taxa from freshwater (Takahara et al., 2012; Thomsen et al., 2012; Pilliod et al., 2013; Doi et al., 2015; Buxton et al., 2017; Levi et al., 2018) and marine water (Mauvisseau et al., 2017; Nichols and Marko, 2019). Our results suggest that the primer pair producing the shorter amplicon (LCMint2/H950g, 253 bp) would be a better candidate to further develop eDNA methodologies for C. mydas than LTCM2/HDCM2, which produces a longer amplicon (488 bp). Both primer sets performed with similar success in aquaria trials (Table 2), but in vitro testing indicated that LCMint2/H950g was more suited for C. mydas eDNA detection as it showed superior amplification metrics (Table 1 and Supplementary Tables S1, S2) and cross-reactive species could be distinguished by melt-curve analysis in laboratory studies (Supplementary Figure S1B). Furthermore, LCMint2/H950g tended to be more effective when applied to water samples collected at lower depths from San Diego Bay under the same filtering conditions (Table 3), and returned more positive reactions when tested near netted and stranded animals (Tables 4, 5). Future studies using the LCMint2/H950g SYBR Green assay may wish to conduct high-resolution melting (HRM) analysis to further confirm species identity (Robinson et al., 2018), utilise Sanger sequencing, or develop a TaqMan probe for use at locations where multiple sea turtle species may be present.
The findings here are consistent with other studies that have shown shorter amplicons have improved eDNA detection rates (Bylemans et al., 2018), including at bottom sites (Jo et al., 2017). Although amplification of longer fragments may better indicate recently deposited DNA (Hänfling et al., 2016; Jo et al., 2017; Bylemans et al., 2018), eDNA assays may require short amplicons due to the typically degraded state of DNA in the environment (Rees et al., 2014; Thomsen and Willerslev, 2015; Goldberg et al., 2016; Taberlet et al., 2018; Mauvisseau et al., 2019). Future assay development could test whether amplification of an even shorter fragment might increase assay sensitivity without compromising specificity.
Amplification of C. mydas eDNA by LCMint2/H950g appeared to be specific for use in our study system. Melt curve analysis was able to distinguish non-target amplification of the tested species (Supplementary Figure S1B and Supplementary Table S5). Furthermore, potential cross-reactivity predicted in silico by ecoPCR (Supplementary Table S2) was inconsistent with ecological conditions. Of the six non-target species that could potentially amplify with LCMint2/H950g, only the freshwater common snapping turtle Chelydra serpentina is known to be present in California watersheds. However, eDNA detection of this non-native species is not anticipated because climatic conditions limit freshwater run-off to the study site. Additionally, C. serpentina has not been recorded within the drainage area of San Diego Bay (Fuller et al., 2019). For both primer sets, none of the non-target sea turtle species predicted to amplify by ecoPCR are known to be resident in San Diego Bay. Further study including primer validation and sequencing of the resultant product (Cowart et al., 2018), is recommended before applying these assays in locations where potentially cross-reactive species (Supplementary Tables S1, S2) are sympatric with C. mydas. Future studies should investigate a TaqMan probe to increase specificity (Wilcox et al., 2013). In addition, the LCMint2/H950g assay should be further optimised to eliminate primer dimer (Wilcox et al., 2015). Although primer dimer was distinguished by melt curve analysis so that only samples with amplified C. mydas DNA were designated positive, removal should improve sensitivity of the LCMint2/H950g assay.
In addition to the analytical considerations discussed above, testing C. mydas eDNA detection with water samples collected from deeper depths should be further pursued since eDNA detection can depend on species-specific life history traits (de Souza et al., 2016; Buxton et al., 2017; O’Donnell et al., 2017; Harper et al., 2018). C. mydas maintains a semi-aquatic lifestyle, returning to the surface to breathe and coming to land to breed, but predominantly remains underwater. The C. mydas population found in San Diego Bay is a foraging population, feeding on eelgrass and invertebrates (Lemons et al., 2011) primarily during the day and resting at night (MacDonald et al., 2013). Foraging brings C. mydas close to the sea floor when grazing on seagrass (Bresette et al., 2010), while resting brings C. mydas close to structured habitats for shelter such as reefs and caves (Christiansen et al., 2016). Additionally, C. mydas in other urbanised environments have been found to rest in slightly deeper bottom areas, created by tidal action, in order to extend resting time (Crear et al., 2017). The life history traits outlined above may help illuminate why C. mydas eDNA tended to be detected in more LCMint2/H950g reactions in water samples collected close to the bottom of the water column compared to those taken close to surface (Table 3).
The persistence of eDNA in the environment is of critical importance to inferring contemporary presence of a target species (Barnes and Turner, 2016; Collins et al., 2018). eDNA persistence in the aquatic environment can range from hours to days (see review by Barnes and Turner, 2016), while eDNA decay rates in marine systems range from 10 to 50 h and are influenced by temperature (Collins et al., 2018). Our preliminary investigation into C. mydas eDNA persistence (Table 4) indicated short persistence time and would infer highly contemporary C. mydas presence in a given area, which is important for rapid habitat distribution assessment. However, further investigation over a longer time period is required to accurately evaluate C. mydas eDNA persistence and decay rates, and reliably infer habitat distribution.
It has been suggested that increasing the volume of water sampled can increase eDNA yield, and thus detection sensitivity (Hunter et al., 2019). Initial testing revealed that 5 L of water filtered through a 0.45 μm pore size filter did not increase the number of field samples positive for C. mydas eDNA compared to 1 L through a 0.45 μm pore size filter (data not shown). In addition, due to the high turbidity of these samples, increasing the volume of water caused filter clogging and slowed down the filtration process to an unreasonable extent. Pre-filtering may reduce clogging, but increases cost (Takahara et al., 2012; Robson et al., 2016).
Methodology could be optimised by not only increasing the volume of water collected, but also the filter pore size. For example, in a turbid wetland system, Goldberg et al. (2018) found that any eDNA lost by increasing the filter pore size from 0.45 to 6 μm was compensated for by the increased volume of water which could be filtered. A C. mydas stranding provided us with an opportunity, albeit limited, to test this scenario. The pore size through which water was filtered was increased from 0.45 to 5.0 μm and volume of water collected was increased from 1 to 2 L (Table 5). Results showed an increased number of positive qPCR reactions and lower average Ct values, although the total number of positive samples did not increase (Table 5). These results suggest further investigation of filtration protocols that combine larger pore size with larger filtration volumes and greater biological replication is warranted.
Increasing the number of water samples collected could increase assay sensitivity and eDNA yield (Schultz and Lance, 2015). Similarly, increasing the number of qPCR replicates could enhance eDNA detection (Schultz and Lance, 2015). For example, Biggs et al. (2015) often found that only 1 of 12 qPCR replicates per eDNA sample would amplify, and ponds were classed as positive for their species of interest on this basis. Future studies should optimise sampling methodology for C. mydas by rigorously testing increasing volumes of water and filter pore sizes, as well as taking more water samples and increasing the number of qPCR replicates.
Marine eDNA studies to date have primarily used a water filtration approach versus ethanol precipitation (Hinlo et al., 2017) to collect eDNA as it allows larger volumes of water to be processed. eDNA yield can be influenced by filter type. For example, cellulose nitrate filters (as used in this study) have been reported to provide optimum eDNA yield (Renshaw et al., 2015; Hinlo et al., 2017), although different species may require different filter types for optimal eDNA analysis (Spens et al., 2017). Filtration is often conducted with ‘open’ filters, but recent studies have investigated the efficacy of ‘enclosed’ filters for eDNA capture (Spens et al., 2017; Li et al., 2018; Thomas et al., 2019). Spens et al. (2017) reported that Sterivex-GP capsule filters containing an ‘enclosed’ polyethersulfone membrane yielded higher concentrations of eDNA compared to ‘open’ cellulose nitrate filters. Given the potentially low shedding rates of aquatic reptiles, further method comparisons are needed to determine the methodology that maximises eDNA yield and detection for C. mydas.
Conclusion
The goal of this pilot study was to determine whether eDNA analysis could be applied to the detection of C. mydas in a natural marine environment. We have successfully demonstrated the capture, extraction and amplification of C. mydas eDNA from aquaria and seawater samples taken in San Diego Bay. While our assay is sufficient to detect presence of green turtles in coastal lagoons that are potential foraging areas, further research is needed before eDNA approaches can be used to determine absence (e.g., confidence in a “negative” result) of turtles in habitat assessments or determine relative densities of turtles. Currently, our approach is appropriate for rapid assessment across broad areas to identify locations for further evaluation with traditional methods, such as focused visual surveys or netting. These findings provide a baseline for future studies investigating eDNA assay design and optimisation for C. mydas, and potentially other sea turtle species. With further development and refinement, eDNA analysis represents a new tool to improve our knowledge of C. mydas distribution within San Diego Bay and surrounding waters, but also on a global scale.
Data Availability Statement
All data required to reproduce this study are included in the article/Supplementary Material.
Ethics Statement
This eDNA study was conducted as part of field studies covered by NMFS Research Permit #18238.
Author Contributions
KH, KG, PD, and LH contributed to the writing of the manuscript. KH and PD conceived the study and collected the samples from SeaWorld San Diego. KH designed the field sampling protocol, wrote the first draft, prepared all tables and figures, filtered the samples, extracted the DNA, and ran all qPCR reactions in the laboratory. KH, PD, and EL conducted the fieldwork in San Diego Bay. KH and LH designed the laboratory protocol. AF provided the reference tissue, primer advice, and primers. LH performed the ecoPCR analysis. EL ran all Sanger sequencing reactions in the laboratory. KH and KG analysed the qPCR results.
Funding
This work was funded by the NOAA Southwest Fisheries Science Center and the NOAA Office of Oceanic and Atmospheric Research’s Omics Initiative. Laboratory analysis took place at the Southwest Fisheries Science Center, La Jolla, CA, United States.
Conflict of Interest
The authors declare that the research was conducted in the absence of any commercial or financial relationships that could be construed as a potential conflict of interest.
Acknowledgments
We thank Mike Price for providing access to the Turtle Reef at SeaWorld San Diego, Garrett Lemons, Joel Schumacher, Jeffery Seminoff, and Tomo Eguchi for field assistance, Gabriela Serra-Valente, Amy Lanci, and Victoria Pease for assistance with sample processing, and laboratory analysis and management. We also thank Suzanne Roden, Brittany Hancock-Hanser, and the Frontiers peer-reviewers, whose comments and suggestions helped to improve and clarify the manuscript.
Supplementary Material
The Supplementary Material for this article can be found online at: https://www.frontiersin.org/articles/10.3389/fmars.2019.00810/full#supplementary-material
References
Adams, C. I. M., Hoekstra, L. A., Muell, M. R., and Janzen, F. J. (2019). A brief review of non-avian reptile environmental DNA (eDNA), with a case study of painted turtle (Chrysemys picta) eDNA under field conditions. Diversity 11:50. doi: 10.3390/d11040050
Agersnap, S., Larsen, W. B., Knudsen, S. W., Strand, D., Thomsen, P. F., Hesselsøe, M., et al. (2017). Monitoring of noble, signal and narrow-clawed crayfish using environmental DNA from freshwater samples. PLoS One 12:e0179261. doi: 10.1371/journal.pone.0179261
Akre, T. S., Parker, L. D., Ruther, E., Maldonado, J. E., Lemmon, L., and McInerney, N. R. (2019). Concurrent visual encounter sampling validates eDNA selectivity and sensitivity for the endangered wood turtle (Glyptemys insculpta). PLoS One 14:e0215586. doi: 10.1371/journal.pone.0215586
Baker, C. S., Steel, D., Nieukirk, S., and Klinck, H. (2018). Environmental DNA (eDNA) from the wake of the whales: droplet digital PCR for detection and species identification. Front. Mar. Sci. 5:133. doi: 10.3389/fmars.2018.00133
Barnes, M. A., and Turner, C. R. (2016). The ecology of environmental DNA and implications for conservation genetics. Conserv. Genet. 17, 1–17. doi: 10.1007/s10592-015-0775-4
Berry, O., and Sarre, S. D. (2006). Gel-free species identification using melt-curve analysis: technical article. Mol. Ecol. Notes 7, 1–4. doi: 10.1111/j.1471-8286.2006.01541.x
Biggs, J., Ewald, N., Valentini, A., Gaboriaud, C., Dejean, T., Griffiths, R. A., et al. (2015). Using eDNA to develop a national citizen science-based monitoring programme for the great crested newt (Triturus cristatus). Biol. Conserv. 183, 19–28. doi: 10.1016/j.biocon.2014.11.029
Bresette, M. J., Witherington, B. E., Herren, R. M., Bagley, D. A., Gorham, J. C., Traxler, S. L., et al. (2010). Size-class partitioning and herding in a foraging group of green turtles Chelonia mydas. Endanger. Species Res. 9, 105–116. doi: 10.3354/esr00245
Bustin, S. A., Benes, V., Garson, J. A., Hellemans, J., Huggett, J., Kubista, M., et al. (2009). The MIQE guidelines: minimum information for publication of quantitative real-time PCR experiments. Clin. Chem. 55, 611–622. doi: 10.1373/clinchem.2008.112797
Buxton, A. S., Groombridge, J. J., Zakaria, N. B., and Griffiths, R. A. (2017). Seasonal variation in environmental DNA in relation to population size and environmental factors. Sci. Rep. 7:46294. doi: 10.1038/srep46294
Bylemans, J., Furlan, E. M., Gleeson, D. M., Hardy, C. M., and Duncan, R. P. (2018). Does size matter? An experimental evaluation of the relative abundance and decay rates of aquatic environmental DNA. Environ. Sci. Technol. 52, 6408–6416. doi: 10.1021/acs.est.8b01071
Christiansen, F., Esteban, N., Mortimer, J. A., Dujon, A. M., and Hays, G. C. (2016). Diel and seasonal patterns in activity and home range size of green turtles on their foraging grounds revealed by extended Fastloc-GPS tracking. Mar. Biol. 164:10. doi: 10.1007/s00227-016-3048-y
Collins, R. A., Wangensteen, O. S., O’Gorman, E. J., Mariani, S., Sims, D. W., and Genner, M. J. (2018). Persistence of environmental DNA in marine systems. Commun. Biol. 1:185. doi: 10.1038/s42003-018-0192-6
Cowart, D. A., Breedveld, K. G. H., Ellis, M. J., Hull, J. M., and Larson, E. R. (2018). Environmental DNA (eDNA) applications for the conservation of imperiled crayfish (Decapoda: Astacidea) through monitoring of invasive species barriers and relocated populations. J. Crustacean Biol. 38, 257–266. doi: 10.1093/jcbiol/ruy007
Crear, D. P., Lawson, D. D., Seminoff, J. A., Eguchi, T., LeRoux, R. A., and Lowe, C. G. (2016). Seasonal shifts in the movement and distribution of green sea turtles Chelonia mydas in response to anthropogenically altered water temperatures. Mar. Ecol. Prog. Ser. 548, 219–232. doi: 10.3354/meps11696
Crear, D. P., Lawson, D. D., Seminoff, J. A., Eguchi, T., LeRoux, R. A., and Lowe, C. G. (2017). Habitat use and behavior of the east pacific green turtle, Chelonia mydas, in an urbanized system. Bull. South. Calif. Acad. Sci. 116, 17–32. doi: 10.3160/soca-116-01-17-32.1
Cristescu, M. E., and Hebert, P. D. N. (2018). Uses and misuses of environmental DNA in biodiversity science and conservation. Annu. Rev. Ecol. Evol. Syst. 49, 209–230. doi: 10.1146/annurev-ecolsys-110617-062306
Davy, C. M., Kidd, A. G., and Wilson, C. C. (2015). Development and validation of environmental DNA (eDNA) markers for detection of freshwater turtles. PLoS One 10:e0130965. doi: 10.1371/journal.pone.0130965
de Souza, L. S., Godwin, J. C., Renshaw, M. A., and Larson, E. (2016). Environmental DNA (eDNA) detection probability is influenced by seasonal activity of organisms. PLoS One 11:e0165273. doi: 10.1371/journal.pone.0165273
Doi, H., Uchii, K., Takahara, T., Matsuhashi, S., Yamanaka, H., and Minamoto, T. (2015). Use of droplet digital PCR for estimation of fish abundance and biomass in environmental DNA surveys. PLoS One 10:e0122763. doi: 10.1371/journal.pone.0122763
Dutton, P. H., LeRoux, R. A., LaCasella, E. L., Seminoff, J. A., Eguchi, T., and Dutton, D. L. (2019). Genetic analysis and satellite tracking reveal origin of the green turtles in San Diego Bay. Mar. Biol. 166:3.
Eguchi, T., Seminoff, J. A., LeRoux, R. A., Dutton, P. H., and Dutton, D. L. (2010). Abundance and survival rates of green turtles in an urban environment: coexistence of humans and an endangered species. Mar. Biol. 157, 1869–1877. doi: 10.1007/s00227-010-1458-9
Encalada, S. E., Lahanas, P. N., Bjorndal, K. A., Bolten, A. B., Miyamoto, M. M., and Bowen, B. W. (1996). Phylogeography and population structure of the Atlantic and Mediterranean green turtle Chelonia mydas: a mitochondrial DNA control region sequence assessment. Mol. Ecol. 5, 473–483. doi: 10.1046/j.1365-294X.1996.00108.x
Feist, S. M., Jones, R. L., Copley, J. L., Pearson, L. S., Berry, G. A., and Qualls, C. P. (2018). Development and validation of an environmental DNA method for detection of the alligator snapping turtle (Macrochelys temminckii). Chelonian Conserv. Biol. 17, 271–279. doi: 10.2744/CCB-1315.1
Ficetola, G. F., Coissac, E., Zundel, S., Riaz, T., Shehzad, W., Bessière, J., et al. (2010). An in silico approach for the evaluation of DNA barcodes. BMC Genomics 11:434. doi: 10.1186/1471-2164-11-434
Ficetola, G. F., Manenti, R., and Taberlet, P. (2019). Environmental DNA and metabarcoding for the study of amphibians and reptiles: species distribution, the microbiome, and much more. Amphib Reptil. 40, 129–148. doi: 10.1163/15685381-20191194
Ficetola, G. F., Miaud, C., Pompanon, F., and Taberlet, P. (2008). Species detection using environmental DNA from water samples. Biol. Lett. 4, 423–425. doi: 10.1098/rsbl.2008.0118
Foote, A. D., Thomsen, P. F., Sveegaard, S., Wahlberg, M., Kielgast, J., Kyhn, L. A., et al. (2012). Investigating the potential use of environmental DNA (eDNA) for genetic monitoring of marine mammals. PLoS One 7:e41781. doi: 10.1371/journal.pone.0041781
Fuller, P., Foster, A., and Somma, L. A. (2019). Chelydra serpentina (Linnaeus, 1758): U.S. Geological Survey. Gainesville, FL: Nonindigenous Aquatic Species Database.
Godoy, D. A., and Stockin, K. A. (2018). Anthropogenic impacts on green turtles Chelonia mydas in New Zealand. Endanger. Species Res. 37, 1–9. doi: 10.3354/esr00908
Goldberg, C. S., Strickler, K. M., and Fremier, A. K. (2018). Degradation and dispersion limit environmental DNA detection of rare amphibians in wetlands: increasing efficacy of sampling designs. Sci. Total Environ. 633, 695–703. doi: 10.1016/j.scitotenv.2018.02.295
Goldberg, C. S., Turner, C. R., Deiner, K., Klymus, K. E., Thomsen, P. F., Murphy, M. A., et al. (2016). Critical considerations for the application of environmental DNA methods to detect aquatic species. Methods Ecol. Evol. 7, 1299–1307. doi: 10.1111/2041-210X.12595
Hamann, M., Godfrey, M. H., Seminoff, J. A., Arthur, K., Barata, P. C. R., Bjorndal, K. A., et al. (2010). Global research priorities for sea turtles: informing management and conservation in the 21st century. Endanger. Species Res. 11, 245–269. doi: 10.3354/esr00279
Hänfling, B., Lawson Handley, L., Read, D. S., Hahn, C., Li, J., Nichols, P., et al. (2016). Environmental DNA metabarcoding of lake fish communities reflects long-term data from established survey methods. Mol. Ecol. 25, 3101–3119. doi: 10.1111/mec.13660
Hansen, B. K., Bekkevold, D., Clausen, L. W., and Nielsen, E. E. (2018). The sceptical optimist: challenges and perspectives for the application of environmental DNA in marine fisheries. Fish Fish. 19, 751–768. doi: 10.1111/faf.12286
Harper, K. J., Anucha, P., Turnbull, J. F., Bean, C. W., and Leaver, M. J. (2018). Searching for a signal: environmental DNA (eDNA) for the detection of invasive signal crayfish, Pacifastacus leniusculus (Dana, 1852). Manag. Biol. Invasions 9, 137–148. doi: 10.3391/mbi.2018.9.2.07
Hazel, J., and Gyuris, E. (2006). Vessel-related mortality of sea turtles in Queensland, Australia. Wildl. Res. 33, 149–154. doi: 10.1071/WR04097
Hinlo, R., Gleeson, D., Lintermans, M., and Furlan, E. (2017). Methods to maximise recovery of environmental DNA from water samples. PLoS One 12:e0179251. doi: 10.1371/journal.pone.0179251
Hunter, M. E., Ferrante, J. A., Meigs-Friend, G., and Ulmer, A. (2019). Improving eDNA yield and inhibitor reduction through increased water volumes and multi-filter isolation techniques. Sci. Rep. 9:5259. doi: 10.1038/s41598-019-40977-w
Hunter, M. E., Meigs-Friend, G., Ferrante, J. A., Takoukam Kamla, A., Dorazio, R. M., Keith-Diagne, L., et al. (2018). Surveys of environmental DNA (eDNA): a new approach to estimate occurrence in Vulnerable manatee populations. Endanger. Species Res. 35, 101–111. doi: 10.3354/esr00880
IUCN, (2019). The IUCN Red List of Threatened Species. Version 2019-2. Available at: http://www.iucnredlist.org (accessed August 29, 2019).
Jackson, M. V., Kennett, R., Bayliss, P., Warren, R., Waina, N., Adams, J., et al. (2015). Developing collaborative marine turtle monitoring in the Kimberley region of northern Australia. Ecol. Manag. Restor. 16, 163–176. doi: 10.1111/emr.12184
Jane, S. F., Wilcox, T. M., McKelvey, K. S., Young, M. K., Schwartz, M. K., Lowe, W. H., et al. (2015). Distance, flow and PCR inhibition: eDNA dynamics in two headwater streams. Mol. Ecol. Resour. 15, 216–227. doi: 10.1111/1755-0998.12285
Jo, T., Murakami, H., Masuda, R., Sakata, M. K., Yamamoto, S., and Minamoto, T. (2017). Rapid degradation of longer DNA fragments enables the improved estimation of distribution and biomass using environmental DNA. Mol. Ecol. Resour. 17, e25–e33. doi: 10.1111/1755-0998.12685
Kelly, R. P., Port, J. A., Yamahara, K. M., and Crowder, L. B. (2014). Using environmental DNA to census marine fishes in a large mesocosm. PLoS One 9:e86175. doi: 10.1371/journal.pone.0086175
Komoroske, L. M., Jensen, M. P., Stewart, K. R., Shamblin, B. M., and Dutton, P. H. (2017). Advances in the application of genetics in marine turtle biology and conservation. Front. Mar. Sci. 4:156. doi: 10.3389/fmars.2017.00156
Komoroske, L. M., Lewison, R. L., Seminoff, J. A., Deheyn, D. D., and Dutton, P. H. (2011). Pollutants and the health of green sea turtles resident to an urbanized estuary in San Diego, CA. Chemosphere 84, 544–552. doi: 10.1016/j.chemosphere.2011.04.023
Kundu, S., Kumar, V., Tyagi, K., and Chandra, K. (2018). Environmental DNA (eDNA) testing for detection of freshwater turtles in Temple pond. Herpetol. Notes 11, 369–371.
Lacoursière-Roussel, A., Dubois, Y., Normandeau, E., and Bernatchez, L. (2016). Improving herpetological surveys in eastern North America using the environmental DNA method. Genome 59, 991–1007. doi: 10.1139/gen-2015-0218
Lafferty, K. D., Benesh, K. C., Mahon, A. R., Jerde, C. L., and Lowe, C. G. (2018). Detecting southern California’s white sharks with environmental DNA. Front. Mar. Sci. 5:355. doi: 10.3389/fmars.2018.00355
Lemons, G., Lewison, R., Komoroske, L., Gaos, A., Lai, C.-T., Dutton, P., et al. (2011). Trophic ecology of green sea turtles in a highly urbanized bay: insights from stable isotopes and mixing models. J. Exp. Mar. Bio. Ecol. 405, 25–32. doi: 10.1016/j.jembe.2011.05.012
Levi, T., Allen, J. M., Bell, D., Joyce, J., Russell, J. R., Tallmon, D. A., et al. (2018). Environmental DNA for the enumeration and management of Pacific salmon. bioRxiv [Preprint]. doi: 10.1111/1755-0998.12987
Li, J., Lawson Handley, L.-J., Read, D. S., and Hänfling, B. (2018). The effect of filtration method on the efficiency of environmental DNA capture and quantification via metabarcoding. Mol. Ecol. Resour. 18, 1102–1114. doi: 10.1111/1755-0998.12899
MacDonald, B. D., Lewison, R. L., Madrak, S. V., Seminoff, J. A., and Eguchi, T. (2012). Home ranges of East Pacific green turtles Chelonia mydas in a highly urbanized temperate foraging ground. Mar. Ecol. Prog. Ser. 461, 211–221. doi: 10.3354/meps09820
MacDonald, B. D., Madrak, S. V., Lewison, R. L., Seminoff, J. A., and Eguchi, T. (2013). Fine scale diel movement of the east Pacific green turtle, Chelonia mydas, in a highly urbanized foraging environment. J. Exp. Mar. Bio. Ecol. 443, 56–64. doi: 10.1016/j.jembe.2013.02.033
Madrak, S. V., Lewison, R. L., Seminoff, J. A., and Eguchi, T. (2016). Characterizing response of East Pacific green turtles to changing temperatures: using acoustic telemetry in a highly urbanized environment. Anim. Biotelem. 4:22.
Mauvisseau, Q., Burian, A., Gibson, C., Brys, R., Ramsey, A., and Sweet, M. (2019). Influence of accuracy, repeatability and detection probability in the reliability of species-specific eDNA based approaches. Sci. Rep. 9:580. doi: 10.1038/s41598-018-37001-y
Mauvisseau, Q., Parrondo, M., Fernández, M. P., García, L., Martínez, J. L., García-Vázquez, E., et al. (2017). On the way for detecting and quantifying elusive species in the sea: the Octopus vulgaris case study. Fish. Res. 191, 41–48. doi: 10.1016/j.fishres.2017.02.023
McDonald, D., Dutton, P., Mayer, D., and Merkel, K. (1994). Review of the Green Turtles of South San Diego Bay in Relation to the Operations of the SDG&E South Bay Power Plant. Doc 94-045-01. San Diego, CA: San Diego Gas & Electric Co.
National Oceanic and Atmospheric Administration Marine Debris Program, (2014). Report on the Entanglement of Marine Species in Marine Debris with an Emphasis on Species in the United States. Silver Spring, MD: National Oceanic and Atmospheric Administration Marine Debris Program, 28.
National Research Council, Division on Earth, and Life Studies, Ocean Studies Board, Committee on the Review of Sea Turtle Population Assessment Methods, (2010). Assessment of Sea-Turtle Status and Trends: Integrating Demography and Abundance. Washington DC: The National Academies Press, 174.
Nichols, P. K., and Marko, P. B. (2019). Rapid assessment of coral cover from environmental DNA in Hawai’i. Environ. DNA 1, 40–53. doi: 10.1002/edn3.8
O’Donnell, J. L., Kelly, R. P., Shelton, A. O., Samhouri, J. F., Lowell, N. C., and Williams, G. D. (2017). Spatial distribution of environmental DNA in a nearshore marine habitat. PeerJ 5:e3044. doi: 10.7717/peerj.3044
Pilliod, D. S., Goldberg, C. S., Arkle, R. S., and Waits, L. P. (2013). Estimating occupancy and abundance of stream amphibians using environmental DNA from filtered water samples. Can. J. Fish. Aquat. Sci. 70, 1123–1130. doi: 10.1139/cjfas-2013-0047
Raemy, M., and Ursenbacher, S. (2018). Detection of the European pond turtle (Emys orbicularis) by environmental DNA: is eDNA adequate for reptiles? Amphib Reptil. 39, 135–143. doi: 10.1163/15685381-17000025
Rees, A. F., Alfaro-Shigueto, J., Barata, P. C. R., Bjorndal, K. A., Bolten, A. B., Bourjea, J., et al. (2016). Are we working towards global research priorities for management and conservation of sea turtles? Endanger. Species Res. 31, 337–382. doi: 10.3354/esr00801
Rees, A. F., Avens, L., Ballorain, K., Bevan, E., Broderick, A. C., Carthy, R. R., et al. (2018). The potential of unmanned aerial systems for sea turtle research and conservation: a review and future directions. Endanger. Species Res. 35, 81–100. doi: 10.3354/esr00877
Rees, H. C., Maddison, B. C., Middleditch, D. J., Patmore, J. R. M., and Gough, K. C. (2014). REVIEW: the detection of aquatic animal species using environmental DNA - a review of eDNA as a survey tool in ecology. J. Appl. Ecol. 51, 1450–1459. doi: 10.1111/1365-2664.12306
Renshaw, M. A., Olds, B. P., Jerde, C. L., McVeigh, M. M., and Lodge, D. M. (2015). The room temperature preservation of filtered environmental DNA samples and assimilation into a phenol-chloroform-isoamyl alcohol DNA extraction. Mol. Ecol. Resour. 15, 168–176. doi: 10.1111/1755-0998.12281
Robinson, C. V., Uren Webster, T. M., Cable, J., James, J., and Consuegra, S. (2018). Simultaneous detection of invasive signal crayfish, endangered white-clawed crayfish and the crayfish plague pathogen using environmental DNA. Biol. Conserv. 222, 241–252. doi: 10.1016/j.biocon.2018.04.009
Robson, H. L. A., Noble, T. H., Saunders, R. J., Robson, S. K. A., Burrows, D. W., and Jerry, D. R. (2016). Fine-tuning for the tropics: application of eDNA technology for invasive fish detection in tropical freshwater ecosystems. Mol. Ecol. Resour. 16, 922–932. doi: 10.1111/1755-0998.12505
Roussel, J.-M., Paillisson, J.-M., Tréguier, A., and Petit, E. (2015). The downside of eDNA as a survey tool in water bodies. J. Appl. Ecol. 52, 823–826. doi: 10.1111/1365-2664.12428
Schultz, M. T., and Lance, R. F. (2015). Modeling the sensitivity of field surveys for detection of environmental DNA (eDNA). PLoS One 10:e0141503. doi: 10.1371/journal.pone.0141503
Spens, J., Evans, A. R., Halfmaerten, D., Knudsen, S. W., Sengupta, M. E., Mak, S. S. T., et al. (2017). Comparison of capture and storage methods for aqueous macrobial eDNA using an optimized extraction protocol: advantage of enclosed filter. Methods Ecol. Evol. 8, 635–645. doi: 10.1111/2041-210X.12683
Stinson, M. L. (1984). Biology of Sea Turtles in San Diego Bay, California, and the Northeastern Pacific Ocean. Master’s thesis, San Diego State University: San Diego, CA.
Strand, D. A., Holst-Jensen, A., Viljugrein, H., Edvardsen, B., Klaveness, D., Jussila, J., et al. (2011). Detection and quantification of the crayfish plague agent in natural waters: direct monitoring approach for aquatic environments. Dis. Aquat. Organ. 95, 9–17. doi: 10.3354/dao02334
Taberlet, P., Bonin, A., Zinger, L., and Coissac, E. (2018). Environmental DNA: for Biodiversity Research and Monitoring. Oxford: Oxford University Press. doi: 10.1093/oso/9780198767220.001.0001
Takahara, T., Minamoto, T., Yamanaka, H., Doi, H., and Kawabata, Z. (2012). Estimation of fish biomass using environmental DNA. PLoS One 7:e35868. doi: 10.1371/journal.pone.0035868
Thomas, A. C., Nguyen, P. L., Howard, J., and Goldberg, C. S. (2019). A self-preserving, partially biodegradable eDNA filter. Methods Ecol. Evol. 10, 1136–1141. doi: 10.1111/2041-210X.13212
Thomsen, P. F., Iversen, L. L., Wiuf, C., Rasmussen, M., Gilbert, M. T. P., Orlando, L., et al. (2012). Monitoring endangered freshwater biodiversity using environmental DNA. Mol. Ecol. 21, 2565–2573. doi: 10.1111/j.1365-294X.2011.05418.x
Thomsen, P. F., and Willerslev, E. (2015). Environmental DNA – an emerging tool in conservation for monitoring past and present biodiversity. Biol. Conserv. 183, 4–18. doi: 10.1016/j.biocon.2014.11.019
Tréguier, A., Paillisson, J.-M., Dejean, T., Valentini, A., Schlaepfer, M. A., and Roussel, J.-M. (2014). Environmental DNA surveillance for invertebrate species: advantages and technical limitations to detect invasive crayfish Procambarus clarkii in freshwater ponds. J. Appl. Ecol. 51, 871–879. doi: 10.1111/1365-2664.12262
Turner-Tomaszewicz, C., and Seminoff, J. A. (2012). Turning off the heat: impacts of power plant decommissioning on green turtle research in San Diego bay. Coast. Manage. 40, 73–87. doi: 10.1080/08920753.2012.640267
Wilcox, T. M., Carim, K. J., McKelvey, K. S., Young, M. K., and Schwartz, M. K. (2015). The dual challenges of generality and specificity when developing environmental DNA markers for species and subspecies of Oncorhynchus. PLoS One 10:e0142008. doi: 10.1371/journal.pone.0142008
Wilcox, T. M., McKelvey, K. S., Young, M. K., Jane, S. F., Lowe, W. H., Whiteley, A. R., et al. (2013). Robust detection of rare species using environmental DNA: the importance of primer specificity. PLoS One 8:e59520. doi: 10.1371/journal.pone.0059520
Wilson, J.-J., Sing, K.-W., Chen, P.-N., and Zieritz, A. (2018). Tracking the southern river terrapin (Batagur affinis) through environmental DNA: prospects and challenges. Mitochondrial DNA A DNA Mapp. Seq. Anal. 29, 862–866. doi: 10.1080/24701394.2017.1373109
Winder, L., Phillips, C., Richards, N., Ochoa-Corona, F., Hardwick, S., Vink, C. J., et al. (2011). Evaluation of DNA melting analysis as a tool for species identification: DNA melt analysis for species identification. Methods Ecol. Evol. 2, 312–320. doi: 10.1111/j.2041-210X.2010.00079.x
Keywords: eDNA, marine, sea turtle, Chelonia mydas, qPCR, mtDNA, habitat distribution, presence
Citation: Harper KJ, Goodwin KD, Harper LR, LaCasella EL, Frey A and Dutton PH (2020) Finding Crush: Environmental DNA Analysis as a Tool for Tracking the Green Sea Turtle Chelonia mydas in a Marine Estuary. Front. Mar. Sci. 6:810. doi: 10.3389/fmars.2019.00810
Received: 01 October 2019; Accepted: 16 December 2019;
Published: 20 January 2020.
Edited by:
Michele Thums, Australian Institute of Marine Science (AIMS), AustraliaReviewed by:
Benjamin Mayne, Commonwealth Scientific and Industrial Research Organisation (CSIRO), AustraliaTiffany Simpson, Curtin University, Australia
Copyright © 2020 Harper, Goodwin, Harper, LaCasella, Frey and Dutton. This is an open-access article distributed under the terms of the Creative Commons Attribution License (CC BY). The use, distribution or reproduction in other forums is permitted, provided the original author(s) and the copyright owner(s) are credited and that the original publication in this journal is cited, in accordance with accepted academic practice. No use, distribution or reproduction is permitted which does not comply with these terms.
*Correspondence: Kirsten J. Harper, a2lyc3Rlbi5oYXJwZXJAbm9hYS5nb3Y=; ZHJraXJzdGVuamhhcnBlckBnbWFpbC5jb20=