 K. J. Steinman1*
 T. R. Robeck1
 G. A. Fetter2T. L. Schmitt3S. Osborn4
 S. DiRocco5H. H. Nollens6
 J. K. O’Brien1†
- 1SeaWorld and Busch Gardens Species Preservation Laboratory, SeaWorld Parks and Entertainment, Inc., San Diego, CA, United States
- 2San Diego Zoo Global, Institute for Conservation Research, San Diego, CA, United States
- 3SeaWorld Parks and Entertainment, Inc., SeaWorld California, San Diego, CA, United States
- 4SeaWorld Parks and Entertainment, Inc., SeaWorld Texas, San Antonio, TX, United States
- 5SeaWorld Parks and Entertainment, Inc., SeaWorld Florida, Orlando, FL, United States
- 6SeaWorld Parks and Entertainment, Inc., Orlando, FL, United States
Comparisons of circulating and excreted corticosteroid profiles during a biological stress response could provide more data concerning the timing and magnitude of acute hormone changes in different sample matrices. A stress test was performed in 13 zoo-based killer whales (Orcinus orca) whereby animals were elevated out of the water on a rising lift-bottom platform for 20 min. Paired blood and feces were tested for cortisol, corticosterone, aldosterone, and their metabolites and hematological and serum chemistry parameters. Circulating corticosteroids significantly increased during the stress test and returned to pre-treatment concentrations within 24 h, indicating hypothalamic-pituitary-adrenal-axis activation. Concentrations of fecal corticosteroid metabolites did not change significantly during the stress test. Significant differences between pre-test levels and the stress test stage were observed for counts of white blood cells and absolute neutrophils, consistent with a stress leukogram. For serum chemistry, significant deviations from baseline levels were seen for the majority (20/37) of measured parameters. This study provides a direct measurement of the physiologic response of clinically healthy killer whales to a stress event. However, due to the lack of significant changes in fecal hormone metabolite profiles, further investigation of the excretory dynamics of corticosteroids during acute and chronic stress is warranted.
Introduction
Maintenance of physiological homeostasis in response to rapid (acute) or long-term (chronic) environmental, cognitive or physical changes requires corticosteroids, which include both glucocorticoids (GCs), such as cortisol or corticosterone, and mineralocorticoids (MCs), such as aldosterone. The physiologic response to a stressor typically involves the activation of the hypothalamic-pituitary-adrenal (HPA) axis whereby the hypothalamus releases corticotropin releasing factor which stimulates the release of adrenocorticotropic hormone (ACTH) from the anterior pituitary gland. ACTH then acts directly on the adrenal gland to stimulate the secretion of GCs and MCs into systemic circulation (Axelrod and Reisine, 1984). Glucocorticoid measurements are rapidly becoming the preferred method in wildlife species for detecting animals or populations of animals experiencing increased or atypical stressors in their environment (Wasser et al., 2000; Touma and Palme, 2005; Palme, 2019). These hormonal indices represent potential markers of animal health and welfare under a variety of conditions and stakeholders can use this information when drafting and implementing environmental and animal management policies (Ayres et al., 2012). However, a multitude of factors independent of stress such as age, sex, reproductive state, season, and time of day can influence circulating concentrations of these hormones (Touma and Palme, 2005; Palme, 2019). It follows that inferences based on GC measures and their relationship to stress and the environment should be based on a sound understanding of the natural patterns and fluctuations of these hormones.
Though circulating concentrations of GCs represent a common method of assessing biological stress, opportunities for comprehensive assessment via routine or longitudinal blood sampling are infrequent or altogether impossible for most species of wildlife. Further, stress responses associated with the handling of an animal can be reflected fairly quickly in circulating concentrations of GCs, which may then influence study findings and interpretation (Touma and Palme, 2005; Palme, 2019). Finally, circadian and pulsatile secretion influence circulating GC concentrations and a result from one sample that only represents a snapshot in time can be misleading. Therefore, these episodic-influenced, circulatory hormone data are insufficient for evaluating environmental or physical conditions that can have long-term cumulative impacts on a species’ health and welfare. Steroid analysis of excreted samples including feces and respiratory exhalants can address some of the limitations associated with blood sample analysis (Hunt et al., 2006; Richard et al., 2017; Wasser et al., 2017; Palme, 2019). The effects of circulating episodic or pulsatile variations on fecal or urinary steroid concentrations are reduced because of the accumulation of these changes over time within these excretory products. However, because metabolism and excretion of steroid hormones is species dependent, each species must be evaluated independently (Touma and Palme, 2005; Palme, 2019).
Collection of excreted samples typically does not involve animal handling, or is only minimally invasive, and can occur more frequently. Non-invasive collection methods also make it possible to study free-ranging populations of animals, where blood collection is challenging. Steroid hormone assays must be thoroughly validated because excretion of circulating steroid hormones in the mammalian gut is dependent on metabolization or modification and only metabolites are present in the feces (Touma and Palme, 2005; Palme, 2019). Additionally, the specificity of antibodies and assay systems may not allow for accurate measurement of these now metabolized hormones. A comparison of two GC antibodies and assay systems in fecal extracts of several carnivore species revealed that the cortisol antibody was preferable for some species, while the corticosterone antibody was preferable in others (Young et al., 2004). Both a cortisol and a corticosterone enzyme immunoassay (EIA) have been validated for use with killer whale sera (O’Brien et al., 2017; Robeck et al., 2017) but their suitability for measuring fecal glucocorticoid metabolites (FGCMs) has yet to be determined. Furthermore, antibody cross-reactivity with other hormone metabolites (i.e., lack of antibody specificity) is a potential concern. Typically, a cross-reactivity of <1% is considered an acceptable threshold for circulating concentrations and would have minimal effect on the target hormone concentrations (Hunt et al., 2006). However, fecal hormone concentrations are orders of magnitude higher compared to circulating concentrations and even a 0.1% cross-reactivity of a non-targeted hormone would influence excreted hormone metabolite measures (Hunt et al., 2006). Furthermore, structural similarities of fecal androgen metabolites to FGCMs could affect binding to the GC antibody, resulting in inaccurate GC measurements (Ganswindt et al., 2003). In view of the elevated androgen concentrations documented during late pregnancy in the killer whale (Robeck et al., 2017; Legacki et al., 2019), as well as seasonal and sexual maturity influences on androgens in males (O’Brien et al., 2017), the choice of GC antibody is crucial for understanding stress response dynamics in this species. High performance liquid chromatography (HPLC) allows for the separation and characterization of androgen and GC metabolites, and the assay systems are then used with the HPLC fractions to check for any cross-reactivity with the antibodies.
In zoo-based killer whales, blood samples for hematology and serum chemistry are routinely tested as part of preventative animal health assessment programs, and monitoring occurs throughout all phases of growth, development, reproduction, and senescence (Nollens et al., 2019). Although normal reference ranges during these varied biological phases of life were established, almost no information exists on the relationship of hematological and serum chemistry parameters to GCs and/or MCs in the killer whale. For all mammalian species analyzed, GC and MC secretion can influence serum chemistry and hematology parameters. Elevated GCs cause increases in circulating glucose concentrations (Tataranni et al., 1996), and aldosterone plays a direct role in the renin:angiotensin system, and osmoregulation and, hence, may influence sodium and potassium concentrations (Morris, 1981). Although no information exists on these relationships within the killer whale, several studies were conducted concerning adrenal hormones and/or serum chemistry and hematology relationships in other cetacean species, in particular, the bottlenose dolphin (Tursiops truncatus) and the beluga (Delphinapterus leucas). For wild bottlenose dolphins, analysis of paired blood samples collected immediately post-capture and just prior to release after an approximately 1.5 h health assessment found increases in cortisol, ACTH, and some catecholamines (Fair et al., 2014), while another study, which had total restraint times of less than 40 min, found no significant relationships between restraint time and concentrations of cortisol, corticosterone and aldosterone when comparing duration of restraint times in this species (Ortiz and Worthy, 2000). In addition to comparisons of hormone concentrations, serum chemistry changes during capture and restraint were examined in the beluga, whereby capture of wild animals increased concentrations of cortisol, aldosterone, glucose, iron, potassium, creatine kinase, aspartate aminotransferase, and gamma-glutamyltranspeptidase as well as induced lymphopenia, eosinopenia, and neutrophilia (St. Aubin and Geraci, 1996). In zoo-based beluga, removal from water experiments resulted in increased cortisol and aldosterone, eosinopenia, lymphopenia, hyperglycemia, hyperphosphatemia, and hypercholesterolemia (Schmitt et al., 2010). Additionally, physiological stress response tests via administration of ACTH or dexamethasone were performed in the bottlenose dolphin, and analysis included serum and hematological parameters and adrenal hormones (Thomson and Geraci, 1986; Reidarson and McBain, 1999). During the ACTH challenge, cortisol and aldosterone increased and eosinopenia occurred (Thomson and Geraci, 1986). Dexamethasone administration resulted in decreased cortisol, neutrophilia, eosinopenia, and lymphopenia (Reidarson and McBain, 1999). In studies of wild animals, acquiring blood samples involves capture and restraint of animals under likely stressful conditions making it impossible to establish baseline reference values in these instances. Hence, collection methodology likely influences the animal’s physiology. Meanwhile, in a zoo-based environment, animals are conditioned using positive reinforcement training for blood and fecal collection as part of routine husbandry and management, and therefore, collection methodologies have minimal influence.
Analysis of GCs and their metabolites in killer whale sera and feces has been previously reported (Ayres et al., 2012; Wasser et al., 2017 [feces]; O’Brien et al., 2017; Robeck et al., 2017 [sera]). Yet the relationship between circulating and excretory GCs in this species is unknown and no studies of aldosterone in this species exist to our knowledge. Accordingly, our objectives were to: (1) Determine if previously validated GC antibodies for killer whale sera were appropriate for measuring FGCMs; (2) Determine the suitability of an aldosterone enzyme immunoassay (EIA) for use in killer whale sera and feces; (3) Quantify corticosteroid measures in blood and feces prior to and after an induced acute stress event; and (4) Determine if any correlation exists between changes in serum hormones and serum chemistry and hematological parameters.
Materials and Methods
All samples were collected as part of routine veterinary procedures for killer whales and at the discretion of the attending veterinarian. All procedures described within were reviewed and approved by the SeaWorld Parks and Entertainment Incorporated Research Review Committee and were performed in strict accordance with the US Animal Welfare Act for the care of Marine Mammals.
Study Animals and Time Period
Killer whales were housed at three separate SeaWorld locations in the United States (Orlando, San Antonio, and San Diego). Enclosures contained a minimum of 19,000 m3 of either natural processed or manufactured salt water kept at approximately 14°C year round. Animals were fed a diet consisting of frozen-thawed whole fish including some or all of the following fish: Pacific herring (Clupea harengus); sardines (Sardinops sagax); Pacific mackerel (Scomber japonicus); capelin (Mallotus villosus); and pink salmon (Oncorhynchus gorbuscha) at approximately 2–3% of their body weight per day. Per standard husbandry management, animal care and training staff feed animals and animals do not have access to food overnight. This diet is given to the animals throughout the day with start times varying seasonally from 07:00 to 09:00. Their diet is spread amongst a minimum of eight interactive and variable sessions throughout the day. Intervals between sessions may range from a few minutes to a few hours, and are spread throughout days of no less than 9 h time periods. All fish were graded for human consumption. Animals were supplemented with Vita-Zu Marine Mammal tablets without Vitamin A (Mazuri, St. Louis, MO, United States).
Killer whales are socially managed within the habitat to maintain conspecific relationships between family and non-family members. The animals have opportunities for choice and control through several motion-activated autonomous enrichment devices (water sprayers, sensory, visual, and auditory stimuli). The animals are provided kelp (Macrocystis spp.) and puzzles or mazes on a variable schedule, and are provided over 50 environmental enrichment items during several types of interactions. These items include mirrors and physical enrichment items of varying buoyancy (e.g., balls, natural kelp, plastic barrels, hoops, rubber balls). The killer whales’ positive operant conditioning program additionally consists of learning, play, husbandry, relationship building, research, and educational interactions on a variable basis that are conducted either at the surface or through underwater viewing windows, and that are designed to provide mental stimulation and social bonding with the training staff. The killer whales participate in veterinary approved and supervised exercise programs to maintain physical fitness.
Experimental Design
In an attempt to stimulate the adrenal cortex and induce a biological stress response, we used an out-of-water stress response test similar, but shorter in duration (20 min versus 2 h), to a previously published work in bottlenose dolphins (Champagne et al., 2018). All animals had been preconditioned for routine entry into the medical pool for a minimum of 2 years prior to study initiation. Additionally, all animals were previously and regularly (minimum of 12 times over the preceding 2-year period) lifted on the platform for short durations (<5 min) to either condition the animals to the experience or to conduct physical exams. Twenty minutes was chosen as the time period the animals were held out of the water because it represents an amount of time which is generally adequate to perform standard physical exams and most minor veterinary procedures. This was also the maximum amount of time for the lift subjectively permitted by our institutional research review committee. For the experiment, clinically healthy killer whales (n = 13, Table 1) voluntarily entered a shaded (to eliminate any direct sunlight) medical pool equipped with a fast-rising lifting bottom which was then used to beach the animals for a 20 min out-of-water trial. A minimum of six inches to two feet of water remained in the medical pool during the procedure and cold seawater was sprayed onto animals to prevent skin drying. The raising and lowering of the lift bottom takes 1 min for each part; thus the total duration of the stress test including, raising, out-of-water, and lowering time was 22 min. Immediately after the lowering of the lift-bottom, animals were gated out of the medical pool into their normal habitat for the rest of the experiment. Blood and fecal samples were collected 30 min prior to the lifting procedure, immediately after, during recovery and once daily for the following 2 days (Table 1). All animals were fasted overnight throughout the study period as per standard daily husbandry management.
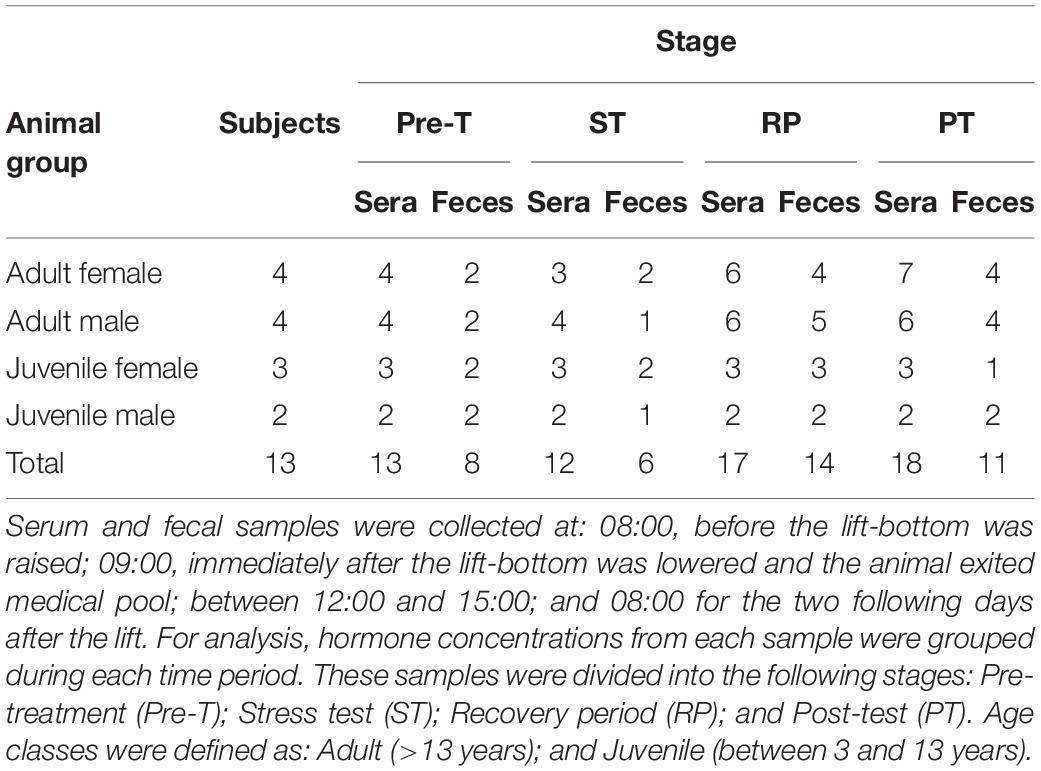
Table 1. Age and sex classification of study animals and number of samples collected during study.
Sample Collection
Blood samples (n = 51) were collected unrestrained with each animal presenting its ventral fluke surface to the attending veterinarian for venipuncture of the central fluke vein using a 19 gauge, 1.5 inch needle. Approximately 30 cc of whole blood was collected into BD Vacutainers (Becton Dickinson, Franklin Lakes, NJ, United States) containing either K-EDTA or activated thrombin. Samples were centrifuged at 1500 rpm for 10 min and the serum was decanted and frozen at −80°C for further testing. Whole blood-EDTA treated samples were used for hematology and serum was used for biochemistry and hormone analyses. All samples were processed within 30 min of collection.
Fecal samples (n = 37) were also collected unrestrained with each whale stationing upside down adjacent to the edge of the pool. An 18 French red rubber catheter (Kendall, Covidien, Mansfield, MA, United States) was inserted 30 cm into the rectum. Next, a 60 ml catheter tip syringe (Monoject, Covidien) was used to introduce 60–120 ml of sterile, physiological saline solution (Henry Schein, Melville, NY, United States) into the colon, and then the fluid feces mixture was gently aspirated back into the syringe. Fecal fluid was dark green to brown in color. Fecal samples were immediately transported to the laboratory and centrifuged at 1000 rpm for 5 min. The supernatant was decanted and the remaining pellet was frozen at −80°C until further processing and testing. Fecal samples were not always able to be collected at every stage for all 13 animals (Table 1). If the animal defecated in the enclosure pools prior to the collection, this resulted in an unsuccessful collection on the next attempt; collection of fecal material from the enclosure pools after defecation was also not possible as fecal material dissipates almost instantaneously after defecation, unlike what occurs in wild killer whales where fecal samples can float on the surface of the water up to 45 min post-defecation (Ayres et al., 2012).
To control for possible seasonal effects on hormone concentrations, the biological stress response test was conducted from March 17th through June 19th, 2015 and each animal was only used once during the experiment. To control for possible diurnal variation influence on corticosteroid measures, samples collected after 15:00 during each day of the trial were not used. Husbandry and veterinary staff monitored animals throughout the study period using routine, standardized protocols.
Sample Processing and Extraction
Hematological and Serum Chemistry Parameters
To look for effects of an acute stress response on killer whale hematology and serum chemistry profiles, the following analytes were measured at each stage as previously described (Robeck and Nollens, 2013; Nollens et al., 2019): red blood cells (RBC); hemoglobin (Hb); hematocrit (Hct); mean corpuscular volume (MCV); mean corpuscular hemoglobin (MCH); mean corpuscular hemoglobin concentration (MCHC); platelet count; mean platelet volume (MPV); total white blood cells (WBC); absolute segmented neutrophil count (Abs seg); absolute monocyte count (Abs mono); absolute lymphocyte count (Abs lymph); and absolute eosinophil count (Abs eos). For serum chemistry analysis, the following analytes were measured: glucose; blood urea nitrogen (BUN); creatinine (Creat); total bilirubin (TBili); cholesterol; triglyceride; total protein (Tprotein); albumin; globulin; alkaline phosphatase (ALP); alanine aminotransferase (ALT); aspartate aminotransferase (AST); gamma glutamyl transpeptidase (GGT); creatine kinase (CK); lactate dehydrogenase (LDH); calcium; phosphorus; sodium; potassium; chloride; CO2; and iron. Briefly, samples were processed in the on-site diagnostic laboratory at each park. The hematology analytes RBC, Hb, Hct, MCV, platelet count, MPV, and WBC were determined using either Abbott Cell Dyn 3500R (Abbott Laboratories, Abbott Park, IL, United States) or Siemens Advia 2120i (Siemens Medical Solutions United States, Inc., Malvern, PA, United States) automated hematology analyzers using the manufacturer’s reagents. The differential cell counts Abs segs, Abs lymph, Abs mono and Abs eos were made by manually counting 100 cells in EDTA-anticoagulated blood smears stained with Wright-Giemsa. The serum chemistry parameters were measured using Olympus AU400E (Olympus Corporation, Center Valley, PA, United States) automated serum chemistry analyzers on thrombin-coagulated serum. All reagents used were designed for and purchased from the manufacturer.
Serum Extraction
Extraction of killer whale sera for use in GC assays has been previously validated and described for both female and male killer whales (O’Brien et al., 2017; Robeck et al., 2017). Sera extraction was performed identically to previously published methods (see O’Brien et al., 2017; Robeck et al., 2017).
For aldosterone, serum (0.5 ml) and extraction buffer (0.5 ml) were added to a 50 ml polypropylene tube (Axygen, Corning, Reynosa, Mexico). Then 10 ml of di-ethyl ether was added to all tubes and placed on a multi-tube vortexer for 5 min (1800 rpm). After vortexing, the samples remained on the benchtop for 10 min, to allow for separation of the ether layer. Samples were placed in a −80°C freezer for 20 min to allow the aqueous layer to freeze. Supernatant was rapidly poured off into 16 × 125 mm glass tubes (ThermoFisher). The supernatant layer was dried down under compressed nitrogen gas (approximately 40–50 min total drying time). Dried extracts were reconstituted in 0.25 ml of extraction buffer and stored at −20°C until further analysis. To determine the extraction efficiency of aldosterone using this process, a subset of samples were extracted and analyzed in duplicate. One set of these samples was processed as described above, and the second set of these samples was spiked with aldosterone standard (0.2 ng/ml in extraction buffer) and extracted and analyzed identically to the first set. The mean recovery (±sem) of the aldosterone standard (representing the extraction efficiency of the reported technique) was 107.48 ± 8.50% (n = 10).
Due to potential differences that may arise from thawing of the aqueous layer when pouring off the supernatant, samples were extracted in batches of 25 samples or less (5 total extraction batches). Each step during the extraction process, i.e., addition of di-ethyl ether or pouring off of supernatant, from first to last sample took less than 5 min total time. For each sample extraction batch, a 30 ml pool of killer whale sera, pooled from male and female killer whale sera (15 ml each sex) collected during the study period, was used as an extraction control to examine the hormone recovery for each batch. A sample of the extraction control was prepared in the same manner as described above for glucocorticoids and aldosterone respectively, and a second extraction control sample (“spiked control”) containing 0.15 ml or 0.5 ml of extraction control (depending on the hormone of interest) and 0.15 ml or 0.5 ml of a spiked standard (10 pg cortisol or corticosterone/tube or 1.5 ng aldosterone/tube in extraction buffer) was combined and extracted the same as described above for each respective hormone. The reconstituted extraction control and spiked control were then assayed, and the recovery of the spiked control was calculated to determine the extraction efficiency for each batch by dividing the observed pg/well from the spiked control by the expected amount (extraction control + known amount of standard added). Any extraction batch displaying a control recovery of <85% was repeated to ensure adequate efficiency of the procedure. The percent mean ± sem recovery for the extraction control for each hormone was as follows: cortisol, 98.79 ± 1.51% (n = 13); corticosterone, 87.72 ± 1.21% (n = 8); aldosterone, 99.63 ± 2.37% (n = 14).
Fecal Steroid Extraction
Fecal samples were processed similarly to previously described methods (Ayres et al., 2012) with any modifications indicated below. Ayres et al. (2012) and Wasser et al. (2017) used the supernatant extract solution (70% ethanol) directly in their assay system. We were unable to use alcohol solutions in our EIAs due to matrix interference (Steinman, unpublished results). Our methods differed from Ayres et al. (2012) in following steps. Supernatant was dried down overnight under nitrogen gas. Then, once dry, 3 ml of pure methanol (HPLC Grade, ThermoFisher) was added to each tube, and the tubes were individually vortexed for 15–30 s and then placed in a sonicating water bath (Sonicor, Sonicor Inc., West Babylon, NY, United States) for 30 min to dissolve residual dried fecal extract from tubes. The methanol was evaporated to dryness under nitrogen gas (20–30 min). Extraction buffer (1 ml, 0.2 M phosphate buffered saline, pH 7.5) was added to each tube and then briefly vortexed (15–30 s) and placed back into the sonicating water bath for 30 min. This 1 ml solution represented the neat fecal extract and was transferred to a 12 × 75 mm glass tube (ThermoFisher) and stored at −20°C until analysis.
High Performance Liquid Chromatography (HPLC) of Fecal Extracts
High performance liquid chromatography characterization of immunoreactive GCs, androgens, and metabolites in killer whale sera has been reported previously (O’Brien et al., 2017). In this study, HPLC was performed to characterize the measured immunoreactive metabolites in killer whale feces. An HPLC machine (Beckman System Gold Programmable Solvent Module 125 and Model 168 Diode Array Detector, Beckman Instruments, Brea, CA, United States) was used along with a reverse phase HPLC column (C18, 4 μm, 3.9 × 150 mm, Nova-Pak®, Waters Corporation, Milford, MA, United States). Two pools of fecal extract (adult male and adult female) were filtered using a 0.2 μm syringe filter (Corning Inc., Corning, NY, United States) and then concentrated using a SPICE C18 cartridge (Analtech, Newark, DE, United States) to remove contaminants, and the eluant was dried down. Samples were reconstituted in 0.1 ml methanol (HPLC Grade, ThermoFisher), resuspended by vortexing, then 0.05 ml was loaded into the injection port and 0.02 ml injected onto the column. Our mobile phases were water and methanol (HPLC Grade, ThermoFisher). A gradient from 20% methanol to 100% methanol was run at a flow rate of 1 ml/min over a 120 min run time to separate the steroids. Known cortisol, corticosterone, 5-tetrahydrocorticosterone, testosterone, testosterone-sulfate, testosterone-glucuronide, 5α-dihydrotestosterone, androstenedione, and dehydroepiandrosterone standards (1 mg/ml, Sigma Aldrich, or Steraloids, Steraloids, Inc., Newport, RI, United States) were run prior to each sample to determine when each eluted (as detected by the diode array detector). Fractions were evaporated to dryness, reconstituted in 0.25 ml of 0.2 M phosphate buffered saline (PBS) with 0.1% bovine serum albumin (pH 7.0, EIA buffer), and then stored at −20°C until hormone analysis using the cortisol and corticosterone EIAs. Sample immunoreactivity, as detected by the EIA, was then compared to the retention times of the known standards to characterize measured steroid hormone metabolites.
Steroid Assays
All steroid concentrations were expressed as ng hormone per ml serum or ng hormone per g dried and extracted feces. To avoid confusion between the two different GC assays used, the fecal GC metabolite data were described as fecal cortisol metabolites and fecal corticosterone metabolites; the authors acknowledge that the fecal GC metabolites measured are most likely not the parent hormones but their metabolites and the correct terminology for fecal GCs should be fecal glucocorticoid metabolites (FGCMs).
Cortisol Assay
Cortisol concentrations were measured using a single antibody, direct EIA as previously described (Munro and Lasley, 1988) in detail for use with killer whale sera (O’Brien et al., 2017; Robeck et al., 2017). For fecal extracts, 0.0025–0.010 ml of reconstituted extract was used. Parallel displacement of extracted feces compared to the standard curve was demonstrated (Supplementary Figure S1A) and an accuracy test plotting the concentrations of fecal extracts spiked with known concentrations of standard against non-spiked fecal extracts yielded a recovery of 101.26 ± 4.40% (linear regression, y = 1.03x – 0.18, r2 = 0.999). Mean coefficient of variation (CV) between sample replicates, analyzed in duplicate was 3.89 and 2.31% for sera and feces, respectively. Inter-assay CV for the two quality controls with antibody at 30 and 70% binding were 10.5 and 6.2%, respectively (n = 15). The inter-assay CVs for two biological controls made from pooled killer whale sera and fecal extract with antibody binding at approximately 60 and 40% were 12.6% (n = 6) and 9.2% (n = 7), respectively.
Corticosterone Assay
Corticosterone concentrations were measured using a commercial EIA kit (#K014, Arbor Assays, Ann Arbor, MI, United States) previously validated for use with killer whale sera (O’Brien et al., 2017; Robeck et al., 2017). The assay was performed according to manufacturer’s directions. For fecal extracts, 0.0025–0.025 ml of reconstituted extract was used. Parallel displacement of fecal extracts compared to the standard curve was demonstrated (Supplementary Figure S1B) and an accuracy test plotting the concentrations of fecal extracts spiked with known concentrations of standard against non-spiked fecal extracts yielded a recovery of 92.62 ± 5.02% (linear regression, y = 0.94x – 1.13, r2 = 0.999). Mean CV for sample replicates, analyzed in duplicate, was 1.57 and 1.77% for sera and feces, respectively. Inter-assay variation for the two controls with antibody at 30 and 70% binding were 9.4 and 12.0%, respectively (n = 12). Separate pools of serum and fecal extracts were used as species- and matrix-specific biological controls with antibody binding at 60 and 55%. Inter-assay CVs for these two pools were 11.1% (n = 11) and 12.6% (n = 7) for sera and feces, respectively.
Aldosterone Assay
Aldosterone concentrations were measured using a commercial EIA kit (#K052, Arbor Assays). The assay was performed according to manufacturer’s directions. For sera and fecal extracts, 0.1 ml and 0.02–0.1 ml were used, respectively. According to the manufacturer, assay sensitivity was 4.97 pg/ml and antibody cross-reactivity was as follows: aldosterone, 100%; corticosterone, 0.047%; desoxycorticosterone, 0.019%; and <0.016% for progesterone, tetrahydrocorticosterone, cortisol, 1-dehydrocortisol, and estradiol. Parallel displacement of sera and fecal extracts compared to the standard curve was demonstrated (Supplementary Figure S1C) and an accuracy test plotting the concentrations of sera and fecal extracts spiked with known concentrations of standard against non-spiked sera and fecal extracts yielded a recovery of 110.30 ± 10.58% (linear regression, y = 1.09x + 0.48, r2 = 0.999) and 99.35 ± 3.13% (linear regression, y = 0.99x – 0.31, r2 = 0.999), respectively. Mean CV for sample replicates, analyzed in duplicate, was 1.78 and 2.19% for sera and feces, respectively. Inter-assay variation for the two controls with antibody at 30 and 70% binding were 9.3 and 12.0%, respectively (n = 10). Separate pools of sera and fecal extracts were used as species- and matrix-specific biological controls with antibody binding at 75 and 65%. Inter-assay CVs for these two pools were 13.8% (n = 5) and 10.1% (n = 7) for sera and feces, respectively.
Data and Statistical Analyses
Unless stated otherwise, statistical analyses were performed using Stata statistical software (version 14; StataCorp LP, College Station, TX, United States). To rapidly prescreen for all potential pairwise correlations between serum and fecal steroids and serum chemistry and hematology parameters over the test period, a Pearson correlation coefficient test was used to identify any significant relationships. Based on this analysis, only paired values which demonstrated significance (data not presented) were then reanalyzed using a two-stage linear mixed effects (LMM) restricted maximum likelihood (REML) regression model (West et al., 2014) with animal id as the random intercept. Linear mixed models where slopes varied significantly by individual, as determined by the likelihood ratio analysis, were run using both random slopes and random intercepts. For LMM, degrees of freedom adjustments for the small sample size were performed using the Kenward–Roger approximation (Kenward and Roger, 1997). To determine a relative comparison of goodness of fit between the paired analysis, marginal r-squared (mR2) was determined for mixed models (Nakagawa and Schielzeth, 2013) using MuMLN package for mixed models (lme4, Bates et al., 2014) using R statistical software version 3.6.1 (R Core Team, 2013). This analysis was done to indirectly determine if common physiologic stimulatory or inhibitory feedback mechanisms may exist among these steroids and between steroids and serum chemistry and hematology parameters.
For detection of any significant effects that the stress test had on mean steroid and serum chemistry and hematology concentrations, we used a two-step REML LMM. Hormone and hormone metabolite concentrations were grouped by time periods or “time-stage” as outlined above (Table 2, Pre-T, ST, RP, and PT [coded 0, 1, 2, 3]), while hematological and serum chemistry parameters were binned into three time-stages, baseline (BL, which included Pre-T and PT binned together), ST, and RP (coded 0, 1, 2). The fixed effect variables (step 1 of the LMM), in addition to the factorial variable time-stage, included the dependent variable (steroid or serum chemistry/hematology parameter) and independent fixed effect variables (animal age [continuous variable] and sex [coded 0,1]) and their interaction. Animal age and sex and their interaction were included as fixed effects variables to control for potential effect that these variables may have on the dependent variables being evaluated (West et al., 2014; O’Brien et al., 2017; Robeck et al., 2017; Nollens et al., 2019). The random effect, or intercept (reduced model), variable, animal ID (stage 2, n = 13, coded 1–13), was used to control for the variance associated with an unequal number of repeated measures per animal. All random intercept models were also evaluated against models which included random slopes (full model) for each fixed variable by animal. If significant inter-animal variation across slopes was detected using the likelihood ratio test, the full model was used. To adjust for the small sample size used with the LMM, degrees of freedom were estimated by using the Kenward–Roger approximation (Kenward and Roger, 1997). The LMM analysis used to compare hormone concentrations and hematology and serum chemistry concentrations adjust for any potential clustering of sample variance around animal id. The final LMM model was checked for normality using quantile plots of the standard residuals. If quantile-quantile (qnorm) plots of standardized residuals exhibited non-normal distribution, then data was log transformed. Post hoc marginal significance (fixed portion of the LMM model) for time-stage, age, sex, and age∗sex were checked for significance using Wald’s chi-square test. If “time-stage” was significant, then an intra-stage marginal means multiple comparison test with Šidák correction was run to determine if significant differences between each time stage existed. For text and tables, any transformed data were first back-transformed and then presented as marginal means with 95% confidence intervals (CI).
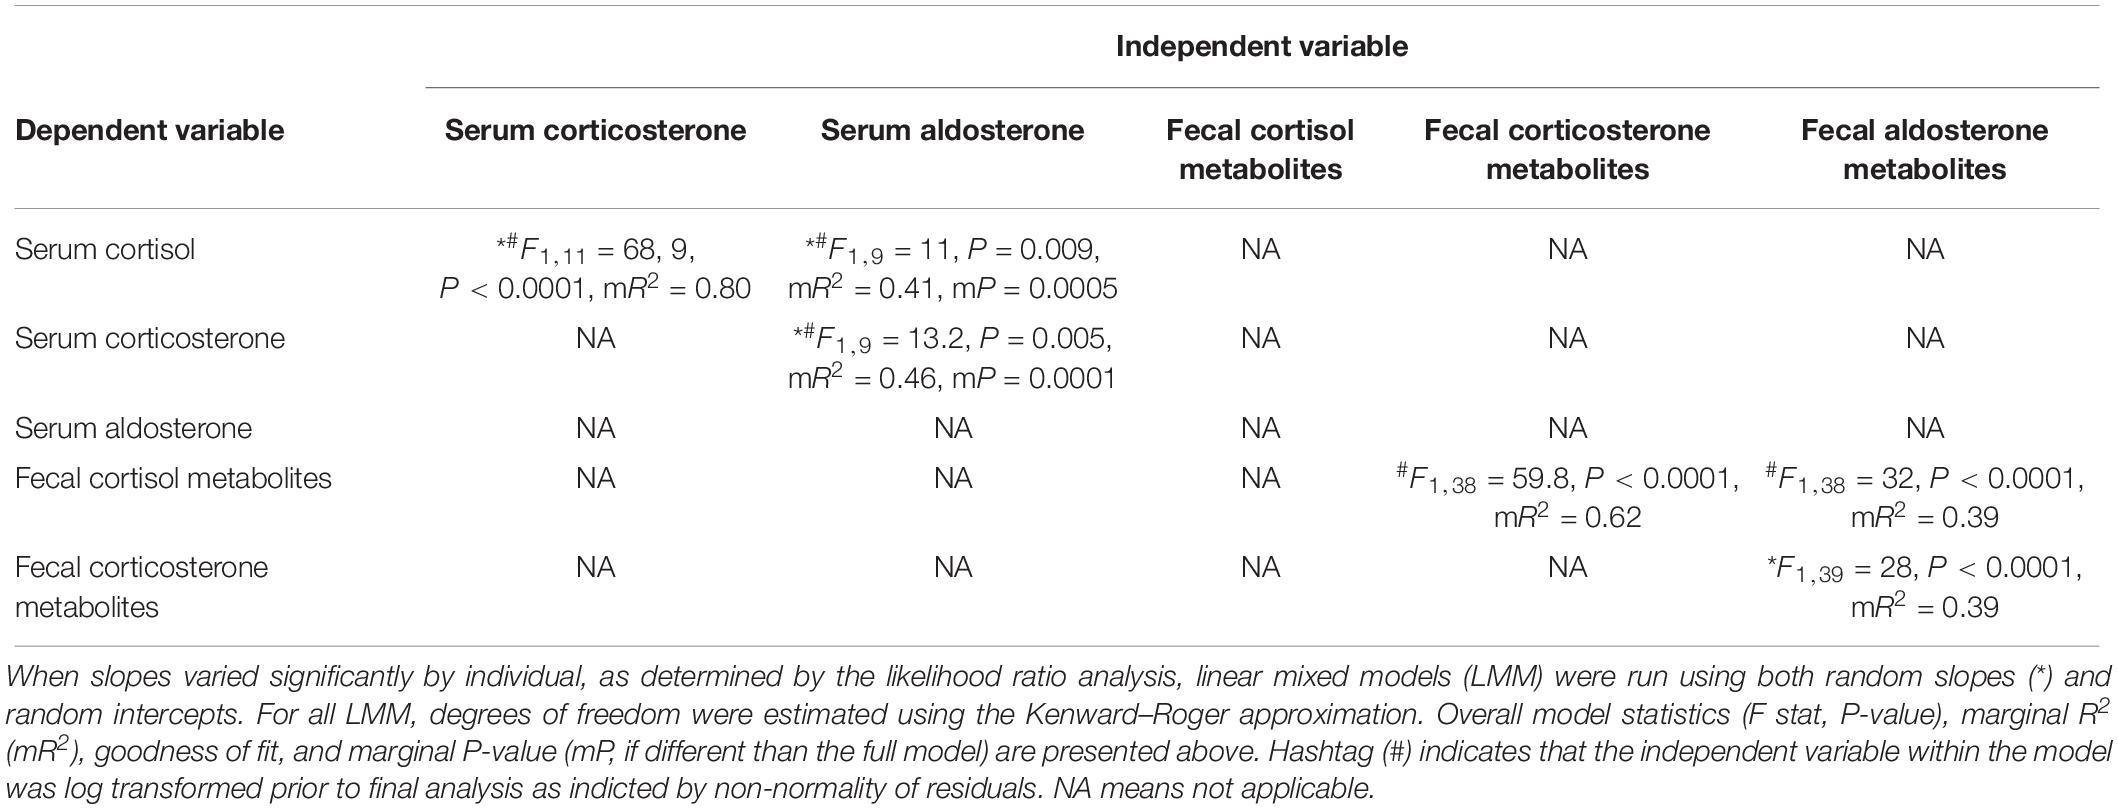
Table 2. Model statistics from paired analyses amongst serum hormones and amongst fecal metabolites, respectively, as determined by linear mixed model restricted maximum likelihood analysis.
Results
HPLC of Fecal Extracts
Analysis of HPLC fractions using the cortisol EIA showed that the largest immunoreactive peak for both female and male fecal extract pools coincided with the elution time point for the known cortisol standard (Figure 1A). For both sexes, there were small peaks (∼5% of total immunoreactivity cumulatively) observed just after the elution time points for testosterone-sulfate (T-sulf) and testosterone-glucuronide (T-gluc) as well as a small peak that eluted from fractions 77–79.
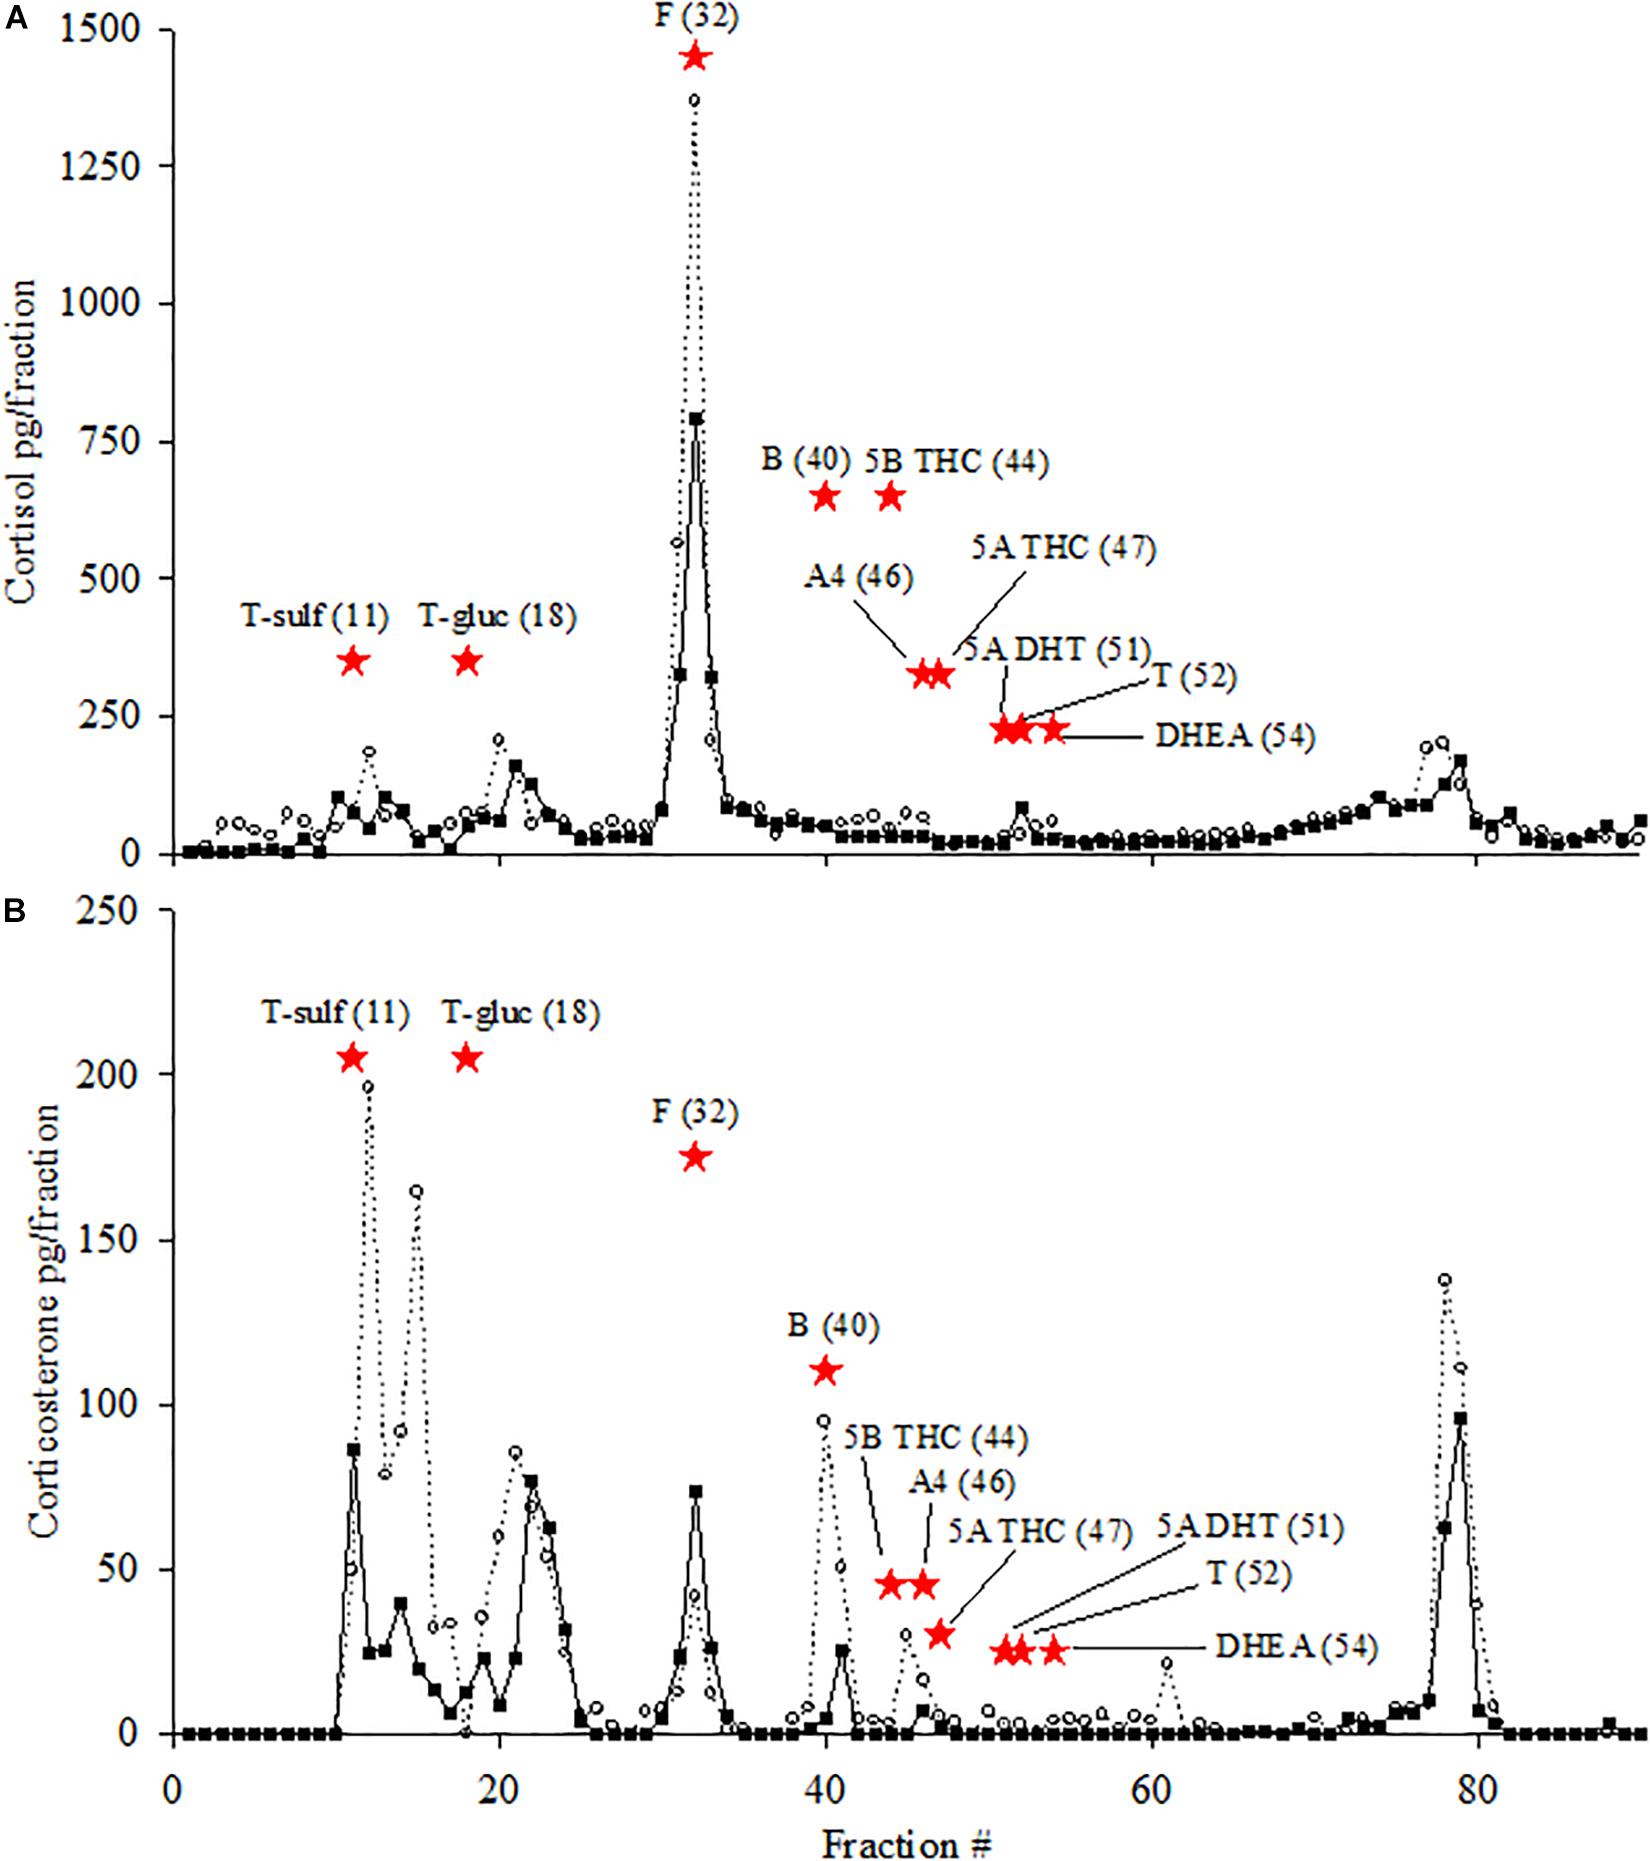
Figure 1. HPLC immunogram. HPLC immunogram of pools of female (open circles) and male (closed squares) killer whale fecal extracts for cortisol (A) and corticosterone EIAs (B). Data points for each HPLC fraction are presented as the measured pg/fraction (y-axis) in each EIA. Elution positions of known reference standards are indicated by red stars: T-sulf (testosterone-sulfate, fraction 11); T-gluc (testosterone-glucuronide, fraction 18); F (cortisol, fraction 32); B (corticosterone, fraction 40); 5B THC (5β tetrahydrocorticosterone, fraction 44); A4 (androstenedione, fraction 46); 5A THC (5α tetrahydrocorticosterone, fraction 47); T (testosterone, fraction 51); 5α-DHT (dihydrotestosterone, fraction 52); DHEA (dehydroepiandrosterone, fraction 54). Run time for HPLC was 120 min but figure only displays to fraction 90 because no peaks were observed after fraction 90.
Analysis of HPLC fractions using the corticosterone EIA (Figure 1B) revealed, for both sexes, a large peak (>10% of total immunoreactivity) that co-eluted with T-sulf and another peak that eluted from fractions 13–16. Another peak that eluted after the time point for T-gluc, during fractions 20–22, was also observed. Immunoreactive peaks coinciding with the elution time point for cortisol were also observed, although the magnitude of the peak was three times larger for the male pool compared to the female pool. Peaks coinciding with the corticosterone elution time point were observed, albeit smaller in magnitude compared to cortisol, and the magnitude of the peak for the female pool was almost two-fold higher than the male pool peak. In the male pool, the immunoreactive peak that co-eluted with the cortisol standard was larger than the immunoreactive peak that co-eluted with the corticosterone standard, and the reverse was observed for the female pool. A large peak was observed from fractions 77–79.
Correlations of Hormones, Serum Chemistry, and Hematology
Positive associations amongst all serum hormone concentrations were observed. Cortisol was positively associated with both corticosterone (mR2 = 0.80, P < 0.0001) and aldosterone (mR2 = 0.41, P = 0.009), and a positive association was also found between corticosterone and aldosterone (mR2 = 0.46, P = 0.005; Table 2). All pairwise associations between these hormones varied by individual animals (random slopes models were significantly improved as determined by the likelihood ratio test, Table 2). All fecal hormone metabolites positively correlated amongst themselves with the strongest positive association between fecal cortisol and fecal corticosterone (mR2 = 0.62, P < 0.0001; Table 2). None of the correlations among fecal hormone metabolites had variations among animals (random intercept model only).
For relationships of serum hormones to serum chemistry and hematology parameters across the entire study period, serum cortisol (mR2 = 0.41, P < 0.0001) and corticosterone (mR2 = 0.31, P < 0.0001) were positively correlated with glucose (Table 3). There were significant, positive correlations between serum corticosterone and Abs eos (mR2 = 0.10, m P = 0.003). Significant, positive relationships existed between serum cortisol and Creat, Tprotein, albumin, globulin, and CO2, as well as between serum corticosterone and Creat, Tprotein, globulin, and CO2 (Table 3).
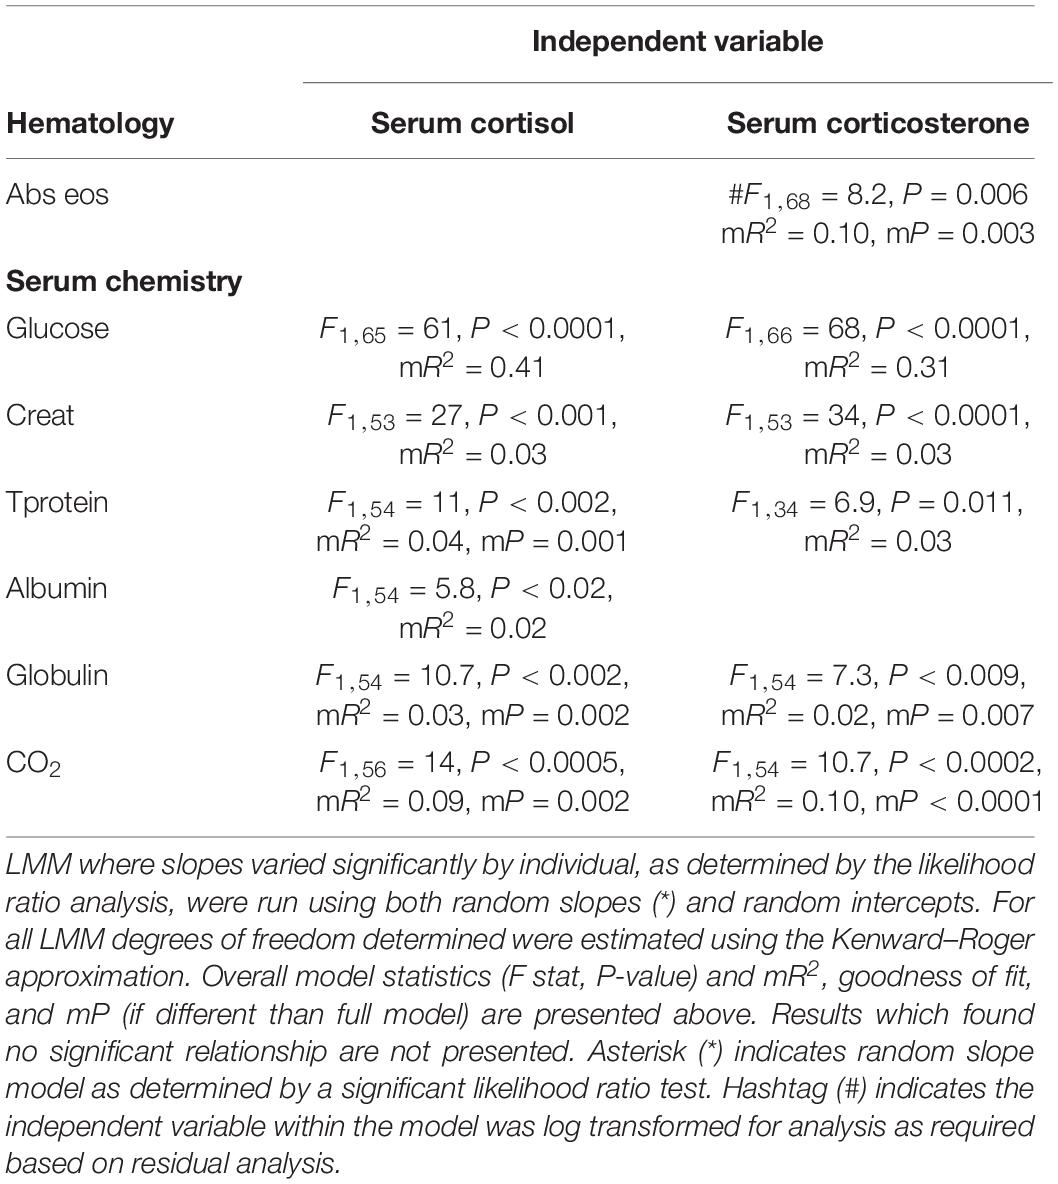
Table 3. Model statistics from paired analysis between serum hormones and serum chemistry and hematology parameters as determined by LMM restricted maximum likelihood analysis.
Serum Hormones and Their Fecal Metabolites
Age significantly influenced serum cortisol, corticosterone, and aldosterone, while sex significantly influenced serum aldosterone and fecal cortisol metabolites (Table 4). A significant interaction between age∗sex and serum aldosterone was also observed (Table 4).
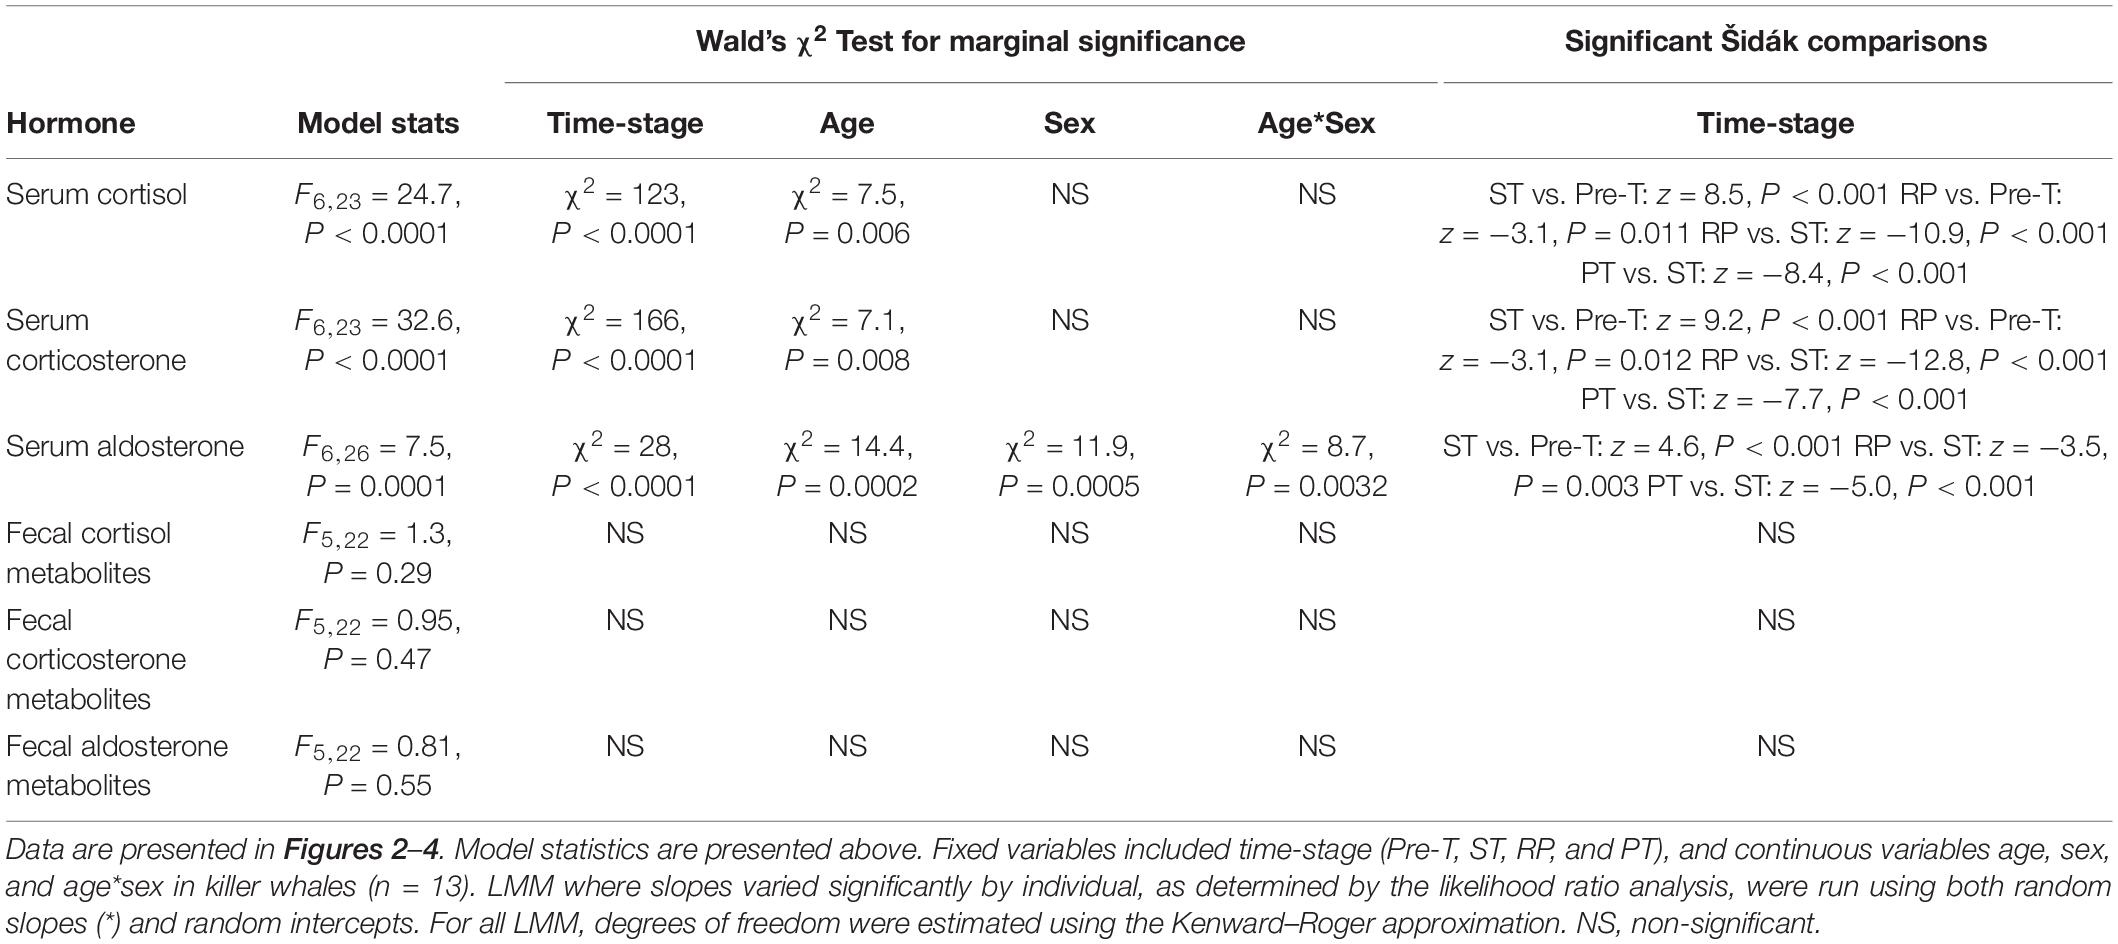
Table 4. Linear mixed model analysis exploring variation in serum and fecal metabolite concentrations of corticosteroids.
Serum cortisol and corticosterone significantly increased to the highest concentrations just after ST (>200% increase from Pre-T for both, Table 4). Following ST, serum cortisol and corticosterone significantly decreased to their lowest concentrations during RP, a −21% and −45% change for cortisol and corticosterone compared to Pre-T, respectively, and then returned to Pre-T concentrations during PT (Table 4 and Figures 2A, 3A). Serum aldosterone also significantly increased from Pre-T concentrations although the magnitude of the increase was not as great compared to cortisol and corticosterone (∼100% increase, Table 4 and Figure 4A). Serum aldosterone concentrations decreased significantly from ST during RP. No statistical differences in fecal steroid concentrations were observed during the different stages (Figures 2B, 3B, 4B).
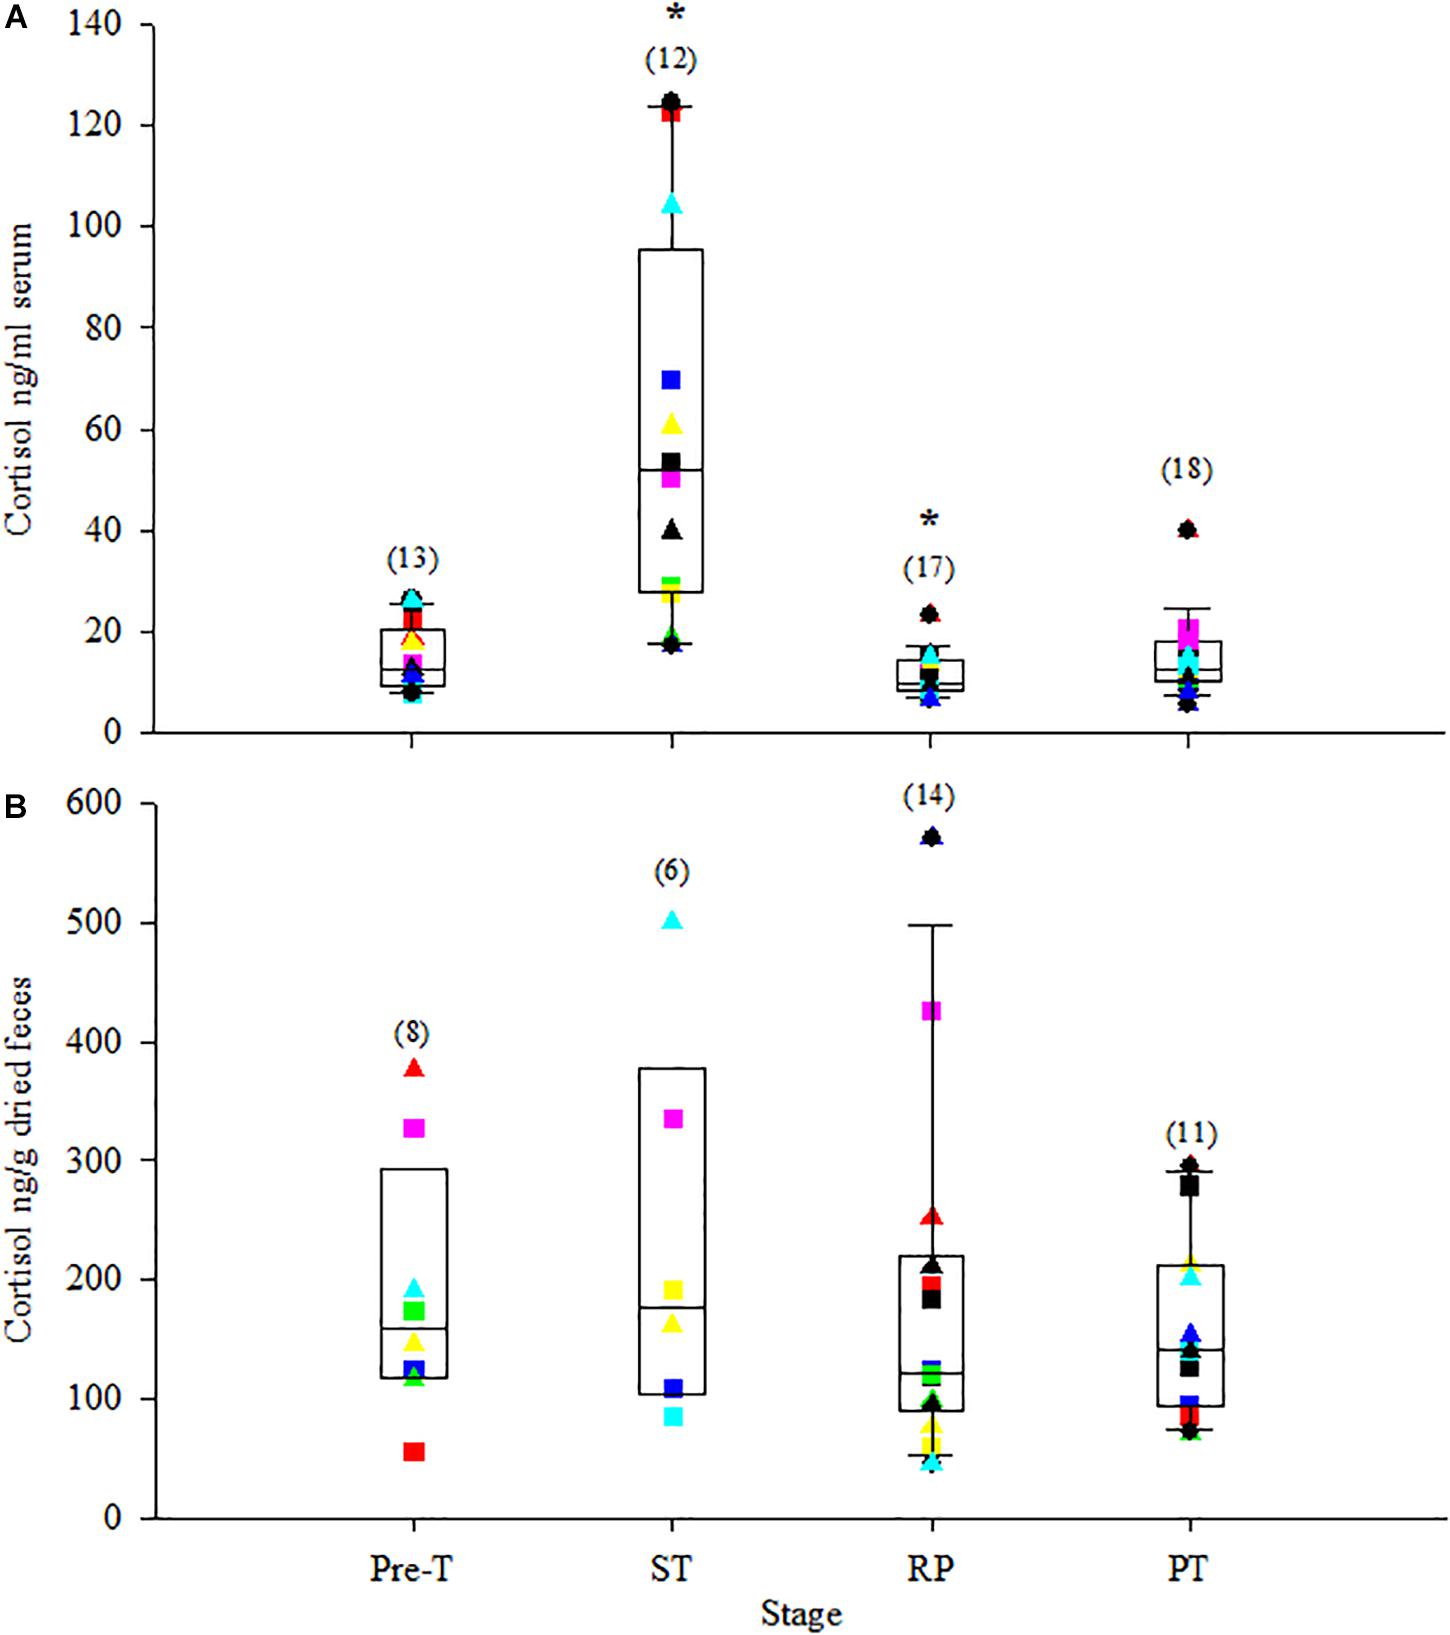
Figure 2. Box plot of serum cortisol (A) and fecal cortisol metabolites (B) during the stress test with overlay of individual animal data. Stages were: pre-treatment (Pre-T); stress test (ST, samples collected immediately after return to water); recovery phase (RP, samples collected at 3 h and/or 6 h post ST); and post-test (PT, samples collected at 24 h and/or 48 h after ST). For box plots, the line inside the box denotes the median value, the height of the box represents the 25th and 75th quartiles and whiskers represent extreme observations (10th and 90th percentiles). Closed circles represent outliers. Colored squares represent data for individual females and colored triangles represent data for individual males. Values in parentheses represent number of samples for that stage. Asterisks (*) represent stages where means were statistically significant (P < 0.05) from the Pre-T mean.
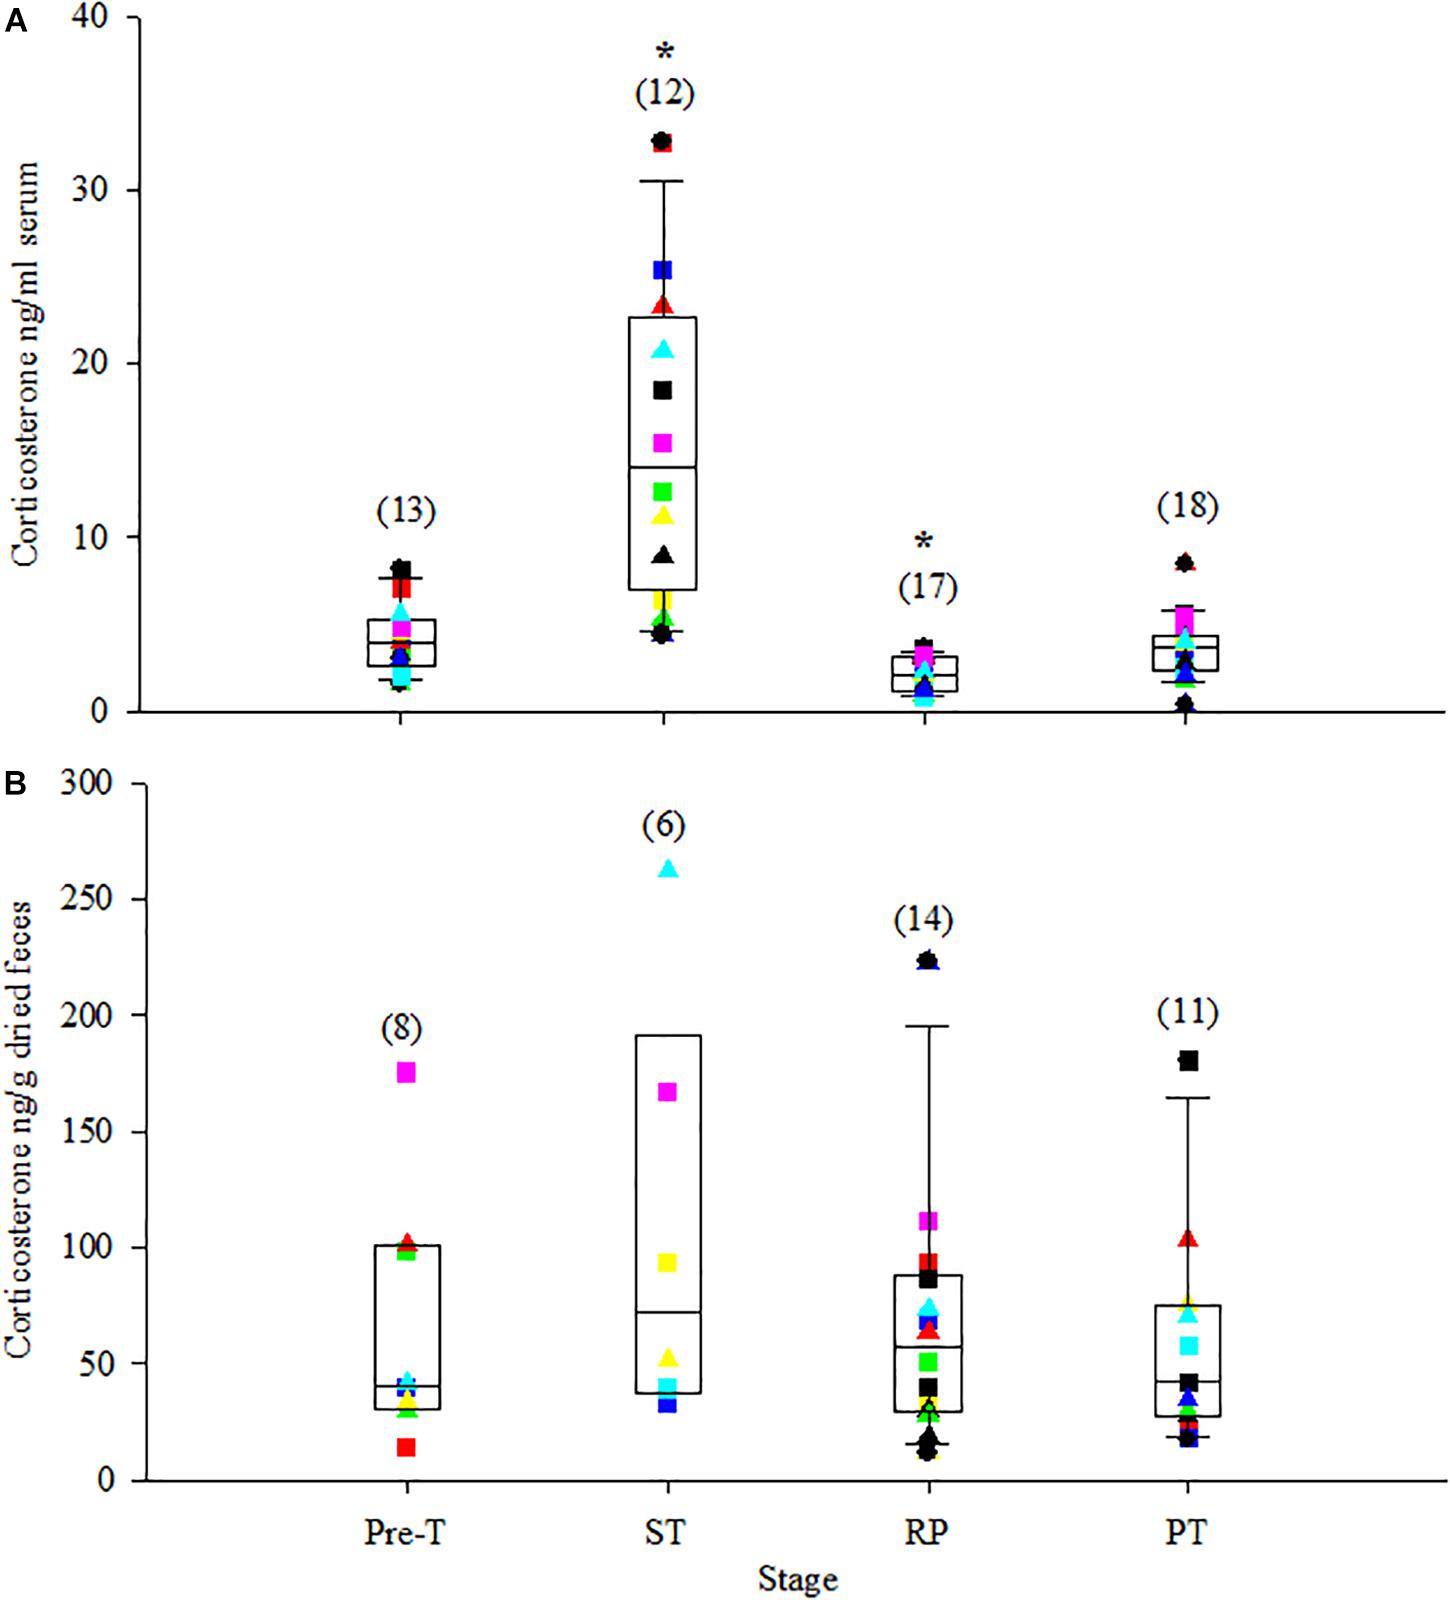
Figure 3. Box plot of serum corticosterone (A) and fecal corticosterone metabolites (B) during the stress test with overlay of individual animal data. For specific details, see Figure 2, legend.
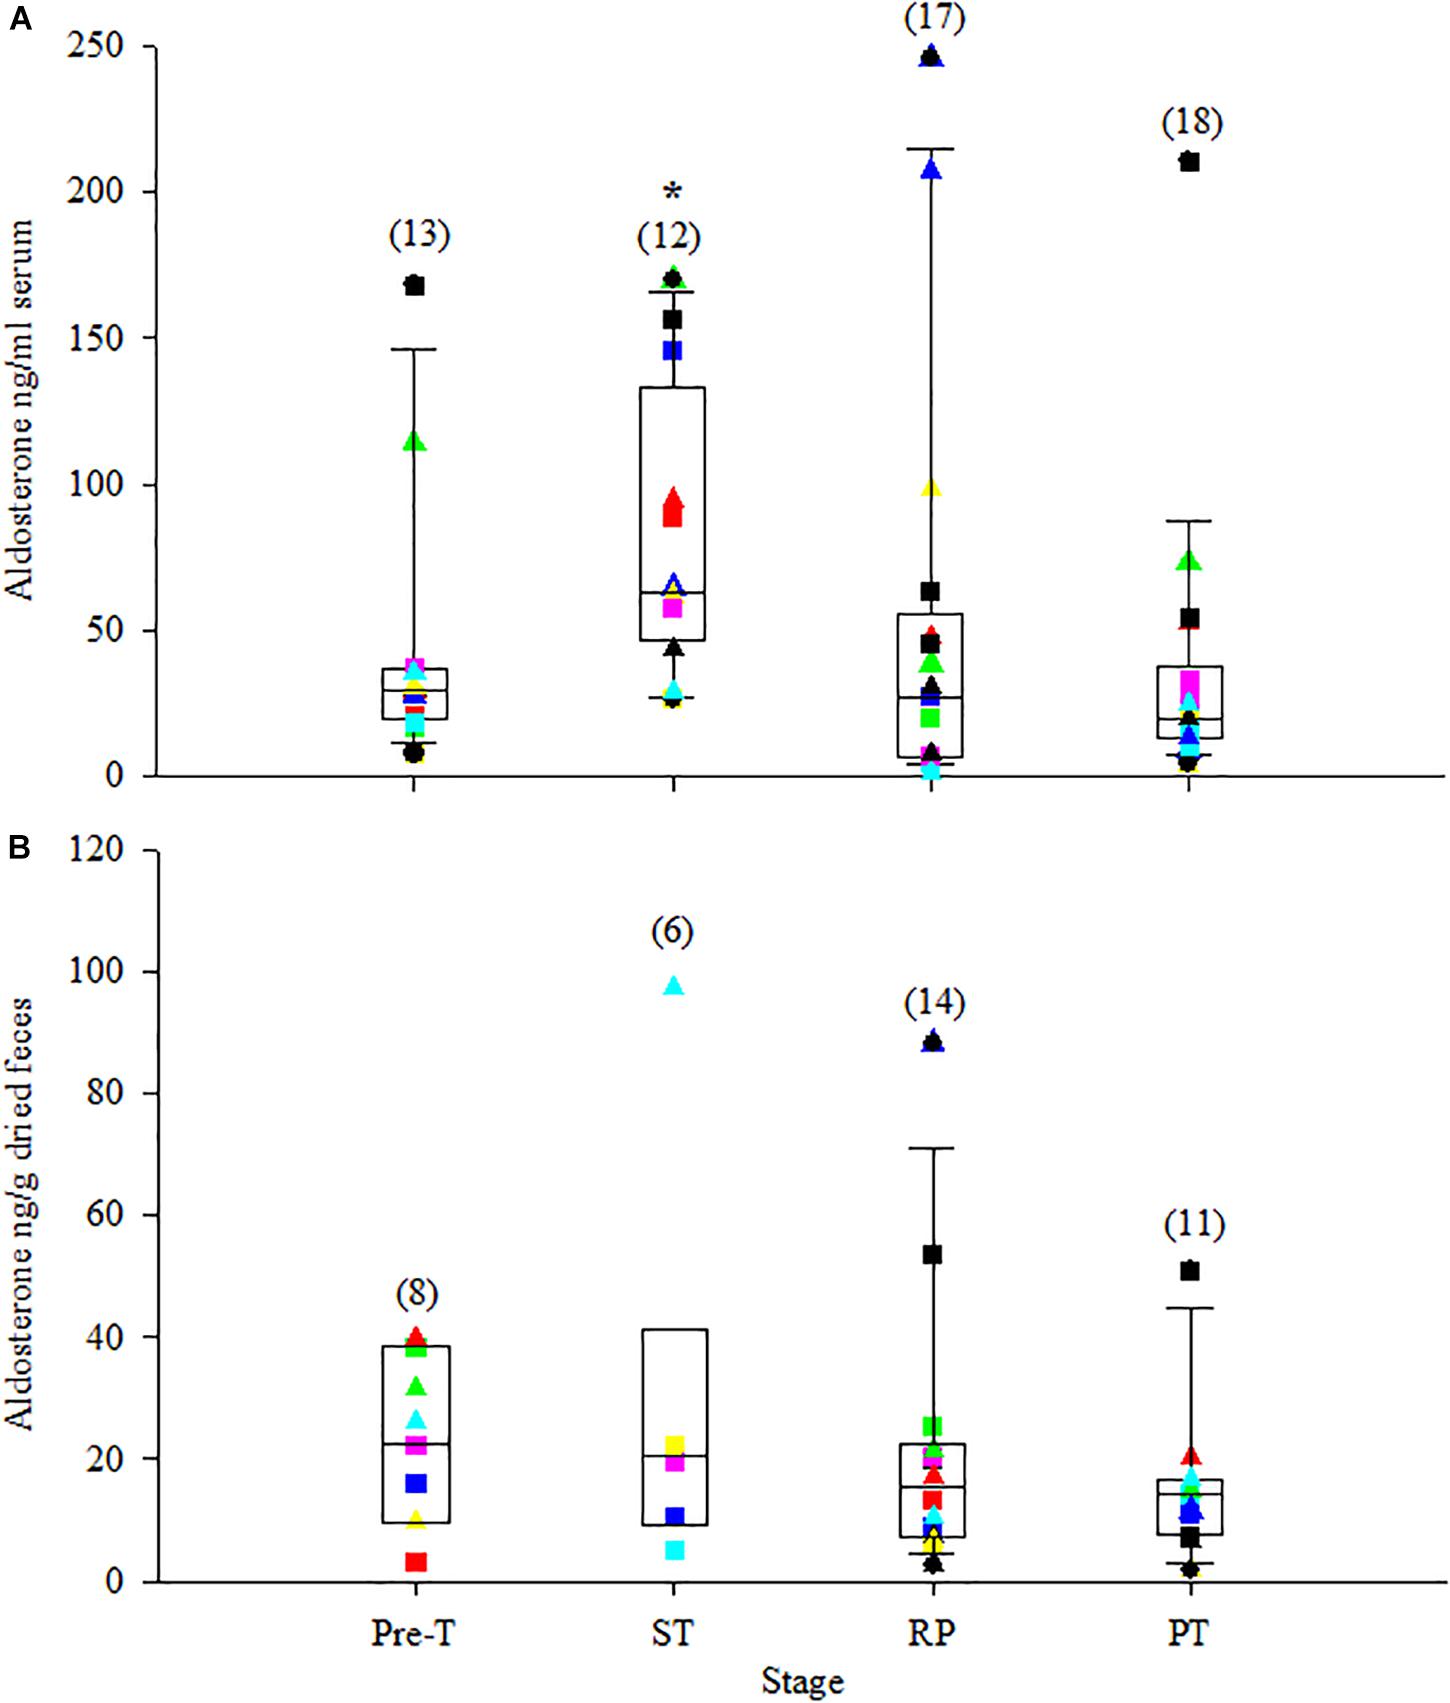
Figure 4. Box plot of serum aldosterone (A) and fecal aldosterone metabolites (B) during the stress test with overlay of individual animal data. For specific details, see Figure 2 legend.
Serum Chemistry and Hematology
Overall 7 of 14 hematologic and 13 of 23 serum chemistry parameters were significantly different between time points (i.e., 20 of all 37 parameters, Table 5; see Supplementary Table S1 for model statistics). Deviations predominantly occurred during ST (15 of 37, Table 5 and Supplementary Table S1). For hematology, Hb, Hct, RBC, WBC, Abs seg, and Abs eos all increased significantly (P < 0.05, Table 5) during ST compared to BL. Compared to RP, MPV, WBC, Abs seg, and Abs eos also were significantly higher during ST (Table 5, P < 0.05). MPV was also significantly higher during BL compared to RP (Table 5, P < 0.05). For serum chemistry parameters, glucose, Creat, cholesterol, TProtein, albumin, globulin, ALP, and iron all increased significantly, and CO2 was significantly decreased during ST compared to BL (P < 0.05, Table 5). Glucose, Creat, cholesterol, TProtein, and globulin all decreased significantly during RP compared to ST while triglycerides and CO2 increased (Table 5, P < 0.05). Creat and chloride were significantly higher during BL compared to RP (Table 5, P < 0.05, Supplementary Table S1). Triglyceride, ALP, phosphorus, and iron were significantly higher during RP compared to BL (P < 0.05, Table 5). Age had a significant influence on Creat, cholesterol, albumin, and ALP, and sex had a significant influence on Hb, Hct, and Creat (Table 5 and Supplementary Table S1). Age∗sex had a significant interacting effect on Creat, phosphorus, and CO2 (Table 5 and Supplementary Table S1).
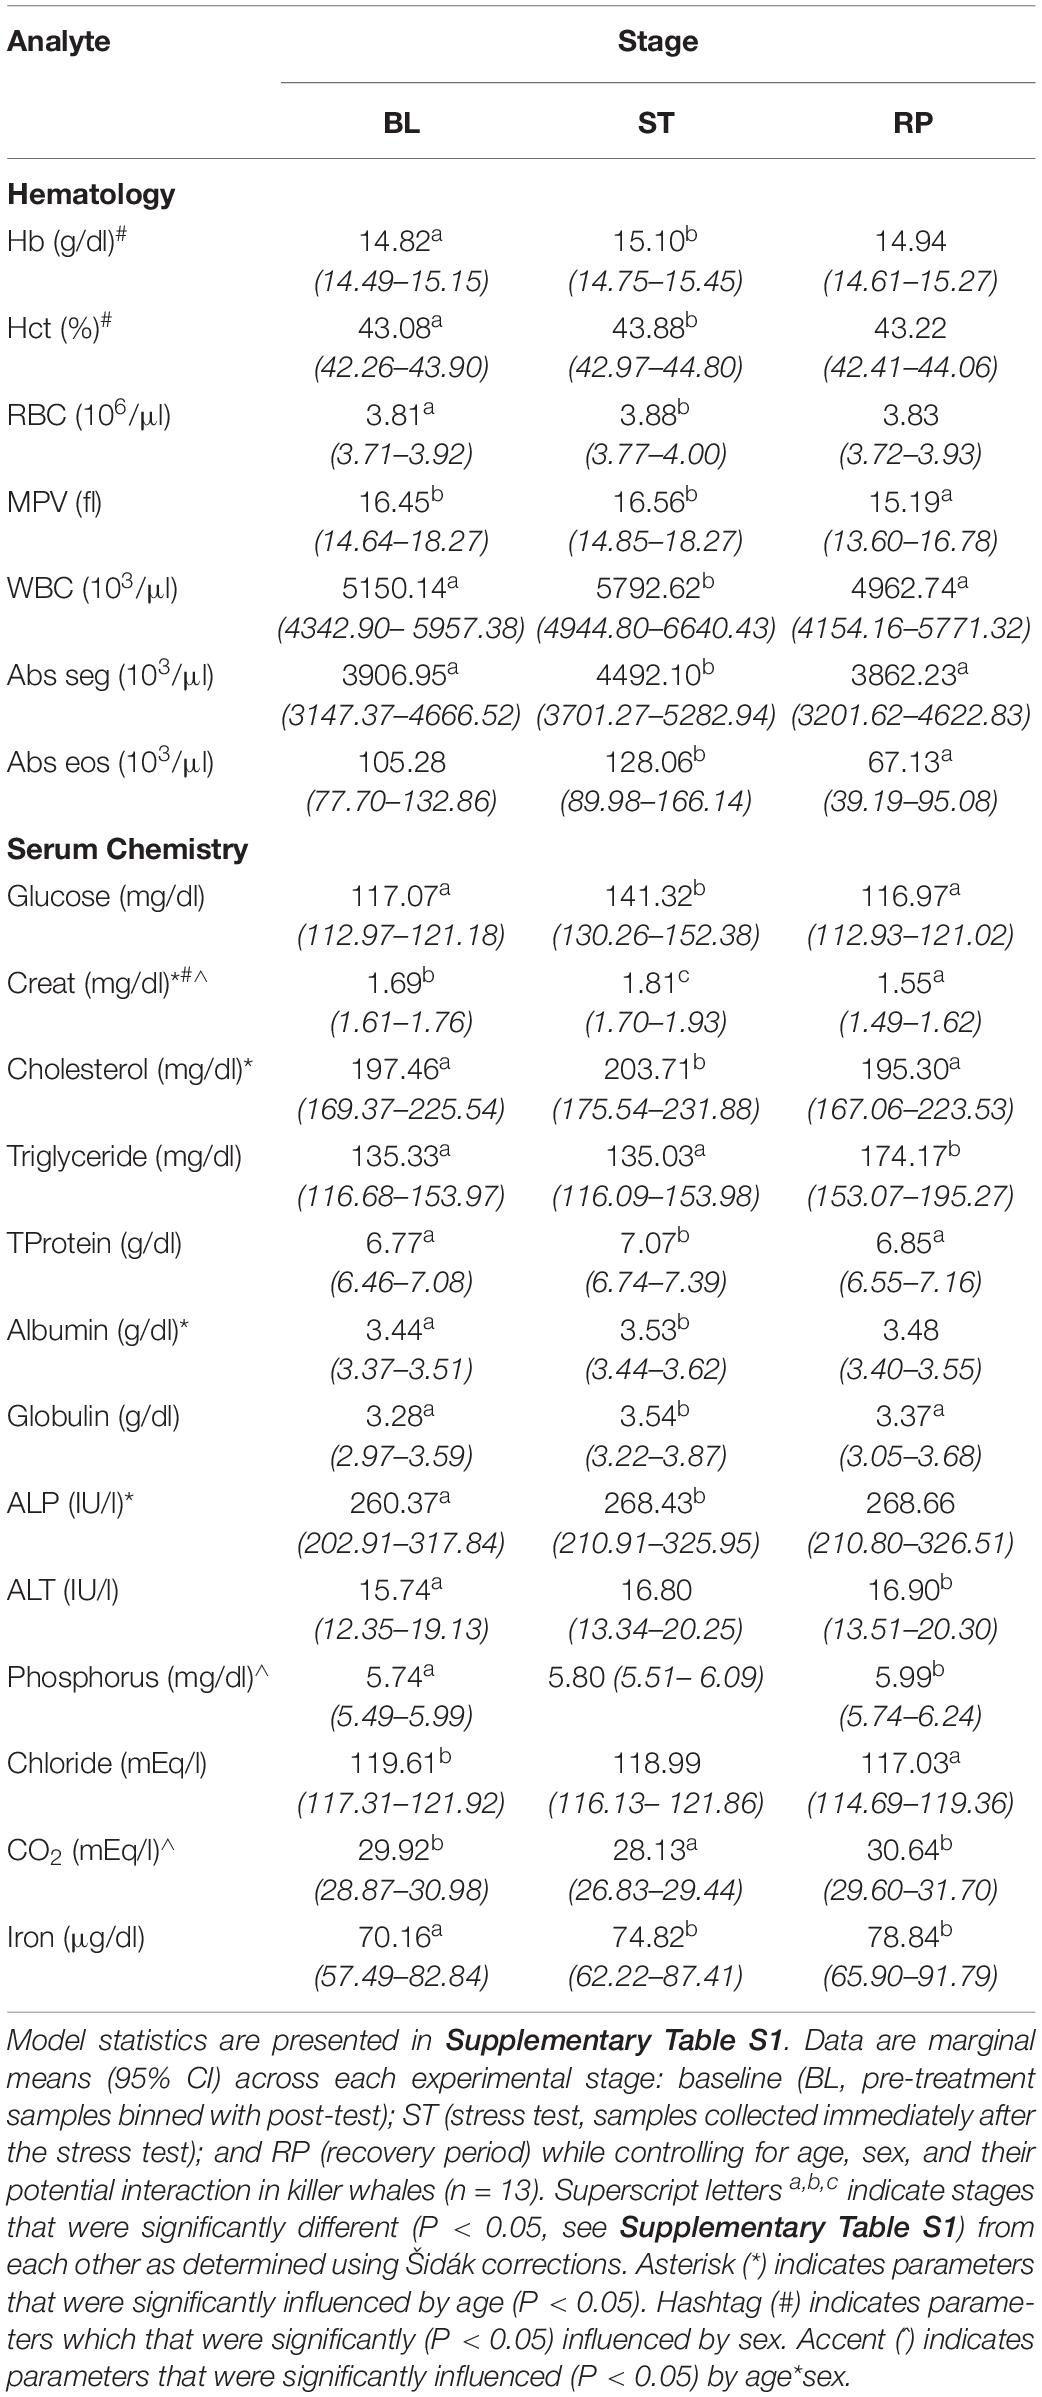
Table 5. Linear mixed model analysis, with animal id as the random intercept variable, exploring the relationship between serum chemistry and hematology parameters during the stress response trial.
Discussion
We found substantial influences of a biological stressor on corticosteroids, hematology, and serum chemistry parameters in killer whales. The lift-bottom experiment presented herein triggered physiological changes in 20 of 37 (54%) of serum chemistry and hematological parameters, including a transient leukocytosis, neutrophilia, a transient eosinopenia during the RP, hypercholesterolemia, and hyperglycemia. In response to this event the HPA axis was activated. Concentrations of circulating corticosteroids increased, thereby validating the lift-bottom as an acute, short-term stress event. However, no effect was observed on excreted hormone metabolites. We also present, for the first time, circulating and excreted aldosterone data in this species.
Cross-Reactivity and Correlation of Steroid Metabolites in Feces
Antibodies used for GC measurements may cross-react with other steroid hormones and metabolites, which can lead to inaccurate quantification of FGCMs (Ganswindt et al., 2003; Hunt et al., 2006; Goymann, 2012). Liquid chromatography-mass spectrometry (LCMS) analysis of bottlenose dolphin feces revealed that native cortisol but not corticosterone was present, suggesting that antibodies that react with cortisol are sufficient for quantifying cortisol in bottlenose dolphin feces (Biancani et al., 2017). However, Biancani et al. (2017) did not fully examine the suitability of their cortisol antibody for detecting FGCMs. In our study, elution of an immunoreactive peak that coincided with the elution time point for T-sulf in the corticosterone EIA gives the appearance that the corticosterone antibody cross-reacted with this androgen metabolite. However, many metabolites can co-elute and HPLC cannot definitively identify which metabolite is present, thus it is unknown if the peak observed was actually GC- or androgen-derived. A radiolabel metabolism study to possibly identify the parent hormone origin of the fecal metabolites that are cross-reacting with the antibodies (Wasser et al., 2000; Palme, 2019) is warranted, but not feasible to conduct with this population of killer whales. Previous research by our group examined circulating GCs, androgens, and associated antibody cross-reactivities using the same HPLC and EIA approach as reported herein, and found no significant cross-reactivity of the circulating androgens with the antibodies used in the cortisol or corticosterone EIAs (O’Brien et al., 2017). However, only one antibody for each GC hormone was analyzed in our study, and it is possible that antibodies with broader spectrum of cross-reactivity for FGCMs, i.e., group specific antibodies (see Palme, 2019 for examples), compared to those used herein may be better suited for the analysis of FGCMs in this species.
All fecal hormone metabolites measured were strongly correlated with each other (see Table 2). In the North Atlantic right whale (Eubalaena glacialis), fecal aldosterone metabolites are correlated with FGCMs (using a corticosterone specific antibody, Burgess et al., 2017). Due to the high degree of association between fecal GC and aldosterone metabolite measures and the potential for cross-reactivity of other fecal hormone metabolites with GC antibodies, Burgess et al. (2017) suggest, when possible, a concomitant evaluation of fecal GC and aldosterone metabolites. Combined fecal GC and aldosterone data can potentially provide more insight into evaluations and impacts of stress/stressors in wildlife species, especially when physiological stress response studies, such as an ACTH challenge, are not possible. Because GCs and MCs have differing roles in physiology, i.e., aldosterone is critical for sodium and potassium regulation and GCs for glucose regulation, parallel measurements of these hormones may help to identify specific stressors related to physiological mechanisms. Additionally, to make comparisons of zoo-based killer whale FGCM profiles to on-going and past research of FGCMs in wild killer whales (Ayres et al., 2012; Wasser et al., 2017) that uses a different group specific GC antibody, the relationship of FGCMs and their profiles and concentrations measured using different antibodies should be explored further. Future research should examine the associations of these hormones and their metabolites over a broader time period to see if associations are influenced by season, time of day, and other factors.
Serum Chemistry and Hematology
A comprehensive evaluation of serum chemistry and hematology parameters in killer whales spanning multiple years and evaluating age, sex, and season in a clinically healthy, managed killer whale population has recently been published (Nollens et al., 2019). However, to our knowledge, a study of hematology and serum chemistries in killer whales during an acute stress event has not been performed.
In our study, an acute stress response after the lift-bottom stressor was characterized by leukocytosis and neutrophilia immediately after ST, with eosinopenia detected shortly thereafter during RP. A classic stress leukogram comprising of leukocytosis, neutrophilia, lymphopenia, and eosinopenia has been consistently observed in pinnipeds, but the presence or absence of lymphopenia in response to acute stress is less clear among cetaceans (Thomson and Geraci, 1986; Atkinson and Dierauf, 2018). Additionally, although it has been well documented in multiple mammalian species that GCs can influence WBC kinetics in such a manner as to induce an overall increase in relative concentrations of neutrophils, the effect on lymphocytes appears to be species dependent (Cohn, 1991). A reduced, inconsistent or non-existent lymphopenia has also been observed for bottlenose dolphins and cattle (Thomson and Geraci, 1986; Reidarson and McBain, 1999 [dolphin]; Wilkie et al., 1979; Pruett et al., 1987 [cattle]). Therefore, the lack of lymphopenia in this study may be because the lift-bottom stressor was insufficient to cause lymphopenia or an indication that lymphopenia is not typically observed in the killer whale’s stress response. However, the results demonstrate that the lift-bottom trial was an adequate, physiologically stressful event to induce an acute, short-term (<24 h) effect on the cellular immune components.
Further evidence of a physiologic response to the stress event was the significant increase in glucose that far exceeded the variation in serum glucose in clinically healthy killer whales under routine, non-stressed conditions (Nollens et al., 2019). In addition to the acute hyperglycemia, glucose concentrations significantly correlated with serum cortisol and corticosterone throughout the study period. This response is expected and part of the classic stress response described in other species whereby glucose concentrations increase in direct response to acute GC activity (Munck et al., 1984; Tataranni et al., 1996). Similar increases were observed in the beluga and Yangtze finless porpoise (Neophocaena phocaenoides) during capture-release studies (St. Aubin and Geraci, 1996; Hao et al., 2009). Interestingly, no relationship was found between glucose and cortisol concentrations during capture release studies in the bottlenose dolphin (Thomson and Geraci, 1986; Ortiz and Worthy, 2000), and glucose remained unchanged after an exogenous administration of dexamethasone for a cortisol suppression test, although the authors of the latter study suggested a hyperglycemic event may have been missed due to an inadequate sample collection frequency (Reidarson and McBain, 1999).
For renal enzymes and muscle protein by-products, only Creat increased during ST then decreased during RP. The differences observed in Creat in the present study could also be attributed to experimental design whereby animals with a larger body mass would have a disproportionate gravitational effect on muscle tissue while out of the water; this effect could then be reflected by an increase in Creat. Furthermore, because animals are not fed 24 h a day, this routine overnight fasting (Pre-T and PT, both binned in BL for data analysis) followed by a normal daily feeding schedule may create changes in Creat that have been influenced by feeding, daily activity/exercise, or time of day. For comparison, the published reference ranges for clinically healthy animals are all based on morning blood samples taken from fasted animals (Nollens et al., 2019). Study of the possible influences of daily activity on serum chemistry concentrations and patterns would help remove any questions concerning if our results were in part influenced by normal daily patterns in animals’ husbandry.
Changes in triglycerides and cholesterol in cetaceans during stressful events have not been well-studied. We observed a transitory hypercholesterolemia during ST and an increase in triglycerides during RP. This effect was similar to what was noted for the bottlenose dolphin where triglyceride concentrations increased four-fold in response to a dexamethasone challenge but, unlike our study, cholesterol did not change (Reidarson and McBain, 1999). A transitory hypercholesterolemia, with concentrations returning to baseline within 12 h, occurred in the beluga during an out-of-water experiment (Schmitt et al., 2010). This suggests that acute stress events may induce changes in these serum chemistry parameters. Again, the variations of serum chemistries in the killer whale due to circadian variation and food intake are unknown. Further study may be able to reveal more insight into this possible phenomenon.
TProtein, albumin, and globulin were all elevated during ST. All three also had significant relationships with serum cortisol, while Tprotein and globulin also had a significant relationship with serum corticosterone. This suggests the stress event could have influenced protein binding and availability. One of albumin’s physiological roles is to serve as a carrier protein for steroid hormones and regulate access of steroid hormones to their receptors (Baker, 1998); thus, when GC secretion increases, a concomitant increase in albumin might be expected. TProtein and albumin increases in pigs after transport compared to pre-transport are also correlated with cortisol, suggesting stress may influence serum proteins (Averos et al., 2007). Age was determined to influence some hematology and serum chemistry parameters herein, namely Creat, cholesterol, albumin, and ALP. Given the limited demographics of the current study (5 juveniles, 8 adults, Table 1 and Supplementary Table S2), we did not attempt to discern specific age-related relationships with serum chemistry and hematological parameters, but, in a previous killer whale study, Creat and globulin were shown to increase with age and conversely, total WBC, lymphocytes, iron, sodium, potassium and glucose decreased with age (Nollens et al., 2019). In our study, sex was found to have an influence on Creat, Hb, and Hct. The influence of sex on Creat has also been observed in other cetaceans [bottlenose dolphin (Venn-Watson et al., 2007), beluga (Norman et al., 2013)]. These differences have been attributed to sexual dimorphism between adult male and female killer whales, whereby males are much larger and would expectedly have more muscle mass.
Biological Stress Response
The lift-bottom study presented here induced a biological stress response in killer whales. We observed significant increases in circulating cortisol, corticosterone, and aldosterone concentrations immediately after ST, and cortisol and corticosterone were positively correlated with each other (Figures 2–4 and Table 2). During RP, serum cortisol and corticosterone decreased to their lowest concentrations during the experiment, and then returned to Pre-T concentrations during PT. In the bottlenose dolphin, circulating cortisol and aldosterone were correlated and increased during exposure to cold water temperatures (Houser et al., 2011). The positive correlation between circulating cortisol, corticosterone, and aldosterone during the lift-bottom experiment suggests activation of the HPA axis was achieved (Ortiz and Worthy, 2000), and provides the first documented biological validation for using circulating cortisol, corticosterone, and aldosterone as indicators of stress in the killer whale. However, these hormones are also influenced by factors independent of stress, such as age, sex, and reproductive state (O’Brien et al., 2017; Robeck et al., 2017), and may be influenced by season and time of day (Touma and Palme, 2005; Palme, 2019). Diurnal variation in circulating cortisol was reported in the killer whale (Suzuki et al., 2003). However, the Suzuki et al. (2003) study only involved two animals with samples collected over a single 24 h period. Further study with a larger sample size and collection period is warranted. Nonetheless, interpretation of GC concentrations should therefore occur in the context of the natural patterns and fluctuations of these hormones.
Age influenced all circulating corticosteroids while sex influenced all fecal corticosteroid metabolites and serum aldosterone. The interaction of age and sex only influenced serum aldosterone. Maturational status has an effect on serum cortisol and corticosterone in male killer whales with juvenile and pubertal animals exhibiting lower concentrations of GCs compared to adults (O’Brien et al., 2017). Conversely, age had no effect in female killer whales (Robeck et al., 2017). There are conflicting reports in the literature concerning the influence of age on corticosteroids in bottlenose dolphins. Three different studies found no influence of age on circulating cortisol (St. Aubin et al., 1996; Hart et al., 2012; Fair et al., 2014). However, the Fair et al. (2014) study did find an influence of age on urinary cortisol metabolites, with juveniles exhibiting higher concentrations compared to adults. Additionally, no influence of sex on circulating cortisol was found in two of these aforementioned studies (St. Aubin et al., 1996; Hart et al., 2012) but the Fair et al. (2014) study did show urinary cortisol metabolites were higher in females. No influence of age or sex on aldosterone was found in the bottlenose dolphin (St. Aubin et al., 1996; Hart et al., 2012). In the North Atlantic right whale, fecal aldosterone metabolites in juvenile animals, regardless of sex, are lower compared to adult males (Burgess et al., 2017). Given the influence of age and/or sex on circulating aldosterone in the killer whale, future studies over longer periods with increased sample size could better characterize the factors that influence aldosterone dynamics.
In a similarly designed study to ours, but in the bottlenose dolphin, animals were removed from the water for 2 h. Serum cortisol and aldosterone were elevated within 15 and 45 min from removal from water, respectively, and concentrations remained elevated during the 2 h out-of-water time frame (Champagne et al., 2018). However, due to the increased length of time for the stress test in dolphins, concentrations of both hormones had peaked and were already returning to baseline prior to the end of the stress test (Champagne et al., 2018). It is possible that negative feedback of the HPA axis had already begun to occur in the bottlenose dolphin during the time out-of-water (Champagne et al., 2018) and due to the short duration of our test, may not have in the killer whale.
In another biological stress response study in the harbor porpoise (Phocoena phocoena), circulating cortisol concentrations measured while animals were removed from the water were three-fold higher compared to samples collected under voluntary husbandry conditions (Desportes et al., 2007). In the beluga, circulating cortisol and aldosterone concentrations increased within 1 h of removal from water and returned to pre-removal concentrations at some time point between 1 and 12 h post-removal (Schmitt et al., 2010). Fair et al. (2017) found no difference in circulating cortisol and aldosterone concentrations between zoo-based versus wild bottlenose dolphins, where zoo-based samples were collected under voluntary husbandry behavior and wild samples were collected within the first 10 min of capture. Conversely, Thomson and Geraci (1986) observed increases in circulating bottlenose dolphin cortisol concentrations at 1 h after capture and at 3 h for aldosterone. Obviously in wild animals, pre-capture sampling is not possible and all samples collected in these studies could be influenced by the stress of capture. The length and duration of capture and restraint times and blood collection time intervals during and after the stressor will influence results, as demonstrated in bottlenose dolphins by Champagne et al. (2018) and in the beluga (Schmitt et al., 2010). Experimental design for biological stress response studies should take these considerations into account.
Although the physiological responses to stress can be multi-faceted and intricate, these responses almost always involve activation of the HPA axis which results in an increase in GC synthesis and release (Turner et al., 2012). Activation of the HPA axis causes an increase in ACTH, which then stimulates the release of GCs and aldosterone in bottlenose dolphins (Thomson and Geraci, 1986) and other cetaceans (Atkinson and Dierauf, 2018). Physiologically, chronic stress can be expressed by both hyper- and hypo-activation of the HPA axis, the former of which would result in long-term, sustained elevations of GCs and MCs, and the latter would be reflected in negative feedback of the HPA axis and subsequent decreased GCs and MCs over time (Charmandari et al., 2005). As a result, expected increases in GC and MC secretion during acute stress may not manifest in chronically stressed animals. In our study, activation of the HPA axis via a single, acute stress event was achieved as evidenced by the increase in circulating GC and MC measures and a concomitant presentation of a stress leukogram. Additionally, the magnitude of the stress-induced change we observed in killer whales (∼15 to ∼45 ng/ml) is comparable to that seen in other cetacean species under managed care, including bottlenose dolphins (∼10 to ∼35 ng/ml; Champagne et al., 2018) and belugas (∼18 to ∼45 ng/ml; Schmitt et al., 2010). In all of these studies, significant differences were observed between pre-treatment versus stress test concentrations.
The lack of a significant increase in fecal corticosteroid metabolite concentrations following acute stress in our study could be due to several reasons. Firstly, the “stress event” for the killer whales may not have been long enough in duration or novel enough for the participants to induce a measurable response in feces. The killer whales in this study are at times lifted for husbandry procedures (see section Materials and Methods), so habituation toward the stressor in some animals may have occurred. Although circulating concentrations of GCs in this study were similar in magnitude, they were elevated for a much shorter duration compared to the 2 h stress test conducted in the bottlenose dolphin, where significant increases in fecal GC metabolites were detected (Champagne et al., 2018). Fecal samples represent more cumulative hormone measures and may not be as easily influenced by the episodic and pulsatile changes compared to circulating hormones, and a shorter duration stress event may not be sufficient to be reflected in the feces. Ayres et al. (2012) reported fecal corticosterone metabolites from an emaciated, stranded killer whale to be 27 times higher than the average concentrations from non-stranded, wild Southern Resident male killer whales in Puget Sound, Washington, United States, indicating that severe stress is sufficient to induce significant changes in FGCM profiles. Secondly, the sampling frequency we used may not have been adequate to detect fecal hormone changes, or the inability to collect fecal samples from all of our animals during the stress test stage (6 out of 13 animals collected) precluded our ability to detect any changes. Indeed, the time course of steroid hormone excretion in the killer whale is unknown. In some terrestrial mammals, where research has been conducted, a FGCM peak is observed 24–36 h after ACTH administration (Wasser et al., 2000), but other species have shorter delay times (i.e., 4–12 h in rodents and small carnivores, see Palme (2019). However, although we may have missed a rise in our 1, 3, 6, and 24 h post stressor samples, our methodology was based on the best available evidence which supports a rapid rise in FGCMs in cetaceans. For example in bottlenose dolphins, defecation and fecal transit time following a feeding has been observed to occur within approximately 6 h (Ridgway, 1972). Further, Champagne et al. (2018) observed an increase in fecal cortisol metabolites at 4.5 h after initiation of the stressors. Biancani et al. (2017) did not detect a rise in FGCMs after a prolonged transport stressor, with sampling at 1, 24, and 27 h post-transport, supporting the premise that the rise in FGCMs in their study was missed because it occurs within a 1–24 h period post-stressor, and possibly between 4 and 8 h post-stressor. An increased sampling frequency and successful fecal collection may have increased our chances of detecting a change, if indeed one was present to detect. And finally, as previously explained, the assays employed herein may not be of sufficient sensitivity or cross-reactivity to detect any changes that may have occurred in fecal GC and aldosterone metabolites within our samples.
This is the first published report of circulating aldosterone and fecal aldosterone metabolite measures in this species. Although we only tested one aldosterone assay in our study, both feces and sera satisfied assay validation requirements, and sample processing and extraction methods were also demonstrated to be sufficient (see section Materials and Methods). The ability to induce a measurable corticosteroid response for all three hormones in serum during the lift-bottom experiment suggests that the assays are adequate for measuring circulating corticosteroids. Further investigation of the suitability of the GC and aldosterone antibodies used herein for measuring FGCMs and fecal aldosterone metabolites is warranted and investigation of additional antibodies should be considered. Additionally, centrifugation of the fecal sample after collection and discarding of the supernatant as described in the sample collection and fecal extraction methods may have inadvertently reduced our ability to detect polar FGCMs. Further study of this potential loss of polar metabolites is warranted.
In summary, this study provides the first direct measurement of the physiologic response of killer whales to a controlled stress event. Profiles of circulating and excretory corticosteroids from paired samples collected during a biological stress response test, along with hematology and biochemistry analysis, revealed significant increases in all circulating hormones measured and associated changes in serum chemistry and hematology parameters. This work builds upon that of previous controlled studies to provide robust baseline and reference ranges for adrenal hormones and serum chemistry and hematology parameters in clinically healthy killer whales. Collectively, these findings continue to strengthen tools for monitoring health and welfare of ex situ killer whales, and can inform conservation strategies for the species in situ.
Data Availability Statement
The raw data supporting the conclusions of this article will be made available by the authors, without undue reservation, to any qualified researcher.
Ethics Statement
All samples were collected as part of routine veterinary procedures for killer whales and at the discretion of the attending veterinarian. All procedures described within were reviewed and approved by the SeaWorld Parks and Entertainment Incorporated Research Review Committee and were performed in strict accordance with the US Animal Welfare Act for the care of Marine Mammals.
Author Contributions
KS, JO, and TR conceived the study. KS and TR drafted the manuscript and completed the data curation and analyses. KS, GF, TS, SO, SD, and HN collected and processed the sample. All authors read and approved the final version of the manuscript.
Funding
This project was funded by the SeaWorld Parks and Entertainment, Inc. Funder also provided support in form of salary for authors KS, TR, TS, SO, SD, HN, and JO. The funder had no role in study design, data collection and analysis, decision to publish, or preparation of the manuscript.
Conflict of Interest
The authors have no competing interests and SeaWorld Parks and Entertainment affiliations did not influence or alter our adherence to all Frontier and Aquatic Physiology policies. This does not alter our adherence to Aquatic Physiology policies on sharing data and materials.
Acknowledgments
We thank animal training and husbandry, curatorial and veterinary staff at all three SeaWorld parks for sample collection efforts. Research technicians, Kirsten Monahan-Morris and Amanda McDonnell and interns, Lauren Schmidt and Miranda Neumann are thanked for assistance with sample collation and processing and hormone analysis. Research technician Jacqueline Posy is thanked for help with manuscript formatting. Brad Andrews and Dr. Chris Dold are thanked for their continued support of this project. This is a SeaWorld technical contribution # 2019-5.
Supplementary Material
The Supplementary Material for this article can be found online at: https://www.frontiersin.org/articles/10.3389/fmars.2019.00830/full#supplementary-material
FIGURE S1 | Parallelism for cortisol (A), corticosterone (B), and aldosterone (C) assays. Assay parallelism for serial dilutions for two pools of samples (female and male) graphed as log-transformed relative dose (x-axis) vs. percent bound (y-axis) and compared to the standard curve (black circles) for each assay. Correlation coefficients for the female fecal extract pool (red squares) were r = 0.992, 0.997, and 0.993 (P < 0.05) for the cortisol, corticosterone, and aldosterone assays, respectively. Correlation coefficients for the male fecal extract pool (blue triangles) were r = 0.990, 0.993, and 0.999 (P < 0.05) for the cortisol, corticosterone, and aldosterone assays, respectively. Also for the aldosterone assay, the correlation coefficient for the female sera extract pool (red diamonds, dashed line) was r = 0.995 (P < 0.05), and the correlation coefficient for the male sera extract pool (blue hexagons, dashed line) was r = 0.999 (P < 0.05).
TABLE S1 | Restricted maximum likelihood linear mixed model analysis, with animal id as the random intercept variable, exploring the relationship between serum chemistry and hematology parameters during the study. Data are presented in Table 5. Model statistics are presented below. Fixed variables included time stage (BL, Pre-T samples binned with PT; ST; and RP) sex (coded 0 and 1) age (continuous), and age∗sex in killer whale (n = 13). If P > 0.2 for age∗sex, it was dropped from the final model. Fixed variables were evaluated for marginal significance using the Walds χ2 test. Significant differences (P < 0.05) of time-stage marginal means were made with Šidák corrections. For all LMM, degrees of freedom were estimated using the Kenward–Roger approximation. NS, non-significant.
TABLE S2 | Raw data for experimental study.
References
Atkinson, S., and Dierauf, L. (2018). “Stress and marine mammals,” in Handbook of Marine Mammal Medicine, 3rd Edn, eds F. M. D. Gulland, L. A. Dierauf, and K. L. Whitman (Boca Raton, FL: CRC Press), 153–168.
Averos, X., Herranz, A., Sanchez, R., Comella, J. X., and Gosalvez, L. F. (2007). Serum stress parameters in pigs transported to slaughter under commercial conditions in different seasons. Vet. Med. 52, 333–342.
Axelrod, J., and Reisine, T. D. (1984). Stress hormones: their interaction and regulation. Science 224, 452–459.
Ayres, K. L., Booth, R. K., Hempelmann, J. A., Koski, K. L., Emmons, C. K., Baird, R. W., et al. (2012). Distinguishing the impacts of inadequate prey and vessel traffic on an endangered killer whale (Orcinus orca)population. PLoS One 7:e36842. doi: 10.1371/pone.0036842
Baker, M. E. (1998). Albumin’s role in steroid hormone action and the origins of vertebrates: is albumin an essential protein? FEBS Lett. 439, 9–12.
Bates, D., Maechler, M., Bolker, B., and Walker, S. (2014). Package lme4: Linear Mixed-Effects Models Using Eigen and S4. R Package Version 67.
Biancani, B., Da Dalt, L., Gallina, G., Capolongo, F., and Gabai, G. (2017). Fecal cortisol radioimmunoassay to monitor adrenal gland activity in the bottlenose dolphin (Tursiopstruncatus) under human care. Mar. Mamm. Sci. 33, 1014–1034.
Burgess, E. A., Hunt, K. E., Kraus, S. D., and Rolland, R. M. (2017). Adrenal responses of large whales: integrating fecal aldosterone as a complimentary biomarker to glucocorticoids. Gen. Comp. Endocrinol. 252, 103–110. doi: 10.1016/j.ygcen.2017.07.026
Champagne, C. D., Kellar, N. M., Trego, M. L., Delehanty, B., Boonstra, R., Wasser, S. K., et al. (2018). Comprehensive endocrine response to acute stress in the bottlenose dolphin from serum, blubber, and feces. Gen. Comp. Endocrinol. 266, 178–193. doi: 10.1016/j.ygcen.2018.05.015
Charmandari, E., Tsigos, C., and Chrousos, G. (2005). Endocrinology of the stress response. Ann. Rev. Physiol. 67, 259–284.
Cohn, L. A. (1991). The influence of corticosteroids on host defense mechanisms. J. Vet. Int. Med. 5, 95–104.
Desportes, G., Buholzer, L., Anderson-Hansen, K., Blanchett, M. A., Acquarone, M., Shephard, Q., et al. (2007). Decrease stress: train your animals; the effect of handling methods on cortisol levels in harbor porpoises (Phocoena phocoena) under human care. Aquat. Mamm. 33, 286–292.
Fair, P. A., Schaefer, A. M., Houser, D. S., Bossart, G. D., Romano, T. A., Champagne, C. D., et al. (2017). The environment as a driver of immune and endocrine responses in dolphins (Tursiopstruncatus). PLoS One 12:e0176202. doi: 10.1371/journal.pone.0176202
Fair, P. A., Schaefer, A. M., Romano, T. A., Bossart, G. D., Lamb, S. V., and Reif, J. S. (2014). Stress response of wild bottlenose dolphins (Tursiops truncatus) during capture-release health assessment studies. Gen. Comp. Endocrinol. 206, 203–212. doi: 10.1016/j.ygcen.2014.07.002
Ganswindt, A., Palme, R., Heistermann, M., Borragan, S., and Hodges, J. K. (2003). Non-invasive assessment of adrenocortical function in the male African elephant (Loxodonta africana) and its relation to musth. Gen. Comp. Endocrinol. 134, 156–166.
Goymann, W. (2012). On the use of non-invasive hormone research in uncontrolled, natural environments: the problem with sex, diet, metabolic rate and the individual. Methods Ecol. Evol. 3, 757–765.
Hao, Y. J., Zhao, Q. Z., Wu, H. P., Chen, D. Q., Gong, C., Li, L., et al. (2009). Physiological responses to capture and handling of free-ranging male Yangtze finless porpoises (Neophocaena phocaenoides asiaeorientalis). Mar. Freshw. Behav. Physiol. 42, 315–327.
Hart, L. B., Wells, R. S., Keller, N., Balmer, B. C., Hohn, A. A., and Lamb, S. V. (2012). Adrenal hormones in common bottlenose dolphins (Tursiops truncatus): influential factors and reference intervals. PLoS One 10:e0127432. doi: 10.1371/journal.pone.0127432
Houser, D. S., Yeates, L. C., and Crocker, D. E. (2011). Cold stress induces an adrenocortical response in bottlenose dolphins (Tursiops truncatus). J. Zoo Wild. Med. 42, 565–571.
Hunt, K. E., Rolland, R. M., Kraus, S. D., and Wasser, S. K. (2006). Analysis of fecal glucocorticoids in the North Atlantic right whales (Eubalaena glacialis). Gen. Comp. Endocrinol. 148, 260–272.
Kenward, M. G., and Roger, J. H. (1997). Small sample inference for fixed effects from restricted maximum likelihood. Biometrics 5, 983–997.
Legacki, E. L., Robeck, T. R., Steinman, K. J., and Conley, A. J. (2019). Comparative analysis of steroids in cyclic and pregnant killer whales, beluga whales, and bottlenose dolphins by liquid chromatography tandem mass spectrometry. Gen. Comp. Endocr. 285:113273. doi: 10.1016/j.ygcen.2019.113273
Morris, D. J. (1981). The metabolism and mechanism of action of aldosterone. Endocr. Rev. 2, 234–247.
Munck, A., Guyre, P. M., and Holbrook, N. J. (1984). Physiological functions of glucocorticoids in stress and their relation to pharmacological actions. Endocr. Rev. 5, 25–44.
Munro, C. L., and Lasley, B. L. (1988). “Non-radiometric methods for immunoassay of steroid hormones,” in Non-Radiometric Assays: Technology and Application in Polypeptide and Steroid Hormone Detection, eds B. D. Albertson and F. P. Haseltine (New York, NY: Liss), 289–329.
Nakagawa, S., and Schielzeth, H. (2013). A general and simple method for obtaining R2 from generalized linear mixed-effects models. Meth. Ecol. Evol. 4, 133–142. doi: 10.1093/sysbio/syy060
Nollens, H. H., Robeck, T. R., Schmitt, T. L., Croft, L. L., Osborn, S., and McBain, J. F. (2019). Effects of age, sex and season on the variation in blood analytes in clinically normal ex situ population of killer whales (Orcinus orca). Vet. Clin. Pathol. 48, 100–113. doi: 10.111/vcp.12697
Norman, S. A., Beckett, L. A., Miller, W. A., St.Leger, J., and Hobbs, R. C. (2013). Variation in hematologic and serum biochemical values of belugas (Delphinapterus leucas) under managed care. J. Zoo Wildl. Med. 44, 376–388.
O’Brien, J. K., Steinman, K. J., Fetter, G. A., and Robeck, T. R. (2017). Androgen and glucocorticoid production in the male killer whale (Orcinus orca): influence of age, maturity and environmental factors. Andrology 5, 180–190. doi: 10.1111/andr.12254
Ortiz, R. M., and Worthy, G. A. (2000). Effects of capture on adrenal steroid and vasopressin concentrations in free-ranging bottlenose dolphins (Tursiops truncatus). Comp. Biochem. Physiol. A Mol. Integr. Physiol. 125, 317–324.
Palme, R. (2019). Non-invasive measurement of glucocorticoids: advances and problems. Physiol. Behav. 199, 229–243. doi: 10.1016/j.physbeh.2018.11.021
Pruett, J. H., Fisher, W. F., and Deloach, J. R. (1987). Effects of dexamethasone on selected parameters of the bovine immune system. Vet. Res. Commun. 11, 305–323.
R Core Team, (2013). R: A Language and Environment for Statistical Computing. Vienna: R Foundation for Statistical Computing.
Reidarson, T. H., and McBain, J. F. (1999). Hematologic, biochemical, and endocrine effects of dexamethasone on bottlenose dolphins (Tursiops truncatus). J. Zoo Wild. Med. 30, 310–312.
Richard, J. T., Robeck, T. R., Osborn, S. D., Naples, L., McDermott, A., LaForge, R., et al. (2017). Testosterone and progesterone concentrations in blow samples are biologically relevant in belugas (Delphinapterus leucas). Gen. Comp. Endocrinol. 246, 183–193. doi: 10.1016/j.ygcen.2016.12.006
Ridgway, S. H. (1972). “Homeostasis in the aquatic environment,” in Mammals of the Sea: Biology and Medicine, eds S. H. Ridgway and C. S. Thomas (Springfield, IL: Thomas), 590–747.
Robeck, T. R., and Nollens, H. H. (2013). Hematologic and serum biochemical parameters reflect physiological changes during gestation and lactation in killer whales (Orcinus orca). Zoo Biol. 32, 479–509.
Robeck, T. R., Steinman, K. J., and O’Brien, J. K. (2017). Characterization and longitudinal monitoring of serum androgens and glucocorticoids during normal pregnancy in the killer whale (Orcinus orca). Gen. Comp. Endocrinol. 247, 116–129. doi: 10.1016/j.ygcen.2017.01.023
Schmitt, T. L., St.Aubin, D. J., Schaefer, A. M., and Dunn, J. L. (2010). Baseline, diurnal variations, and stress- induced changes of stress hormones in three captive beluga whales. Delphinapterus leucas. Mar. Mamm. Sci. 26, 635–647.
St. Aubin, D. J., and Geraci, J. R. (1996). Adaptive changes in hematologic and plasma chemical constituents in captive beluga whales Delphinpaterus leucas. Can. J. Fish. Aquat. Sci. 46, 796–803.
St. Aubin, D. J., Ridgway, S. H., Wells, R. S., and Rhinehart, H. (1996). Dolphin thyroid and adrenal gland hormones: circulating levels in wild and domesticated Tursiops truncatus, and influence of age, sex, and season. Mar. Mamm. Sci. 12, 1–13.
Suzuki, M. S., Uchida, S., Ueda, K., Tobayama, T., Katsumata, E., Yoshioka, M., et al. (2003). Diurnal and annual changes in serum cortisol concentrations in Indo-Pacific bottlenose dolphins Tursiops aduncus and killer whales Orcinus orca. Gen. Comp. Endo. 132, 427–433.
Tataranni, P. A., Larson, D. E., Snitker, S., Young, J. B., Flatt, J. P., and Ravussin, E. (1996). Effects of glucocorticoids on energy metabolism and food intake in humans. Am. J. Physiol. 271, E317–E325.
Thomson, C. A., and Geraci, J. R. (1986). Cortisol, aldosterone, and leucocytes in the stress response of bottlenose dolphins, Tursiops truncatus. Can. J. Fish. Aquat. Sci. 43, 1010–1016.
Touma, C., and Palme, R. (2005). Measuring fecal glucocorticoid metabolites in mammals and birds: the importance of validation. Ann. N.Y. Acad. Sci. 1046, 54–74.
Turner, A. I., Keating, C., and Tilbrook, A. J. (2012). “Sex differences and the role of sex steroids in sympatho-adrenal medullary system the hypothalamo-pituitary adrenal axis responses to stress,” in Sex Steroids, ed. S. M. Kahn (Rijeka: In Tech Publishing), 115–136.
Venn-Watson, S., Jensen, E. D., and Ridgway, S. H. (2007). Effects of age and sex on clinicopathologic reference ranges in a healthy managed Atlantic bottlenose dolphin population. J. Am. Vet. Med. Assoc. 231, 596–601.
Wasser, S. K., Hunt, K. E., Brown, J. L., Cooper, K., Crockett, C. M., Bechert, U., et al. (2000). A generalized fecal glucocorticoid assay for use in a diverse array of nondomestic mammalian and avian species. Gen. Comp. Endocrinol. 120, 260–275.
Wasser, S. K., Lundin, J. I., Ayres, K., Seely, E., Giles, D., Balcomb, K., et al. (2017). Population growth is limited by nutritional impacts on pregnancy success in endangered southern resident killer whales (Orcinus orca). PLoS One 12:E0179824. doi: 10.1371/journal.pone.0179824
West, B. T., Welch, K. B., and Galecki, A. T. (2014). Linear Mixed Models: a Practical Guide Using Statistical Software, 2nd Edn. New York: CRC Press.
Wilkie, B. N., Caoili, F., and Jacobs, R. (1979). Bovine lymphocytes: erythrocyte rosettes in normal, lymphomatous and corticosteroid-treated cattle. Can. J. Comp. Med. 43, 22–28.
Keywords: corticosteroids, endocrinology, stress, killer whale (Orcinus orca), feces
Citation: Steinman KJ, Robeck TR, Fetter GA, Schmitt TL, Osborn S, DiRocco S, Nollens HH and O’Brien JK (2020) Circulating and Excreted Corticosteroids and Metabolites, Hematological, and Serum Chemistry Parameters in the Killer Whale (Orcinus orca) Before and After a Stress Response. Front. Mar. Sci. 6:830. doi: 10.3389/fmars.2019.00830
Received: 09 September 2019; Accepted: 26 December 2019;
Published: 23 January 2020.
Edited by:
Cory D. Champagne, University of Washington Bothell, United StatesReviewed by:
Elizabeth A. Burgess, Anderson Cabot Center for Ocean Life, United StatesLaura Thompson, Sea Research Foundation, United States
Rupert Palme, University of Veterinary Medicine Vienna, Austria
Copyright © 2020 Steinman, Robeck, Fetter, Schmitt, Osborn, DiRocco, Nollens and O’Brien. This is an open-access article distributed under the terms of the Creative Commons Attribution License (CC BY). The use, distribution or reproduction in other forums is permitted, provided the original author(s) and the copyright owner(s) are credited and that the original publication in this journal is cited, in accordance with accepted academic practice. No use, distribution or reproduction is permitted which does not comply with these terms.
*Correspondence: K. J. Steinman, S2FyZW4uU3RlaW5tYW5AU2VhV29ybGQuY29t
†Present address: J. K. O’Brien, Taronga Conservation Society Australia, Sydney, NSW, Australia