 Silvia de Juan1*
 Hilmar Hinz2
 Paolo Sartor3
 Sergio Vitale4Luis Bentes5
 Jose M. Bellido6Claudia Musumeci3Daniela Massi4Vita Gancitano4
 Montserrat Demestre1
- 1Consejo Superior de Investigaciones Científicas, Institute of Marine Science, Passeig Marítim de la Barceloneta, Barcelona, Spain
- 2Consejo Superior de Investigaciones Científicas, Mediterranean Institute for Advanced Studies, Esporles, Spain
- 3Consorzio per il Centro Interuniversitario di Biologia Marina ed Ecologia Applicata (CIBM), Livorno, Italy
- 4Consiglio Nazionale delle Ricerche (CNR) – Istituto per le Risorse Biologiche e le Biotecnologie Marine (IRBIM), Mazara del Vallo, Italy
- 5Centre of Marine Sciences (CCMAR), University of Algarve, Faro, Portugal
- 6Instituto Español de Oceanografía, Centro Oceanográfico de Murcia, Murcia, Spain
Reducing the impact on vulnerable species through changes in fishing practices, such as the spatial or temporal avoidance of certain areas, is key to increase the ecological sustainability of fisheries. However, it is often hampered by the availability of sufficiently detailed data and robust indicators. Existing trawl surveys are a cost-effective data source to assess the vulnerability of fishing areas based on the quantities of vulnerable species caught. We developed a biological traits-based approach to the vulnerability of demersal assemblages using commercial trawl catch data. An expert-based approach identified a set of biological traits that are expected to condition the species’ response to trawling impact and are combined to produce the vulnerability index ranked into four levels (low, moderate, high, and very high vulnerability). The approach was tested in four southern European fishing grounds showing evidence of over-exploitation, through catches being dominated by species of relatively low vulnerability to fishing impacts. The general distribution of species’ biomass amongst vulnerability groups was highly homogenous across case studies, despite local differences in fishing fleet structure, target species and fishing depths. Within all areas the species with moderate vulnerability dominated and, in most instances, species of “very high” vulnerability were not recorded. Nevertheless, differences emerged when comparing the proportions of highly vulnerable species in the catches. Variability in vulnerability level of the catch was also observed at small spatial scales, which was principally explained by differences in habitat type and depth and, secondarily, by fishing effort. In fine mud in the shallower areas there was a higher presence of low vulnerable fauna. Furthermore, vulnerable organisms decreased in their presence in sandier substrates on the continental shelf. The spatial heterogeneity in assemblage vulnerability composition encourages the potential for adoption of this index in the spatial management of fishing grounds aiming at ensuring a sustainable exploitation by mitigating trawl impacts on the most vulnerable components of the demersal assemblages.
Introduction
Trawling is globally recognized as a low-selective fishing activity, with by-catch that often constitutes a large fraction of the catch. High by-catch levels result in the removal of large parts of demersal/benthic communities, including many species that play a key role in these systems (Hall et al., 2000). Consequently, this can generate profound changes in ecosystem structure and functioning (Coleman and Williams, 2002; Thrush and Dayton, 2002). To ensure the long-term sustainability of fisheries and minimize indirect impacts on ecosystems, fishing related mortalities of vulnerable species should be mitigated by adapting adequate technical and management measures. Aiming to face these challenges, both scientists and stakeholders are currently joining efforts to minimize the impact of trawling by incentivizing more selective gears and fishing practices (Komoroske and Lewison, 2015; Vogel et al., 2017). However, mitigation of trawling effects on the ecosystem needs to be underpinned by detailed information about where and when vulnerable species occur, understanding vulnerability as the susceptibility of either an individual, a species, a population, a community or an habitat to impact from external factors, natural and anthropogenic (Halpern et al., 2007). To significantly contribute to these advances, a crucial scientific input is the assessment of the vulnerability of demersal assemblages to fishing practices at spatial and temporal scales that are relevant for management.
The responses of fish communities to stressors such as fishing have been generally evaluated by studying the effects of fishing pressure on individual species biomass, on size spectra or on the trophic level (Pauly et al., 1998; Daan et al., 2005; Piet and Jennings, 2005; Greenstreet and Rogers, 2006; Agnetta et al., 2019). However, the large-scale assessment of biological assemblages’ structure and composition is often masked by the complexity and natural dynamism of ecological systems (Mouillot et al., 2006). More than four decades ago, Pearson and Rosenberg (1978) demonstrated that the response of benthic fauna to organic enrichment depends on the biological traits of the organisms. More recent advances in the application of species biological traits is to assess the response of communities under a wide range of environmental scenarios. This provides an approach that responds rapidly and consistently across taxa and ecosystems to multiple disturbances (e.g., Doledec et al., 1999; Usseglio-Polatera et al., 2000; Mouillot et al., 2013), and particularly to fishing (e.g., de Juan et al., 2007; Bremner, 2008). The Biological Traits Approach (BTA) is based on the assumption that species, regardless the taxonomy affinity, sharing a range of similar longevity, reproduction, morphological and behavioral attributes are expected to have similar responses to external stressors (Jennings et al., 1999; Usseglio-Polatera et al., 2000; Bremner, 2008). BTA provides variables that correlate well with impact intensity (Suding et al., 2008), as it focuses on the different strategies (traits) giving mechanistic explanations to stress responses or resultant ecosystem conditions (Statzner and Bêche, 2010). Therefore, we can develop ecological indicators that assist management decisions by adapting the principles of BTA to the assessment of potential vulnerability of biological assemblages to trawling activities at large scales.
Within the present study, a BTA to estimate and quantify species’ vulnerability to trawling activities was developed and validated, with a specific focus on the vulnerability of “catch assemblages.” The proposed vulnerability indicator takes account of extractive effects by the fishing gear and the posterior fate of the organisms, with no accounting of the physical effects of gear contact with the seabed, traditionally assessed in fishing impact studies (Thrush and Dayton, 2002; Kaiser et al., 2006). Reasons for focusing on demersal assemblages are based on prioritizing the feasibility of the approach. Standardized trawl surveys can provide cost-effective comprehensive sources of data at a regular basis that allow the assessment of large scale and/or temporal changes in marine communities, while the monitoring of benthic communities is highly time consuming and not practical at large scales. The data collected by regular trawl surveys is limited by the selectivity of fishing gears catching only a fraction of the marine assemblages (Collie et al., 2013), it may nonetheless provide a readily available and adequate proxy for the overall vulnerability of marine communities. Therefore, the approach developed in this work was aimed at assessing the vulnerability of a “exploited fish assemblage,” defined as a group of benthic and demersal species co-occurring in trawl catches. We propose a composite vulnerability index that encompasses: (1) the susceptibility of species to be caught (hereafter “Catchability), (2) the species’ resistance to extraction from the water and subsequent discard (hereafter “Resistance”), and (3) the populations’ effects of fishing mortality (hereafter population “Resilience”). An expert-based approach was adopted, aimed at identifying a set of biological traits of demersal assemblages that are expected to condition the species’ response to trawling pressure and that are combined to produce the vulnerability index. Differently from the traditional BTAs (e.g., Bremner et al., 2003), traits were selected a priori to define levels of species’ vulnerability to trawling, therefore adopting the “vulnerability group” concept (e.g., de Juan and Demestre, 2012). This way, the use of biological traits allowed dividing a multi-species assemblage in different groups according to different expected values of vulnerability to trawling, relying on the “Catchability,” “Resistance” and “Resilience” properties of the species’ populations.
This vulnerability indicator framework was tested in four southern European fisheries (case studies) to account for regional variability. These case studies corresponded to different trawling grounds located on the continental shelf where regular monitoring of catch composition is in force. In southern European fisheries the by-catch of trawl fisheries can comprise more than half of the catch biomass, often containing a number of vulnerable species that are usually commercialized (Tsagarakis et al., 2014). The most relevant causes for high by-catch rates are the low selectivity of fishing gears, as well as the great variety of fishing strategies that act in an adaptive way to the variations of the market requests (Damalas et al., 2015). In this region, management actions could focus on changes in fishing practices, including the reduction of fishing effort in areas with assemblages containing a high density of by-catch that is vulnerable and/or with low commercial interest. Accordingly, the objective of this work was to develop a methodological framework to assess the vulnerability of trawled assemblages that can be applied to various spatial scales in southern European seas, providing information that could allow modified fishing practices to be tailored to each unit of assessment.
Materials and Methods
The methodological approach is divided in two main steps. The first step consisted on the development of the vulnerability index by: (a) the identification of the biological traits relevant for characterizing the species’ vulnerability to trawling, (b) the scoring of traits depending on their contribution to increase or decrease the species’ vulnerability, and (c) the combination of traits to produce a composite vulnerability index. The vulnerability index is composed by three sub-indices related with the different properties of vulnerability to commercial trawling: catchability, resistance, and population resilience to fishing. This structure allows tracing back the contribution of the sub-indices to the overall assemblage vulnerability. A template to reproduce the index is included as Supplementary Table S1.
The second step consisted on testing the approach in four case studies in southern European Seas (Catalan Sea, Ligurian and north Tyrrhenian Sea, Strait of Sicily and north-east Atlantic – coast of Algarve), where the vulnerability indices were estimated for demersal assemblages exploited by commercial trawlers.
The methodological approach relied on an expert workshop that was organized in January 2017, within the framework of MINOUW Horizon 2020 Project1.
First Step: Development of Vulnerability Index
Selection of Biological Traits and Scoring of Trait Categories
Experts selected ten biological traits related with morphological, behavioral and life-history characteristics of demersal species and expected to reflect the vulnerability of the organisms to trawling (Table 1). The expert evaluation was done considering the different phases of professional fishing, including capture, resistance on-board and survival after sorting and potential discard at sea, and population resilience to fishing mortality considering reproductive strategies related to their recovery potential.
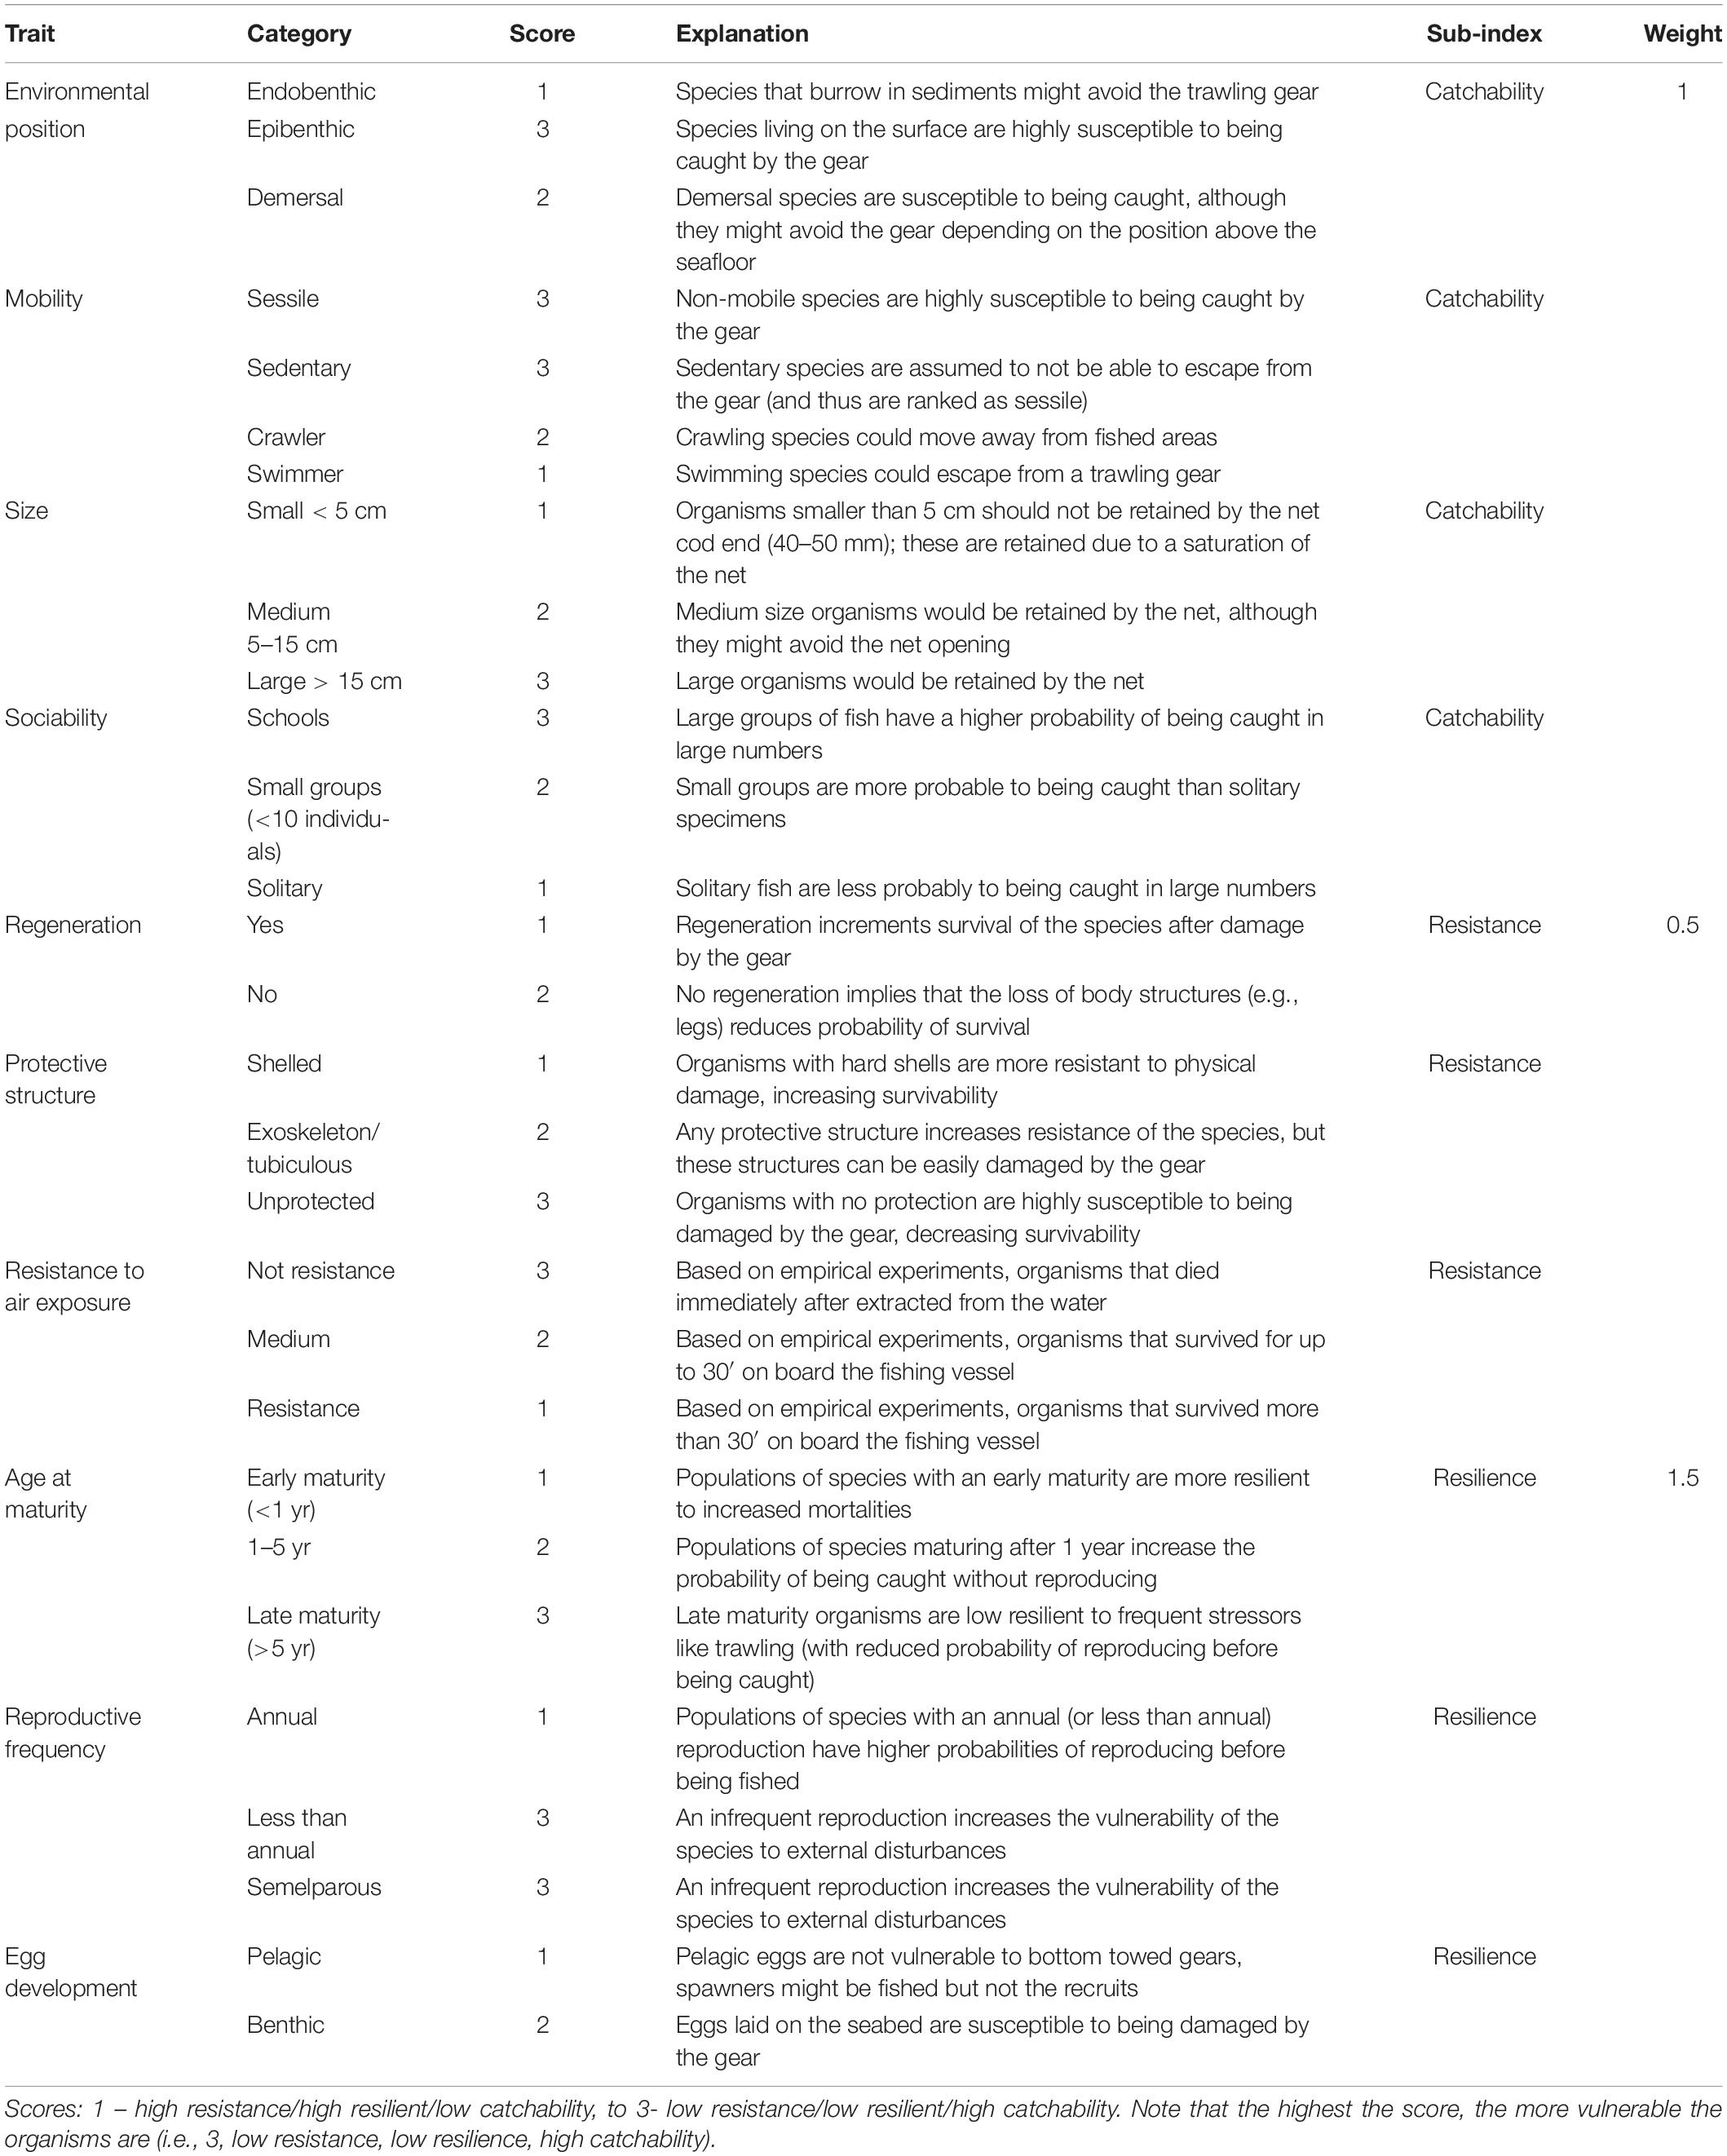
Table 1. Summary of traits, traits’ categories and sub-indices, including the category scores and sub-index weight and the justification for score/weight assignation.
The variability in biological traits’ expression (e.g., mobility trait varies from sessile to swimmer) was identified for each trait as trait’s category. The categories within a trait were scored depending on their expected link with trawling activities: a score of 1 means the trait category contributes to a neutral response to trawling (low vulnerability), while a 3 score means a negative response (high vulnerability) (Table 1).
Combination of Traits to Produce a Composite Vulnerability Index
The biological traits were classified in three vulnerability sub-indices related to the effects of trawling practices on the species: (1) Catchability, encompassing those traits that increase or decrease the probability of individuals to be caught (4 traits: size, habitat, mobility, sociability), (2) Resistance, including those traits that increase or decrease the potential survival of individuals extracted from the water and discarded (3 traits: protective structure, regeneration, resistance to air exposure), and (3) Resilience, as the reproductive potential of a species, including those traits that increase or decrease the long-term recoverability and viability of the population (4 traits: age at maturity, reproductive frequency, egg development and life-span). To estimate a sub-index value per species, first, traits that identify a sub-index are selected (e.g., size, habitat, mobility and sociability for “catchability”). Then, the scores assigned to the traits exhibited by the species is summed and divided by the number of traits that compose the sub-index. The result is the score for the sub-index, that was normalized so each sub-index ranged from 0 to 1.
Vulnerability Index
The three sub-indices characterize the overall vulnerability of a species to fishing practices; however, the sub-indices were weighted depending on their expected role in conditioning the overall vulnerability of the species to fishing practices (Table 1). The resistance of the individuals is expected to have a limited impact by influencing at the individual level and only if species are discarded, so Resistance was weighed by 0.5. The Catchability sub-index was weighed by 1, as it is related with the probability of fishing individuals from a population, therefore, this index has a moderate influence on the overall vulnerability. The Resilience of populations was considered the most relevant component as it is related with the long-term sustainability of fished populations, therefore, it was weighed by 1.5. The vulnerability score was obtained after the sum of the weighed sub-indices, and it ranges from 0 to 3.
The total vulnerability score was divided in 4 ranges, defined after k-means, that represent 4 vulnerability groups: “very high,” “high,” “moderate,” and “low” (e.g., “low” vulnerability means “low” catchability, “high” resistance, and “high” resilience). The same methodology was applied to the sub-indices. The vulnerability ranges were defined based on the potential maximum and minimum scores implying some groups might be poorly represented in an assemblage. The adequacy of this approach was tested by comparing the output with vulnerability groups based on natural bins, that relied on maximum and minimum values recorded in the samples.
Second Step: Testing the Vulnerability Indices in Four Case Studies
Case Studies and Biological Surveys
The performance of the vulnerability index was tested in four case studies, represented by different fishing grounds with own characteristics in terms of target species and average fishing effort (Table 2). They were located in the western and central Mediterranean Sea (Catalan Sea, GSA 6; Ligurian and north Tyrrhenian Sea, GSA 9; Strait of Sicily, GSA 16) and north-east Atlantic (coast of Algarve, ICES IXa) (Figure 1). In these areas, fishing activity is regularly monitored according to the activities of EU Data Collection Programs, as well as by national research Projects. Data on species assemblages exploited by trawling, collected on a seasonal basis, were used: from 2010 to 2015 for the Catalan and Ligurian-North Tyrrhenian Sea, 2009–2013 for the Strait of Sicily, and from 1998 to 2001 for the coast of Algarve. In each case study, data collected by scientific observers on board commercial trawlers, or by self-reporting and self-samplings by trained fishermen, allowed identifying the species composition of the catches and the total wet weight of each species in the catch. The species were classified as commercial or non-commercial, according to the local fishing practices. The trawl catch biomass data was standardized to area trawled, according to the information on the area swept by the investigated vessels (kg/km2). The number of samples ranged from 130 to 275 trawl catches in each of the four case studies.
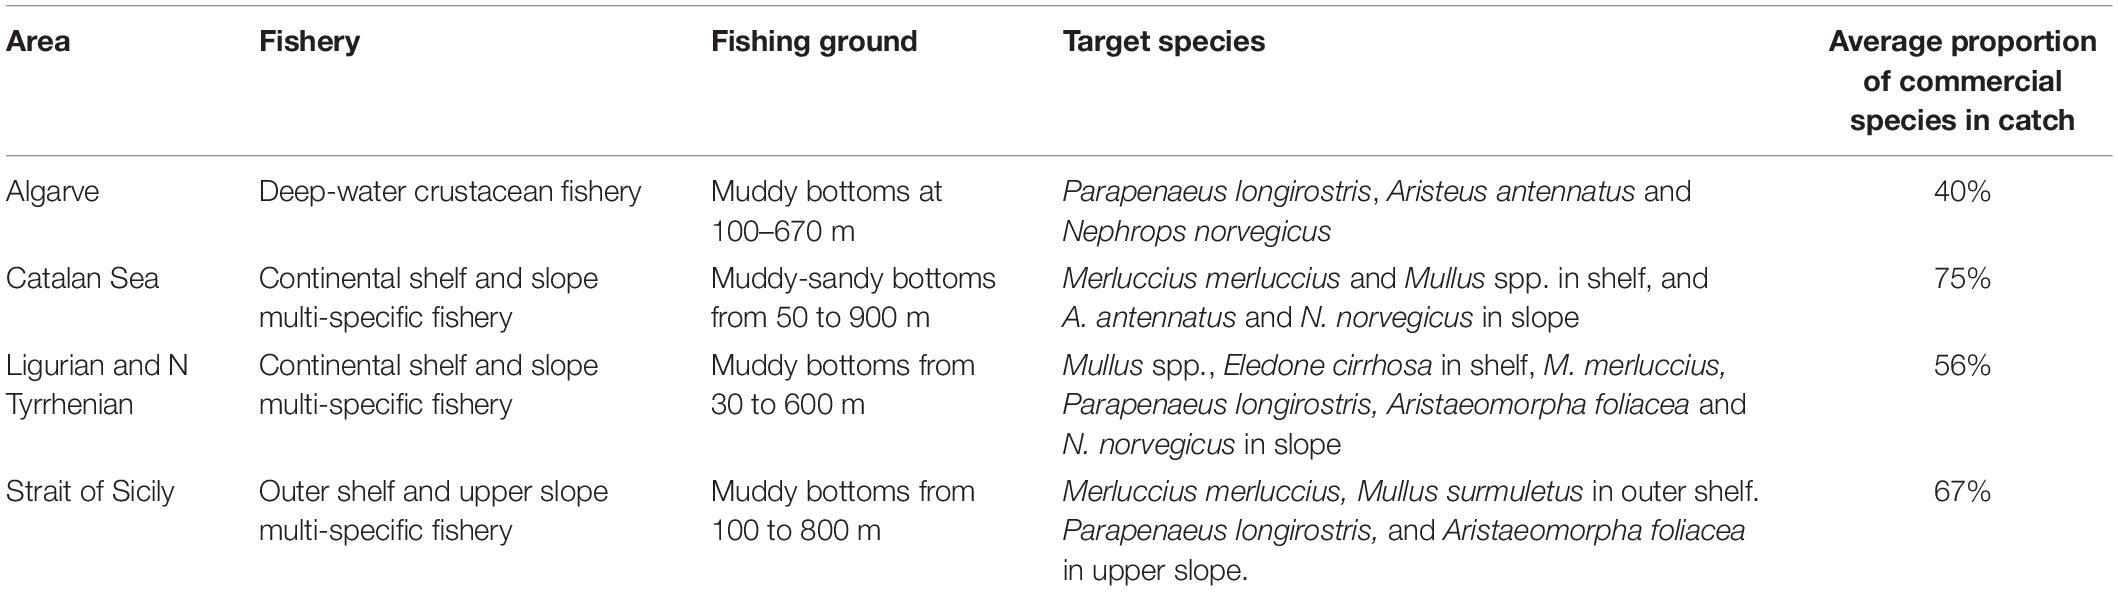
Table 2. Characteristics of the trawl fisheries in the four case studies.
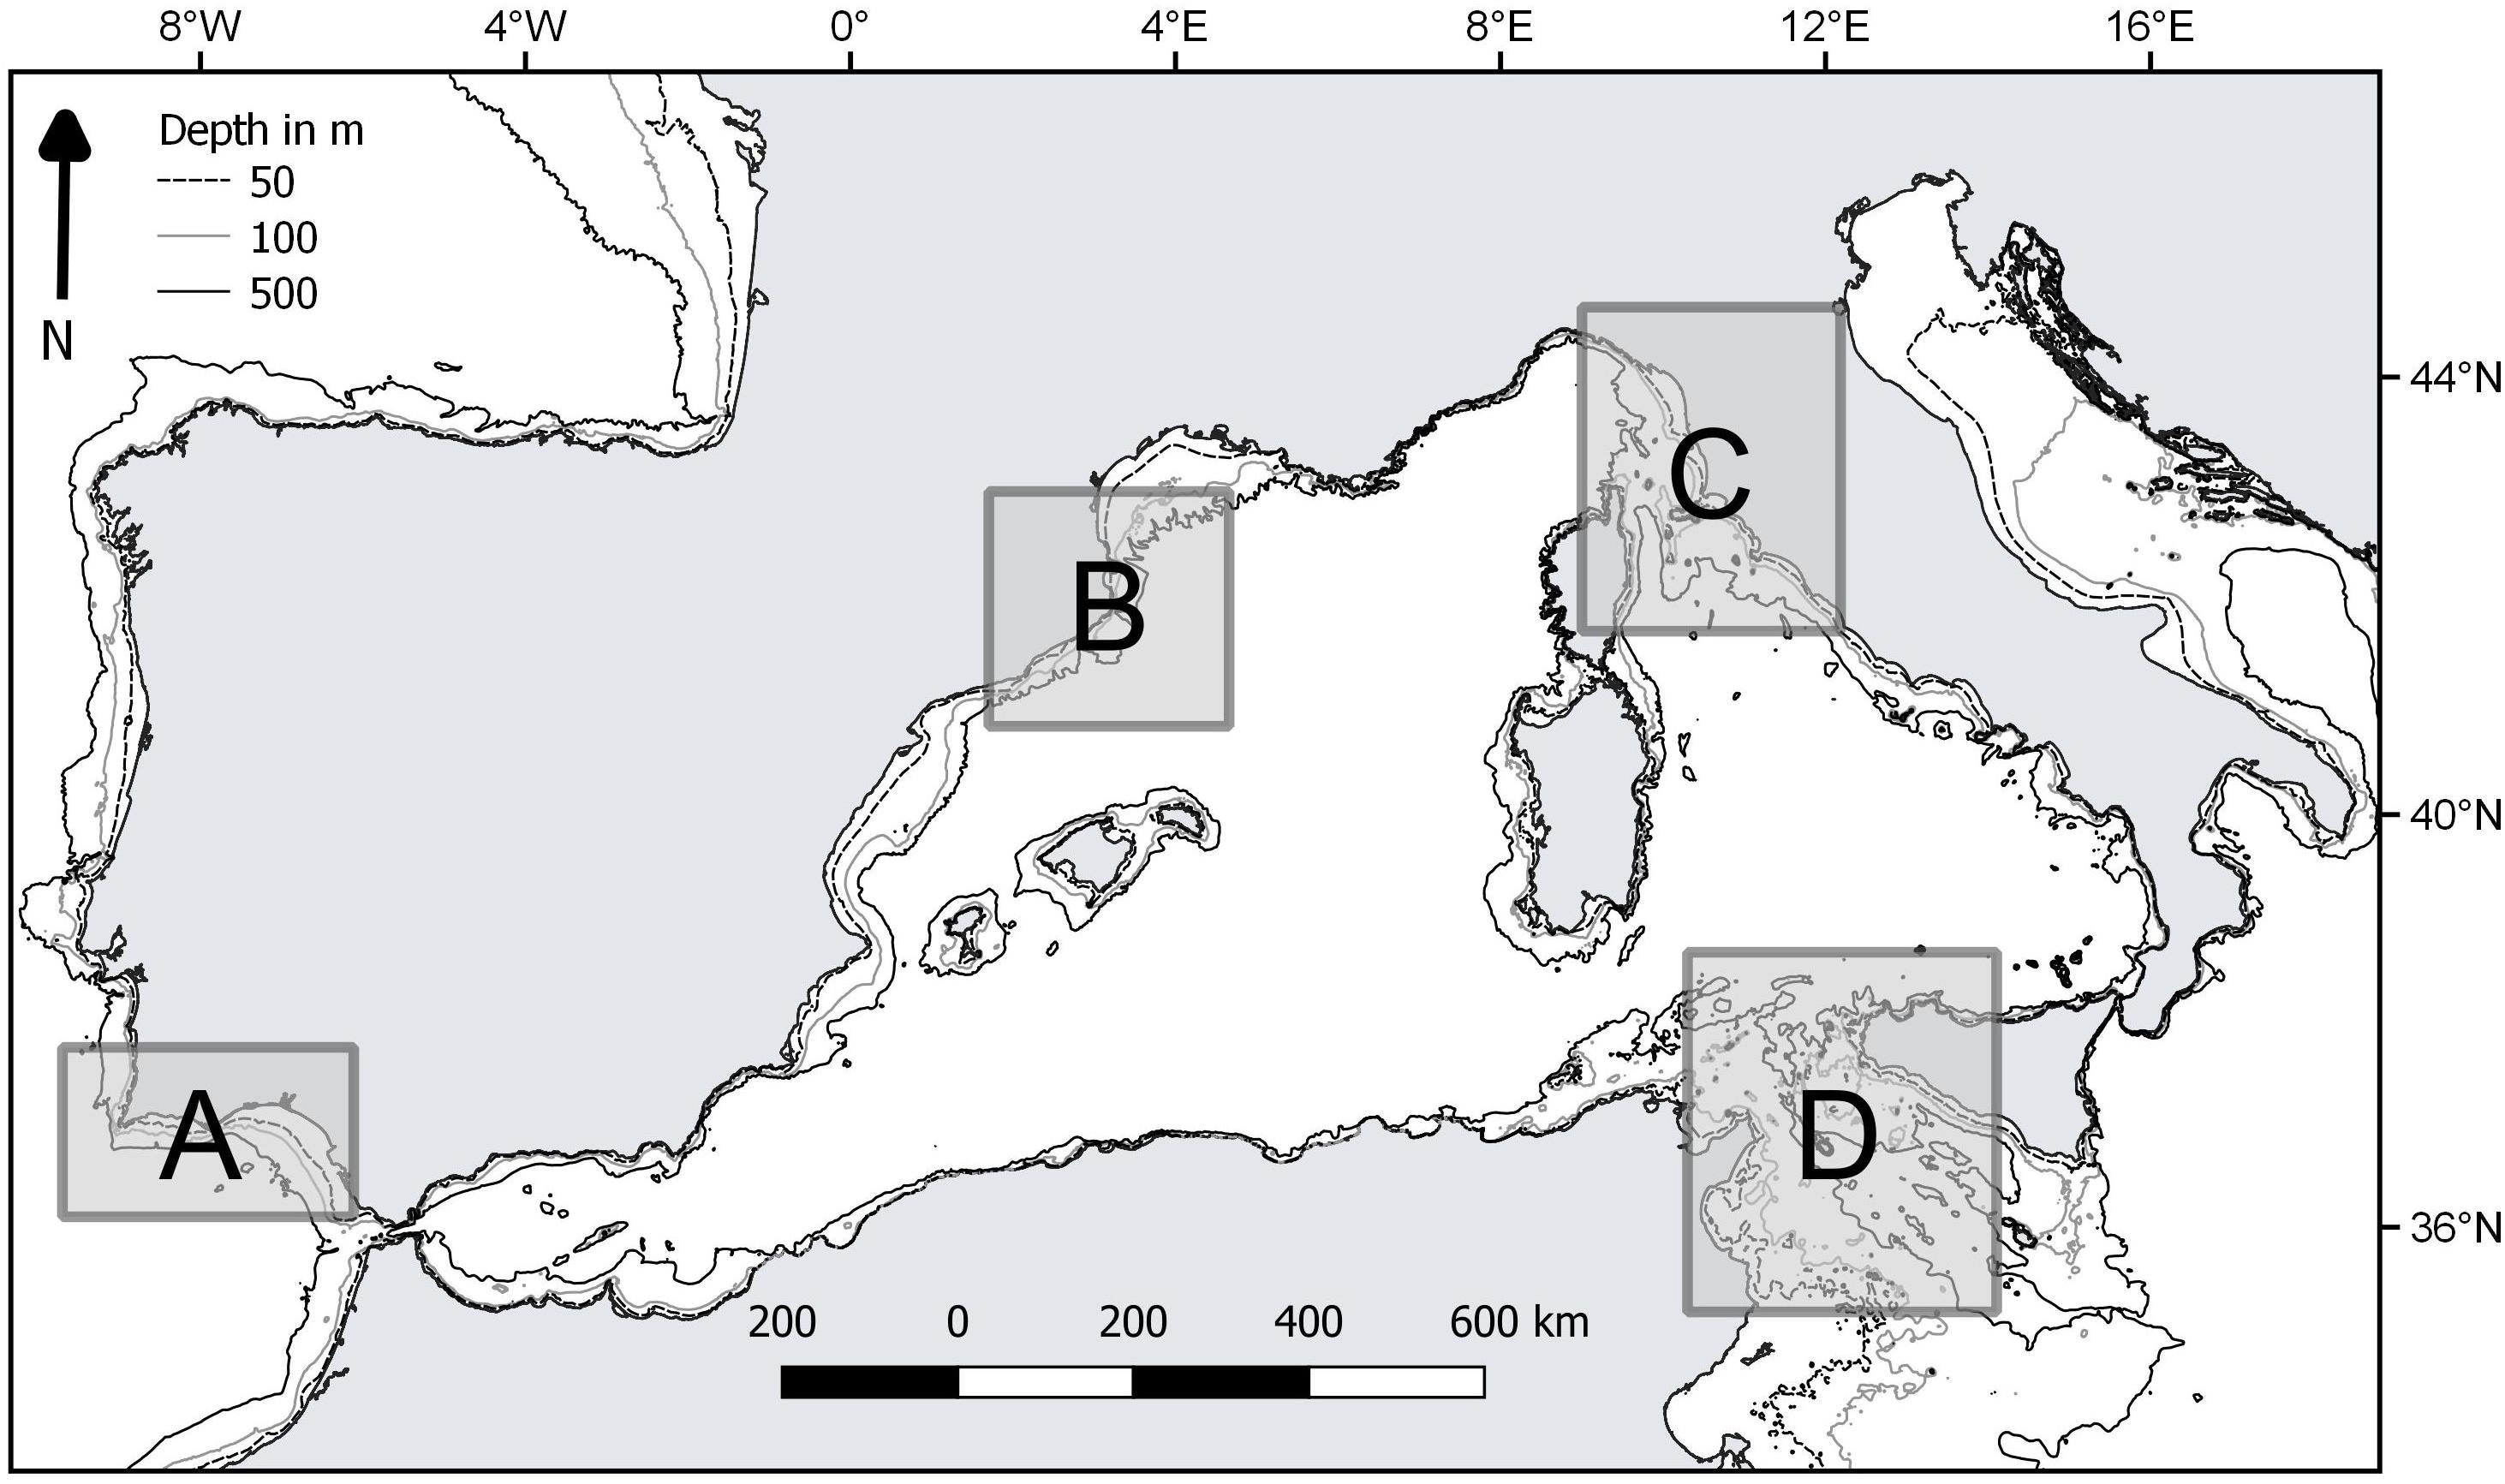
Figure 1. Location of the case studies: A, coast of Algarve; B, Catalan Sea; C, Ligurian and north Tyrrhenian Sea; D, Strait of Sicily.
Biological Trait Assignation to the Demersal Assemblage
In order to have a manageable list of species to search for biological traits information, a subset of representative species was selected based on the representativeness and dominance criteria, expressed as frequency of occurrence in at least 10% of samples, or species within the 90% of cumulative biomass (full species list is available in Supplementary Table S2). The result was a subset of 161 species that included 71 Actinopterygii, 10 Elasmobranchia, 32 Crustacea Decapoda, 19 Cephalopoda, and 28 benthic invertebrates (including Bivalvia, Gastropoda, Echinodermata, Ascidiacea, and Cnidaria). The set of biological traits (Table 1) was assigned to the species’ subset during the expert workshop and it relied on expert knowledge and available databases (e.g., FISHBASE for vertebrates2, and BIOTIC for invertebrates3). Additionally, the available scientific literature provided information on the reproductive strategies of species, often encompassing regional variability. As a result, a minor proportion of cases (i.e., species-trait category) remained empty (<10%). The assignation of trait categories followed a fuzzy coding approach. Each trait per species had a maximum value of 1, that could be split amongst the different trait categories, allowing a species to exhibit more than one category. When no information for a trait was available, the 1 was equally divided amongst the trait categories. The trait score was multiplied by the fuzzy code, so each species had a single score per trait that determined its vulnerability group (see previous section). The biomass of all species within a vulnerability group in each sample was added. As a result, each sample (i.e., trawl catch) was characterized by variable biomass of the vulnerability groups (low, moderate, high, and very high) that represent the vulnerability level of the catch.
Additionally, as the case studies corresponded to commercial fishing grounds historically exploited, with no reference or baseline for the index testing, we relied on published literature to provide information on commercial species that have historically declined. Two scientific papers (Maynou et al., 2011; Damalas et al., 2015) provided information on species noticed by fishermen as suffering an historical decline in Mediterranean trawl catches.
Data Analysis
To avoid trait redundancy, we checked for correlation in the biomass of traits included in the analysis and observed an absence of significant correlation between any pair of traits. Then, we graphically explored patterns in the distribution of trawl catch biomass in the four groups for the vulnerability index and the three sub-indices, catchability, resistance and resilience, per case study. The biomass was averaged across sampling events within each geographical region. A Generalized Linear Model (GLM) was applied to assess the significance of variability in vulnerability levels of the catch biomass (catch biomass ∼ level, family = “quasi-poisson”; level: low, moderate, high and very high). The adequacy of the selected error structures was assessed by visual inspection of residuals vs. fits plots. The goodness-of-fit of the models was assessed by comparing their relative contribution to total explained deviance. GLMs were done with the R v.3.5.0 packages mgcv v.1.8-23 and MASS v.7.3-494.
The average trawl catch biomass, as well as the average biomass of the species with high or very high vulnerability within the four study areas, was compared using a GLM with a quasi-poisson error distribution as described above (total catch/vulnerable species biomass ∼ area, family = “quasi-poisson”). Error distributions were visually inspected to ensure test assumptions. Finally, we compared the percentage of high or very high vulnerability species in catches between the four study areas using a non-parametric rank test (Kruskal–Wallis). Equally, we compared the% of commercialization of vulnerable species.
Information on relative fishing intensities and the habitat type was gathered for each case study at the sample scale. The fishing effort was estimated from AIS records available through the EU website5. The AIS is provided at a fine grid scale of 1 km2 cells. Trawls are usually towed for at least about 5 km, therefore, the 1 km grid cells were aggregated within larger at 23 km2 grid cells providing a width and length of (4.1 and 5.5 km integrating fishing values over a larger area of influence). The habitat type and biozone was assigned to each sample through its locations based on EUNIS habitat maps (public data6) using QGIS and based on EUNIS classification.
The effects of external factors (average sample depth; habitat type and biozone, according to EUNIS classification; fishing effort; sampling season) on the variability in biomass distribution amongst vulnerability index groups was tested with a multivariate extension of a GLM, using the function manyglm in the package mvabund v.3.13.1 in R v.1.8-23. A manyglm with negative binomial distribution was applied, with fishing effort, depth, habitat type, season and biozone as the explanatory variables. Biomass data was approximated to count data, assuming it indirectly represents density of organisms, to adjust the data to negative-binomial regression (Warton, 2005). The multivariate test statistic was based on the likelihood ratio, considering the correlation between response variables. An adjusted p-value was calculated for each index group with a step-down Monte Carlo resampling algorithm with 500 resamples (Wang et al., 2012).
Results
The trawl catch biomass was dominated by organisms with moderate or high vulnerability to fishing practices in all case studies (Figure 2). If the four ranges of the index were based on the maximum score possible (i.e., 3), the result was that none of the species collected categorized in the highly vulnerable group. Alternatively, we tested an index with natural bins, based on the maximum score recorded in the samples. This approach re-distributed the biomass in the very high vulnerability group, but moderate and high vulnerability species were still dominant (Figure 2). Therefore, we adopted the more objective first approach for subsequent analyses. The vulnerability index reflects the traits exhibited by the most common species in the trawl assemblages: 50% of the catch biomass was represented by two moderately vulnerable species in Algarve, by three moderately-highly vulnerable species in Sicily, and by six moderately-highly vulnerable species in Catalan Sea and Ligurian-North Tyrrhenian. These patterns are sustained by a different set of dominant species in each case study that mostly exhibited moderate catchability, low resistance and high or very high resilience (Table 3). The historical records reported by Damalas et al. (2015) and Maynou et al. (2011) included several “very high” vulnerable species, as well as species holding low resistance, low resilience or high catchability (Table 4 and, Supplementary Figure S1), evidencing a loss of representation of the more vulnerable traits with trawling.
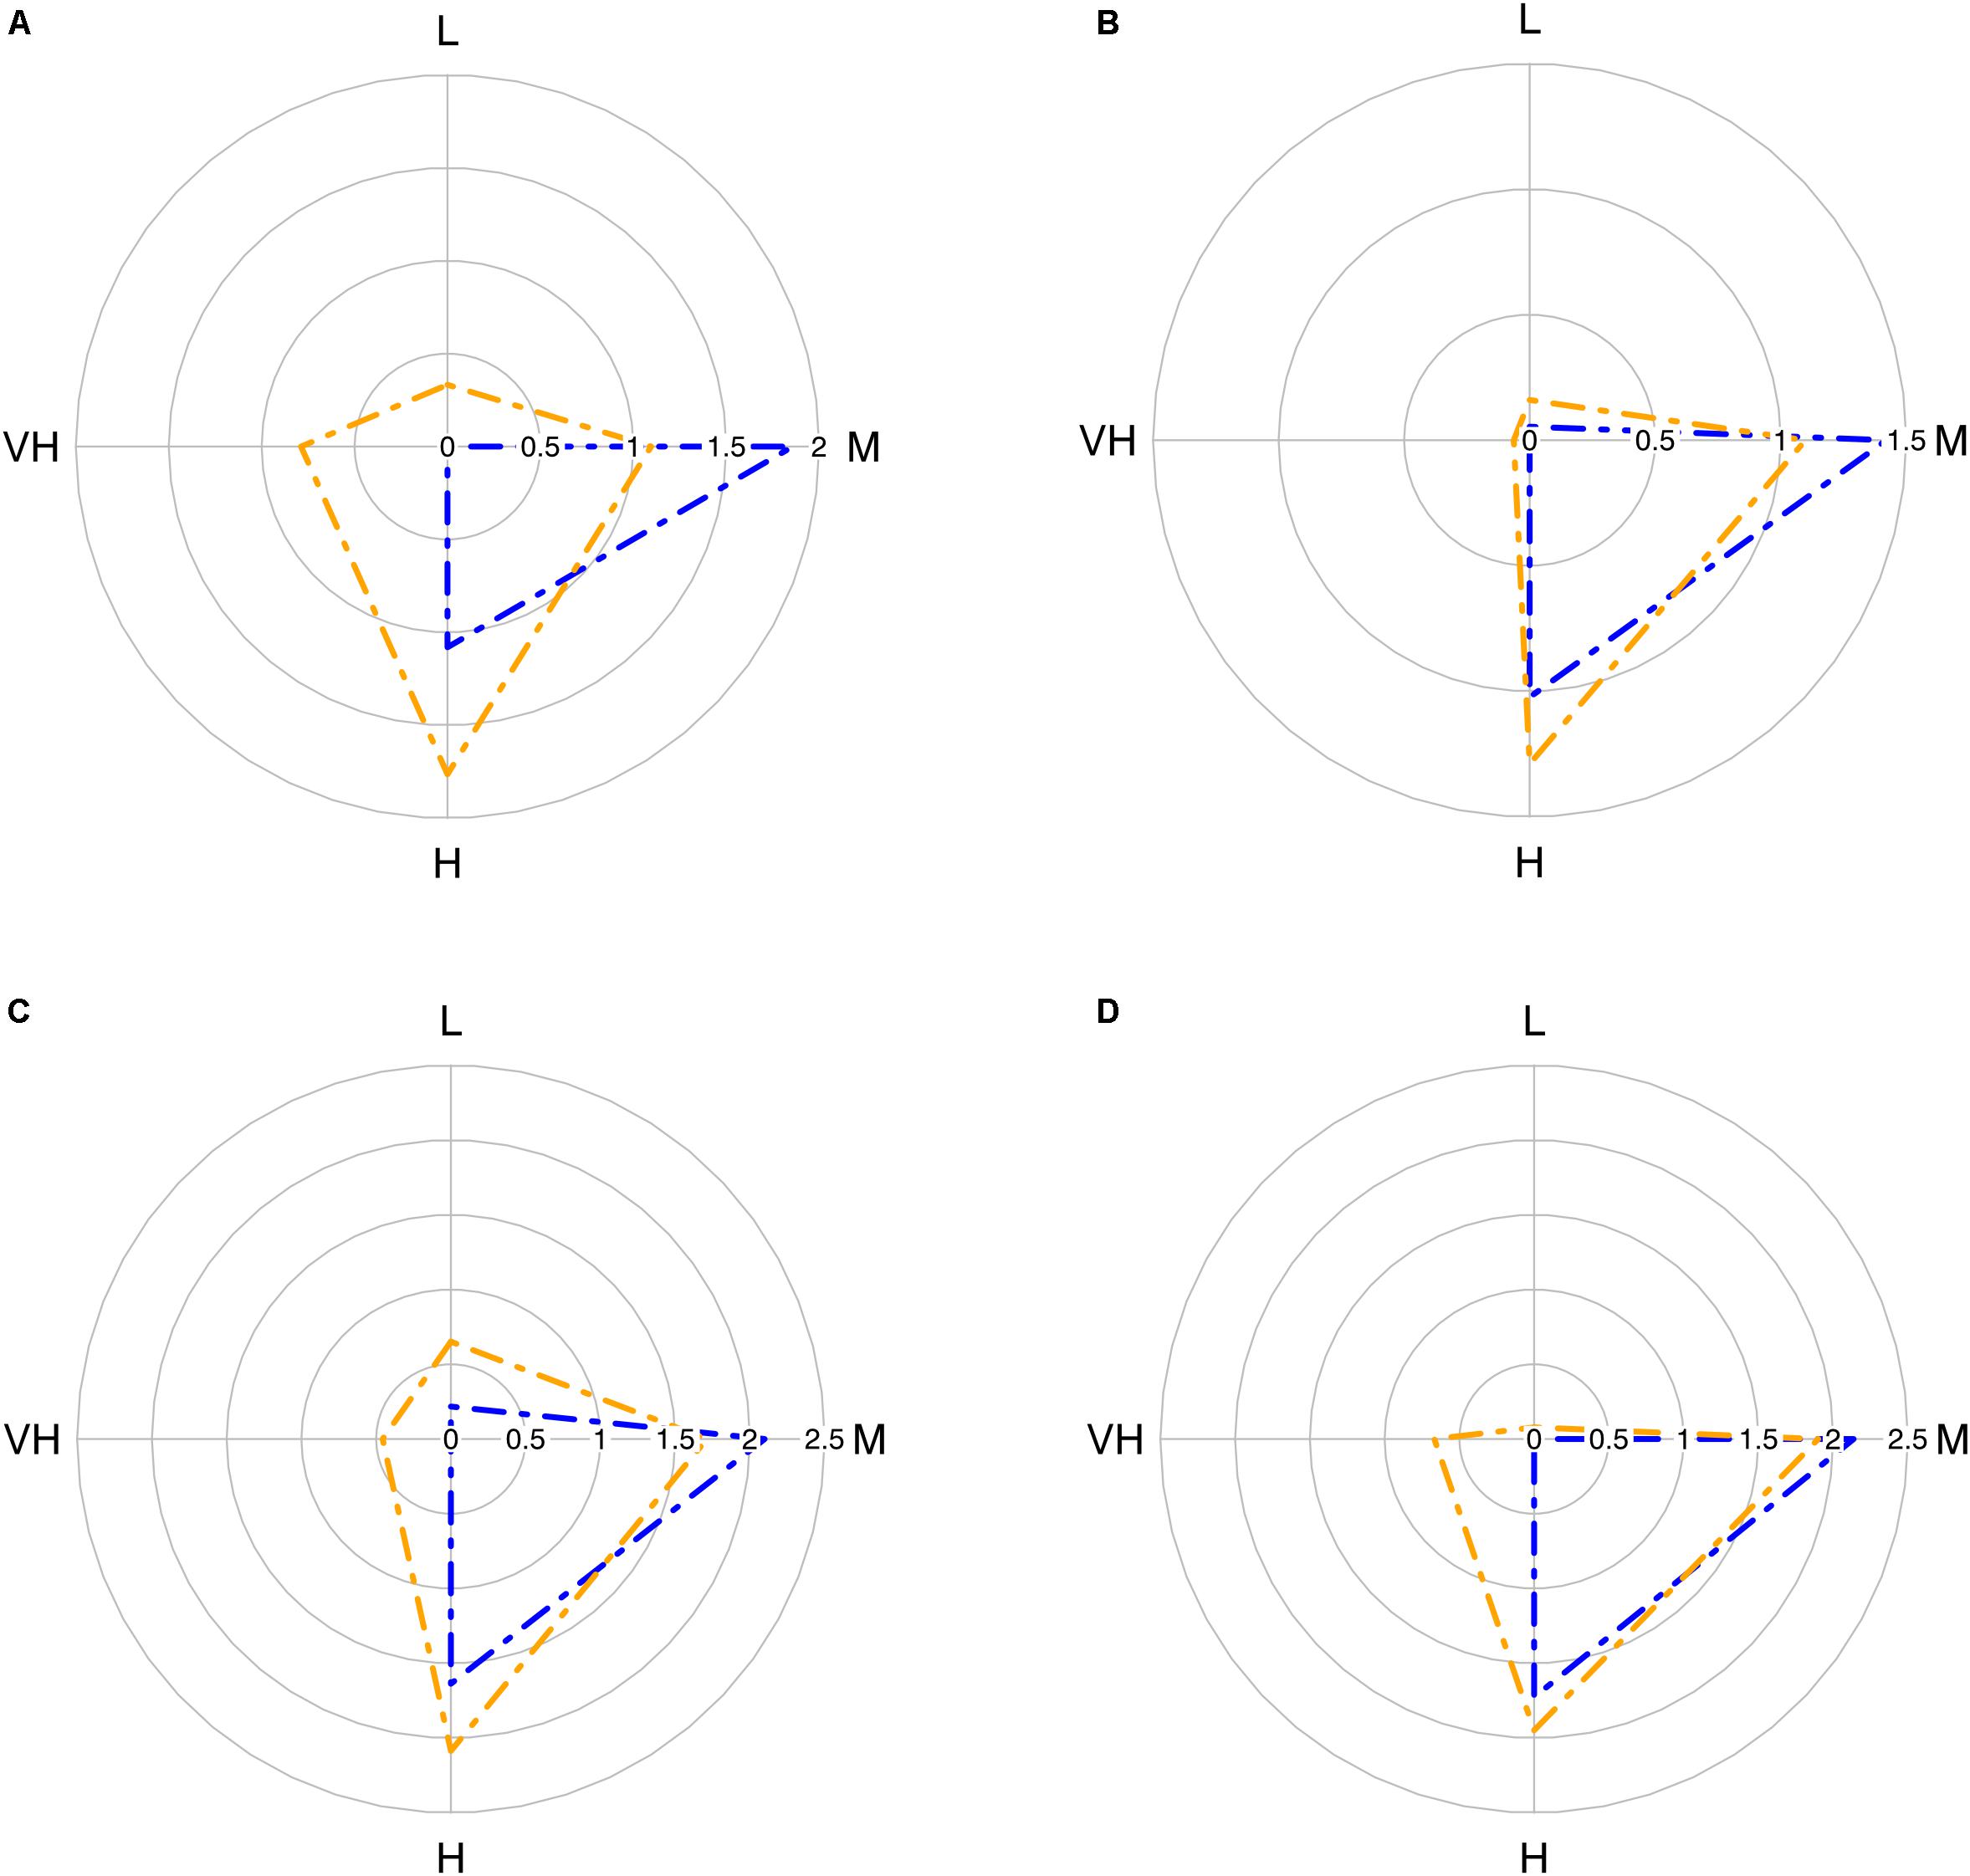
Figure 2. Radar plot with average biomass of the four vulnerability groups in the trawl assemblage in each case study: (A) Algarve; (B) Catalan Sea; (C) Ligurian-North Tyrrhenian Sea; (D) Sicily Strait. Blue polygons correspond to index based in k-means (based on the maximum possible score, 3); orange polygons correspond to index based on natural bins (based on the maximum score recorded in the samples). Vulnerability groups: L, low; M, moderate; H, high; VH, very high. Data: log10 (biomass + 1).
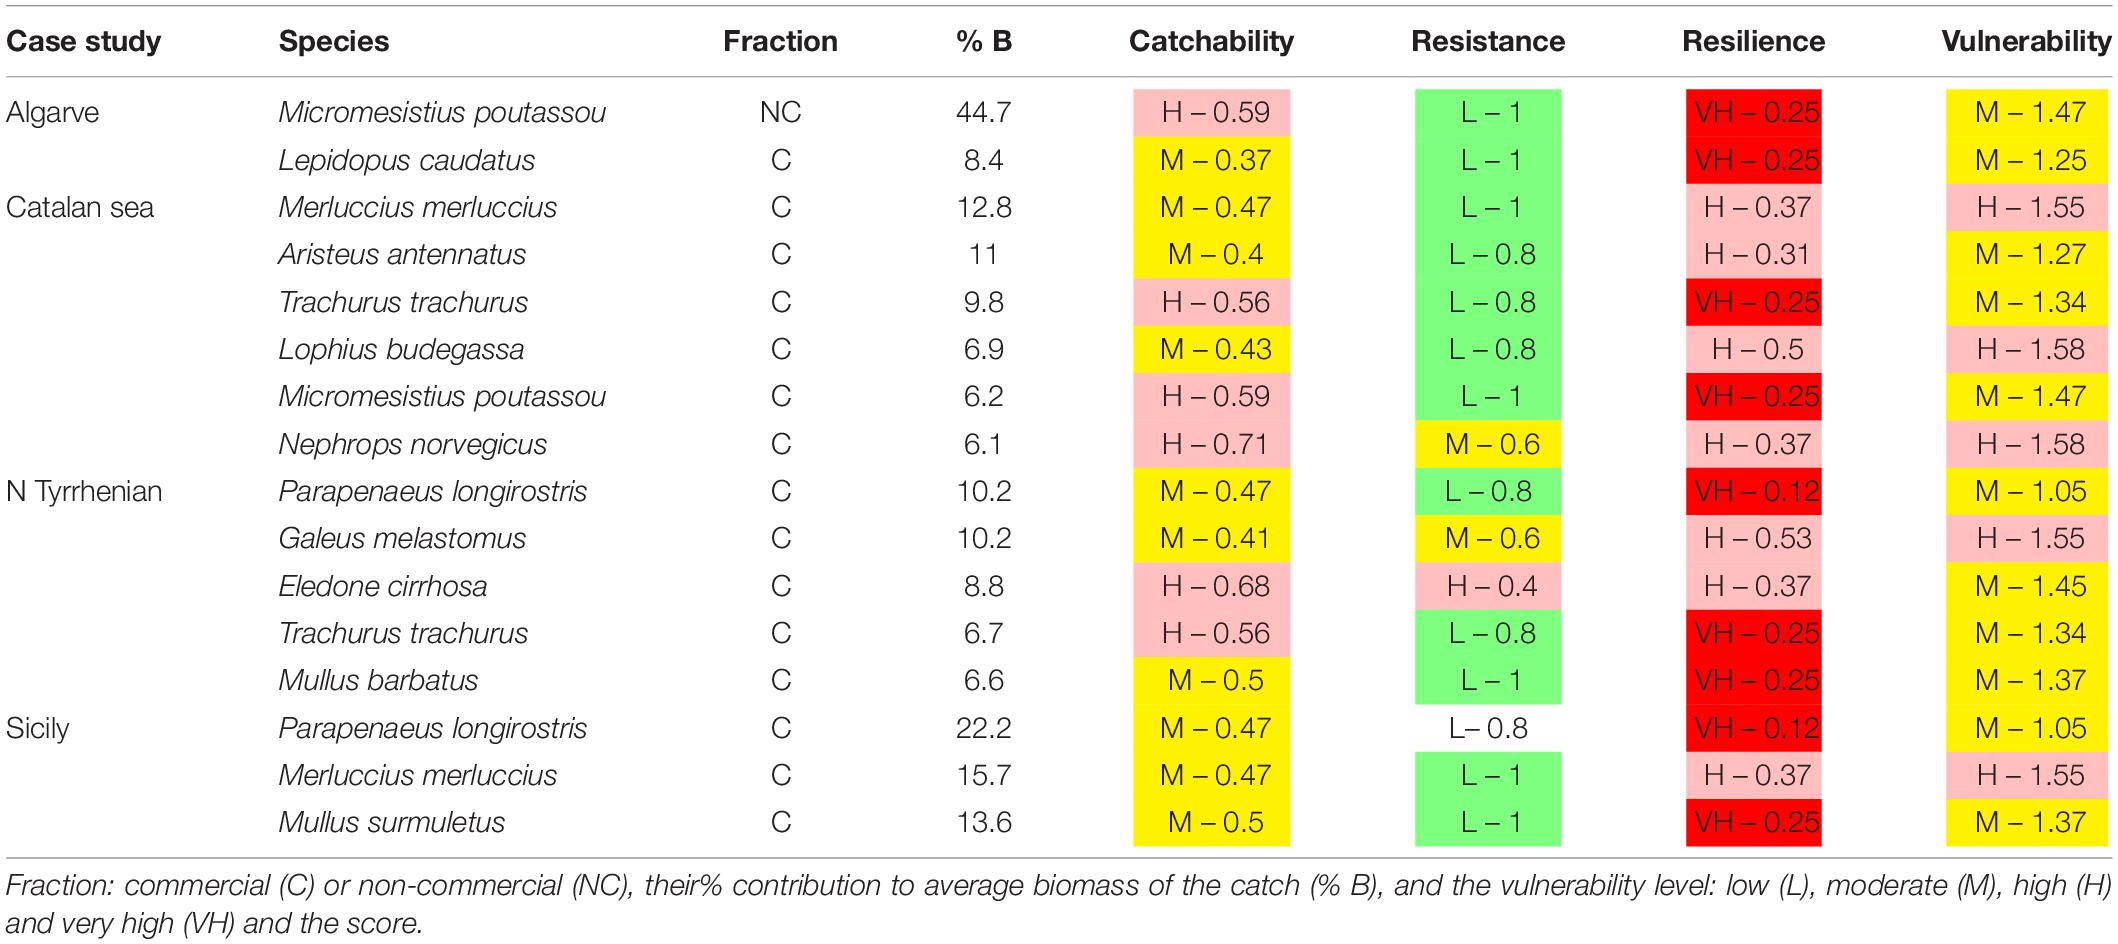
Table 3. Species accounting to 50% of biomass across sampling times in the case studies.
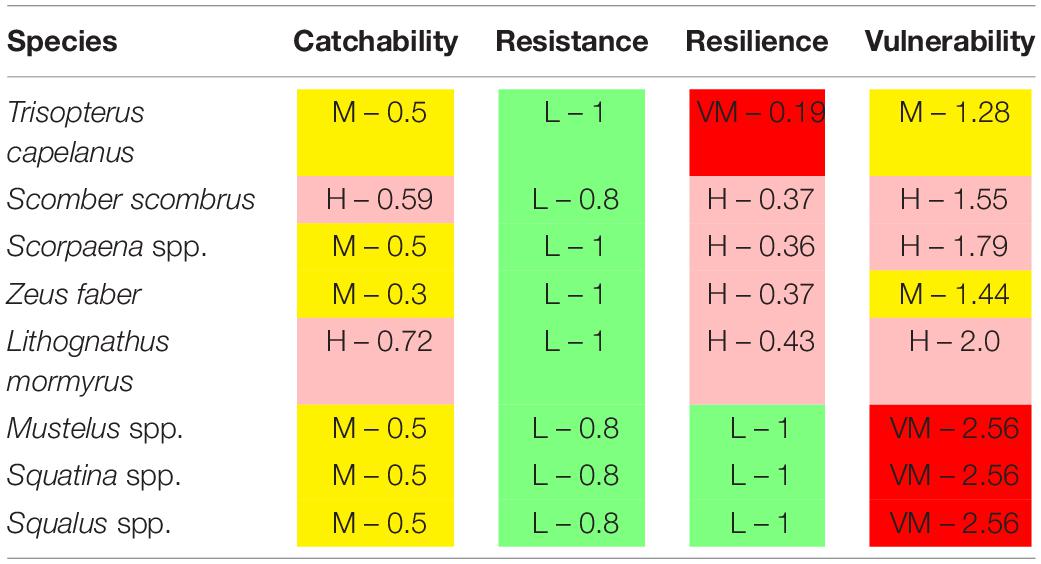
Table 4. Species that characterized historical declines in Mediterranean trawl catches, based on Traditional Ecological Knowledge (Maynou et al., 2011; Damalas et al., 2015), with their vulnerability level and score.
The vulnerability groups’ average biomass was similar for the commercial and non-commercial fractions of the catch in all case studies (Figure 3). These two fractions were characterized by (1) moderate to high catchability, but the non-commercial fraction had also “very high catchability species”, particularly in the Catalan Sea; by (2) low to high resistance species, prevailing the low resistance species; and by (3) organisms with high to very high resilience to fishing practices. Differences between vulnerability groups’ biomass were mostly significant (Supplementary Table S3). However, a large standard deviation associated to the samples was evidenced. The sample-scale variability in the vulnerability index was explored with multivariate analysis of variance that evidenced that the greatest deviance for vulnerability groups’ biomass was explained by habitat type, followed by depth and then effort (Supplementary Table S4). The relative importance of factors was maintained for the sub-indices, with habitat type and depth explaining most of the deviance, followed by effort and season having marginal effects (Supplementary Table S4). There was an increased presence of low vulnerable species in fine mud, accentuated at depths shallower than 200 m. Also, the biomass of highly vulnerable species was reduced in sandy-mud/muddy-sand substrates between 100 and 400 m (Supplementary Figure S2).
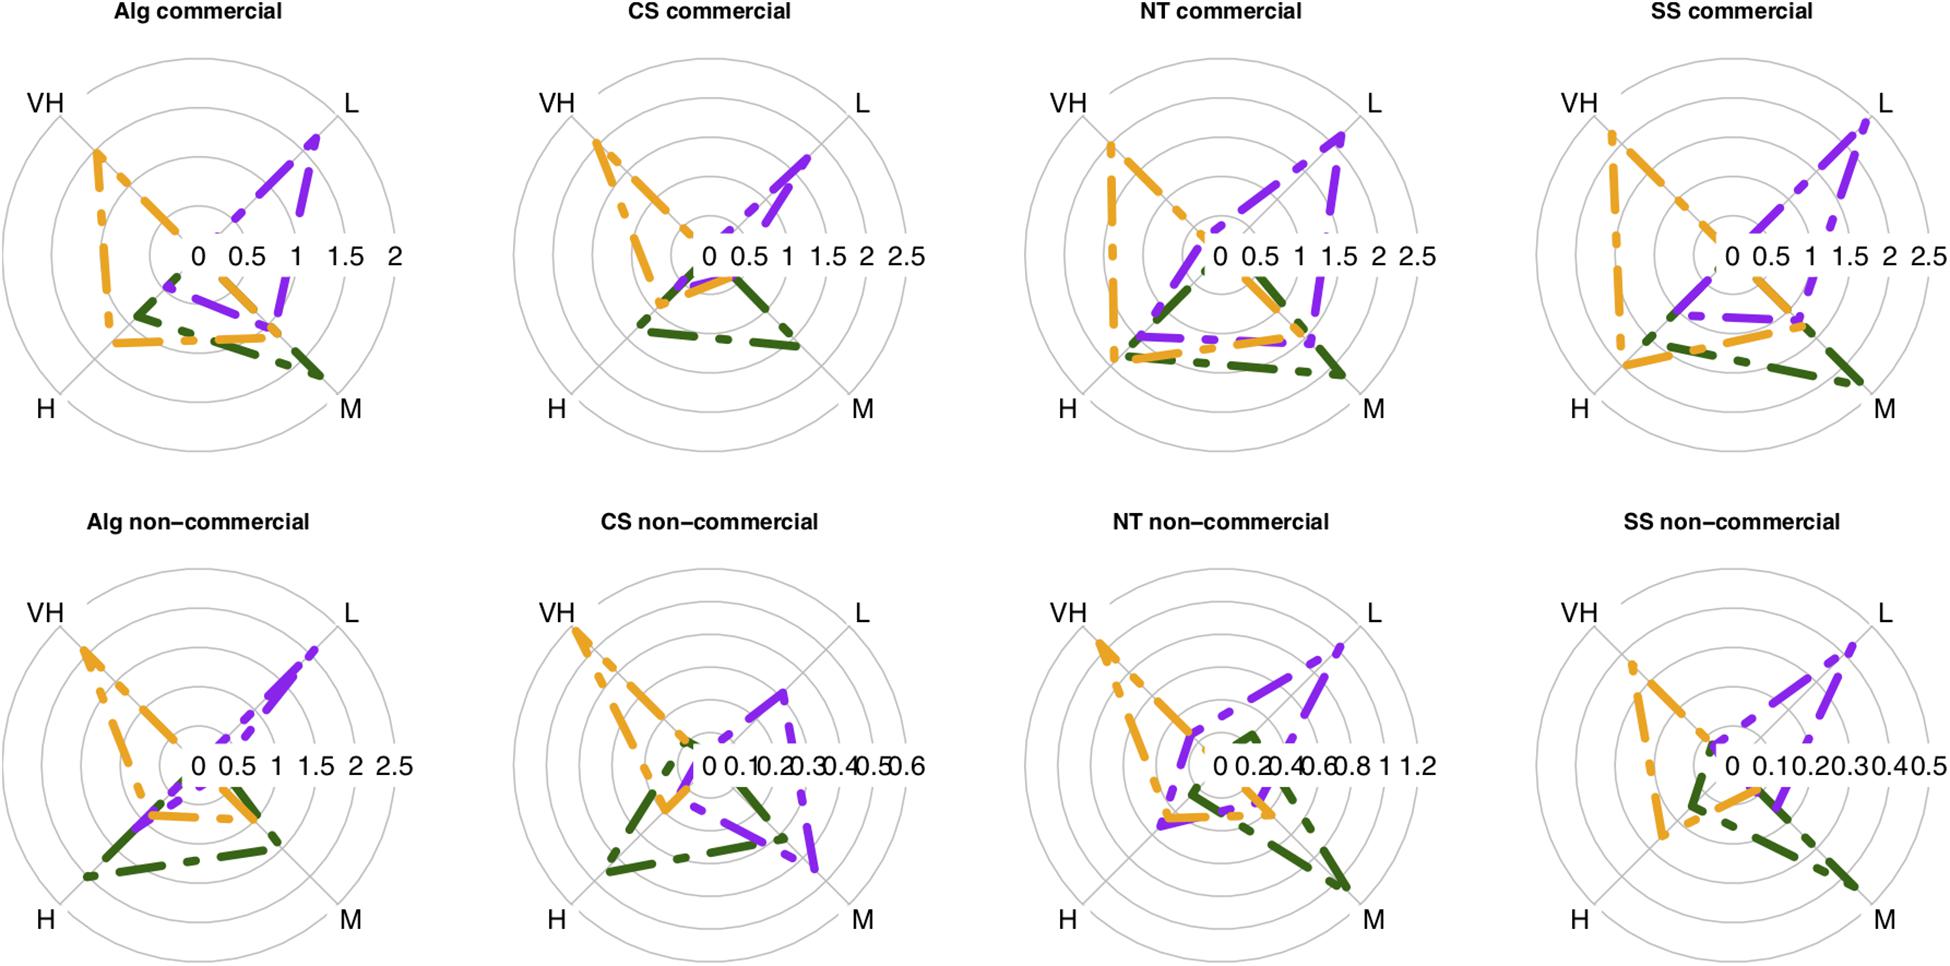
Figure 3. Average biomass of the four vulnerability groups (L, low; M, moderate; H, high; VH, very high) per sub-index: catchability (dark green), resistance (purple), resilience (orange) in each case study: Alg, Algarve; CS, Catalan sea; NT, Ligurian-North Tyrrhenian Sea; SS, Strait of Sicily. The first row illustrates the average vulnerability biomass of the commercial fraction and the second row illustrates the non-commercial fraction. Data as average biomass [log10 (biomass + 1)] dy.
The highest average catches (as kg per km2) were reported in the Sicily Strait (269 kg) and the Ligurian-North Tyrrhenian Sea (221 kg), followed by the Algarve (191 kg) and Catalan Sea (69 kg). Similarly, focusing on high vulnerability species, the highest average biomass was recorded in the Sicily Strait (91 kg) followed by the Tyrrhenian Sea (68 kg), and Algarve (31 kg) and the Catalan Sea (23 kg) with lowest values (Figure 4). As concerns the average percentage of high vulnerability species in catches, the highest proportion was also found in the Sicily Strait (41%), followed by Ligurian-North Tyrrhenian Sea (30%) and the Catalan Sea (27%), while in Algarve it was lower (22%). Differences between areas were significant for all the estimations (Supplementary Table S5). Of the high vulnerability species captured, many were commercialized, with significant differences detected between the four areas (Figure 4 and Supplementary Table S5). In the Sicily Strait an average of 99% of the biomass of high vulnerability species were commercialized, followed by the Catalan Sea with 98% and Ligurian – North Tyrrhenian Sea with 96%. In Algarve, overall less of the high vulnerability species biomass was commercialized (55%). The most important high vulnerability species in terms of biomass for each area and if they were commercialized or discarded are listed in Supplementary Table S6.
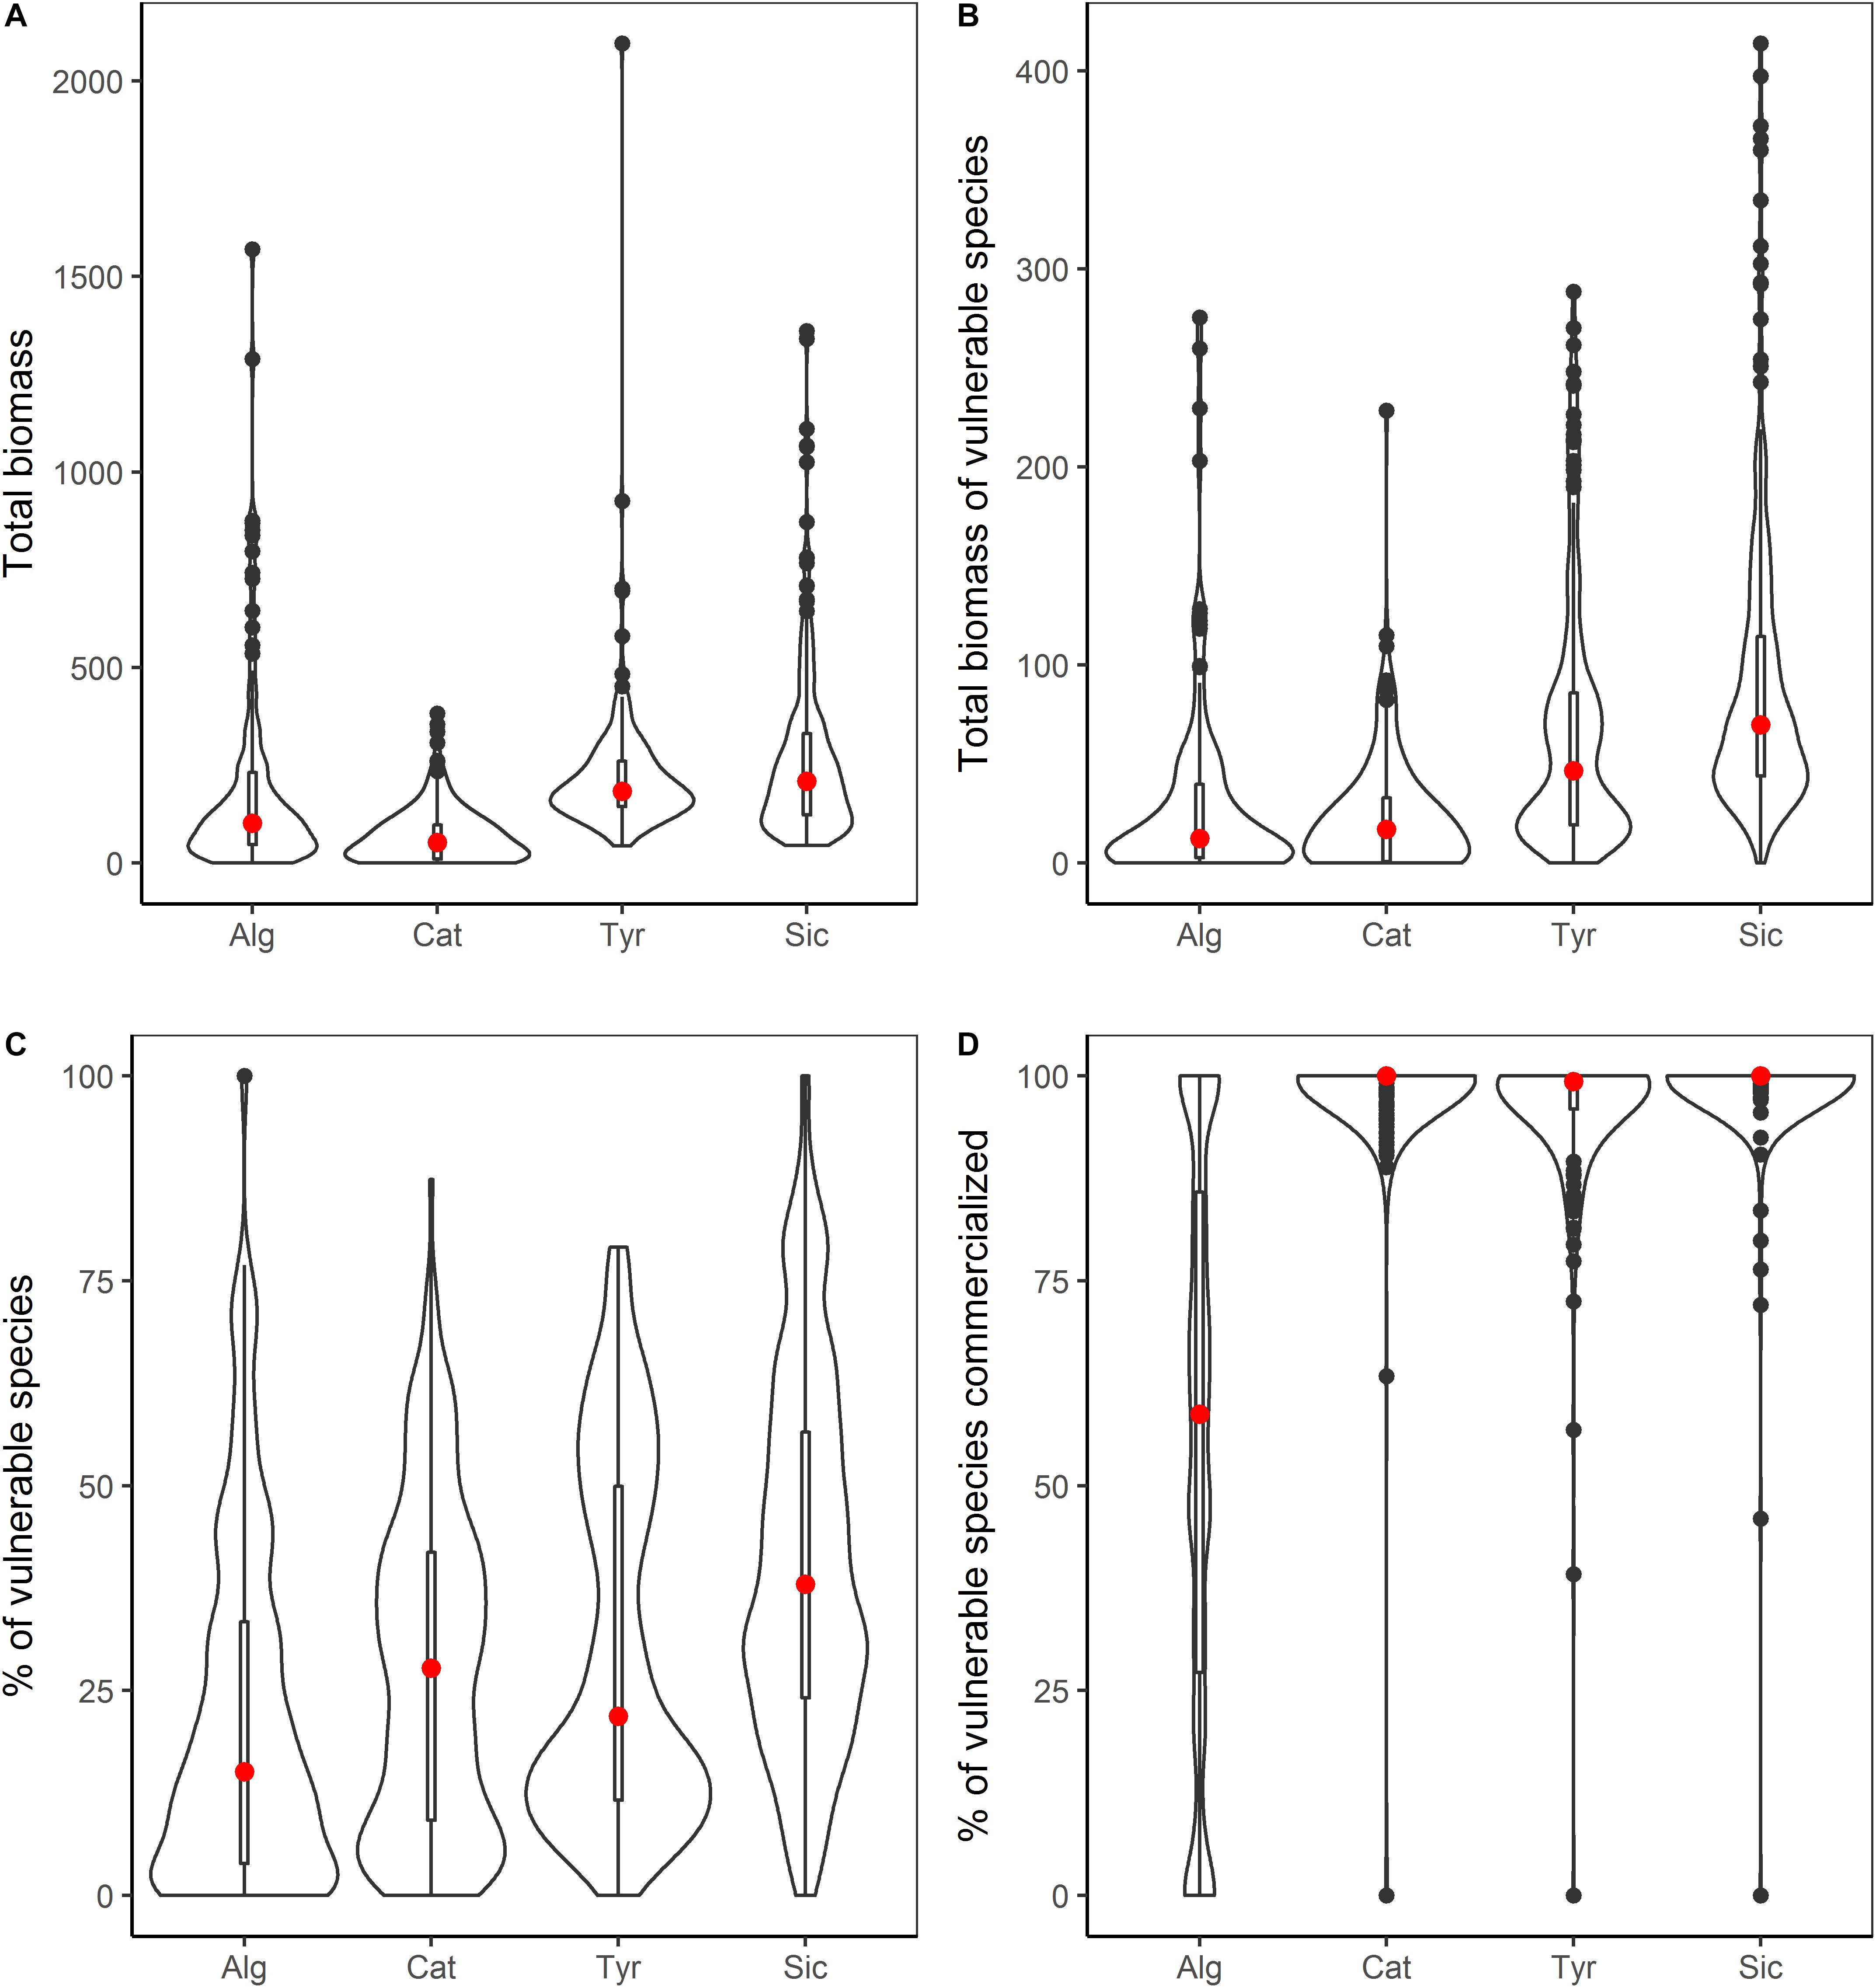
Figure 4. Combined violin/boxplots summarizing data of catches made over the four study areas: Alg, Algarve (n = 129); Cat, Catalan Sea (n = 221); Tyr, Ligurian-North Tyrrhenian Sea (n = 207); and Sic, Sicily Strait (n = 275). The red dot signifies the mean and the bar indicated the interquartile range; the external line indicates data density. (A) The total biomass of catches kg per km2. (B) The total biomass of vulnerable species in catches kg per km2. (C) The Percentage of Vulnerable species in catches. (D) The percentage of vulnerable species commercialized.
Discussion
The present work introduces a BTA approach particularly targeted to assess how vulnerable are demersal assemblages to trawling, where assemblages are highly diverse across spatial scales and are composed by species with a wide range of life strategies (e.g., from sedentary invertebrates to migratory demersal fish). The flexibility in the BTA approach is particularly critical to assess the taxonomically diverse demersal assemblages in the southern European Seas, with a large proportion of invertebrates present in the catches. The case studies examined were similarly characterized by demersal assemblages dominated by moderately to highly vulnerable species, with moderate to high catchability, low resistance and high to very high resilience to fishing practices. However, a different set of dominant species illustrated this pattern in each case study with a different set of susceptibility to one or two fishing phases reflected by differences in our sub-index scores, e.g., the fish horse mackerel (Trachurus trachurus) was characterized by high catchability and low resistance, but very high resilience, and it is thus classified as moderately vulnerable. On the other hand, the mantis shrimp (Squilla mantis) was also characterized as moderately vulnerable, but it was classified as having moderate catchability, high resistance and very high resilience. An index that illustrates the vulnerability level of demersal assemblages, that is not based on the taxonomic nomenclature (such as traditional diversity indices), has many benefits as it can be adapted to different case studies allowing for comparisons of distinct communities across regional scales. Also, the possibility of index breakdown in components that reflect the susceptibility to different phases of fishing practices is an advantage as it preserves information that can guide management efforts toward the identification of the most vulnerable aspects of a local fished assemblage.
The distribution of species’ biomass amongst vulnerability groups was highly homogenous across the four case studies, despite local differences in fishing fleet structure, target species and fishing depths. Within all areas the species with moderate to high vulnerability dominated trawl catches and, in most instances, no “very high” vulnerable species were recorded. This is probably a consequence of historically over-exploited fishing grounds across the study region, with absence of less impacted areas within the habitats (i.e., soft-bottoms) and depths (i.e., 50–800 m) operated by commercial trawling (de Juan et al., 2009). It is likely that the demersal assemblages in the depths and habitats regularly visited by commercial trawlers are currently held in a modified state through their activities that do not allow for sensitive species’ refuges (Thrush and Dayton, 2002). According to historical records collected by Damalas et al. (2015) and Maynou et al. (2005) this scenario probably dates back to the development of industrial fishing in the Mediterranean (Coll et al., 2012). Consequently, trawled assemblages in the case studies are dominated by resilient species like the deep water rose shrimp Parapenaeus longirostris or the horse mackerel T. trachurus. Dominance of high resilient species is a consequence of adaptation to continuous environmental stress and often implies loss of ecosystem functions in the long term (Jennings et al., 1999; Duarte et al., 2008). The assessment of the current scenario compared with species recorded as historical declines, evidenced the past occurrence of highly vulnerable species in the area, like some elasmobranchs, including the angel shark Squatina spp. and the smoot hound Mustelus spp. Some of these historical declines belong to the class of cartilaginous fishes Chondrichthyes (Damalas et al., 2015), widely recognized to be negatively affected by fishing due to life-history strategies characterized by slow growth, late maturity, long life spans and low fecundity (e.g., Foster et al., 2014; Henriques et al., 2014). Sessile invertebrates that are highly susceptible to trawling and are known to be declining in fishing grounds, like sponges or cnidarians (Lundquist et al., 2018) were not recorded within our study areas. Would these have been recorded, they would have been classified as highly vulnerable according to our index scores, as these taxonomic groups are generally characterized by very high catchability, high resistance, and low resilience. The index composition also evidenced a poor representation of the species with low catchability and very high resistance in all four areas, even when analyzing small-scale distribution of samples. This fraction was represented by small invertebrates, like swimming crabs or gastropods, that are abundant components of muddy bottom communities in fishing grounds (de Juan et al., 2007). This is a consequence of a methodological approach that targets demersal assemblages surveyed with commercial trawling vessels that use a 40–50 mm mesh size, instead of the traditionally targeted benthic assemblages sampled with smaller mesh sizes. However, this approach was preferred as the monitoring of catches of commercial vessels contributes to a cost-effective monitoring approach feasible of implementation at regional scales.
Despite similarity in index composition among the four case studies, differences emerged when comparing the proportions of highly vulnerable species that varied from 41% in the Sicily strait to 22% in the Algarve. These results need to be placed in the context of considerable differences in the total mean biomass of catches, which also varied considerably between areas and ranged from 269 kg in Sicily Strait compared to 69 kg in the Catalan Sea. These differences most likely illustrate the variability in the fishery characteristics in each area, as the Sicily Strait is a deep-sea fishery that catch vulnerable species like Thornback ray, European conger or Deep-water rose shrimp. The vulnerable faction of the catch was almost entirely commercialized in the three Mediterranean case studies, close to 100%, while in the Algarve only 55% were commercialized. The black mouth catshark Galeus melastomus is a vulnerable species that is important in terms of its biomass contribution to the catches. While it is commercialized in the Ligurian-North Tyrrhenian area it is not in the Sicily strait. This behavior is probably driven by the need of fishermen to maximize yield by commercializing as much as possible of their daily catch in particular in areas where overall catches tend to be lower (Lobo et al., 2010). This variability highlights the need to implement a spatial planning to these fisheries at regional scales (Bellido et al., 2019). Variability in vulnerability level of the catch was also observed at small spatial scales, where the greatest deviance for vulnerability groups’ biomass was explained by habitat type, followed by depth and then effort, as for example, in fine mud in the shallower areas there was higher presence of low vulnerable fauna compared to the sandier habitats or deeper grounds. These spatial patterns provide important information to guide management efforts with the aim to reduce fishing pressure on the most vulnerable components of demersal assemblages. The data sets analyzed involve a degree of bias as data was collected by on-board observers during regular commercial trawling practices; therefore, sampling was conducted over regularly trawled areas (i.e., certain habitats and depths). For a solid assessment of the influence of habitat and depth on assemblage composition, a structured data collection scheme should be followed. Nevertheless, we acknowledge the value of large biological data sets collected with a cost-effective method; the small-scale variability observed in vulnerability index components could be the baseline for a systematic exploration of spatial variability in demersal assemblage composition to identify areas that are consistently more prone to harbor vulnerable assemblages.
The proposed methodology follows a top-down expert-based approach that groups species according to their expected response to fishing practices, assigned based on their combination of biological traits, and where the relative biomass of groups compose the vulnerability index. An expert-based approach allows to incorporate knowledge generated over decades of scientific research on the biology of demersal communities, to define the species’ expected response to fishing practices that is determined by its morphological, behavioral and life-history characteristics, including field-experiments for on-board survival (Demestre et al., 2018). A bottom-up approach (e.g., Foster et al., 2014) could be alternatively followed, by grouping the species according to their response curve to fishing intensity. However, this approach overlaps with the natural distribution of the species, crucial in large scale assessment (Jones, 2011), and we considered it inadequate for chronically altered fishing grounds where most species are inherently resilient to fishing (de Juan et al., 2009). The definition of groups implies the subjectivity of cut-off points and the homogenization of variability. However, the representation of a multi-dimensional assemblage in a single and continuous metric also implies oversimplification of community composition and, in our case studies, losing track of the drivers of community vulnerability. Whether to take account of the biomass by clustering organisms under biological groups (e.g., Thrush et al., 2008) or in a continuous metric by weighting the index by species biomass (e.g., de Juan and Demestre, 2012) is a discussion that goes beyond the objective of the present work. The proposed framework presented here benefits from providing an overall picture of a biological assemblage by considering the biomass of the species distributed amongst vulnerability groups. An illustrative representation of the fished assemblage composition is useful when translating scientific knowledge to decision makers, for which the use of a “traffic light” system that ranges from “good to bad” status, or in our case “low to very high,” has become popular. Nevertheless, caution is recommended and the exploration of the species behind the indices should always be undertaken.
Conclusion
The knowledge accumulated over decades of research allowed to track small-scale variability in the vulnerability of demersal assemblages. This information could recommend a spatial management of fishing practices and the incorporation of more selective techniques in areas with organisms particularly susceptible to being catch; the improvement of handling techniques with assemblages less prone to survive on board and after discarded; or the restriction of fishing in areas with concentrations of individuals less resilient to fishing. Additionally, the index has potential in the analysis of time series to identify temporal trends of the vulnerability components and, accordingly, modify fishing practices. The ultimate goal of the index is to inform on the potential of an area to harbor vulnerable assemblages and assist efforts to recover biological communities from a current overexploited baseline. Therefore, any action adopted should be followed by the monitoring of the assemblage status, where management targets could focus on trends in the index components, so the vulnerability index components are assessed over time and changes in relative biomass from low to high vulnerability groups is expected with modified fishing practices and decreasing fishing intensity. However, fishery systems are a complex interacting matrix of many actors and drivers, and variability in catch composition does not always mirror natural assemblages, as it is highly influenced by fishermen behavior. As such, the reconstruction of trends also illustrates fishery dynamics, with changes in the species targeted by the fleet often conditioned by market demands, that often drive fishermen to increase fishing effort in order to maintain catches of highly valued species. The role of fishermen behavior and market demands needs to be taken into account for the interpretation of assemblage composition, but, importantly, these variables should be consulted and incorporated in the interpretation and decision-making process to avoid fishing over areas that harbor high densities of vulnerable fauna.
Data Availability Statement
The datasets generated for this study are available on request to the corresponding author.
Author Contributions
SJ, MD, HH, PS, SV, and LB conceived the ideas and designed methodology. JB, LB, PS, CM, SV, VG, and DM collected the data. SJ and HH performed formal analysis. SJ led the writing of the manuscript. All authors contributed critically to the drafts and gave final approval for publication.
Funding
This study was developed in the framework of MINOUW Horizon 2020 (Project ID: 634495). SJ was funded by H2020-Marie Skłodowska-Curie Action MSCA-IF-2016 (Project ID: 743545). HH was supported by the Ramón y Cajal Fellowship (grant by the Ministerio de Economía y Competitividad de España and the Conselleria d’Educacio, Cultura i Universitats Comunidad Autoñoma de las Islas Baleares). Fishery data used in this paper has been co-funded by the EU through the European Maritime and Fisheries Fund (EMFF) within the National Program of collection, management and use of data in the fisheries sector and support for scientific advice regarding the Common Fisheries Policy.
Conflict of Interest
The authors declare that the research was conducted in the absence of any commercial or financial relationships that could be construed as a potential conflict of interest.
Supplementary Material
The Supplementary Material for this article can be found online at: https://www.frontiersin.org/articles/10.3389/fmars.2020.00044/full#supplementary-material
FIGURE S1 | Scatter plot of species that (A) account to 50% of catch biomass in any of the case studies, and (B) have historically declined according to Damalas et al. (2015) and Maynou et al. (2011). Data and species are detailed in Supplementary Tables S5, S6. The 3 axes of the plot correspond to x = Catchability, y = Resistance, z = Resilience. Color bar includes the Vulnerability score for each species. Red dot in “Declines” plot overlap 3 very high vulnerability species (see Supplementary Table S6).
FIGURE S2 | Examples of interaction between environmental factors and biomass distribution amongst index groups. Data is the average of Log (Biomass + 1); data is represented in bars, excluding the standard error in order to illustrate index patterns. Substrate: fine mud (FM), muddy sand (MS), sandy mud-muddy sand (SMMS), sandy mud (SM), sand (S).
TABLE S1 | Template to reproduce the vulnerability index including the short species list from the four case studies.
TABLE S2 | Full species list recorded in the four case studies.
TABLE S3 | Summary of GLM to test the variability in vulnerability level (low, moderate, high, very high) of catch biomass (vulnerability index ∼ Level, family = “quasipoisson”). Test performed for all the species, for the commercial fraction and for the non-commercial fraction. The “%” corresponds to the percentage of explained variance by the model.
TABLE S4 | Deviance table from the mvabund test. Variables: biomass of the index’s groups (low, moderate, high and very high).
TABLE S5 | Summary of GLM to test the variability in total biomass and total biomass of vulnerable species, % ofvulnerable species in the catch and % of vulnerable species in the catch that are commercialized.
TABLE S6 | The most important high vulnerability species (the two species with the highest average biomass in catches within each study area) that were either commercialized or discarded.
Footnotes
- ^ http://minouw-project.eu
- ^ www.fishbase.org
- ^ www.marlin.ac.uk/biotic
- ^ www.R-project.org
- ^ https://bluehub.jrc.ec.europa.eu/webgis_fish/
- ^ http://www.emodnet-seabedhabitats.eu
References
Agnetta, D., Badalamenti, F., D’Anna, G., Sinopoli, M., Andaloro, F., Vizzini, S., et al. (2019). Sizing up the role of predators on Mullus barbatus populations in Mediterranean trawl and no-trawl areas. Fish. Res. 213, 196–203. doi: 10.1016/j.fishres.2019.01.023
Bellido, J. M., Paradinas, I., Vilela, R., Bas, G., and Pennino, M. G. (2019). “A marine spatial planning approach to minimize discards: challenges and opportunities of the landing obligation in European waters,” in The European Landing Obligation. Reducing Discards in Complex, Multi-Species and Multi-Jurisdictional Fisheries, eds S. S. Uhlman, C. Ulrich, and S. J. Kennelly, (Cham: Springer).
Bremner, J. (2008). Species’ traits and ecological functioning in marine conservation and management. J. Exp. Mar. Biol. Ecol. 366, 37–47. doi: 10.1016/j.jembe.2008.07.007
Bremner, J., Rogers, S. I., and Frid, C. L. (2003). Assessing functional diversity in marine benthic ecosystems: a comparison of approaches. Mar. Ecol. Prog. Ser. 254, 11–25. doi: 10.3354/meps254011
Coleman, F. C., and Williams, S. L. (2002). Overexploiting marine ecosystem engineers: potential consequences for biodiversity. Trends Ecol. Evol. 17, 40–44. doi: 10.1016/S0169-5347(01)02330-8
Coll, M., Piroddi, C., Albouy, C., Ben Rais Lasram, F., Cheung, W. W. L., Christensen, V., et al. (2012). The Mediterranean Sea under siege: spatial overlap between marine biodiversity, cumulative threats and marine reserves. Glob. Ecol. Biogeogr. 21, 465–480. doi: 10.1111/j.1466-8238.2011.00697.x
Collie, J., Rochet, M.-J., and Bell, R. (2013). Rebuilding fish communities: the ghost of fisheries past and the virtue of patience. Ecol. Appl. 23, 374–391. doi: 10.1890/12-0877.1
Daan, N., Gislason, H., Pope, J. G., and Rice, J. C. (2005). Changes in the North Sea fish community:evidence of indirect effects of fishing? ICES J. Mar. Sci. 62, 177–188. doi: 10.1016/j.icesjms.2004.08.020
Damalas, D., Maravelias, C. D., Osio, G. C., Maynou, F. X., Sbrana, M., Sartor, P., et al. (2015). Historical discarding in Mediterranean fisheries: a fishers’ perception. ICES J. Mar. Sci. 72, 2600–2608. doi: 10.1093/icesjms/fsv141
de Juan, S., and Demestre, M. (2012). A trawl disturbance Indicator to quantify large scale fishing impact on benthic ecosystems. Ecol. Ind. 18, 183–190. doi: 10.1016/j.ecolind.2011.11.020
de Juan, S., Demestre, M., and Thrush, S. F. (2009). Defining ecological indicators of trawling disturbance when everywhere that can be fished is fished: a Mediterranean case study. Mar. Policy 33, 472–478. doi: 10.1016/j.marpol.2008.11.005
de Juan, S., Thrush, S. F., and Demestre, M. (2007). Functional changes as indicators of trawling disturbance on a benthic community located in a fishing ground (NW Mediterranean Sea). Mar. Ecol. Prog. Ser. 334, 117–129. doi: 10.3354/meps334117
Demestre, M., Sartor, P., Garcia-de-Vinuesa, A., Sbrana, M., Maynou, F. X., and Massaro, A. (2018). Ecological importance of survival of unwanted invertebrates discarded in different NW Mediterranean trawl fisheries. Sci. Mar. 82, 189–198. doi: 10.3989/scimar.04784.28A
Doledec, S., Statzner, B., and Bournard, M. (1999). Species traits for future biomonitoring across ecoregions: patterns along a human-impacted river. Freshw. Biol. 42, 737–758. doi: 10.1046/j.1365-2427.1999.00509.x
Duarte, C. M., Conley, D. J., Carstensen, J., and Sánchez-Camacho, M. (2008). Return to Neverland: shifting baselines affect eutrophication restoration targets. Estuaries Coasts 32, 29–36. doi: 10.1007/s12237-008-9111-2
Foster, S. D., Dunstan, P. K., Althaus, F., and Williams, A. (2014). The cumulative effect of trawl fishing on a multispecies fish assemblage in south-eastern Australia. J. Appl. Ecol. 52, 129–139. doi: 10.1111/1365-2664.12353
Greenstreet, S. P. R., and Rogers, I. (2006). Indicators of the health of the North Sea fish community : identifying reference levels for an ecosystem approach to management. ICES J. Mar. Sci. 63, 573–593. doi: 10.1016/j.icesjms.2005.12.009
Hall, M. A., Alverson, D. L., and Metuzals, K. I. (2000). By-catch: problems and solutions. Mar. Pollut. Bull. 41, 204–219. doi: 10.1016/S0025-326X(00)00111-9
Halpern, B. S., Selkoe, K. A., Micheli, F., and Kappel, C. V. (2007). Evaluating and ranking the vulnerability of global marine ecosystems to anthropogenic threats. Conserv. Biol. 21, 1301–1315. doi: 10.1111/j.1523-1739.2007.00752.x
Henriques, S., Pais, M. P., Vasconcelos, R. P., Murta, A., Azevedo, M., Costa, M. J., et al. (2014). Structural and functional trends indicate fishing pressure on marine fish assemblages. J. Appl. Ecol. 51, 623–631. doi: 10.1111/1365-2664.12235
Jennings, S., Greenstreet, S. P., and Reynolds, J. D. (1999). Structural change in an exploited fish community: a consequence of differential fishing effects on species with contrasting life histories. J. Anim. Ecol. 68, 617–627. doi: 10.1046/j.1365-2656.1999.00312.x
Jones, J. P. G. (2011). Monitoring species abundance and distribution at the landscape scale. J. Appl. Ecol. 48, 9–13. doi: 10.1111/j.1365-2664.2010.01917.x
Kaiser, M. J., Clarke, K. R., Hinz, H., Austen, M. C., Somerfield, P. J., and Karakassis, I. (2006). Global analysis of response and recovery of benthic biota to fishing. Mar. Ecol. Prog. Ser. 311, 1–14. doi: 10.3354/meps311001
Komoroske, L. M., and Lewison, R. L. (2015). Addressing fisheries bycatch in a changing world. Front. Mar. Sci. 2:83. doi: 10.3389/fmars.2015.00083
Lobo, A. S., Balmford, A., Arthur, R., and Manica, A. (2010). Commercializing bycatch can push a fishery beyond economic extinction. Consrv. Lett. 3, 277–285. doi: 10.1111/j.1755-263X.2010.00117.x
Lundquist, C. J., Bowden, D., Cartner, K., Stephenson, F., Tuck, I., and Hewitt, J. E. (2018). Assessing benthic responses to fishing disturbance over broad spatial scales that incorporate high environmental variation. Front. Mar. Sci. 5:405. doi: 10.3389/fmars.2018.00405
Maynou, F. X., Abello, P., and Sartor, P. (2005). A review of the fisheries biology of the mantis shrimp, Squilla mantis (L., 1758) in the Mediterranean. Crustaceana 77, 1081–1099. doi: 10.1163/1568540042900295
Maynou, F. X., Sbrana, M., Sartor, P., Maravelias, C., Kavadas, S., Damalas, D., et al. (2011). Estimating trends of population decline in long-lived marine species in the Mediterranean Sea based on fishers’ perceptions. PLoS One 6:e21818. doi: 10.1371/journal.pone.0021818
Mouillot, D., Graham, N. J., Villéger, S., Mason, N. W. H., and Bellwood, D. R. (2013). A functional approach reveals community responses to disturbances. Trends Ecol. Evol. 28, 167–177. doi: 10.1016/j.tree.2012.10.004
Mouillot, D., Spatharis, S., Reizopoulou, S., Laugier, T., Sabetta, L., Basset, A., et al. (2006). Alternatives to taxonomic-based approaches to assess changes in transitional water communities. Aquat. Conserv. 16, 469–482. doi: 10.1002/aqc.769
Pauly, D., Christensen, V., Dalsgaard, J., Froese, R., and Torres, F. Jr. (1998). Fishing down marine foodwebs. Science 279, 860–863. doi: 10.1126/science.279.5352.860
Pearson, T. H., and Rosenberg, R. (1978). Macrobenthic succession in relation to organic enrichment and pollution on the marine environment. Oceanogr. Mar. Biol. Annu. Rev. 16, 229–311.
Piet, G. J., and Jennings, S. R. (2005). Response of potential fish community indicators to fishing. ICES J. Mar. Sci. 62, 214–225. doi: 10.1016/j.icesjms.2004.09.007
Statzner, B., and Bêche, L. A. (2010). Can biological invertebrate traits resolve effects of multiple stressors on running water ecosystems? Freshw. Biol. 55, 80–119. doi: 10.1111/j.1365-2427.2009.02369.x
Suding, K., Lavorel, S., Chapin, F. S., Cornelissen, J. H. C., Diez, S., and Garnier, E. (2008). Scaling environmental change through the framework for plants. Glob. Change Biol. 14, 1125–1140. doi: 10.1111/j.1365-2486.2008.01557.x
Thrush, S. F., Coco, G., and Hewitt, J. E. (2008). Complex positive connections between functional groups are revealed by neural network analysis of ecological time series. Am. Nat. 171, 669–677. doi: 10.1086/587069
Thrush, S. F., and Dayton, P. K. (2002). Disturbance to marine benthic habitats by trawling and dredging: implications for marine biodiversity. Annu. Rev. Ecol. Evol. Syst. 33, 449–473. doi: 10.1146/annurev.ecolsys.33.010802.150515
Tsagarakis, K., Palialexis, A., and Vassilopoulou, V. (2014). Mediterranean fishery discards: review of the existing knowledge. ICES J. Mar. Sci. 71, 1219–1234. doi: 10.1093/icesjms/fst074
Usseglio-Polatera, P., Bournaud, M., Richoux, P., and Tachet, H. (2000). Biomonitoring through biological traits of benthic macroinvertebrates : how to use species trait databases ? Hydrobiologia 42, 153–162. doi: 10.1007/978-94-011-4164-2_12
Vogel, C., Kopp, D., and Méhault, S. (2017). From discard ban to exemption: how can gear technology help reduce catches of undersized Nephrops and hake in the Bay of Biscay trawling fleet? J. Environ. Manag. 186, 96–107. doi: 10.1016/j.jenvman.2016.10.017
Wang, Y., Naumann, U., Wright, S. T., and Warton, D. I. (2012). mvabund- an Rpackage for model-based analysis of multivariate abundance data. Methods Ecol. Evol. 3, 471–474. doi: 10.1111/j.2041-210X.2012.00190.x
Keywords: biological traits, vulnerability indicators, trawl fisheries, large-scale monitoring, fishery management
Citation: de Juan S, Hinz H, Sartor P, Vitale S, Bentes L, Bellido JM, Musumeci C, Massi D, Gancitano V and Demestre M (2020) Vulnerability of Demersal Fish Assemblages to Trawling Activities: A Traits-Based Index. Front. Mar. Sci. 7:44. doi: 10.3389/fmars.2020.00044
Received: 17 September 2019; Accepted: 23 January 2020;
Published: 07 February 2020.
Edited by:
Trevor John Willis, Stazione Zoologica Anton Dohrn, ItalyReviewed by:
Heather D. Penney, Memorial University of Newfoundland, CanadaMauro Sinopoli, Stazione Zoologica Anton Dohrn, Italy
Copyright © 2020 de Juan, Hinz, Sartor, Vitale, Bentes, Bellido, Musumeci, Massi, Gancitano and Demestre. This is an open-access article distributed under the terms of the Creative Commons Attribution License (CC BY). The use, distribution or reproduction in other forums is permitted, provided the original author(s) and the copyright owner(s) are credited and that the original publication in this journal is cited, in accordance with accepted academic practice. No use, distribution or reproduction is permitted which does not comply with these terms.
*Correspondence: Silvia de Juan, c2RlanVhbkBpY20uY3NpYy5lcw==