 Vittoria Roncalli
 Matthew C. Cieslak1
 Petra H. Lenz
- 1Pacific Biosciences Research Center, University of Hawai‘i at Mānoa, Honolulu, HI, United States
- 2Integrative Marine Ecology Department, Stazione Zoologica Anton Dohrn, Naples, Italy
- 3Institute of Marine Science, University of Alaska Fairbanks, Fairbanks, AK, United States
Capital breeders must balance the energetic requirements of cellular function and the cost of reproduction. The subarctic copepod Neocalanus flemingeri, a small planktonic crustacean, depends on a short annual phytoplankton bloom to acquire the energy needed to support a non-feeding adult female that enters a period of diapause prior to spawning 5 to 7 months later. After emergence from diapause, the reproductive program takes 2 months starting with germline development. In this study, the regulation of genes involved in energy utilization and cellular maintenance were investigated using RNA-Seq as females progressed from diapause to end-of-life. Hierarchical clustering of expression profiles from 61 individual females identified four major transitions in transcriptional profiles along a timeline spanning from diapause to spawning and post-reproduction. The clusters were analyzed statistically for differential gene expression followed by functional analyses. The transition from diapause to post-diapause (early to mid-oogenesis) was characterized by the up-regulation of genes involved in cellular homeostasis, glycolysis and lipid catabolism. As females approached spawning genes involved in cellular homeostasis, like innate immunity became down-regulated. Genes involved in protein ubiquitination and programmed cell death became up-regulated as females started to spawn. Gene expression patterns suggest that energy allocation and utilization is highly dynamic in N. flemingeri during the progression of the reproductive period. Major changes in the expression of genes involved in cellular homeostasis, metabolic processes and autophagy were linked to stages of egg maturation. Changes in gene expression that marked the transition from diapause to post-diapause were similar to those reported in other arthropods that resume feeding after emergence from diapause. As egg maturation progressed, gene expression patterns indicate that resources became concentrated on provisioning eggs, while being diverted away from cellular homeostasis. The data suggest that in N. flemingeri genes are regulated such that organismal function and sources of energy are synchronized with stages of egg maturation to optimize the exploitation of finite resources. The existence of mechanisms that regulate fecundity to match the availability of stored resources could reduce reproductive failure in this species.
Introduction
Central to life-history theory is how individuals allocate energeticresources to meet the “cost of reproduction” (Stearns, 1992, 2000). Organisms allocate energy resources competitively and this requirestrade-offs between reproductive output and individual growth, maintenance and life span (Williams, 1966; Stearns, 1992). In highlyseasonal and food-limited environments, organisms have evolved lifehistories that synchronize growth and reproduction to peaks inproduction and often include a period of dormancy, like diapause. Diapause ensures survival during adverse periods (e.g., extreme cold) and energy-poor conditions. It is a developmental program that delaysreproduction and lengthens life span (Mansingh, 1974; Denlinger, 1991, 2002; Hirche, 1996; Tatar and Yin, 2001; Denlinger and Armbruster, 2014; Kučerová et al., 2016). Arthropods with post-embryonic diapause use lipids accumulated during pre-diapause to fuel the dormant period and contribute energetically to post-diapause development and reproduction (Niehoff and Runge, 2003; Sim and Denlinger, 2009; Hahn and Denlinger, 2011; Ragland et al., 2011). These organisms typically resume feeding post-diapause - an effective bet hedging strategy that allows them to acquire resources for reproduction at two time points that are separated by the diapause period (Niehoff et al., 2002). However, the females of the sub-arctic copepod, Neocalanus flemingeri (Miller, 1988) rely on “capital” acquired during pre-diapause to fuel the entire reproductive program starting with early cell line differentiation (“germline formation”; Roncalli et al., 2018b). The annual life cycle of N. flemingeri is limited to a single generation per year with the early larval stages (nauplii) appearing in the water column during the winter (Miller and Clemons, 1988; Lenz and Roncalli, 2019). Development through the juvenile stages (copepodid stages CI to CV) occurs from March to June with maximum growth rates coinciding with the spring phytoplankton bloom (Liu and Hopcroft, 2006). In June, large numbers of non-feeding adult females accumulate below 250 m, where they spawn in January and February (Miller and Clemons, 1988). In this species, the reproductive program is fueled by resources that were accumulated at least 6 months prior to spawning. Thus, in N. flemingeri allocation of finite resources requires balancing the energetic requirements for maintaining organism function during and post diapause, while also seeking to maximize egg production.
Resource availability during the growth period will determine how much capital an individual can accumulate to fuel diapause and reproduction. Accumulation of capital in N. flemingeri depends on food resources that are temporally and spatially variable, and unpredictable (Mackas and Coyle, 2005). Algal blooms in the Gulf of Alaska and neighboring fjords are both seasonal and patchy – magnitude and timing vary interannually and spatial heterogeneity is high (Strom et al., 2006; Waite and Mueter, 2013). Chlorophyll a, an indicator of food abundance can differ by one to two orders of magnitude between near shore areas and the high nutrient-low chlorophyll region of the subarctic Alaska gyre (Mackas and Coyle, 2005; Waite and Mueter, 2013; Coyle et al., 2019). Diapause preparation in such a heterogeneous environment will affect the copepods’ ability to maximize the acquisition of resources, in particular if individuals experience extended periods of low food during the lipid accumulation phase (Roncalli et al., 2019). While few studies have investigated reproductive success in this species, one published report indicates high variability in lifetime fecundity of individual N. flemingeri (Saito and Tsuda, 2000), consistent with large differences in stored capital. Thus, a key question in N. flemingeri is how an individual female allocates finite and potentially very limited resources to avoid reproductive failure.
In a recent study, the progression of oogenesis in N. flemingeri females was characterized using transcriptomics from diapause up to spawning (Roncalli et al., 2018b). Gene expression patterns in N. flemingeri were compared with the well-characterized reproductive program of the model species Drosophila melanogaster (Baker and Russell, 2009; Jagut et al., 2013; Kronja et al., 2014), followed by an analysis that linked gene expression in N. flemingeri to the five stages of oogenesis (OS0 – OS4) described for calanoid copepods using histology (Niehoff and Hirche, 1996; Niehoff, 2007). Based on the relative expression of ca. 1,000 differentially expressed genes involved in reproduction, the progression through oogenesis is nearly synchronous in females collected in September from deep water (400 to 700 m) and incubated in the laboratory at 5°C. The reproductive program starts with the up-regulation of genes involved in germline development, the first stage of oogenesis (OS0), and it takes 6–7 weeks before females start to spawn. While in most calanoid copepods all five stages of oogenesis are concurrent, Roncalli et al. (2018b) found oogenesis to be sequential in N. flemingeri with processes associated with early oogenesis becoming down-regulated as females neared spawning.
The sequential regulation of reproductive genes raised the question whether these were correlated with other physiological changes in the female given finite resources. In this study, the progression through the reproductive program provided the framework to investigate expression patterns of other biological processes. The temporal sequence of the expression of reproductive genes was used to examine all other transcriptional changes that occurred between diapause, emergence from diapause and the progression through the five stages of oogenesis, including post-reproduction and end of life. The analysis strategy involved clustering females into groups using relative expression of all transcripts. The resulting clusters formed the basis for statistical comparisons to identify transitions in transcriptional profiles followed by functional analyses of genes involved in cellular maintenance and energy metabolism. The goal was to develop an understanding of how trade-offs between cost of reproduction and organism integrity are balanced in this capital breeder, and how this balance changed with the egg maturation process.
Materials and Methods
Neocalanus flemingeri RNA-Seq Dataset
The dataset comprised of RNA-Seq data generated for individual female N. flemingeri is publicly available through the National Center for Biotechnology Information (BioProject: PRJNA324453). The time series included weekly or semi-weekly sampling of deep-collected females followed by laboratory incubations starting at collection (Wk0) to 9.5 weeks post-collection (Wk9.5). In a previous study, the data from Wk0 to Wk7 were analyzed to characterize the reproductive program (Roncalli et al., 2018b).
Field Collection, Transfer to Laboratory and Laboratory Incubation
As described previously (Roncalli et al., 2018b), Neocalanus flemingeri adult females were collected from depth on September 20, 2015 in Prince William Sound (station “PWS2”; depth:∼740 m; Latitude 60° 32.1′N; Longitude 147° 48.2′W) during the fall cruise of the Seward Line Long-term Observation Program (LTOP)1. Briefly, a multiple opening and closing plankton net (0.25 m2 cross-sectional area; 150 μm mesh nets; Multinet-Midi, Hydro-Bios) was towed vertically from 700 m. Collections from 400–700 m were immediately diluted, and adult females of N. flemingeri were live sorted and either preserved within 35 min of the retrieval of the net [“Wk0”, n = 6; RNAlater Stabilization Reagent (QIAGEN)] or sorted into 20L carboys for the incubation experiment. Carboys were stored in large insulated coolers and kept in darkness at 5–6°C for transportation to the University of Alaska Fairbanks (UAF).
At UAF, laboratory incubations were set up on September 24, 2015 with 30 sets of four adult females Falcon tissue-culture flask with 600 ml of seawater collected from depth (400–600 m). Flasks were incubated in the dark at 5°C. Between weeks 1 and 7, three tissue-culture flasks were randomly chosen at weekly intervals and harvested. Thereafter, flasks were harvested at semi-weekly intervals to Wk9.5. Females in each harvested flask were assessed for survival and any visible morphological changes associated with oocyte development. In addition, surviving females were preserved in RNALater Stabilization Reagent (QIAGEN) and stored at −80°C. Flasks were also checked for the presence of eggs and/or nauplii, which were first observed at 7.5 weeks with two more clutches released per female between 7.5 and 10 weeks. Overall RNA-Seq was performed on 61 females with six individuals per time point between Wk0 and Wk7 (n = 48), and 13 individuals after females started to release clutches of eggs (Wk7.5: n = 3, Wk8.5: n = 2, Wk9: n = 2 and Wk9.5: n = 6; Supplementary Table S3).
RNA Extraction, RNA-Seq, Expression Profiling and Clustering Analysis
Total RNA extraction and RNA-Seq followed previously described protocols (Roncalli et al., 2018a, b). Briefly, extracted total RNA was extracted from individual females using QIAGEN RNeasy Plus Mini Kit (catalog # 74134)] in combination with a Qiashredder column (catalog # 79654) and shipped on dry ice to the Georgia Genomics Bioinformatics Core2. Double-stranded cDNA libraries [Kapa Stranded mRNA-seq kit (KK8420)] were sequenced using a High Output Flow Cell (150 bp, paired end Illumina Next-Seq 500 instrument). Reads with a length ≥50 bp and a Phred score ≥30 were kept for downstream analysis (FASTX Toolkit v.2.0.0; Illumina Basespace Labs) leading to the removal of ca. 7% of reads per sample, and resulting in an average of 20.7 million reads per sample (range: 20 to 32 million reads) (Supplementary Table S1). Quality-filtered libraries (n = 61) were mapped to an existing adult female N. flemingeri reference transcriptome (transcripts = 140,841) (Roncalli et al., 2018a) using kallisto software (default settings; v.0.43.1) (Bray et al., 2016). The BioConductor package edgeR (Robinson et al., 2010) was used to remove transcripts with very low expression levels. This filter removed all transcripts that were expressed at less than 1 cpm in a set of replicate samples. Application of this filter reduced the total number of reference transcripts to 85,505.
The output from the kallisto mapping step was used to compute normalized relative expression per individual female and per transcript as reads per kilobase per million (RPKM) (Mortazavi et al., 2008). Relative expression in RPKM were log-transformed [Log10(RPKM + 1)] and used in a hierarchical clustering step to identify relationships among all females (Wk0 to Wk9.5). The analysis included all 61 individuals and was performed with the function hclust in the base R package applying the average linkage method (UPGMA) and all other default settings (Müllner, 2013). The clusters (CL) resulting in this analysis, which group females with similar expression profiles, were compared and tested for statistical differences in gene expression (see below).
Identification of Differentially Expressed Genes (DEGs)
Three separate statistical comparisons were completed to identify differentially expressed genes (DEGs): (1) pairwise comparisons between diapausing females (CL1) and post-diapause females (all other clusters) to establish how relative expression changed over time from emergence to spawning; (2) generalized linear model followed by pairwise comparisons between three clusters of post-diapause females (CL2-CL4; Wk1 to Wk7) to define transcriptional transitions during the reproductive program; and (3) generalized linear model followed by pairwise comparisons between clusters of spawning and post-reproductive (“end of life”) females (Wk7.5 to Wk9.5) to reveal changes in gene expression as females approach end of life.
Statistical analyses were performed on the transcripts mapped to the reference transcriptome using edgeR. Prior to statistical testing, RNA-Seq libraries were normalized using the TMM methods (trimmed means of M values) as implemented by edgeR. Differentially expressed genes between clusters of females in pairwise comparisons were identified using the Fisher’s exact test with p-values corrected for False Discovery Rate (Benjamini–Hochberg procedure) (FDR; p ≤ 0.05). In multiple cluster comparisons DEGs were identified using the generalized linear model (glmFit function) with adjusted p-values (Benjamini–Hochberg procedure) (FDR; p ≤ 0.05) followed by pairwise comparisons between clusters using likelihood ratio test (glmLRT).
For the functional analysis, the annotated N. flemingeri adult female reference transcriptome (transcripts = 59,544) was used to identify DEGs with significant annotation against the Gene Ontology database (GO terms) and the Kyoto Encyclopedia of Genes and Genomes (KEGG) database (enzyme commission number, EC) (Roncalli et al., 2018a). To identify biological processes (GO terms) that were over-represented among the DEGs, enrichment analyses were performed using topGO software (Alexa and Rahnenfuhrer, 2010). Up- and down-regulated genes with GO annotation identified from each pairwise comparison were independently compared against the 59,544 annotated transcripts in the reference transcriptome (Roncalli et al., 2018a) using the Fisher exact test with a Benjamini–Hochberg correction (p-values ≤ 0.05 (v. 2.88.0, default algorithm weight01). Visualization of the enrichment results was done using ReviGO software (similarity setting to medium = 0.7) (Supek et al., 2011). The software summarizes lists of GO terms removing the redundancy using a simple clustering algorithm that relies on semantic similarity measures.
Additional enrichment analyses of the pathways involved in energy metabolism were performed on the DEGs identified in diapausing vs. post-diapause comparisons (1) using ClusterProfiler software (R package; v. 3.8.1) (Yu et al., 2012). For this analysis, enrichKEGG function (p-values ≤ 0.05 corrected for FDR) was used to compare DEGs (combined up- and down-regulated) annotated with EC numbers against the KEGG database (toType = ncbi-proteinid) using the fruit fly D. melanogaster as reference (organism = dme).
Results from enrichment analyses (GO and KEGG) were used to generate heat maps of DEGs involved in specific metabolic pathways (glycolysis, citric acid cycle (TCA), proteolysis and ubiquitination), cellular homeostasis, immune response, programmed cell death and chromatin silencing. Genes involved in glycolysis, glycerophospholipid metabolism, TCA and ubiquitination were obtained from the KEGG database using the insect D. melanogaster as the reference organism (map00010, map00564, map00020, map04120). Genes annotated with the GO term “cellular homeostasis” [GO:0019725], “immune response” [GO:0006955], “programmed cell death” [GO:0010942, GO:0012501] and “chromatin silencing” [GO:0006342] were searched using AMIGO software GOOSE (May, 2019; Ashburner et al., 2000). As implemented by the software, the selected GO terms and their descendants were searched using the LEAD SQL wiki called find descendants of the node “nucleus” with “nucleus” replaced with the specific GO term name (e.g., “cellular homeostasis”). Heat maps of the genes involved in each pathway/process of interest were generated by averaging relative expression [Log10(RPKM + 1)] of all individuals within a cluster and comparing across clusters. Statistical significance for differential expression of the genes among the clusters was confirmed by searching the genes in the list of DEGs.
Results
Survival and Egg Development
Survival rate in the harvested flasks averaged 87% (range: 70 to 100%) during the 9.5-week incubation period with the lowest survival recorded in flasks harvested at Wk7.5. The first morphological changes associated with oogenesis were noted in a few females harvested at Wk3 (Roncalli et al., 2018b). Visible changes included the appearance of light coloration in the dorsal region indicative of early oogenesis. By Wk8.5 all females were in a late stage of oogenesis: dark-colored eggs were clearly visible in the oviducts along the mid-dorsal and posterio-lateral regions of the prosome. Furthermore, by this time eggs and/or nauplii were present in the flasks suggesting that most females had released at least one clutch of eggs. All individuals harvested in Wk9 had either many mature eggs in their oviducts, or they appeared to be “partially spent” as indicated by a smaller number of eggs in the oviducts. At the last sampling time point (Wk9.5), 75% of the females in the flasks were still alive, but most were inactive, and several individuals were “spent” with no or very few mature eggs remaining in the oviducts.
Five Major Clusters From Collection to End of Life
Agnostic cluster analysis of individuals by normalized expression profiles (transcripts >1 cpm = 85,505) segregated the 61 females into two major branches (Figure 1). The “early” branch included all females that had not started to release eggs (n = 48, Wk0 to Wk7), while females in the “late” branch had started to spawn (n = 13; Wk7.5 to Wk9.5). Within each branch females were grouped into clusters, which were named based on the stage in the reproductive program (Roncalli et al., 2018b). In the “early” branch, females aggregated into three clusters (CL1, CL2, and CL3). “Diapause” (CL1) included the six Wk0 individuals, which were clearly separated from all other females within the early branch. The remaining 42 individuals separated into CL2 “early to mid-oogenesis” with 29 individuals from the Wk1 to Wk5 harvests, CL3 “pre-spawning” with 12 individuals from the Wk6 and Wk7 harvests (Figure 1). One outlier, a Wk5 individual was excluded from all downstream analyses.
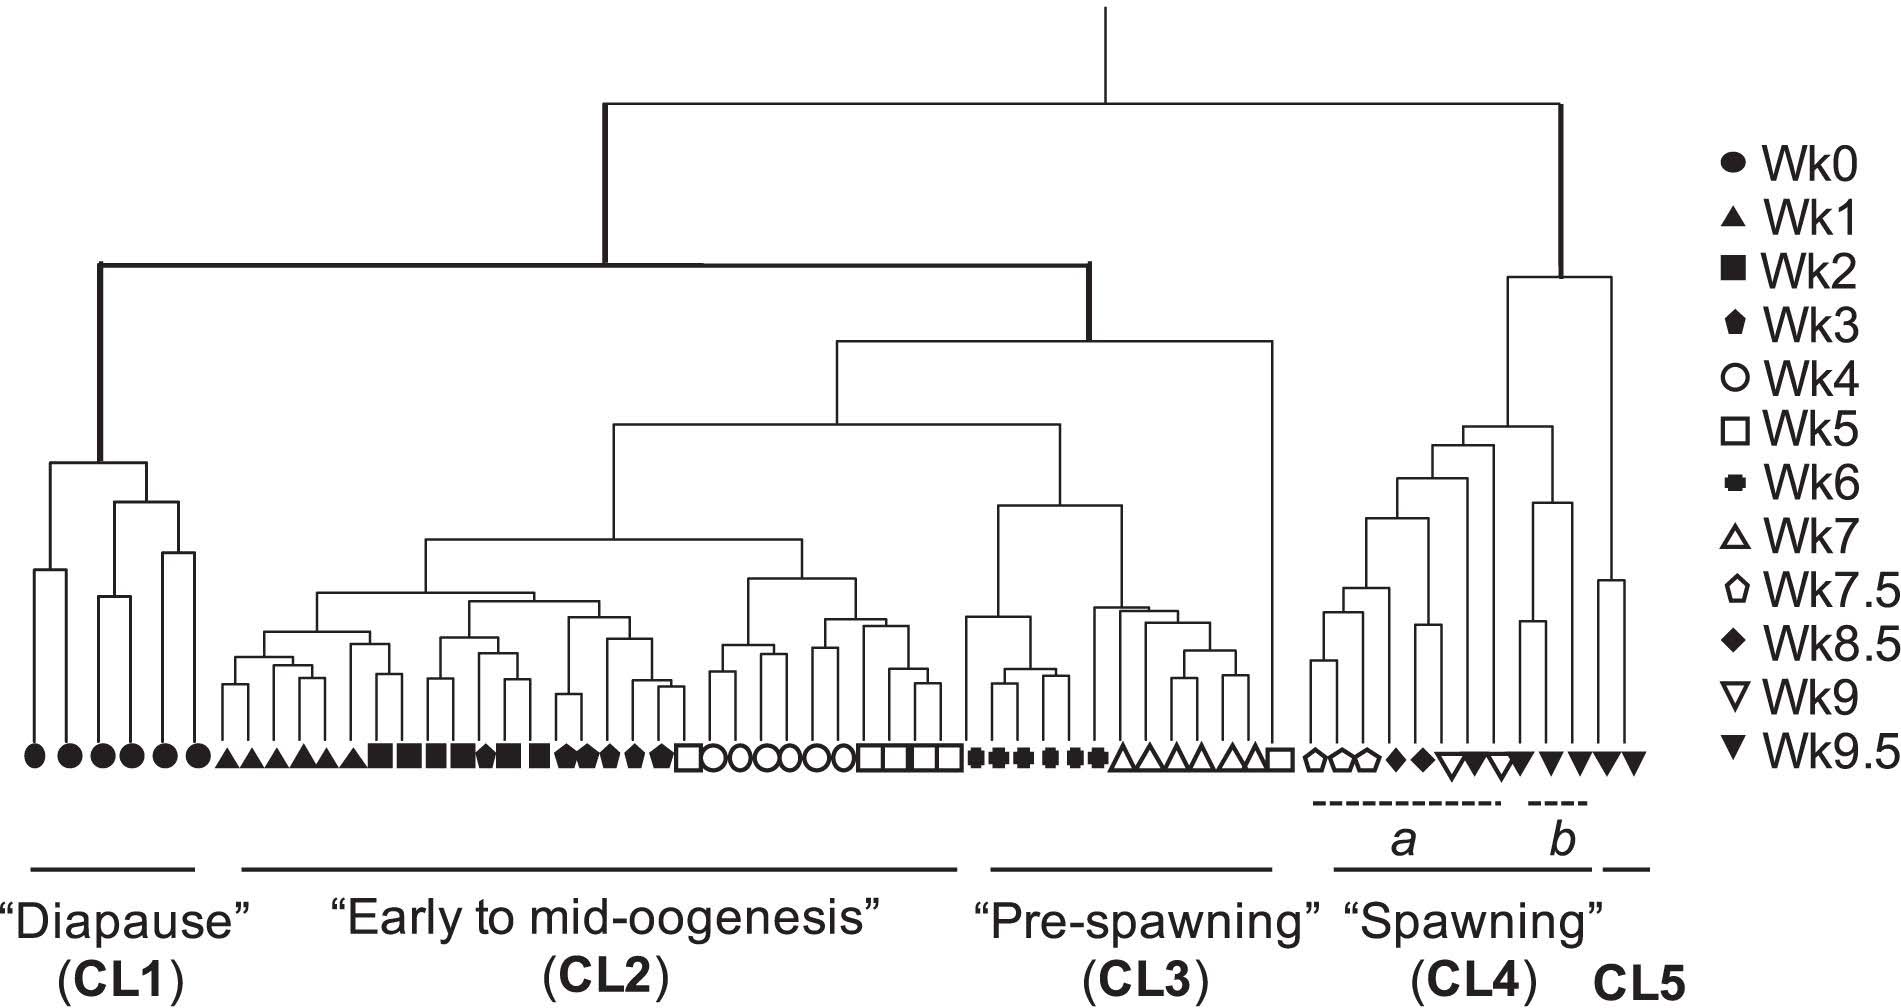
Figure 1. Cluster analysis by gene expression profile of all transcripts in Neocalanus flemingeri adult females from collection (Wk0) to Wk9.5. Dendrogram of adult females (n = 61) obtained by hierarchical cluster analysis based on relative expression of 85,505 transcripts (>1 cpm expression) showed four major clusters (CL1-CL4) and a fifth cluster (CL5) with only two females. Clusters have been named based on stage of reproductive program (Roncalli et al., 2018b) (see text). Each line represents a single adult female individual. One female (Wk5) did not cluster with any others, and this individual was removed from downstream analyses. Symbols indicate length of incubation time post collection (see legend in figure).
The 13 females in the “late” branch separated into clusters as well. One cluster was composed of two sub-clusters (CL4a and CL4b), which included females with eggs in the oviduct. Females from CL4 “spawning” separated in CL4a with eight individuals (Wk7.5 to Wk9.5) and CL4b with three Wk9.5 individuals. Individuals from these two sub-clusters (CL4a and CL4b) were combined in comparisons with diapausing females (CL1) and in the characterization of transitions between major clusters. They were only considered as separate groups for the analysis focused on “end-of-life” processes. The second cluster (CL5) included two spent (= post-reproductive) Wk9.5 females. The grouping of only two females in CL5 named “end-of-life” is consistent with microscopic observations prior to preservation for RNA-Seq, which identified these two females as “spent.”
Comparisons of Gene Expression Between Diapausing and Post-diapause Females
Paired comparisons between diapause (CL1) and post-diapause females (CL2-CL4) underscored the large transcriptional differences associated with emergence from diapause (Table 1 and Supplementary Table S2). A high number of DEGs (n = 7,224) were identified in the comparison between “diapause” (CL1) and “early to mid-oogenesis” (CL2) females, marking the termination of diapause and the beginning of oogenesis. The number of DEGs increased to more than 10,000 between “diapause” (CL1) and “pre-spawning” (CL3) and “spawning” (CL4) females (pairwise comparisons, p ≤ 0.05 after FDR correction) (Supplementary Table S2). While ‘reproductive process’ was common among the DEGs in all comparisons, other processes represented over 50% of the GO terms among the annotated DEGs (Supplementary Figure S1). These other GO terms included “single organism process,” “multicellular organismal process,” “biological regulation,” and “localization”.
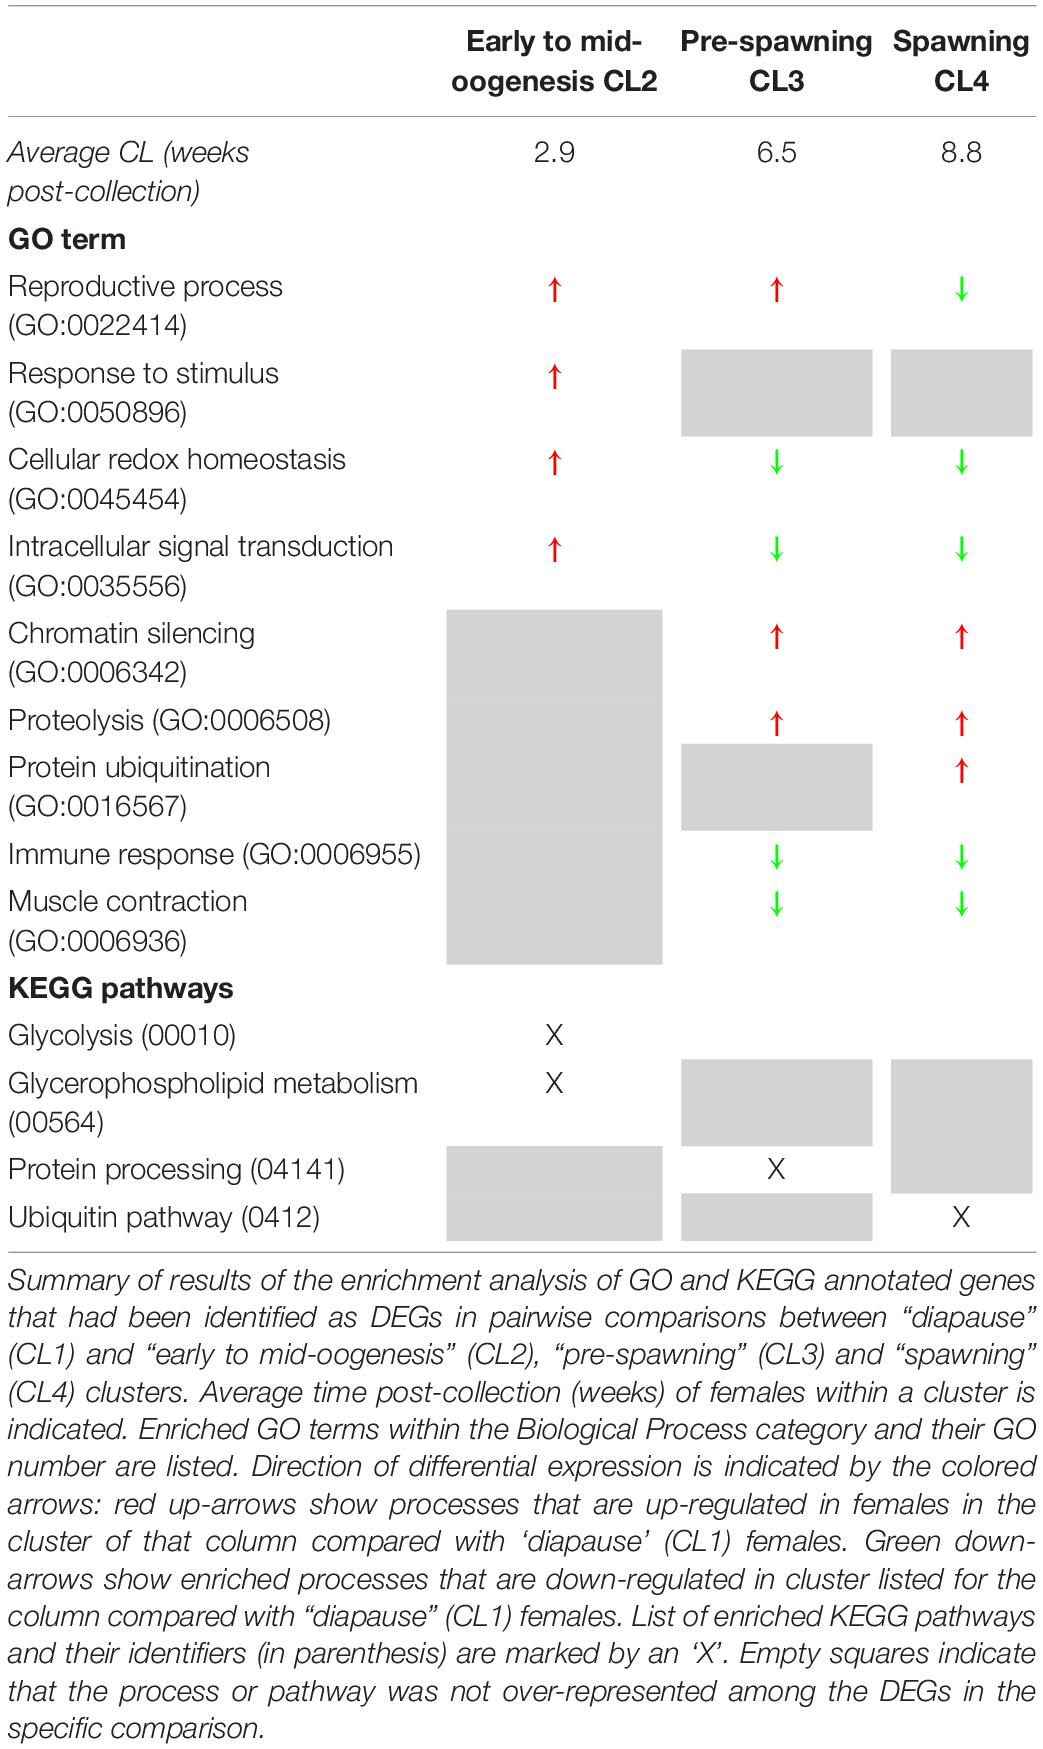
Table 1. Transcriptional differences between Neocalanus flemingeri females in diapause and in post-diapause. Relative gene expression of diapausing females (CL1) were compared with females in three other major clusters (columns) identified using hierarchical clustering (Figure 2).
The first transition between “diapause” (CL1) and “early to mid-oogenesis” (CL2) females was characterized by a general activation of cellular processes with four being enriched among the up-regulated genes with no enriched down-regulated processes (Table 1 and Figure 2A). Genes involved in “reproductive process,” “cellular redox homeostasis,” “response to stimulus,” and “intracellular signal transduction” were all up-regulated, consistent with a physiologically more active state and the initiation of the reproductive program in “early to mid-oogenesis” (CL2) females (Table 1 and Figure 2A).
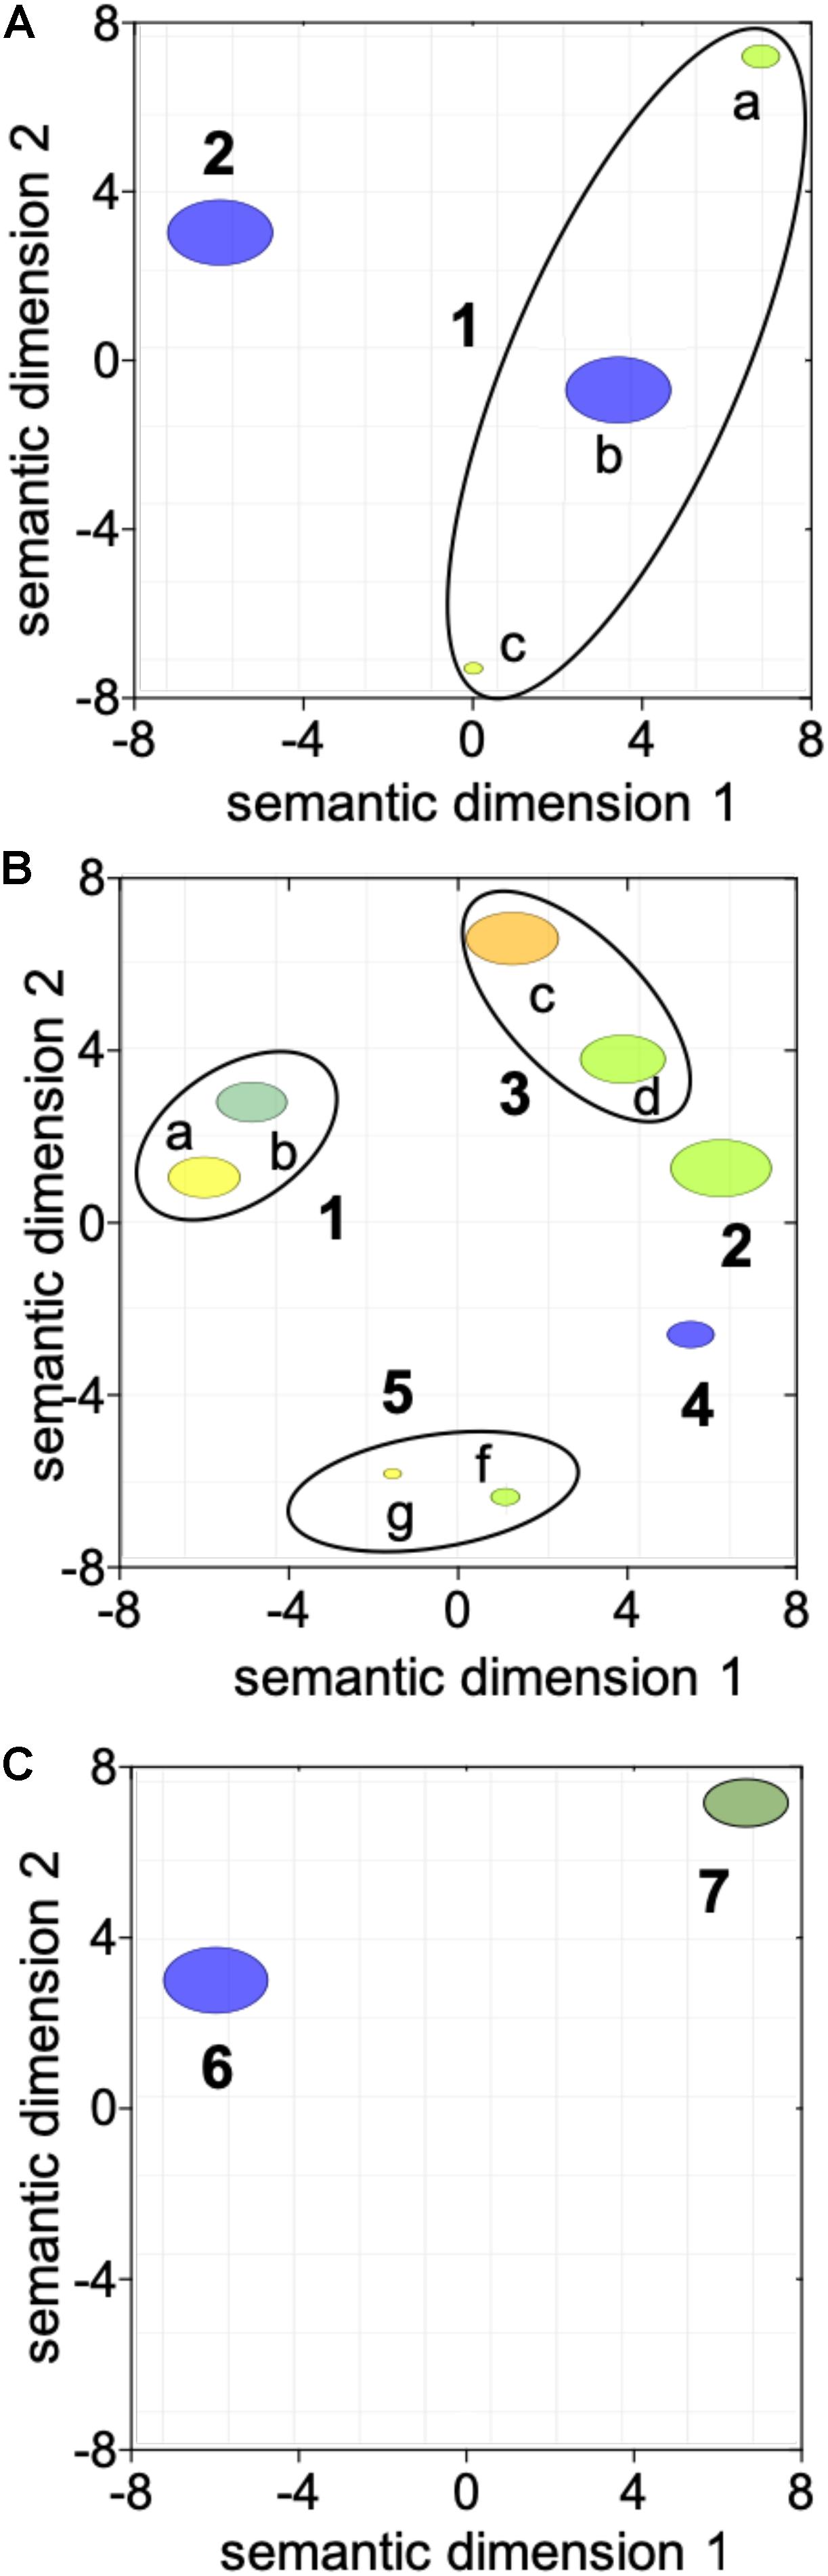
Figure 2. Visualization of the transition in gene expression between adjacent clusters using reviGO semantic analysis of enriched GO terms. ReviGO summarization analysis was performed on the enriched GO terms represented among the DEGs identified between adjacent clusters: (A) “diapause” (CL1) vs. “early to mid-oogenesis” (CL2); (B) “early to mid-oogenesis” (CL2) vs. “pre-spawning” (CL3) and (C) “pre-spawning” (CL3) vs. “spawning” (CL4). DEGs in (A) were identified with using Fisher exact test (FDR; p ≤ 0.05) while for (B,C), DEGs were identified using a generalized linear model followed by pairwise likelihood ratio tests (FDR; p ≤ 0.05). GO terms with a shared GO parent have been circled (black line). Annotations: 1 “response to stimulus” [a GO:0050896, b GO:0045454, c GO:0035556], 2 “reproductive process” [GO:0022414], 3 “immune response” [d GO:0006955, e GO:0008063], 4 “regulation of transcription” [GO:0006357], 5 “chromatin silencing” [f GO:0006342, g GO:0016569], 6 “positive regulation of programmed cell death” [GO:0043068] and 7 “protein ubiquitination” [GO:0016567].
Three GO terms remained enriched in the paired comparisons between “diapause” (CL1) and “pre-spawning” (CL3) and “spawning” (CL4), however, some enriched processes switched from up-regulated to down-regulated (Table 1). Notable among these processes was “reproductive process,” which switched to down-regulated in “spawning” (CL4) females. Other processes enriched among down-regulated genes were “immune response,” and “muscle contraction” (Table 1). Processes that were enriched among the up-regulated genes in “pre-spawning” (CL3) and “spawning” (CL4) females included “proteolysis,” “chromatin silencing,” and “protein ubiquitination” (Table 1).
An analysis of the enzymatic pathways represented among the DEGs showed a temporal progression of enriched pathways in pairwise comparisons between diapause and post-diapause clusters of females. Significant over-representation of DEGs involved in glycolysis and glycerophospholipid metabolic pathway characterized the “early to mid-oogenesis” (CL2) females in comparison with the “diapause” (CL1) females. Consistent with the enrichment of the “proteolysis” GO term, “pre-spawning” (CL3) females showed an enrichment of DEGs involved in enzymatic pathways of protein processing. In the “spawning” (CL4) females, DEGs involved in the ubiquitin pathway were enriched among the up-regulated genes (Table 1).
Transcriptional Changes at the Termination of Diapause
Several genes that are often used as indicators of diapause termination in insects were also significantly regulated in N. flemingeri in the transition between “diapause” (CL1) and “early to mid-oogenesis” (CL2) females (Figure 3A). “Diapause termination” genes such as proliferating cell nuclear antigen (PCNA), cyclin-dependent kinase 1, cyclin-B, tribbles, sestrin, and 5′-AMP-activated protein kinase (AMPK) were differentially expressed between “diapause” (CL1) and “early to mid-oogenesis” (CL2) females (Figure 3A). The expression of these genes was also lower in females in the ‘pre-spawning’ and “spawning” clusters (CL3, CL4), but not significantly different compared with “early to mid-oogenesis” (CL2) females (Figure 3A). Low expression was also observed for several anti-longevity genes (e.g., edem 1, sirtuin 6) in CL1 females (Figure 3A). In contrast, relative expression of several transcripts annotated to phosphoenolpyruvate carboxy-kinase (PEPCK), a metabolic enzyme involved in gluconeogenesis, and pro-longevity genes (e.g., embryonic lethal abnormal vision, cheerio) was low in all post-diapause females (CL2, CL3, and CL4) compared with “diapause” (CL1) females (Figure 3A).
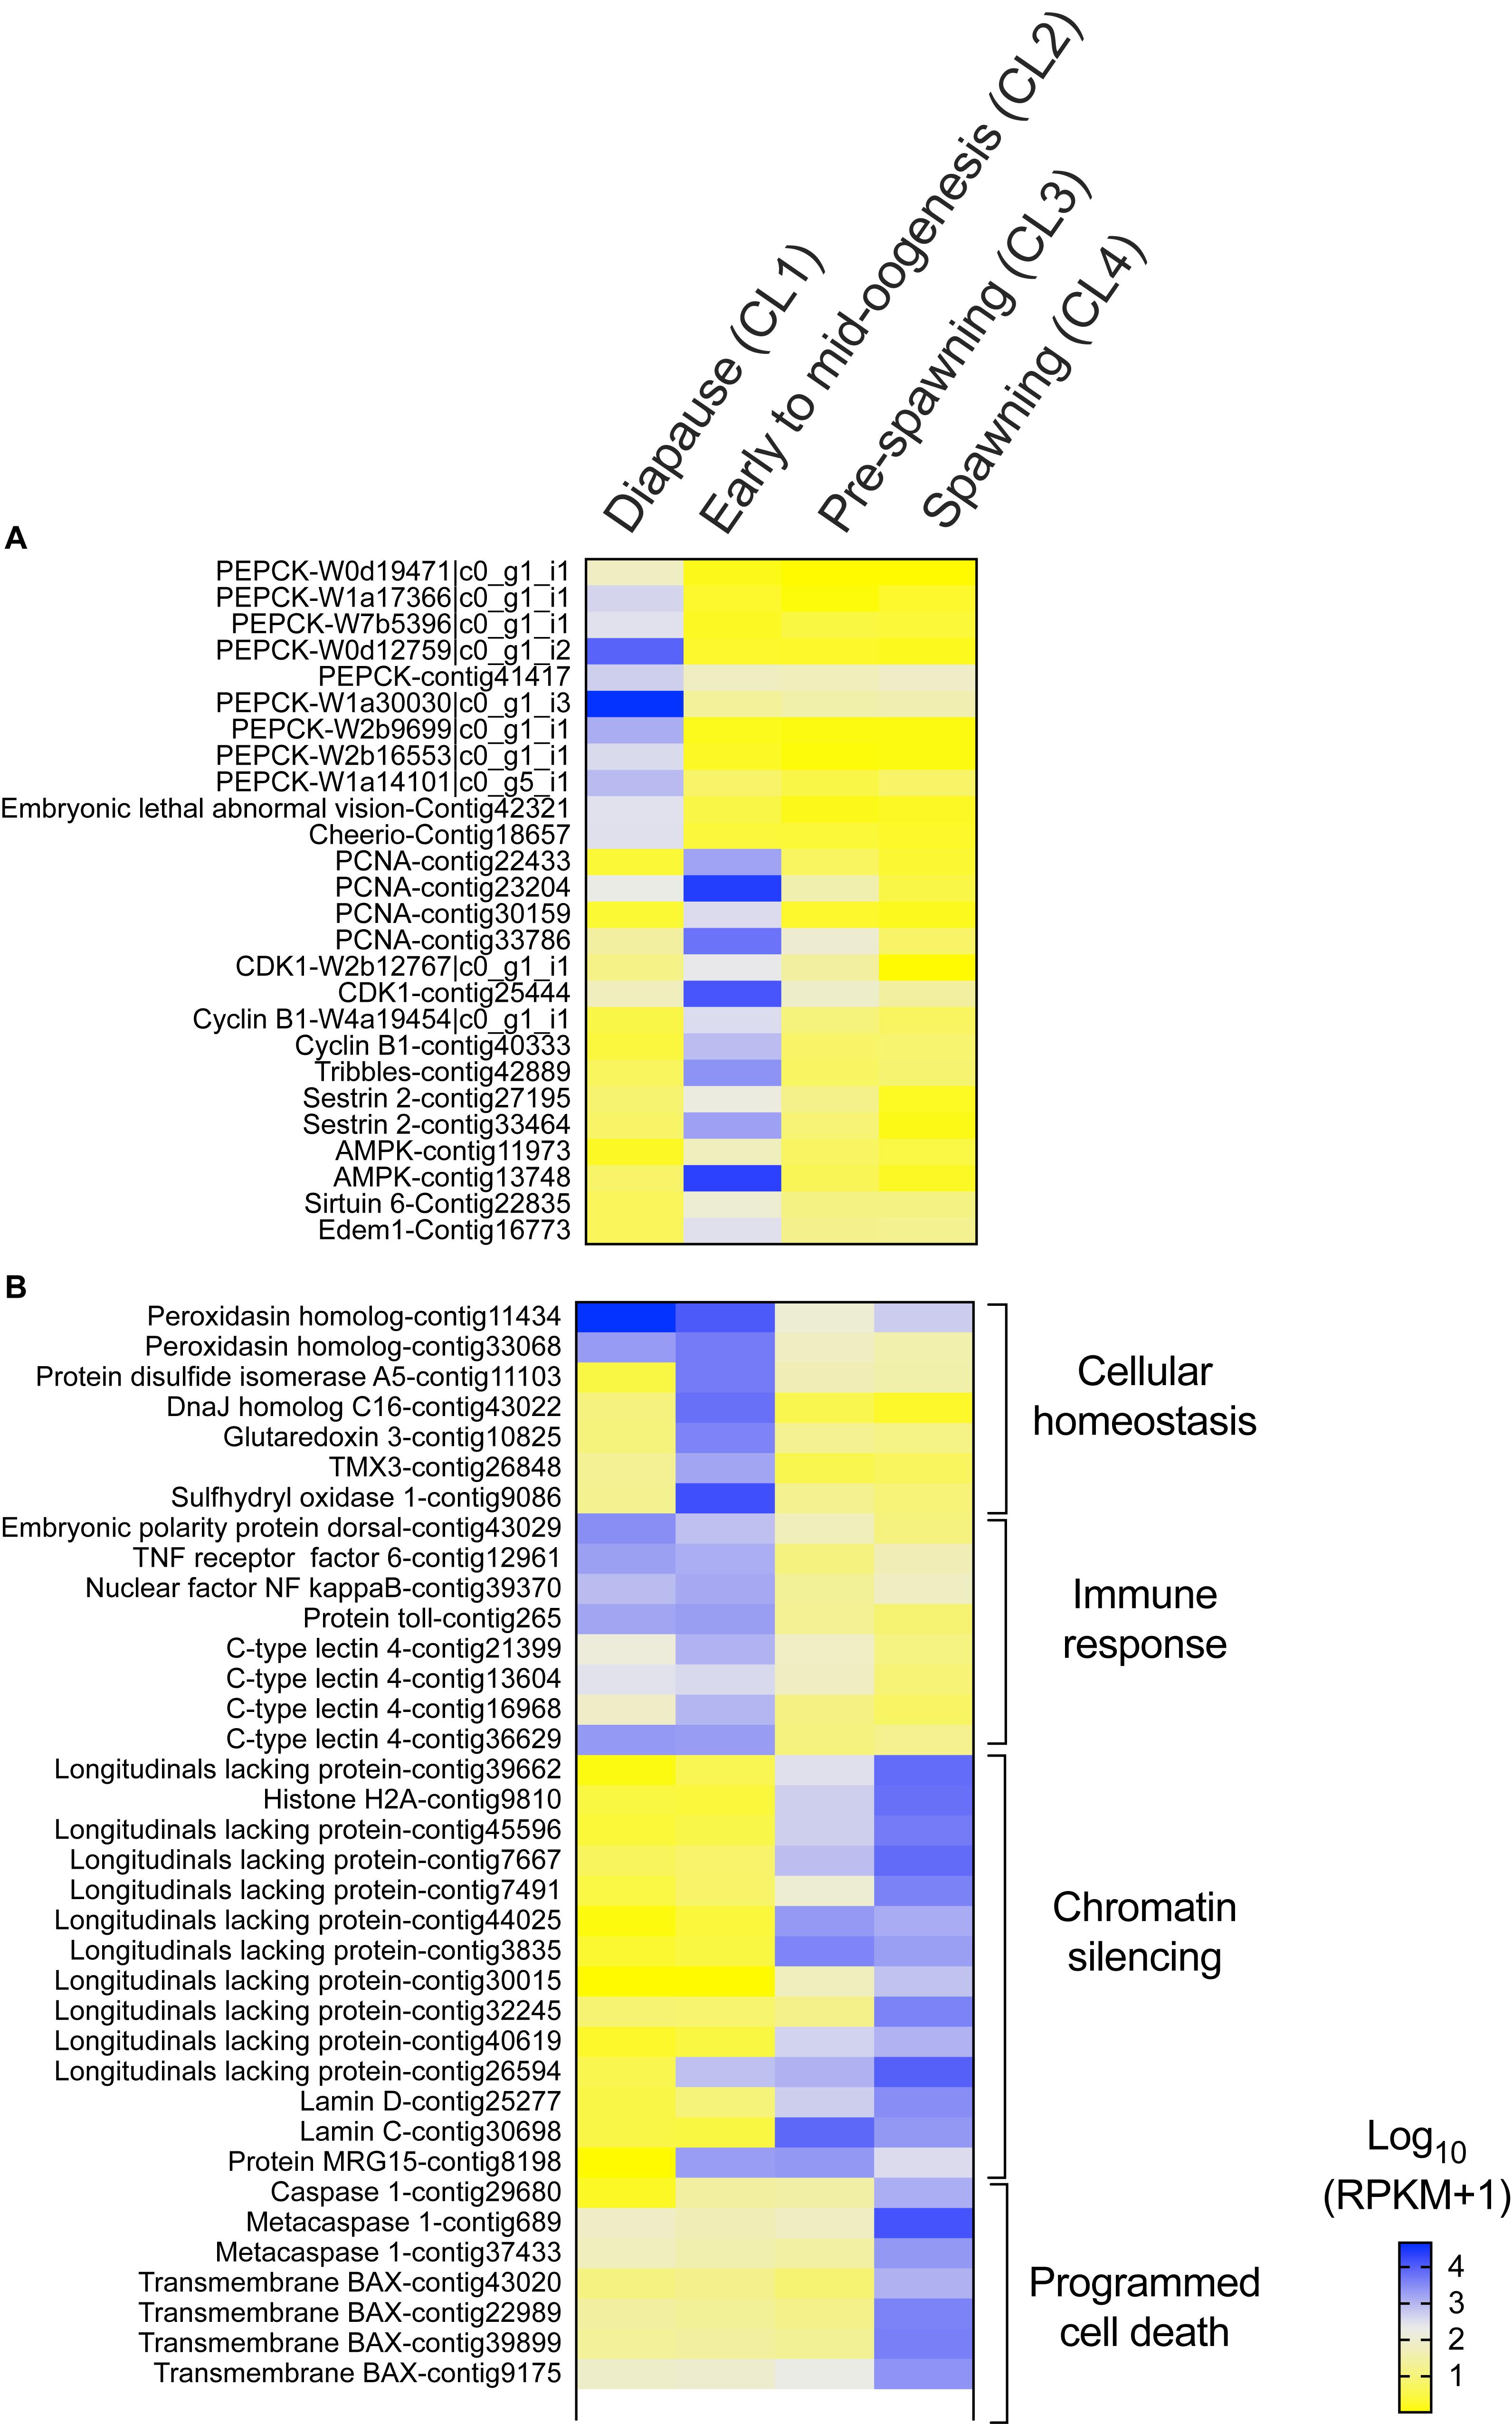
Figure 3. Neocalanus flemingeri differential gene expression. Heat map of relative expression of target genes involved in (A) “diapause phenotype” and (B) “cellular homeostasis” [GO:0019725], “immune response” [GO:0006955], “chromatin silencing” [GO:0006342] and “programmed cell death” [GO:0012501]. Color-coding for each gene indicates the magnitude of expression as Log10 (RPKM + 1). Columns are ordered by clusters following the grouping in Figure 1 as indicated by the labels (top). Genes were ordered by functional category (right).
Transcriptional Changes in Post-diapause Females
The three clusters of post-diapause females (CL2 to CL4) represented major transitions in transcriptional profiles associated with “cellular redox homeostasis” and “metabolic process” in addition to “reproductive process.” A total of 13,788 DEGs were identified among the clusters of post-diapause females (CL2-CL4) with ca. 7,000 DEGs between “early to mid-oogenesis” (CL2) and “pre-spawning” (CL3), and ca. 12,000 DEGs between ‘pre-spawning’ (CL3) and ‘spawning’ (CL4) females (Supplementary Table S2). “Reproductive process” was the top GO term among the DEGs (37 to 45%) between adjoining clusters of post-diapause females, consistent with sequential changes in expression related to the progression of the reproductive program described by Roncalli et al. (2018b) (Supplementary Figure S1C). The remaining DEGs (>55%) were involved in conserved processes such as “single organism process,” “multicellular organismal process,” “biological regulation,” and “localization” (Supplementary Figure S1C).
Females grouped in “pre-spawning” (CL3) cluster were on average 2 weeks further along the reproductive program than females within the “early to mid-oogenesis” (CL2) cluster (Table 1). Eight GO terms belonging to five functional groups were enriched among the DEGs between “early to mid-oogenesis” (CL2) and “pre-spawning” (CL3) females, as summarized by reviGO analysis (Supplementary Table S3 and Figure 2B). The transition was characterized by an overall down-regulation in the “pre-spawning” (CL3) females compared with those in “early to mid-oogenesis” (CL2). Six out of eight process were enriched among the down-regulated genes in the “pre-spawning” (CL3) females and this included “reproductive process” as well as multiple GO terms linked to organismal and cellular maintenance, such as “response to stress,” “cellular redox homeostasis” and “immune response” (Supplementary Table S3 and Figure 2B). As part of cellular redox homeostasis, expression of genes like glutaredoxin and sulfhydryl oxidase was lower in “pre-spawning” (CL3) and “spawning” (CL4) females compared with females from “diapause” (CL1) and “early to mid-oogenesis” (CL2) (Figure 3B). Expression of two peroxidasins were high in diapause females and continued to be up-regulated in “early to mid-oogenesis” (CL2) compared with “pre-spawning” (CL3) and “spawning” (CL4) females. Relative expression of genes involved in immune response (c-type lectins, a single protein Toll and embryonic polarity dorsal protein) was high in “early to mid-oogenesis” (CL2) compared with “pre-spawning” (CL3) females, and remained low in “spawning” (CL4) females (Figure 3B).
The transition from “early to mid-oogenesis” (CL2) to “pre-spawning” (CL3) included the up-regulation of genes involved in chromatin modification, as shown by the enrichment of two GO terms associated with this process (Supplementary Table S3 and Figure 2B). Significant up-regulation of seven longitudinal-lacking proteins, involved in chromatin condensation was found in “pre-spawning” (CL3) females compared with females from the previous two clusters (Figure 3B). High expression in “pre-spawning” (CL3) females was found also for a single protein MRG15 and a longitudinal-lacking protein although their expression was already high in “early to mid-oogenesis” (CL2) females compared with “diapause” (CL1) ones (Figure 3B). Expression of all these genes continued to be high also in “spawning” (CL4) females (Figure 2C).
Females grouped in CL4 were actively spawning and had been incubated for an average of 8.8 weeks in the lab. Despite the high number of DEGs (>12,000), only two GO terms were enriched in the comparison between “pre-spawning” (CL3) and “spawning” (CL4) females: “regulation of programmed cell death” and “protein ubiquitination” (Figure 2C and Supplementary Table S3). Both processes were enriched among the up-regulated genes. Relative expression of seven genes involved in the “regulation of programmed cell death,” which included several transmembrane BAX proteins, two metacaspases, a single caspase 1, was significantly higher in “spawning” (CL4) females compared with all other clusters (Figure 3B). In contrast, relative expression for the apoptosis inducing factor 3 was high in “early to mid-oogenesis” (CL2) and “pre-spawning” (CL3) females but not in “spawning” (CL4) (Figure 3B).
Regulation of Transcripts Involved in Energy Metabolism
Transitions between clusters were characterized by large changes in the relative expression of genes involved in energy metabolism. The progressive change in expression is shown in a heat map that visualizes how sets of genes associated with specific pathways were up-regulated in one or two clusters (Figure 4). With the exception of PEPCK (Figure 3A), expression of genes involved in energy metabolism was low in “diapause” (CL1) females (Figure 4). The up-regulation of these genes is consistent with an increase in basal metabolism as females emerged from diapause. In addition, the data suggest that females differentially regulated energy sources as they progressed through the reproductive program.
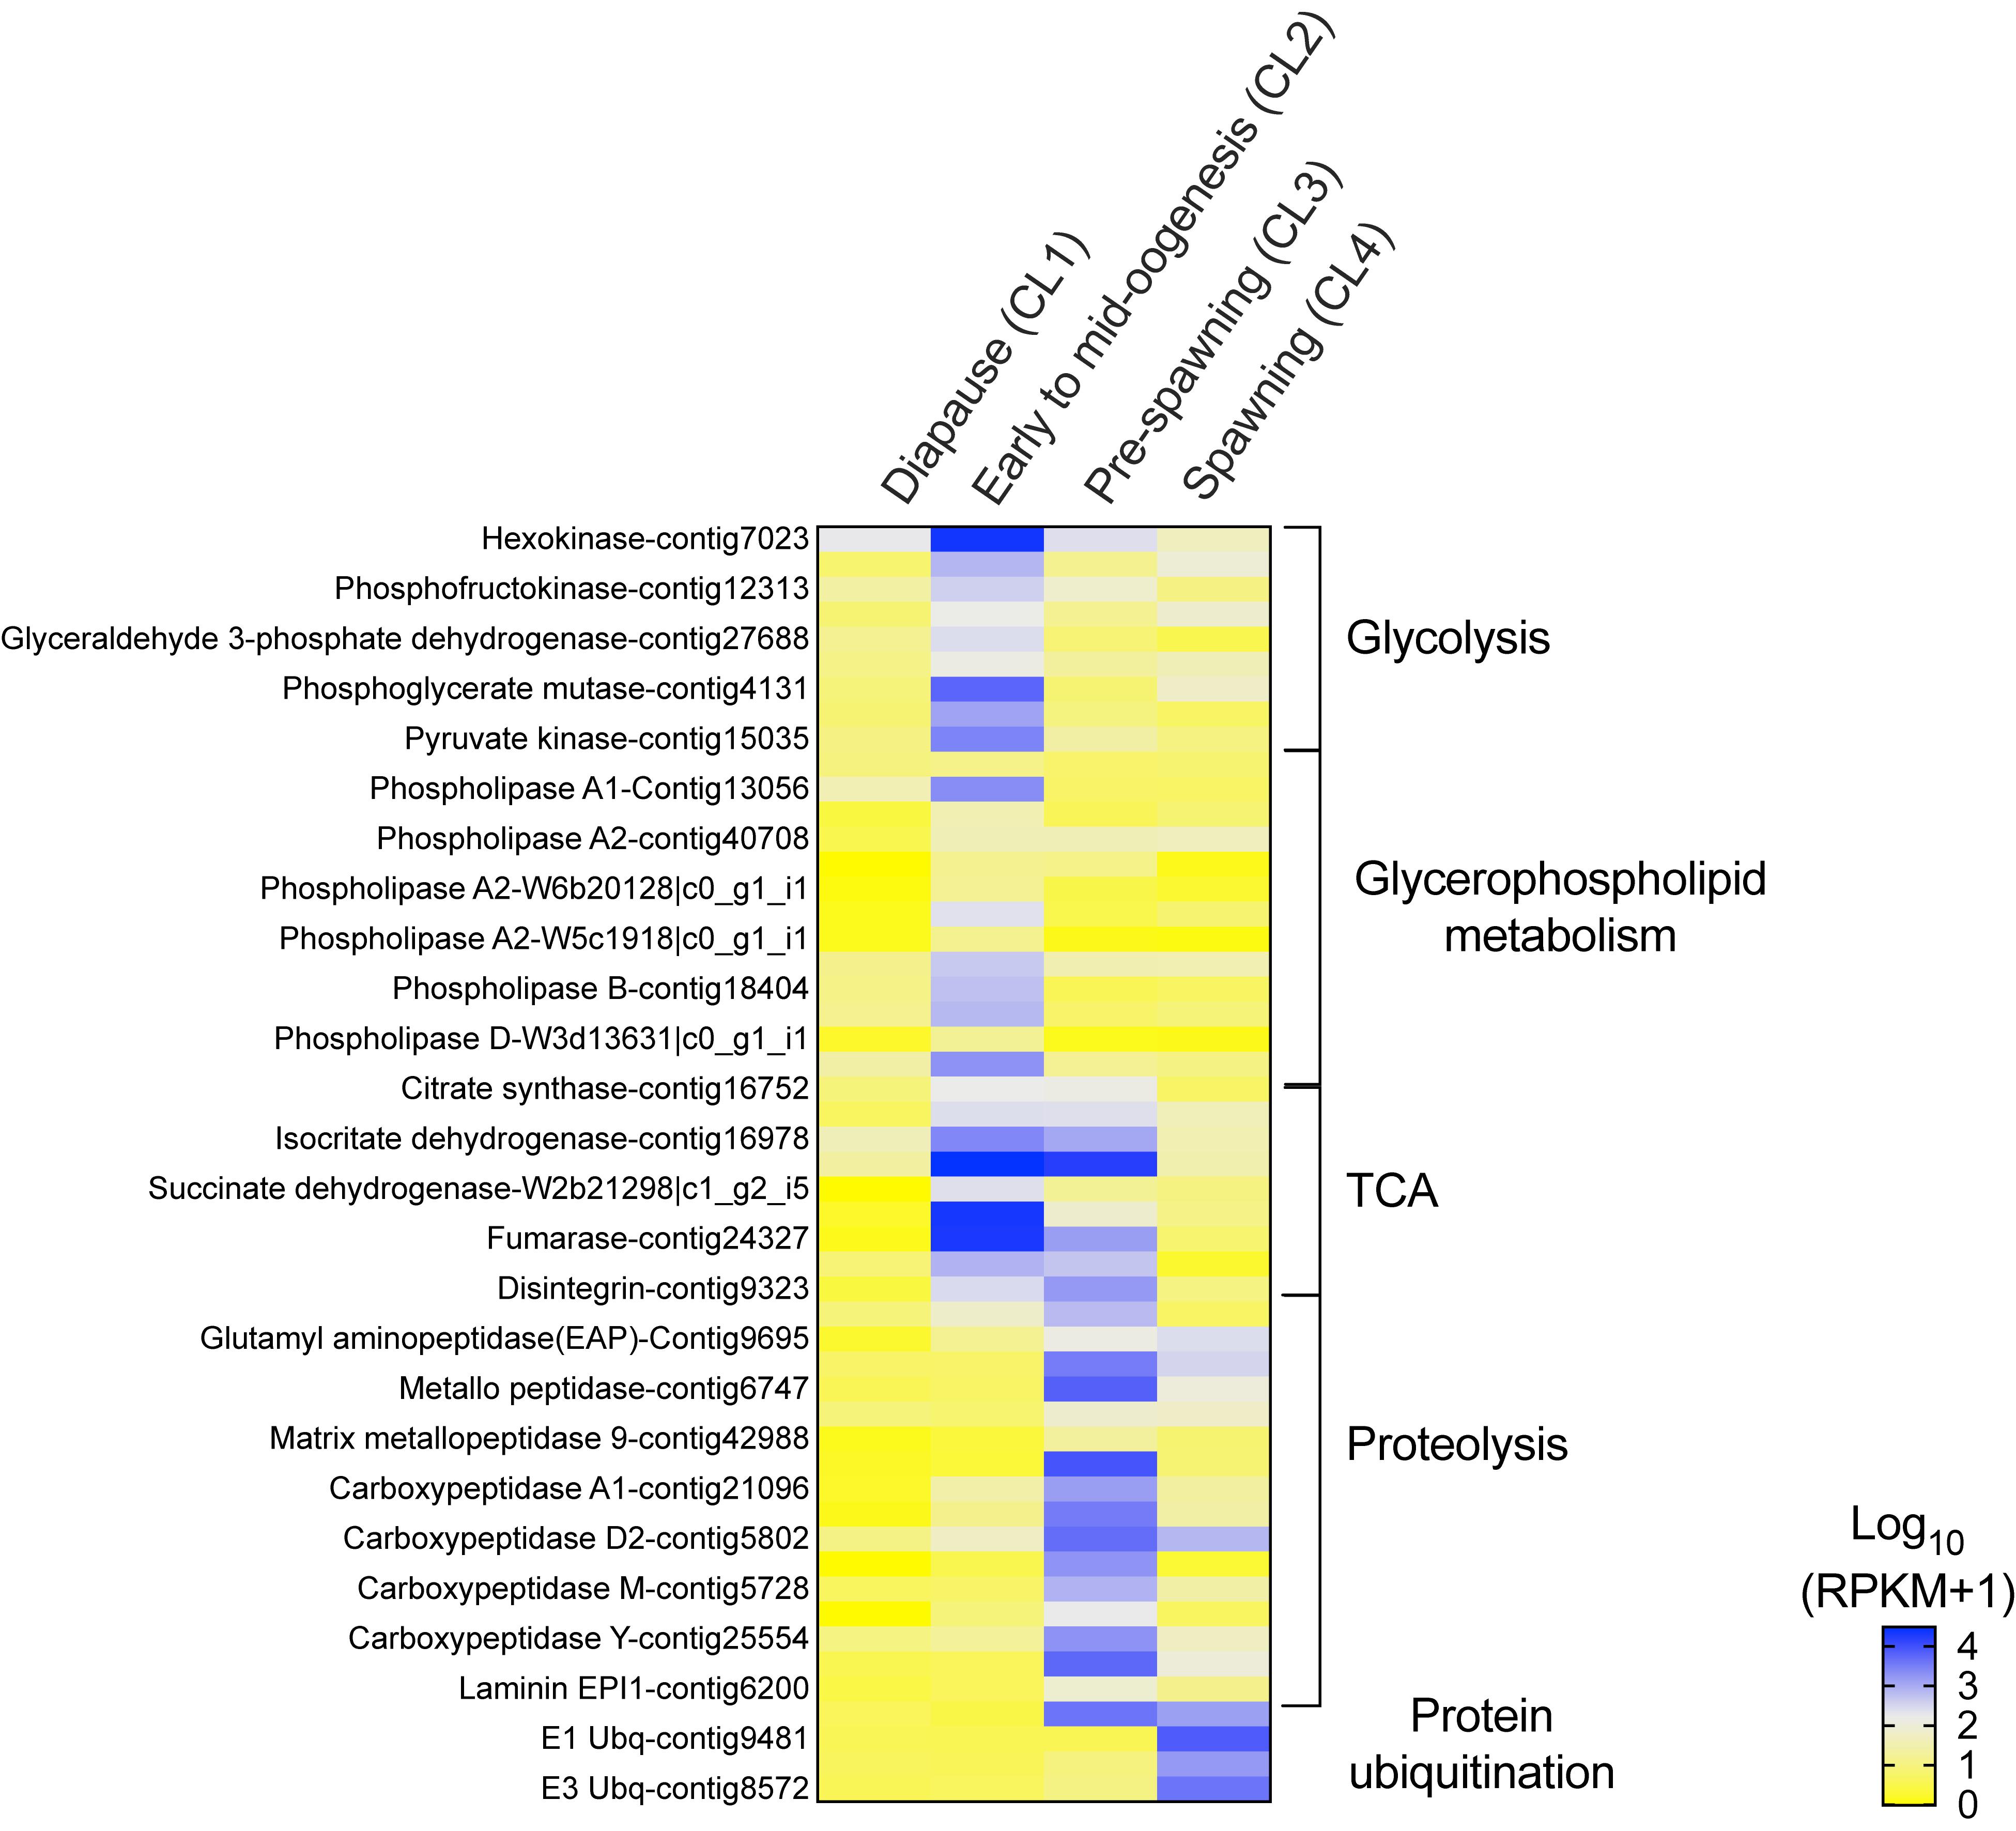
Figure 4. Neocalanus flemingeri relative expression of transcripts involved in energy metabolic process. Heat map of relative expression of target genes associated with energy metabolism involved in the pathways: glycolysis, glycerophospholipid, citric acid cycle (TCA), “proteolysis” [GO:0006508] and “protein ubiquitination” [GO:0016567]. Color-coding for each gene indicates the magnitude of expression as Log10 (RPKM + 1). Columns are ordered by clusters following the grouping in Figure 1 as indicated by the labels (top). Genes were ordered by functional category (right).
The increase in transcriptional activity between “diapause” (CL1) and “early to mid-oogenesis” (CL2) females was marked by high expression of all nine glycolytic enzymes (hexokinase, phosphoglucose isomerase, phosphofructokinase, fructose-bisphosphate aldolase, glyceraldehyde 3-phosphate dehydrogenase, phosphoglycerate kinase, phosphoglycerate mutase, enolase and pyruvate kinase), which were significantly higher in CL2 females compared with those in all other clusters (Figure 4). A similar pattern was observed in the expression of genes involved in glycerophospholipid metabolism, an enriched pathway. Relative expression of 12 phospholipases (class A1, A2, B) and a single monoacylglycerol lipase (MGL) was significantly higher in “early to mid-oogenesis” (CL2) females compared with all other clusters (Figure 4). Females within the ‘early to mid-oogenesis’ (CL2) cluster were also characterized by the up-regulation of genes involved in the citric cycle (TCA), which regulates metabolic rate (Figure 4). The eight TCA enzymes, citrate synthase, aconitase, isocitrate dehydrogenase, α-ketoglutarate dehydrogenase, succinyl-CoA synthetase, succinate dehydrogenase, fumarase, malate dehydrogenase and citrate synthase, were up-regulated in “early to mid-oogenesis” (CL2) and “pre-spawning” (CL3) females in comparison with both “diapause” (CL1) and “spawning” (CL4) ones (Figure 4).
The significant high expression of 17 proteolytic genes such as carboxypeptidases, metallo-peptidases and amino peptidases in “pre-spawning” (CL3) females compared with all other clusters, is consistent with the proteolysis signal identified by enrichment analysis. Eleven genes were exclusively differentially expressed in ‘pre-spawning’ (CL3) females, and these included carboxypeptidases (6 of 7), three proteases (ADAM, cysteine, serine easter), a single laminin, and matrix metallo-peptidase 9 (Figure 4). Two aminopeptidases two metallo-peptidases and a single carboxypeptidase D2 were up-regulated in “pre-spawning” (CL3) and “spawning” (CL4) females, although relative expression of these genes tended to be lower in CL4 females compared with CL3 ones. A single disintegrin was highly expressed in “pre-spawning” (CL3) females as well as “early to mid-oogenesis” (CL2) and “spawning” (CL4) females (Figure 4).
The expression pattern of ‘spawning’ (CL4) females was distinct from all others: relative expression of most of the genes involved in energy metabolism was either low or intermediate with the exception of the high expression found for genes involved in ubiquitination (Figure 4). Relative expression of E1, E2, and E3 ubiquitins was significantly higher in “spawning” (CL4) females compared with expression in “diapause” (CL1), “early to mid-oogenesis” (CL2) and “pre-spawning” (CL3) (Figure 4). An exception to this pattern, the E3 ubiquitin-protein ligase ARIH1, which catalyzes ubiquitination of target proteins together with ubiquitin-conjugating enzymes, was highly expressed in both pre- and spawning females (CL3 and CL4) (Figure 4).
Transitions During Spawning and End-of-Life
The “spawning” and “end of life” phases comprising of females in CL4a (n = 8), CL4b (n = 3) and CL5 (n = 2) were analyzed separately to elucidate transcriptional transitions that occurred during the release of multiple clutches of eggs (CL4a, CL4b) and post-reproduction (CL5) (Figure 1). A total of 2,023 DEGs were identified among the females in the three clusters (GLM) with more than 700 DEGs identified between CL4a and CL4b and CL4a and CL5 and 583 DEGs between CL4b and Cl5 (Supplementary Table S2). Four GO terms were enriched among the DEGs (Figure 5A). Two of the GO terms, “positive regulation of programmed cell death” and “protein ubiquitination,” were also enriched in the transition between “pre-spawning” (CL3) and “spawning” (CL4) females (Figure 3B), while the other two GO terms were specific to transcriptional changes among clusters in the late branch (“phosphorylation” and “phosphate-containing compound metabolic process”; Figure 5A). Relative expression of genes involved in these processes is shown in Figure 5B. For comparison, this figure also includes relative expression of these genes in “pre-spawning” (CL3) females (first column on left). The transition between CL4a and CL4b females was characterized by an overall decrease in the expression of genes involved in phosphorylation (e.g., casein kinase, CaM kinase, aurora kinase), cellular integrity [collagen alpha-2, phosphatidylinositol-3,5-bisphosphate 3-phosphatases (ptdlns)] and cellular redox homeostasis (GSH synthetase and DnaJ homolog C16). With the exception of a single flotillin (structural integrity), all genes shared a similar pattern of expression: low expression in “pre-spawning” (CL3), significant up-regulation in CL4a, followed by lower expression in CL4b, which decreased even further in CL5.
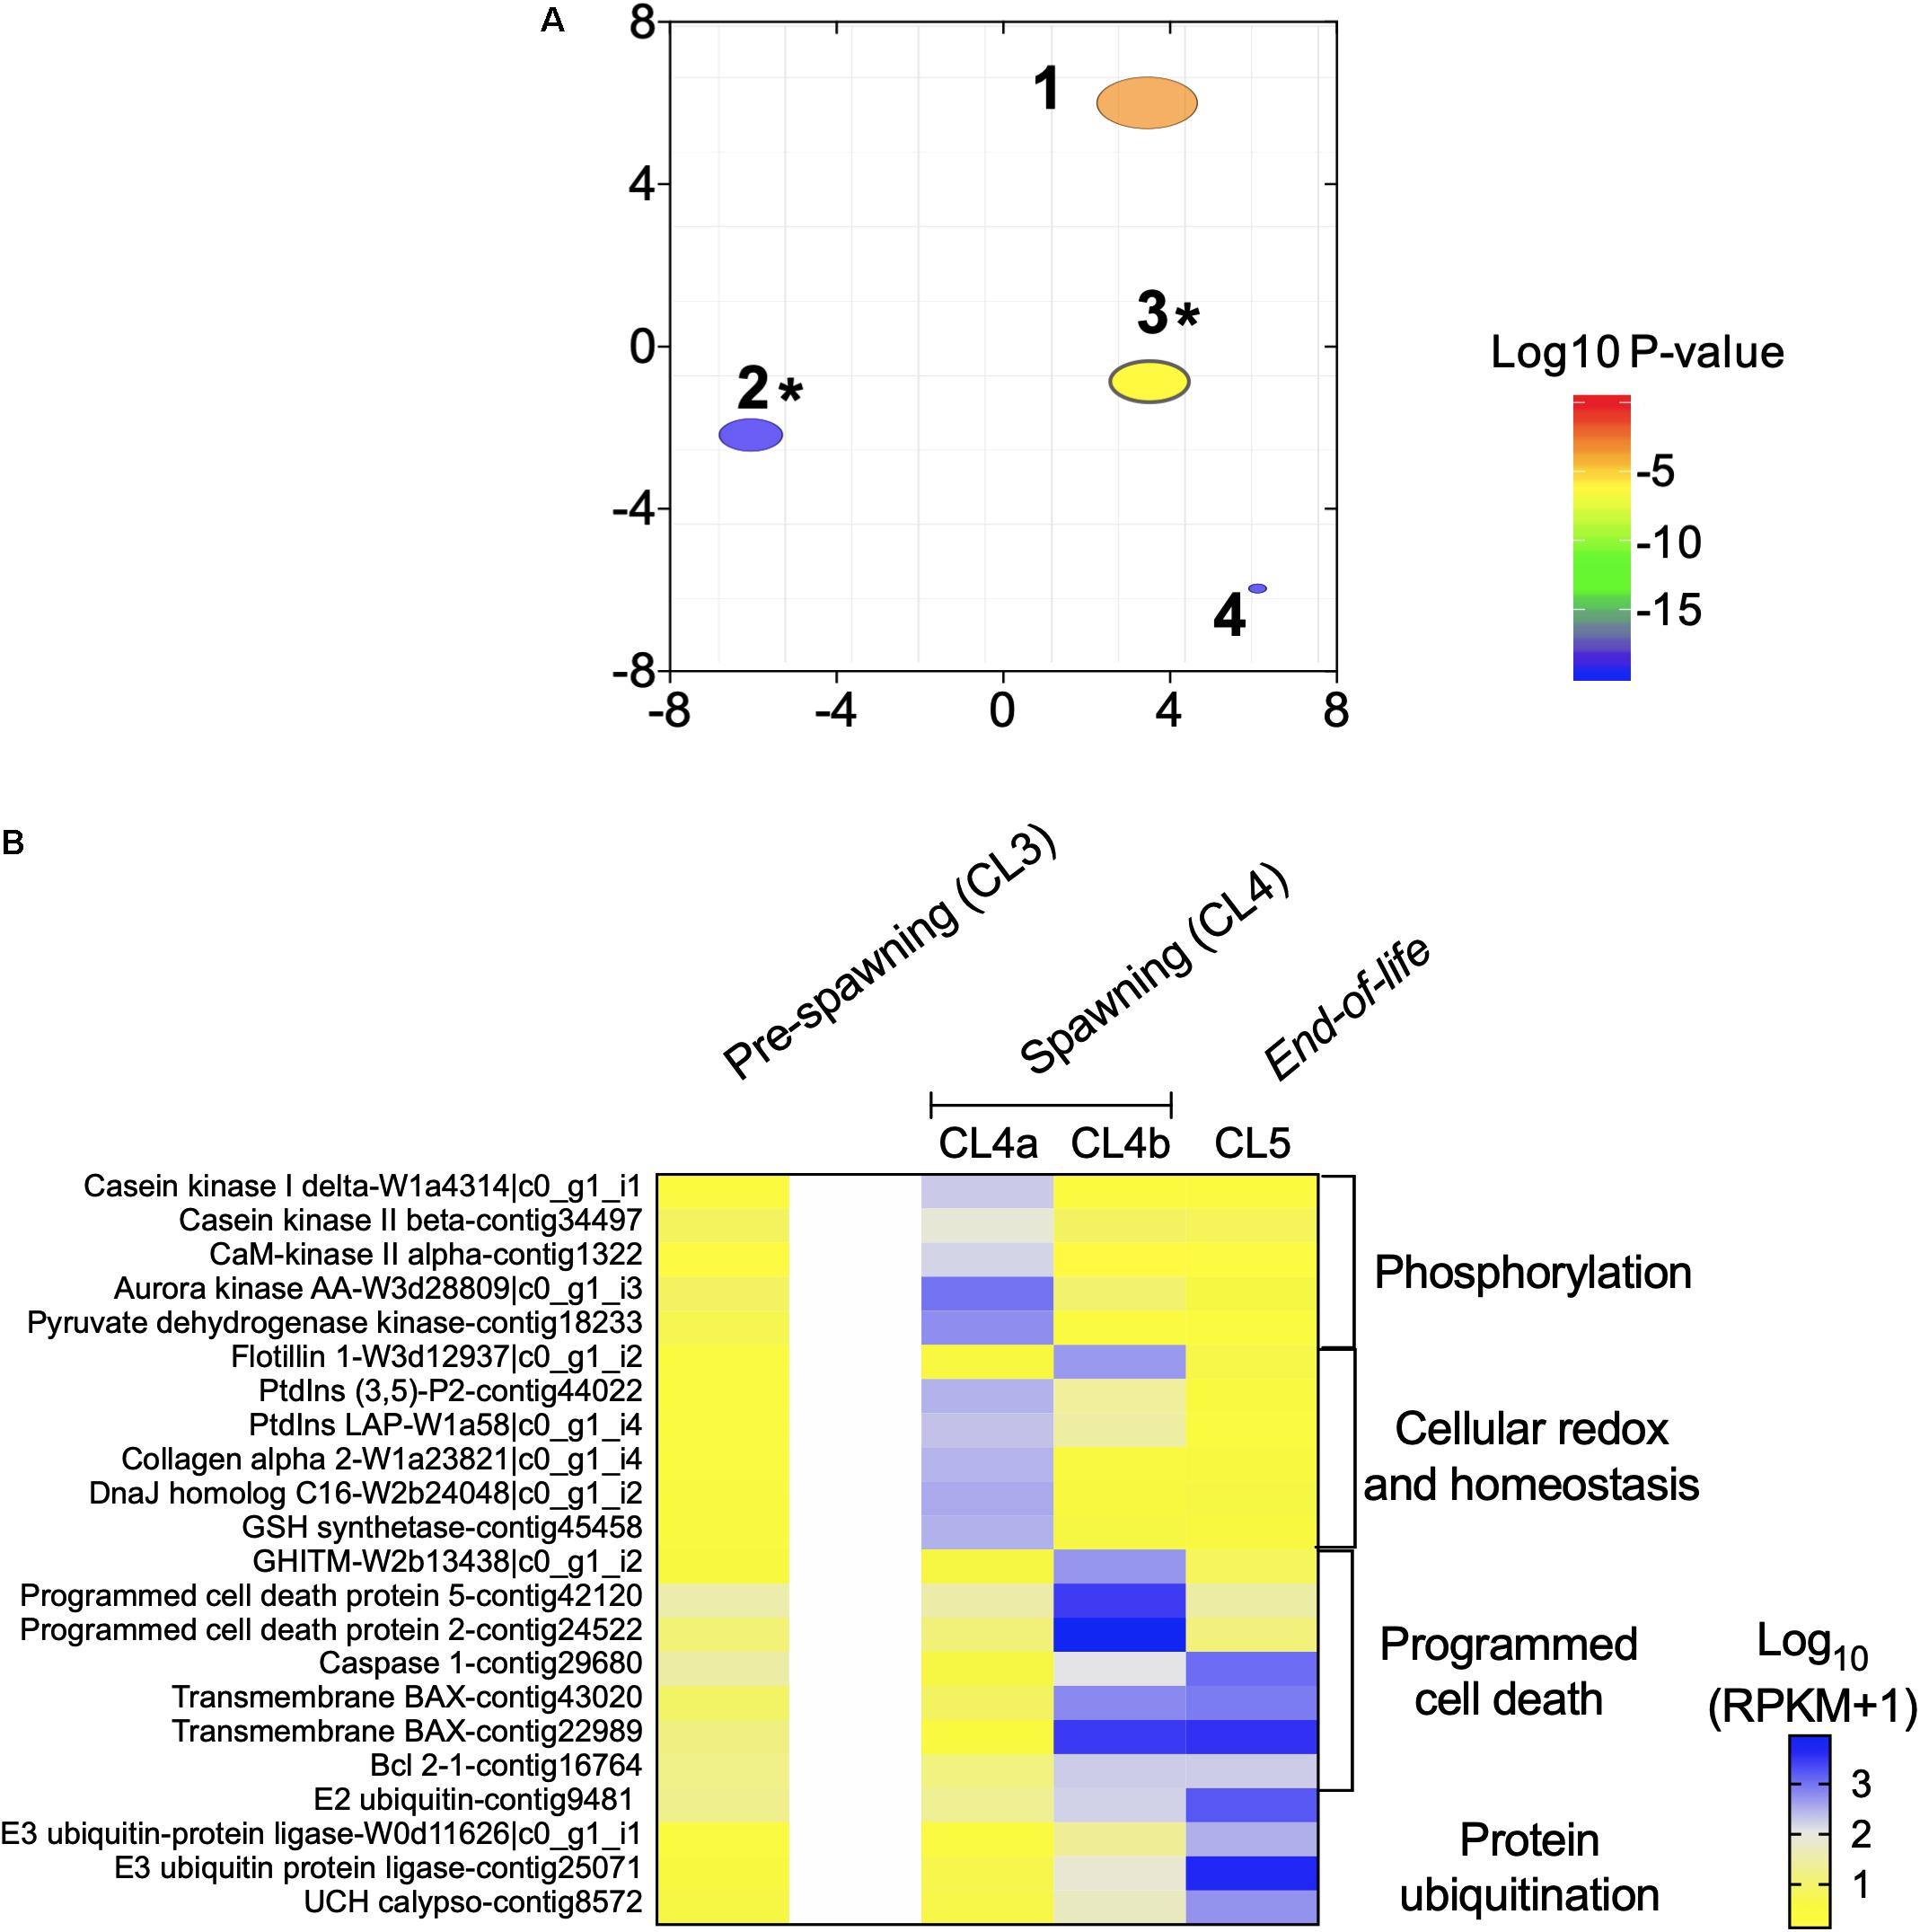
Figure 5. “End of life transition” in Neocalanus flemingeri. (A) ReviGO semantic analysis of the enriched GO terms represented among the DEGs identified in the “end of life” transition by generalized linear model followed by pairwise likelihood ratio tests. Annotations: 1 “phosphorylation” [GO:0016310], 2 “positive regulation of programmed cell death” [GO:0043068], 3 “protein ubiquitination” [GO:0016567], 4 “phosphate-containing compound metabolic process” [GO:0006796]. *Marks GO terms that were also enriched in the previous comparisons (Figure 2C). (B) Heat map of relative expression of target genes associated with end of life involved in the processes: “phosphorylation” [GO:0016310], “cellular homeostasis” [GO:0045454], “programmed cell death” [GO:0043068] and “protein ubiquitination” [GO:0016567]. Color-coding for each gene indicates the magnitude of expression as Log10 (RPKM + 1). Columns are ordered by clusters following the grouping in Figure 1 as indicated by the labels (top). Genes were ordered by functional category (right).
The transition between CL4a and CL4b was characterized by the up-regulation of genes involved in “programmed cell death” (Figure 5B). Two programmed cell-death proteins (2, 5), and a growth hormone-inducible transmembrane protein were significantly up-regulated in CL4b compared with CL4a and CL5 females (relative expression: CL4b > CL5 > CL4a) (Figure 5B). Relative expression of four other genes involved in this process were lower in CL4a compared with Cl4b and Cl5, and this difference was significant (Figure 5B). Genes involved in “protein ubiquitination,” which characterized the transition between “pre-spawning” (CL3) and “spawning” (CL4) females (Figure 3B) became increasingly up-regulated with cluster number (Figure 5B). Relative expression of all four genes, E3 ubiquitin ligase, E2 conjugating enzyme and ubiquitin carboxyl-terminal hydrolase calypso was low in CL4a females in comparison with CL4b ones, which was followed by another increase in expression in CL5 females (Figure 5B).
Discussion
Post-embryonic diapause in calanoid copepods is similar to that of other arthropods: lipid stores are accumulated during the preparatory phase and used as an energy source during the dormant period (Hirche, 1996; Baumgartner and Tarrant, 2017; Lenz and Roncalli, 2019). While most copepods resume feeding post-diapause, N. flemingeri is a capital-breeder and depends on lipid stores that are accumulated during the immature stages (copepodids CII to CV) (Tsuda et al., 2001). The energy acquired during development fuels the entire adult life span (mating, diapause, oogenesis, and spawning) and the first two non-feeding naupliar stages (NI and NII) (Miller and Clemons, 1988). Progression toward egg maturation in the females occurs through the sequential activation of genes that regulate different stages of oogenesis over a period of 7 weeks prior to spawning (Roncalli et al., 2018b).
As a capital breeder, N. flemingeri females have to choose between organismal function and egg production when allocating finite resources. The gene expression patterns described here provide the first analysis of how the species manages the trade-off between organism maintenance and oogenesis physiologically and how this changes with the egg maturation process. The key results of this study are: (1) the identification of major transitions in transcriptional profiles during post-diapause; and (2) the characterization of these transitions through functional analysis. Transcriptional changes suggest that the post-feeding stage is dynamic: N. flemingeri females invest in cellular maintenance during early mid oogenesis, however, this investment decreases as oogenesis progresses toward the spawning phase. The transitions coincide with changes in the expression of genes involved in energy metabolism as well as down-regulation of genes involved in cellular homeostasis and immune response and up-regulation of genes involved in protein degradation.
Neocalanus flemingeri females collected from depth (>400 m, Wk0, CL1) were in a state of developmental arrest and low metabolic activity as indicated by their behavior and gene expression profile (Roncalli et al., 2018b; Lenz and Roncalli, 2019). Ontogenetic migration occurs in June, and at the time of collection (late September), these females had been in diapause for 2 to 3 months (Miller and Clemons, 1988). Consistent with expression profiles of diapausing insects (e.g., D. melanogaster, Bombyx mori, Culex pipiens) (Hahn and Denlinger, 2011), genes involved in transcription and translation, DNA metabolism and reproduction were down-regulated, while genes involved in oxidative stress resistance and those linked to increased life spans were up-regulated (this study, Roncalli et al., 2018b). Although data are limited, lifespan in diapausing copepods within the family Calanidae is typically double when compared with direct developing individuals of the same species (Lenz and Roncalli, 2019). In insects, delay of senescence is regulated through the up-regulation of ‘pro-longevity’ genes like embryonic lethal, abnormal vision, and cheerio) in combination with down-regulation of anti-longevity genes (e.g., edem 1, sirtuin 6) (Kubrak et al., 2014; Kučerová et al., 2016). Similar expression patterns of these types of genes were observed in diapausing N. flemingeri.
Emergence from diapause and the activation of the reproductive machinery characterizes the transition from “diapause” (CL1 females) to “early to mid-oogenesis” (CL2). Activation of the reproductive program in these females involved the up-regulation of genes involved in germline formation, DNA binding and cell differentiation (Roncalli et al., 2018b), genes that are typically associated with the very early stages of oogenesis in D. melanogaster (Jagut et al., 2013). Similar to insect pupae emerging from diapause, N. flemingeri females in CL2 showed up-regulation of several genes associated with diapause termination (e.g., PCNA, CDK1, AMPK; Ragland et al., 2011), and an increase in metabolic rate as suggested by the up-regulation of genes involved in the TCA cycle and glycolysis. The up-regulation of genes involved in cellular homeostasis and response to stress suggests that “early to mid-oogenesis” (CL2) females were metabolically active and investing in organism maintenance.
Major changes in relative gene expression related to reproduction, organism maintenance and source of energy occurred in the transition between “early to mid-oogenesis” (CL2) and “pre-spawning” (CL3) females. With an average of 6.5 weeks post-collection, females in CL3 have transitioned into mid to late oocyte development, but none have spawned (Roncalli et al., 2018b). Gene expression signals related to the reproductive program include the up-regulation of processes associated with accumulation of yolk and lipid vesicles (vitellogenesis-2) and late egg formation in combination with the down-regulation of genes associated with the formation of oogonia and early oogenesis (Roncalli et al., 2018b). This is in contrast to most calanoid copepods, where all stages of oogenesis are present simultaneously within sexually mature females, even in those that undergo a period of diapause before becoming mature (Eckelbarger and Blades-Eckelbarger, 2005; Niehoff, 2007).
In “pre-spawning” (CL3) females, the cost of reproduction may be competing with other organismal processes for finite resources. The down-regulation of basal processes during late oogenesis suggests a reallocation of energy away from cellular maintenance to meet the high costs involved in the accumulation of lipid and yolk vesicles in the oocytes, which occurs during vitellogenesis-2 (Blades-Eckelbarger and Youngbluth, 1984; Tsukimura, 2001). Genes involved in cellular homeostasis, signal transduction, immune system and muscle contraction were down-regulated in CL3 females compared with those from the two earlier clusters. Furthermore, the up-regulation of genes involved in proteolysis suggests that females were switching to protein degradation to meet energetic needs. In contrast, other diapausing arthropods, including the calanid copepods such as C. finmarchicus minimize protein degradation by relying on new resources to complete the late stages of oogenesis (Niehoff et al., 2002; Zhou and Miesfeld, 2009; Hahn and Denlinger, 2011).
During spawning (CL4), reproductive genes were increasingly down-regulated, while genes involved in basal activities (e.g., cellular homeostasis, signal transduction, immune response and muscle contraction) were even more down-regulated than in “pre-spawning” (CL3) females. Proteins were the most important source of energy in these females as indicated by the up-regulation of genes involved in proteolysis and ubiquitination, concurrent with low expression of genes encoding enzymes involved in the TCA cycle, glycolysis and lipid catabolism. During reproduction, protein catabolism is activated in order to produce amino acids which can be directly used to support embryo development (e.g., egg yolk) or can be converted to glucose via gluconeogenesis when other resources are insufficient (Lourdais et al., 2013; Brusch et al., 2018). Furthermore, activation of the ubiquitin-proteasome system is associated with decreases in muscle activity and muscle mass and is indicative of muscle loss (Lourdais et al., 2013). A similar pattern was observed in “spawning” (CL4) females: down-regulation of genes involved in muscle contraction co-occurred with the up-regulation of the ubiquitin-proteasome system most likely to provide energy and nutrients required for final steps in maturation and spawning. The up-regulation of genes involved in programmed cell death characterized all females in this cluster, and this signature response was even more up-regulated in two post-reproductive females (CL5).
The protein degradation signal in spawning and post-reproductive females is consistent with visual observations: in their final days, females appear as relatively empty husks, often lacking the muscles required to fully push out the final clutch of eggs (personal observation; Miller and Clemons, 1988). The degree to which autophagy converts female tissue into matter and energy for provisioning of the eggs is striking, and consistent with data on N. flemingeri fecundity (Saito and Tsuda, 2000). Based on these authors’ measurements of carbon content and total fecundity, N. flemingeri females transform ca. 70% of their body carbon into eggs.
In conclusion, N. flemingeri accumulates resources in a highly heterogeneous environment with a narrow 3-month window to store sufficient capital for diapause and reproduction (Mackas and Coyle, 2005; Coyle et al., 2019). Diapausing calanid copepods, including N. flemingeri females range in size and in their lipid-sac volumes (Saito and Tsuda, 2000; Jónasdóttir et al., 2019). However, low mortality throughout the incubation period of 9.5 weeks suggests that N. flemingeri females even with fewer stored resources are able to complete the reproductive program albeit at lower fecundity. Thus, in order to assure maturation of the eggs, the females have to fine tune the number of eggs that they can provision adequately. Two possible mechanisms might involve: (1) regulating the provisioning of oogonia by laying clutches as distinct events, or (2) limiting the number of oogonia produced by linking germline development to resource levels at emergence from diapause. These alternate hypotheses lead to different predictions with respect to the number and timing of oogonia production, that are currently being tested. However, in either case, a mechanism that regulates fecundity to a female’s stored resources would contribute to the resilience and success of this species by minimizing reproductive failure, even when pre-diapause conditions are non-optimal leading to smaller females with smaller lipid sacs and lower fecundity.
Data Availability Statement
The datasets for this study can be found as raw short sequence on NCBI; BioProject: PRJNA324453. The shotgun assembly used as reference transcriptome in the article is available under the accession GFUD00000000 (PRJNA324453). The list of differentially expressed genes with their relative expression as RPKM (Log2) is included in the supplementary information files (Supplementary Table S4).
Author Contributions
VR, PL, and RH conceived the study. VR, PL, and RH performed the experiments. VR, PL, and RH interpreted the data, and wrote and reviewed the manuscript. All authors approved the final manuscript.
Funding
This research was supported by the National Science Foundation Grant OCE-1459235 to PL and Andrew E. Christie and Grant OCE-1459826 to RH. Additional support was provided by the National Science Foundation NCGAS under Grant Nos. DBI-1458641 and ABI-1062432 to Indiana University. Seward Line core activities was supported by a consortium of the North Pacific Research Board, the Alaska Ocean Observing System, and the Exxon Valdez Oil Spill Trustee Council (through Gulf Watch Alaska). The views expressed herein are those of the authors and do not reflect the views of the funding agencies.
Conflict of Interest
The authors declare that the research was conducted in the absence of any commercial or financial relationships that could be construed as a potential conflict of interest.
Acknowledgments
We would like to thank D. K. Hartline and L. Hata from the University of Hawai‘i at Mānoa, C. Clarke-Hopcroft and C. Smoot from University of Alaska Fairbanks, and M. Belanger and R. Nilsen from the Georgia Genomics Facility at the University of Georgia. We would also like to thank the science party and the crew of the USFWS R/V Tiglax for at sea support and assistance with collections.
Supplementary Material
The Supplementary Material for this article can be found online at: https://www.frontiersin.org/articles/10.3389/fmars.2020.00056/full#supplementary-material
Footnotes
References
Alexa, A., and Rahnenfuhrer, J. (2010). TopGO: Enrichment Analysis for Gene Ontology. R package Version 2.
Ashburner, M., Ball, C. A., Blake, J. A., Botstein, D., Butler, H., Cherry, J. M., et al. (2000). Gene ontology: tool for the unification of biology. Nat. Genet. 25:25.
Baker, D. A., and Russell, S. (2009). Gene expression during Drosophila melanogaster egg development before and after reproductive diapause. BMC Genomics 10:242. doi: 10.1186/1471-2164-10-242
Baumgartner, M. F., and Tarrant, A. M. (2017). The physiology and ecology of diapause in marine copepods. Annu. Rev. Mar. Sci. 9, 387–411. doi: 10.1146/annurev-marine-010816-060505
Blades-Eckelbarger, P. I., and Youngbluth, M. J. (1984). The ultrastructure of oogenesis and yolk formation in Labidocera aestiva (Copepoda: Calanoida). J. Morphol. 179, 33–46. doi: 10.1002/jmor.1051790105
Bray, N. L., Pimentel, H., Melsted, P., and Pachter, L. (2016). Near-optimal probabilistic RNA-seq quantification. Nat. Biotechnol. 34:525. doi: 10.1038/nbt.3519
Brusch, G. A., Lourdais, O., Kaminsky, B., and De Nardo, D. F. (2018). Muscles provide an internal water reserve for reproduction. Proc. R. Soc. B 285:20180752. doi: 10.1098/rspb.2018.0752
Coyle, K. O., Hermann, A. J., and Hopcroft, R. R. (2019). Modeled spatial-temporal distribution of productivity, chlorophyll, iron and nitrate on the northern Gulf of Alaska shelf relative to field observations. Deep Sea Res. II 165, 163–191. doi: 10.1016/j.dsr2.2019.05.006
Denlinger, D. L. (1991). “Relationship Between Cold Hardiness and Diapause,” In Insects at low temperature, eds R. E. Lee and D. L. Denlinger (Boston, MA: Springer), 174–198. doi: 10.1007/978-1-4757-0190-6_8
Denlinger, D. L., and Armbruster, P. A. (2014). Mosquito diapause. Annu. Rev. Entomol. 59, 73–93. doi: 10.1146/annurev-ento-011613-162023
Eckelbarger, K. J., and Blades-Eckelbarger, P. I. (2005). Oogenesis in calanoid copepods. Invertebr. Reprod. Dev. 47, 167–181. doi: 10.1080/07924259.2005.9652157
Hahn, D. A., and Denlinger, D. L. (2011). Energetics of insect diapause. Annu. Rev. Entomol. 56, 103–121. doi: 10.1146/annurev-ento-112408-085436
Hirche, H. J. (1996). Diapause in the marine copepod. Calanus finmarchicus—a review. Ophelia 44, 129–143. doi: 10.1080/00785326.1995.10429843
Jagut, M., Mihaila-Bodart, L., Molla-Herman, A., Alin, M. F., Lepesant, J. A., and Huynh, J. R. (2013). A mosaic genetic screen for genes involved in the early steps of Drosophila oogenesis. G3: Genes Genom. Genet. 3, 409–425. doi: 10.1534/g3.112.004747
Jónasdóttir, S. H., Wilson, R. J., Gislason, A., and Heath, M. R. (2019). Lipid content in overwintering Calanus finmarchicus across the Subpolar Eastern North Atlantic Ocean. Limnol. Oceanogr. 64, 2029–2043. doi: 10.1002/lno.11167
Kronja, I., Whitfield, Z. J., Yuan, B., Dzeyk, K., Kirkpatrick, J., Krijgsveld, J., et al. (2014). Quantitative proteomics reveals the dynamics of protein changes during Drosophila oocyte maturation and the oocyte-to-embryo transition. Proc. Natl. Acad. Sci. U.S.A. 111, 16023–16028. doi: 10.1073/pnas.1418657111
Kubrak, O. I., Kučerová, L., Theopold, U., and Nässel, D. R. (2014). The sleeping beauty: how reproductive diapause affects hormone signaling, metabolism, immune response and somatic maintenance in Drosophila melanogaster. PloS One 9:e113051. doi: 10.1371/journal.pone.0113051
Kučerová, L., Kubrak, O. I., Bengtsson, J. M., Strnad, H., Nylin, S., Theopold, U., et al. (2016). Slowed aging during reproductive dormancy is reflected in genome-wide transcriptome changes in Drosophila melanogaster. BMC Genomics 17:50. doi: 10.1186/s12864-016-2383-1
Lenz, P. H., and Roncalli, V. (2019). Diapause within the context of life-history strategies in calanid copepods (Calanoida: Crustacea). Biol. Bull. 237, 1700–179. doi: 10.1086/705160
Liu, H., and Hopcroft, R. R. (2006). Growth and development of Neocalanus flemingeri/plumchrus in the northern Gulf of Alaska: validation of the artificial-cohort method in cold waters. J. Plankton Res. 28, 87–101. doi: 10.1093/plankt/fbi102
Lourdais, O., Lorioux, S., and De Nardo, D. F. (2013). Structural and performance costs of reproduction in a pure capital breeder, the children’s python Antaresia childreni. Physiol. Biochem. Zool. 86, 176–183. doi: 10.1086/669127
Mackas, D. L., and Coyle, K. O. (2005). Shelf–offshore exchange processes, and their effects on mesozooplankton biomass and community composition patterns in the northeast Pacific. Deep Sea Res. Part II 52, 707–725. doi: 10.1016/j.dsr2.2004.12.020
Mansingh, A. (1974). Studies on insect dormancy. II. Relationship of cold-hardiness to diapause and quiescence in the eastern tent caterpillar, Malacosoma americanum (Fab.)(Lasiocampidae: Lepidoptera). Can. J. Zool. 52, 629–637. doi: 10.1139/z74-080
Miller, C. B., and Clemons, M. J. (1988). Revised life history analysis for large grazing copepods in the subarctic Pacific Ocean. Progr. Oceanogr. 20, 293–313. doi: 10.1016/0079-6611(88)90044-4
Mortazavi, A., Williams, B. A., McCue, K., Schaeffer, L., and Wold, B. (2008). Mapping and quantifying mammalian transcriptomes by RNA-Seq. Nat. Methods 5, 621. doi: 10.1038/nmeth.1226
Müllner, D. (2013). Fastcluster: fast hierarchical, agglomerative clustering routines for R and Python. J. Stat. Softw. 53, 1–8.
Niehoff, B. (2007). Life history strategies in zooplankton communities: the significance of female gonad morphology and maturation types for the reproductive biology of marine calanoid copepods. Progr. Oceanogr. 74, 1–47. doi: 10.1016/j.pocean.2006.05.005
Niehoff, B., and Hirche, H. J. (1996). Oogenesis and gonad maturation in the copepod Calanus finmarchicus and the prediction of egg production from preserved samples. Polar Biol. 16, 601–612. doi: 10.1007/s003000050095
Niehoff, B., Madsen, S., Hansen, B., and Nielsen, T. (2002). Reproductive cycles of three dominant Calanus species in Disko Bay. West Greenland. Mar. Biol. 140, 567–576. doi: 10.1007/s00227-001-0731-3
Niehoff, B., and Runge, J. A. (2003). A revised methodology for prediction of egg production Calanus finmarchicus from preserved samples. J. Plankton Res. 25, 1581–1587. doi: 10.1093/plankt/fbg104
Ragland, G. J., Egan, S. P., Feder, J. L., Berlocher, S. H., and Hahn, D. A. (2011). Developmental trajectories of gene expression reveal candidates for diapause termination: a key life-history transition in the apple maggot fly Rhagoletis pomonella. J. Exp. Biol. 214, 3948–3960. doi: 10.1242/jeb.061085
Robinson, M. D., McCarthy, D. J., and Smyth, G. K. (2010). EdgeR: a Bioconductor package for differential expression analysis of digital gene expression data. Bioinformatics 26, 139–140. doi: 10.1093/bioinformatics/btp616
Roncalli, V., Cieslak, M. C., Germano, M., Hopcroft, R. R., and Lenz, P. H. (2019). Regional heterogeneity impacts gene expression in the sub-arctic zooplankter Neocalanus flemingeri in the northern Gulf of Alaska. Commun. Biol. 2:324.
Roncalli, V., Cieslak, M. C., Sommer, S. A., Hopcroft, R. R., and Lenz, P. H. (2018a). De novo transcriptome assembly of the calanoid copepod Neocalanus flemingeri: a new resource for emergence from diapause. Mar. Genom. 37, 114–119. doi: 10.1016/j.margen.2017.09.002
Roncalli, V., Sommer, S. A., Cieslak, M. C., Clarke, C., Hopcroft, R. R., and Lenz, P. H. (2018b). Physiological characterization of the emergence from diapause: a transcriptomics approach. Sci. Rep. 8:12577. doi: 10.1038/s41598-018-30873-0
Saito, H., and Tsuda, A. (2000). Egg production and early development of the subarctic copepods Neocalanus cristatus. N. plumchrus and N. flemingeri. Deep Sea Res. I 47, 2141–2158. doi: 10.1016/s0967-0637(00)00017-0
Sim, C., and Denlinger, D. L. (2009). Transcription profiling and regulation of fat metabolism genes in diapausing adults of the mosquito Culex pipiens. Physiol. Genomics. 39, 202–209. doi: 10.1152/physiolgenomics.00095.2009
Stearns, S. C. (2000). Life history evolution: successes, limitations, and prospects. Naturwissenschaften 87, 476–486. doi: 10.1007/s001140050763
Strom, S. L., Olson, M. B., Macri, E. L., and Mordy, C. W. (2006). Cross-shelf gradients in phytoplankton community structure, nutrient utilization, and growth rate in the coastal Gulf of Alaska. Mar. Ecol. Progr. Ser. 328, 75–92. doi: 10.3354/meps328075
Supek, F., Bošnjak, M., Škunca, N., and Šmuc, T. (2011). ReviGO summarizes and visualizes long lists of gene ontology terms. PloS one 6:e21800. doi: 10.1371/journal.pone.0021800
Tatar, M., and Yin, C. M. (2001). Slow aging during insect reproductive diapause: why butterflies, grasshoppers and flies are like worms. Exp. Geront. 36, 723–738. doi: 10.1016/s0531-5565(00)00238-2
Tsuda, A., Saito, H., and Kasai, H. (2001). Geographical variation of body size of Neocalanus cristatus, N. plumchrus and N. flemingeri in the subarctic Pacific and its marginal seas: implications for the origin of large form of N. flemingeri in the Oyashio area. J. Oceanogr. 57, 341–352.
Tsukimura, B. (2001). Crustacean vitellogenesis: its role in oocyte development. Am. Zool. 41, 465–476. doi: 10.1093/icb/41.3.465
Waite, J. N., and Mueter, F. J. (2013). Spatial and temporal variability of chlorophyll-a concentrations in the coastal Gulf of Alaska, 1998–2011, using cloud-free reconstructions of SeaWiFS and MODIS-Aqua data. Progr. Oceanogr. 116, 179–192. doi: 10.1016/j.pocean.2013.07.006
Williams, G. C. (1966). Natural selection, the costs of reproduction, and a refinement of Lack’s principle. Amer. Nat. 100, 687–690. doi: 10.1086/282461
Yu, G., Wang, L. G., Han, Y., and He, Q. Y. (2012). ClusterProfiler: an R package for comparing biological themes among gene clusters. Omics 16, 284–287. doi: 10.1089/omi.2011.0118
Keywords: Neocalanus flemingeri, gene expression, RNA-Seq, oogenesis, energy resources
Citation: Roncalli V, Cieslak MC, Hopcroft RR and Lenz PH (2020) Capital Breeding in a Diapausing Copepod: A Transcriptomics Analysis. Front. Mar. Sci. 7:56. doi: 10.3389/fmars.2020.00056
Received: 30 October 2019; Accepted: 27 January 2020;
Published: 06 March 2020.
Edited by:
Lorenzo Zane, University of Padua, ItalyReviewed by:
Ann Tarrant, Woods Hole Oceanographic Institution, United StatesIlias Semmouri, Ghent University, Belgium
Copyright © 2020 Roncalli, Cieslak, Hopcroft and Lenz. This is an open-access article distributed under the terms of the Creative Commons Attribution License (CC BY). The use, distribution or reproduction in other forums is permitted, provided the original author(s) and the copyright owner(s) are credited and that the original publication in this journal is cited, in accordance with accepted academic practice. No use, distribution or reproduction is permitted which does not comply with these terms.
*Correspondence: Vittoria Roncalli, dml0dG9yaWEucm9uY2FsbGlAc3puLml0; cm9uY2FsbGlAaGF3YWlpLmVkdQ==