 T. Mariella Canales1*
 Mauricio Lima1,2
 Rodrigo Wiff1
 Javier E. Contreras-Reyes3
 Ursula Cifuentes4
 José Montero1,2
- 1Center of Applied Ecology and Sustainability, Santiago, Chile
- 2Departamento de Ecología, Facultad de Ciencias Biológicas, Pontificia Universidad Católica de Chile Santiago, Santiago, Chile
- 3Departamento de Estadística, Facultad de Ciencias, Universidad del Bío Bío, Concepción, Chile
- 4División de Investigación Pesquera, Instituto de Fomento Pesquero, Valparaíso, Chile
There remains a lack of holistic approaches for analyzing how different density-independent and density-dependent (endogenous) mechanisms interact to drive the dynamics of the small pelagic fish populations of the southern Humboldt Current ecosystem. In this study, we analyzed the drivers of the small pelagic fishes (SPF) off the coast of Chile from the late 1980s until the early 2010s. We postulated that climate, fishing, and endogenous effects drove the biomass dynamics of these populations. Per capita growth rates (R models) were used to investigate how these factors regulated the dynamics of three anchovy populations and one population of common sardine (CS) off the Chilean coast. We found that the dynamics of the anchovy populations located off northern Chile were driven by endogenous components and by the effects of the climate, fishing, and the climate–fishing interaction. We proposed that during the study period, the climate conditions favored the population growth of the anchovies in the north; however, fishing had a negative effect on anchovy biomass, which was facilitated by the climate. The dynamics of the SPF off central-southern Chile showed weaker endogenous effects. Indeed, the anchovy population displayed the lowest density-dependent effect, and fishing played the most significant role. The endogenous effect on the CS was slightly higher in comparison to that on the anchovy; however, climate [sea surface temperature (SST)] seemed to be the main driver of the flourishment in the CS biomass following 2006, which supported the previous hypothesis regarding the effect of climate on the species. We discussed that the R models approach could be used to provide a holistic understanding of the drivers of the biomass dynamics of these populations. The approach provided a framework for integrating climate variability in the population dynamics of these species and moving toward an ecosystem approach to fisheries management. Further steps involve exploring the effects of competition and predation on the population dynamics of these species.
Introduction
Populations of small pelagic fishes (SPF) provide ∼25% of the total annual yield of fish capture worldwide and those of many coastal communities, particularly in developing countries (Alheit and Peck, 2019; Food and Agriculture Organisation [FAO], 2019). These populations experience extreme fluctuations in abundance and have a wide geographic distribution (Alheit et al., 2019).
The mechanisms causing fluctuations in SPF have received considerable attention worldwide (Alheit et al., 2009; MacCall, 2009; Alheit and Bakun, 2010). The general view is that the variations in population abundances are primarily steered by bottom–up controls, such as ocean temperature, upwelling, and plankton composition (Chavez et al., 2003; Alheit and Niquen, 2004; Ayón et al., 2008); top–down processes, such as intraguild predation and natural predators (Irigoien and de Roos, 2011; Checkley et al., 2017); and the intrinsic traits of the species (Checkley et al., 2017).
Small pelagic fishes support large-scale fisheries worldwide, and thus, the anthropogenic effect of fishing is also considered an important driver (Beverton, 1990; Essington et al., 2015). High exploitation rates have been associated with the decline in biomass production, accelerating the population collapses in SPF (Essington et al., 2015). Hence, maintaining high fishing rates at unfavorable climate phases may amplify the collapse of populations of SPF. In other words, fishing and climate act together in a synergistic manner. In addition, fishing exploitation is a highly selective process that produces the loss of older age classes (known as age truncation), which accelerates the collapse by decreasing the capacity of the population to adjust to climate variability (Anderson et al., 2008). In SPF, the effect is difficult to detect (Hay et al., 2019); however, a few examples exist. Cubillos et al. (2014) compared empirical observations and results from a simulation analysis and found that in Strangomera bentincki, mortality from fishing removes fast-growing fish or fish that recruit at younger ages. Therefore, the age structure is truncated, and as a consequence, slow-growing fish or late-recruiting fish are selected. In this way, fishing induces changes in the reproductive cycle, increasing the sensitivity of the population to climate variability, by either matching or mismatching the reproductive cycle with the favorable/unfavorable climate conditions for recruitment.
Density-dependent and density-independent factors are critical for the dynamics of wild populations (Lima et al., 2002; Stenseth et al., 2002; Belgrano et al., 2004), and a particular set of density-dependent factors is necessary to ensure the robust regulation of a population (Royama, 1992; Turchin and Taylor, 1992). Density-dependent processes also drive fish populations (Rose et al., 2001). This negative feedback control arises from the interaction between individuals competing for one or more resources, affecting population size through processes such as growth, survival, reproduction, movements (Rose et al., 2001; Berryman and Kindlmann, 2008), and cannibalism (Irigoien and de Roos, 2011). Hence, determining density dependence is an essential step in understanding population regulations and their responses to climate variability and exogenous perturbations (Royama, 1992). For instance, Lindegren et al. (2013) predicted that density-dependence regulation (competition) would be an essential factor during favorable sea surface temperature (SST) conditions with high levels of sardine spawning biomass. Similarly, Cahuin et al. (2009) found that density dependence was a component of the Peruvian anchovy dynamics during regimes that were unfavorable for anchovy (i.e., warm SST, weak upwelling, low zooplankton).
Two small pelagic fish species inhabit the southern Coast of Chile and Peru; anchovies (Engraulis ringens) and common sardine (CS; S. bentincki) are important species in regard of their ecological interactions and economic value. Both species accounted for 38.8% of all fish that landed in Chile in 2017 (SERNAPESCA, 2017). They are the dominant species in terms of biomass in the pelagic communities of the southern Humboldt Current ecosystem and vital species in the transfer of energy from plankton to higher trophic levels (Neira, 2008). In addition, these species aggregate into a small number of populations (Cubillos et al., 2007; Garcés et al., 2019). Several factors have been reported to influence the dynamics of SPF in the Humboldt Current system, such as ocean temperature, zooplankton, oxygen, plankton size structure, cannibalism, and fishing (Alheit, 1987; Chavez et al., 2003; Ayón et al., 2008; Bertrand et al., 2011; Essington et al., 2015; Canales et al., 2016). However, there is no holistic perspective on how different density-dependent and density-independent mechanisms interact to drive these populations. Understanding the underlying mechanisms controlling the biomass dynamics of anchovies and sardines involves disentangling the effects of interacting density-dependent/density-independent factors (Lindegren et al., 2013). Understanding such mechanisms is particularly useful in the context of an ecosystem approach to fisheries management (Link and Browman, 2014) and thus the sustainable exploitation of SPF in the southern Humboldt Current Ecosystem.
We examined key drivers of the biomass dynamics of a CS population and three anchovy populations off the Chilean coast from the late 1980s until the early 2010s. We hypothesized that the biomass dynamics of these populations over these decades were the result of the combined effects of density-dependent and density-independent factors, such as climate variability and fishing. We used a functional relationship between the realized per-capita rate of biomass change and the population biomass, which can be considered a general property of a dynamical system (Turchin, 2003), and we analyzed the effects of climate, fishing, and endogenous drivers in modulating the biomass dynamics of these species.
Materials and Methods
Time Series
Small Pelagic Fish Data
The first anchovy population examined is distributed between southern Peru and northern Chile (APCH) between 16 and 24°S (Figure 1). The exploitation of this population expanded in the mid-1950s, with an average annual catch of approximately 1 million tons (Canales, 2014). The second anchovy population studied was located off central-northern Chile (ACN) between 25 and 32°S (Figure 1), with annual catches of ∼30 thousand tons (Leal and Canales, 2014). The third anchovy population located between 33 and 41°S shared its habitat with the CS (Figure 1). Both species support a pelagic fishery in the area of 33–41°S with average annual catches of 700 thousand tons since 1990 (Zuñiga and Canales, 2014).
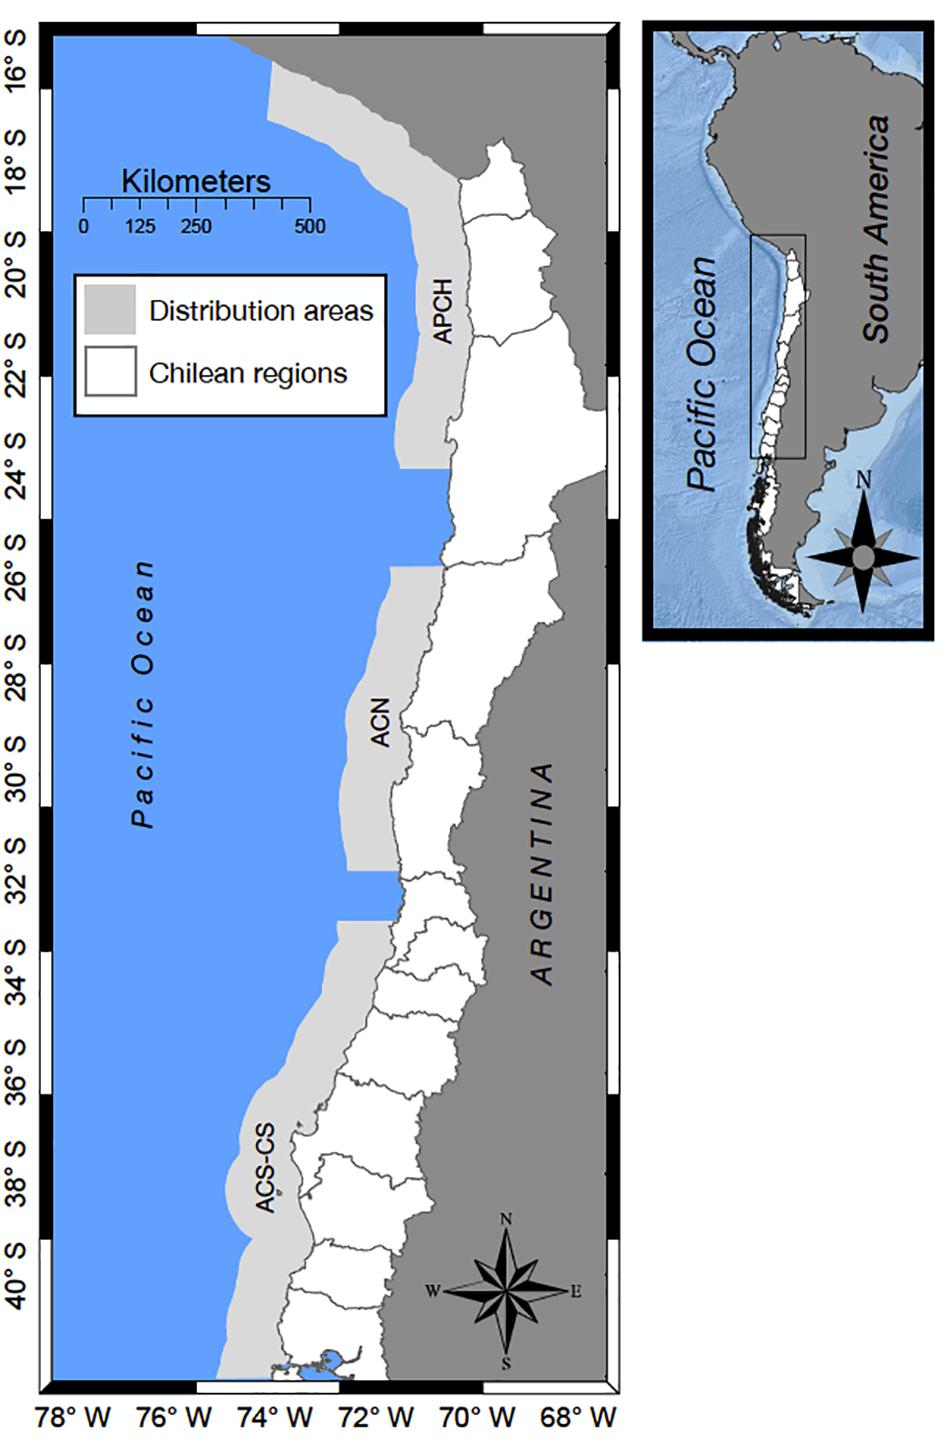
Figure 1. Distribution of the small pelagic fish populations along the Chilean coast and the southern Peruvian coast. The first anchovy population (APCH) is shared between southern Peru and northern Chile (16–24° LS). The second anchovy population (ACN) is distributed along central-northern Chile (25–32° LS). The third anchovy population (ACS) and the common sardine (CS) population inhabit the area from 33 to 41° LS, which is known as central-southern Chile.
The biomass of these species was estimated with the catch at age-/length-integrated stock assessment models that are updated yearly by the Instituto de Fomento Pesquero (IFOP1). Data derived from acoustic biomass surveys were available only for a few years for these populations (Supplementary Table S1). Therefore, these data are short time series (e.g., ACN had only six observations) for the type of analysis, and the estimation procedure applies here (see section “Statistical Analysis”). In addition, the discontinuity within the time series and the lack of a consistent sampling window for all years are typical restrictions of the survey data (Supplementary Table S1). We used biomass estimates from the stock assessments, which may be less precise than independent biomass surveys but represent a long time series that allows the representation of a more general pattern in the population dynamics of anchovy populations and the CS. We describe the main characteristics and assumptions of the stock assessment models of the anchovy populations and CS off the Chilean coast, and their data sources in the Supplementary Material.
Environmental Data
We used the Southern Oscillation Index (SOI) as covariable to explore the climate effect on the population growth rates. The index registers SST fluctuations in the tropical Pacific related to the occurrence of El Niño. Monthly standardized annual SOI values were obtained at https://www.ncdc.noaa.gov/teleconnections/enso/indicators/soi/. Positive values of SOI indicate the presence of cold conditions, such as La Niña-type conditions to normal conditions, and the negative values are indicative of warm conditions, such as El Niño. In addition to the SOI, the SST (°C) was used to analyze the impact of the climate on the SPF populations. SST data were obtained for the habitat of each population using the Advanced Very High Resolution Radiometer (AVHRR) Pathfinder dataset2 at a spatial resolution of 4 km from 1990 until the first half of 2007. From the second half of 2007 until December 2014, the SST (daytime and nighttime) data were obtained from Moderate Resolution Imaging Spectroradiometer (MODIS) at https://doi.org/10.5067/MODSA-MO4N4. To make the SST data comparable, we corrected the SST from the AVHRR using a linear correlation between SST-MODIS and SST-AVRR that was obtained for the period 2003–2009, during which the SSTs from both sources overlapped. Linear correlations of the SSTs from AVHRR and MODIS for the three habitats yielded R2 = 0.99.
Annual or semester averaged values of both climate variables (SOI and SST) were used to study the influence of the climate on the biomass dynamics of each population. The SST anomaly was used and calculated by subtracting the mean of the SST by the observed value for each period of the study. The environmental variables SOI and SST were correlated for each population [APCH-S1: r = −0.38; APCH-S2: r = −0.49; ACN: r = −0.47; anchovy population of central-southern Chile (ACS): r = −0.51; CS: r = −0.64]; therefore, we avoided including both climate variables in a single model. Early explorations of both climate indexes on the R model of the anchovies and CS led to SOI for the anchovy populations and the SST for CS. The SOI explained more of the variance of the Rt data than the SST did for anchovy populations, and the SST performed better for the CS. Previous authors (Cubillos and Arcos, 2002; Gomez et al., 2012) also identified significant correlations between the SST and CS (recruitment), supporting our chosen climate variable.
Fishing Data
The number of fishing trips was used as the unit of effort for measuring the fishing effect on the biomass dynamics of the fish. Fishing trips were selected because there was robust measurement of the fishing effort (Aranis et al., 2017) when more detailed effort information, such as duration of the fishing trip, is fragmentary, such as in the Chileans anchovy and CS fisheries. In all populations, the chosen fishing variables were the number of fishing trips (E), catches (C), the ratio between the annual catch and the biomass (exploitation rate), and the ratio between the annual effort and the biomass. In addition, for the ACS and CS populations, we tested the total number of fishing trips (EA + S) and the total catches (CA + S) of anchovies and sardine together.
Density-Dependent Effect Diagnosis
We assume that the population dynamics of SPF are the result of the combined effects of ecological interactions within species (endogenous effect), climate influences, fishing, and stochastic forces. To understand the influences of these factors on biomass fluctuations, density-dependent and density-independent effects can be modeled using R functions (Lima et al., 2008; Lima and Naya, 2011). These functions represent the realized per capita population growth rates (Rt) that reflect the processes of individual survival and reproduction (Berryman, 1999). The population growth rate at time t is defined as Rt = ln(Bt)−ln(Bt−1) and can be expressed as:
where B is the total biomass, Bt–i is the biomass in year t, and i represents the time lags (with i = 1,2,3) (Berryman, 1999).
The first step in the development of the statistical model was to estimate the order of the dynamical process (Royama, 1977) by analyzing how many lags (Bt–i) should be included in the R model to represent the density dependence or the endogenous effects. We used the partial rate correlation function (PRCF) between Rt and ln(Bt−i) = Xt−i to explore the relative strength of the different parts of the feedback structure regulating the population dynamics (Berryman, 2001; Lima and Naya, 2011). PRCF is a useful diagnostic tool for making inferences about the structure of the density-dependence feedback processes that govern the population trajectory, but it is not a modeling tool (Berryman and Turchin, 2001).
Equation 1 was rewritten in natural logarithmic form to calculate the partial correlations as follows:
where Rt is calculated from the data, and Xt–i is the lagged population biomass.
Theoretical Models
To understand the fluctuations of the SPF biomasses, we assumed that Rt was influenced by density-dependent and density-independent effects, such as climate and fishing. The general model consisted of a simple exponential logistic equation (Royama, 1992) as follows:
where Bt represents the population biomass of a Chilean SPF at time t, Rm is a positive constant representing the maximum per capita growth rate of each population, b is the constant of the endogenous effect (Bt−i), c is the constant of the climate variability effect (Ct−i), and d is the constant of the fishing effect (Ft–i). Taking the natural logarithmic form of Eq. 3 leads to the following general model:
where all terms were as defined before.
Climate perturbations in the model were added as an additive effect on the Rt and followed the framework in Royama (1992). Two types of climate effects were studied: vertical and lateral. The vertical effect was additive and influenced Rm. This can be expressed as , where c is a simple linear function (positive or negative) of the climate variable Ct – i. The lateral climate perturbations shift the R function along the x-axis and can be represented as , where c was previously defined, and b′ represents the constant of the lateral climate effect (Andreo et al., 2009). We also considered the potential effects that arose from the interaction between climate and fishing, which are indicated in this study as the climate–fishing interaction effects. This was represented as , where d′ represents the constant of the interaction effect.
Statistical Analysis
Parameter Estimation
The estimation of the parameters in Eq. 4 is routinely performed with non-linear regression techniques (Lima and Estay, 2013). Such an approach assumes that the error is only in the observations but that the dynamics are known without error. Here, an alternative approach is suggested in which error can be assumed in both the dynamics (process error) and the observations. By introducing process error, we try to account for some aspects of the stock assessment data used in this study, such as the correlation between estimates (Brooks and Deroba, 2015).
When estimating the parameters of a time series as in Eq. 4, a popular method for incorporating processing and observation errors is known as the Kalman filter (Kalman, 1962). We used the Kalman filter algorithm to calculate the expected means and covariances of the observed values for the complete time series in the presence of observation and process errors (Bolker, 2008).
Following Kalman (1962), we considered an unobserved variable xt that could be estimated through the observed trajectory from yt. Therefore, there is a relationship between xt and yt with the following linear structure:
where W is the state matrix with t = 1,…,N; G is the observed matrix; H is a linear operator; and εt is the noise that is assumed to have a Gaussian distribution, with a mean of zero and a constant variance σ2. Equation 5 is called the state equation, and Eq. 6 is the observed equation that is used to model the observed variable Rt. Therefore, the observed matrix G is [1bcde], and xt includes the covariables as [RmBt−1Ct−iFt]. It is clear that, depending on the models that are used, the dimensions of G and xt could be reduced. For the state equation, Eq. 5, the absence of independence between the observations xt and the high correlation between the covariables in matrix H are assumed. Indeed, it is assumed that xt is an autoregressive model, AR(p) and that coefficients of H are non-zero (Hyndman and Khandakar, 2008).
Model selection was conducted using the Akaike information criterion for small sample sizes (AICc), and the differences in the AICc among models were assessed (ΔAICc). We also examined Akaike weights (wi) and R-squared values (R2; pseudo-R2) as a measure of the variance explained by the model (Burnham and Anderson, 2004).
Time series cross-validation is used to measure the prediction performance of the selected models. Cross-validation consists of selecting a subsample with a size k (k < N) of ∼25% of the total sample size N, fitting the proposed model on this subsample and forecasting Rt, 1-year prediction ahead.
Biomass predictions and observations were compared using the root-mean-square error (RMSE) prediction. The smallest values represent the best prediction of biomass (Sheiner and Beal, 1981). The prediction uncertainty is computed with the 95% confidence interval of a standardized normal quantile. All models were implemented in R (R Core Team, 2017), and the “Forecast” package in R was used to apply the Kalman filter algorithm (Hyndman and Khandakar, 2008).
Results
Biological Time Series and Diagnostics
The biomass time series of the APCH for both semesters (APCH-S1 and APCH-S2) spanned the period from 1986 to 2010 and showed almost identical dynamics (Figures 2A,B). Both presented a large second-order like oscillation of the biomass from 1986 to 1997 and more stable dynamics after 1998. The biomass time series of the ACN (Figure 2C) ranged from 1985 to 2013 with a maximum in 1994, which was followed by a sharp decline and a slow recovery after 2000. The time series of the ACS and CS spanned the period from 1990 to 2014 (Figures 2D,E). The former was characterized by two large second-order oscillations; on the other hand, the CS showed a different type of variability with irregular high-frequency oscillation and a “U” shaped long-term trend.
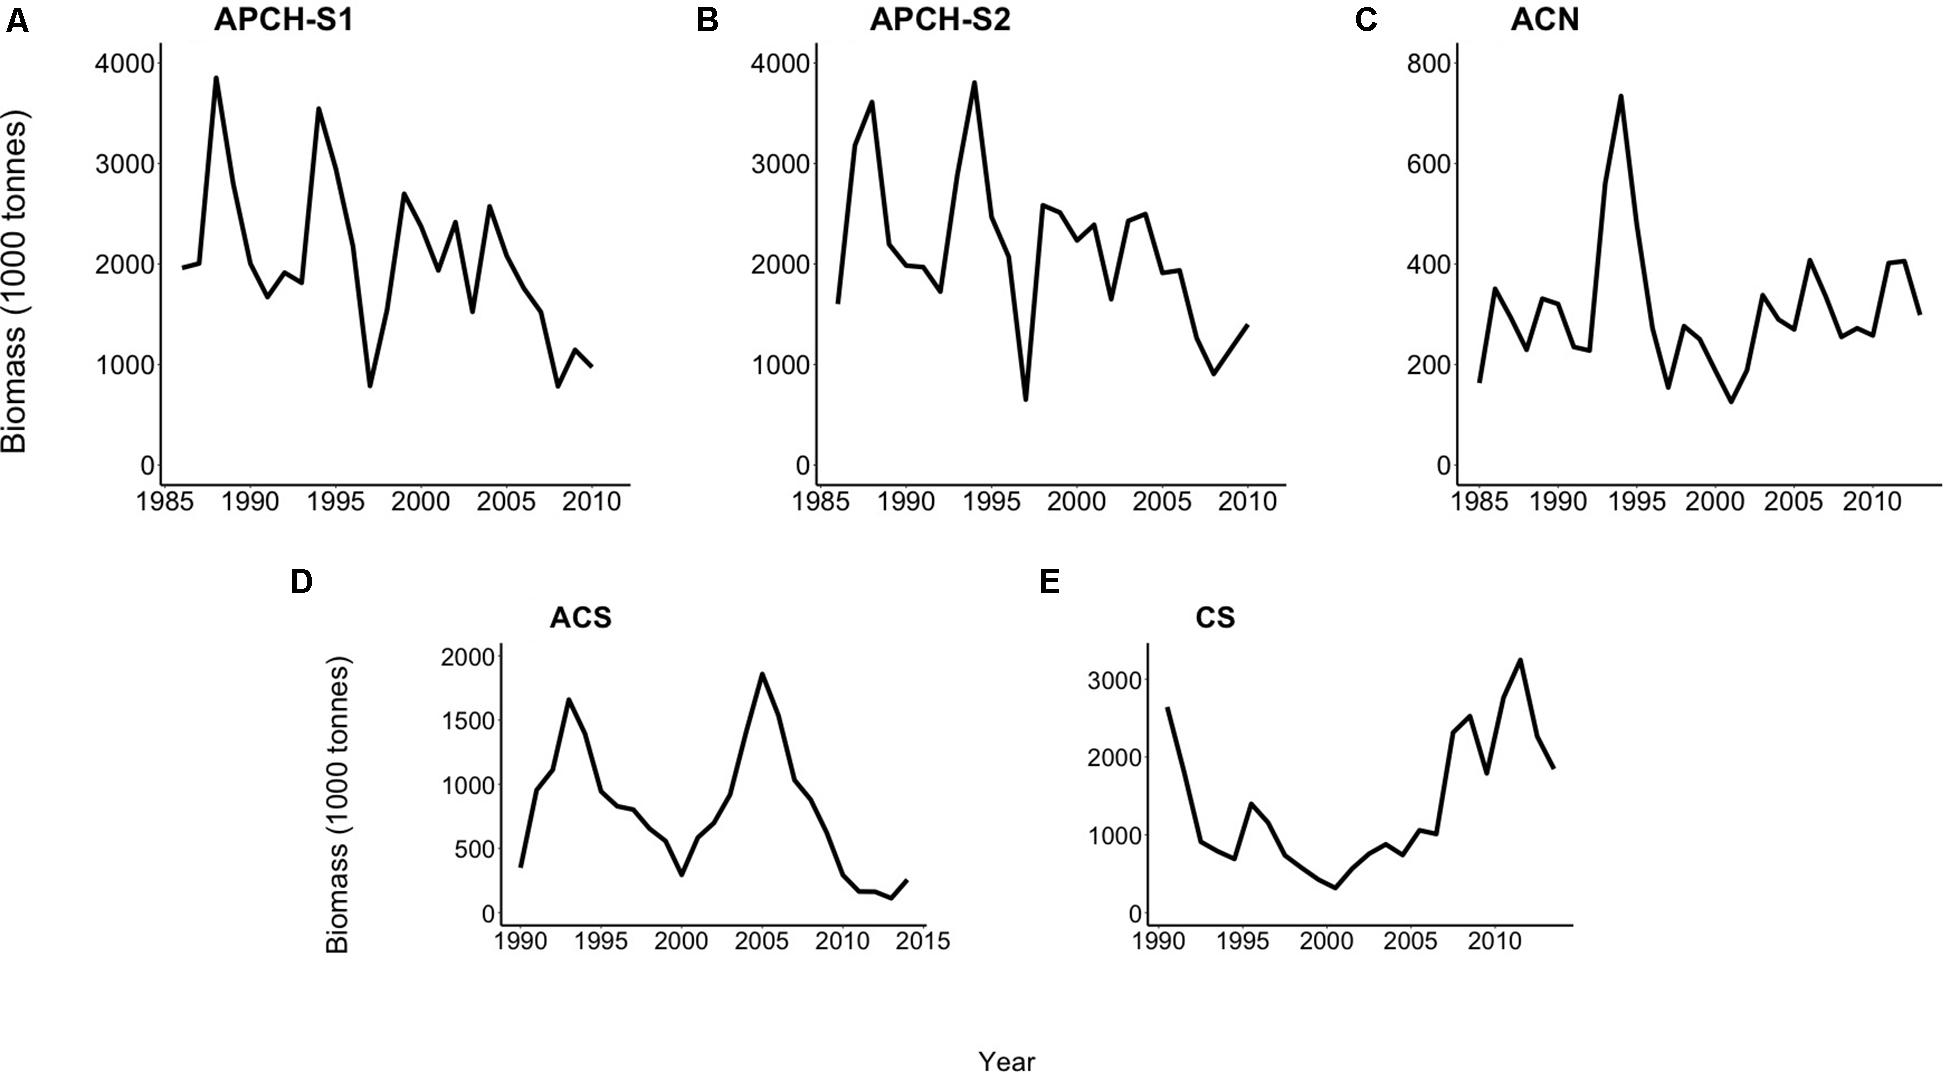
Figure 2. Biomass (tonnes) time series of the Chilean small pelagic fish populations. Anchovy population of southern Peru and northern Chile (APCH) from 1986 to 2010. (A) APCH-S1, biomass semester January–June and (B) APCH-S2, anchovy biomass semester July to December. (C) Anchovy population off central-northern Chile (ACN) from 1985 to 2013. (D) The anchovy population (ACS) and (E) common sardine (CS) population off central-southern Chile includes estimates from 1990 to 2014.
The diagnosis of the PRCF for all anchovy populations exhibited significant first-order processes (density-dependence effects). APCH-S1, APCH-S2, and ACN (Figures 3A–C) showed significant correlations between the Rt and biomass with a 1-year lag. The second-order processes in the APCH population in both semesters were identified in the limit of their significance. In the case of APCH-S2 (Figure 3B), a fifth-order process was detected but not included in the statistical model because the number of observations was short to estimate its correlation. The ACN population also displayed a second-order effect; however, a sensitivity analysis (not shown) indicated that the presence of this effect was conditional on the high maximum biomass estimated in the period from 1993 to 1995. The ACS showed a correlation with a second-year lag (Figure 3D) and the first-order effect within the limits of its significance compared to the APCH and ACN populations. Contrary to the anchovies, the CS only showed a first-order process (Figure 3E).
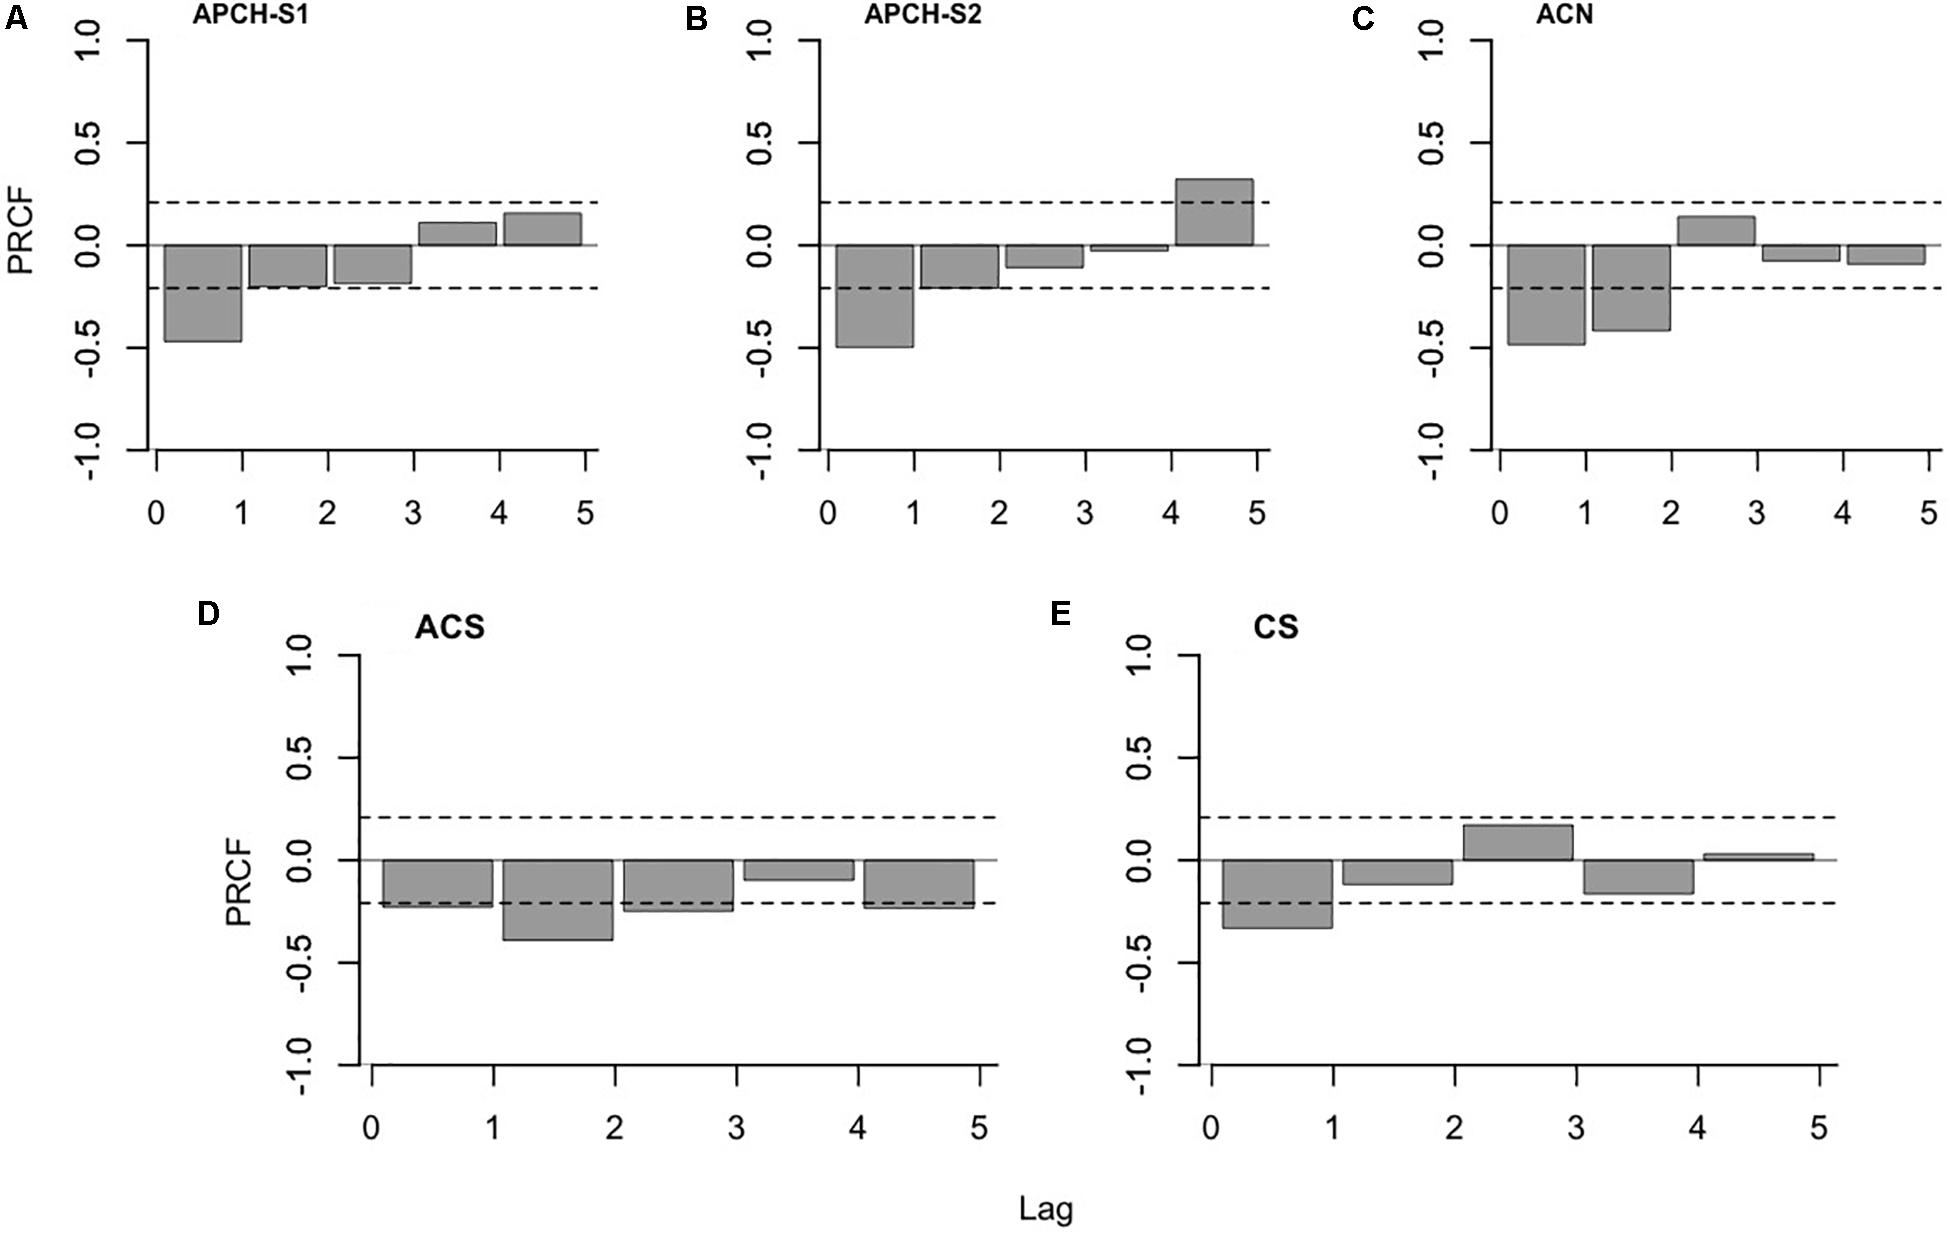
Figure 3. Partial rate correlation function (PRCF) of the per capita population growth rate (Rt, y-axis) and the biomass at different time lags (x-axis). The analysis diagnoses the relative contribution of the population feedback at a lag of i (i = 0,1,2,3,4,5) (endogenous effect) for the determination of Rt. (A) Anchovy population of southern Peru and northern Chile (APCH-S1). (B) Anchovy population of southern Peru and northern Chile (APCH-S2). (C) Anchovy population of central-northern Chile (ACN). (D) Anchovy population of central-southern Chile (ACS), and (E) the common sardine (CS) population of central-southern Chile (the dashed line indicates significance at p < 0.05).
Population Dynamics Modeling
Anchovy Peru–Chile
APCH-S1
The first-order process of the APCH-S1 as occurred with the biomass with a 1-year lag (Bt – 1), which explained 0.50 of the variance (Table 1, S1.m1). The SOI vertical climate effect with no lags displayed the lowest AICc (Table 1, S1.m2). The effect of fishing in models S1.m8 to S1.m10 (Table 1) showed that Et was the predictor that best improved the fit (Table 1, S1.m8).
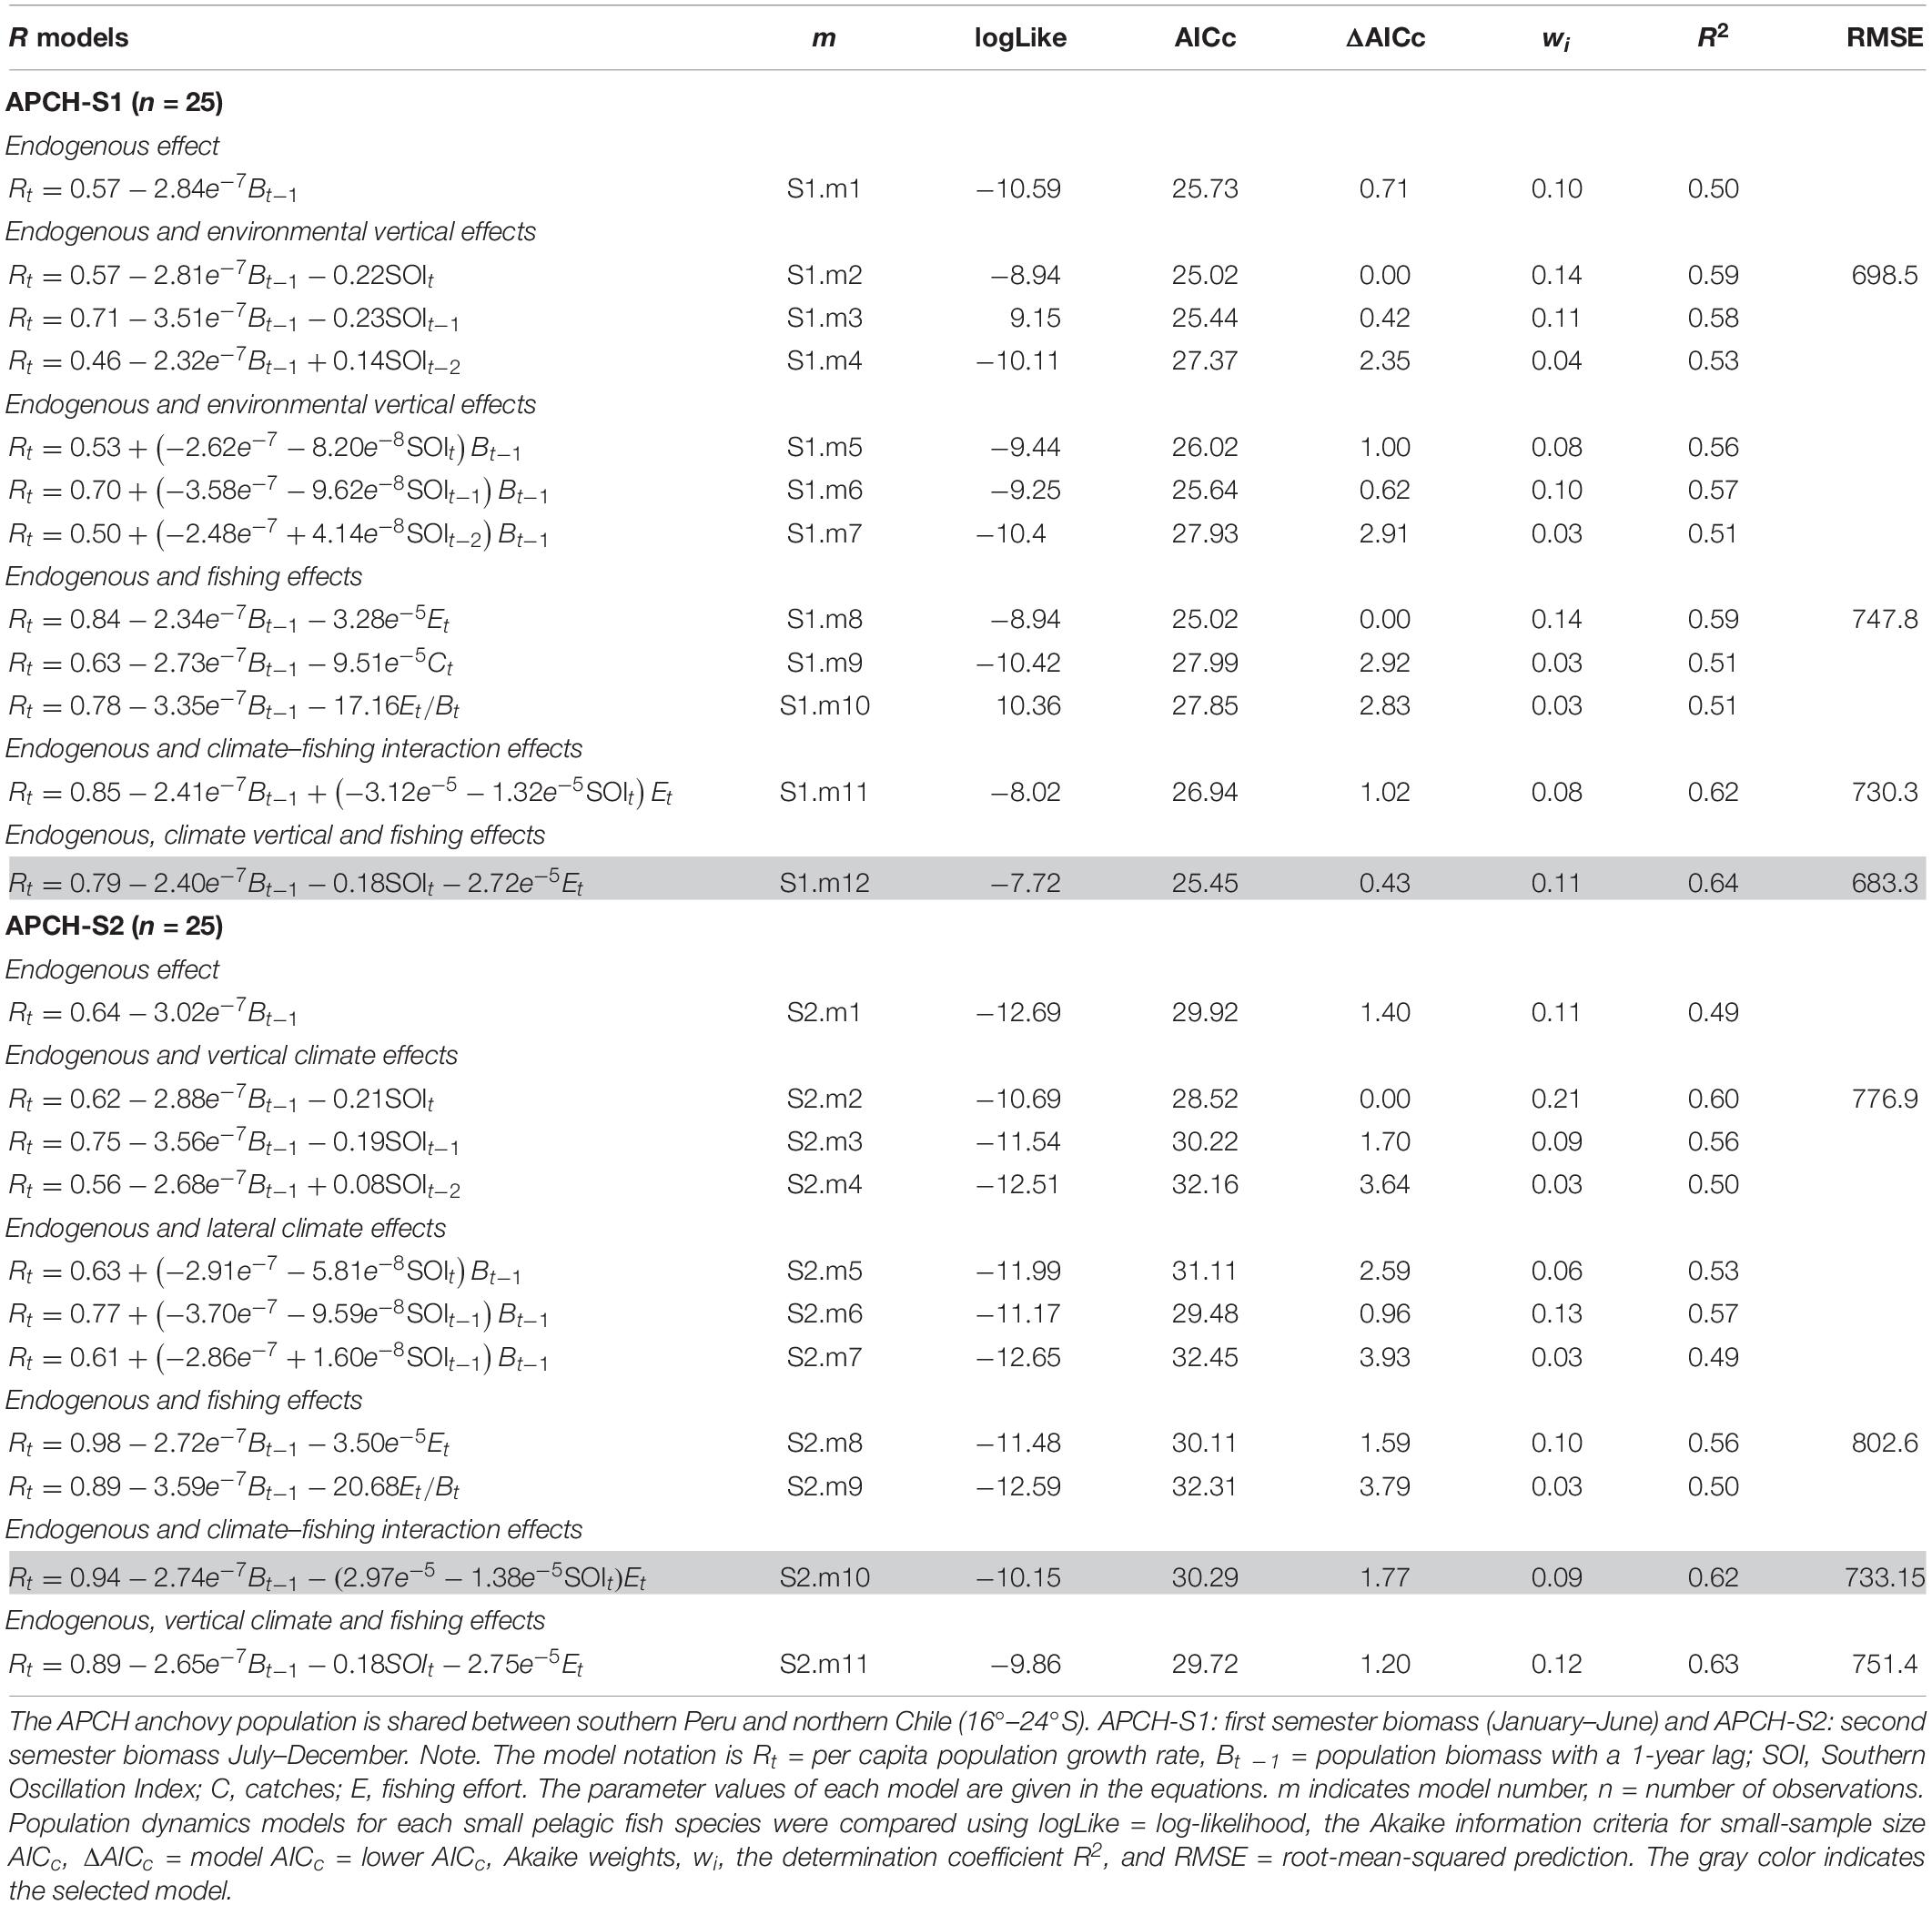
Table 1. Population models for the Chilean anchovy stocks (Engraulis ringens).
The combined effect of the previous factors on Rt showed an improvement in the fit (Table 1, S1.m11 and S1.m12). Model S1.m12, which considered the additive effect of climate and fishing rather than the climate–fishing interaction, showed a lower AICc value.
The predictability of the biomass of APCH-S1 was assessed with models S1.m2, S1.m8, S1.m11, and S1.m12. Model S1.m12 showed the best prediction of the APCH-S1 biomass (lowest RMSE value). Figure 4A indicates that the selected model was able to predict the trend starting with that for 1993, the maximum biomass for 1994, and the declining trend after 2005. The endogenous effects primarily drove the APCH-S1 biomass, which was secondarily driven by the climate and fishing. These last two factors had negative effects on the APCH-S1 growth rate.
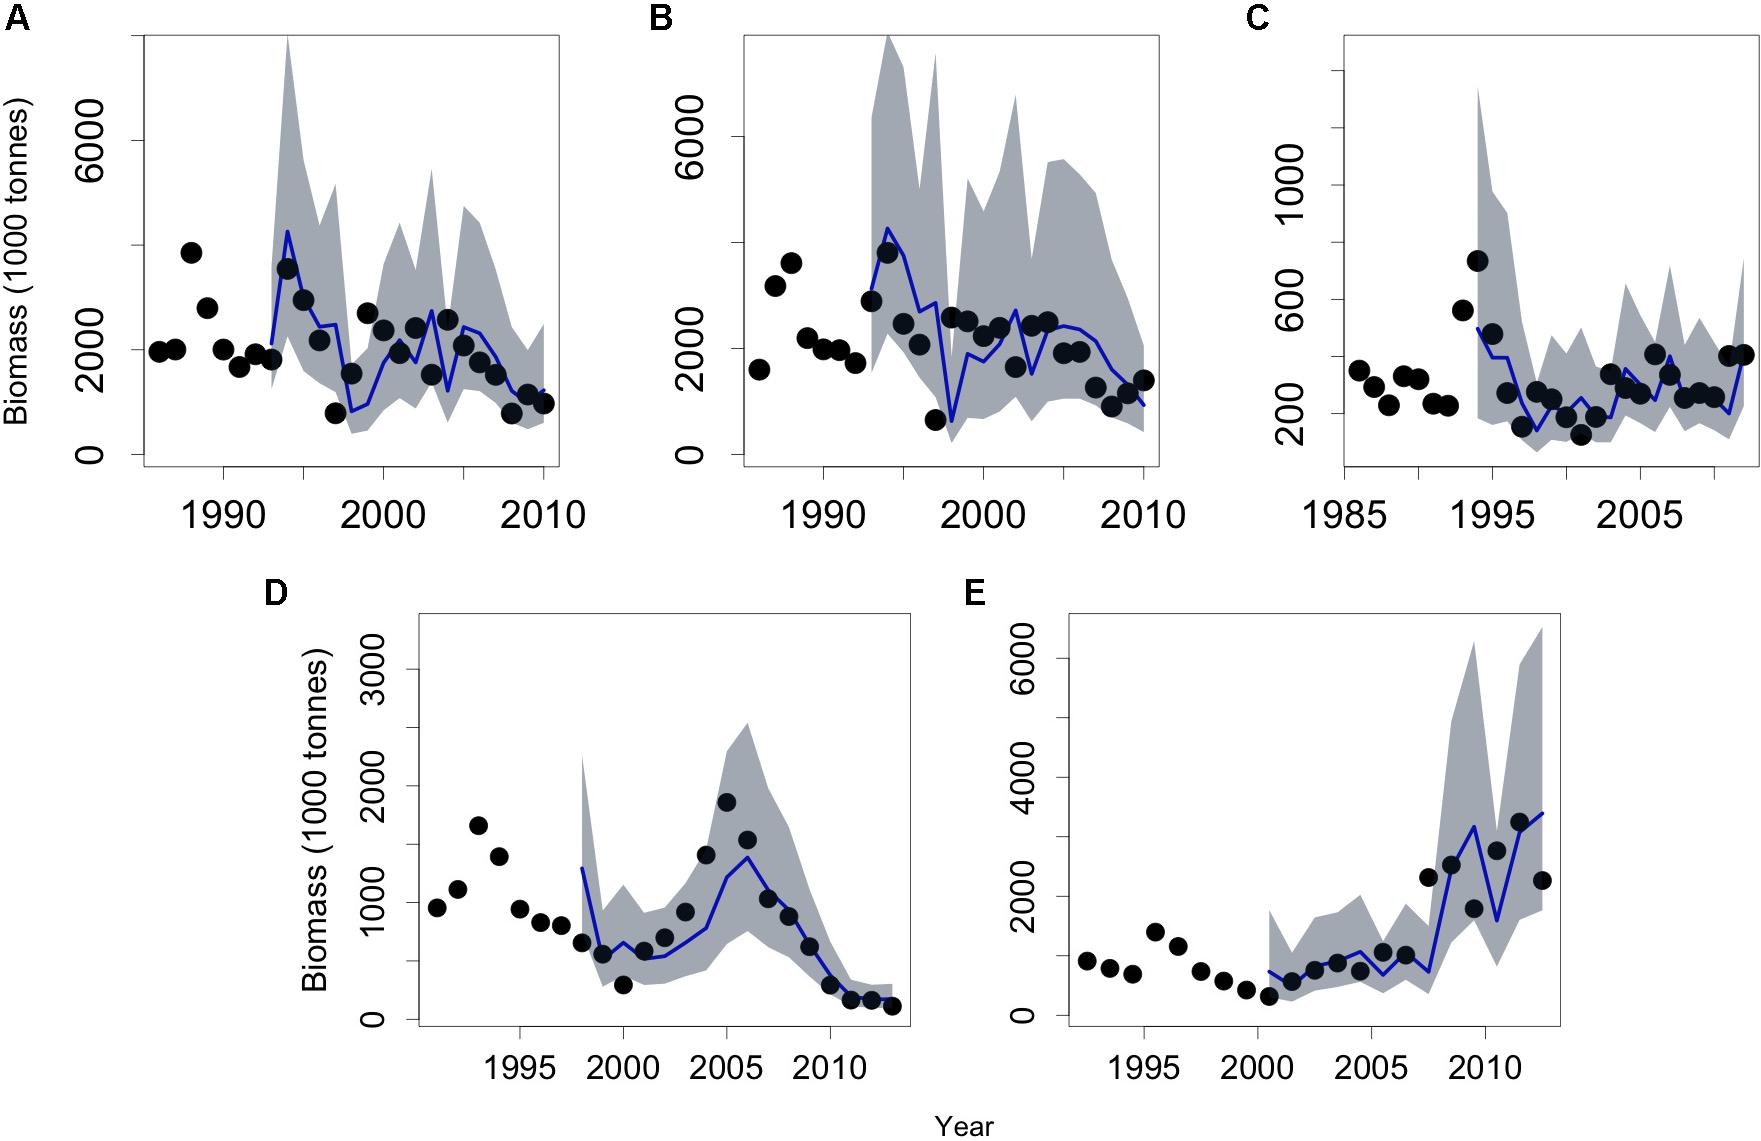
Figure 4. Simulations of the anchovy and common sardine biomasses with the selected models in Table 1. (A) APCH-S1 population (Table 1, S1.m12). (B) APCH-S2 population (Table 1, S2.m10). (C) ACN population (Table 2, m13). (D) Anchovy population of central southern Chile (Table 2, m11), and (E) common sardine population of central-southern Chile (Table 3, m12) (points correspond to the observations, the blue line to the prediction, and gray area to the confidence interval of the predictions).
APCH-S2
The first-order process explained 0.49 of the Rt variance (Table 1, S2.m1). As in the case of APCH-S1, the vertical climate effect (SOI) and fishing (Et) with no lags showed the best fit with the R models, although in the APCH-S2 models, the climate effect performed better than fishing alone (Table 1). The combined influences of endogenous, vertical climate, and fishing factors (S2.m10 and S2.m11) showed an improvement in the fit of models with independent effects (S2.m1 to S2.m9). Cross-validation analyses were conducted with models S2.m2, S2.m8, S2.m10, and S2.m11. The lowest RMSE value was obtained with model S2.m10; thus, this model best predicted the APCH-S2 biomass (Figure 4B).
Anchovy central-northern Chile
The endogenous process in the ACN population explained a slightly higher variance compared to the APCH, with an R2 = 0.54 (Table 2, m1). The climate effect was examined, and the best parsimonious model was obtained with a vertical effect and no lags (Table 2, m2). The fishing effect slightly improved the fit in comparison with model m1, whereas models m9 and m11 showed the lowest AICc values.
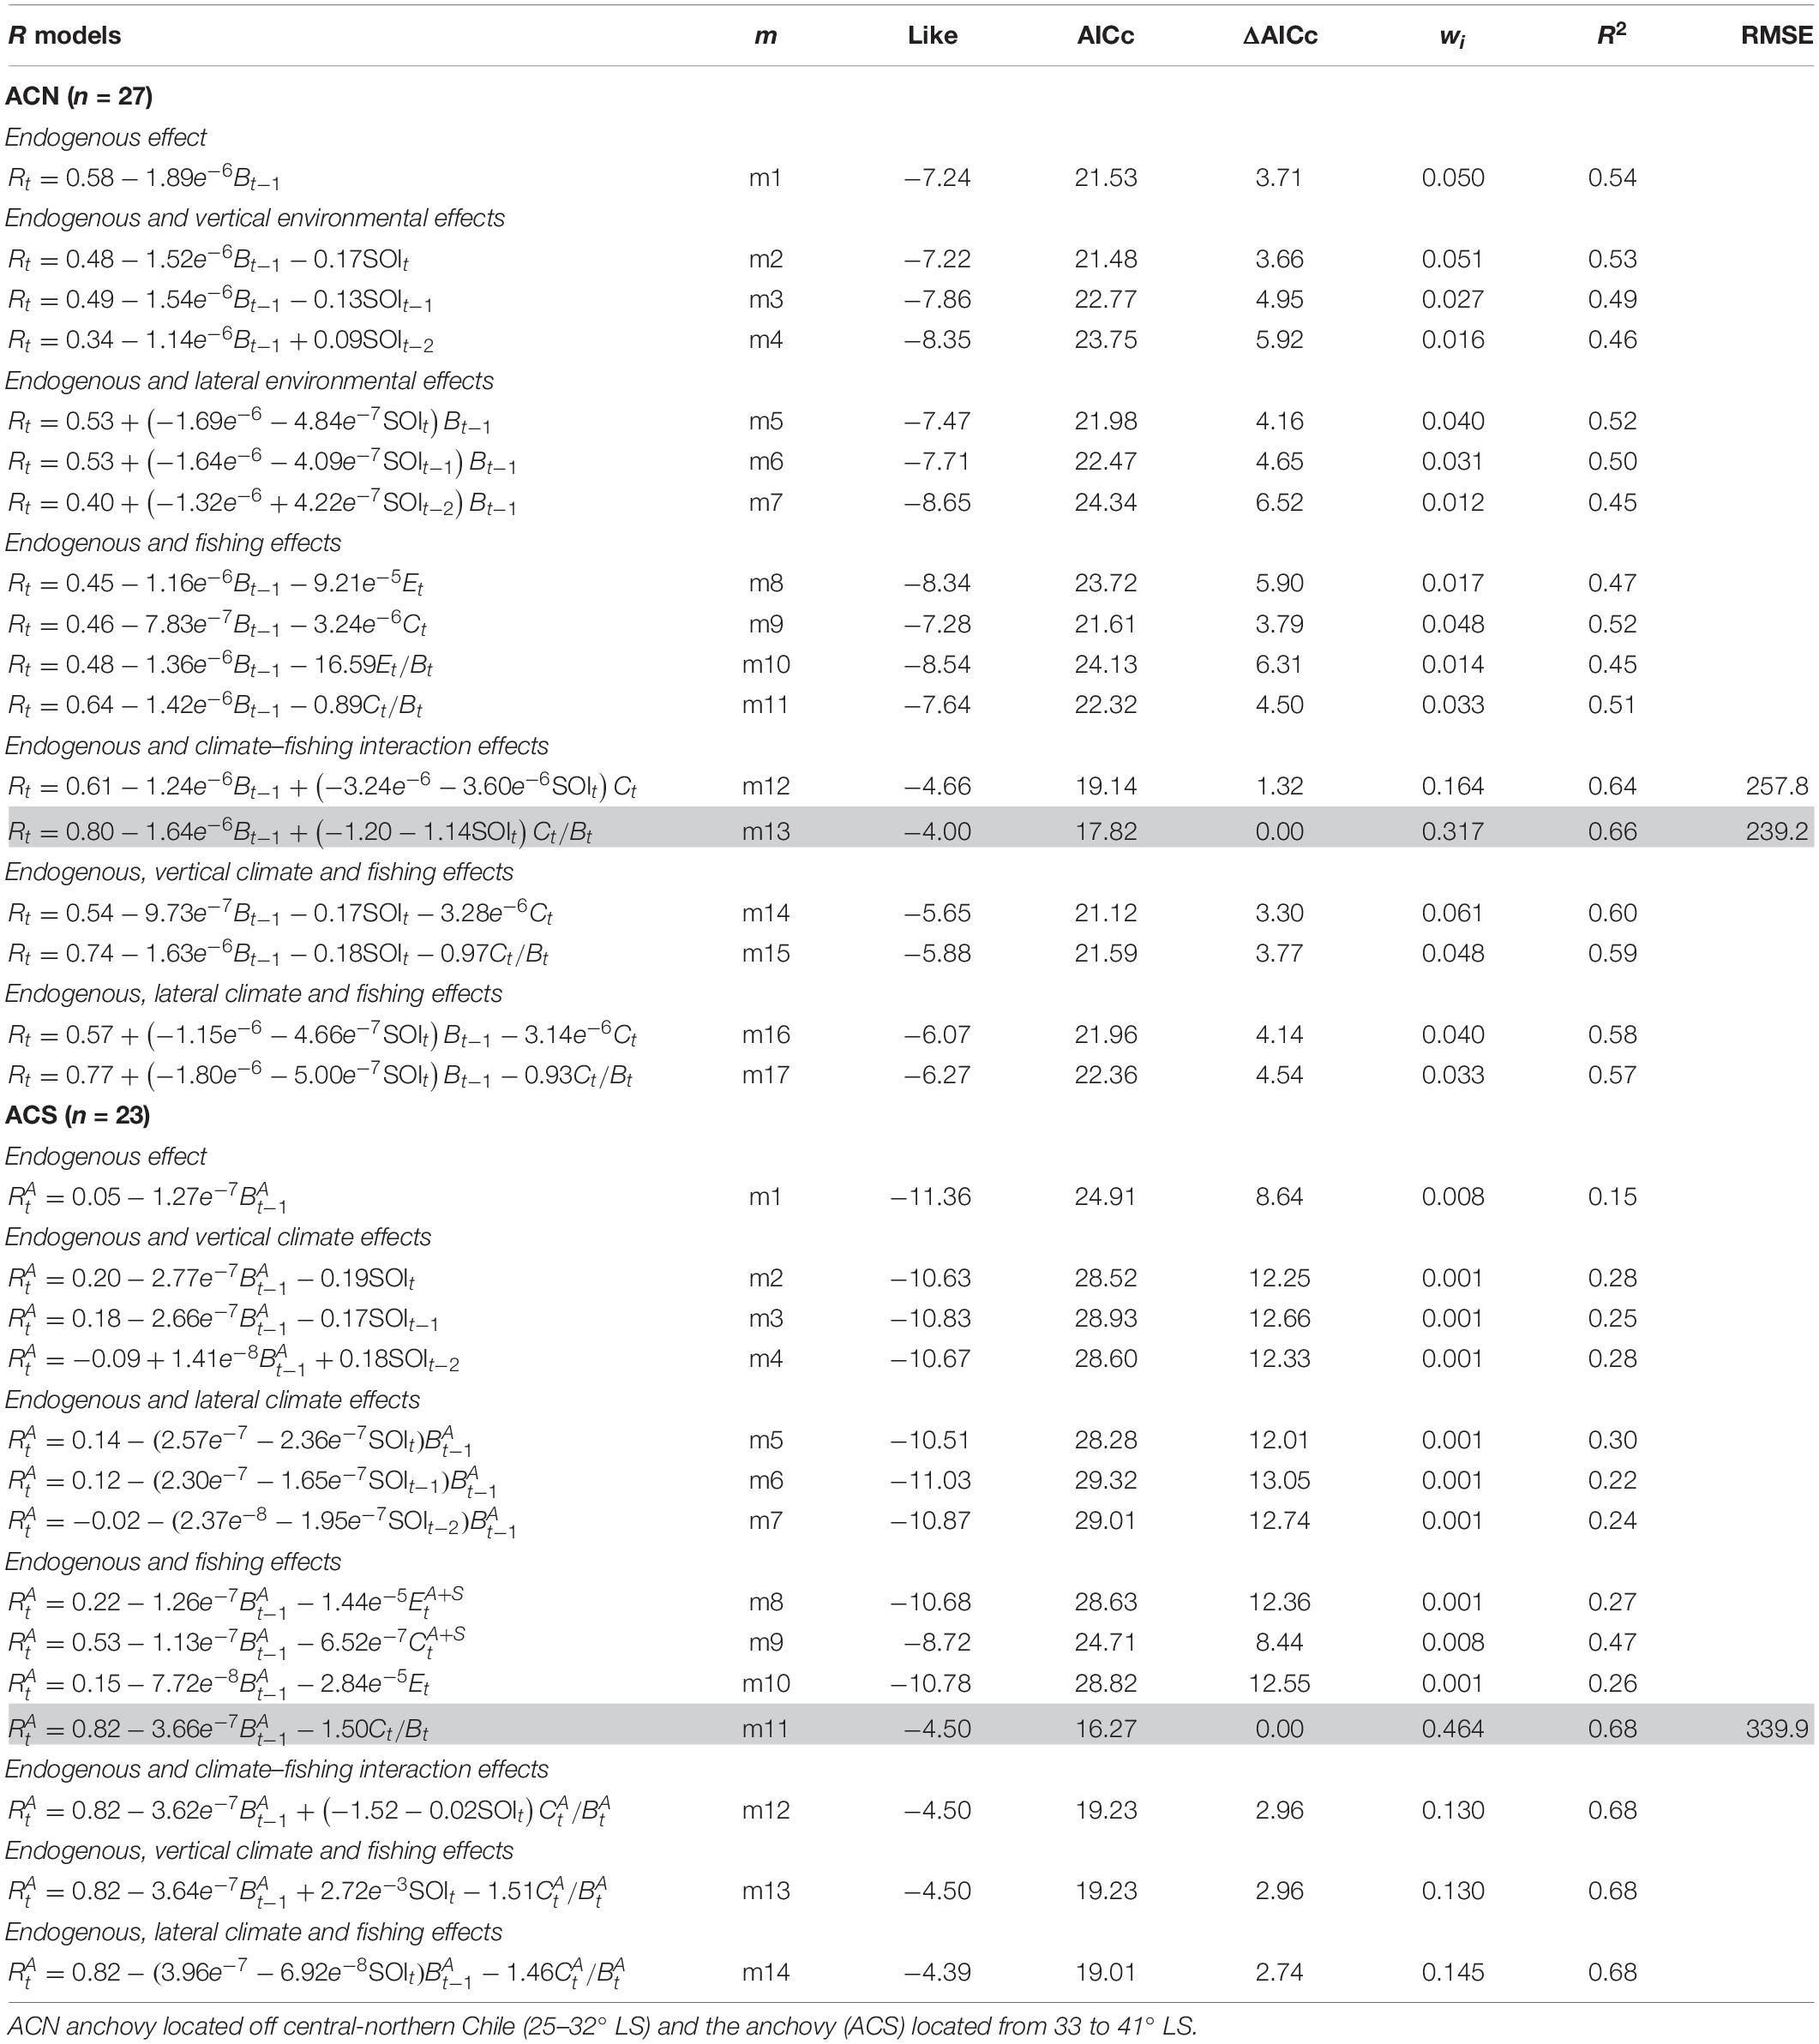
Table 2. Population dynamics models for the anchovy stocks (Engraulis ringens).
Combining the density-dependent effect with climate and fishing (Table 2, m12 to m17) showed that the model with the climate–fishing interaction performed better. The best fit was obtained when the climate–fishing interaction was considered (Table 2, m12 and m13). Cross-validation analysis was conducted with models m12 and m13; however, the last model better predicted the biomass (smallest RMSE). The forecast of the ACN biomass by m13 (Figure 4C) predicted the observed decline in biomass in 1994 and the recovery and stability following 2005 as a function of an endogenous process and the climate–fishing interaction.
Anchovy central-southern Chile
The first-order process explained a low variance of 0.15 (Table 2, m1), which had a weak influence on the ACS dynamics compared to the northern anchovies. The climate effect, either vertical or lateral, performed better (lowest AICc) than the endogenous effect alone (Table 2, m3–m8). Adding the fishing effect to the R model showed the best results when the anchovy exploitation rate was added (Table 2, m11). Indeed, the anchovy exploitation rate increased the R2 to 0.68 in the presence of the endogenous effect, thereby improving the fit.
The combination of the previous factors (endogenous process, climate, and fishing) in models m13–m20 (Table 2) did not improve the fit with model m11. Therefore, cross-validation analysis was performed only considering m11. Figure 4D shows that m11 closely predicted the fluctuation in the ACS biomass in the period from 1999 to 2013 as a function of the endogenous effect and fishing.
Common sardine central-southern chile (CS)
The endogenous effect in the CS population showed a low influence in Rt, as in the ACS (Table 3, m1). The vertical climate effects, SSTt –1, displayed the lowest AICc values, although no significant differences were found with the SSTt –2 effect. The additive effects of the fishing or the climate–fishing interaction (m8 and m9) did not lead to a better fit. Hence, the effect of fishing was dismissed. One- and 2-year SST lag effects produced a significant improvement in model fit (Table 3, m10–m12).
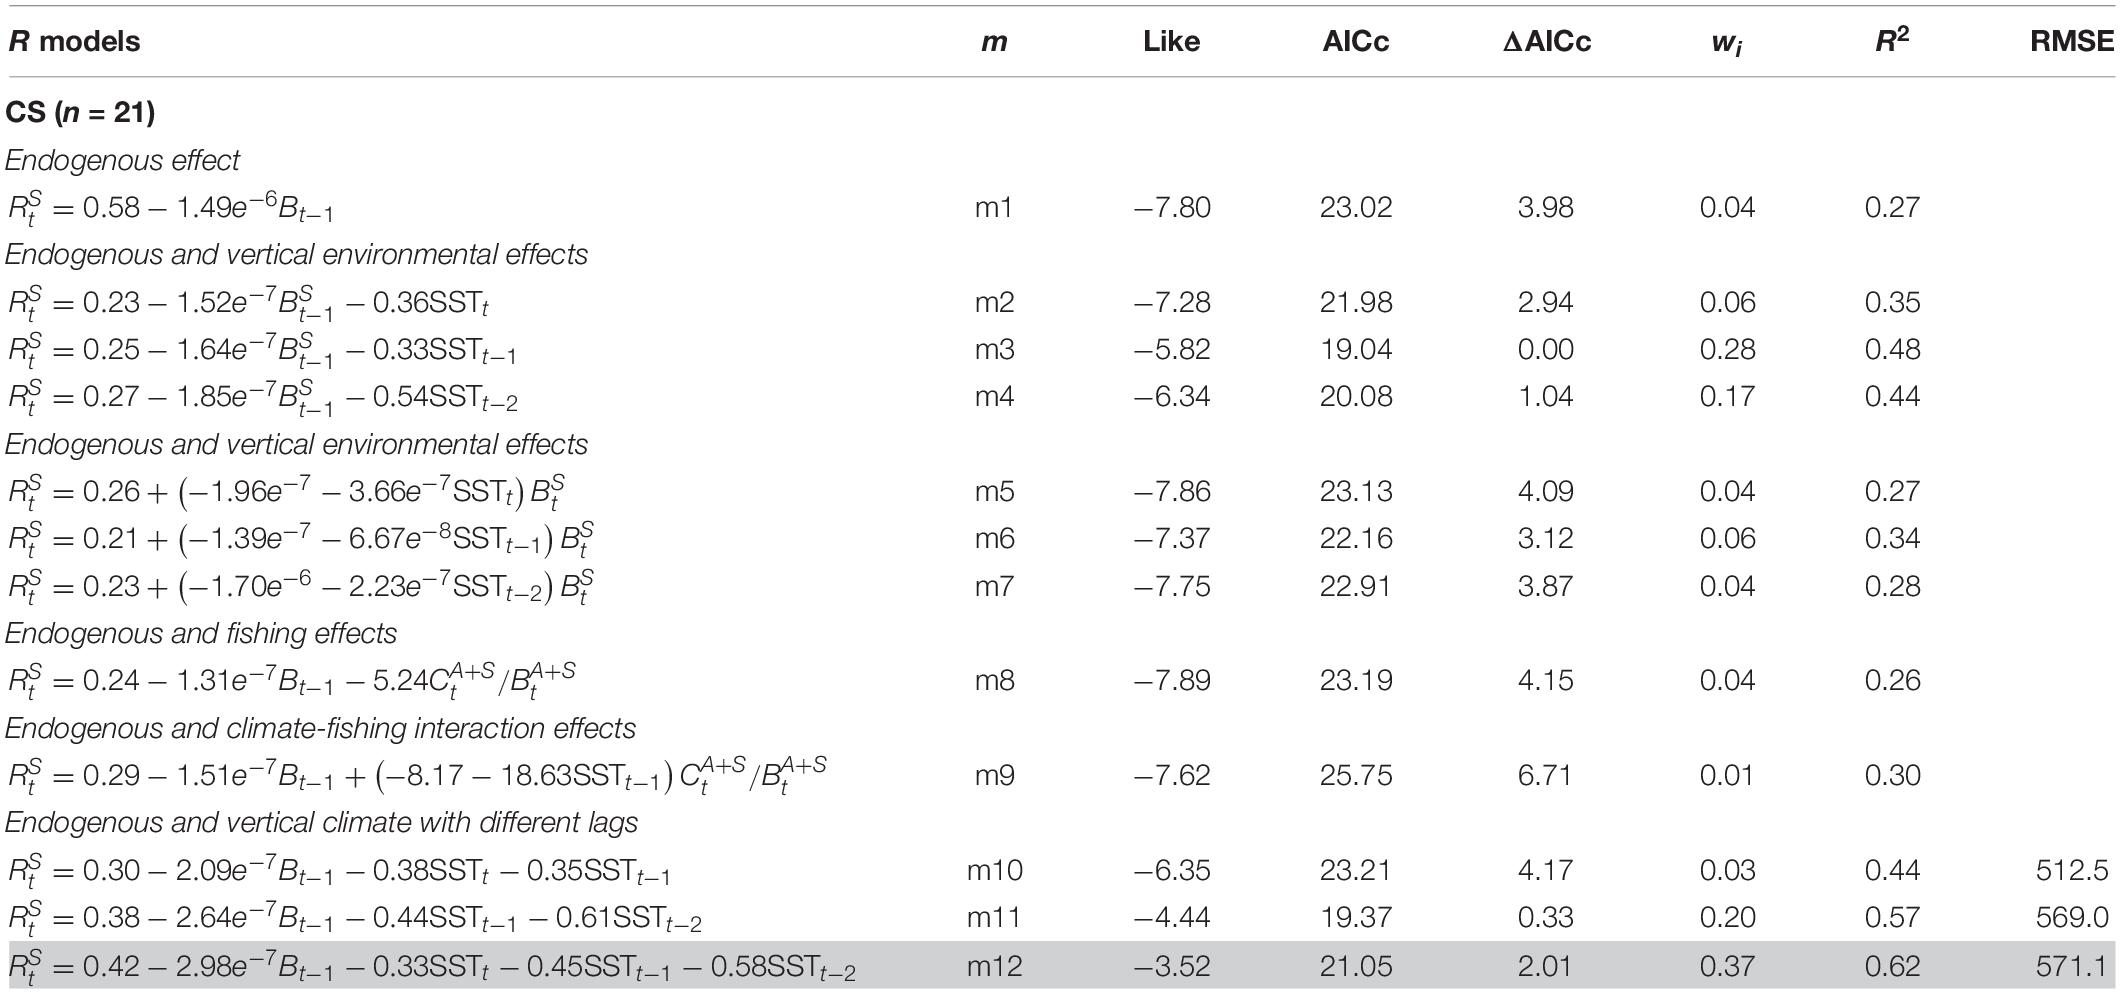
Table 3. Population dynamics models for the common sardine (Strangomera bentincki) off central-southern Chile (33–41° LS).
Cross-validation analysis was conducted with models m10, m11, and m12. Small differences in the RMSE values of m11 and m12 were recorded. On the other hand, m10 showed the lowest RMSE values. Although model m12 did not record the lowest RMSE value, it was selected because it had the better fit and explained more of the variance. Figure 4E shows the predictions of the CS biomass from model m12. The biomass dynamics seemed to be mainly driven by the climate conditions signaled in the SST and, to a lesser extent, by a density-dependent effect. The model was able to predict the low biomass period observed from 2000 to 2006 and the sharp increase in biomass following 2006.
Discussion
Density-dependent and density-independent (climate and fishing) effects were the drivers of the biomass dynamics of the anchovy and CS populations off the Chilean coast from the late 1980s to the early 2010s. The relative importance of these effects varied across the studied populations. The density-dependent, climate, and fishing effects were significant in the anchovy populations. Whereas climate was the main driver of the CS biomass, fishing had a non-significant effect in modulating its dynamics.
We also found differences in the anchovy populations, where northern anchovies showed the most important endogenous effect (higher explained variance) in comparison with the southern population. Pedraza and Cubillos (2008) proposed a similar modeling framework to assess density-dependent forcing on the anchovy and CS populations of central-southern Chile. Their results pointed to an endogenous effect in the anchovy of central-southern Chile with an explained variance of 23%, which was close to the value found in this study (15%) for the same anchovy population (ACS). However, the process effect of the same order shown by Pedraza and Cubillos (2008) was far lower than the importance of the endogenous components in the northern anchovy populations. Regarding the CS population, the density-dependent effect detected in Pedraza and Cubillos (2008) explained a variance of 42% of the changes in biomass compared to those found in this study, where the endogenous component only explained 27%. The differences between the studies could be related to the trends and the length of the time series used. The results in Pedraza and Cubillos (2008) used information from 1991 to 2002, which coincided with a low abundance period in CS. Our results extended the period used in Pedraza and Cubillos (2008) and included a relatively high abundance phase of CS after 2006; thus, comparison of our results and those in Pedraza and Cubillos (2008) should be conducted cautiously. Indeed, the sensitivity to climate changes of anchovy and probably other SPF seems to be dependent on the population size (Cahuin et al., 2009). These authors found that the density-dependent effects in anchovy could be more important when unfavorable habitat conditions prevailed in the system. We believe that the lower influence of the density-dependent effects on the CS found in this work may be associated with the increase in the population after 2006 due to the prevailing favorable SSTs in the habitat of the species. Therefore, the climate conditions did not favor high competition for food.
The studied populations showed a density-independent climate effect with the SOI and SST. In anchovy populations, the influence was through the climate–fishing interaction (APCH-S2 and ACN) or through direct effects on the population growth rate (APCH-S1). In the first scenario, the climate–fishing interaction indicated that, in addition to the negative effect of fishing on the population growth rate (high fishing effort after 2000, Figure 5C), climate mediated the negative influence of fishing on the anchovy biomass. Likewise, the SOI indicated the trend of the prevailing climate conditions toward a cool environment (Figure 5A), favoring the growth of the anchovy population. A lasting period of cold temperature anomalies due to the retreat of the warm subtropical oceanic waters off the coasts of Peru and Chile creates conditions for active upwelling (Cahuin et al., 2009; Swartzman et al., 2009; Bertrand et al., 2011). Such climate conditions also increase the vulnerability of anchovy to fishing by creating pools of cold water where anchovies gather to feed or spawn, thereby increasing the probability of being found by fishing boats (Alheit and Niquen, 2004; Bertrand et al., 2004, 2008; Alheit et al., 2009). Therefore, anchovy population growth is favored under cold conditions, but this also increases their vulnerability to fishing.
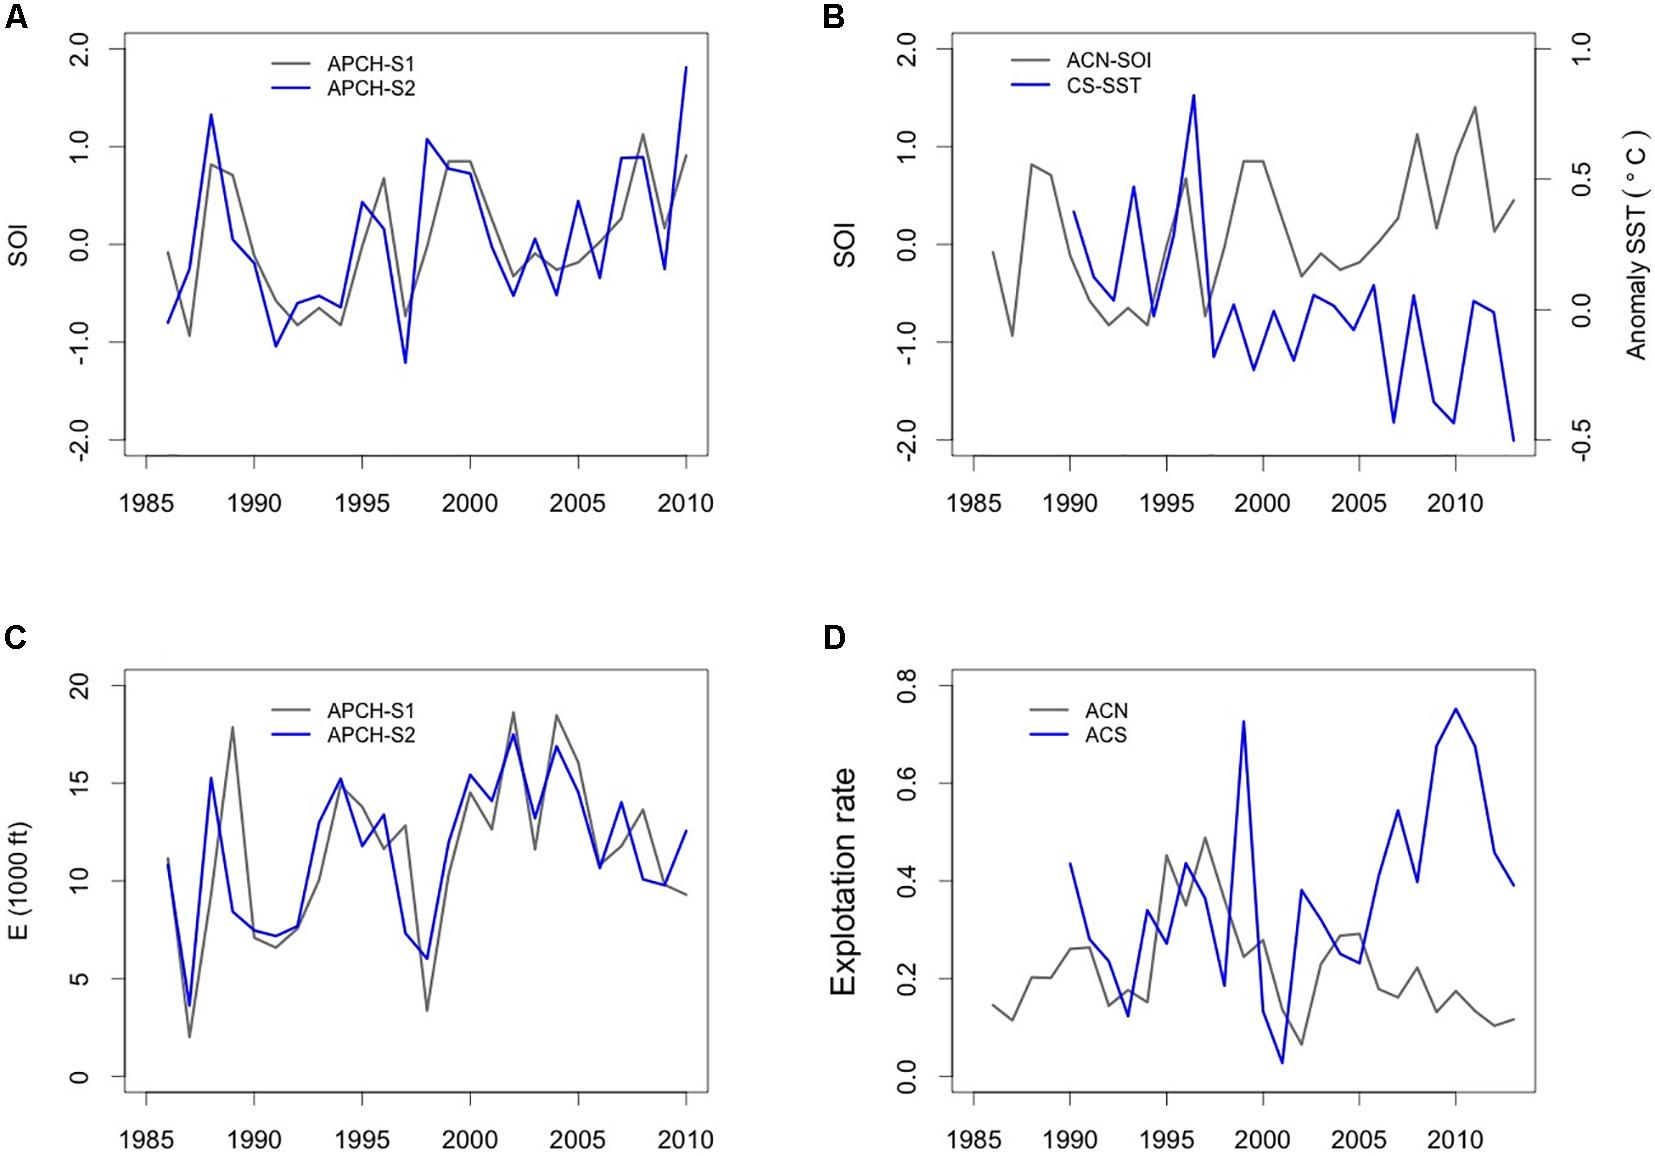
Figure 5. Climate and fishing predictors of the anchovy and common sardine biomass dynamics off Chile. (A) Southern Oscillation Index (SOI) climate predictors for the anchovy population of southern Peru and northern Chile (APCH), (B) SOI for the anchovy population of central-northern Chile (ACN) and anomaly sea surface temperature (SST, °C) for the common sardine, (C) fishing effort as the number of fishing trips (ft) (y-axis has been/1000) for APCH. (D) Exploitation rates for the ACN and ACS populations.
The anchovy population (APCH-S1) did not show a climate–fishing interaction but rather a negative effect of climate (SOI) on the population growth rate, signaling that prevailing warm conditions seemed to have a positive effect on the growth rate of APCH-S1. Previous knowledge of the anchovy and climate conditions favoring the population growth of the species in northern Chile indicated that cool conditions (i.e., cold SSTs, intense upwelling) favored the recruitment of anchovy in the area (Cahuin et al., 2009) leading to a high level of biomass. We think that our results may be seen as a consequence of north–south migration during warm events rather than recruitment success. Salvatteci et al. (2018) found that anchovies persisted off Mejillones (northern Chile) for several decades from 1880 to 1905, when upwelling was dramatically reduced in the northern part of the Humboldt system due to warm conditions. Moreover, observations in this area during strong El Niño events showed that anchovies tended to move toward the coast and southward (Alheit and Niquen, 2004). Thus, warm events in northern Chile, such as those observed in the system before 2000, may trigger anchovy migration from areas beyond northern Chile, which may be seen through increases in the biomass in northern Chile.
The negative vertical climate effect on the population growth rate of the CS implied that a decrease in the local SSTs could have a positive effect on its population growth rate. Figure 5B shows that SSTs in the CS habitat from the early 1990s to early 2010 tended to have negative anomalies, particularly after 2005. The climate conditions occurred almost simultaneously with the significant increase of the CS biomass after 2006. The relationship between the CS and climate variables such as the SST and recruitment has been previously studied. For instance, Cubillos and Arcos (2002) found that the recruitment of the CS had a negative correlation with SST anomalies during the prerecruitment period and the upwelling index in the peak of spawning, signaling that negative anomalies might favor CS recruitment. Recently, Gomez et al. (2012) found that recruitment and the CS recruitment rate had a negative correlation with the SSTs in the El Niño 34 region, indicating that cold habitat conditions favor CS recruitment. Moreover, the authors proposed that chlorophyll (which is significantly correlated with SST) is a good proxy for the abundance of food for the CS population and that changes in this quantity can substantially affect the survival of CS prerecruits, which determine the strength of a population in late spring. Hence, we believe that the climate conditions after 2006 were predominantly cold years off central-southern Chile (Corredor-Acosta et al., 2015), favoring chlorophyll-a production in the austral spring–summer (Aguirre et al., 2018) and, therefore, the recruitment success and the population growth rate of CS.
Effect of fishing was found on all anchovy populations, although the effects were mostly relevant only in the ACS population due to the high exploitation rates after the year 2000 (Figure 5D). Two clear oscillations were present in the ACS population, where the second-order effect was more significant than the first-order effect. Thus, at an early stage, we hypothesized that fishing (or an alternative specialist predator) may have played a more significant role in the dynamics of the ACS population, causing the typical oscillations observed in a predator–prey relationship (Berryman and Turchin, 1997). Although no explicit effect of fishing on this anchovy population has been detected before, Pedraza and Cubillos (2008) discussed the presence of a second-order effect in the anchovy population off central-southern Chile, proposing the hypothesis of the effect of a specialist predator on the ACS. Currently, the ACS is a collapsed fishery off central-southern Chile that is characterized by low levels of recruitment and low spawning biomass (Zuñiga, 2017).
Here, we used biomass estimates derived from the Chilean stock assessment of SPF as the input to infer population dynamics in our proposed models. Ideally, a more independent source for biomass observations (e.g., from fishery-independent surveys) should be used because the original population models (Berryman and Turchin, 2001; Lima and Naya, 2011) should be fed with empirical observations rather than estimates from models. However, fishery-independent biomass observations are fragmented for the anchovy and CS fisheries in Chile because they span a short time window, show discontinuity, and do not always have a consistent sampling window (Supplementary Table S1). Therefore, these features preclude their incorporation into the population models proposed in this study for these species.
In addition, the biomass estimates from the stock assessment may overlook potential biases, correlation among estimates, and the structural assumptions of the original assessment model (Brooks and Deroba, 2015). We believe that we accounted for these aspects using Kalmar filter analysis (Hosack et al., 2013) rather than a non-linear regression (Lima and Naya, 2011 and similar). The Kalmar filter assumes both observation and process error, and thus, the estimates of biomass from the stock assessment were tractable as input in the proposed population model. In addition, the Kalmar filter accounts for potential correlation among estimates, which is a desirable property when working with possibly correlated data, such as the outputs from a stock assessment, or structural assumptions (e.g., the existence of fishing mortality). Because the Kalman filter accounts for both process and observation error, the overall uncertainty in the biomass estimates is higher compared to the estimates from the stock assessments (Figure 4 and Supplementary Figure S1). Moreover, all unmeasured effects (exogenous effects) were included within the error (Eq. 6) as part of the uncertainty of the biomass. Therefore, the proposed statistical treatment of our data supported the hypothesis that fishing, climate, and density-dependent factors may influence the population dynamics of the anchovy and CS populations in Chile.
We used a simple logistic model with linear assumptions about the relationship between the per capita growth rate and their predictors (density dependence, climate, and fishing). The variability explained by the density-dependent and density-independent factors in the selected models fluctuated from 62 to 68%, depending on the population. The predictability of these models may improve with further explorations that focus on covariables, such as predators and competitor biomass, and that consider the trophic role of the species or even additional climate predictors. In addition, the assumption of linearity between the per capita growth rate and the predictors could be relaxed. In this context, Pedraza and Cubillos (2008) used generalized additive models (GAMs) to explore the endogenous effect on the CS and anchovy population dynamics, which explained the higher level of variance. In this study, to simplify the analysis, we used a simple linear assumption considering the numbers of predictors and populations.
The current management of the SPF in Chile is based on a single-species model approach that does not explicitly include climate variability. The failure to include climate variability may cause fisheries to be considered either underexploited during favorable regimes or overexploited during unfavorable climate conditions. On the other hand, not including density-dependent effects when modeling is equivalent to assuming an infinite compensatory effect (Hilborn and Walters, 1992) in which recruitment is unaffected by decreases of biomass, which increases the risk of overfishing (Rose et al., 2001). Our approach does not offer a straightforward solution for including climate and density-dependence effects in the management of these populations but rather identified critical drivers of the anchovy and CS populations in the southern Humboldt Current ecosystem. The approach used here and the identification of the underlying drivers of SPF biomass can be seen as a step forward in the ecosystem approach to fisheries management.
Data Availability Statement
Publicly available datasets were analyzed in this study. This data can be found here: www.ifop.cl, https://www.ncdc.noaa.gov/teleconnections/enso/indicators/soi/, and https://modis.gsfc.nasa.gov/data/dataprod/mod28.php.
Ethics Statement
Ethical review and approval was not required for the animal study because we used public information.
Author Contributions
TC wrote most of the manuscript, developed the ideas, interpreted the results, and created the tables and some figures. ML interpreted the results and reviewed the final manuscript. RW developed the ideas, interpreted the results, wrote some of the manuscript, and reviewed the final manuscript. JC-R performed and wrote the statistical analyses. UC contributed to collecting the climate time series. JM contributed to creating the figures.
Funding
TC was supported by the CONICYT-FONDECYT Post-Doctoral Project No. 3160248. ML, RW, and JM were supported by the CONICYT Project CAPES FB 0002. JC-R was partially supported by FONDECYT No. 11190116.
Conflict of Interest
The authors declare that the research was conducted in the absence of any commercial or financial relationships that could be construed as a potential conflict of interest.
Acknowledgments
We acknowledged the two reviewers of this paper who contributed to improving the first version of this manuscript. We also thank the Instituto de Fomento Pesquero (IFOP, Chile) for providing the fishing effort information used in this work.
Supplementary Material
The Supplementary Material for this article can be found online at: https://www.frontiersin.org/articles/10.3389/fmars.2020.00082/full#supplementary-material
Footnotes
References
Aguirre, C., García-Loyola, S., Testa, G., Silva, D., and And Farías, L. (2018). Insight into anthropogenic forcing on coastal upwelling off south-central Chile. Elem. Sci. Anth. 6:59. doi: 10.1525/elementa.314
Alheit, J. (1987). Egg cannibalism versus egg predation: their significance in anchovies. S. Afr. J. Mar. Sci. 5, 467–470. doi: 10.2989/025776187784522694
Alheit, J., and Bakun, A. (2010). Population synchronies within and between ocean basins: apparent teleconnections and implications as to physical–biological linkage mechanisms. J. Mar. Syst. 79, 267–285. doi: 10.1016/j.jmarsys.2008.11.029
Alheit, J., Di Lorenzo, E., Rykaczewski, R., and Sundby, S. (2019). Drivers of dynamics of small pelagic fish resources: environmental control of long-term changes. Deep-Sea Res. Pt II 159, 1–3. doi: 10.1016/j.dsr2.2018.12.005
Alheit, J., and Niquen, M. (2004). Regime shifts in the humboldt current ecosystem. Prog. Oceanogr. 60, 201–222. doi: 10.1016/j.pocean.2004.02.006
Alheit, J., and Peck, M. (2019). Drivers of dynamics of small pelagic fish resources: biology, management and human factors. Mar. Ecol. Prog. Ser. 61, 1–6. doi: 10.3354/meps12985
Alheit, J., Roy, C., and Kifani, S. (2009). “Decadal-scale variability in populations,” in Climate Change and Small Pelagic Fish, eds D. Check-ley, J. Alheit, Y. Oozeki, and C. Roy (Cambrigde: Cambrigde University Press).
Anderson, C. N. K., Hsieh, C.-H., Sandin, S. A., Hewitt, R., Hollowed, A., Beddington, J., et al. (2008). Why fishing magnifies fluctuations in fish abundance. Nature 452, 835–839. doi: 10.1038/nature06851
Andreo, V., Lima, M., Provensal, C., Priotto, J., and Polop, J. (2009). Population dynamics of two rodent species in agroecosystems of central Argentina: intra-specific competition, land-use, and climate effects. Popul. Ecol. 51, 297–306. doi: 10.1007/s10144-008-0123-3
Aranis, A., Gómez, A., Caballero, L., Ramírez, M., Eisele, G., González, M., et al. (2017). Informe final, investigación situación pesquería pelágica zona centro-sur, 2016. Seguimiento del estado de situación de las principales pesquerías nacionales. Subsecretaría de Pesca. Inst. Fom. Pesq. 213. Available online at: www.ifop.cl
Ayón, A., Criales-Hernandez, M. I., Schwamborn, R., and Hirche, H.-J. (2008). Zooplankton research off Peru: a review. Prog. Oceanogr. 79, 238–255. doi: 10.1016/j.pocean.2008.10.020
Belgrano, A., Lima, M., and Stenseth, N. C. (2004). Non-linear dynamics in marine-phytoplankton population systems. Mar. Ecol. Prog. Ser. 273, 281–289. doi: 10.3354/meps273281
Berryman, A. (2001). Functional web analysis. Detecting the structure of population dynamics from multi-species time series. Basic Appl. Ecol. 2, 311–321. doi: 10.1078/1439-1791-00069
Berryman, A., and Turchin, P. (2001). Identify the density-dependent structure underlying ecological time series. Oikos 92, 265–270. doi: 10.1034/j.1600-0706.2001.920208.x
Berryman, A. A. (1999). Principles of Population Dynamics and Their Application. London: Stanley Thornes.
Berryman, A. A., and Kindlmann, P. (2008). Populations Systems: A General Introduction. Berlin: Springer.
Berryman, A. A., and Turchin, P. (1997). Detection of delayed density dependence: comment. Ecology 78, 318–320. doi: 10.1890/0012-9658(1997)078
Bertrand, A., Chaigneau, A., Peraltilla, S., Ledesma, J., Graco, M., Monetti, F., et al. (2011). Oxygen: a fundamental property regulating pelagic ecosystem structure in the coastal southeastern tropical Pacific. PLoS ONE 6:e29558. doi: 10.1371/journal.pone.0029558
Bertrand, A., Segura, M., Mauriano, G., and Vásquez, L. (2004). From small-scale habitat populations off Peru. Fish Fish. 5, 296–316. doi: 10.1111/j.1467-2679.2004.00165.x
Bertrand, S., Dewitte, B., Tam, J., Díaz, E., and Bertrand, A. (2008). Impacts of Kelvin wave forcing in the Peru Humboldt Current system: scenarios of spatial reorganizations from physics to fishers. Prog. Oceanogr. 79, 278–289. doi: 10.1016/j.pocean.2008.10.017
Beverton, R. J. A. (1990). Small marine pelagic fish and the threat of fishing; are they endangered? J. Fish Biol. 37, 5–16. doi: 10.1111/j.1095-8649.1990.tb05015.x
Brooks, E. N., and Deroba, J. J. (2015). When “data” are not data: the pitfalls of post hoc analyses that use stock assessment model output. Can. J. Fish. Aquat. Sci. 72, 634–641. doi: 10.1139/cjfas-2014-0231
Burnham, K., and Anderson, D. (2004). Model Selection and Multimodel Inference. A Practical Information – Theoretic Approach. New York, NY: Springer-Verlag.
Cahuin, S., Cubillos, L., Ñiquen, M., and Escribano, R. (2009). Climatic regimes and the recruitment rate of anchoveta, Engraulis ringens, off Peru. Estuar. Coast. Shelf Sci. 84, 591–597. doi: 10.1016/j.ecss.2009.07.027
Canales, T. M. (2014). Estatus y posibilidades de explotación biológicamente sustentables de los principales recursos pesqueros nacionales, 2015. Anchoveta XV-II Regiones. Informe Estatus y Cuota 65. Available online at: www.ifop.cl
Canales, T. M., Law, R., and Blanchard, J. L. (2016). Shifts in plankton size spectra modulate growth and coexistence of anchovy and sardine in upwelling systems. Can. J. Fish. Aquat. Sci. 73, 611–621. doi: 10.1139/cjfas-2015-0181
Chavez, F. P., Ryan, J., Lluch-Cota, S. E., and Ñiquén, M. C. (2003). From anchovies to sardines and back: multidecadal change in the Pacific Ocean. Science 299, 217–221. doi: 10.1126/science.1075880
Checkley, D. M., Asch, R. G., and Rykaczewski, R. (2017). Climate, anchovy, and sardine. Annu. Rev. Mar. Sci. 9, 469–493. doi: 10.1146/annurev-marine-122414-033819
Corredor-Acosta, A., Morales, C. E., Hormazabal, S., Andrade, I., and Ramirez-Correa, M. (2015). Phytoplankton phenology in the coastal upwelling region off central-southern Chile (35°S–38°S): time-space variability, coupling to environmental factors, and sources of uncertainty in the estimates. J. Geophys. Res. Oceans 120, 813–831. doi: 10.1002/2014JC010330
Cubillos, L. A., and Arcos, D. F. (2002). Recruitment of common sardine (Strangomera bentincki) and anchovy (Engraulis ringens) off central-south Chile in the 1990s and the impact of the 1997–1998 El Niño. Aquat. Living Resour. 15, 87–94. doi: 10.1016/s0990-7440(02)01158-0
Cubillos, L. A., Claramunt, G., and And Castro, L. (2014). Simulation of fishery-induced changes on the reproductive cycle of common sardine, Strangomera bentincki, off central southern Chile. Fish. Res. 160, 103–111. doi: 10.1016/j.fishres.2013.12.003
Cubillos, L. A., Serra, R., and Freon, P. (2007). Synchronous pattern of fluctuation in three anchovy fisheries in the humboldt current system. Aquat. Living Resour. 20, 69–75. doi: 10.1051/alr:2007017
Essington, T. E., Moriarty, P. E., Froehlich, H. E., Hodgson, E. E., Koehn, L. E., Oken, K. L., et al. (2015). Fishing amplifies forage fish population collapses. Proc. Natl. Acad. Sci. U.S.A. 112, 6648–6652. doi: 10.1073/pnas.1422020112
Food and Agriculture Organisation [FAO] (2019). Fishery and Aquaculture Statistics 2017 – Yearbook. Available at: http://www.fao.org/3/ca5495t/ca5495t.pdf.
Garcés, C., Niklitschek, E. J., Plaza, G., Cerna, F., Leisen, M., Toledo, P., et al. (2019). Anchoveta Engraulis ringens along the Chilean coast: management units, demographic units and water masses: insights from multiple otolith-based approaches. Fish. Oceanog. 28, 735–750. doi: 10.1111/fog.12455
Gomez, F., Montecinos, A., Hormazabal, S., Cubillos, L., Correa-Ramirez, M., and Chavez, F. (2012). Impact of spring upwelling variability off southern-central Chile on common sardine (Strangomera bentincki) recruitment. Fish. Oceanog. 21, 405–414. doi: 10.1111/j.1365-2419.2012.00632.x
Hay, D., Schweigert, J., Boldt, J. L., and Thompson, M. (2019). Temporal changes in size-at-age: impacts and implications for reproductive biology, egg density and management of Pacific herring in British Columbia. Deep-Sea Res. Pt II 159, 42–51. doi: 10.1016/j.dsr2.2018.04.008
Hilborn, R., and Walters, C. J. (1992). Quantitative Fisheries Stock Assessment: Choice, Dynamics, and Uncertainty. New York, NY: Chapman and Hall.
Hosack, G. R., Trenkel, V. M., and Dambacher, J. M. (2013). The relative importance of environ-mental stochasticity, interspecific interactions, and observation error: insights from sardine and anchovy landings. J. Mar. Syst. 125, 77–89. doi: 10.1016/j.jmarsys.2012.09.003
Hyndman, R. J., and Khandakar, Y. (2008). Automatic time series forecasting: the forecast package for R. J. Stat. Softw. 27:3. doi: 10.18637/jss.v027.i03
Irigoien, X., and de Roos, A. (2011). The role of intraguild predation in the population dynamics of small pelagic fish. Mar. Biol. 158, 1683–1690. doi: 10.1007/s00227-011-1699-2
Kalman, R. E. (1962). A new approach to linear filtering and prediction problems. J. Basic Eng. 82, 94–35.
Leal, E., and Canales, C. (2014). Estatus y posibilidades de explotación biológicamente sustentables de los principales recursos pesqueros nacionales, 2015. Anchoveta III-IV Regiones. Informe Estatus y Cuota 53. Available online at: www.ifop.cl
Lima, M., Ernest, S. K. M., Brown, J., Belgrano, A., and Stenseth, N. (2008). Chihuahuan desert kangaroo rats: nonlinear effects of population dynamics, competition, and rainfall. Ecology 89, 2594–2603. doi: 10.1890/07-1246.1
Lima, M., and Estay, S. (2013). Warming effects in the western Antarctic peninsula ecosystem: the role of population dynamic models for explaining and predicting penguin trends. Popul. Ecol. 55, 557–565. doi: 10.1007/s10144-013-0386-1
Lima, M., and Naya, D. (2011). Large-scale climatic variability affects the dynamics of tropical skipjack tuna in the Western Pacific Ocean. Ecography 34, 597–605. doi: 10.1111/j.1600-0587.2010.06422.x
Lima, M., Stenseth, N. C., and Jaksic, F. M. (2002). Foob web structure and climate effects on the dynamics of small mammals and owls in semiarid Chile. Ecol. Lett. 5, 273–284. doi: 10.1046/j.1461-0248.2002.00312.x
Lindegren, M., Checkley, D. M., Rouyer, T., MacCall, A. D., and Stenseth, N. (2013). Climate, fishing, and fluctuations of sardine and anchovy in the California current. Proc. Natl. Acad. Sci. U.S.A. 110, 13672–13677. doi: 10.1073/pnas.1305733110
Link, J. S., and Browman, H. I. (2014). Integrating what? Levels of marine ecosystem-based assessment and management. ICES J. Mar. Sci. 71, 1170–1173. doi: 10.1093/icesjms/fsu026
MacCall, A. (2009). “Mechanisms of low-frequency fluctuations in sardine and anchovy populations,” in Climate Change and Small Pelagic Fish, eds D. Checkley, J. Alheit, Y. Oozeki, and C. Roy (Cambridge: Cambridge University Press).
Neira, S. (2008). Assessing the Effects of Internal (Trophic Structure) and External (Fishing and Environment) Forcing Factors on Fisheries Off Central Chile: Basis For an Ecosystem Approach to Management. PhD Thesis, University of Cape Town, Cape Town.
Pedraza, M., and Cubillos, L. (2008). Population dynamics of two small pelagic fish in the central-south area off Chile: delayed density-dependence and biological interaction. Environ. Biol. Fish. 82, 111–122. doi: 10.1007/s10641-007-9260-3
R Core Team (2017). R: A Language and Environment for Statistical Computing. Vienna: R foundation for Statistical Computing.
Rose, K., Cowan, J., Winemiller, K. O., Myers, R. A., and Hilborn, R. (2001). Compensatory density dependence in fish populations: importance, controversy, understanding and prognosis. Fish Fish. 2, 293–327. doi: 10.1046/j.1467-2960.2001.00056.x
Royama, T. (1977). Population persistence and density-dependence. Ecol. Monogr. 47, 1–35. doi: 10.2307/1942222
Salvatteci, R., Field, D., Gutiérrez, D., Baumgartner, T., Ferreira, V., Ortlieb, L., et al. (2018). Multifarious anchovy and sardine regimes in the Humboldt current system during the last 150 years. Glob. Change Biol. 24, 1055–1068. doi: 10.1111/gcb.13991
SERNAPESCA (2017). Anuarios Estadisticos de Pesca 2017. Available at: http://www.sernapesca.cl/informes/estadisticas.
Sheiner, L., and Beal, S. (1981). Some suggestions for measuring predictive performance. J. Pharmacokinet. Phar. 9, 503–512. doi: 10.1007/bf01060893
Stenseth, N. C., Mysterud, A., Ottersen, G., Hurrell, J. W., Chan, K. S., and Lima, M. (2002). Ecological effects of climate fluctuations. Science 297:1292. doi: 10.1126/science.1071281
Swartzman, G., Bertrand, A., Gutiérrez, M., Bertrand, S., and Vasquez, L. (2009). The relationship of anchovy and sardine to water masses in the Peruvian Humboldt Current System from 1983 to 2005. Prog. Oceanogr. 79, 228–237. doi: 10.1016/j.pocean.2008.10.021
Turchin, P. (2003). Complex Population Dynamics: A Theoretical/Empirical Synthesis. Princeton, NJ: Princeton University Press.
Turchin, P., and Taylor, A. D. (1992). Complex dynamics in ecological time series. Ecology 73, 289–305. doi: 10.2307/1938740
Zuñiga, M. J. (2017). Estatus y Posibilidades de Explotación Biológicamente Sustentables de los Principales Recursos Pesqueros año 2017. Informe 2 de Estatus. Available at: www.ifop.cl
Zuñiga, M. J., and Canales, C. (2014). Estatus y posibilidades de explotación biológicamente sustentables de los principales recursos pesqueros nacionales, año 2014. Anchoveta V-X Regiones Cuarto Informe 78. Available online at: www.ifop.cl
Keywords: Chile, anchovy, sardine, density dependence, temperature, effort, Southern Oscillation Index
Citation: Canales TM, Lima M, Wiff R, Contreras-Reyes JE, Cifuentes U and Montero J (2020) Endogenous, Climate, and Fishing Influences on the Population Dynamics of Small Pelagic Fish in the Southern Humboldt Current Ecosystem. Front. Mar. Sci. 7:82. doi: 10.3389/fmars.2020.00082
Received: 30 June 2019; Accepted: 31 January 2020;
Published: 06 March 2020.
Edited by:
Francisco Leitão, University of Algarve, PortugalReviewed by:
Hui Zhang, Chinese Academy of Sciences, ChinaLuis A. Cubillos, University of Concepción, Chile
Copyright © 2020 Canales, Lima, Wiff, Contreras-Reyes, Cifuentes and Montero. This is an open-access article distributed under the terms of the Creative Commons Attribution License (CC BY). The use, distribution or reproduction in other forums is permitted, provided the original author(s) and the copyright owner(s) are credited and that the original publication in this journal is cited, in accordance with accepted academic practice. No use, distribution or reproduction is permitted which does not comply with these terms.
*Correspondence: T. Mariella Canales, bWFyaWVsbGEuY2FuYWxlc0BnbWFpbC5jb20=