 Samantha Cope
 Ellen Hines
 Roger Bland
 Jerry D. Davis
 Brendan Tougher
 Virgil Zetterlind
- 1ProtectedSeas, Anthropocene Institute, Palo Alto, CA, United States
- 2Estuary & Ocean Science Center, San Francisco State University, Tiburon, CA, United States
- 3Department of Geography & Environment, San Francisco State University, San Francisco, CA, United States
- 4Department of Physics & Astronomy, San Francisco State University, San Francisco, CA, United States
Vessel traffic management systems can be employed for environmental management where vessel activity may be of concern. One such location is in San Francisco Bay where a variety of vessel types transit a highly developed urban estuary. We analyzed vessel presence and speed across space and time using vessel data from the Marine Monitor, a vessel tracking system that integrates data from the Automatic Identification System and a marine-radar sensor linked to a high-definition camera. In doing so, we provide data that can inform collision risk to cetaceans who show an increased presence in the Bay and evaluation of the value in incorporating data from multiple sources when observing vessel traffic. We found that ferries traveled the greatest distance of any vessel type. Ferries and other commercial vessels (e.g., cargo and tanker ships and tug boats) traveled consistently in distinct paths while recreational traffic (e.g., motorized recreational craft and sailing vessels) was more dispersed. Large shipping vessels often traveled at speeds greater than 10 kn when transiting the study area, and ferries traveled at speeds greater than 30 kn. We found that distance traveled and speed varied by season for tugs, motorized recreational and sailing vessels. Distance traveled varied across day and night for cargo ships, tugs, and ferries while speed varied between day and night only for ferries. Between weekdays and weekends, distance traveled varied for cargo ships, ferries, and sailing vessels, while speed varied for ferries, motorized recreational craft, and sailing vessels. Radar-detected vessel traffic accounted for 33.9% of the total track distance observed, highlighting the need to include data from multiple vessel tracking systems to fully assess and manage vessel traffic in a densely populated urban estuary.
Introduction
Vessel traffic monitoring systems are often used for maritime surveillance and traffic control in coastal areas (e.g., Wahab et al., 2016; Zhen et al., 2017) but can also be employed for environmental protection purposes. Monitoring vessel activity can help local management institutions assess compliance with protected area and/or fisheries regulations (Bergseth et al., 2015; Elahi et al., 2018; Elvidge et al., 2018; Longépé et al., 2018; Hsu et al., 2019; Kurekin et al., 2019). Many marine protected areas (MPAs) fail to meet thresholds for effective management due to staff and budget capacity (Gill et al., 2017). Vessel traffic monitoring systems can provide an unbiased and data-based solution as an alternative to traditional onboard observers or manned patrol activity (Bartholomew et al., 2018).
Vessel tracking technologies, such as the Automatic Identification System (AIS), inform an understanding of vessel use of the marine environment through time and space. The International Maritime Organization (IMO) requires all transiting ships of greater than 300 gross tonnage, and all commercial passenger vessels, to broadcast static information on a vessel and its voyage and dynamic information on the vessel’s geolocation, heading, and speed throughout the voyage (International Maritime Organization [IMO], 2018). AIS data has helped detect illegal fishing (Longépé et al., 2018; Kurekin et al., 2019), model underwater noise pollution (Erbe et al., 2014; Redfern et al., 2017; Cholewiak et al., 2018), and inform risk assessments of collisions between ships and large whales (Williams and O’Hara, 2010; Wiley et al., 2011; van der Hoop et al., 2012; Conn and Silber, 2013; Redfern et al., 2013; Jensen et al., 2015). Since AIS was not originally designed for environmental management, there are limitations to the use of AIS in this capacity (Robards et al., 2016).
AIS may not provide a complete picture of vessel activity since vessel operators can turn off onboard AIS transponders (McCauley et al., 2016), it relies on user input and onboard equipment functioning (Schwehr and McGillivary, 2007), and most small-scale fisheries or recreational vessels may not meet the size at which AIS data transmission is required by law. Solutions have been proposed to fill these data gaps including ship- and land-based radar, and air- and space-born radar (Bloisi et al., 2015). Radar technology uses electromagnetic pulses to determine a vessel’s geolocation and speed (Calvo-Gallego and Pérez-Martínez, 2012; Bole et al., 2013). Radar systems with an Automatic Radar Plotting Aid track unique live targets whose attributes can later be stored for post hoc analysis (Nohara et al., 2008). Satellite images, digital photographs, and video can also be used to supplement vessel and activity detection and tracking (e.g., Taborda and Silva, 2012; Bloisi et al., 2017; Bartholomew et al., 2018; James et al., 2019). The Marine Monitor (M2) is a low-cost proprietary coastal monitoring system developed by ProtectedSeas (2019) that integrates these multiple components including AIS, off-the-shelf marine radar, and a high-definition camera.
The M2 was initially designed to assist in vessel monitoring of remote MPAs. The ecological benefits of MPAs, like fish stock replenishment, habitat protection, and anticipated increased biodiversity, are dependent on implementation and enforcement of restrictions on activities (Edgar et al., 2014). The M2 autonomously monitors vessel traffic in coastal areas in place of physically manned patrols that require resources like boat-use, fuel, and human effort (ProtectedSeas, 2019). In addition to lowering these operational costs, the M2 provides a more affordable tool than military-grade radar equipment often utilized by law enforcement. Local sources in the Chesapeake Bay area and Costa Rica report that more complex radar systems utilizing this type of equipment for vessel monitoring in protected areas have a cost on the order of millions (Prudente, 2014; Costa Rican Times, 2014). The M2 keeps costs low (<$100,000 for hardware, software, and deployment and $2,500–$5,000/year for ongoing maintenance and support) by utilizing commercial marine radar systems and custom software (ProtectedSeas, 2019). It utilizes solar panels for its power supply and directs all data through a local computer which transmits over wireless internet to an online portal where users can view both live and historic data via an internet web browser. The M2 can provide managers with live situational awareness of their area without needing to be physically present on the water, and historical data can facilitate vessel activity analysis over time to inform future management decisions.
San Francisco Bay (SFB) in central California is the second largest estuary in the contiguous United States, is heavily urbanized, and is an ideal location for evaluating a vessel monitoring system, like the M2, that integrates data from different vessel tracking technologies as both commercial shipping, destined for major ports, heavy recreational vessel traffic filling over 80 marinas (Zabin et al., 2014), and high-speed ferries traverse its waters. Ships access six of California’s eleven major seaports via SFB, including Oakland, Richmond, San Francisco, Sacramento, Stockton, and Redwood City (California Department of Fish and Wildlife [CDFW], 2008). In 2016, the Port of Oakland was ranked sixth in total volume of cargo traffic in the United States (United States Army Corps of Engineers [USACE], 2018) and 60th in the world (Association of American Port Authorities [AAPA], 2016). There are few MPAs within SFB (covering approximately 12 km2 total across 8 unique sites, or <1% of the total SFB area) (California Department of Fish and Wildlife [CDFW], 2008), however further study on human use impacts is necessary to fully understand their effect on wildlife (Stern et al., 2017).
In addition to vessels, cetaceans also frequent SFB seasonally, in particular humpback (Megaptera novaeangliae) and gray whales (Eschrichtius robustus) (National Marine Fisheries Service [NMFS], 2017). Harbor porpoises (Phocoena phocoena) are in the Bay year round (Stern et al., 2017). Collisions with vessels of all sizes are a direct threat to cetacean species along the California coast (Dransfield et al., 2014; Irvine et al., 2014; Calambokidis et al., 2015). When an animal is struck, either by the vessel’s bow or by its propeller (Knowlton et al., 1995; Silber et al., 2010), the outcome can be death or serious injury (Moore et al., 2005; Campbell-Malone et al., 2008). In the SFB area, cetacean strandings and mortalities are often accompanied by evidence of vessel collisions (Barcenas-De la Cruz et al., 2017; Scordino et al., 2017). In May 2019, the National Oceanic and Atmospheric Administration declared an Unusual Mortality Event for gray whales due to elevated strandings off the U.S. west coast, some found within SFB (National Oceanic and Atmospheric Administration [NOAA], 2019).
Common ship-strike mitigation efforts include vessel route adjustments and speed restrictions. The likelihood of a lethal strike is significantly reduced at speeds below 10 kn (Laist et al., 2001; Vanderlaan and Taggart, 2007; Wiley et al., 2011) due to lower impact forces (Silber et al., 2010) and increased time for collision avoidance (Laist et al., 2001; Williams et al., 2016). On the U.S. east coast, these methods have been effective in reducing collisions (Laist et al., 2014; van der Hoop et al., 2015). On the U.S. west coast, a joint recommendation from the Greater Farallones and Cordell Bank National Marine Sanctuaries and The United States Coast Guard modified shipping lanes passing through sanctuary boundaries to improve navigational safety and avoid overlap with whale habitat (Joint Working Group on Vessel Strikes, and Acoustic Impacts [JWG], 2012). During peak whale migration season in 2017, the National Marine Fisheries Service issued a voluntary speed reduction to 10 kn in the shipping lanes (United States Coast Guard [USCG], 2017). SFB lies outside of these managed area boundaries.
With the growing presence of cetaceans in SFB and gray whales at a heightened risk, it is critical that we understand both the spatial and temporal trends in vessel traffic. The spatial and temporal extent of vessel use is vital to evaluating overlap with cetacean habitat (Redfern et al., 2013). This research utilized a new technology, the M2, to track major vessel classes within a portion of SFB using data collected via AIS broadcasts and radar combined with photographs for those vessels that did not broadcast AIS data. Results shed light on potential threats to cetaceans by answering the following questions: (1) how do vessel presence and speed vary spatially? and (2) are there temporal or seasonal differences in vessel presence or speed? A baseline understanding of vessel traffic provides a foundation for traffic management and future cetacean risk assessments in SFB. The methods used also provide insight on utilizing M2 for vessel monitoring.
Materials and Methods
Data Collection
We gathered vessel data for 1 year (13 February 2017–12 February 2018) using the M2 located at the Estuary & Ocean Science Center in Tiburon, California (Figure 1). The study area was defined by the maximum range of the marine radar sensor, approximately 60 km2 in the northern portion of the Central Bay, as this was smaller in spatial extent than the range of AIS detection points. AIS data are transmitted over very-high-frequency (VHF) channels (United States Coast Guard [USCG], 2016), while the radar relies on electromagnetic pulse reflections to identify solid objects, limiting the range of target detection due to the presence of land, bridges, and dock structures within the area. The M2 radar system tracks vessels within a range of 5 nmi (ProtectedSeas, 2019) but can regularly track targets at greater distances depending on sea state. Conditions in SFB allowed for vessels to be tracked across the study area defined in Figure 1. While the full area of SFB and its tributaries is large (approximately 1,400 km2), vessels must pass through the study area to access the major ports of Richmond, Sacramento, and Stockton, and the area is surrounded by ferry terminals and marinas on all sides. Therefore, the study area is representative of a range of vessel classes observed in SFB.
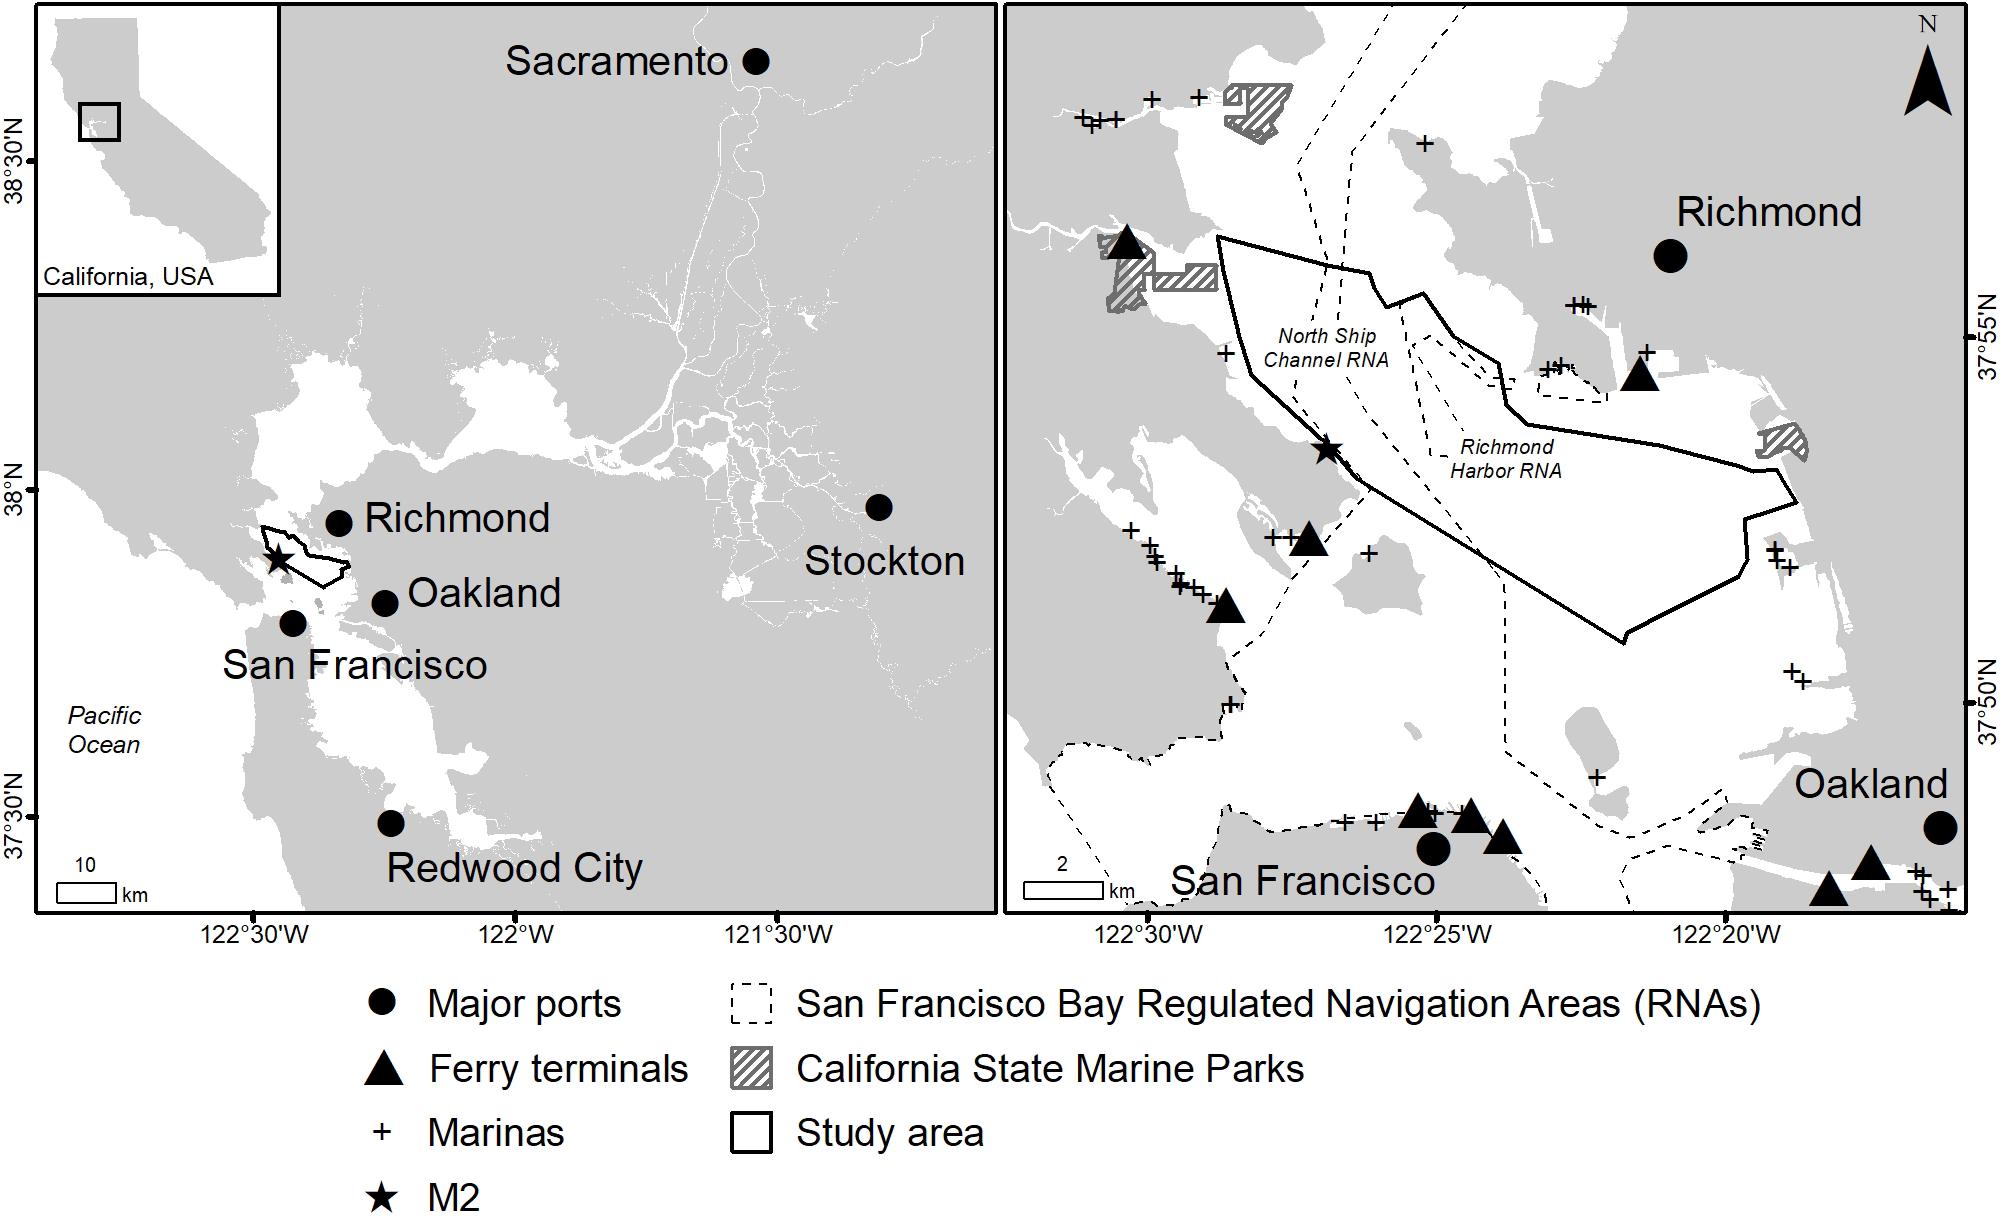
Figure 1. San Francisco Bay Area (left) with study area in the Central Bay (right) indicated by the solid black line. Locations of major ports, marinas, protected areas (California Department of Fish and Wildlife [CDFW], 2008), and ferry terminals (Golden Gate Bridge, Highway and Transportation District, 2017; San Francisco Bay Ferry, 2018) are also shown. San Francisco Bay Regulated Navigation Areas (RNAs) were digitized according to 33 CFR 165.1181. Those lying within study area boundaries are the North Ship Channel RNA and the Richmond Harbor RNA.
The M2 system provided spatial data in two formats. First, individual detection points reported dynamic information, including a vessel’s geolocation, range and bearing from the sensor, speed over ground, heading, unique voyage number, and vessel identification number. For vessels transmitting AIS data, this identification number was the Maritime Mobile Service Identity (MMSI). Second, vessel tracks provided lines connecting a vessel’s detection points joined in chronological order (Jensen et al., 2015; Redfern et al., 2017) and reported static information, including the unique voyage and vessel identification number, vessel type, and start date and time. For vessels transmitting AIS data, vessel type was reported in the static data via an AIS vessel type number. For vessels detected by radar, the camera linked to the radar sensor output, part of the M2 system, archived digital photographs of these vessels. We manually determined vessel type for all radar-detected vessels using these photographs which allowed us to include those vessel types that did not transmit AIS data. Interpretation of photographs was limited by daylight and weather conditions, so we consider our radar-detected vessel data to be an underestimate of total traffic.
Since the accuracy of AIS data is dependent on vessel user input and onboard equipment and transmitter functioning (Schwehr and McGillivary, 2007), we removed tracks from consideration that were likely erroneous or duplicates. Vessels transmitting AIS data with an invalid or missing MMSI number (<201000000 or >775999999) or AIS vessel type number (<10 or >100) were removed (Jensen et al., 2015; Redfern et al., 2017) since they could not be accurately identified (607 of 37,500 total AIS tracks observed, or 1.6%). We calculated the maximum speed statistic for all vessel tracks using the speed over ground attribute provided in the detection points, and removed any track with an unreasonable maximum speed (Rycyk et al., 2018). Due to the geographic complexity and heavy vessel use of SFB, we attributed maximum speeds greater than 50 kn to onboard equipment error or the detection of an aircraft by radar, and these tracks were removed from analysis (1,243 of 37,500 total AIS tracks observed, or 3.3%; 26 of 184,712 total radar tracks observed, or <0.01%).
The radar sensor tracked all vessels in its range regardless of whether vessels were transmitting AIS data, so the M2 system identified and removed radar-detected vessel tracks that duplicated AIS tracks. This is accomplished by associating detection points from the marine radar sensor with AIS detection points using the following qualifications: points were within 100 m in geolocation, were detected less than 15 s apart, had a difference in speed less than 1.5 kn, and had less than a 10-degree difference in heading. If two points met all requirements, one association was created. Radar-detected vessel tracks with more than 20 points associated with an AIS track were removed from consideration. Those vessel tracks with less than 20 associated detection points that duplicated AIS tracks were discovered in the photo-identification process and removed from consideration as well. Of the total 184,712 radar-detected tracks, 125,680, or 68.0%, had 20 or more AIS associations and were removed as a result of AIS track duplication; 671, or <0.01%, had less than 20 associations but were discovered and removed during photo-identification; and 37,232, or 20.2%, were removed due to inconclusive photos (including those at night).
Positional error of radar data (dependent on range) may have impacted radar and AIS track associations since one requirement is that both detection points be within 100 m in geolocation. Since AIS data is self-reported and relies on onboard equipment functioning, the positional error of this data is unknown. To rectify this error, we identified and removed false negatives in photo-identification, and we considered false positives to be highly unlikely due to ad hoc observation and the other requirements necessary for association, including similar speed and heading.
Data Analysis
Using a geographic information system (GIS), we projected (UTM Zone 10) and clipped vessel detection points and tracks to the extent of the study area (Environmental System Research Institute [ESRI], 2016). Both radar-detected vessels and vessels transmitting AIS data were reclassified into six major vessel classes that reflected the primary vessel types that used the study area: cargo, tanker, tug, ferry, motorized recreational vessels, and sailing vessels (Table 1). Due to occasional M2 outages, we only considered data from days with a full 24-h period of data acquisition in our analysis (January–March: n = 32 days, April–June: n = 45 days, July–September: n = 51 days, October–December: n = 47 days).
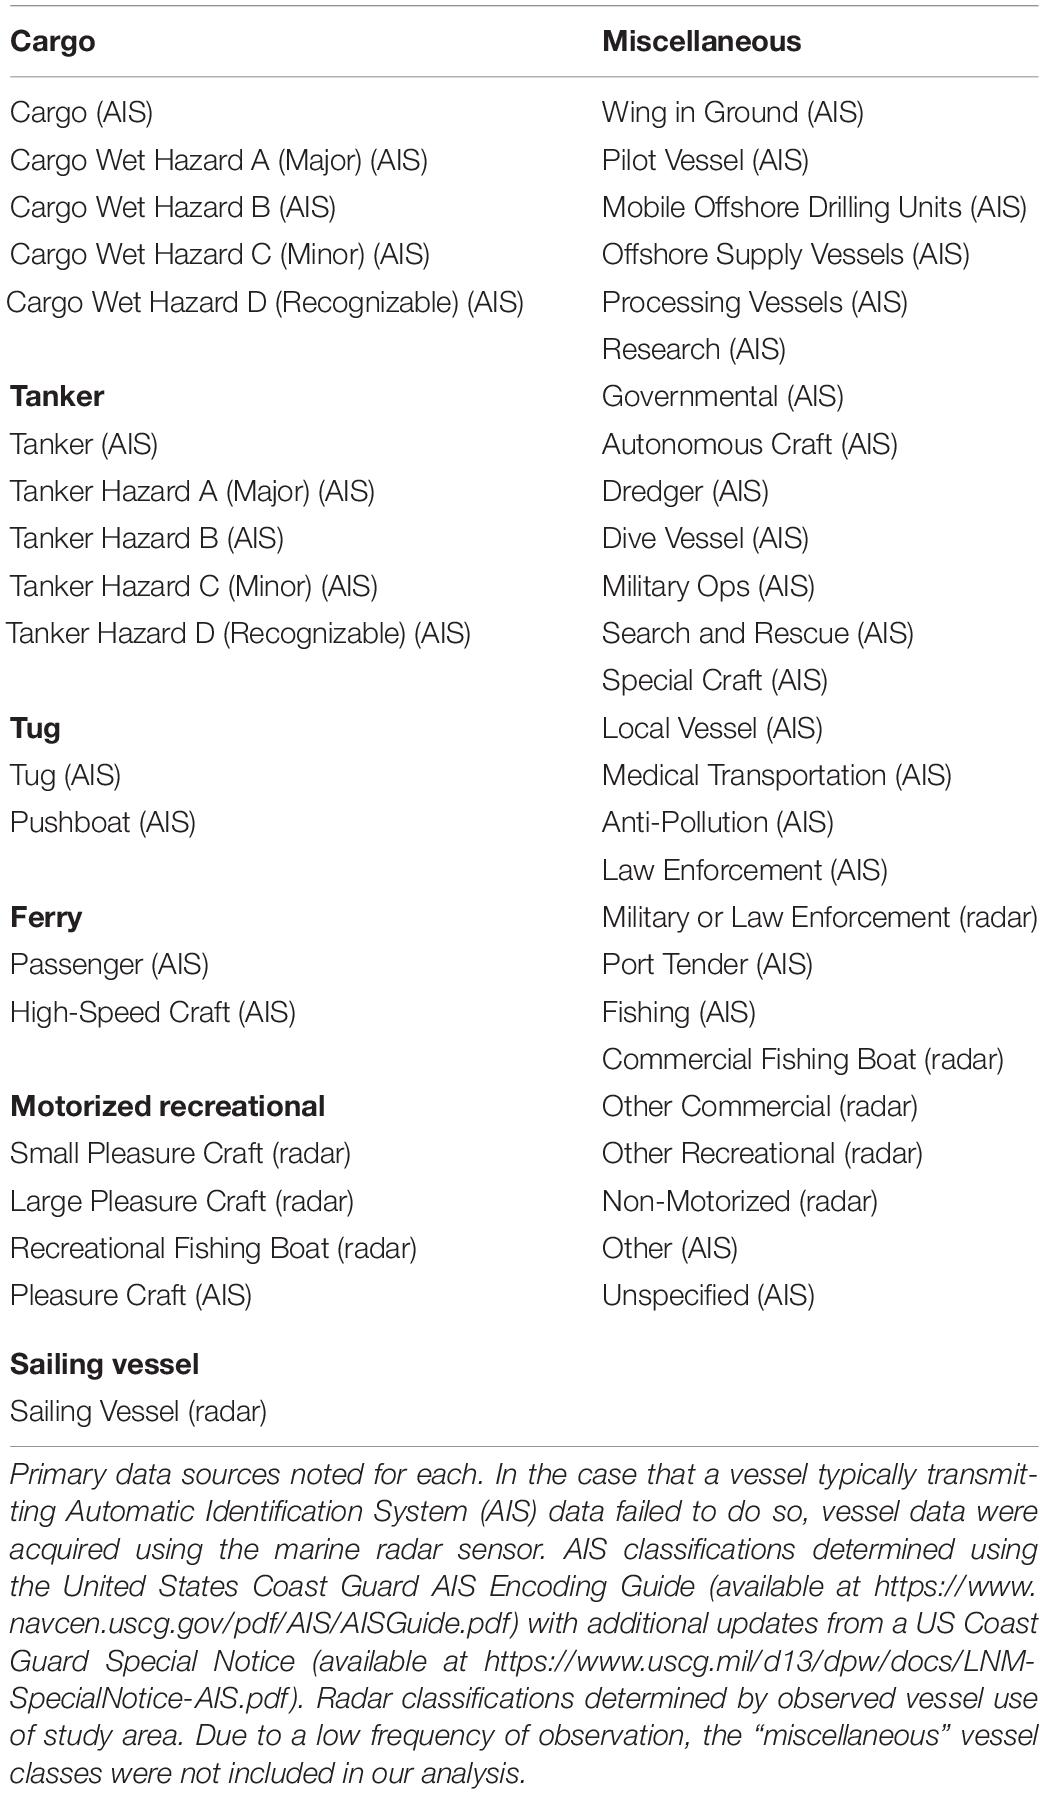
Table 1. Vessel types and vessel type classes.
Spatial Distribution of Vessel Traffic
First, we generated a grid across the study area in a GIS. To determine an appropriate cell-size we created a positional error model using the reported bearing accuracy of the radar sensor (±1°) (Furuno, 2016). With the formula,
we calculated the 2° arc length (corresponding to the reported accuracy of ±1°), where r was equal to the range under which 95% of the radar-detected points fell and used the resulting length (266 m) as the cell size. Only cells completely contained within the study area were used.
Next, we calculated density (trips per day) for each vessel class by counting the number of unique voyages within a cell and dividing by the total number of days observed. We also calculated median speed over ground using all detection points within a cell for each vessel class. Finally, we overlaid the density and speed maps to create a bivariate choropleth map for each vessel class to facilitate viewing both simultaneously.
Temporal Differences in Vessel Traffic
Using the start date and time of each vessel track, we analyzed daily vessel presence and speed across three temporal resolutions: season, day/night using local Pacific Time (PST/PDT), and weekday/weekend. We quantified vessel presence by summing the length of all tracks per day over the study area for each vessel class (Jensen et al., 2015). The speed over ground for all detection points within the study area was averaged for each day and for each vessel class. Seasons were assigned using commonly defined calendar quarters in the region: winter was assigned to January–March, spring to April–June, summer to July–September, and autumn to October–December (Forney and Barlow, 1998; Becker et al., 2014; Jensen et al., 2015). Tracks were assigned to day/night using the StreamMetabolism package in R (Sefick, 2016), which utilized the NOAA Solar Calculator to provide past sunrise and sunset times for Tiburon, California. If a vessel track began during the day (after sunrise and before sunset), we assigned a day/night attribute of 1. We assigned all other vessel tracks (those beginning at night) a day/night attribute of 0. Since those vessels solely detected by the marine radar sensor could not be identified in photographs at night, we restricted our day/night analysis to those vessels required to transmit AIS data (cargo and tanker ships, tugs, and ferries). Finally, if a vessel track began Monday-Friday, we assigned a weekday/weekend attribute of 1. We assigned all other vessel tracks (those beginning Saturday–Sunday) a weekday/weekend attribute of 0.
We used a Shapiro–Wilk test to find that median total track length and average speed across 175 days of data collection were not normally distributed across most temporal resolutions (Supplementary Tables 1–3). Consequently, we used the non-parametric Mood’s median test to compare the daily distances and speeds (Jensen et al., 2015). For those samples with a normal distribution, the test was less powerful, so we defined significance as p < 0.01 to ensure fewer type I errors across all vessel classes (Mood, 1950). We conducted post hoc analysis for vessel classes with a significant difference in daily distance or average speed across seasons.
Results
After the filtering process, 34,814 total tracks (AIS tracks: n = 19,626; radar-detected tracks: n = 15,188) remained for analysis. Data on commercial vessels were primarily provided by AIS, and data on recreational vessels were primarily provided by radar (Figure 2). AIS data provided track data across 64,281 nmi, or 66.1% of the total vessel distance tracked, while radar data provided track data across 33,008 nmi, or 33.9%. Ferries traveled the greatest total distance through the study area while cargo ships traveled the least total distance (Figure 2).
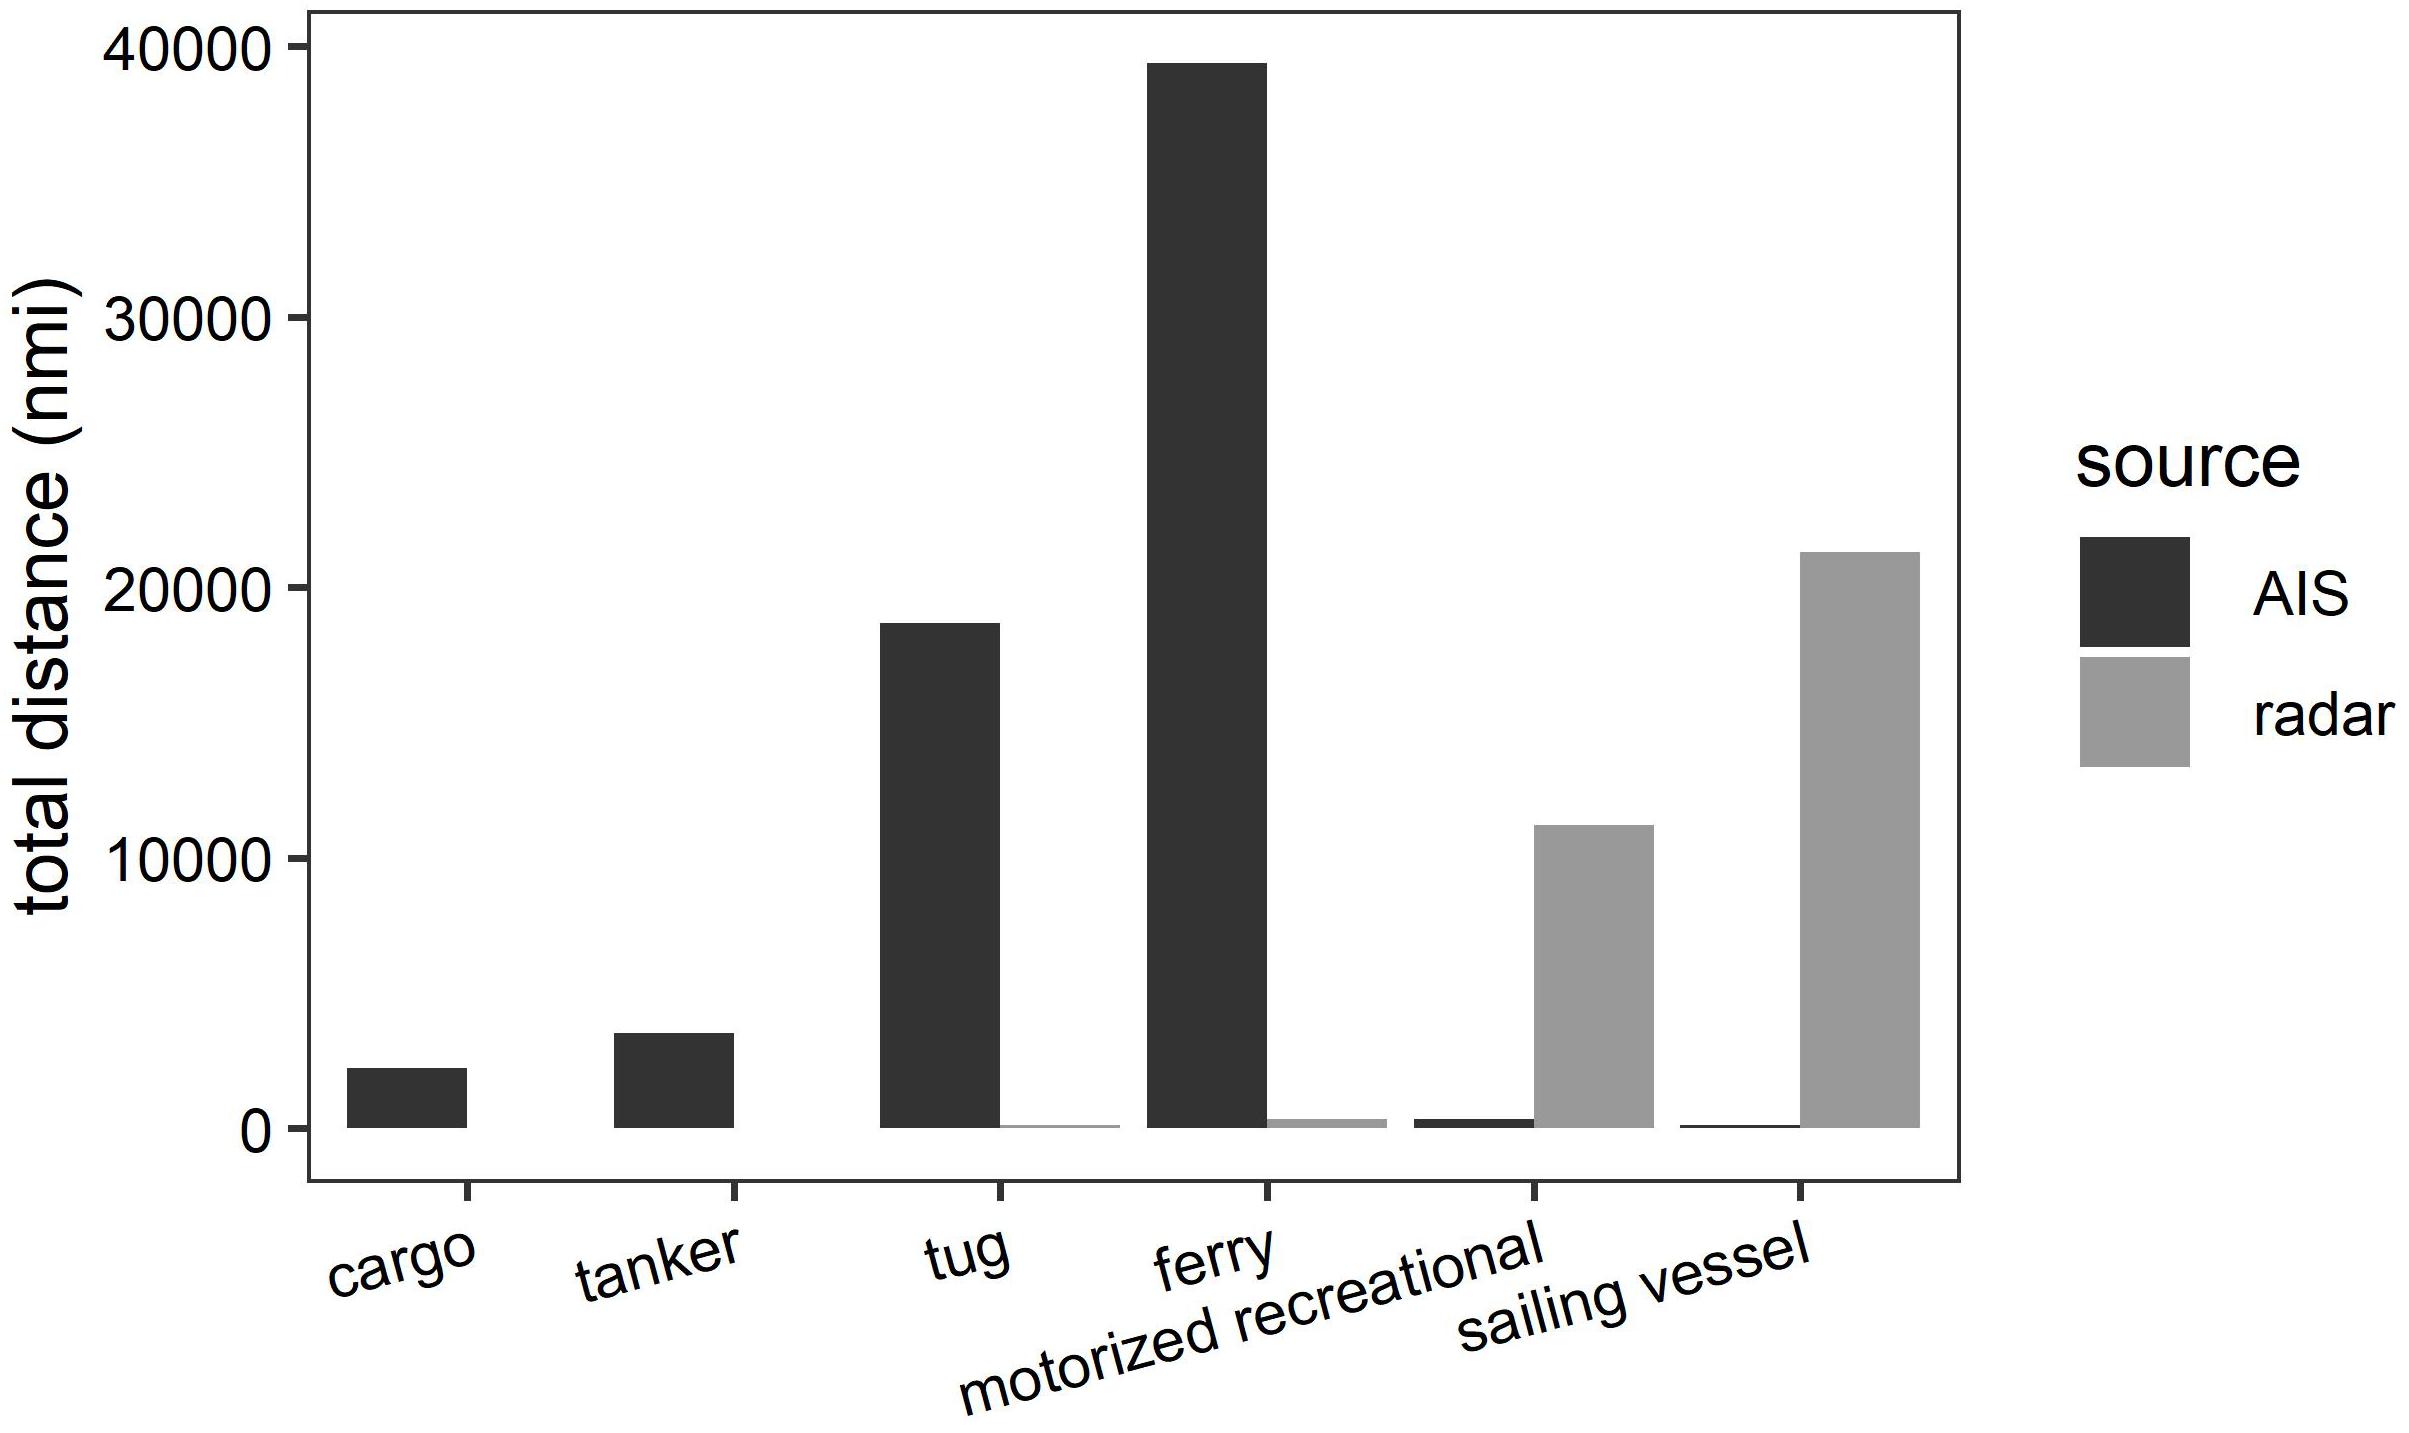
Figure 2. Total distance traveled in the study area (in nmi) across 175 days of 24-h data acquisition for all major vessel classes. Distance traveled is separated by data source (AIS or radar). Motorized recreational and sailing vessel distance calculation did not include vessel transits at night.
Spatial Distribution of Vessel Traffic
Commercial vessel traffic (cargo and tanker ships, tugs, and ferries) was most dense in distinct paths across the study area (Figures 3a–d). Cargo and tanker ships traveled almost exclusively through the North Ship Channel and Richmond Harbor Regulated Navigation Areas (RNAs) (Figures 3a,b). These vessels traveled at speeds greater than 10 kn while transiting through the study area but under 10 kn while transiting near the Port of Richmond. Tug and ferry traffic was also most dense within the RNAs but was more dispersed overall than the larger ship traffic (Figures 3c,d). A third distinct path for ferries outside the RNAs was evident in the northwest corner of the study area, likely traffic to the nearby ferry terminal.
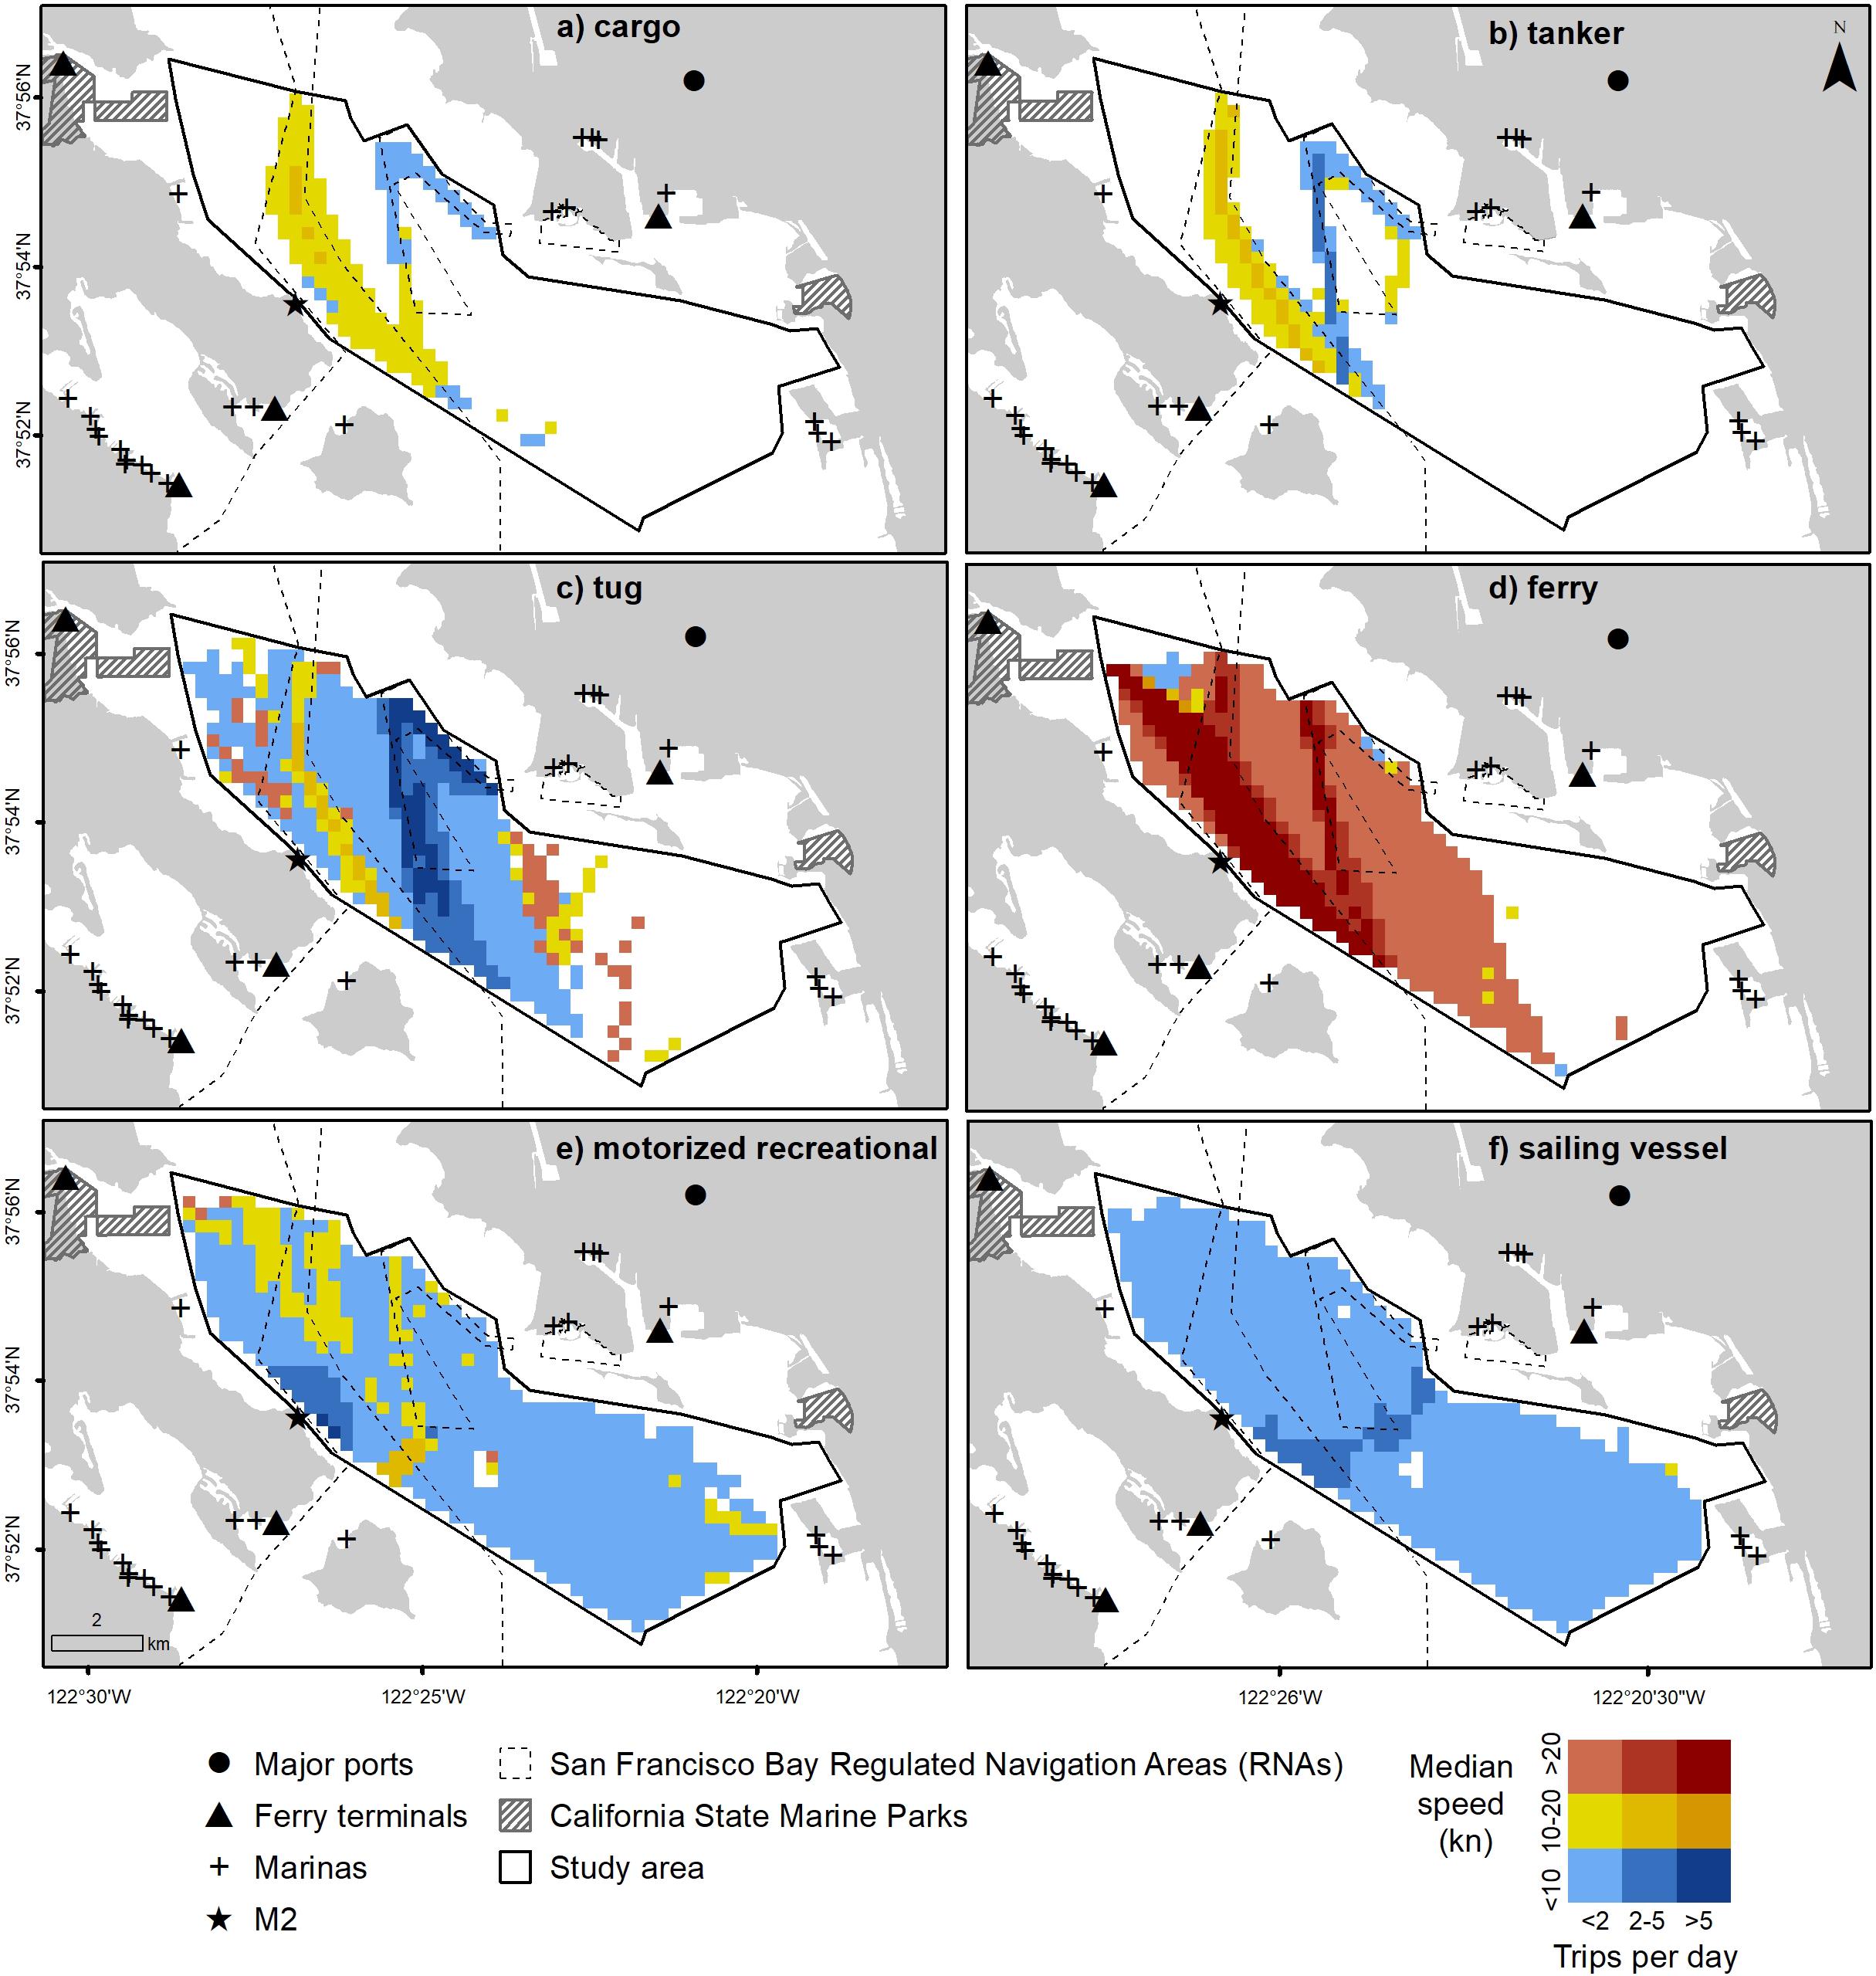
Figure 3. (a-f) Spatial distribution of trips per day and median speed for cargo (a), tanker (b), tug (c), ferry (d), motorized recreational (e), and sailing vessels (f). Cells colored blue indicate an average speed less than 10 kn, the voluntary speed restriction used in National Marine Sanctuaries outside SFB (United States Coast Guard [USCG], 2017). Locations of major ports, marinas, protected areas (California Department of Fish and Wildlife [CDFW], 2008), and ferry terminals (Golden Gate Bridge, Highway and Transportation District, 2017; San Francisco Bay Ferry, 2018) are also shown. San Francisco Bay Regulated Navigation Areas (RNAs) were digitized according to 33 CFR 165.1181.
Recreational vessel traffic was dispersed across much of the study area (Figures 3e,f). In the eastern portion, motorized recreational vessels traveled at speeds below 10 kn while some vessels in the western portion traveled at speeds greater than 10 kn (Figure 3e). Sailing vessel traffic was most dense across the center of the study area (Figure 3f). These vessels traveled almost exclusively under 10 kn across the entire study area.
Temporal Differences in Vessel Traffic
Seasons
Across vessel classes, median daily distance was greatest for ferries and lowest for cargo and tanker ships in all seasons (Figure 4), and no significant differences existed for these vessel classes between seasons. Significant differences in daily distance existed for tugs, motorized recreational, and sailing vessels (Table 2). Ferries traveled the fastest and sailing vessels the slowest of all vessel classes in all seasons (Figure 4). Significant differences in average speed between seasons existed for tugs, motorized recreational, and sailing vessels (Table 2). See Supplementary Tables 4–6 for detailed numeric results.
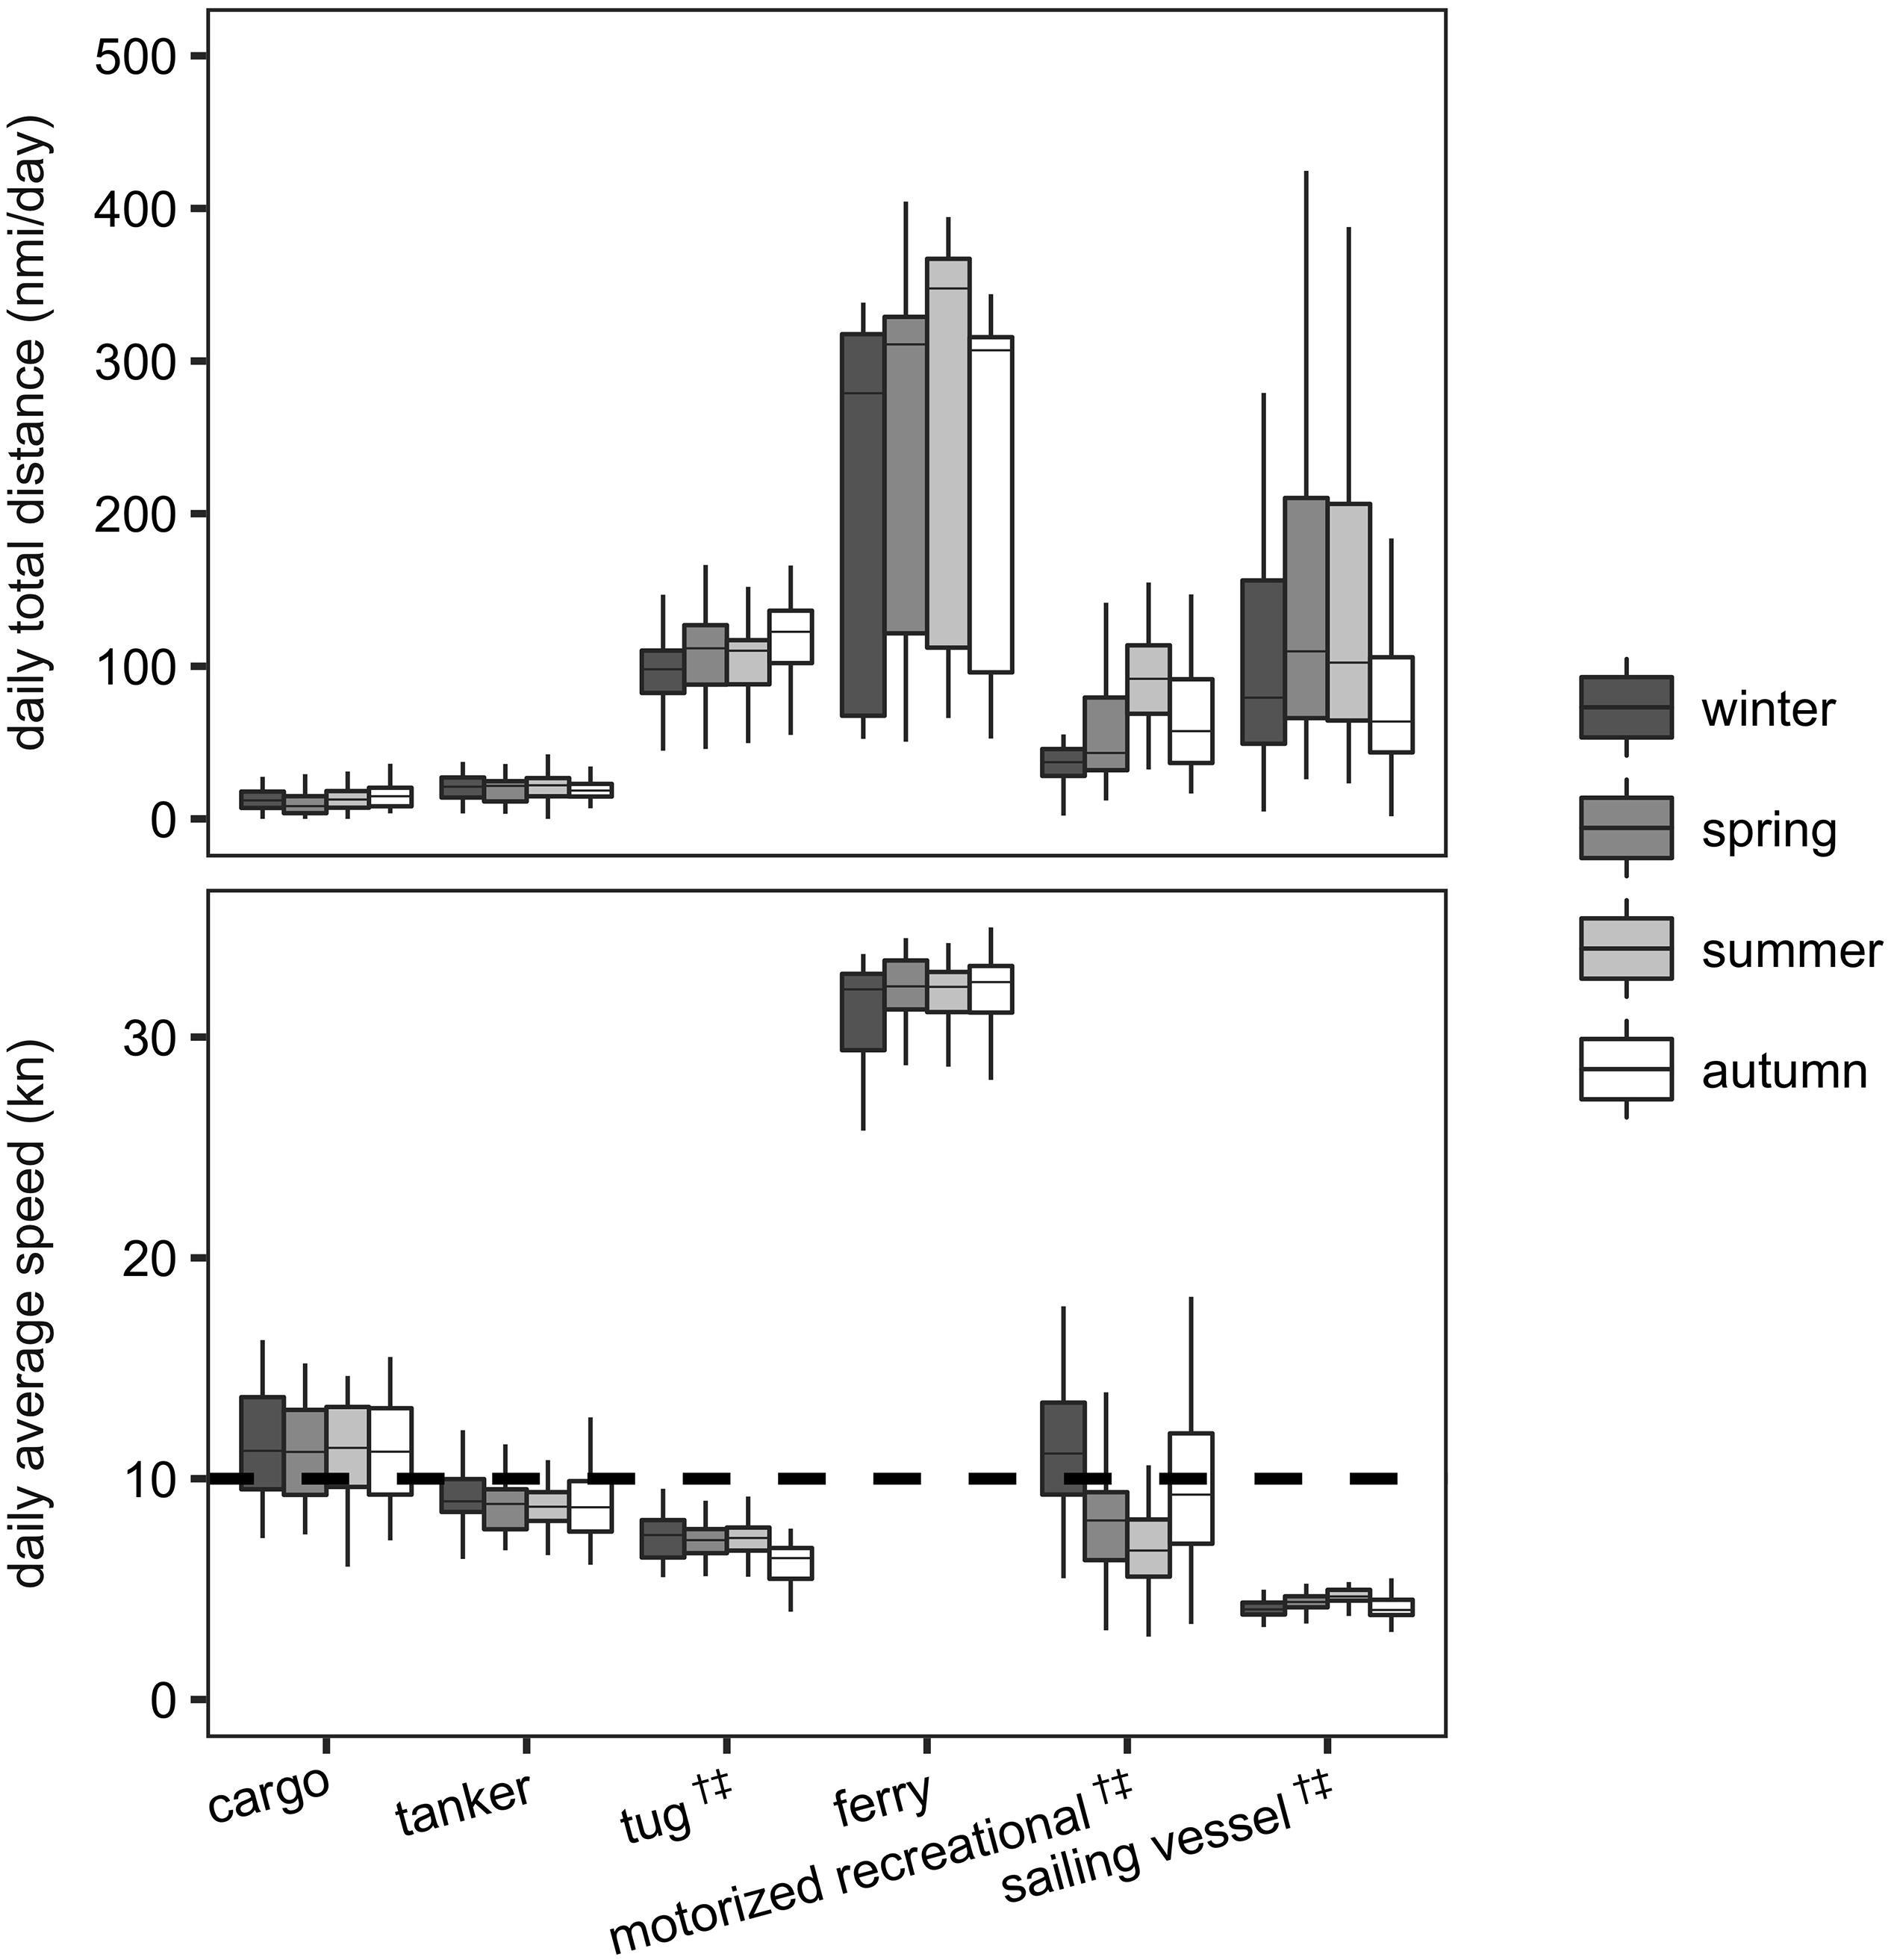
Figure 4. Daily distance (nmi/day) (top) and average speed (kn) (bottom) by season for each vessel class. Box and whisker plots show sample minimum, maximum, median, and first and third interquartile values. Outliers are not shown. Statistically significant differences in median daily distance between seasons denoted by † (p < 0.01). Statistically significant differences in median speed between seasons denoted by ‡ (p < 0.01). Dashed line indicates 10-kn voluntary speed restriction used in National Marine Sanctuaries outside San Francisco Bay (United States Coast Guard [USCG], 2017). Sample sizes: n1 = 32 days (winter), n2 = 45 days (spring), n3 = 51 days (summer), n4 = 47 days (autumn).
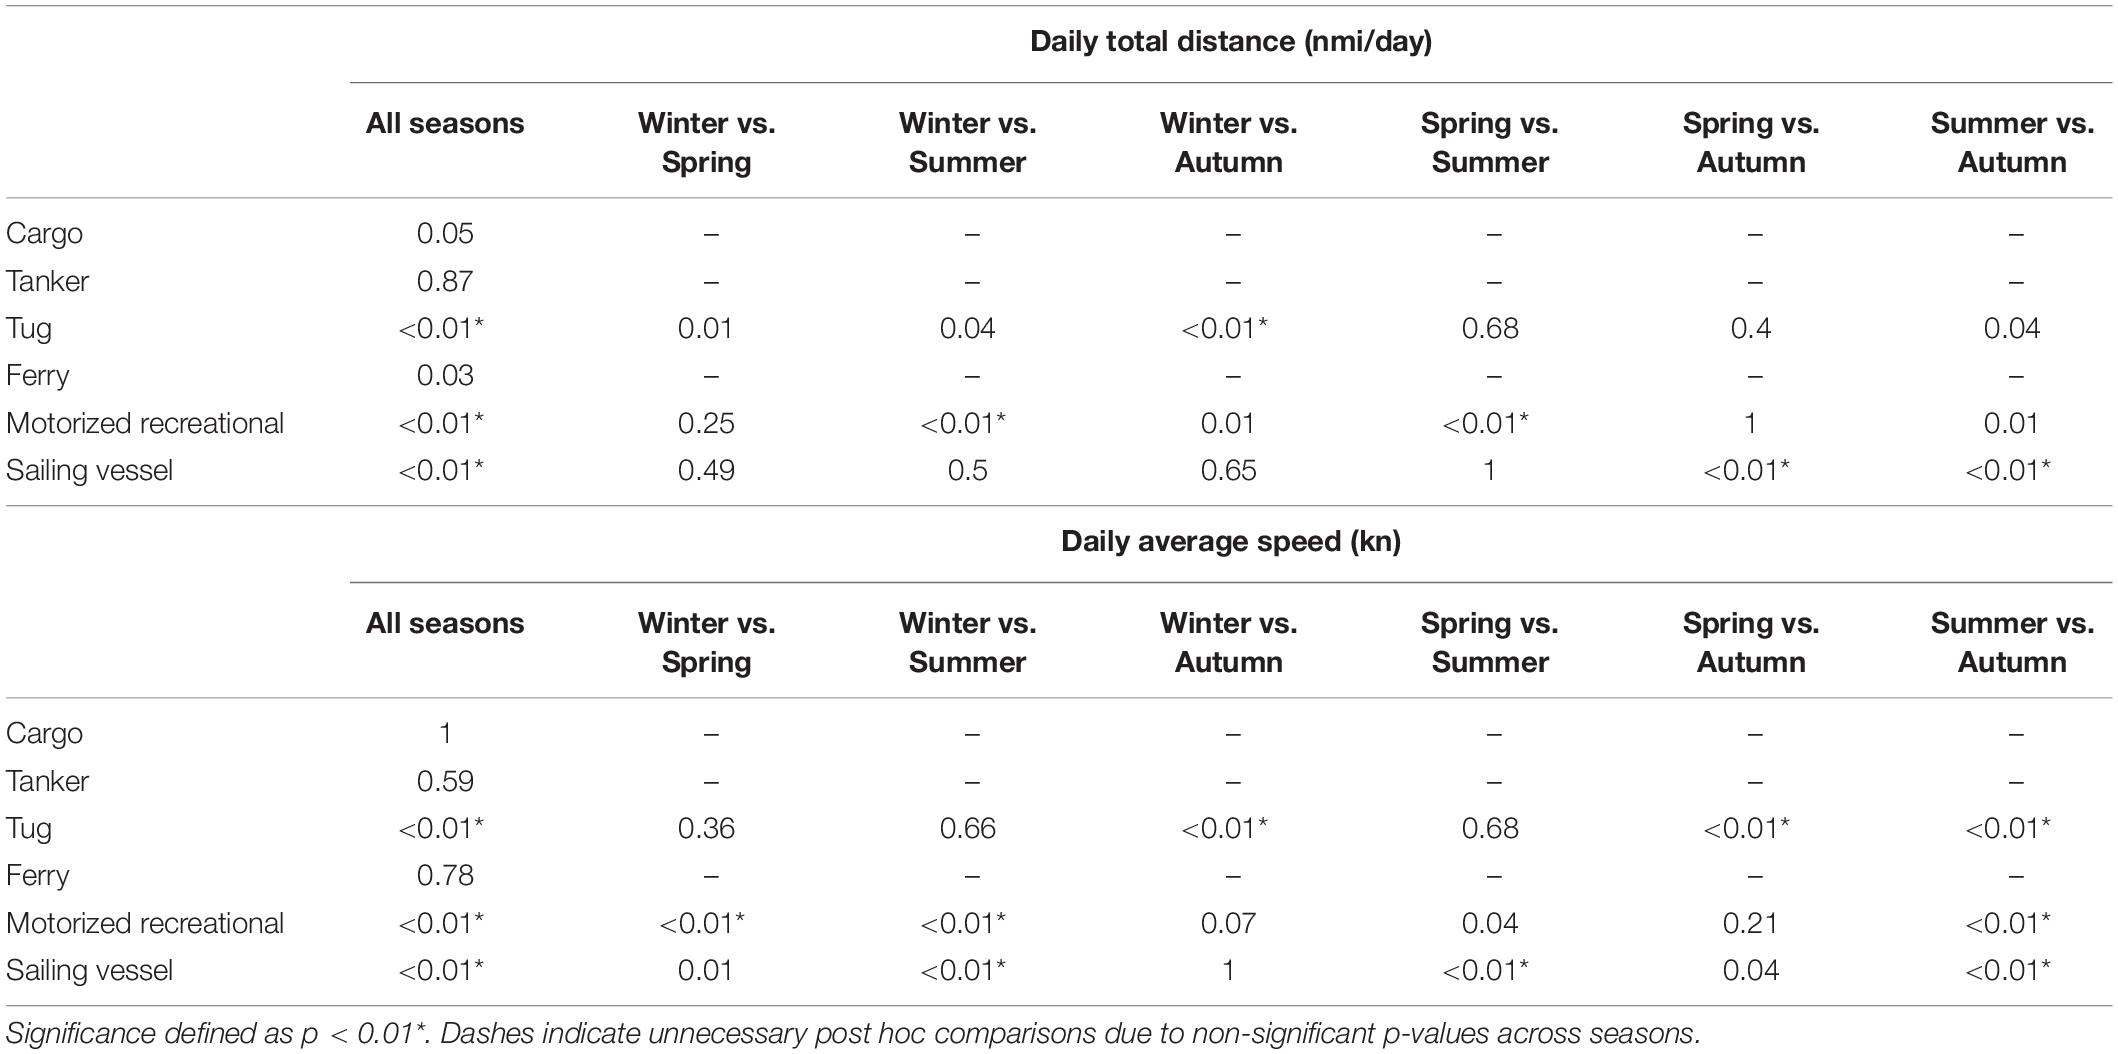
Table 2. Mood’s median test results (p-values) comparing daily total distance traveled (nmi/day) and daily average speed (kn) across seasons and post hoc analysis between seasons.
Day/Night
During the day, ferries traveled the farthest of all vessel classes while tugs traveled farthest at night (Figure 5). Both tugs and ferries traveled significantly less distance from day to night (Table 3). Ferries traveled the fastest of all vessel classes during the day and at night. Cargo ships traveled significantly faster at night, and there were no significant differences in daily distance or average speed for tanker ships.
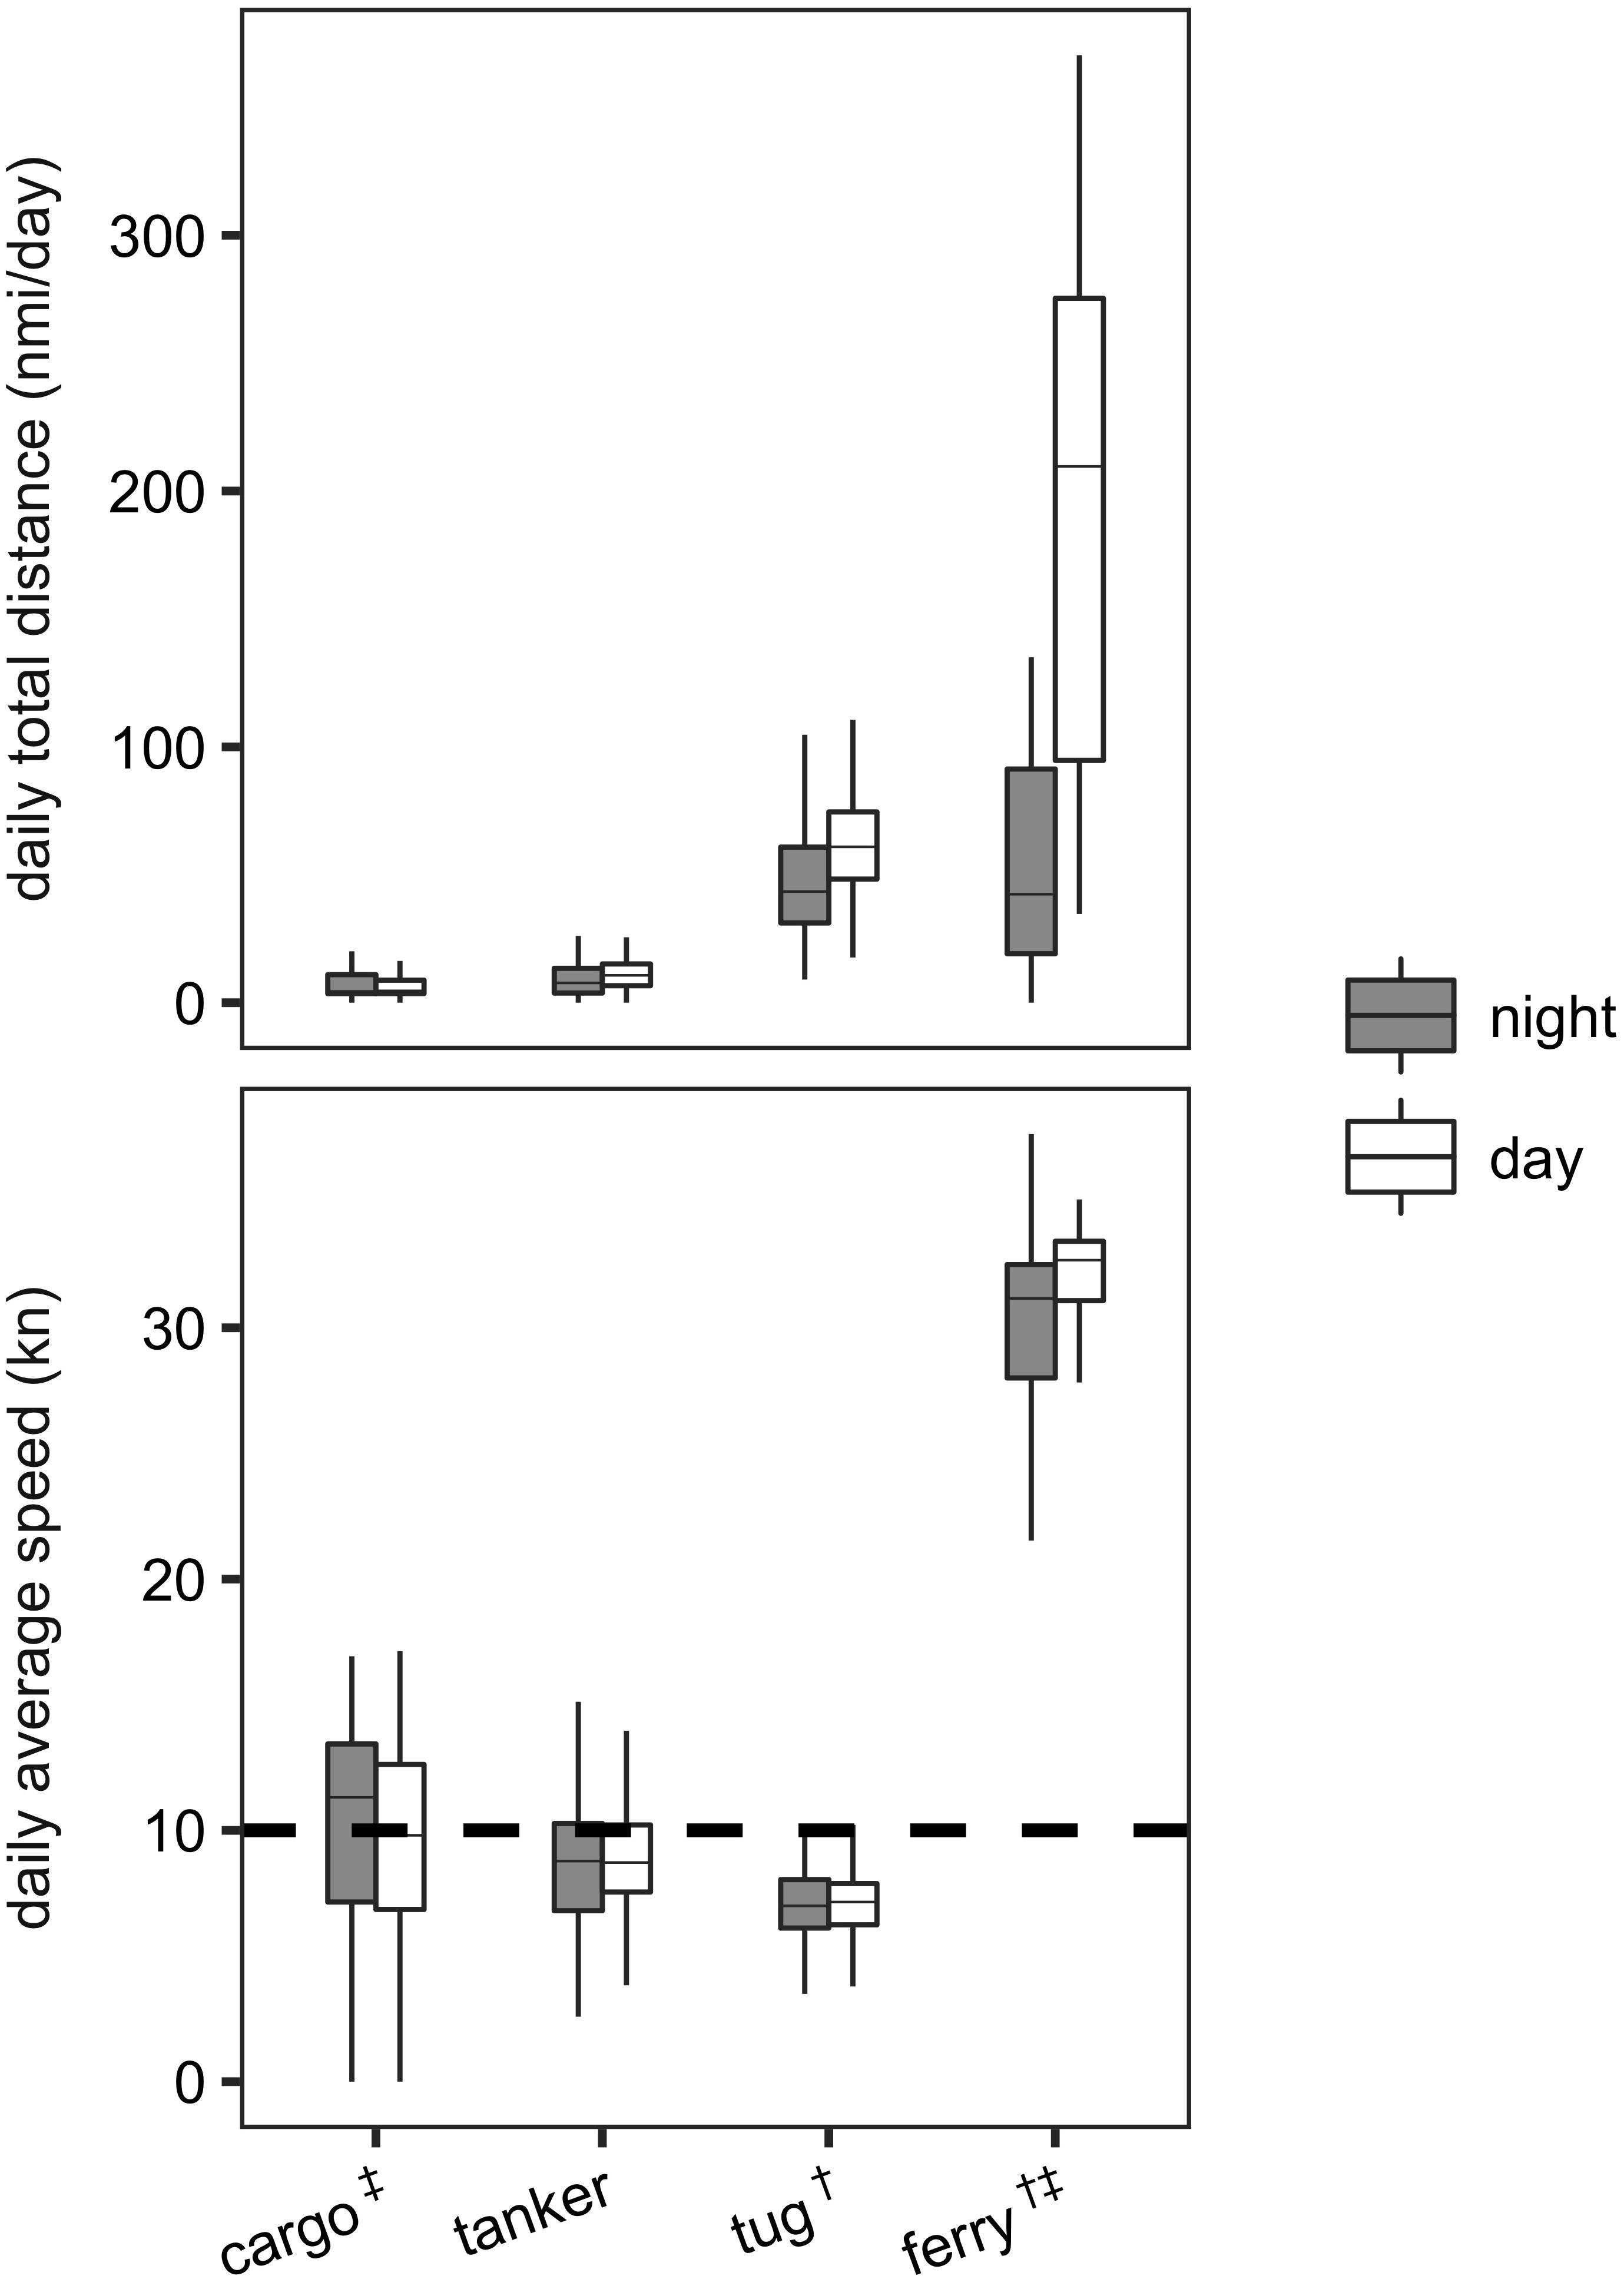
Figure 5. Daily distance (nmi/day) (top) and average speed (kn) (bottom) by day/night for each vessel class using exclusively AIS data. Box and whisker plots show sample minimum, maximum, median, and first and third interquartile values. Outliers are not shown. Statistically significant differences in median daily distance between day/night denoted by † (p < 0.01). Statistically significant differences in median speed between seasons denoted by ‡ (p < 0.01). Dashed line indicates 10-kn voluntary speed restriction used in National Marine Sanctuaries outside San Francisco Bay (United States Coast Guard [USCG], 2017). Sample sizes: n1 = 175 days (day), n2 = 175 days (night).
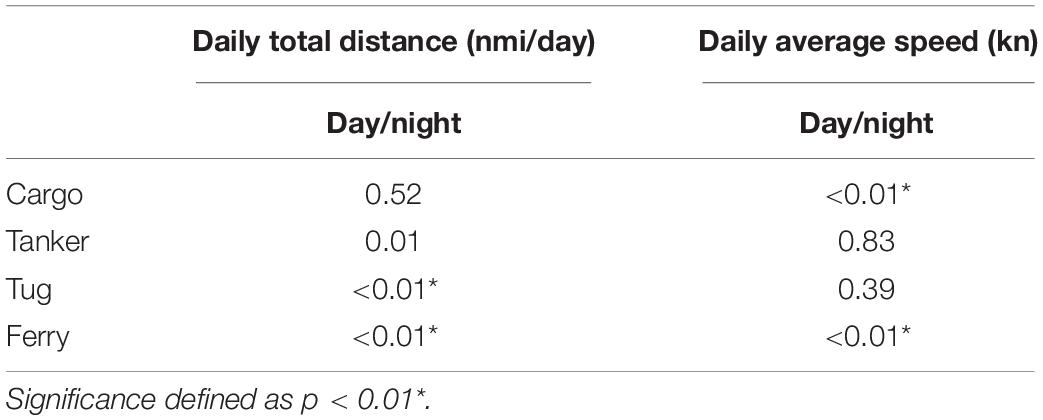
Table 3. Mood’s median test results (p-values) comparing daily total distance (nmi/day) and daily average speed (kn) across day/night.
Weekday/Weekend
Median daily distance was greatest on weekdays for ferries and greatest on weekends for sailing vessels (Figure 6). Significant differences in daily distance between weekdays and weekends existed for cargo ships, ferries, motorized recreational, and sailing vessels (Table 4). Motorized recreational and sailing vessels traveled significantly greater distance from weekdays to weekends. Ferries traveled the fastest of all vessel classes during both weekdays and weekends, but average speed decreased significantly from weekdays to weekends. Sailing vessels traveled significantly more slowly on weekends, although both weekday and weekend median values fell between 4.16 and 4.48 kn.

Figure 6. Daily distance (nmi/day) (top) and average speed (kn) (bottom) by weekday/weekend for each vessel class. Box and whisker plots show sample minimum, maximum, median, and first and third interquartile values. Outliers are not shown. Statistically significant differences in median daily distance between seasons denoted by † (p < 0.01). Statistically significant differences in median speed between weekday/weekend denoted by ‡ (p < 0.01). Dashed line indicates 10-kn voluntary speed restriction used in National Marine Sanctuaries outside San Francisco Bay (United States Coast Guard [USCG], 2017). Sample sizes: n1 = 118 days (weekdays), n2 = 57 days (weekends).
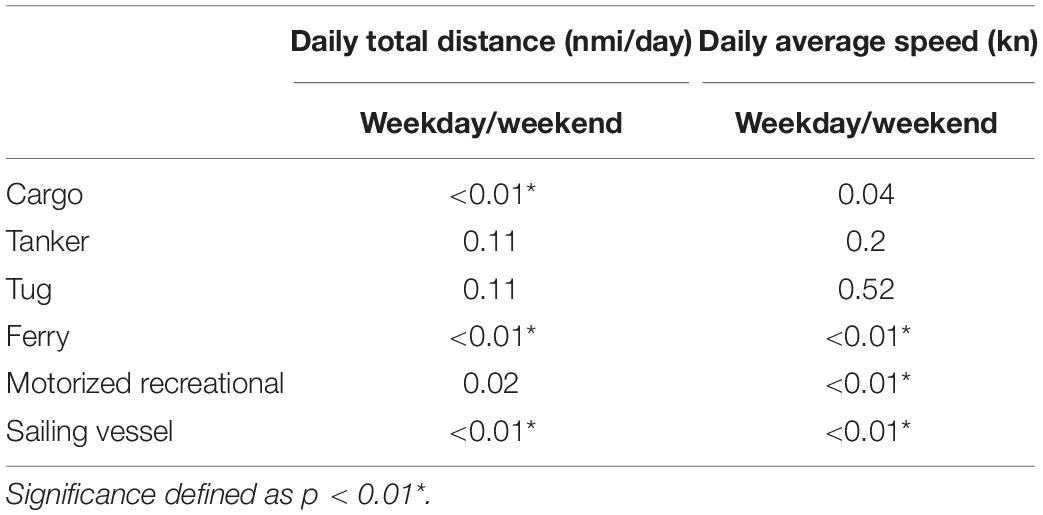
Table 4. Mood’s median test results (p-values) comparing daily total distance (nmi/day) and daily average speed (kn) across weekday/weekend.
Discussion
Vessel traffic was dominated by commercial high-speed ferry use in SFB, likely a response to growing congestion on roadways (Merrick et al., 2003; Weinrich, 2004). According to published schedules by the Golden Gate Ferry (Golden Gate Bridge, Highway and Transportation District, 2017) and San Francisco Bay Ferry (San Francisco Bay Ferry, 2018) services, ferries regularly operate throughout the day almost every day of the year and more frequently during the day than at night, which was reflected in our results. The increase we observed in ferry traffic on weekdays was also reflected in these schedules as service becomes more frequent on weekdays due to commuter traffic as opposed to more recreational use on weekends. This may also explain why we detected significantly faster speeds on weekdays. Slower speeds at night, which we also observed, are likely less influenced by commuter traffic and more by restricted visibility (Merrick et al., 2003).
For cargo and tanker ships, there were few significant temporal differences, suggesting that other drivers influence when these vessels use the study area and how fast they travel. The significant differences in cargo ship speeds between day/night and distance traveled between weekdays/weekends may be explained by the presence or absence of other vessel types. Large cargo ships may more easily transit the study area during times of reduced ferry traffic at night and reduced recreational traffic on weekdays. Tug boats typically escort these large vessels to assist with docking and steering but are also a multi-purpose platform, assisting in mooring, salvage, and clean-up operations, and responding quickly to vessels in distress (Couce et al., 2015). Despite consistent distance and speed traveled in the study area across seasons for large ships, tugs traveled significantly less distance in autumn than in winter and significantly slower speeds in autumn than any other season. This suggests that tug distance and speed in autumn may be driven by the varied uses of these vessels outside of escorting large ships in the study area.
In a recent study of rescued cetaceans with anthropogenic trauma in the SFB area, the primary source of trauma was vessel collision (Barcenas-De la Cruz et al., 2017). Since lethal collisions are most common when vessels are traveling faster than 10 kn (Laist et al., 2001; Vanderlaan and Taggart, 2007), cetaceans are most at risk from vessels traveling above this speed. In the National Marine Sanctuaries outside SFB, vessels are asked to voluntarily slow down to 10 kn during peak migration season (United States Coast Guard [USCG], 2018). Commercial shipping vessels did not always extend this speed limit into SFB upon entering. In the study area, cargo and tanker ships, ferries, and motorized recreational vessels traveled at average daily speeds greater than 10 kn. Median ferry speed across all temporal resolutions was greater than 29 kn, and these vessels were the most abundant of any vessel class in the study area. These high speeds make commercial ferries a pervasive potential threat to local cetaceans. Further, narrow inland ship passageways, like SFB, increase the chance of collision (Webb and Gende, 2015).
In the intensely urbanized SFB area, high concentrations of commuters need to be transferred across SFB waters quickly. Commercial shipping traffic activity is likely driven by the needs of the global economy (Cumming et al., 2006). To mitigate collisions while maintaining these status quos, vessels regularly watch for and report cetacean presence in and around SFB (United States Coast Guard [USCG], 2018). One potential flaw in this system is the need for cetaceans to be seen. We found that there were no significant differences in cargo or tanker ship presence between day and night, but cargo ships traveled significantly faster at night with a median speed greater than 10 kn. Despite ferries traveling significantly more slowly at night, median speeds across day and night were still greater than 30 kn. Cetaceans, such as humpback whales, actively forage at night (Baird et al., 2000) but would potentially be more difficult to spot during this time. Previous research on cetaceans in SFB has relied on visual observation (e.g., Stern et al., 2017), so it is currently unknown if and how cetaceans use SFB at night. If present, they also may be more likely to incur a lethal vessel collision during this time since vessels routinely traveled with median speeds greater than 10 kn.
While traditional spatial risk assessments for collisions between vessels and cetaceans involve overlaying vessel traffic with species habitat (Williams and O’Hara, 2010; van der Hoop et al., 2012; Redfern et al., 2013; Dransfield et al., 2014), this research analyzes a new technology for vessel distribution and speed. More information on cetacean use of SFB is needed to adequately assess risk. Shifting cetacean assemblages in response to changing climate variables (MacLeod, 2009) has been observed off the central California coast (Benson et al., 2002), and the same may occur in SFB. We do know that commercial shipping traffic is increasing worldwide (United Nations Conference on Trade and Development [UNCTAD], 2017) and that congested roadways in the SFB area have spurred expansion of ferry traffic (National Marine Fisheries Service [NMFS], 2017). As conditions change, more research is needed on drivers of cetacean presence in SFB. For example, harbor porpoises entering SFB, especially pregnant or lactating females, need to forage in Bay waters to account for energy lost while swimming (Gallagher et al., 2018). Therefore, the density and spatial distribution of prey in SFB as it relates to the metabolic needs of harbor porpoises would likely help inform where these animals forage when inside SFB. Climate variables also influence humpback whale diet along the California coast (Fleming et al., 2015) which could determine whether these animals will forage on prey found in SFB.
When the results of this research are compared with known habitat, risk assessments can identify areas and times of potential overlap and ultimately determine if and what mitigation may be necessary to minimize collision risk. But unlike the marine sanctuaries along the central California coast, there are few managed marine areas within SFB (California Code of Regulations [CCR], 2019) for which regulations could be adapted or added. Managers had success reducing vessel collisions with endangered Northern Atlantic right whales (Eubalaena glacialis) off the U.S. east coast thanks to a network of seasonal management areas overlapping important habitat or major ports where speeds were limited to a maximum of 10 kn (Laist et al., 2014). In southern California, the Santa Barbara Channel Vessel Speed Reduction Zone overlaps with established shipping lanes through the area and suggests limiting speeds to 10 kn due to the presence of cetaceans that commonly forage in the area (Croll et al., 1998). Although most ships have not significantly lowered their speeds at this request (McKenna et al., 2012), the designated zone establishes a framework with spatially explicit boundaries under which management action can occur and provides a defined context for evaluating compliance. Results of this research show vessels in SFB often travel at speeds greater than the limits imposed in these managed areas. For vessels greater than 1,600 gross tons in SFB, there is a speed limit within the RNAs of 15 kn for vessel safety (Code of Federal Regulations [CFR], 2015), but ferries and recreational traffic do not meet the weight requirement for the speed limit.
As more becomes known about the increasing presence of cetaceans in SFB, a need for additional managed areas could become apparent. While harbor porpoises are present year-round (Stern et al., 2017), humpback whales have consistently returned to Bay waters during spring and summer months since 2016 (Keener et al., 2016, personal communication), and most gray whale strandings in SFB historically occur in spring (Scordino et al., 2017). This suggests that a seasonal speed reduction framework, like those imposed on the U.S. east coast or suggested in the marine sanctuaries outside SFB, has the potential to be effective in minimizing risk to cetaceans in the Bay. Data from vessel traffic monitoring systems, like the M2, can inform management decisions and could evaluate compliance if regulations were put in place.
Our results support the claim that a single data source/sensor cannot reliably capture all vessel activity (Bloisi et al., 2015). Despite the limitation of identifying radar-detected vessels at night, the M2 system provided valuable daytime-use data on recreational crafts that would have been absent from our analysis if AIS data had been used exclusively. This information on the spatial extent of vessel traffic contributes to the overall predictability of presence and speed as it informs where these factors most likely vary. While commercial vessel traffic was most dense in defined paths through the study area (predictable by the established RNAs for shipping activity and ferry terminal location and schedules), without the incorporation of radar, recreational traffic would have been largely absent from analysis (Figure 2). Therefore, traffic would have primarily appeared to travel in paths defined by commercial vessels exclusively, which would have ignored the more dispersed and likely less predictable pattern of recreational traffic (Figure 3). Since roughly one-third of the vessel traffic we observed was recreational with some median speeds above 10 kn, it is important that future analyses of environmental impacts from vessels in urban areas, like SFB, consider these vessel types in addition to vessels transmitting AIS data.
We chose to use data collected by the M2 to create a holistic baseline understanding of vessel traffic in SFB across 1 year, but more specific use in other management areas may have a clearer target vessel type, activity, spatial extent, or time of interest for monitoring (i.e., illegal fishing vessel presence inside an MPA) that would narrow the data and time needed for analysis. Manually identifying radar-detected vessels via photographs was time-intensive for this comprehensive study (15,792 vessels positively identified), but the online portal where users can view and interact with data, the M2 Viewer, streamlines the photo review process as users can filter on specific dates and times and quickly click through photos associated with targets and consequently tag vessel type, activity, and make notes. The ports in SFB are also some of the busiest in the country (United States Army Corps of Engineers [USACE], 2018) with a dense human population in the surrounding area. Therefore, M2 sites monitoring coastal areas outside SFB would likely track far less vessels. Other limitations of the M2 included outages due to low power from the solar panels and the inability to identify radar-detected target identity through photographs at night. Continuing improvements of the M2 system include improved power supply and thermal cameras for use at night (ProtectedSeas, 2019).
The use of this research and the M2 system extend beyond informing cetacean risk assessment within the SFB study area. For example, research on non-indigenous marine species invasions via recreational vessels in the SFB region has relied on boater questionnaires and vessel observation at local marinas (e.g., Zabin et al., 2014), leaving vessel activity on the water largely unknown. In other coastal areas with high recreational traffic, research has sought to assess the level of underwater noise pollution from these vessels through manual tracking (Erbe, 2002; Hermannsen et al., 2019). Using the M2 to collect vessel tracks would likely provide a more robust dataset than relying on physical human effort. Outside of environmental concerns, the M2 could also inform general traffic management or provide a resource for maritime law enforcement. Because of its integration of AIS and radar data, the M2 system is especially useful where many vessels are not transmitting AIS, where activities such as recreational activity or illegal fishing are of concern.
Data Availability Statement
The datasets generated for this study are available on request to the corresponding author.
Author Contributions
All authors listed have made a substantial, direct and intellectual contribution to the work, and approved it for publication.
Funding
Funds for open access publication fees to be provided by Anthropocene Institute.
Conflict of Interest
The authors declare that the research was conducted in the absence of any commercial or financial relationships that could be construed as a potential conflict of interest.
Acknowledgments
The authors wish to thank the Estuary & Ocean Science Center of San Francisco State University for housing the M2 system and assisting with equipment maintenance.
Supplementary Material
The Supplementary Material for this article can be found online at: https://www.frontiersin.org/articles/10.3389/fmars.2020.00086/full#supplementary-material
References
Association of American Port Authorities [AAPA] (2016). Port Industry Statistics. Available at: https://www.aapa-ports.org/unifying/content.aspx?ItemNumber=21048 (accessed December 8, 2018).
Baird, R. W., Ligon, A. D., and Hooker, S. K. (2000). Sub-Surface And Night-Time Behavior Of Humpback Whales Off Maui, Hawaii: A Preliminary Report. Report prepared under Contract #40ABNC050729. Kihei, HI: Hawaiian Islands Humpback Whale National Marine Sanctuary.
Barcenas-De la Cruz, D., DeRango, E., Johnson, S. P., and Simeone, C. A. (2017). Evidence of anthropogenic trauma in marine mammals stranded along the central California coast, 2003-2015. Mar. Mamm. Sci. 36, 330–346. doi: 10.1111/mms.12457
Bartholomew, D. C., Mangel, J. C., Alfaro-Shiguesto, J., Pingo, S., Jimenez, A., and Godley, B. J. (2018). Remote electronic monitoring as a potential alternative to on-board observers in small-scale fisheries. Biol. Cons. 219, 35–45. doi: 10.1016/j.biocon.2018.01.003
Becker, E. A., Forney, K. A., Foley, D. G., Smith, R. C., Moore, T. J., and Barlow, J. (2014). Predicting seasonal density patterns of California cetaceans based on habitat models. Endang. Species Res. 23, 1–22. doi: 10.3354/esr00548
Benson, S. R., Croll, D. A., Marinovic, B. B., Chavez, F. P., and Harvey, J. T. (2002). Changes in the cetacean assemblage of a coastal upwelling ecosystem during El Niño 1997-98 and La Niña 1999. Prog. Oceanogr. 54, 279–291. doi: 10.1016/s0079-6611(02)00054-x
Bergseth, B. J., Russ, G. R., and Cinner, J. E. (2015). Measuring and monitoring compliance in no-take marine reserves. Fish Fish. 16, 240–258. doi: 10.1111/faf.12051
Bloisi, D. D., Iocchi, L., Nardi, D., and Fiorini, M. (2015). “Integrated visual information for maritime surveillance,” in Clean Mobility and Intelligent Transport Systems, eds M. Fiorini and J. Lin, (Stevenage: The Institution of Engineering and Technology), 237–264. doi: 10.1049/pbtr001e_ch11
Bloisi, D. D., Previtali, F., Pennisi, A., Nardi, D., and Fiorini, M. (2017). Enhancing automatic maritime surveillance systems with visual information. IEEE Trans. Intell. Transp. Syst. 18, 824–833. doi: 10.1109/tits.2016.2591321
Bole, A. G., Wall, A. D., and Norris, A. (2013). Radar and ARPA Manual: Radar, AIS and Target Tracking for Marine Radar Users. Oxford: Butterworth-Heinemann.
Calambokidis, J., Steiger, G. H., Curtice, C., Harrison, J., Ferguson, M. C., Becker, E., et al. (2015). 4. Biologically important areas for selected cetaceans within U.S. waters – west coast region. Aquat. Mamm. 41, 39–53. doi: 10.1578/am.41.1.2015.39
California Code of Regulations [CCR] (2019). Title 14 Section 642. Available at: https://www.wildlife.ca.gov/Conservation/Marine/MPAs/Network/Title-14-Section-632 (accessed June 13, 2018).
California Department of Fish and Wildlife [CDFW] (2008). California Ports. Available at: https://map.dfg.ca.gov/metadata/ds0353.html (accessed June 13, 2018).
Calvo-Gallego, J., and Pérez-Martínez, F. (2012). Simple traffic surveillance system based on range-doppler radar images. Prog. Electromagn. Res. 125, 343–364. doi: 10.2528/pier12011809
Campbell-Malone, R., Barco, S. G., Daoust, P., Knowlton, A. R., McLellan, W. A., Rotstein, D. S., et al. (2008). Gross and histologic evidence of sharp and blunt trauma in North Atlantic right whales (Eubalaena Glacialis) killed by vessels. J. Zool. Wildl. Med. 39, 37–55. doi: 10.1638/2006-0057.1
Cholewiak, D., Clark, C. W., Ponirakis, D., Frankel, A., Hatch, L. T., Risch, D., et al. (2018). Communicating amidst the noise: modeling the aggregate influence of ambient and vessel noise on baleen whale communication space in a national marine sanctuary. Endang. Species Res. 36, 59–75. doi: 10.3354/esr00875
Code of Federal Regulations [CFR] (2015). 33 CFR §165.1181 – San Francisco Bay Region, California – Regulated Navigation Area. Washington, D.C: CFR.
Conn, P. B., and Silber, G. K. (2013). Vessel speed restrictions reduce rise of collision-related mortality for North Atlantic right whales. Ecosphere 4, 1–15.
Costa Rican Times (2014). Leonardo DiCaprio Foundation Donates Towards Costa Rica Radar Facility on Cocos Island. Available at: https://www.costaricantimes.com/leonardo-dicaprio-foundation-donates-towards-costa-rica-radar-facility-on-cocos-island/32481 (accessed January 6, 2020).
Couce, L. C., Couce, J. C. C., and Formosa, J. A. F. (2015). Operation and handling in escort tugboat manoeuvres with the aid of automatic towing winch systems. J. Navig. 68, 71–88. doi: 10.1017/s0373463314000435
Croll, D. A., Tershy, B. R., Hewitt, R. P., Demer, D. A., Fiedler, P. C., Smith, S. E., et al. (1998). An integrated approach to the foraging ecology of marine birds and mammals. Deep Sea Res. 2 Top. Stud. Oceanogr. 45, 1353–1371.
Cumming, G. S., Cumming, D. H. M., and Redman, C. L. (2006). Scale mismatches in social-ecological systems: causes, consequences, and solutions. Ecol. Soc. 11:14.
Dransfield, A., Hines, E., McGowan, J., Holzman, B., Nur, N., Elliott, M., et al. (2014). Where the whales are: using habitat modeling to support changes in shipping regulations within national marine sanctuaries in central California. Endang. Species Res. 26, 39–57. doi: 10.3354/esr00627
Edgar, G. J., Stuart-Smith, R. D., Willis, T. J., Kininmonth, S., Baker, S. C., Banks, S., et al. (2014). Global conservation outcomes depend on marine protected areas with five key features. Nature 506, 216–220. doi: 10.1038/nature13022
Elahi, R., Ferretti, F., Bastari, A., Cerrano, C., Colloca, F., Kowalik, J., et al. (2018). Leveraging vessel traffic data and a temporary fishing closure to inform marine management. Front. Ecol. Environ. 16:440–446. doi: 10.1002/fee.1936
Elvidge, C. D., Ghosh, T., Baugh, K., Zhizhin, M., Hsu, F., Katada, N. S., et al. (2018). Rating the effectiveness of fishery closures with visible infrared imaging radiometer suite boat detection data. Front. Mar. Sci. 5:132. doi: 10.3389/fmars.2018.00132
Erbe, C. (2002). Underwater noise of whale-watching boats and potential effects on killer whales (Orcinus orca), based on an acoustic impact model. Mar. Mamm. Sci. 18, 394–418. doi: 10.1111/j.1748-7692.2002.tb01045.x
Erbe, C., Williams, R., Sandilands, D., and Ashe, E. (2014). Identifying modeled ship noise hotspots for marine mammals of Canada’s Pacific region. PLoS One 9:e89820. doi: 10.1371/journal.pone.0089820
Fleming, A. H., Clark, C. T., Calambokidis, J., and Barlow, J. (2015). Humpback whale diets respond to variance in ocean climate and ecosystem conditions in the California Current. Glob. Change Biol. 22, 1214–1224. doi: 10.1111/gcb.13171
Forney, K. A., and Barlow, J. (1998). Seasonal patterns in the abundance and distribution of California cetaceans, 1991-1992. Mar. Mamm. Sci. 14, 460–489. doi: 10.1111/j.1748-7692.1998.tb00737.x
Furuno (2016). Installation Manual Radar Sensor Model DRSA X-Class. Nishinomiya: Furuno Electric Co., Ltd.
Gallagher, C. A., Stern, S. J., and Hines, E. (2018). The metabolic cost of swimming and reproduction in harbor porpoises (Phocoena phocoena) as predicted by a bioenergetic model. Mar. Mamm. Sci. 34, 875–900. doi: 10.1111/mms.12487
Gill, D. A., Mascia, M. B., Ahmadia, G. N., Glew, L., Lester, S. E., Barnes, M., et al. (2017). Capacity shortfalls hinder the performance of marine protected areas globally. Nature 543, 665–669. doi: 10.1038/nature21708
Golden Gate Bridge, Highway and Transportation District (2017). Golden Gate ferry Schedules. Available at: http://goldengateferry.org/schedules/ (accessed June 13, 2018).
Hermannsen, L., Mikkelsen, L., Tougaard, J., Beedholm, K., Johnson, M., and Madsen, P. T. (2019). Recreational vessels without automatic identification system (AIS) dominate anthropogenic noise contributions to a shallow water soundscape. Sci. Rep. 9:15477. doi: 10.1038/s41598-019-51222-9
Hsu, F., Elvidge, C. D., Baugh, K., Zhizhin, M., Ghosh, T., Kroodsma, D., et al. (2019). Cross-matching VIIRS boat detections with vessel monitoring system tracks in Indonesia. Remote Sens. 11:995. doi: 10.3390/rs11090995
International Maritime Organization [IMO] (2018). SOLAS Chapter V, Regulation 19 - Carriage Requirements for Shipborne Navigational Systems and Equipment. London: International Maritime Organization.
Irvine, L. M., Mate, B. R., Winsor, M. H., Palacios, D. M., Bograd, S. J., Costa, D. P., et al. (2014). Spatial and temporal occurrence of blue whales off the U.S. west coast, with implications for management. PLoS One 9:e102959. doi: 10.1371/journal.pone.0102959
James, K. M., Campbell, N., Viðarsson, J. R., Vilas, C., Plet-Hansen, K. S., Borges, L., et al. (2019). “Tools and technologies for the monitoring, control and surveillance of unwanted catches,” in The European Landing Obligation, eds S. S. Uhlmann, C. Ulrich, and S. J. Kennelly, (Cham: Springer), 363–382. doi: 10.1007/978-3-030-03308-8_18
Jensen, C. M., Hines, E., Holzman, B. A., Moore, T. J., Jahncke, J., and Redfern, J. V. (2015). Spatial and temporal variability in shipping traffic off San Francisco, California. Coast. Manag. 43, 575–588. doi: 10.1080/08920753.2015.1086947
Joint Working Group on Vessel Strikes, and Acoustic Impacts [JWG] (2012). Vessel Strikes and Acoustic Impacts. Joint Working Group of Gulf of the Farallones and Cordell Bank National Marine Sanctuaries Advisory Councils. San Francisco, CA: JWG.
Keener, W., Szczepaniak, I., Webber, M. A., Stern, S. J., and Schramm, M. J. (2016). First Observed Foraging by Humpback Whales in San Francisco Bay. Tiburon, CA: Beyond the Golden Gate Research Symposium.
Knowlton, A. R., Korsmeyer, F. T., Kerwin, J. E., Wu, H., and Hynes, B. (1995). The hydrodynamic Effects of Large Vessels on Right Whales. National Marine Fisheries Service Center Final Report for Contract 40EANFF400534. Woods Hole, MA: Northeast Fisheries Science Center.
Kurekin, A. A., Loveday, B. R., Clements, O., Quartly, G. D., Miller, P. I., Wiafe, G., et al. (2019). Operational monitoring of illegal fishing in Ghana through exploitation of satellite Earth observation and AIS data. Remote Sens. 11:293. doi: 10.3390/rs11030293
Laist, D. W., Knowlton, A. R., Mead, J. G., Collet, A. S., and Podesta, M. (2001). Collisions between ships and whales. Mar. Mamm. Sci. 17, 35–75. doi: 10.1111/j.1748-7692.2001.tb00980.x
Laist, D. W., Knowlton, A. R., and Pendleton, D. (2014). Effectiveness of mandatory vessel speed limits for protecting north Atlantic right whales. Endang. Species. Res. 23, 133–147. doi: 10.3354/esr00586
Longépé, N., Hajduch, G., Ardianto, R., Joux, R., Nhunfat, B., Marzuki, M. I., et al. (2018). Completing fishing monitoring with spaceborne vessel detection system (VDS) and automatic identification system (AIS) to assess illegal fishing in Indonesia. Mar. Pollut. Bull. 131(Part B), 33–39. doi: 10.1016/j.marpolbul.2017.10.016
MacLeod, C. D. (2009). Global climate change, range changes and potential implications for the conservation of marine cetaceans: a review and synthesis. Endang. Species Res. 7, 125–136. doi: 10.3354/esr00197
McCauley, D. J., Woods, P., Sullivan, B., Bergman, B., Jablonicky, C., Roan, A., et al. (2016). Ending hide and seek at sea. Science 351, 1148–1150. doi: 10.1126/science.aad5686
McKenna, M. F., Katz, S. L., Condit, C., and Walbridge, S. (2012). Response of commercial ships to a voluntary speed reduction measure: are voluntary strategies adequate for mitigating ship-strike risk? Coast. Manag. 40, 634–650. doi: 10.1080/08920753.2012.727749
Merrick, J. R. W., van Dorp, J. R., Blackford, J. P., Shaw, G. L., Harrald, J., and Mazzuchi, T. A. (2003). A traffic density analysis of proposed ferry service expansion in San Francisco Bay using a maritime simulation model. Reliabil. Eng. Syst. Saf. 81, 119–132. doi: 10.1016/s0951-8320(03)00054-1
Mood, A. M. (1950). Introduction to the Theory of Statistics. London: McGraw-Hill Publishing Co. Ltd.
Moore, M. J., Knowlton, A. R., Kraus, S. D., McLellan, W. A., and Bonde, R. K. (2005). Morphometry, gross morphology and available histopathology in north Atlantic right whale (Eubalaena glacialis) mortalities (1970 to 2002). J. Cetacean Res. Manag. 6:16.
National Marine Fisheries Service [NMFS] (2017). Takes of Marine Mammals Incidental to Specified Activities; Taking Marine Mammals Incidental to the San Francisco Ferry Terminal Expansion Project, South Basin Improvements Project. 83 FR 29521. Silver Spring, MD: NMFS.
National Oceanic and Atmospheric Administration [NOAA] (2019). Active and Closed Unusual Mortality Events. Silver Spring, MD: NOAA.
Nohara, T. J., Weber, P., Jones, G., Ukrainec, A., and Premji, A. (2008). “Affordable high-performance radar networks for homeland security applications,” in Proceedings of the Institute of Electrical and Electronics Engineers Radar Conference 2008, Rome.
ProtectedSeas (2019). Marine Monitor. Available at: https://protectedseas.net/marine-monitor-m2 (accessed December 18, 2019).
Prudente, T. (2014). Military-Grade Radar Network Watching For Oyster Poachers. Annapolis, MD: Capital Gazette.
Redfern, J. V., Hatch, L. T., Caldow, C., DeAngelis, M. L., Gedamke, J., Hastings, S., et al. (2017). Assessing the risk of chronic shipping noise to baleen whales off Southern California, USA. Endang. Species Res. 32, 153–167. doi: 10.3354/esr00797
Redfern, J. V., McKenna, M. F., Moore, T. J., Calambokidis, J., Deangelis, M. L., Becker, E. A., et al. (2013). Assessing the risk of ships striking large whales in marine spatial planning. Conserv. Biol. 27, 292–302. doi: 10.1111/cobi.12029
Robards, R. M., Silber, G., Adams, J., Arroyo, J., Lorenzini, D., Schwehr, K., et al. (2016). Conservation science and policy applications of the marine vessel automatic identification system (AIS) – a review. Bull. Mar. Sci. 92, 75–103. doi: 10.5343/bms.2015.1034
Rycyk, A. M., Deutsch, C. J., Barlas, M. E., Hardy, S. K., Frisch, K., Leone, E. H., et al. (2018). Manatee behavioral response to boats. Mar. Mamm. Sci. 34, 924–962. doi: 10.1111/mms.12491
San Francisco Bay Ferry (2018). Where Do You Want To Go? When Do You Want To Go?. Available at: http://sanfranciscobayferry.com/schedule-information (accessed 13 June 2018). doi: 10.1111/mms.12491
Schwehr, K. D., and McGillivary, P. A. (2007). “Marine ship automatic identification system (AIS) for enhanced coastal security capabilities: an oil spill tracking application,” in Proceedings of the OCEANS 2007, Vancouver, BC.
Scordino, J., Carretta, J., Cottrell, P., Greenman, J., Savage, K., Scordino, J., et al. (2017). Ship Strikes and Entanglements of Gray Whales in the North Pacific Ocean, 1924-2015. Western Gray Whale Advisory Panel, International Whaling Commission, SC/67A/HIM/06. Cambridge: IWC.
Sefick, S. A. Jr. (2016). Stream Metabolism-A Package for Calculating Single Station Metabolism From Diurnal Oxygen Curves. R Package Version 1.1.2.
Silber, G. K., Slutsky, J., and Bettridge, S. (2010). Hydrodynamics of a ship/whale collision. J. Exp. Mar. Bio. Ecol. 391, 10–19. doi: 10.1016/j.jembe.2010.05.013
Stern, S. J., Keener, W., Szczepaniak, I. D., and Webber, M. A. (2017). Return of harbor porpoises (Phocoena phocoena) to San Francisco Bay. Aquat. Mamm. 43, 691–702. doi: 10.1578/am.43.6.2017.691
Taborda, R., and Silva, A. (2012). COSMOS: a lightweight coastal video monitoring system. Comput. Geosci. 49, 248–255. doi: 10.1016/j.cageo.2012.07.013
United Nations Conference on Trade and Development [UNCTAD] (2017). Review of Maritime Transport. Geneva: UNCTAD.
United States Army Corps of Engineers [USACE] (2018). Ports and Waterways Facilities. Available at: https://www.iwr.usace.army.mil/about/technical-centers/wcsc-waterborne-commerce-statistics-center/ (accessed December 8, 2018).
United States Coast Guard [USCG] (2016). Automatic Identification System: How AIS Works. Available at: https://www.navcen.uscg.gov/?pageName=AISworks (accessed January 6, 2020).
United States Coast Guard [USCG] (2017). Local Notice to Mariners, District: 11, Week: 17/17. Washington, DC: U.S. Department of Homeland Security.
United States Coast Guard [USCG] (2018). Local Notice to Mariners, District: 11, Week: 23/18. Washington, D.C: U.S. Department of Homeland Security.
van der Hoop, J. M., Vanderlaan, A. S. M., Cole, T. V. N., Henry, A. G., Hall, L., Mase-Guthrie, B., et al. (2015). Vessel strikes to large whales before and after the 2008 Ship Strike Rule. Conserv. Lett. 8, 24–32. doi: 10.1111/conl.12105
van der Hoop, J. M., Vanderlaan, A. S. M., and Taggart, C. T. (2012). Absolute probability estimates of lethal vessel strikes to North Atlantic right whales in Roseway Basin, Scotian Shelf. Ecol Appl. 22, 2021–2033. doi: 10.1890/11-1841.1
Vanderlaan, A. S. M., and Taggart, C. T. (2007). Vessel collisions with whales: the probability of lethal injury based on vessel speed. Mar. Mamm. Sci. 23, 144–156. doi: 10.1111/j.1748-7692.2006.00098.x
Wahab, M., Kurniadi, D. P., Estu, T. T., Mahmudin, D., Maulana, Y. Y., and Sulistyaningsih, L. (2016). Development of coastal radar network at sunda Strait. Telkomnika 14, 507–514.
Webb, K., and Gende, S. M. (2015). Activity patterns and speeds of large cruise ships in southeast Alaska. Coast. Manag. 43, 67–83. doi: 10.1080/08920753.2014.989148
Weinrich, M. (2004). A Review Of Worldwide Collisions Between Whales And Fast Ferries. Report to the Scientific Committee of the International Whaling Commission SC/56/BC9. Cambridge: IWC.
Wiley, D. N., Thompson, M., Pace, R. M. III, and Levenson, J. (2011). Modeling speed restrictions to mitigate lethal collisions between ships and whales in the Stellwagen Bank national marine sanctuary USA. Biol. Conserv. 144, 2377–2381. doi: 10.1016/j.biocon.2011.05.007
Williams, R., and O’Hara, P. (2010). Modelling ship strike risk to fin, humpback and killer whales in British Columbia, Canada. J. Cetacean Res. Manag. 11, 1–8.
Williams, S., Gende, S. M., Lukacs, P. M., and Webb, K. (2016). Factors affecting whale detection from large ships in Alaska with implications for whale avoidance. Endang. Species Res. 30, 209–223. doi: 10.3354/esr00736
Zabin, C. J., Ashton, G. V., Brown, C. W., Davidson, I. C., Sytsma, M. D., and Ruiz, G. M. (2014). Small boats provide connectivity for nonindigenous marine species between a highly invaded international port and nearby coastal harbors. Manag. Biol. Invasion 5, 97–112. doi: 10.3391/mbi.2014.5.2.03
Keywords: vessel management, coastal monitoring, Automatic Identification System (AIS), marine radar, cetaceans, San Francisco Bay
Citation: Cope S, Hines E, Bland R, Davis JD, Tougher B and Zetterlind V (2020) Application of a New Shore-Based Vessel Traffic Monitoring System Within San Francisco Bay. Front. Mar. Sci. 7:86. doi: 10.3389/fmars.2020.00086
Received: 01 July 2019; Accepted: 03 February 2020;
Published: 21 February 2020.
Edited by:
Annette Breckwoldt, Leibniz Centre for Tropical Marine Research (LG), GermanyReviewed by:
Andrew M. Fischer, University of Tasmania, AustraliaKristian Metcalfe, University of Exeter, United Kingdom
Copyright © 2020 Cope, Hines, Bland, Davis, Tougher and Zetterlind. This is an open-access article distributed under the terms of the Creative Commons Attribution License (CC BY). The use, distribution or reproduction in other forums is permitted, provided the original author(s) and the copyright owner(s) are credited and that the original publication in this journal is cited, in accordance with accepted academic practice. No use, distribution or reproduction is permitted which does not comply with these terms.
*Correspondence: Samantha Cope, c2FtYW50aGFAcHJvdGVjdGVkc2Vhcy5uZXQ=; Ellen Hines, ZWhpbmVzQHNmc3UuZWR1