 Silja Frankenbach1*†
 João Ezequiel1†‡
 Sandra Plecha2,3‡
 Johannes W. Goessling4,5
 Leandro Vaz2
 Michael Kühl4
 João Miguel Dias2
 Nuno Vaz2
 João Serôdio1
- 1Department of Biology – Centre for Environmental and Marine Studies, University of Aveiro, Aveiro, Portugal
- 2Department of Physics – Centre for Environmental and Marine Studies, University of Aveiro, Aveiro, Portugal
- 3Instituto Dom Luiz (IDL), Faculdade de Ciências da Universidade de Lisboa (FCUL), Lisbon, Portugal
- 4Marine Biological Section, Department of Biology, University of Copenhagen, Helsingør, Denmark
- 5International Iberian Nanotechnology Laboratory, Braga, Portugal
Tidal estuaries are regarded as highly important ecosystems, mostly due to their high primary productivity and associated role as carbon sinks. In these ecosystems, primary productivity is mainly due to the photosynthetic carbon fixation by phytoplankton and microphytobenthos. The productivity of the two communities has been mostly studied separately, and directly comparable estimates of their carbon fixation rates in the same estuary are relatively scarce. The present study aimed to characterize the spatio-temporal variability of the productivity of phytoplankton and microphytobenthos in a tidal estuary, the Ria de Aveiro (Portugal). The productivity of the two communities was determined using a common methodological approach, based on measurements of in vivo chlorophyll fluorescence, allowing the estimation of the annual ecosystem-level budget for carbon fixation by the two groups. Productivity rates were determined based on synoptic in situ measurements of absolute rates of electron transport rate of photosystem II, using Pulse Amplitude Modulation fluorometry. Chlorophyll fluorescence indices were accompanied by measurements of salinity, temperature, water turbidity, solar irradiance, and planktonic and benthic microalgal biomass. Measurements were carried out hourly, along four spring-neap tidal cycles distributed along 1 year, on three sites of the estuary. The most pronounced trends in the spatio-temporal variability of the photophysiology and productivity of the two communities were the following: (i) maximum biomass and productivity were reached later for microphytobenthos (summer-autumn) than for phytoplankton (spring-summer); (ii) the absorption cross-section of PSII was generally higher for phytoplankton; (iii) the two groups showed a similar photoacclimation state, but microphytobenthos appeared as high light-acclimated when compared to phytoplankton. Biomass-specific productivity was on average higher for phytoplankton than for microphytobenthos, averaging 68.0 and 19.1 mg C mg Chl a–1 d–1, respectively. However, areal depth-integrated production rates were generally higher for the microphytobenthos than for the phytoplankton, averaging 264.5 and 140.0 mg C m–2 d–1, respectively. On an annual basis, phytoplankton productivity averaged 49.9 g C m–2 yr–1 while the productivity of microphytobenthos averaged 105.2 g C m–2 yr–1. When upscaling to the whole estuary, annual primary production rates of phytoplankton and microphytobenthos reached 4894.3 and 7534.0 t C yr–1, respectively, representing 39.4 and 60.6% of the combined total of 12428.3 t C yr–1 determined for the two communities in the Ria de Aveiro.
Introduction
Estuaries and coastal zones support a variety of important ecosystem services, including nutrient cycling, flood control, and provision of nursery ground for a large diversity of marine animal species (Hope et al., 2019). At the same time, these areas are currently under direct threat from heavy human use, such as industrial and agricultural activities, littering and global climate changes (Barbier et al., 2011). The importance attributed to these habitats is largely justified by their high rates of primary productivity, ranking among the highest in both aquatic and terrestrial ecosystems, supporting important food webs and affecting atmospheric carbon sequestration (McLusky and Elliott, 2007). In tidal estuaries and shallow coastal zones, primary productivity is mostly due to the photosynthetic carbon fixation by phytoplankton and microphytobenthos (Underwood and Kromkamp, 1999). Although estuarine primary productivity is often considered to be mainly due to phytoplankton photosynthetic activity, the contribution of microphytobenthos can be significant in tidal systems, having been estimated to reach up to 50% of ecosystem-level carbon fixation (Cadée and Hegeman, 1974; Joint, 1978). This is due to the light-limitation of phytoplankton productivity, associated to the high turbidity of the water column caused by sediment resuspension by strong tidal currents (Ubertini et al., 2012; Pratt et al., 2014), and, on the other hand, to the large intertidal areas formed during low tide, which harbor dense and highly productive microphytobenthos communities (Van Colen et al., 2014).
The assessment of the primary productivity of estuarine areas is crucial to evaluate their role as carbon sinks, a question particularly relevant in the current context of increasing of atmospheric carbon levels due to anthropogenic action (Bauer et al., 2013). However, the primary productivity of phytoplankton and microphytobenthos communities have been generally studied separately and only a relatively small number of studies have attempted to provide directly comparable estimates of carbon fixation rates of the two groups in the same estuary (Cadée and Hegeman, 1974; Joint, 1978; Fielding et al., 1988; Caffrey et al., 2014). This is likely due to differences in the methodologies used to quantify photosynthetic activity and carbon fixation in the water column and in the sediment. The difficulties in obtaining comparable estimates for phytoplankton and microphytobenthos have been long recognized (Underwood and Kromkamp, 1999) and are essentially due to the drastic differences in the vertical scale of the photic zone in the water column (meters) and the sediment (micrometers). This has hampered not only the estimation of integrated pelagic-benthic production budgets but also the evaluation of the relative importance of both communities.
This work aimed to assess the integrated pelagic-benthic productivity in a tidal estuarine system, the Ria de Aveiro (Portugal), by estimating photosynthetic rates of both phytoplankton and microphytobenthos communities using a common methodological approach. The primary productivity of phytoplankton and microphytobenthos was estimated based on measurements of in vivo chlorophyll fluorescence indices combining the functional absorption cross section and the effective quantum yield of photosystem II (PSII), enabling the calculation of absolute rates of electron transport at PSII, which is expected to be closely related with rates of photosynthetic carbon fixation (Kromkamp et al., 1998; Migné et al., 2007; Schreiber et al., 2012; Morelle et al., 2018). Measurements were carried out on water and sediment samples, collected on different sites of the estuary, selected to cover a wide range of conditions, including distance to the mouth of the estuary or sediment grain size, and covering the main scales of temporal variability in the estuarine environment (hourly, fortnightly and seasonal). This approach allowed for the detailed characterization of the spatio-temporal variability of benthic and pelagic photosynthetic activity, ultimately yielding the estimation of an ecosystem-level budget of photosynthetic carbon fixation by phytoplankton and microphytobenthos for the whole estuary.
Materials and Methods
Study Area, Sampling and Sample Processing
The study was carried out in the Ria de Aveiro a coastal lagoon located in the northwest coast of Portugal (40′38′N - 08′45′W). The Ria de Aveiro comprises four main channels (S. Jacinto, Mira, Ílhavo and Espinheiro), receiving fresh water from five rivers (Vouga, Antuã, Cáster, Boco and Valas de Mira) (Araújo et al., 2008). It connects to the Atlantic Ocean by a single artificial inlet, allowing water circulation patterns typical of a tidal estuary (Vaz and Dias, 2008). The Ria de Aveiro is a mesotidal system, with mean tidal amplitude of 2 m, and amplitudes of 0.6 m in neap tides and 3.2 m in spring tides (Vaz and Dias, 2008). It is a shallow, well-mixed system, with an average depth of ca. 1 m (Dias et al., 1999). Further characterization of physical, geomorphological, and ecological features of the Ria de Aveiro can be found elsewhere (Dias et al., 1999, 2003; Tomás et al., 2014; Bueno-Pardo et al., 2018).
Three sampling sites were selected, based on their contrasting characteristics, namely location (channels, distance to the ocean), hydrodynamics, salinity and sediment granulometry (Figure 1): Gafanha da Encarnação, located in the Mira channel and closest to the mouth of the estuary, characterized by sandy sediments (GE; 40°35′18′′ N, 08°41′06′′ W); Vista Alegre, located in the Canal de Ílhavo, characterized by fine muddy sediments (VA; 40°37′12′′ N, 08°44′54′′ W); Torreira, in the S. Jacinto channel, characterized by coarser muddy sand (TO; 40.758403 N, 8.676949 W). The three sampling sites are described in more detail in Frankenbach et al. (2019).
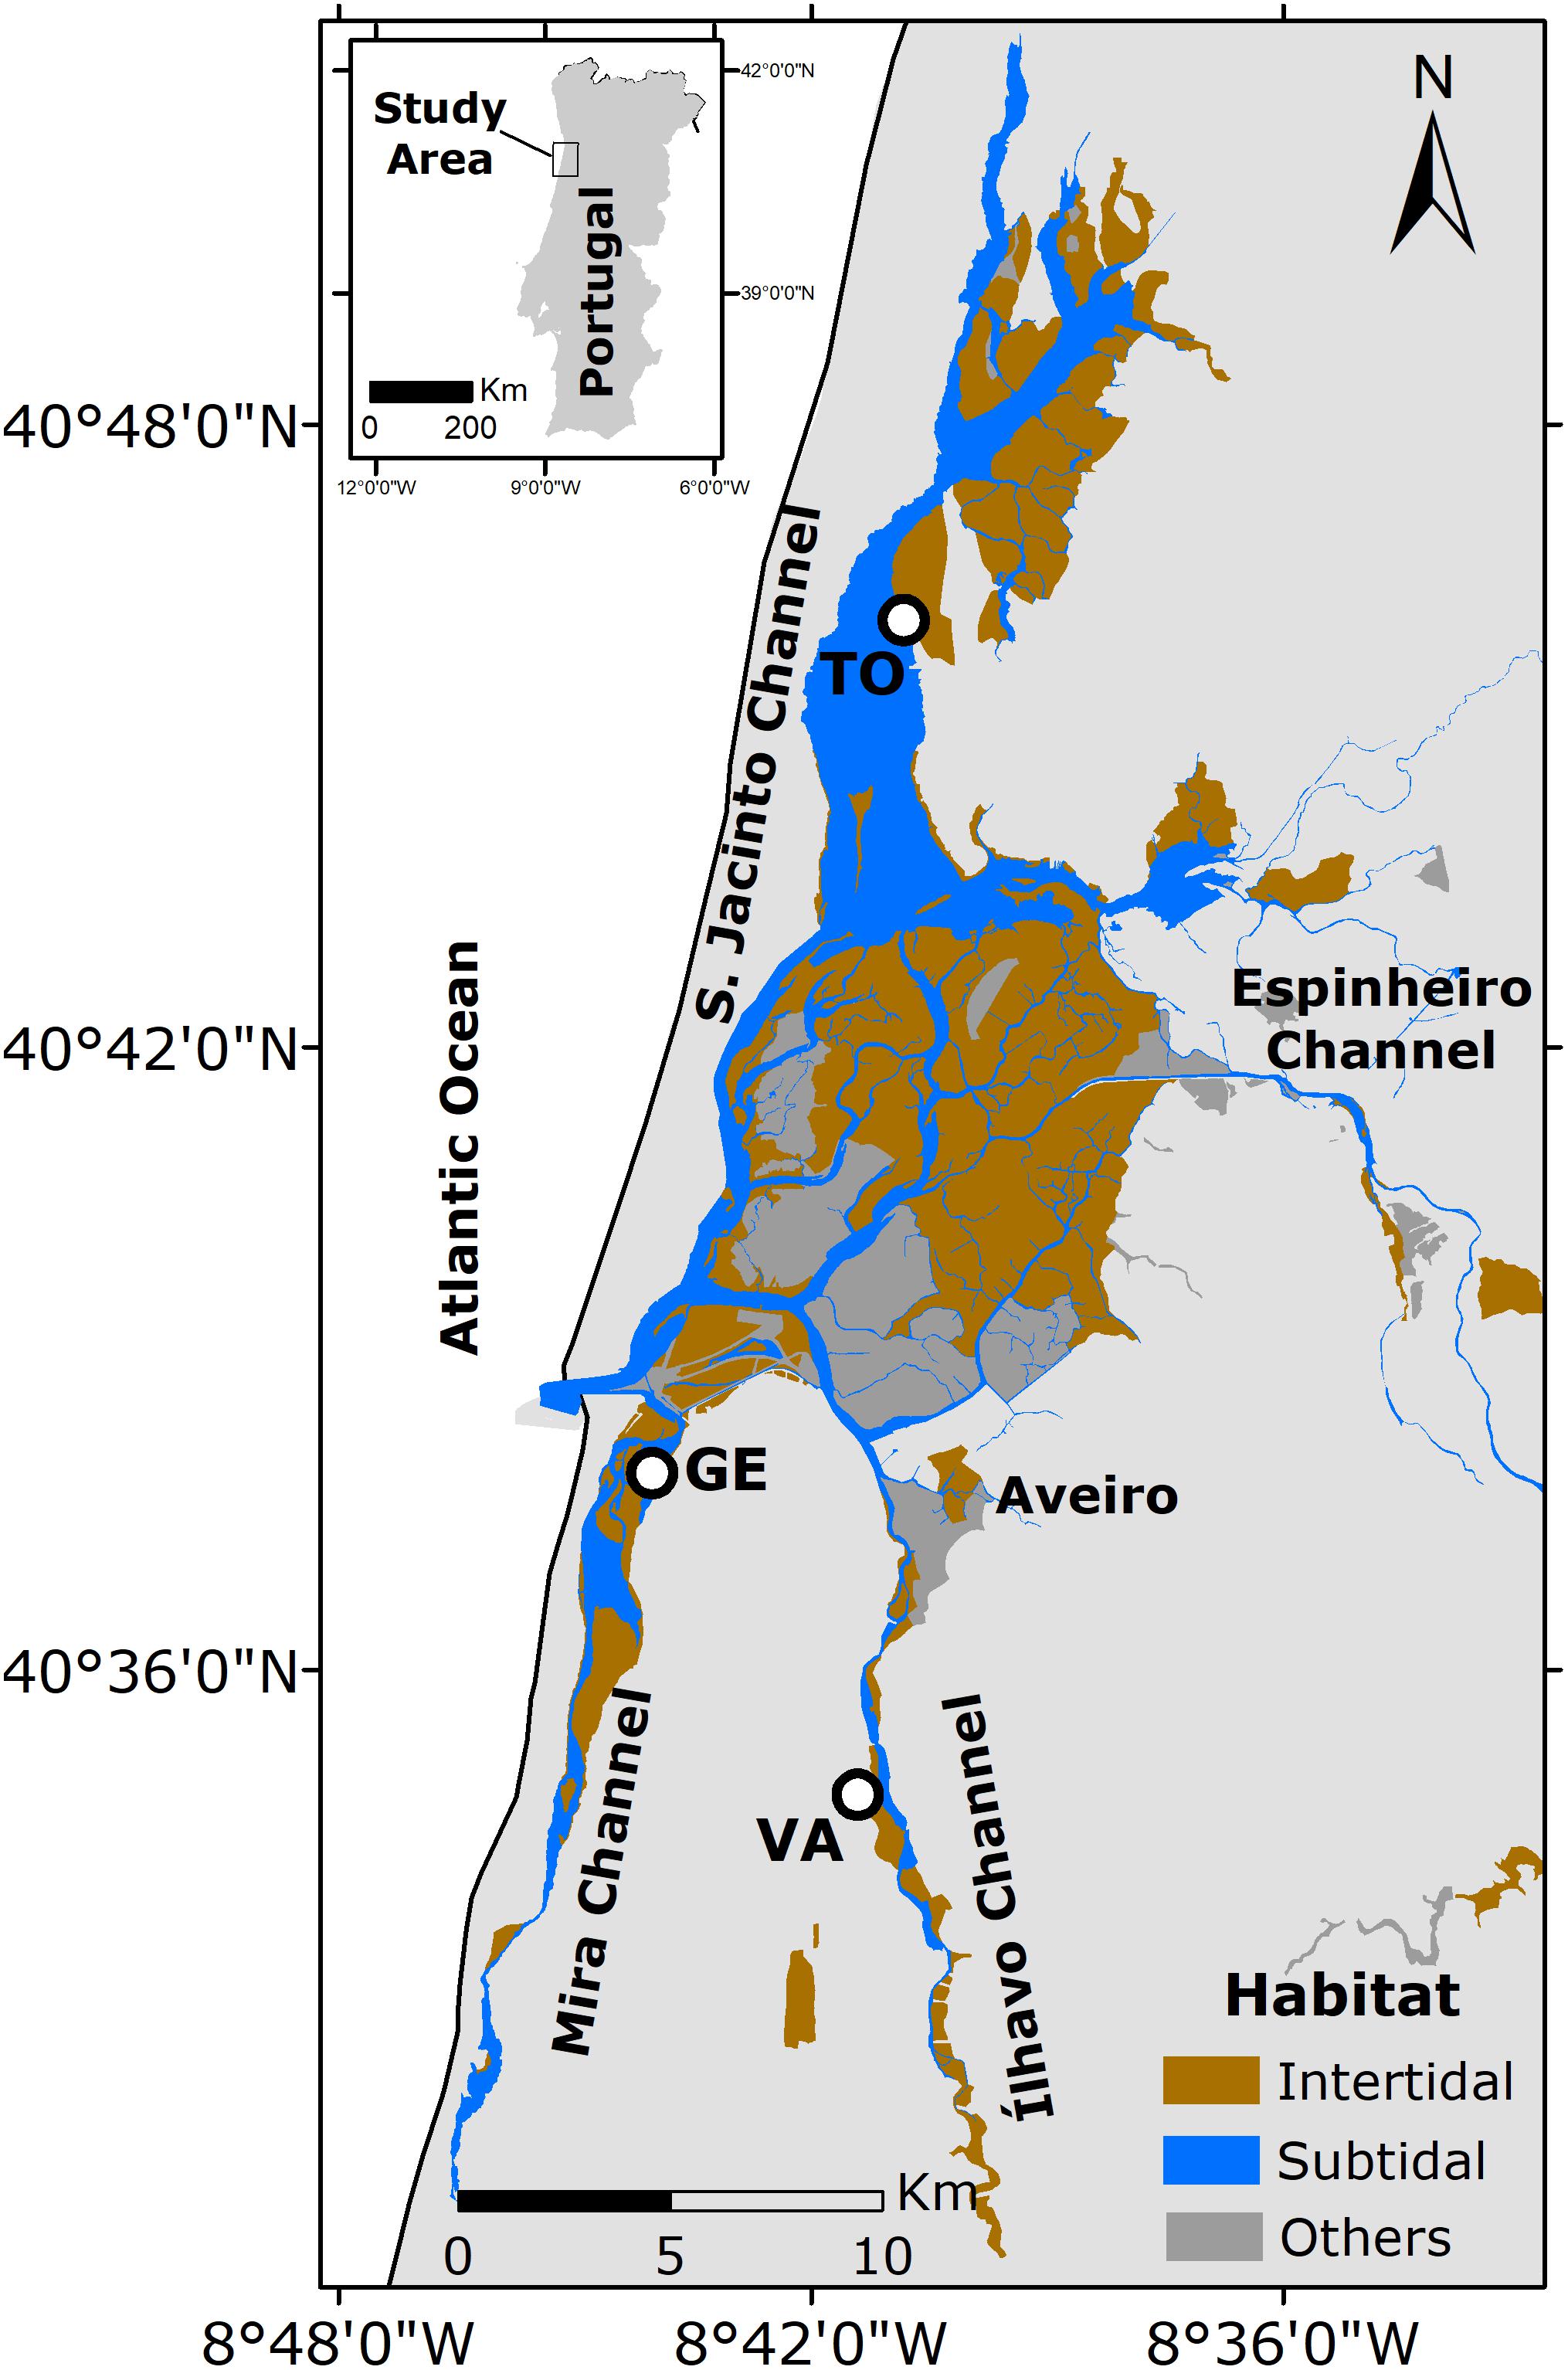
Figure 1. Ria de Aveiro, Portugal. The different habitats are highlighted in green, for intertidal areas, blue for subtidal areas, and gray for other areas (e.g., salt pans). Sampling sites are marked with a black dot: Vista Alegre (VA), Gafanha da Encarnação (GE), and Torreira (TO).
Sampling was carried along four spring-neap tidal cycles, distributed over the period between July 2013 and June 2014, to assess seasonal variability (summer: 16–18 and 23–25 July 2013; autumn: 29–31 October and 4–6 November 2013; winter: 12–13 and 18–20 February 2014; spring: 27–29 May and 3–5 June 2014). For each neap or spring tidal period, sampling was carried out on the three sites on consecutive days, one for each site. During each sampling day, samples were collected hourly, from sunrise to sunset, and all measurements were carried out in situ (see below) immediately following collection. Water samples were collected from surface water (ca. 0.5 m deep), at the shoreline (GE) or from an overlying bridge (VA, TO), using a bucket and transferred into 1.5 L bottles. Sediment samples were collected only during daytime low tide exposure, using Plexiglas corers (3.6 cm internal diameter), and were subsampled for quantification of chlorophyll a, as an indicator of surface biomass (see below) by cryo-sampling using mini contact cores (“crème brûlée” technique; Laviale et al., 2015). Different sample depths were collected for each sampling site, to match the expected depth of the photic zone on each type of sediment (0.25, 0.5, and 2.0 mm for VA, GE, and TO respectively). Samples were flash frozen immediately after collection and kept in liquid nitrogen until further analysis in the laboratory. Microphytobenthos cell suspensions were collected from the sediment surface using the lens tissue technique (Eaton and Moss, 1966). Two layers of lens tissue (Lens cleaning tissue 105, Whatman) were placed on the sediment surface for 1 h and the upper piece was collected and resuspended in falcon tubes with 10 ml of filtered seawater. Chlorophyll a fluorescence was measured immediately after preparation of the suspensions (1.25 ml).
Physical Parameters
Photosynthetic active radiation (E, 400–700 nm; see Table 1 for notation) was measured hourly, at the time of sample collection, using a quantum meter (Model MQ-200, Apogee Instruments, Logan, UT, United States). Sediment temperature was measured with an infrared thermometer (ScanTemp 410, Tematec GmbH, Hennef, Germany). Water temperature, salinity and turbidity (NTU) were measured using a multi-parameter Sonde YSi 6600 (YSI incorporated, Yellow Springs, OH, United States) at the same locations used for collecting water. This allowed to measure salinity in a range from 0 to 70 ppt (±0.1 ppt), temperature from −5 to 50°C (±0.15 °C) and turbidity from 0 to 1000 NTU (±0.3 NTU).
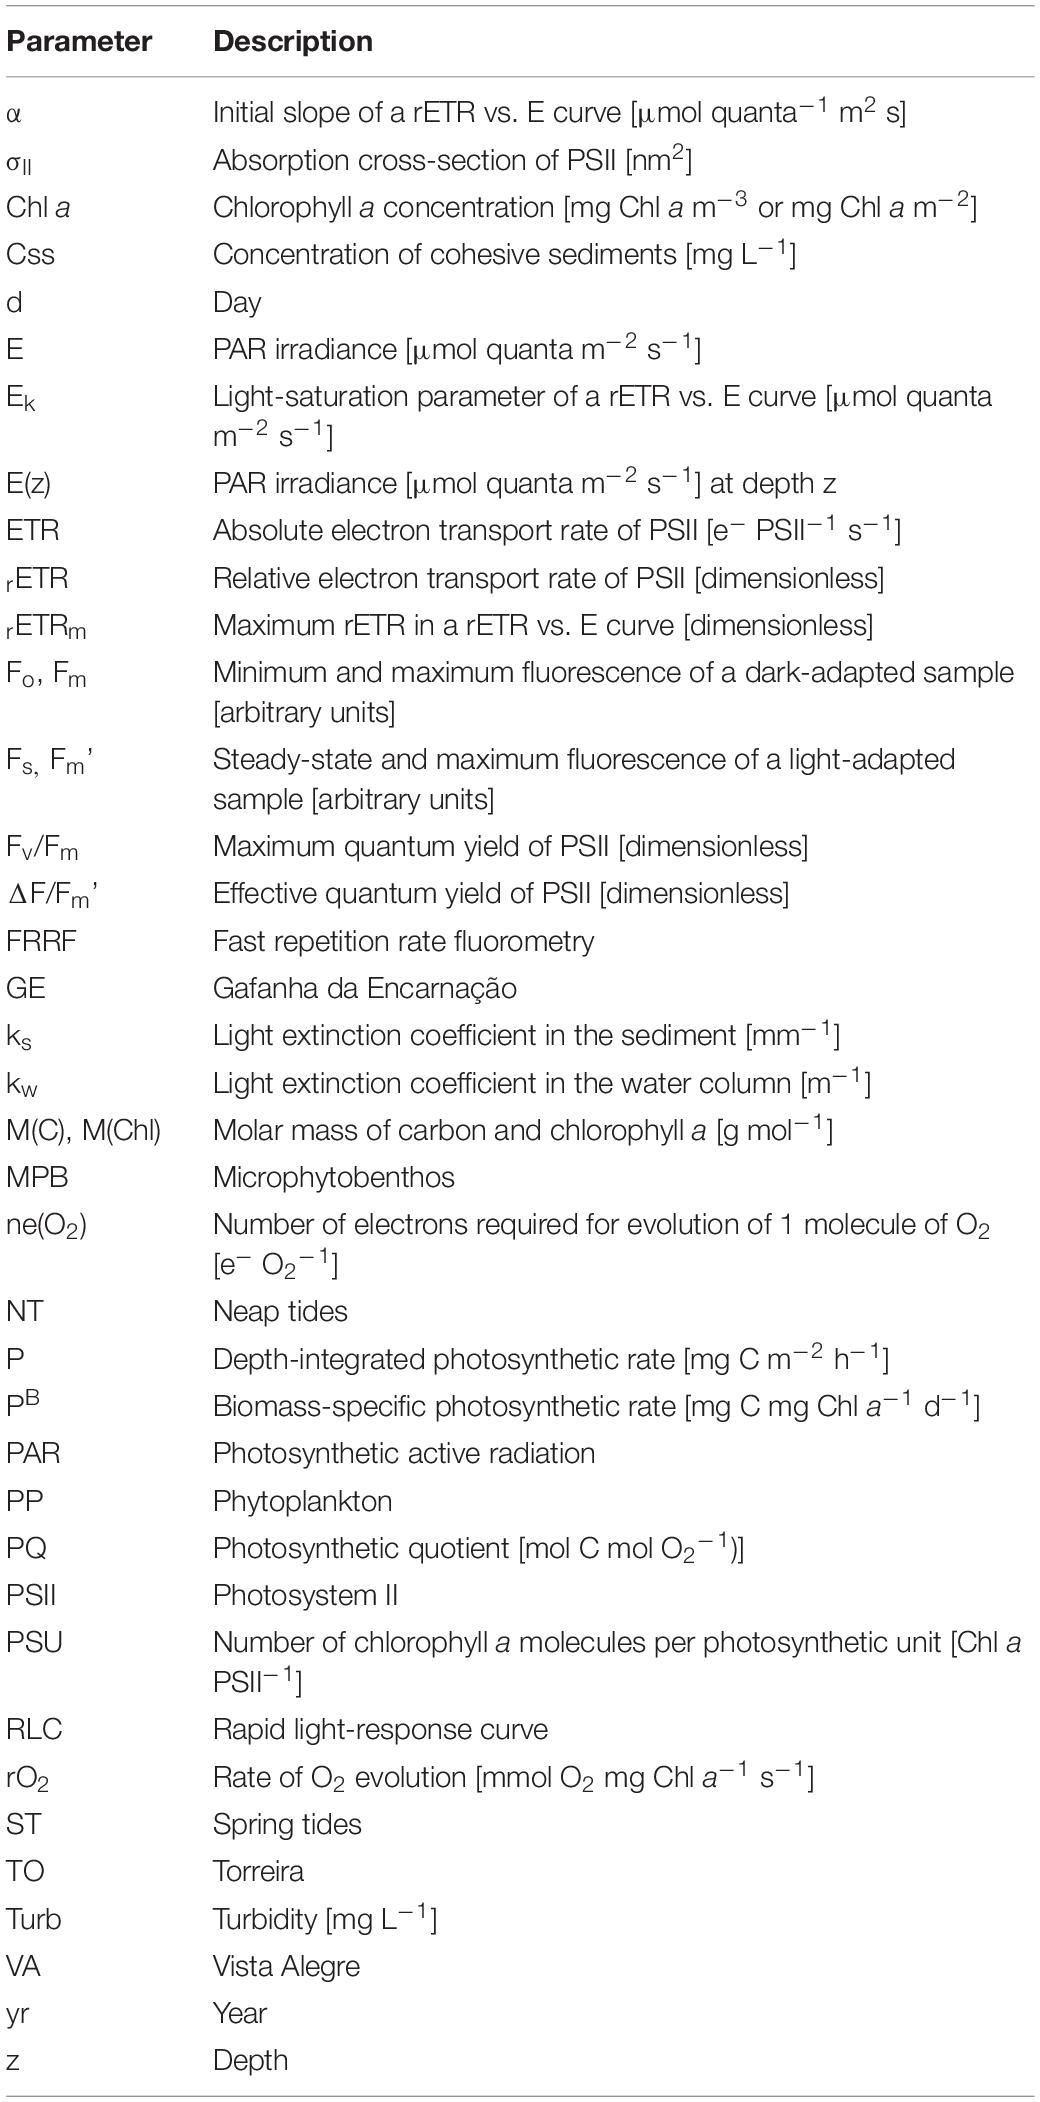
Table 1. Notation.
Biomass
Biomass of phytoplankton and microphytobenthos was estimated by quantifying chlorophyll a content. Water samples (1 L, one replicate per sampling point) were filtered in cellulose nitrate filters (0.8 μm pore size, 47 mm diameter) and immediately frozen at −80°C until pigment extraction. Sediment samples (three replicates per sampling point), collected with mini contact cores, were kept frozen prior to the pigment extraction. Chlorophyll a content was quantified spectrophotometrically following Lorenzen (1967). Pigments from all samples were extracted in 90% aqueous acetone. Samples were homogenized in a vortex, to ensure a good mixing between the sample (filters, sediments or pellets, depending on the sample type) and the extraction solvent. Extraction was done in the dark, at 4°C, for 24 h. Samples were centrifuged (3000 g, 10 min, 4°C) and the absorptance of the supernatant was read in a spectrophotometer (Thermo Fisher Scientific, Waltham, United States) at 664 and 750 nm, with acetone 90% used as a blank. Acidification was done by adding 12 μl of HCl 1 M. Chlorophyll a content was expressed per volume as mg m–3 (phytoplankton) or per area mg m–2 (microphytobenthos).
Chlorophyll a Fluorescence
Chlorophyll a fluorescence was measured using a Multi-Color PAM fluorometer, controlled by the PamWin V3.12w software (Heinz Walz GmbH, Effeltrich, Germany). Blue light (peaking at 440 nm) was used for the measuring and actinic light, and for the saturating light pulses. In the MCP-D detector unit, a RG 665 long pass filter (>650 nm, 3 mm RG665, Schott) was used. Fluorescence of cell suspensions was measured in a 10 × 10 mm quartz cuvette using the ED-101US/MD optical unit, coupled to a magnetic stirrer (PHYTO-MS Miniature Magnetic Stirrer, Walz). Fluorescence of microphytobenthos suspensions was measured using the MCP-BK Optical Unit for Leaf Measurements (Walz). The fluorometer was zeroed using filtered seawater as a blank (cells suspensions) or by pointing the MCP-BK Optical Unit to empty space (sediment samples). Measurements were carried out by running a user-defined Script-file, comprising the following steps: 30 s of darkness; measurement of the absorption cross section of PSII (σII; see below); 30 s of darkness; rapid light curves (RLC; see below); 60 s of actinic light, of intensity matching the solar irradiance at the moment of sample collection; measurement of the effective quantum yield (ΔF/Fm’, see below). During the periods of darkness, far-red illumination (725 nm) was applied to induce the fully re-oxidation of the plastoquinone pool. The first measurement of each RLC was taken as a proxy for the maximum quantum yield of PSII, Fv/Fm. Samples were magnetically stirred between measurements. At each occasion, measurements were carried out on three replicates.
Absorption Cross Section of PS II
The absorption cross section of PS II, σII, was measured from the O–I1 rise kinetics, following Schreiber et al. (2012). The O–I1 rise kinetics was measured under strong light (440 nm), using the pre-programmed Sigma 1000_MT. FTM fast trigger file. σII was then calculated by running the special fitting routine O-I1 Fit (PamWin V3.12w software, Walz), based on the reversible radical pair model of PS II (Schreiber et al., 2012).
Effective Quantum Yield and Relative Electron Transport Rate of PSII
The effective quantum yield (ΔF/Fm’) and the relative electron transport rate of PSII (rETR) were calculated from the fluorescence parameters Fs and Fm’ (steady-state and maximum fluorescence of a light adapted sample, respectively) and the incident photosynthetically active radiation (E; measured in situ or applied as actinic light by the fluorometer), by Genty et al. (1989):
and
Light-Response Curves of rETR
Rapid light-response curves (RLCs) of rETR were generated by sequentially applying 12 incremental lights steps (between 0 and 2180 μmol quanta m–2 s–1) of 10 s. RLCs were described by estimating the initial slope (α), the maximum rETR (rETRm) and the photoacclimation parameter Ek, by fitting the model of Eilers and Peeters (1988) as described in Frankenbach et al. (2018).
Absolute ETR and Carbon Fixation Rates
Absolute rates of electron transport at PSII were estimated following the rationale described by Schreiber et al. (2012), based on the determination of the rate of quantum absorption per PSII (e– PSII–1 s–1):
with L being the Avogadro’s constant (0.6022 mol–1). Carbon fixation rates (biomass-specific photosynthetic hourly rates; mg C mg Chl a–1 h–1) were estimated from (i) hourly rates of O2 evolution (mmol O2 mg Chl a–1 s–1), estimated by:
where PSU is the number of chlorophyll a molecules per photosynthetic unit, ne(O2) is the number of electrons required for evolution of 1 molecule of O2 and M(Chl) is the molar mass of chlorophyll a (893.49 g mol–1); and (ii) the ratio of oxygen produced per fixed carbon (photosynthetic quotient, PQ; mol C mol O2–1):
where M(C) is the molar mass or carbon (12.01 g mol–1) and 3600 is the conversion factor for hourly rates. PSU and ne(O2) were assumed to be equal to 600 Chl a PSII–1 and 5 e– O2–1, respectively, based on the experimental data compiled by Suggett et al. (2010). PQ was assumed to be 1.1 mol C mol O2–1 (Kromkamp et al., 2008). All these parameters were assumed to remain constant across sampling sites and dates of sampling. Daily carbon fixation rates were calculated by integrating the hourly rates for each daytime period.
Areal Rates of Carbon Fixation
Areal rates of carbon fixation were estimated by integrating over depth the biomass-specific photosynthetic rates calculated by Eq. (5), using the method described by MacIntyre et al. (1996). For each depth z below the surface of the water (phytoplankton) or the sediment (microphytobenthos): (i) incident irradiance E(z) was calculated from light the attenuation coefficient kw or ks (for the water column and sediments, respectively; see below) assuming an exponential decrease with depth; (ii) the biomass-specific photosynthetic rate PB(z) was calculated from the light-response curve (PB vs. E) measured for the corresponding sampling time and site, using E(z) as an input; light-response curves of PB were calculated by applying Eqs. 3–5 to the rETR vs. E curves (RLCs). PB(z) was calculated for depth intervals Δz of 10–6 mm (sediment) or 10–6 m (water column) and depth-integrated rate P (mg C m–2 h–1) was calculated summing over all depth intervals and multiplying by the chlorophyll a concentration, Chl a, assumed to be distributed evenly within the water column or the sediment (mg Chl a m–3):
For the microphytobenthos, PB(z) was calculated based on the light curves measured on cells collected in lens tissues, integrated numerically over depth using the attenuation coefficient measured for each type of sediment. Chlorophyll a concentration (mg Chl a m–3) was calculated considering the volume sampled by the contact core used for each sampling site. For the phytoplankton, PB(z) was depth integrated from the surface until the maximum depth of the water column at each sampling moment.
Light Attenuation Coefficients
Spectral scalar irradiance profiles of PAR in sediments of the sampling sites were measured with a custom-made scalar field radiance probe connected to a spectrophotometer (USB 2000+, Ocean Optics, Duiven, Netherlands), and recorded using the spectral acquisition software Spectra Suite (Ocean Optics). The custom-made sensor consisted of a light diffusing sphere with a diameter of 90 μm, attached to the coated tip of a tapered optical fiber (Rickelt et al., 2016). The sensor was mounted on a motorized micromanipulator and positioned on the sediment surface in a 45° angle to minimize self-shading. To account for the insertion angle, the sensor was moved downwards in 141.4 μm steps to record spectral irradiance profiles in vertical depths of 100 μm increments. Spectral data were normalized to the incident downwelling irradiance recorded on a black non-reflective surface at the same position relative to light source and sediment surface. The light attenuation coefficients (ks, mm–1) were determined by the slope of the linear decay of the natural logarithm transformed percentage of incident light intensity as a function of depth, down to a maximum depth of 0.8 mm (Kühl, 2005). Measurements were replicated on three different samples per sampling site.
For the water column, the light extinction coefficient, kw (m–1), was estimated from measurements of turbidity (Turb, NTU), assuming to be proportional to the concentration of cohesive sediments (Css, mg L–1), using the following relationships (Portela, 1996; Vaz et al., 2019):
and
Estimation of Ecosystem-Level Annual Primary Productivity
A tentative estimate of the annual primary productivity of the phytoplankton and microphytobenthos of the entire estuary was calculated by multiplying the daily rates P, measured at each season and tidal cycle (spring vs. neap), by the number of days of each season (91 days, 1/4 of the year) corresponding to spring tides or to neap tides (45.5 days). Daily rates were calculated by summing the hourly rates determined for each day of sampling. Upscale to the whole estuary was done by considering the total flooded area of the estuary (phytoplankton) and the area corresponding to intertidal flats (microphytobenthos). The former was estimated from the mean value between the area covered by water during mean high tide and during mean low tide (89.2 and 64.9 km2, respectively; Lopes et al., 2013). The areas corresponding to each type of sediment type were the ones determined in Frankenbach et al. (2019): 34, 16 and 5 km2 for TO, GE and VA, respectively. The area corresponding to the phytoplankton was estimated to reach 100 km2, by adding the subtidal and the total intertidal areas calculated by Frankenbach et al. (2019). The modeling approach used to estimate the area rates of carbon fixation by phytoplankton and microphytobenthos is summarized in Figure 2.
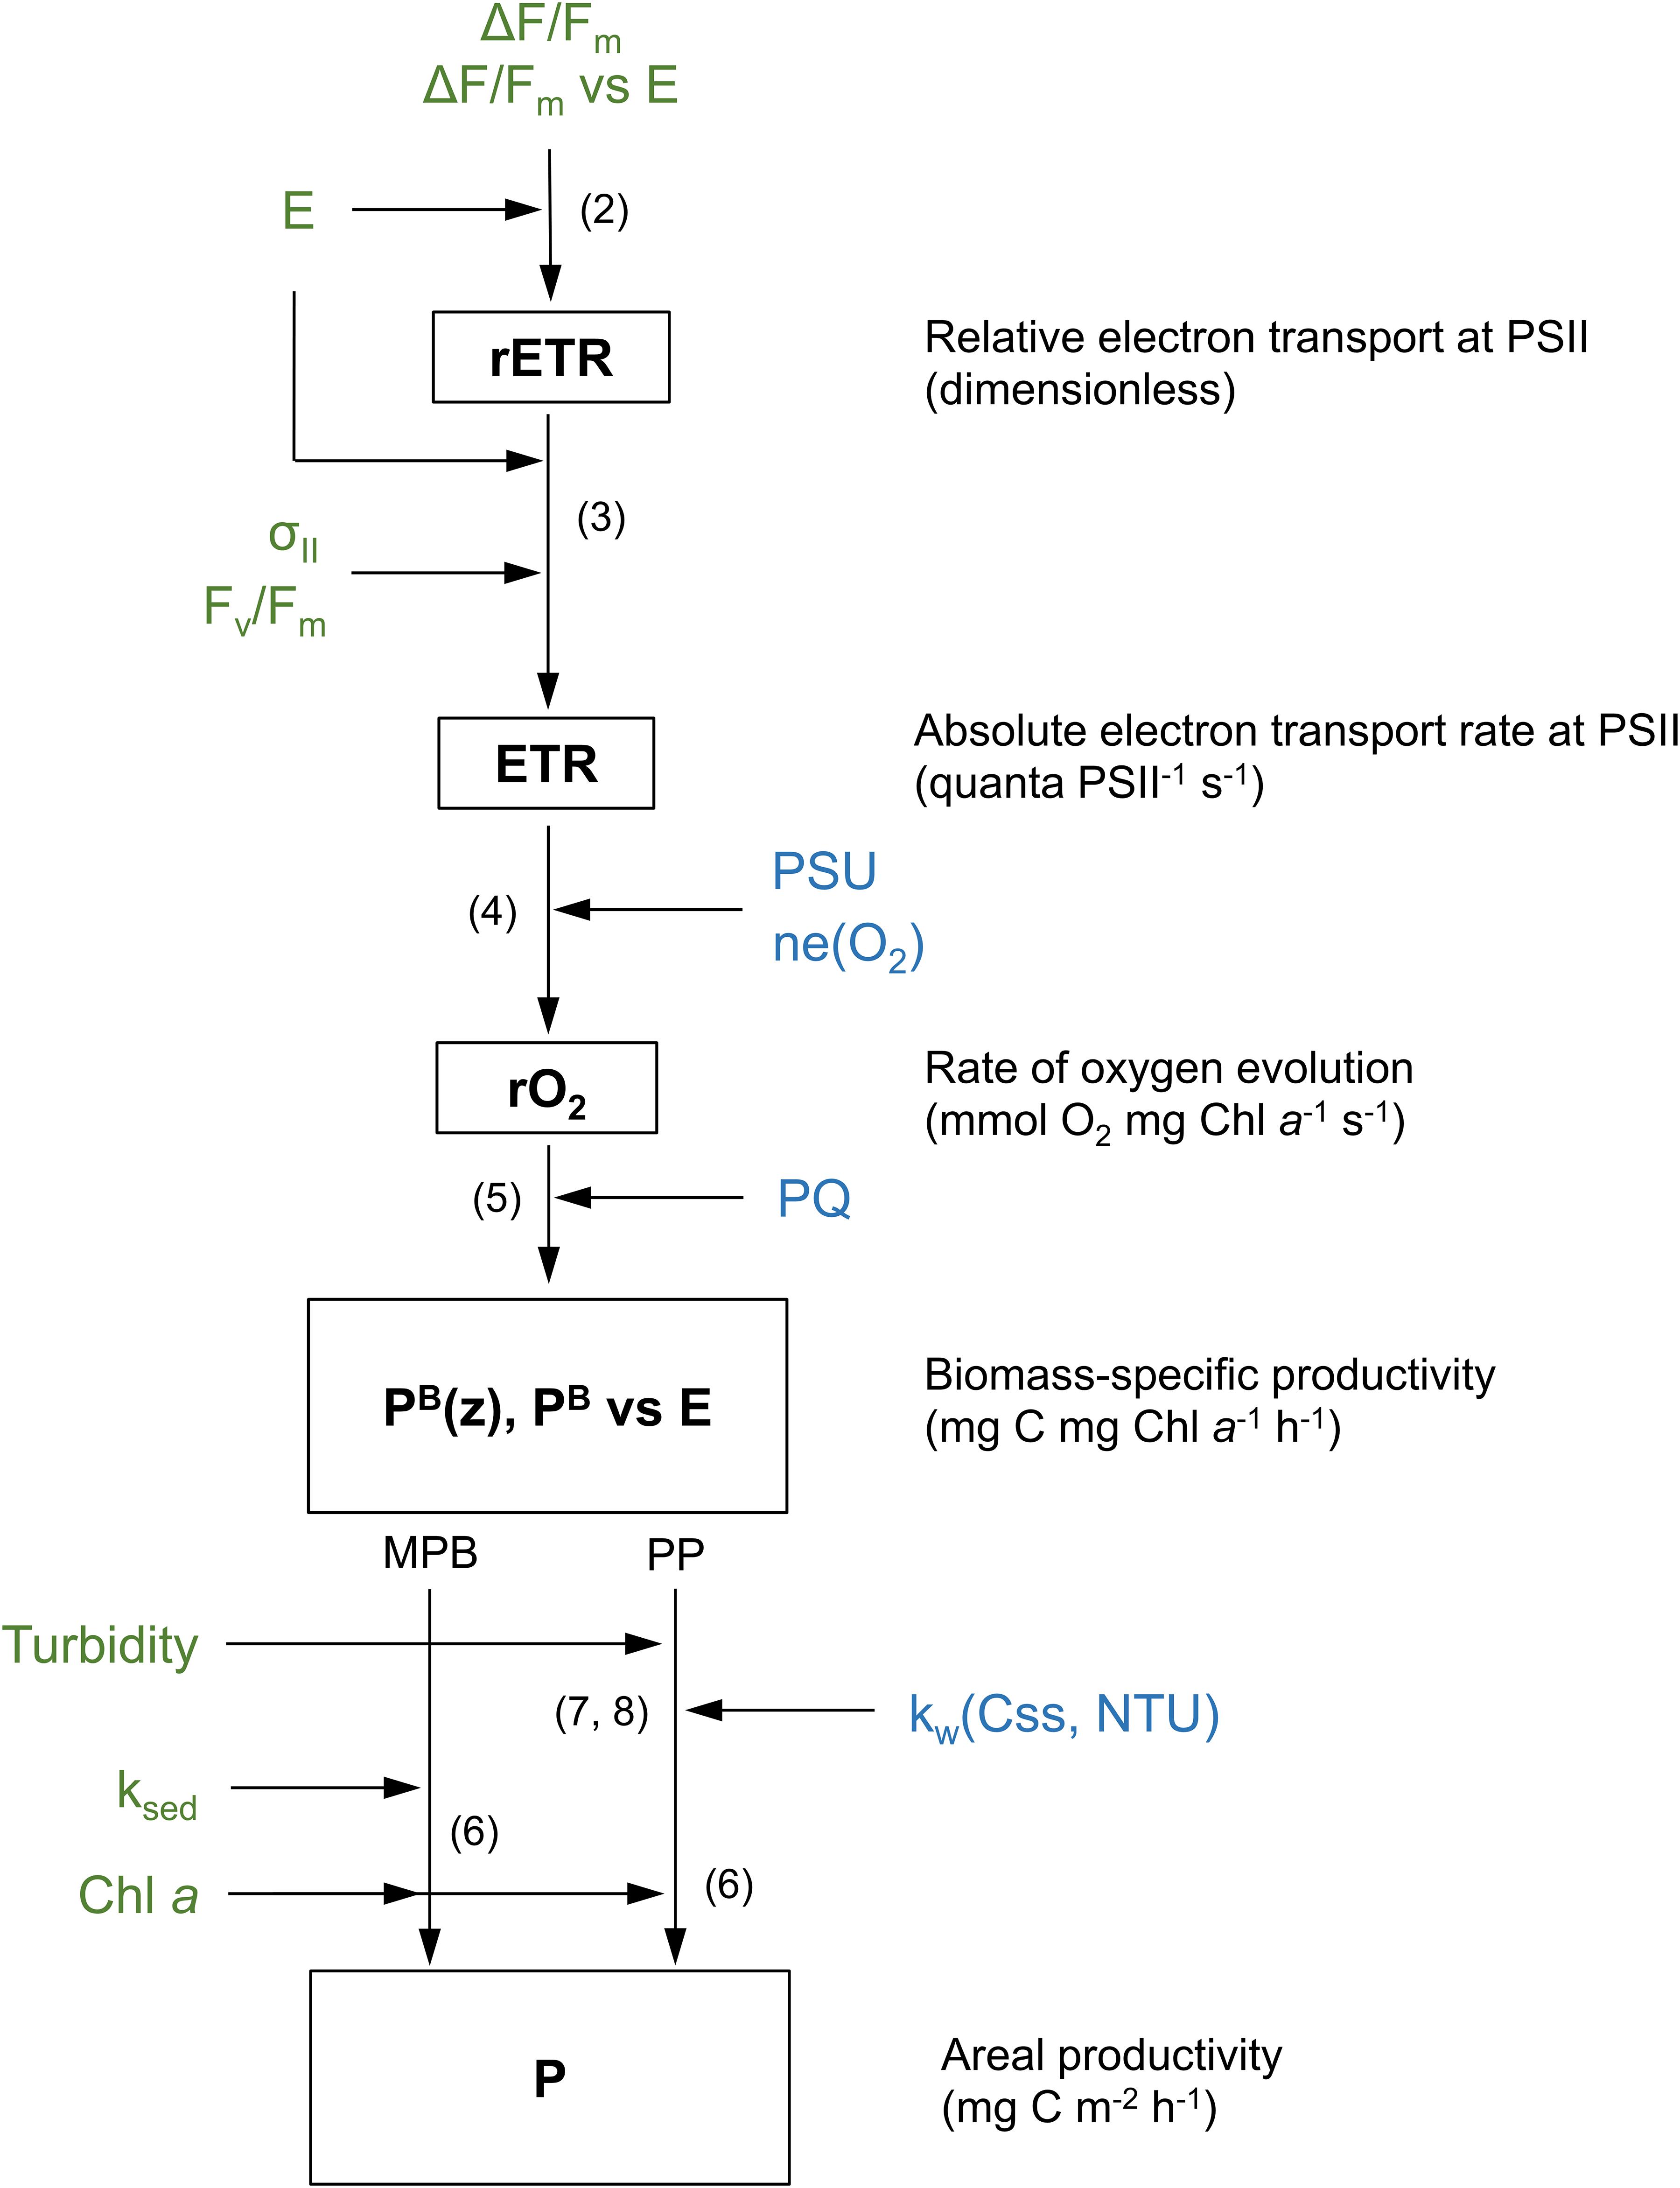
Figure 2. Schematic describing the modeling workflow followed in this study. Biomass-specific productivity rates (PB, mg C mg Chl a–1 h–1) were calculated from irradiance (E) and fluorescence-based parameters (Fv/Fm, ΔF/Fm’, σII). Productivity per unit area was calculated by depth-integrating PB using light-response curves of PB, chlorophyll a content, and light attenuation. Depth-integration was carried out differently for phytoplankton (PP) and microphytobenthos (MPB), using light attenuation coefficient for the water column (kw) and the sediment (ks), respectively. Parameters in green were measured in this study. Parameters in blue were taken from published sources. Numbers represent the equations describing each step.
Statistical Analysis
Measurements made on different sampling sites and occasions were compared by applying two-way ANOVAs, and by post hoc Tukey HSD test. Assumptions of normality and homoscedasticity were verified prior to analysis using the Shapiro–Wilk test and Levene’s test, respectively. In case of violation of assumptions, data were log transformed. All statistical analyses were carried out using Statistica 10 (StatSoft, Tulsa, OK, United States).
Results
Hourly Variability in Physical Conditions, Photophysiology, and Biomass-Specific Productivity
Figures 3–5 illustrate the typical hourly variability in abiotic and photophysiological parameters in the three sampling sites for 2 days, on neap and spring tides, during July 2013. A marked hourly variability in abiotic factors was observed in both the water column and intertidal sediments. Water column turbidity varied markedly during the tidal cycle, typically reaching higher values during low tide (Figures 3–5A,B) and showing short periods of very high values close to the tidal ebb (Figures 3A,B) or flood (Figure 4B).
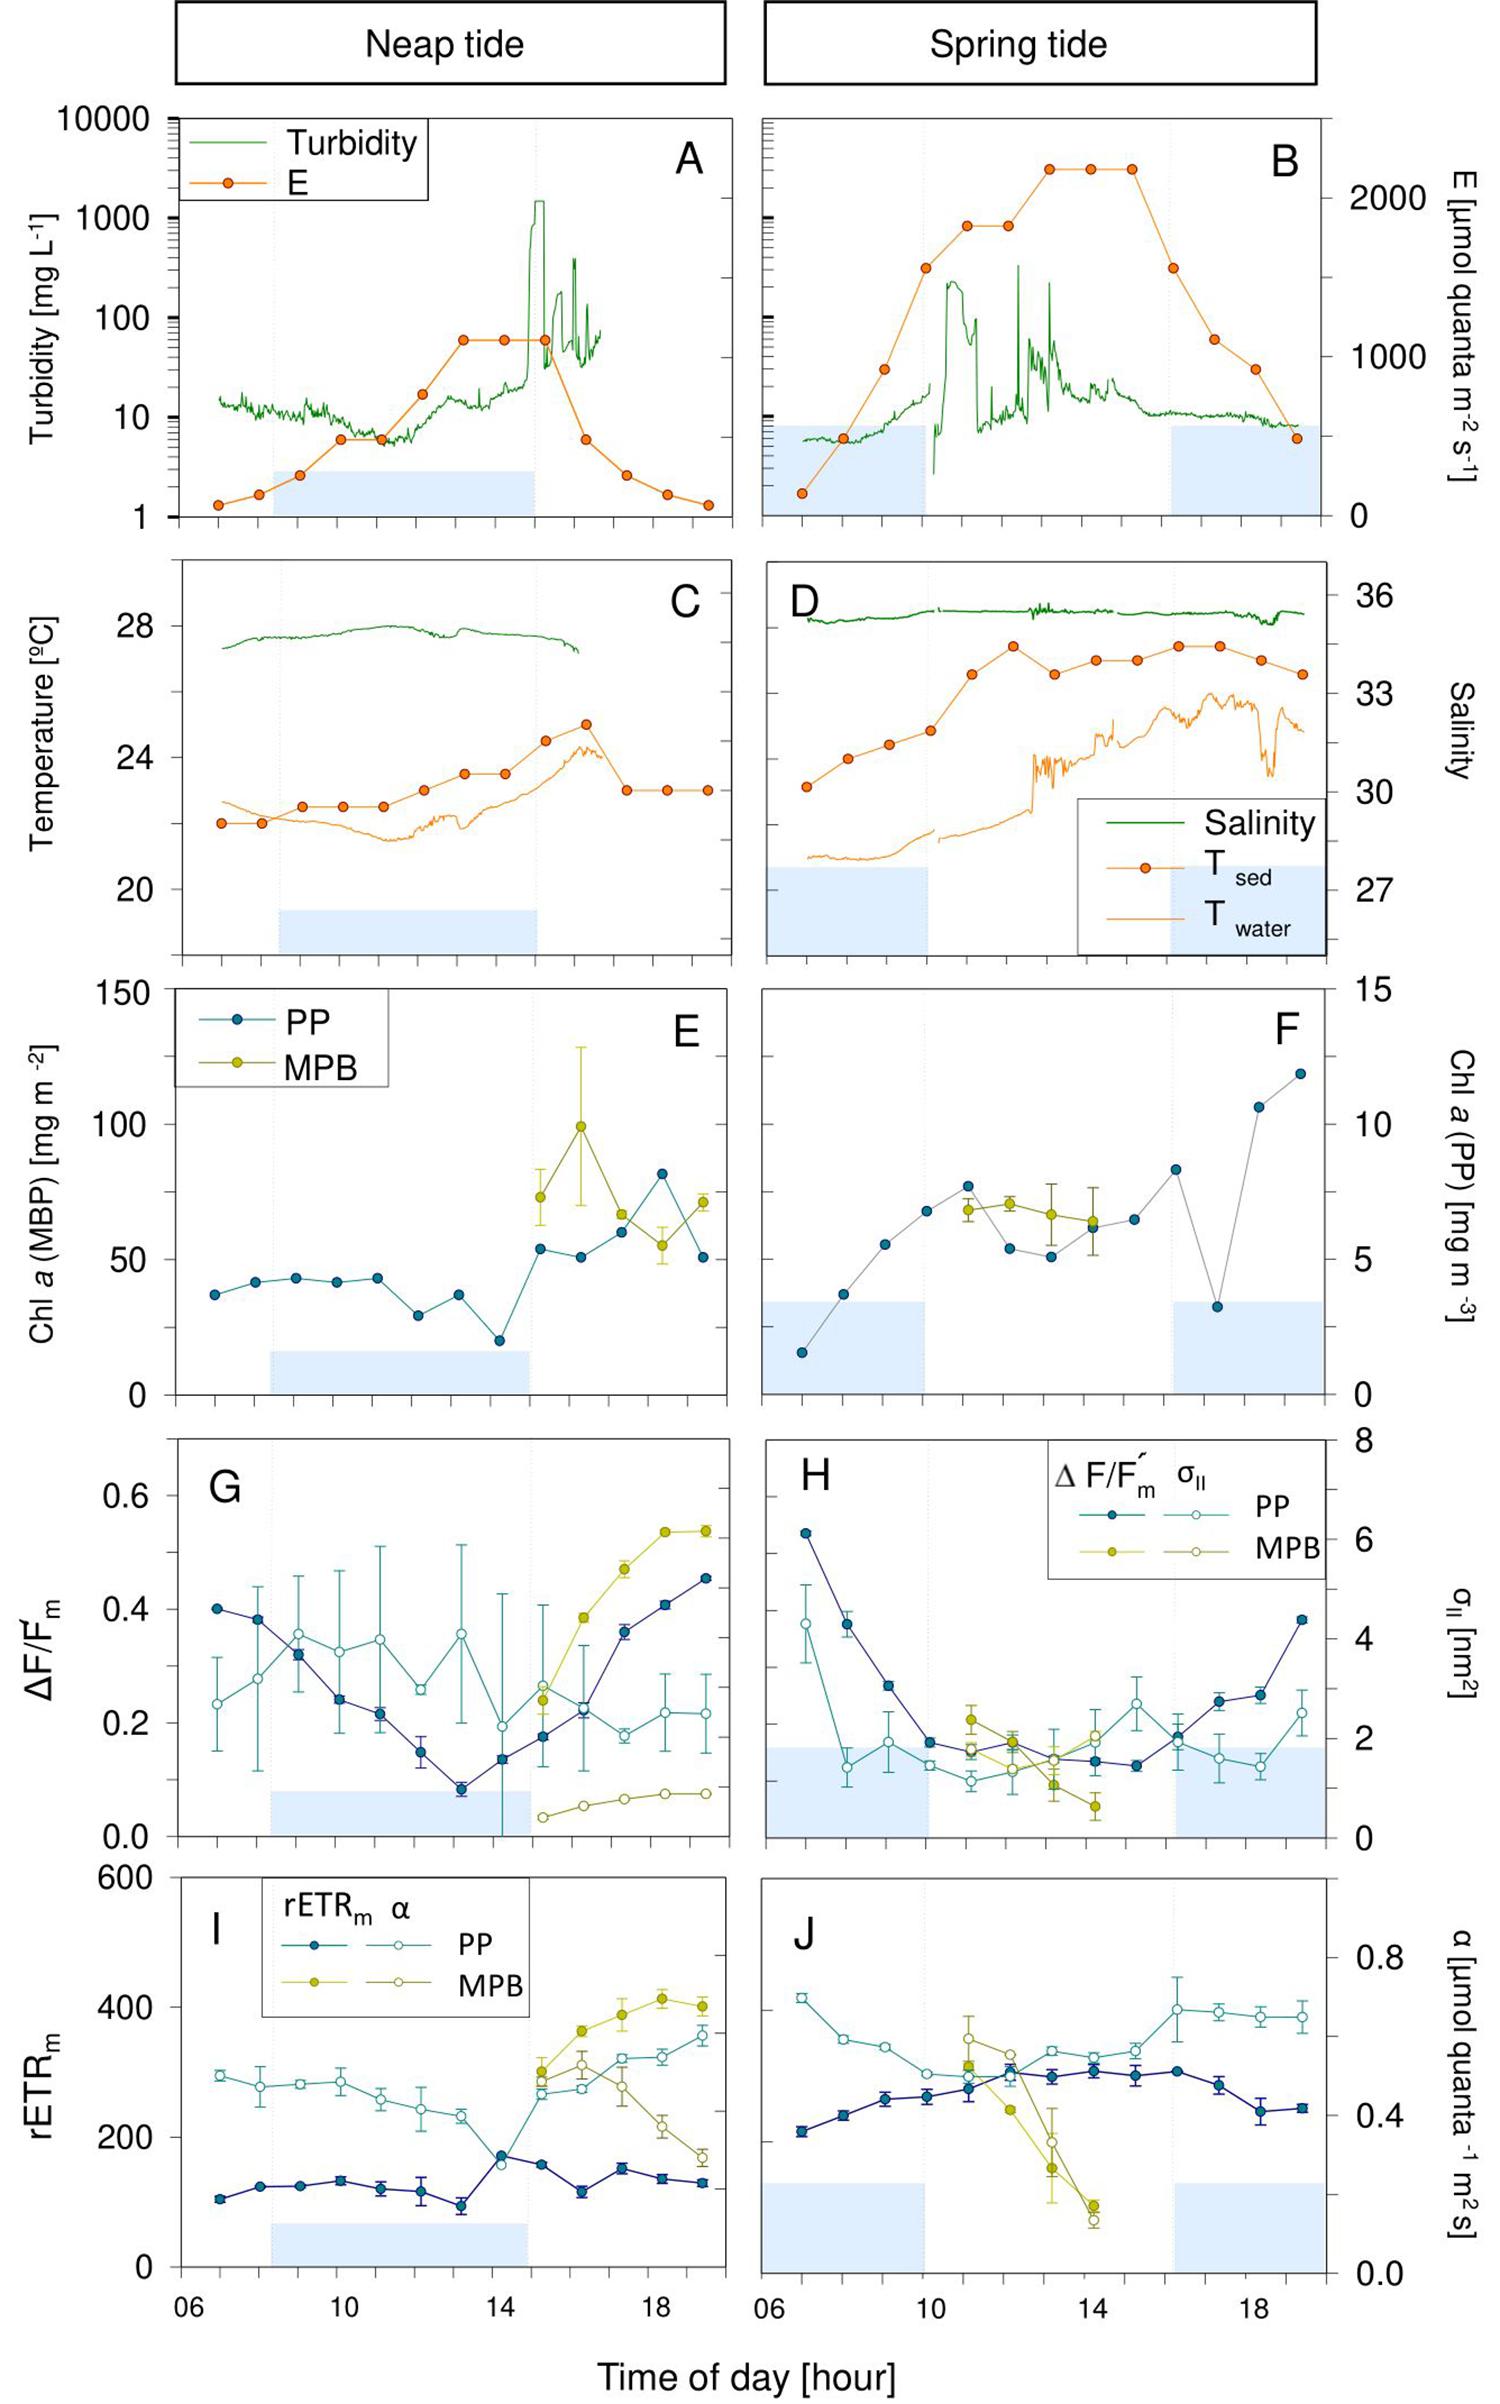
Figure 3. Hourly variation of abiotic (A–D) and photophysiological (E–J) parameters along one day in Torreira (TO) during neap (A,C,E,G,I) and spring tide (B,D,F,H,J) in July 2013. Blue areas represent high tide; vertical bars demonstrate the beginning and end of the high tide. Mean values of three replicates. Error bars represent one standard error. PP, phytoplankton; MPB, microphytobenthos.
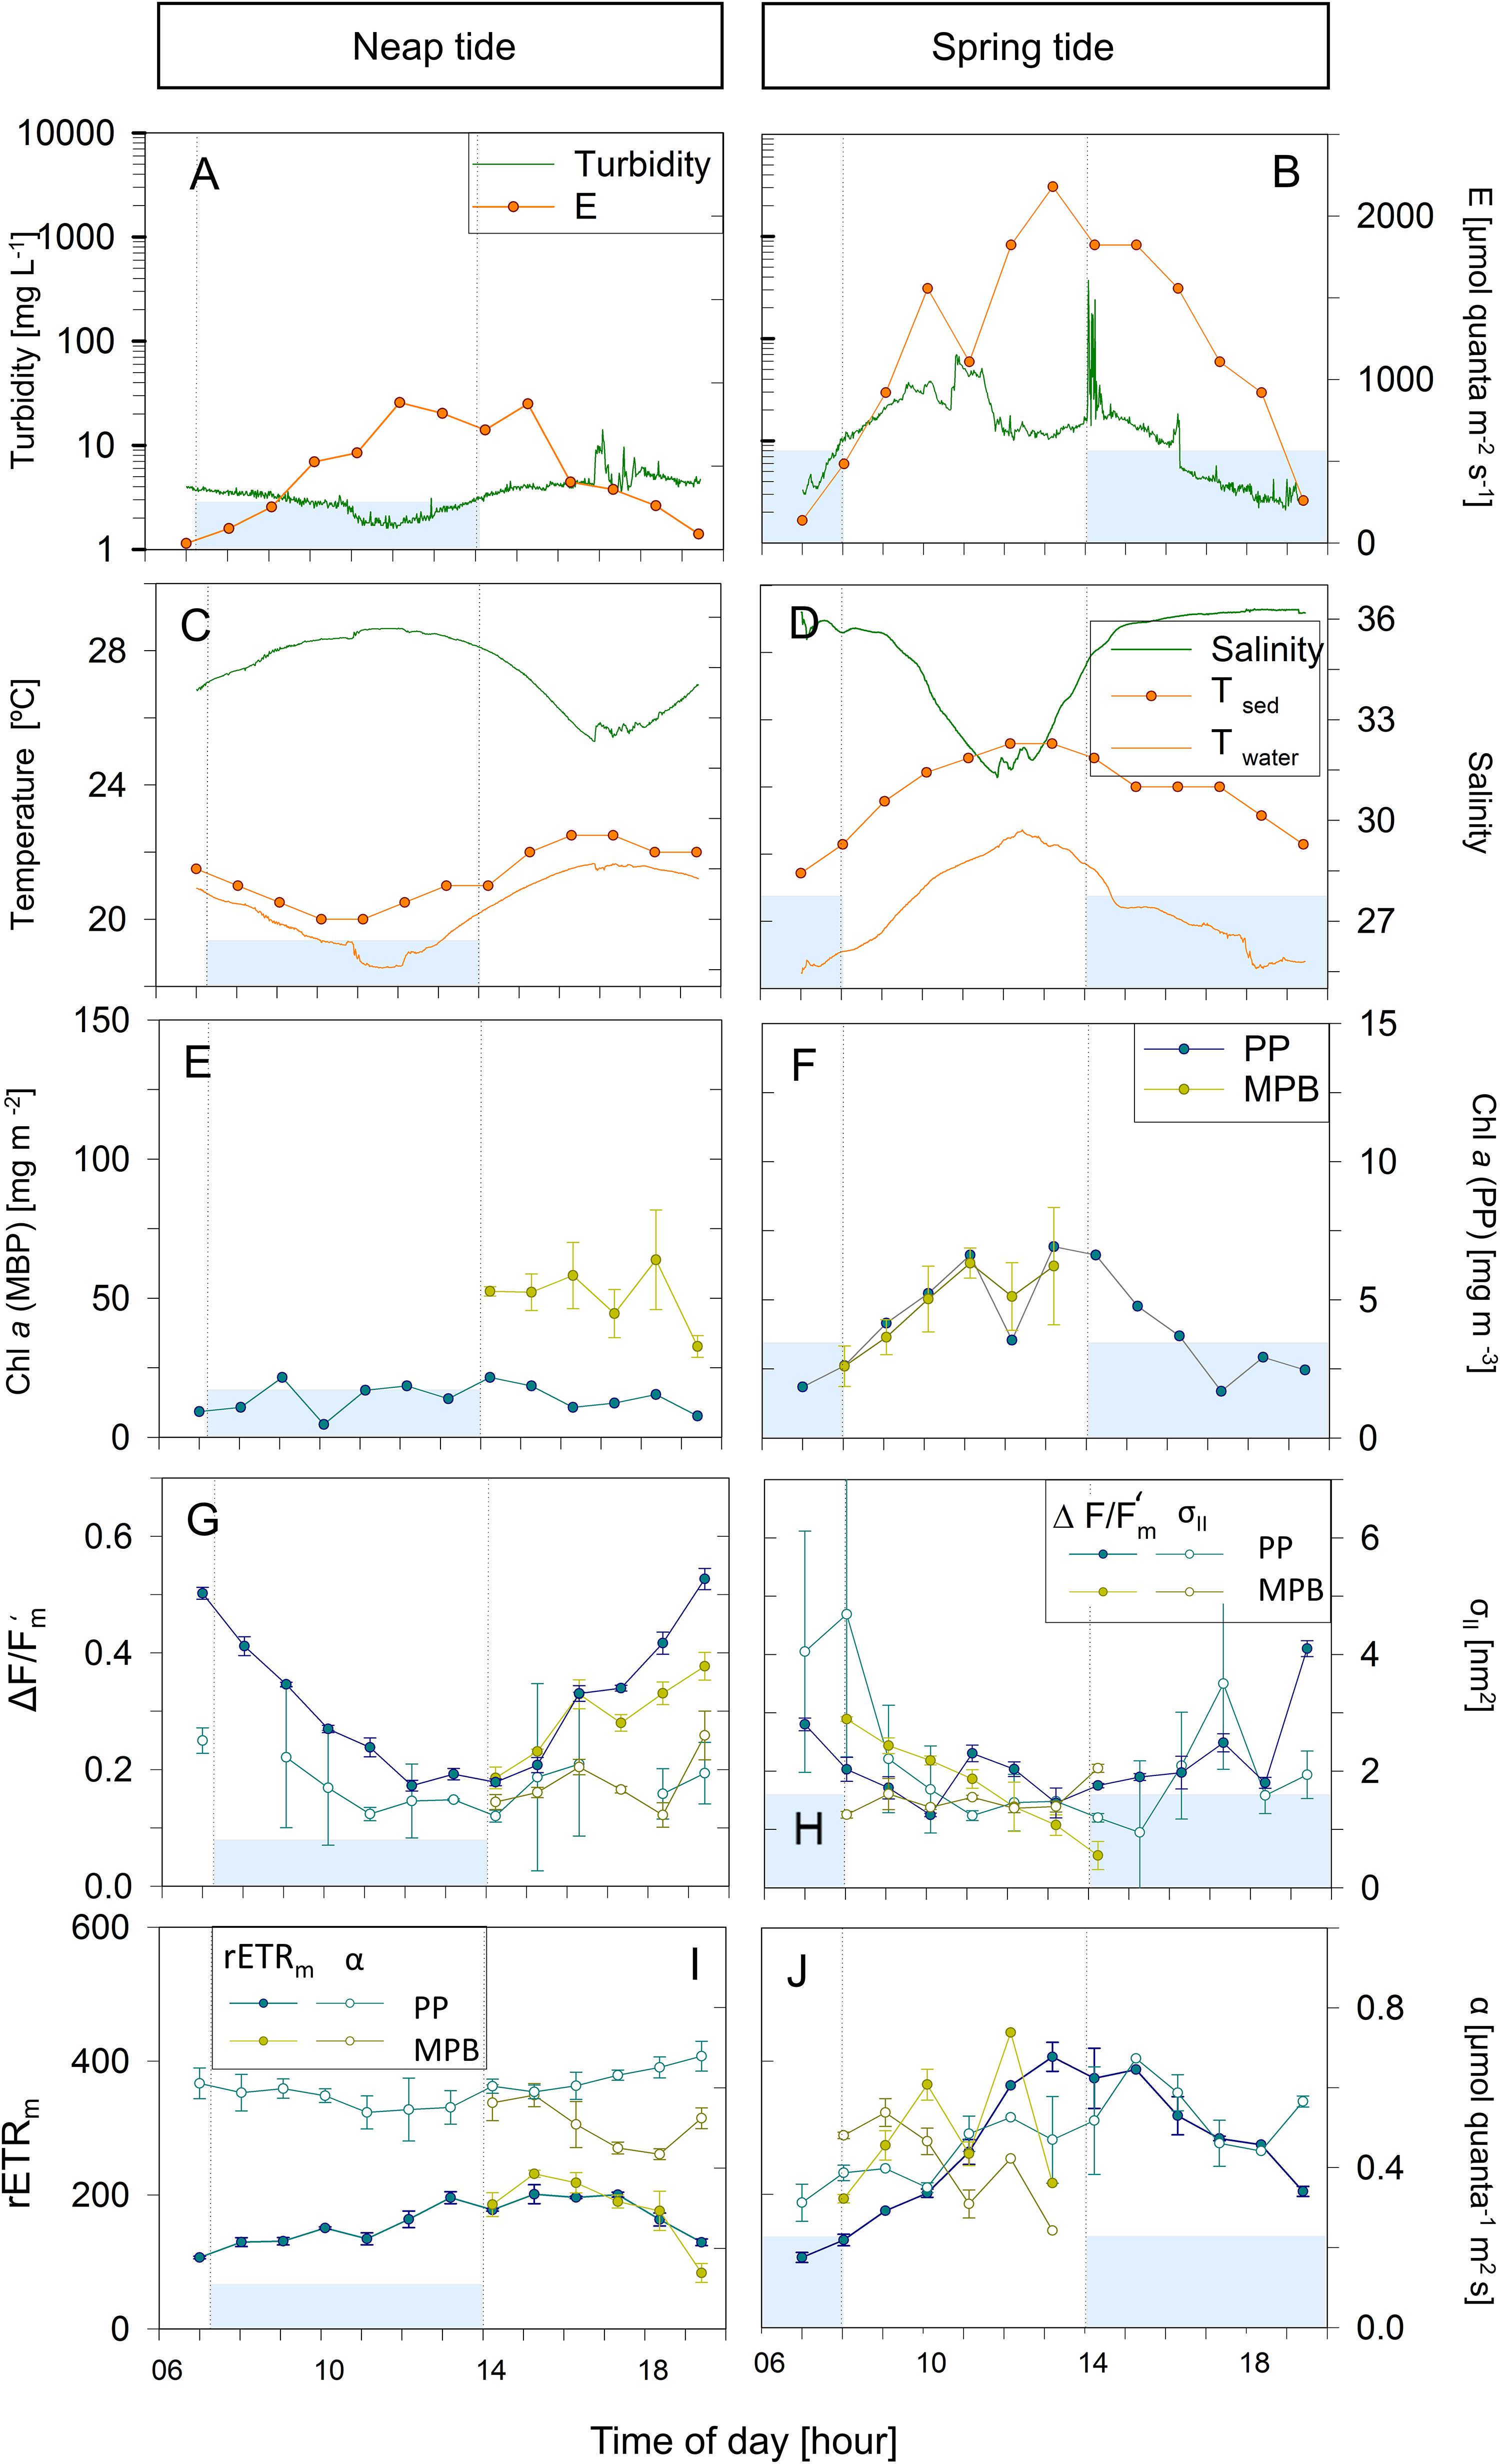
Figure 4. Hourly variation of abiotic (A–D) and photophysiological (E–J) parameters along one day in Gafanha de Encarnação (GE) during neap (A,C,E,G,I) and spring tide (B,D,F,H,J) in July 2013. Blue areas represent high tide; vertical bars demonstrate the beginning and end of the high tide. Mean values of three replicates. Error bars represent one standard error. PP, phytoplankton; MPB, microphytobenthos.
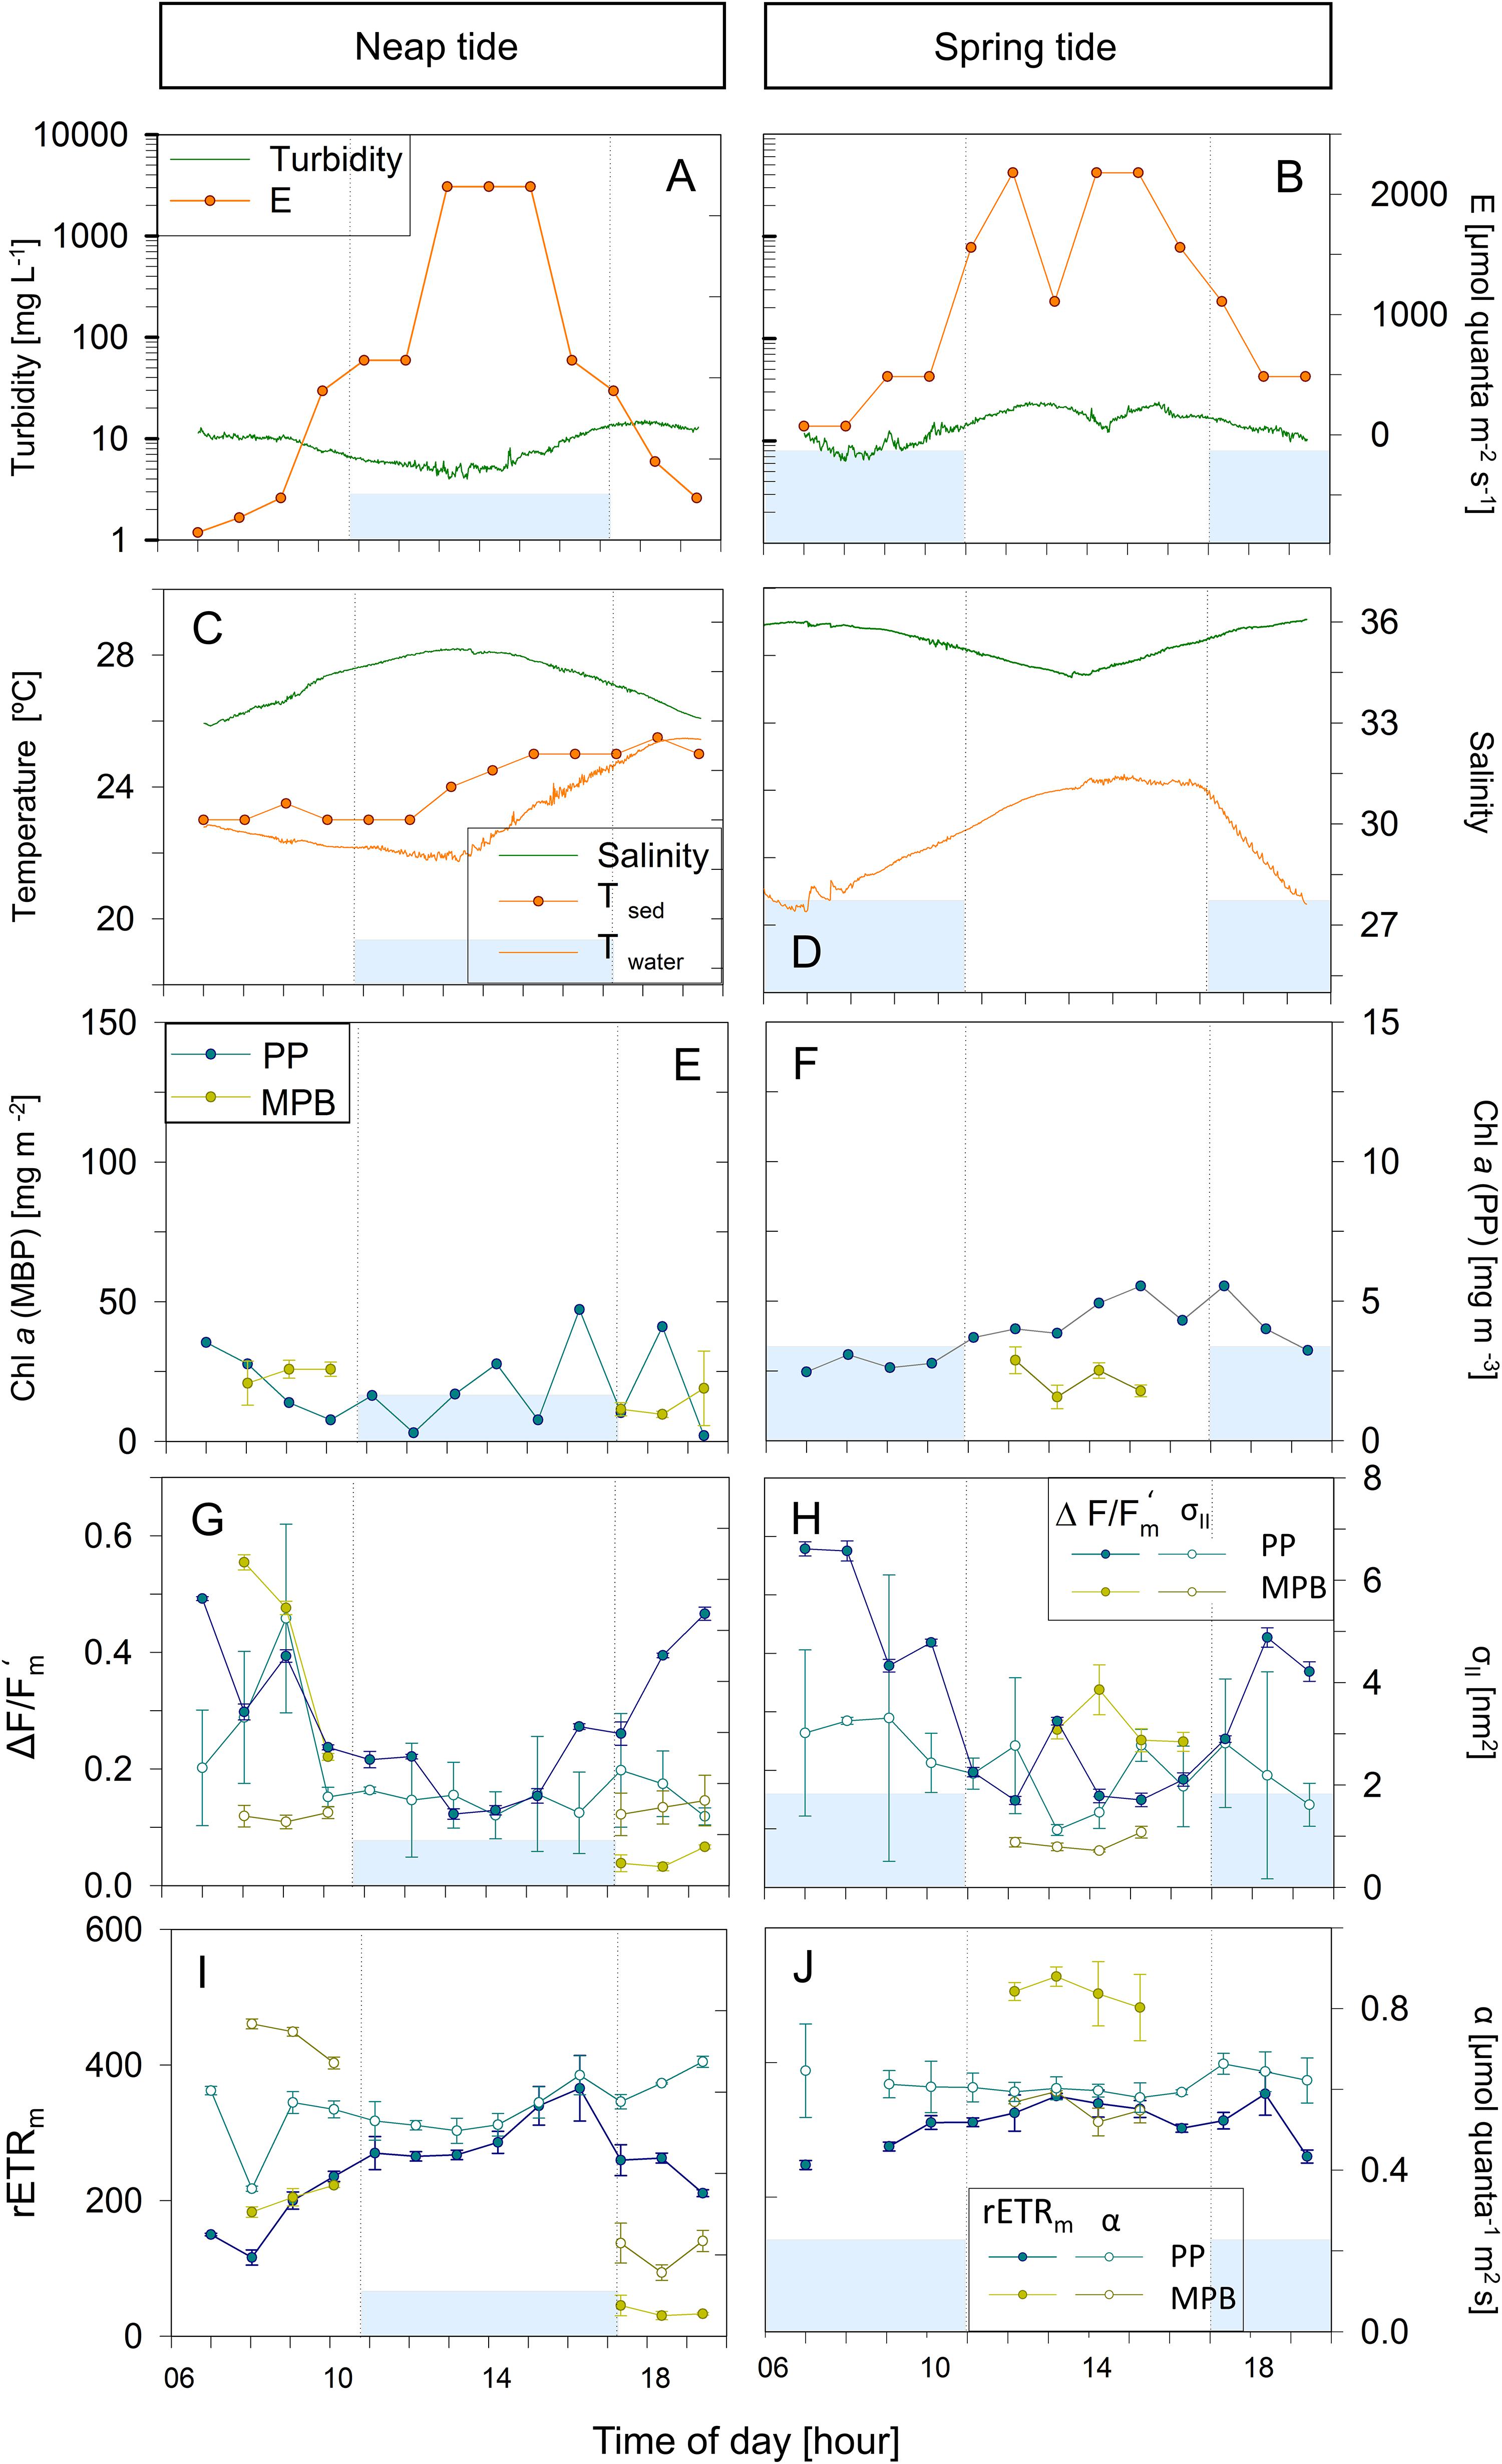
Figure 5. Hourly variation of abiotic (A–D) and photophysiological (E–J) parameters along one day in Vista Alegre (VA) during neap (A,C,E,G,I) and spring tide (B,D,F,H,J) in July 2013. Blue areas represent high tide; vertical bars demonstrate the beginning and end of the high tide. Mean values of three replicates. Error bars represent one standard error. No temperature data available for the spring tide sampling day (D). PP, phytoplankton; MPB, microphytobenthos.
Water temperature was relatively constant during high tide (deeper water column), typically increasing along the ebb, especially when occurring at mid-day (neap tides; Figures 3D, 4C,D, 5D). On some days, on the site closest to the mouth of the estuary (GE), a sharp inversion of water temperature could be observed at the mid of the low tide period, associated with an equally marked change of salinity, revealing a sudden replacement of water masses at the sampling site, from freshwater-dominated (higher temperature, low salinity) to oceanic (lower temperature, high salinity) (Figure 4D). The tides had a measurable impact on the water temperature, as the incoming oceanic seawater during flood was often substantially cooler than the estuarine water. Sediment temperature exhibited the same general pattern as the water column, with higher values being recorded during low tide, when sediment was exposed (Figures 3–5C,D), but especially during spring tides, when low tide occurred at mid-day (Figures 3–5D). The sediment was typically warmer than water column, often reaching values above 25°C (Figure 3D), as measurements were taken during diurnal low tide, when the sediment surface was exposed to direct sunlight.
Water column salinity was often lower during low tides, when the influence of freshwater was the greatest, and higher in high tide, reaching values typical of seawater (around 35). This pattern of variation was more marked in site GE, the one closest the estuary mouth (e.g., Figures 4C,D). On site TO, water salinity remained virtually constant due to reduced influx of fresh water in that canal (Figures 3C,D).
Phytoplankton biomass, as measured by chlorophyll a concentration in the water column, showed a large hourly variability, particularly in sites TO and GE during spring tides (Figures 3E,F, 4F). Maximum values tended to occur during the low tide periods (Figures 3–5F). Variations from about 1.5 to 7.5 mg Chl a m–3 in a period of 4 h were observed in site TO (Figure 3F). At site VA, the farthest from the estuary mouth, hourly variations were much smaller (Figures 5E,F). In contrast with the water column, the chlorophyll a content of the sediment did not show a consistent pattern of variation, although in some instances the two parameters displayed a similar pattern of variation, with maximum values during the low tide periods (Figure 4F).
The effective quantum yield of PSII, ΔF/Fm’, also varied markedly along the day, both for phytoplankton and microphytobenthos. The same overall pattern was observed for the two groups, with values varying from 0.5 to 0.6 during early morning or late afternoon, and around 0.1, when solar irradiances were the highest. For the phytoplankton, this pattern was observed in all days, with ΔF/Fm’ mainly responding (inversely) to solar irradiance, irrespectively of tidal stage. During neap tides, an almost symmetrical pattern was found, with the decrease of ΔF/Fm’ observed during the morning recovering completely during the afternoon (Figures 3–5G). On days during spring tides, the recovery of ΔF/Fm’ appeared incomplete (Figures 3–5H), likely associated to the shallower water column during the middle of the day, allowing the exposure of the cells to higher light levels, higher temperature and lower salinity, conditions prone to cause a higher slowly reversible photodamage. For the microphytobenthos, ΔF/Fm’ values were generally similar to those of phytoplankton, following the same overall trend of varying inversely with incident solar irradiance (Figures 3–5G,H).
The absorption cross section of PS II, σII, was characterized by a large variability between replicates, especially for phytoplankton (e.g., Figures 3–5G). Both for phytoplankton and microphytobenthos, σII varied similarly to ΔF/Fm’, largely responding inversely to solar irradiance (e.g., Figure 3G, microphytobenthos). However, σII seemed to be more affected by tidal stage, as in some days it did not decrease under high solar irradiance if under high tide (Figures 4G,H; phytoplankton and microphytobenthos). σII was consistently lower for microphytobenthos than for phytoplankton. Clear trends of hourly variation were not very evident, although a tendency to vary inversely with irradiance could be identified (e.g., Figures 3–5H).
Short-term photoacclimation status, as measured by RLC parameters α and rETRm, varied hourly both for phytoplankton and microphytobenthos. However, changes in photoacclimation status were driven mostly by changes in rETRm than in α. On most days, rETRm varied markedly, showing a well-defined pattern of variation, increasing toward the middle of the day, and reaching minimum values at beginning and end of the day (Figures 4, 5I,J). In the case of phytoplankton, light-limited photosynthesis (denoted by α) remained relatively constant along the day, on most days (e.g., Figures 4I, 5J), but occasionally showed erratic, short-term variations (Figure 3J). In the case of microphytobenthos, α and rETRm values were similar to those measured in the water column, although rETR varied following less defined trends, and more variable in absolute terms: similar (Figure 3I), significantly lower (Figure 4I) or significantly higher (Figure 4J).
Spatio-Temporal Variability: Fortnight and Seasonal Time Scales
Mean daily solar irradiance (average of hourly values measured during the whole photoperiod) varied markedly with season, with maximum values being measured in July and in May/June (Figures 6A–C). However, the variation in incident solar irradiance between spring and neap tides was partially due to changes in cloud cover during the sampling days (Figures 6A–C). Considering the high turbidity of the water column, the total daily light doses received at the intertidal sites varied substantially on the timing of the low tide period (Figures 6A–C). Also, because of the delay in tidal propagation inside the estuary, causing the timing of low tide to vary between the sampling sites, a systematic variation in daily solar light dose received in the three sites was observed. Water turbidity was relative constant across sampling sites and seasons, being affected mainly by tide, but a tendency for higher values during autumn and winter was observed. Occasional peaks in turbidity were measured, causing a large data dispersion (e.g., TO, July; Figure 6A).
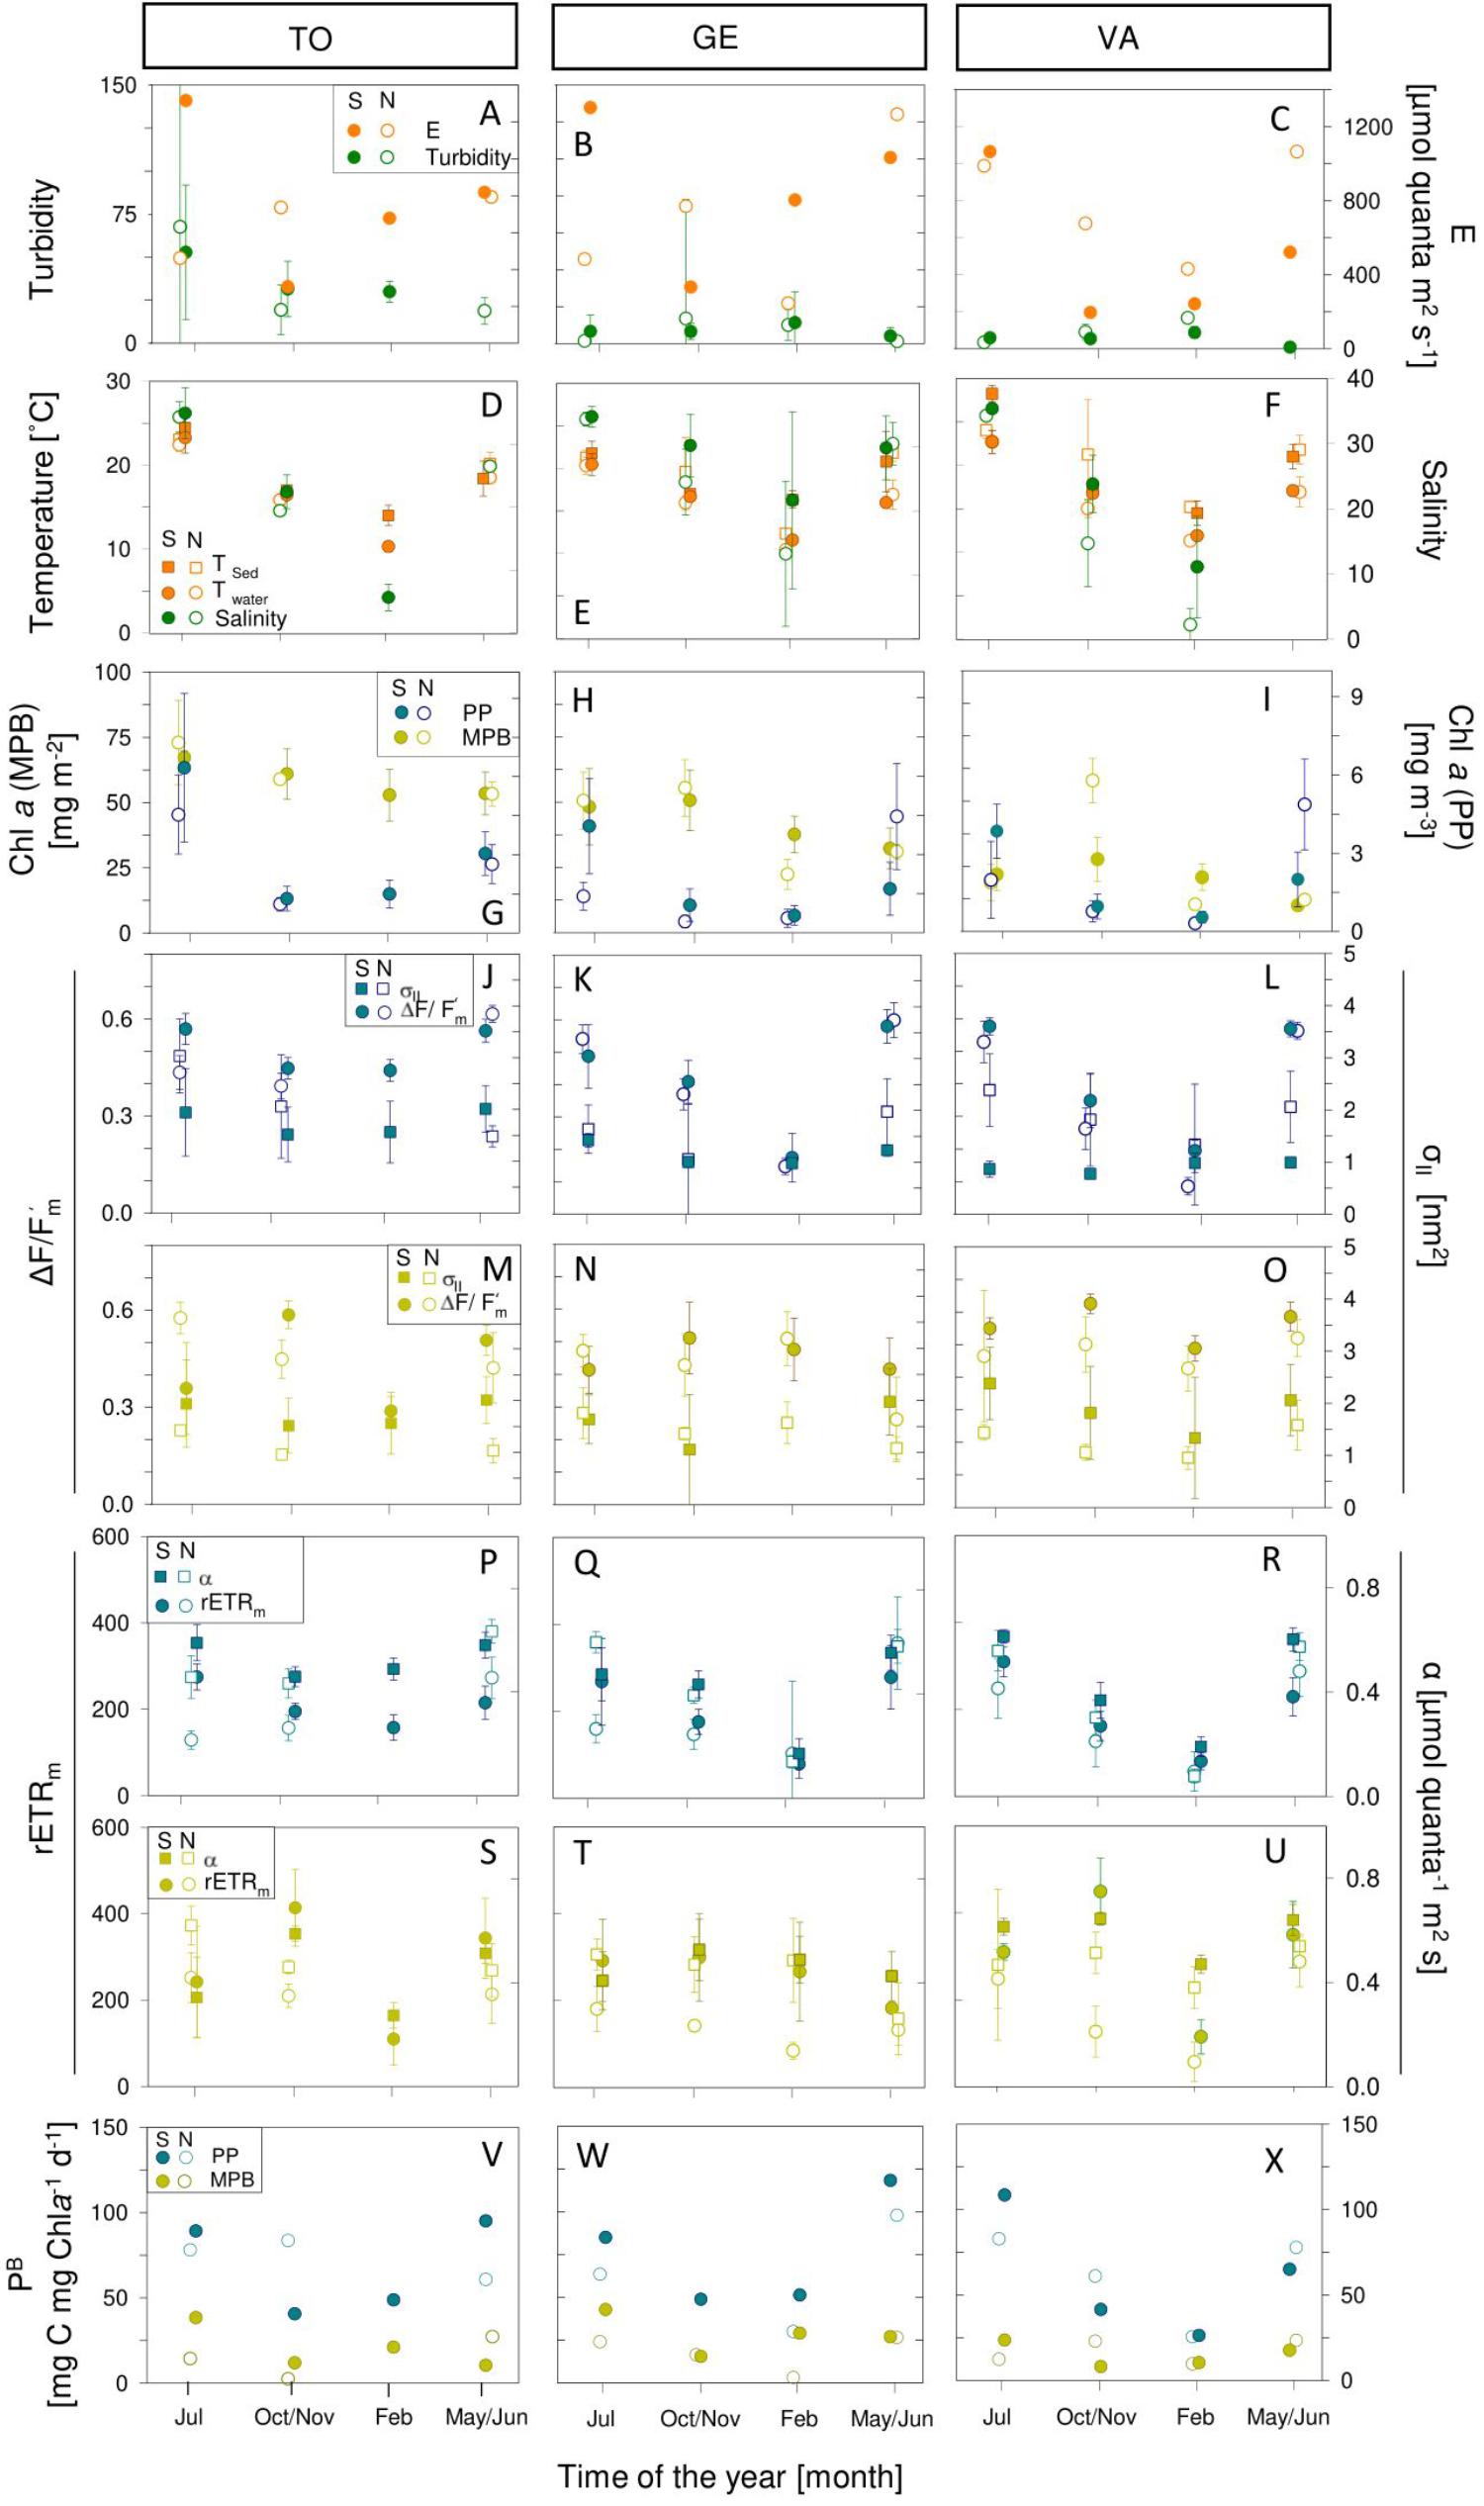
Figure 6. Seasonal variation of abiotic (A–F) and photophysiological (G–X) parameters in sampling sites Torreira (TO; A,D,G,J,M,P,S,V), Gafanha da Encarnação (GE; B,E,H,K,N,Q,T,W) and Vista Alegre (VA; C,F,I,L,O,R,U,X) during spring (full circles) and neap tide (empty circles), for phytoplankton (blue) and microphytobenthos (yellow). Mean values of three replicates. Error bars represent one standard error. PP, phytoplankton; MPB, microphytobenthos.
Water and sediment temperature showed a clear seasonal variation in all sampling sites, with maximum average values occurring in July (23.3 ± 1.83°C for water in TO, and 28.3 ± 0.96°C in sediments at VA) and minimum values (10.3 ± 0.63°C, for water at TO and 12.3 ± 0.58°C for sediments in GE) being observed in February. A virtually identical seasonal pattern was found for all sampling sites (Figures 6D–F). The seasonal variation in water temperature was closely followed by equally large changes in water salinity, at all sampling sites. Highest average salinities were observed in July (35.0 ± 0.52), and the minimum values in February (2.0 ± 2.47), directly resulting from the seasonal variation in freshwater input (Figures 6D–F). Minimum salinity values, close to zero, were recorded in winter at site VA, the sampling site locate farthest from the mouth of the estuary (Figure 6F).
Both the biomass of phytoplankton and microphytobenthos (as expressed per unit area) varied significantly with seasons (ANOVA, F3,817 = 319.54; P < 0.001; and F3,317 = 13.54; P < 0.001, respectively; Figures 5G–I). However, the two communities differed regarding the timing when the maximum biomass was reached, its variation with spring-neap tidal cycle, and its spatial distribution. In the case of the phytoplankton, maximum average values were observed in spring and summer, and the lowest in winter (Figures 6G–I). In contrast, microphytobenthos biomass reached maximum values later in the year, in summer and autumn. On average, the biomass of phytoplankton was significantly higher in spring than in neap tides (ANOVA, F1,817 = 25.14; P < 0.001), although an exception to this general pattern was observed in May/June (Figure 6I). For the microphytobenthos, the differences between spring and neap tides were overall not significant (ANOVA, F1,317 = 1.47; P = 0.226), despite some marked differences at particular moments (February and October/November, Figures 6H,I). Both phytoplankton and microphytobenthos biomass varied significantly between sampling sites (ANOVA, F2,817 = 25.14; P < 0.001, and F2,317 = 45.07; P < 0.001, respectively), and in both cases the highest values were measured at site TO. In the case of phytoplankton, the remaining two sites did not differ significantly (Tukey HSD, P > 0.05). Regarding the microphytobenthos, all sampling sites differed from each other (Tukey HSD, P < 0.001 for all pairwise comparisons), the lowest biomass values being found for site VA (Figures 6G–I).
Phytoplankton and microphytobenthos also differed regarding the spatio-temporal variability of photophysiological parameters ΔF/Fm’ and σII. In the case of the phytoplankton, both ΔF/Fm’ and σII varied significantly with seasons (ANOVA, F3,820 = 230.74; P < 0.001 and F3,705 = 43.63; P < 0.001, respectively; Figures 6J–O), the maximum values being measured in summer and the minimum in winter (Figures 6K,L). In the case of microphytobenthos ΔF/Fm’ and σII also varied significantly with seasons (F3,335 = 48.02; P < 0.001 and F3,335 = 27.44; P < 0.001, respectively). However, maximum values were observed during autumn (ΔF/Fm’) or summer (σII), while minimum values were measured in spring, for both parameters (Figures 6M–O). In the case of the phytoplankton, ΔF/Fm’ varied significantly between spring and neap tides (higher values during spring tides) (ANOVA, F1,820 = 67.01; P < 0.001), while σII did not show significant differences (ANOVA, F1,705 = 1.78; P > 0.1). The opposite pattern was observed for microphytobenthos, with σII varying between spring and neap tides (ANOVA, F1,335 = 10.65; P < 0.01), and ΔF/Fm’ increasing significantly from neap to spring tides (ANOVA, F1,335 = 15.414; P < 0.001). In terms of spatial variation, phytoplankton showed a significant variation in ΔF/Fm’ between sampling sites (ANOVA, F2,820 = 28.04; P < 0.001), with maximum values occurring at TO and minimum ones at VA, while no differences among sites were found regarding σII (ANOVA, F2,705 = 2.29; P > 0.1). In the case of the microphytobenthos, ΔF/Fm’ also varied significantly between sampling sites (ANOVA, F2,335 = 6.61; P < 0.01), with maximum values being observed for site VA and minimum for site GE. σII varied significantly between sites (ANOVA, F2,335 = 22.46; P < 0.001), but showed the opposite pattern, with maximum values occurring at site GE and minimum ones at VA (Figures 6M–O). Still regarding the parameters ΔF/Fm’ and σII, phytoplankton and microphytobenthos differed not only concerning their spatio-temporal variability, but also in terms of their absolute values. While ΔF/Fm’ showed comparable values for the two groups (0.43 ± 0.16 and 0.47 ± 0.09, respectively; ANOVA, F1,44 = 1.13; P > 0.1), σII was significantly higher in the case of the phytoplankton (1.80 ± 1.19 and 1.19 ± 0.03 for phytoplankton and microphytobenthos, respectively; ANOVA, F1,44 = 25.25, P < 0.001).
Regarding the photoacclimation state, phytoplankton samples showed a significant seasonal variability in both light-limited (α) and light-saturated (rETRm) photosynthetic activity (ANOVA, F3,751 = 456.82; P < 0.001 and F3,749 = 307.2; P < 0.001, respectively), with maximum and minimum values occurring in spring and in winter, respectively (Figures 6P–R). The two parameters were also significantly higher during spring than during neap tides (ANOVA, F1,751 = 71.44; P < 0.001 and F1,749 = 74.80; P < 0.001, respectively). Spatially, differences were found only regarding α (ANOVA, F2,751 = 41.37; P < 0.001), with maximum values being reached at site TO and minimum ones at site VA (Figures 6P,R). Regarding the microphytobenthos, also both α and rETRm varied significantly among seasons (ANOVA, F3,335 = 7.661; P < 0.001 and F3,334 = 46.44; P < 0.001, respectively), but maximum values were reached in autumn and minimum ones in winter (Figures 6S–U). As observed for the phytoplankton, both parameters showed significantly higher values during spring tides than during neap tides (ANOVA, F1,335 = 5.44; P < 0.05 and F1,334 = 81.94; P < 0.001, for α and rETRm respectively). Both α and rETRm varied significantly between sampling sites (ANOVA, F2,335 = 8.654; P < 0.001 and F2,334 = 3.45; P < 0.05, respectively), in both cases reaching higher values at site VA and minimum values at site GE (Figures 6T,U).
This large spatio-temporal variability in α and rETRm was reflected in substantial variations in the photoacclimation parameter Ek (data not shown). For both communities, Ek varied significantly over seasons (ANOVA, F3,754 = 4.3; P < 0.01 and F3,334 = 39.91; P < 0.001, respectively), reaching maximum values in spring and autumn (phytoplankton) or in spring (microphytobenthos). For both types of samples, Ek was significantly higher during spring than during neap tides (ANOVA, F1,754 = 4.6; P < 0.05 and F1,334 = 79.10; P < 0.001, for phytoplankton and microphytobenthos, respectively). For the phytoplankton, Ek varied significantly between sampling sites (ANOVA, F2,754 = 11.6; P < 0.001), the highest values occurring at site VA and the minimum at site TO. In contrast, no significant differences were found between sampling sites for microphytobenthos (F1,334 = 0.77; P = 0.466). Overall, the photoacclimation state of phytoplankton and microphytobenthos appeared to be very similar, with Ek values averaging 490.8 ± 211.7 and 491.5 ± 175.7 μmol quanta m–2 s–1, respectively. However, with the exception of the winter sampling period, Ek was higher for microphytobenthos (ranging from 490.7 ± 197.5 in summer to 561.9 ± 124.9 μmol quanta m–2 s–1 in spring), than for phytoplankton (ranging from 408.5 ± 28.5 in summer to 473.6 ± 107.7 μmol quanta m–2 s–1 in spring).
Biomass-Specific Productivity
Despite the differences observed in the physical conditions between the water column and intertidal sediments, and between the photophysiological and photoacclimation state of phytoplankton and microphytobenthos, the spatio-temporal patterns of variability of daily biomass-specific rates, PB, of the two communities was relatively similar (Figures 6V–X). For both communities, the daily rates of carbon fixation varied significantly with season (ANOVA, F3,719 = 58.56; P < 0.001 and F3,315 = 17.40; P < 0.001, respectively) and phase of the spring-neap tidal cycle (ANOVA, F1,719 = 4.83; P < 0.05 and F1,315 = 5.19; P < 0.05, respectively). Maximum values were obtained for summer and spring, during spring tides, and minimum values for winter and neap tides. No significant differences were found between sampling sites. However, the absolute values of PB were on average higher for the phytoplankton than for the microphytobenthos, averaging 68.0 ± 26.1 and 19.1 ± 10.3 mg C mg Chla–1 d–1, respectively.
Light Attenuation Coefficients
The vertical light profiles measured in sediment samples from the three sampling sites revealed an exponential attenuation of downwelling irradiance, enabling a very good fit of an exponential model (Figure 7). The attenuation coefficient ks ranged from 3.9 ± 0.8 mm–1 (TO) to 9.0 ± 0.8 mm–1 (VA), GE reaching the intermediate value of 6.1 ± 0.6 mm–1.
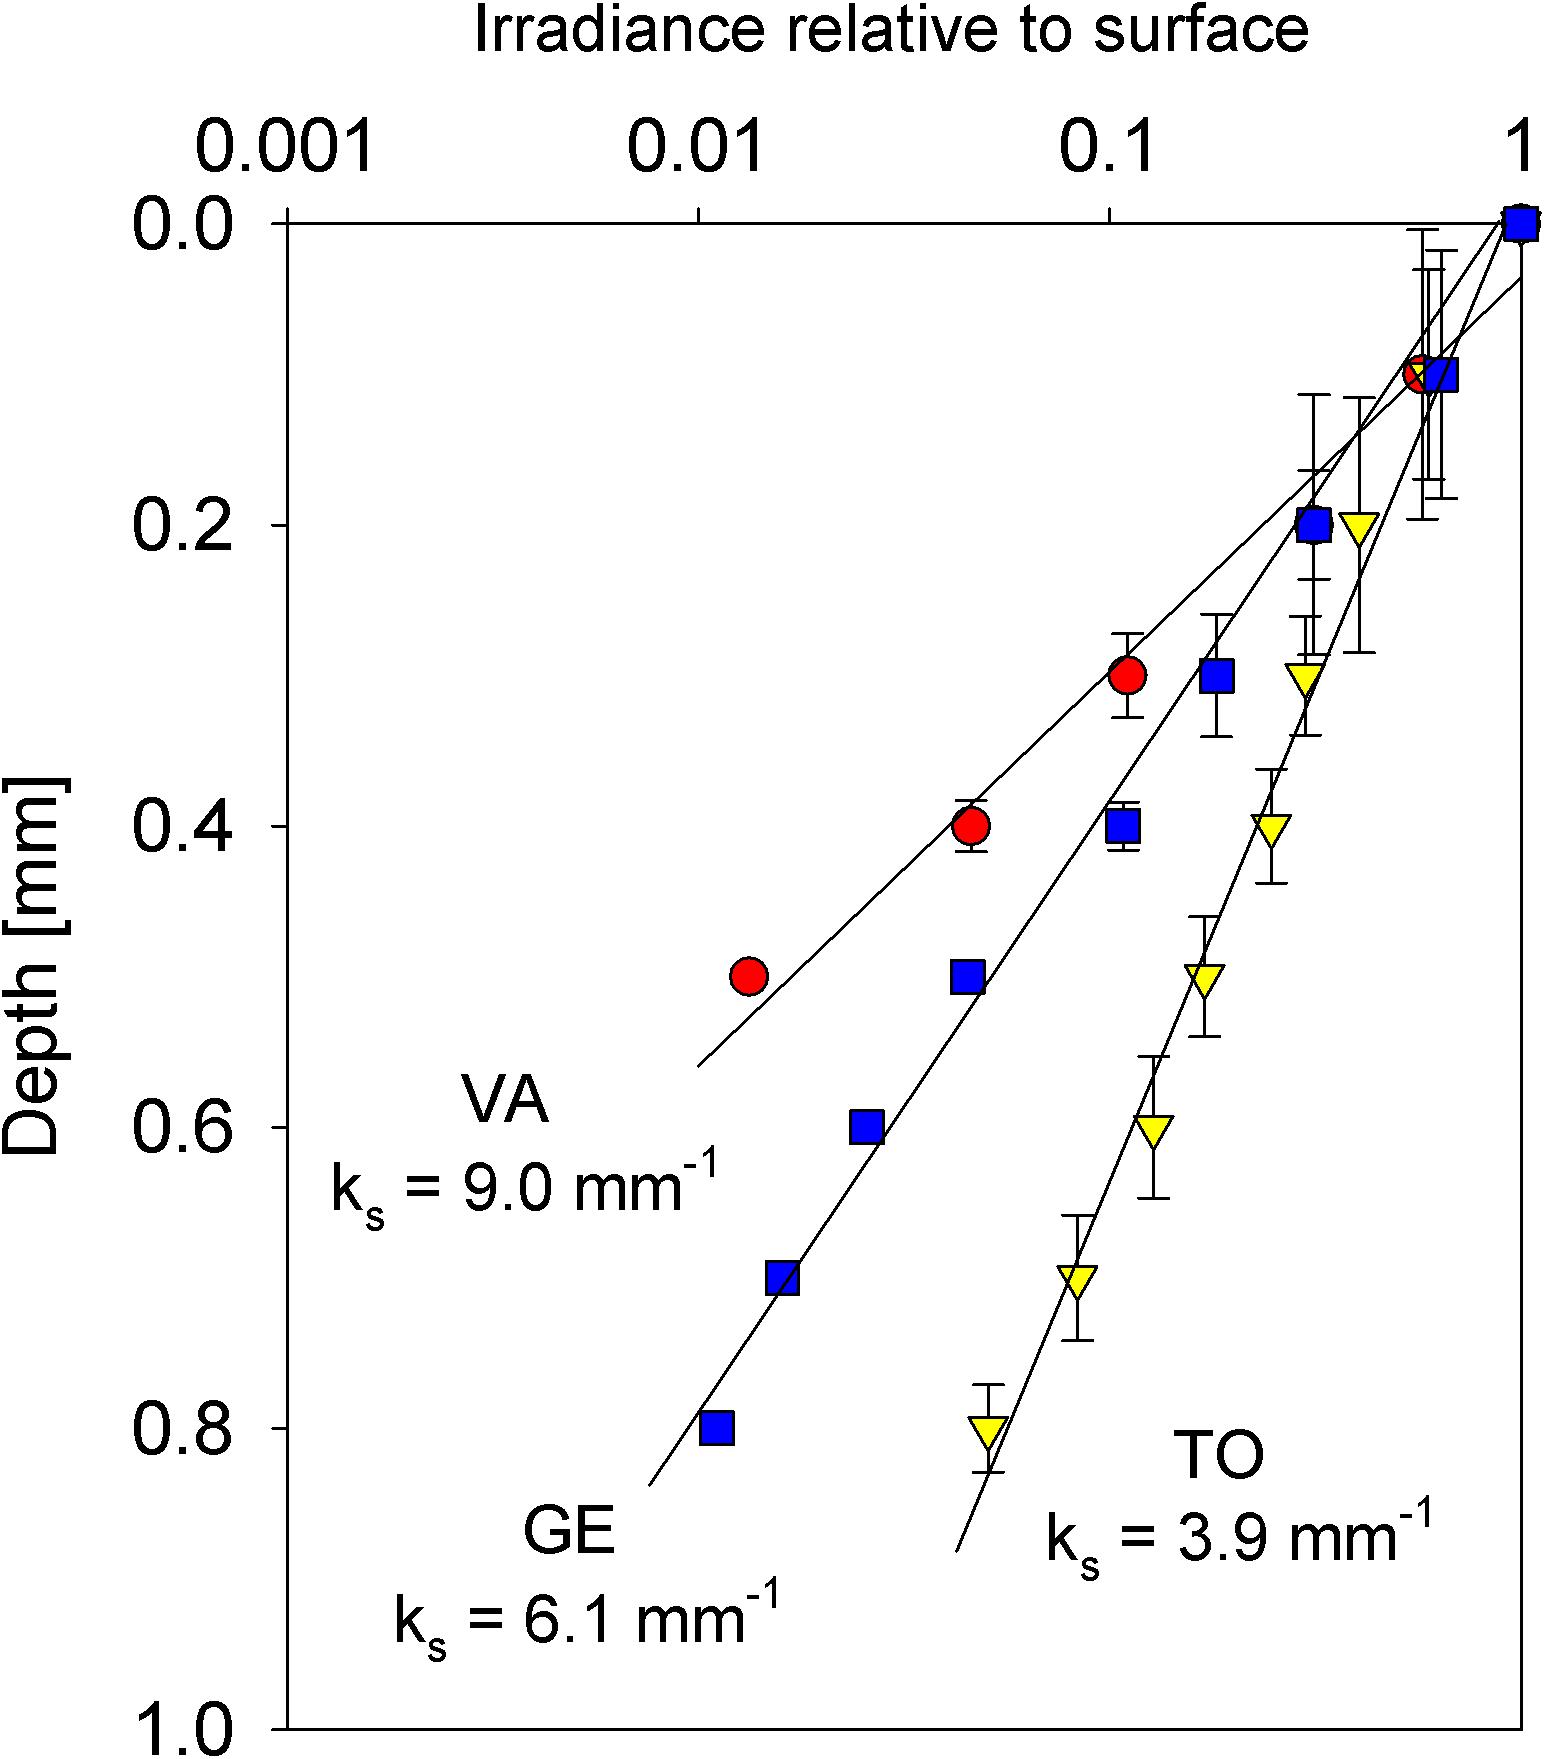
Figure 7. Vertical profile of spectrally averaged irradiance (percentage of incident irradiance) in intertidal sediments of the three sampling sites Vista Alegre (VA), Gafanha da Encarnação (GE) and Torreira (TO). Numbers are the downwelling light attenuation coefficients (ks) for each type of sediment. Mean values of three replicates. Error bars represent one standard error.
Areal Production Rates
Despite the fact that the rates of biomass-specific production were higher for phytoplankton (Figure 6), the depth-integrated areal rates of microphytobenthos were often much higher, due to the higher biomass involved in photosynthetic activity (Figures 8A–D). The difference between the two groups was particularly large when the periods of low tide occurred at the middle of the day (e.g., Figures 8B–D). The higher productivity of microphytobenthos was also found when comparing daily rates, despite the shorter periods of light exposure considered for their calculation (264.5 ± 228.8 and 140.4 ± 154.8 mg C m–2 d–1, respectively; Figures 9A–C). Maximum daily rates of carbon fixation ranged from 8.1 (winter, neap tides, GE) to 505.0 (summer, spring tides, TO) mg C m–2 d–1 for the phytoplankton, and from 25.6 (winter, spring tides, GE) to 909.0 (summer, spring tides, TO) mg C m–2 d–1, for the microphytobenthos.
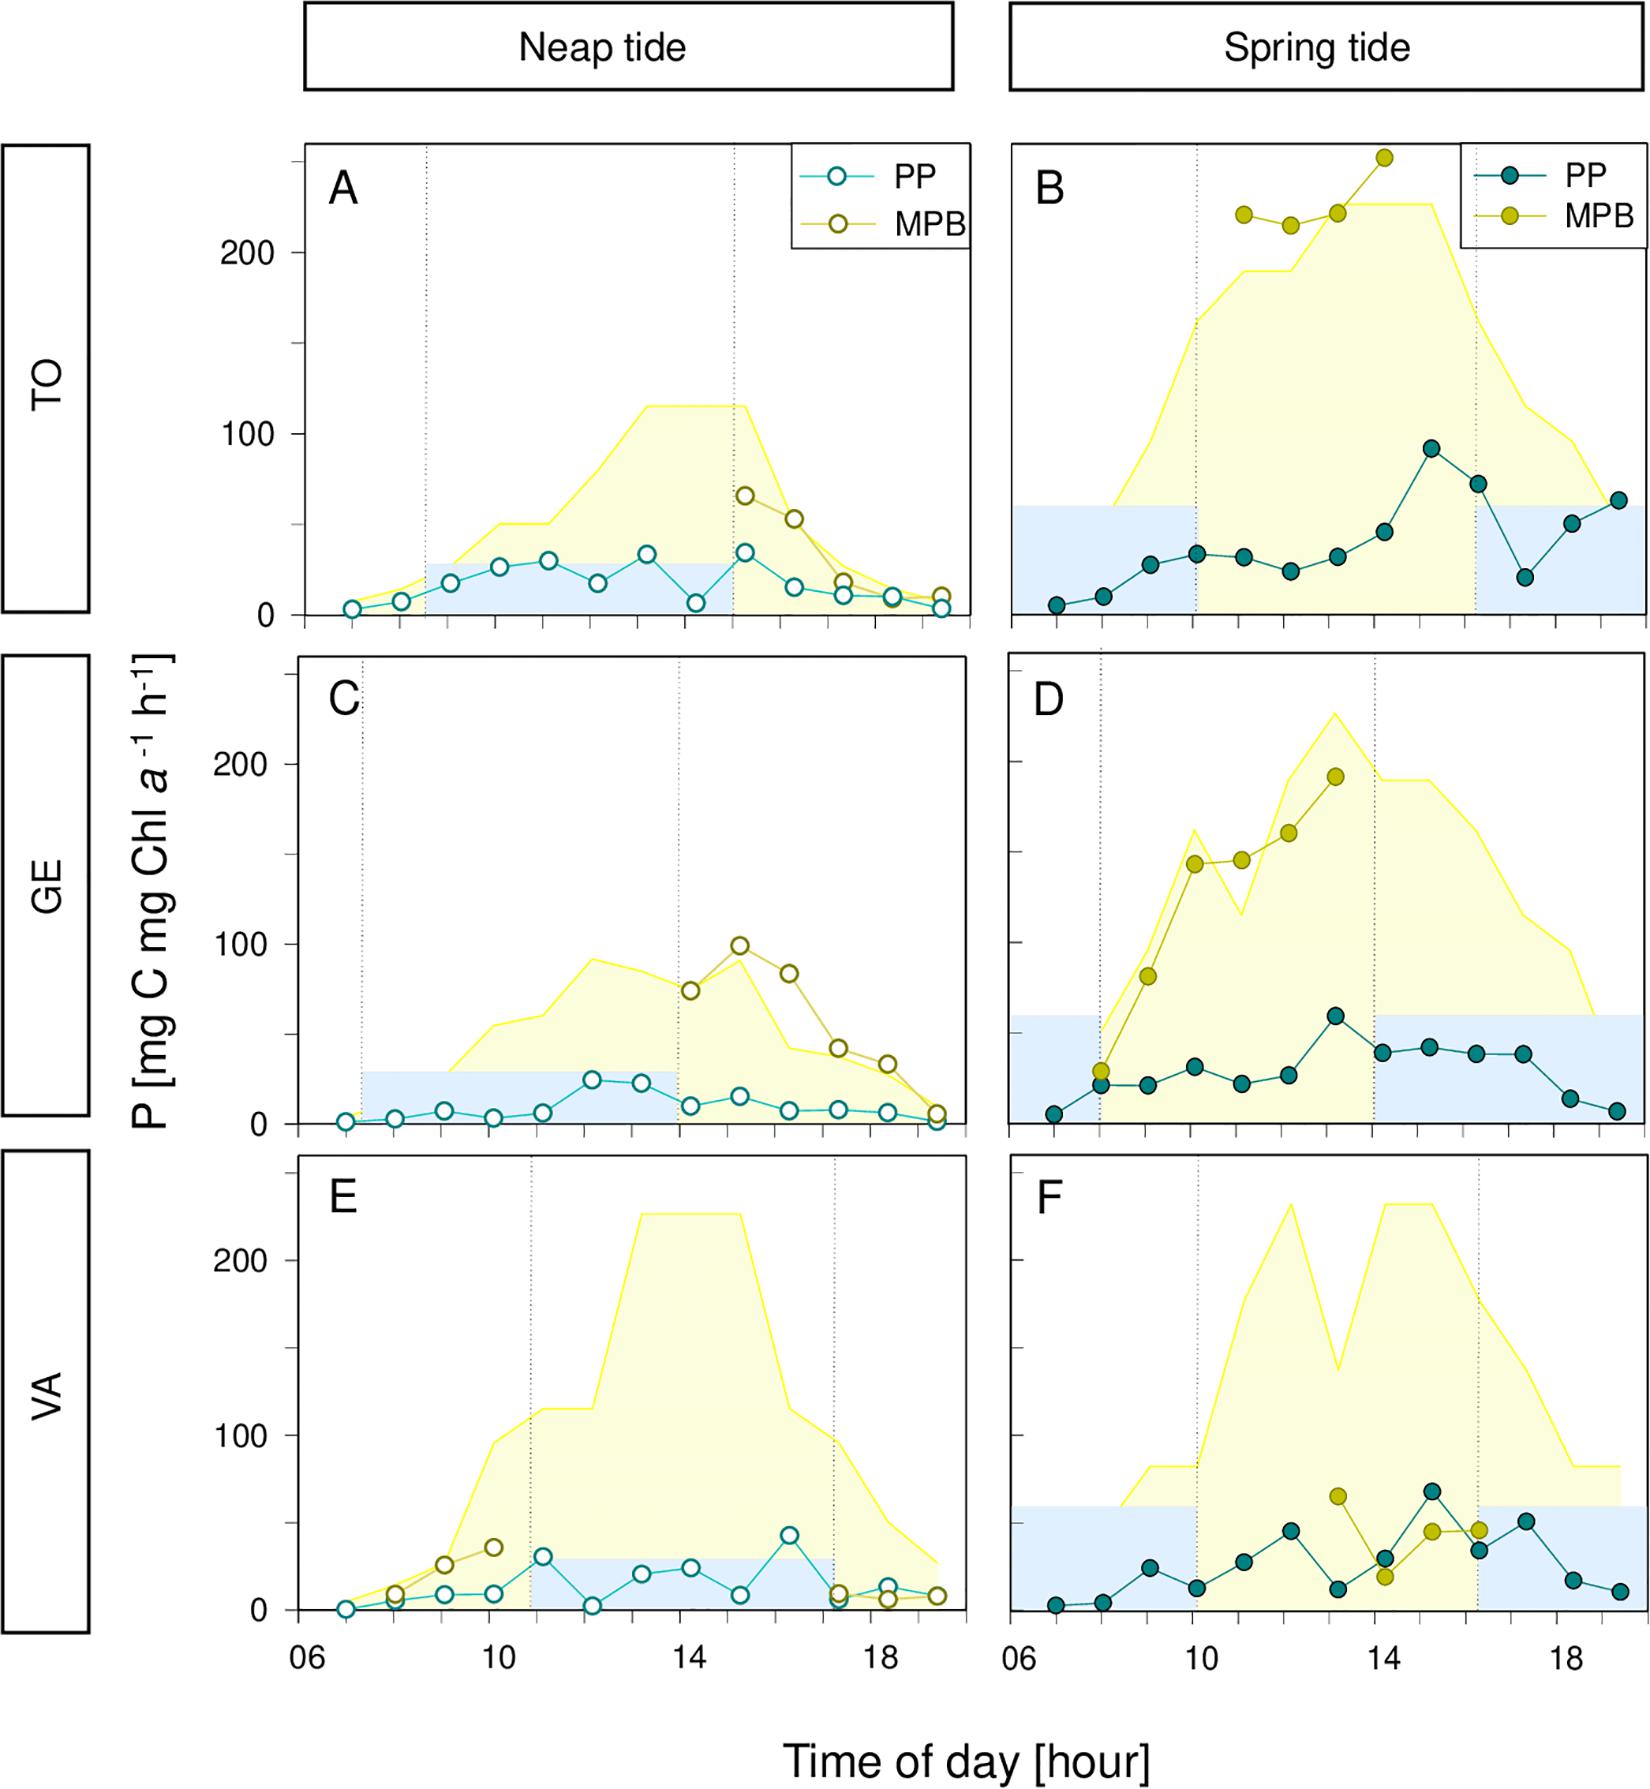
Figure 8. Hourly rates of biomass-specific primary production of phytoplankton (PP) and microphytobenthos (MPB) along two days in July 2013, on tides (A,C,E) and spring tides (B,D,F), at the three sampling sites, Torreira (TO; A,B), Gafanha da Encarnação (GE; C,D) and Vista Alegre (VA; E,F). Areas in the background represent corresponding solar irradiance. Blue areas represent high tide; vertical bars demonstrate the beginning and end of the high tide.
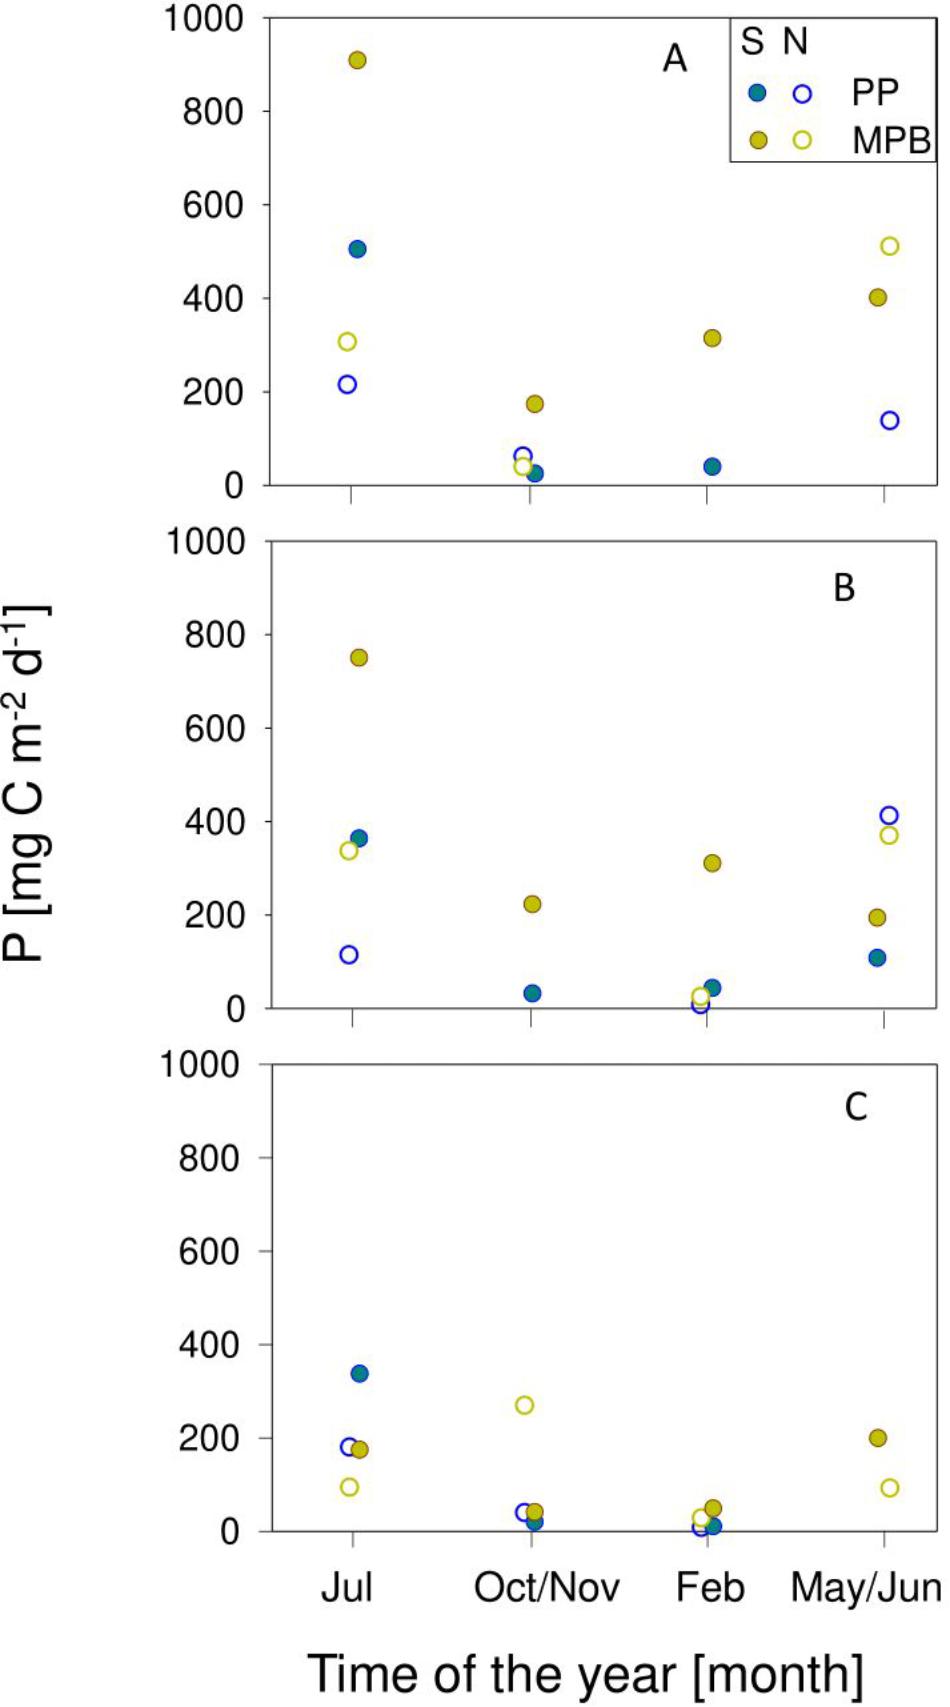
Figure 9. Seasonal variation of daily rates of primary production of phytoplankton (PP) and microphytobenthos (MPB) during spring (S) and neap (N) tides in sampling sites Torreira (A), Gafanha da Encarnação (B), and Vista Alegre (C).
The marked seasonal and fortnight variability of the biomass and the photosynthetic performance was reflected on a significant variation in daily rates of areal production between seasons and spring-neap tide conditions (Figures 8, 9), of both phytoplankton (F3,309 = 75.26; P < 0.001 and F1,309 = 11.19; P < 0.001, comparing between seasons and spring-neap tides, respectively) and microphytobenthos (F3,309 = 75.26; P < 0.001 and F1,309 = 11.19; P < 0.001; comparing between seasons and spring-neap tides, respectively). In both cases, maximum values were attained in spring and summer, and during spring tides, and minimum values occurred on winter, during neap tides. Significant differences were also present regarding the spatial distribution. For the phytoplankton, large variations were found (F2,309 = 7.66; P < 0.001), showing maximum daily production for site TO and lower but comparable rates for sites GE an VA. For the microphytobenthos, significant variations between sampling sites were also observed (F2,309 = 12.31; P < 0.001), but maximum values were observed for site TO and minimum for site VA.
Upscaling to Ecosystem-Level Productivity
The data used to upscale the areal primary production rates to ecosystem-level values are summarized in Table 2. Per unit area, microphytobenthos productivity was the highest, with exception of the site VA, for which the values of the two groups were similar. Phytoplankton rates averaged 49.9 g C m–2 yr–1, ranging from 44.7 to 51.8 g C m–2 yr–1, for sites VA and GE, respectively. Microphytobenthos productivity rates averaged 105.2 g C m–2 yr–1, ranging between 43.4 to 164.4 g C m–2 yr–1, for sites VA and TO, respectively. This tendency was reinforced when upscaling to the whole estuary, despite the larger area accounted for the phytoplankton, and the primary production carried out by the microphytobenthos and by the phytoplankton were found to attain, respectively, 7534.0 and 4894.3 and t C yr–1, representing 60.6 and 39.4% of the global primary production of the two communities in the Ria de Aveiro, that reached 12428.3 t C yr–1.
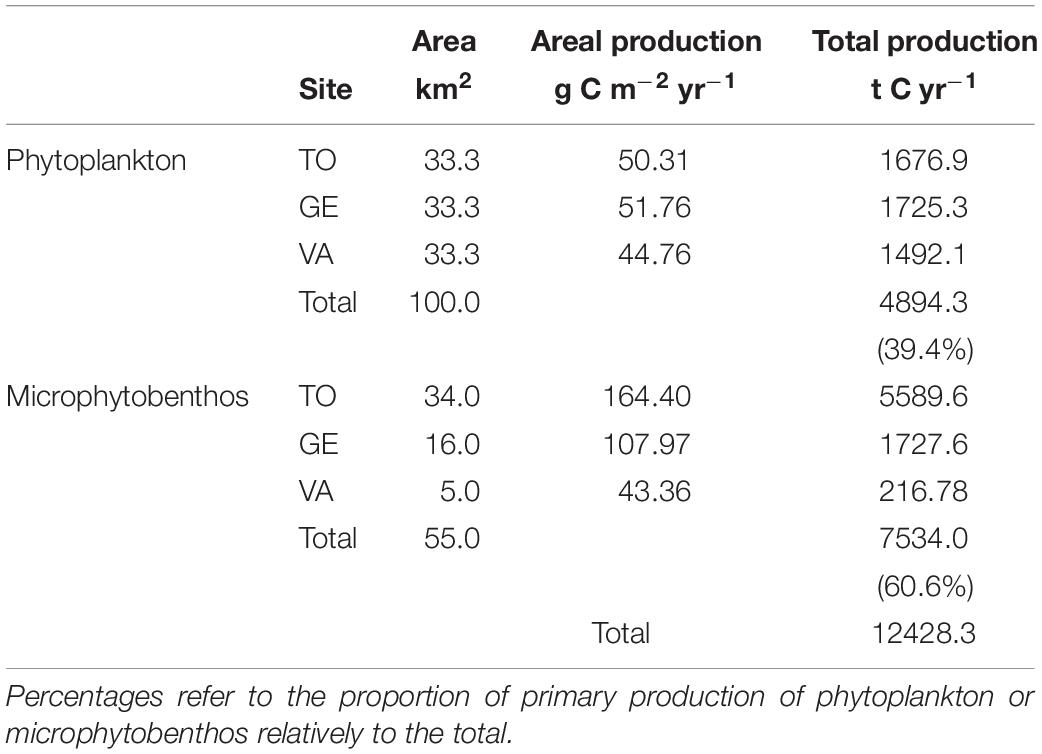
Table 2. Summary of the data used for the upscaling of local areal primary production rates (g C m–2 yr–1) to ecosystem-level carbon fixation budget (t C yr–1).
Discussion
Abiotic Factors
The sampling program carried out in this study allowed to cover a large variability in hourly, fortnight and seasonal time scales in all physical parameters measured for the three studied sampling sites. Seasonal variability was pronounced for both the water column and the intertidal sediments, namely regarding temperature, salinity and turbidity. In both habitats, a strong fortnight variability was superimposed on the seasonal cycle. In the intertidal habitat, stronger and faster changes were observed during tidal ebb and flood, associated to sudden changes between immersion and exposure to sunlight and wind. In the case of the intertidal communities, it is known that the experienced environmental variability is likely characterized by a wider range of conditions than those registered only during the low tide periods, mainly due to the contrast between the conditions during submersion under high tide (not monitored in this study) and air and light exposure during low tide (de Jonge and Van Beusekom, 1995; Koh et al., 2007; Pratt et al., 2014). These patterns of temporal variability were essentially the same in all sampling sites, despite the different time delay of the tidal propagation within the estuary. The observed patterns of spatial and temporal environmental variability are typical of tidal estuaries, strongly dominated by the tidal rhythm (Serôdio and Catarino, 1999; Brito et al., 2009; Kwon et al., 2012). In the sampling sites of the Ria de Aveiro, low tide tends to occur at mid-day during spring tides, and early in the morning and in late afternoon during neap tides. This causes a strong fortnight pattern of variability in physical conditions, particularly in the intertidal areas (Serôdio et al., 2008). The solar irradiance received varied between maximum values during spring tides to minimum values during neap tides, when direct exposure to light was restricted to two short periods, one during early morning and one during late afternoon. The strong periodicity of physical parameters propagated into a large variability in phytoplankton and microphytobenthos biomass and photosynthetic activity, ultimately determining their spatial-temporal patterns of productivity.
Biomass
The synoptic sampling of the water column and intertidal sediments with a high temporal resolution allowed a detailed comparison of the spatio-temporal variability of phytoplankton and microphytobenthos regarding biomass, photophysiology, photosynthetic performance, and productivity. In what regards biomass, the direct comparison of absolute values for microphytobenthos and phytoplankton is usually compromised by well-known difficulties, related to the determination of biomass values using directly comparable units. Ecologically relevant estimates, expressed as unit area (e.g., mg Chl a m–2) are very dependent on the criteria used for the vertical integration of volumetric measurements (Flemming, 2000; Serôdio et al., 2001; Laviale et al., 2015). While these difficulties were not completely resolver in this study, the concurrent sampling of planktonic and benthic biomass allowed comparing the overall patterns of spatial and temporal variability.
The spatio-temporal variation of phytoplankton and microphytobenthos biomass coincided in several aspects, namely a large variation over seasons, spring-neap tidal cycles, and a large variation over sampling sites, with TO showing the highest values. This overall tendency for the two communities to co-vary spatio-temporally, especially regarding the seasonal time scale, is likely tied to their common control by major abiotic factors, like irradiance and temperature, which varied markedly over seasons (de Jonge et al., 2012; Liu et al., 2018; Haro et al., 2019). Both phytoplankton and microphytobenthos biomass varied seasonally, but maximum values were observed later for the microphytobenthos (summer–autumn) than for the phytoplankton (spring, summer). The earlier peaking of phytoplankton biomass may be due to the more pronounced seasonal variation in favorable conditions for growth in the water column than in the sediment. The high nutrient availability in the water column commonly observed at the end of winter in estuaries and coastal areas (Vidal et al., 2017; Vajravelu et al., 2018), together with the start of favorable light and temperature conditions in spring, may have caused the phytoplankton to respond more promptly in terms of growth and accumulation of biomass. The sharp decrease observed in autumn, also typically observed for estuaries (Pennock and Sharp, 1986; Tian et al., 2009; Vidal et al., 2017), is likely associated to nutrient depletion caused by intense uptake during spring and summer. On the other hand, seasonal changes in growth conditions for the microphytobenthos might not be as relevant as for the water column, especially regarding nutrient availability, commonly considered not limiting in this habitat all year round (Davis and McIntire, 1983; Brotas et al., 1995). This, together with the continuation of favorable light and temperature conditions until autumn months, may explain the prolonging of high biomass levels into later in the year. The seasonal variation of microphytobenthos biomass, namely the lower values observed in Spring may thus be related to other factors, namely the increase in feeding activity by grazers (Vieira et al., 2012).
The occurrence of a significant fortnight variability in phytoplankton biomass, with maxima during spring tides, may be associated to the fact that during these periods the shallower water column of low tide coincides with the maximum solar irradiance, allowing a more efficient illumination of the phytoplankton populations (Pennock and Sharp, 1986; Mallin and Pearl, 1992; Madariaga, 2002). Also, the higher water currents during spring tides are associated to increased resuspension rates of sediment and benthic cells, which may have contributed to the higher chlorophyll a content and nutrients in the water column (Delgado et al., 1991; de Jonge and Van Beusekom, 1995; Ubertini et al., 2012; Pratt et al., 2014). For microphytobenthos, a tendency for higher biomass values during spring tides was also observed, that can be associated to the fact that the periods of low tide and light exposure occurring during the middle of the day favor daily photosynthetic rates and growth. However, the observed variation in the accumulation of biomass was not statistically significant, either because the fortnight variability in growth conditions was not sufficiently marked, or because of the confounding effects of varying favorable weather conditions during the periods before each sampling days.
Spatially, the coincidence of higher amounts of both planktonic and benthic biomass at the GE sampling site may be related to higher rates of resuspension-deposition associated to stronger tidal currents, that would cause a larger transfer of microalgal biomass from the benthos to the water column (Delgado et al., 1991; de Jonge and Van Beusekom, 1995; Brito et al., 2009). The reasons for the higher abundance of benthic biomass at this site are uncertain, but maybe related to higher nutrient availability, caused by the combination of finer sediment granulometry, favoring organic matter remineralization, and of possible agricultural run-off, originated in the farm fields bordering the canal of the estuary where the sampling site is located (Sousa et al., 2017; Bueno-Pardo et al., 2018; Vaz et al., 2019).
Photophysiology and Photoacclimation State
The photophysiological parameters ΔF/Fm’ and σII were, on short times scales, mostly controlled by changes in incident irradiance, showing large and rapid (minutes to hours) variations during daytime periods, as observed in other studies (Serôdio et al., 2008; Houliez et al., 2013; Schreiber and Klughammer, 2013). However, both ΔF/Fm’ and σII, of phytoplankton and microphytobenthos, showed also consistent patterns of variation on longer time scales, denoting changes in the photophysiological and photoacclimation state. ΔF/Fm’ largely followed the trends observed for the biomass of in the two groups, regarding seasonality (peaking in summer and in autumn, respectively), and the variation along the spring-neap tidal cycle (higher during spring tides in the case of the phytoplankton; not varying significantly in the case of the microphytobenthos) and spatial distribution (higher values at site TO, both communities). The similarity between the spatio-temporal variation of ΔF/Fm’ and biomass suggests that the accumulation of biomass may be directly related with conditions enabling a better photosynthetic performance. The higher ΔF/Fm’ values for the phytoplankton observed during spring tides may be associated to the increased availability of nutrients caused by the higher resuspension rates typical of the faster tidal currents occurring during spring tides, but also more favorable conditions in terms of temperature or photoperiod. The lack of significant variations in ΔF/Fm’ in microphytobenthos samples may result from the fact that, in the sedimentary environment, photosynthesis is more limited by light conditions than nutrient availability, which may support a good photophysiological condition along the spring-neap tidal cycle.
Regarding σII, there was a general tendency to follow the patterns of spatial and temporal variation of ΔF/Fm’ and biomass, namely concerning seasonal and fortnight time scales for phytoplankton. In other cases, ΔF/Fm’ and σII diverged from each other, indicating the independent short-term regulation of the processes controlling the two parameters. A marked difference between the photophysiology of the phytoplankton and the microphytobenthos was revealed by the consistently higher values of σII measured for the phytoplankton. Higher values of σII are indicative of larger PSII antenna sizes, capable of higher light absorption efficiency, beneficial in low light environments and typical of low-light acclimated organisms (Ragni et al., 2008; Schreiber et al., 2012; Ware et al., 2015). Such high σII values may be advantageous for the planktonic microalgae inhibiting the highly turbid waters of the Ria de Aveiro estuary, where the experienced light regime calls for the optimization of light absorption. The lower σII values measured in the microphytobenthos samples are, on the other hand, symptomatic of a smaller PSII antenna, consistent with a high light environment, as the one at the sediment surface when directly exposed to sunlight during low tide. Smaller antennae sizes are also consistent with high light-acclimation, as allow a reduction in potential photodamage of PSII and photoinhibition of photosynthesis (Gordillo et al., 2001).
The results on photoacclimation state obtained from RLCs repeat, in general terms, the overall patterns of spatio-temporal variability in biomass, ΔF/Fm’ and, to a lesser extent, σII: α and rETRm reaching maximum values during summer (phytoplankton) and autumn (microphytobenthos), during spring tides (both communities), and at sampling site TO (phytoplankton). The marked seasonal photoacclimation in photophysiological parameters ΔF/Fm’ and σII described above was confirmed by comparable large changes in the photoacclimation parameter Ek, for both phytoplankton and microphytobenthos. The highest Ek values observed during summer and the lowest values observed during winter denote a variation from a high light-acclimation state to a low light-acclimation following the change in light conditions between the two contrasting seasons. Although not as clear as for σII, the differences observed between Ek measured in phytoplankton and in microphytobenthos samples, showing a tendency for higher values in the later, supports that the benthic communities appear as high-light acclimated, when compared to their planktonic counterparts.
The photoacclimation state of microphytobenthos appeared to vary fortnightly, as higher values of ΔF/Fm’ α and rETRm were measured during spring tides when compared to neap tides. This is most likely a consequence of the higher light dose received during spring tides rather than an effect of tidal height (Haro et al., 2019). The high light acclimation state of estuarine intertidal microphytobenthos has been referred before, supported by relatively high values of Ek (Serôdio et al., 2005; Frankenbach et al., 2018). It has been explained by the exposure to high solar irradiance levels during low tide periods, and, especially in the case of assemblages dominated by motile diatoms (epipelic), by the use of vertical migration as a form of control of light exposure within the photic zone of the sediment (Serôdio et al., 2001; Consalvey et al., 2004; Ezequiel et al., 2015; Haro et al., 2019). Curiously, microphytobenthos samples did not show a significant variation in the photoacclimation state between sites, as opposed to what was previously reported for the sites VA and GE (Frankenbach et al., 2018). This discrepancy may be explained by the fact that the mention study analyzed samples collected during a short period of three consecutive days (thus not covering different stages along the spring-neap tidal cycle), and that the photophysiological measurements were carried out in the laboratory, remove from the high variability in situ environment.
Biomass-Specific, Areal and Ecosystem-Level Productivity
In this study, the daily biomass-specific rates of productivity, PB, were derived from the photophysiological parameters related to light usage efficiency (ΔF/Fm’ and σII) integrated over daylight hours. As such, the patterns of spatio-temporal variation of PB largely followed the ones observed for those parameters. Probably due to the larger values of σII measured in the water column, the production rates of the phytoplankton resulted substantially higher than those of the microphytobenthos, for all sampling occasions and sites. The incorporation of photosynthetic biomass and the vertical light attenuation in the water and the sediment in the calculation of daily areal productivity rates did not alter the overall patterns of spatio-temporal distribution. However, it resulted in the inversion of the relative importance of phytoplankton and microphytobenthos. As expressed by units of area, benthic carbon fixation rates were on average 1.9 times higher than those in the water column. Despite the fact that the productivity rates determined in this study were based on chlorophyll fluorescence measurements, they fitted well within the range published values, based on the direct quantification of carbon fixation or oxygen evolution, for both estuarine phytoplankton and microphytobenthos (Table 3).
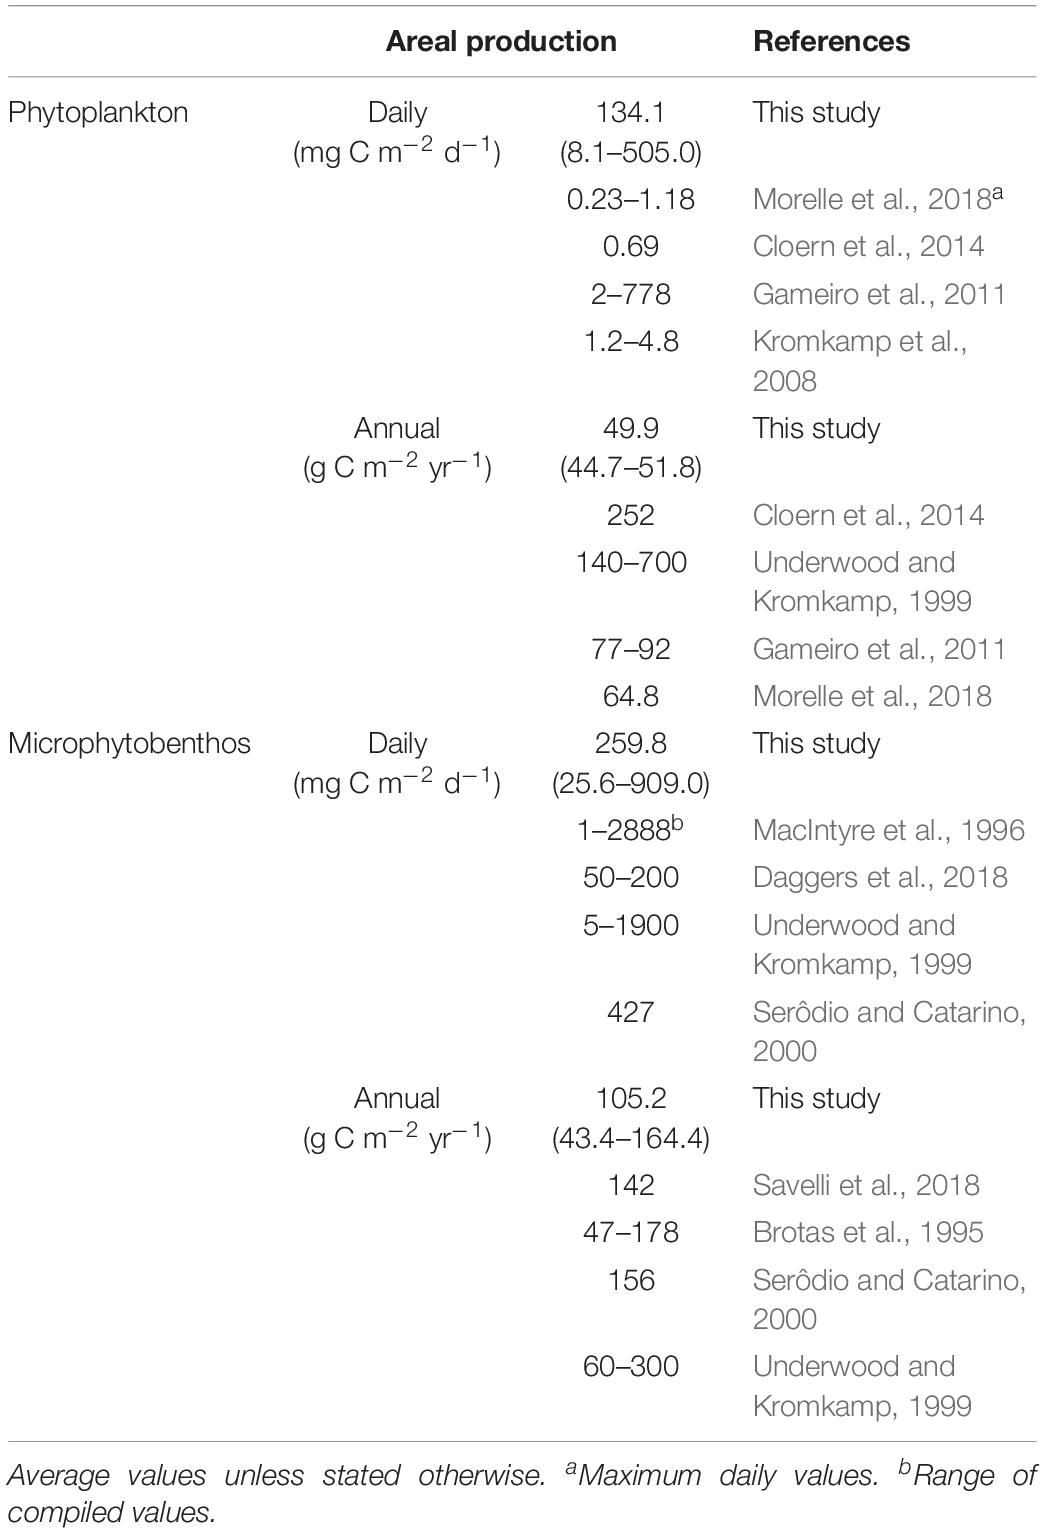
Table 3. Daily and annual primary productivity rates of phytoplankton and microphytobenthos in published studies and as measured in this study (average and range of variation).
Regarding phytoplankton, the average annual rate of 49.8 g C m–2 y–1 appears as relatively low considering the median value of 252 g C m–2 y–1 reported by the exhaustive meta-analysis study of Cloern et al. (2014). According to the classification of Nixon (1995), the studied sites of the Ria de Aveiro could be classified as oligotrophic, as they fall below the limit of 100 g C m–2 y–1. On the other hand, the average annual rate of 105.3 g C m–2 y–1 determined for the microphytobenthos, is remarkably close to the value of 100 g C m–2 y–1, taken as the typical value for primary production rate on estuarine intertidal flats (Underwood and Kromkamp, 1999; Daggers et al., 2018).
The relative contribution of the phytoplankton and the microphytobenthos to the ecosystem-level productivity has been discussed for decades (Underwood and Kromkamp, 1999). Studies that directly compared the two communities have reported that the productivity of microphytobenthos could surpass the one of phytoplankton, reaching between 48.9% (Fielding et al., 1988) to 63.5% (Joint, 1978) of their combined contributions, and, in some cases, reaching over 50% of total estuarine carbon fixation (Cadée and Hegeman, 1974; Joint, 1978). The results of the present study showed that, despite the larger area accounted for the phytoplankton, the primary production carried out by the microphytobenthos may reach around 60% of the 12 kt C yr–1 annual rate estimated for the whole Ria de Aveiro. This estimate is amongst the highest reported in the literature, and close to the value of 63.5% obtained by Joint (1978).
Assumptions and Limitations of Chlorophyll Fluorescence-Based Productivity Estimates
With the aim of obtaining an integrated characterization of the spatio-temporal variability of the photosynthetic activity and productivity of benthic and planktonic microalgal communities, this study employed a synoptic sampling plan to measure the activity of phytoplankton and microphytobenthos under in situ conditions, on the same sites and on the same days, and with the same high temporal resolution. Key for the parallel close comparison of the two communities was the use of the same chlorophyll fluorescence-based technique for planktonic and benthic samples.
A novelty of this study was the estimation, to our knowledge for the first time, of production rates of microphytobenthos based on measurements of absolute rates of PSII electron transport (ETR). Previous studies have used chlorophyll fluorescence to estimate productivity rates of microphytobenthos, but they were based on determinations of relative ETR, integrated on empirically derived indices (Barranguet and Kromkamp, 2000; Serôdio et al., 2007). For the phytoplankton, the use of absolute ETR-based indices for the estimation of productivity rates has been addressed extensively for a long time, mostly based on ‘pump-and-probe’ (e.g., Kolber and Falkowski, 1993; Sakshaug et al., 1997) or ‘fast repetition rate fluorometry’ (FRRF) (Kromkamp et al., 2008; Lawrenz et al., 2013; Boatman et al., 2019) protocols. The protocol used in the present study, developed only recently, and specifically for the MC-PAM, and has been used only a few times, and only for phytoplankton (Morelle and Claquin, 2018; Morelle et al., 2018). While being also based on single-turnover pulses, this protocol is somewhat different from the pump-and-probe or FRRF approaches (Schreiber et al., 2012). Although no direct comparison between the two types of instruments and protocols has been carried out, the results of the present study regarding σII, a parameter crucial for the determination of absolute ETR values, are comparable and well within the range of values obtained with FRRF-based instruments.
This study is also novel because absolute ETR-based productivity estimates were applied to both phytoplankton and microphytobenthos. This approach presents several well-known significant operational advantages as compared to traditional methods based on the direct determination based on carbon fixation or oxygen evolution. In the context of the present study, it allowed for direct comparison of the two groups regarding the characterization of photoacclimation state, quantification of photosynthetic activity, and estimation of primary productivity.
The approach followed in this study is however based on several important assumptions. These apply to both phytoplankton and microphytobenthos, and can be categorized as follows:
(a) Conversion of fluorescence indices to biomass-specific carbon fixation rates. The method associated to the MC-PAM requires the a priori assumption of the value of PSU, ne(O2) and PQ (Eqs. 4,5) (Schreiber et al., 2012). A compilation of experimental data compiled by Suggett et al. (2010) shows that ne(O2), the number of electrons required for evolution of 1 molecule of O2, varies from below 1 to above 11 e– O2–1. However, the values measured for diatoms, dinoflagellates and haptophytes, the dominant groups in the phytoplankton and microphytobenthos of the Ria de Aveiro (Vidal et al., 2017; Frankenbach et al., 2018) vary between 3 and 6 e– O2–1. In this study, ne(O2) was assumed to reach 5 e– O2–1, a value similar to those used by other authors (Kromkamp et al., 2008; Schreiber et al., 2012; Morelle and Claquin, 2018; Morelle et al., 2018). The photosynthetic quotient, PQ, was assumed be 1.1 mol C mol O2–1, a value commonly accepted, including in studies on estuarine phytoplankton (Kromkamp et al., 2008). PSU, the number of chlorophyll a molecules per photosynthetic unit is the most variable parameters required to calculate PB from fluorescence measurements, having a larger direct impact on the final carbon fixation rates. For eukaryotes, the values assumed for PSU have varied from 500 (Schreiber et al., 2011; Lawrenz et al., 2013) and 1000 Chl a PSII–1 (Schreiber et al., 2012; Morelle and Claquin, 2018; Morelle et al., 2018). For diatoms, dinoflagellates and haptophytes, PSU varies between ca. 300 and 700, averaging around 620 Chl a PSII–1 (Suggett et al., 2010). In the present study, PSU was assumed to be 600 Chl a PSII–1, a value considered representative of the main groups that dominate the phytoplankton and the microphytobenthos in the Ria de Aveiro. In the absence of more detailed data, the same value was assumed for both groups although it is conceivable that it may differ between phytoplankton and the microphytobenthos, not only due to different taxonomic composition as to differences in photoacclimation state. All things considered, it seems unlikely that a depart from these assumptions would significantly affect the main conclusions of this study. Even considering the widest range of variation of ne(O2), PQ and PSU, the large difference between the areal and ecosystem-based productivity of phytoplankton and microphytobenthos would likely still hold.
(b) Depth-integration of biomass-specific carbon fixation rates to areal productivity. An implicit assumption of the approach used in this study was to consider, for both the phytoplankton and the microphytobenthos, that the biomass and photosynthetic activity was constant over depth. That is, that the responses measured for samples collected at a single depth (water column) or at the surface (sediment) represent the ones in the remaining regions of the photic zones. For the phytoplankton this assumption seems realistic, due to the homogeneity of the shallow and turbulent water column, caused by the strong tidal currents of the Ria de Aveiro. In the case of the microphytobenthos, this approach may be more problematic, especially due to the fact that the measurements were carried out on cells in suspension, under conditions possibly not representative of the vertically heterogenous physico-chemical environment of the sediment (MacIntyre et al., 1996; Serôdio, 2003).
(c) Upscaling of areal to ecosystem-level productivity. Critical for a realistic evaluation of the planktonic and benthic productivity at the estuary-level, both in absolute as in relative terms, is the correct accounting of the area of intertidal and subtidal habitats, associated to phytoplankton and microphytobenthos productivity. Also important is to consider the time of day, and its variation along the spring-neap tidal cycle, when low or high tides occur, which determine the light incident on exposed tidal flats and light penetration in the water column. In this study, due to the lack of detailed information, estuarine-level production was calculated from spatially and temporal-averaged productivity rates. Another potentially important source of error affecting the absolute estimates of annual productivity of the two groups (but not their relative importance) is the fact that the annual estimates were directly conditioned by the particular conditions (mainly solar irradiance) of the days of measurements. As such, the annual budgets here reported should be seen as tentative estimates. The error associated to this approach is hard to quantify and can only be assessed with a much more extensive sampling program. An additional assumption was to consider that no benthic productivity occurred during immersion in high tide. However, this common assumption seems justified by the high turbidity of the water column and vertical migratory behavior of benthic diatoms (Serôdio and Catarino, 2000; Daggers et al., 2018).
Data Availability Statement
The datasets generated for this study are available on request to the corresponding author.
Author Contributions
JE, NV, JD, and JS planned and designed the research plan and fieldwork. JE, SP, NV, and JS carried out the fieldwork. JG and MK measured the vertical profiles of light in the sediment. SF, JE, and JS analyzed the data and wrote the draft of the manuscript. All authors edited and revised the manuscript.
Funding
The research was funded by the Portuguese Foundation for Science and Technology (FCT), through Project BioChangeR (PTDC/AAC-AMB/121191/2010), project Evo-Sym (POCI-01-0145-FEDER-028751), funded by FEDER, through COMPETE2020 - Programa Operacional Competitividade e Internacionalização (POCI), and by national funds (OE), through FCT/MCTES, and the fellowships BI/UI88/6484/2013 (JE), SFRH/BD/86788/2012 (SF), and SFRH/BD/103973/2014 (LV). NV was funded by national funds (OE), through FCT, in the scope of the framework contract foreseen in the numbers 4, 5, and 6 of the article 23, of the Decree-Law 57/2016, of August 29, changed by Law 57/2017, of July 19. This study was also supported by a Sapere-Aude Advanced grant from the Danish Council for Independent Research/Natural Sciences (MK) and an instrument grant from the Carlsberg Foundation (MK). Thanks are also due to CESAM (UID/AMB/50017 - POCI-01- 0145-FEDER-007638) and (UIDP/50017/2020+UIDB/50017/2020), to FCT/MEC through national funds (PIDDAC), and the co-funding by the FEDER, within the PT2020 Partnership Agreement and Compete 2020.
Conflict of Interest
The authors declare that the research was conducted in the absence of any commercial or financial relationships that could be construed as a potential conflict of interest.
References
Araújo, I., Dias, J., Pugh, D., Araujo, I., Dias, J., and Pugh, D. (2008). Model simulations of tidal changes in a coastal lagoon, the Ria de Aveiro (Portugal). Cont. Shelf Res. 28, 1010–1025. doi: 10.1016/j.csr.2008.02.001
Barbier, E. B., Hacker, S. D., Kennedy, C., Koch, E. W., Stier, A. C., and Silliman, B. R. (2011). The value of estuarine and coastal ecosystem services. Ecol. Monogr. 81, 169–193. doi: 10.1890/10-1510.1
Barranguet, C., and Kromkamp, J. (2000). Estimating primary production rates from photosynthetic electron transport in estuarine microphytobenthos. Mar. Ecol. Prog. Ser. 204, 39–52. doi: 10.3354/meps204039
Bauer, J. E., Cai, W.-J., Raymond, P. a, Bianchi, T. S., Hopkinson, C. S., and Regnier, P. a. G. (2013). The changing carbon cycle of the coastal ocean. Nature 504, 61–70. doi: 10.1038/nature12857
Boatman, T. G., Geider, R. J., and Oxborough, K. (2019). Improving the accuracy of single turnover active fluorometry (STAF) for the estimation of phytoplankton primary productivity (PhytoPP). Front. Mar. Sci. 6:319. doi: 10.3389/fmars.2019.00319
Brito, A., Newton, A., Tett, P., and Fernandes, T. F. (2009). Temporal and spatial variability of microphytobenthos in a shallow lagoon: Ria Formosa (Portugal). Estuar. Coast. Shelf Sci. 83, 67–76. doi: 10.1016/j.ecss.2009.03.023
Brotas, V., Cabrita, T., Portugal, A., Serôdio, J., and Catarino, F. (1995). Spatio-temporal distribution of the microphytobenthic biomass in intertidal flats of Tagus Estuary (Portugal). Hydrobiologia 30, 93–104. doi: 10.1007/BF00024451
Bueno-Pardo, J., García-Seoane, E., Sousa, A. I., Coelho, J. P., Morgado, M., Frankenbach, S., et al. (2018). Trophic web structure and ecosystem attributes of a temperate coastal lagoon (Ria de Aveiro. Portugal). Ecol. Modell. 378, 13–25. doi: 10.1016/j.ecolmodel.2018.03.009
Cadée, G. C., and Hegeman, J. (1974). Primary production of the benthic microflora living on tidal flats in the Dutch Wadden Sea. Neth. J. Sea Res. 8, 260–291. doi: 10.1016/0077-7579(74)90020-9
Caffrey, J. M., Murrell, M. C., Amacker, K. S., Harper, J. W., Phipps, S., and Woodrey, M. S. (2014). Seasonal and inter-annual patterns in primary production, respiration, and net ecosystem metabolism in three estuaries in the northeast Gulf of Mexico. Estuaries Coasts 37, 222–241. doi: 10.1007/s12237-013-9701-5
Cloern, J. E., Foster, S. Q., and Kleckner, A. E. (2014). Phytoplankton primary production in the world’s estuarine-coastal ecosystems. Biogeosciences 11, 2477–2501. doi: 10.5194/bg-11-2477-2014
Consalvey, M., Paterson, D. M., and Underwood, G. J. C. (2004). The ups and downs of life in a benthic biofilm: migration of benthic diatoms. Diatom Res. 19, 181–202. doi: 10.1080/0269249X.2004.9705870
Daggers, T. D., Kromkamp, J. C., Herman, P. M. J., and van der Wal, D. (2018). A model to assess microphytobenthic primary production in tidal systems using satellite remote sensing. Remote Sens. Environ. 211, 129–145. doi: 10.1016/j.rse.2018.03.037
Davis, M. W., and McIntire, C. D. (1983). Effects of physical gradients on the production dynamics of sediment-associated algae. Mar. Ecol. Prog. Ser. 13, 103–114. doi: 10.3354/meps013103
de Jonge, V. N., and Van Beusekom, J. E. E. (1995). Wind and tide induced resuspension of sediment and microphytobenthos in the Ems estuary. Limnol. Oceanogr. 40, 766–778.
de Jonge, V. N. V., de Boer, W. F. W., De Jong, D. D. J., and Brauer, V. V. S. (2012). Long-term mean annual microphytobenthos chlorophyll a variation correlates with air temperature. Mar. Ecol. Prog. Ser. 468, 43–56. doi: 10.3354/meps09954
Delgado, M., de Jonge, V. N., Peletier, H., Jonge, V. N., and Peletier, H. (1991). Experiments on resuspension of natural microphytobenthos populations. Mar. Biol. 108, 321–328. doi: 10.1007/BF01344347
Dias, J. M., Lopes, J. F., and Dekeyser, I. (1999). Hydrological characterisation of Ria de Aveiro, Portugal, in early summer. Oceanol. Acta 22, 473–485. doi: 10.1016/s0399-1784(00)87681-1
Dias, J. M., Lopes, J. F., and Dekeyser, I. (2003). A numerical system to study the transport properties in the Ria de Aveiro lagoon. Ocean Dyn. 53, 220–231. doi: 10.1007/s10236-003-0048-5
Eaton, J. W., and Moss, B. (1966). The estimation of numbers and pigment content in epipelic algal populations. Limnol. Oceanogr. 11, 584–595. doi: 10.4319/lo.1966.11.4.0584
Eilers, P. H. C. H. C., and Peeters, J. C. H. C. H. (1988). A model for the relationship between light intensity and the rate of photosynthesis in phytoplankton. Ecol. Modell. 42, 199–215. doi: 10.1111/jpy.12060
Ezequiel, J., Laviale, M., Frankenbach, S., Cartaxana, P., and Serôdio, J. (2015). Photoacclimation state determines the photobehaviour of motile microalgae: the case of a benthic diatom. J. Exp. Mar. Bio. Ecol. 468, 11–20. doi: 10.1016/j.jembe.2015.03.004
Fielding, P. J., Damstra, K. S. J., and Branch, G. M. (1988). Benthic diatom biomass, production and sediment chlorophyll in langebaan lagoon, South Africa. Estuar. Coast. Shelf Sci. 27, 413–426. doi: 10.1016/0272-7714(88)90097-2
Flemming, B. (2000). Mass physical properties of muddy intertidal sediments: some applications, misapplications and non-applications. Cont. Shelf Res. 20, 1179–1197. doi: 10.1016/s0278-4343(00)00018-2
Frankenbach, S., Azevedo, A. A., Reis, V., Dias, D., Vaz, L., Dias, J. M., et al. (2019). Functional resilience of PSII, vertical distribution and ecosystem-level estimates of subsurface microphytobenthos in estuarine tidal flats. Cont. Shelf Res. 182, 46–56. doi: 10.1016/j.csr.2019.05.018
Frankenbach, S., Schmidt, W., Frommlet, J., and Serôdio, J. (2018). Photoinactivation, repair and the motility-physiology trade-off in microphytobenthos. Mar. Ecol. Prog. Ser. 601, 41–57. doi: 10.3354/meps12670
Gameiro, C., Zwolinski, J., and Brotas, V. (2011). Light control on phytoplankton production in a shallow and turbid estuarine system. Hydrobiologia 669, 249–263. doi: 10.1007/s10750-011-0695-3
Genty, B., Briantais, J.-M. M., and Baker, N. R. (1989). The relationship between the quantum yield of photosynthetic electron transport and quenching of chlorophyll fluorescence. Biochim. Biophys. Acta Gen. Subj. 990, 87–92. doi: 10.1016/s0304-4165(89)80016-9
Gordillo, F. J. L. L., Jimenez, C., Chavarria, J., Niell, F. X., Jiménez, C., Chavarría, J., et al. (2001). Photosynthetic acclimation to photon irradiance and its relation to chlorophyll fluorescence and carbon assimilation in the halotolerant green alga Dunaliella viridis. Photosynth. Res. 68, 225–235. doi: 10.1023/A:1012969324756
Haro, S., Bohórquez, J., Lara, M., González, C. J., Crespo, J. M., Papaspyrou, S., et al. (2019). Diel patterns of microphytobenthic primary production in intertidal sediments : the role of photoperiod on the vertical migration circadian rhythm. Sci. Rep. 9:13376. doi: 10.1038/s41598-019-49971-8
Hope, J. A., Paterson, D. M., and Thrush, S. F. (2019). The role of microphytobenthos in soft-sediment ecological networks and their contribution to the delivery of multiple ecosystem services. J. Ecol. 1–16. doi: 10.1111/1365-2745.13322
Houliez, E., Lizon, F., Lefebvre, S., Artigas, L. F., and Schmitt, F. G. (2013). Short-term variability and control of phytoplankton photosynthetic activity in a macrotidal ecosystem (the Strait of Dover, eastern English Channel). Mar. Biol. 160, 1661–1679. doi: 10.1007/s00227-013-2218-4
Joint, I. R. (1978). Microbial production of an estuarine mudflat. Estuar. Coast. Mar. Sci. 7, 185–195. doi: 10.1016/0302-3524(78)90074-9
Koh, C.-H., Khim, J. S., Araki, H., Yamanishi, H., and Koga, K. (2007). Within-day and seasonal patterns of microphytobenthos biomass determined by co-measurement of sediment and water column chlorophylls in the intertidal mudflat of Nanaura, Saga, Ariake Sea, Japan. Estuar. Coast. Shelf Sci. 72, 42–52. doi: 10.1016/j.ecss.2006.10.005
Kolber, Z., and Falkowski, P. G. (1993). Use of active fluorescence to estimate phytoplankton photosynthesis in situ. Limnol. Oceanogr. 38, 1646–1665. doi: 10.4319/lo.1993.38.8.1646
Kromkamp, J., Barranguet, C., and Peene, J. (1998). Determination of microphytobenthos PSII quantum yield efficiency and photosynthetic activity by means of variable chlorophyll fluorescence. Mar. Ecol. Prog. Ser. 162, 45–55. doi: 10.3354/meps162045
Kromkamp, J. C., Dijkman, N. A., Peene, J., Simis, S. G. H., and Gons, H. J. (2008). Estimating phytoplankton primary production in Lake IJsselmeer (The Netherlands) using variable fluorescence (PAM-FRRF) and C-uptake techniques. Eur. J. Phycol. 43, 327–344. doi: 10.1080/09670260802080895
Kühl, M. (2005). Optical microsensors for analysis of microbial communities. Methods Enzymol. 397, 166–199. doi: 10.1016/s0076-6879(05)97010-9
Kwon, B.-O. O., Khim, J. S., Park, J., Ryu, J., Kang, S.-G. G., and Koh, C.-H. H. (2012). Short-term variability of microphytobenthic primary production associated with in situ diel and tidal conditions. Estuar. Coast. Shelf Sci. 112, 236–242. doi: 10.1016/j.ecss.2012.07.029
Laviale, M., Ezequiel, J., Pais, C., Cartaxana, P., and Serôdio, J. (2015). The “crème brûlée” sampler: a new high-resolution method for the fast vertical sampling of intertidal fine sediments. J. Exp. Mar. Bio. Ecol. 468, 37–44. doi: 10.1016/j.jembe.2015.03.013
Lawrenz, E., Silsbe, G., Capuzzo, E., Ylöstalo, P., Forster, R. M., Simis, S. G. H. H., et al. (2013). Predicting the electron requirement for carbon fixation in seas and oceans. PLoS One 8:e58137. doi: 10.1371/journal.pone.0058137
Liu, B., de Swart, H. E., and de Jonge, V. N. (2018). Phytoplankton bloom dynamics in turbid, well-mixed estuaries: a model study. Estuar. Coast. Shelf Sci. 211, 137–151. doi: 10.1016/j.ecss.2018.01.010
Lopes, C. L., Azevedo, A., and Dias, J. M. (2013). Flooding assessment under sea level rise scenarios: Ria de Aveiro case study. J. Coast. Res. 65, 766–771. doi: 10.2112/si65-130.1
Lorenzen, C. J. (1967). Determination of chlorophyll and pheo-pigments: spectrophotometric equations. Limnol. Oceanogr. 12, 343–346. doi: 10.4319/lo.1967.12.2.0343
MacIntyre, H. L., Geider, R. J., and Miller, D. C. (1996). Microphytobenthos: the ecological role of the “secret garden” of unvegetated, shalow-water marine habitats. I. Distribution, abundance and primary production. Estuaries 19, 186–201. doi: 10.2307/1352224
Madariaga, I. (2002). Short-term variations in the physiological state of phytoplankton in a shallow temperate estuary. Hydrobiologia 475–476, 345–358. doi: 10.1023/A:1020391425989
Mallin, M. A., and Pearl, H. W. (1992). Effects of variable irradiance on phytoplankton productivity in shallow estuaries. Limnol. Oceanogr. 37, 54–62. doi: 10.4319/lo.1992.37.1.0054
McLusky, D. S., and Elliott, M. (2007). Transitional waters: a new approach, semantics or just muddying the waters? Estuar. Coast. Shelf Sci. 71, 359–363. doi: 10.1016/j.ecss.2006.08.025
Migné, A., Gévaert, F., Créach, A., Spilmont, N., Chevalier, E., Davoult, D., et al. (2007). Photosynthetic activity of intertidal microphytobenthic communities during emersion: in situ measurements of chlorophyll fluorescence (PAM) and CO2 flux (IRGA). J. Phycol. 43, 864–873. doi: 10.1111/j.1529-8817.2007.00379.x
Morelle, J., and Claquin, P. (2018). Electron requirements for carbon incorporation along a diel light cycle in three marine diatom species. Photosynth. Res. 137, 201–214. doi: 10.1007/s11120-018-0491-2
Morelle, J., Schapira, M., Orvain, F., Riou, P., Lopez, P. J., Pierre-Duplessix, O., et al. (2018). Annual phytoplankton primary production estimation in a temperate estuary by coupling PAM and carbon incorporation methods. Estuaries Coasts 41, 1337–1355. doi: 10.1007/s12237-018-0369-8
Nixon, S. W. (1995). Coastal marine eutrophication: a definition, social causes, and future concerns. Ophelia 41, 199–219. doi: 10.1080/00785236.1995.10422044
Pennock, J. R., and Sharp, J. H. (1986). Phytoplankton production in the Delaware Estuary: temporal and spatial variability. Mar. Ecol. Prog. Ser. 34, 143–155. doi: 10.3354/meps034143
Portela, L. (1996). Modelação Matemática da Hidrodinâmica e dos Processos de Qualidade da Água no Estuário do Tejo. Lisboa: Instituto Superior Técnico.
Pratt, D. R., Pilditch, C. A., Lohrer, A. M., and Thrush, S. F. (2014). The effects of short-term increases in turbidity on sandflat microphytobenthic productivity and nutrient fluxes. J. Sea Res. 92, 170–177. doi: 10.1016/j.seares.2013.07.009
Ragni, M., Airs, R. L., Leonardos, N., and Geider, R. J. (2008). Photoinhibition of PSII in Emiliania huxleyi (Haptophyta) under high light stress: the roles of photoacclimation, photoprotection, and photorepair. J. Phycol. 44, 670–683. doi: 10.1111/j.1529-8817.2008.00524.x
Rickelt, L. F., Lichtenberg, M., Trampe, E. C. L., and Kühl, M. (2016). Fiber-optic probes for small-scale measurements of scalar irradiance. Photochem. Photobiol. 92, 331–342. doi: 10.1111/php.12560
Sakshaug, E., Bricaud, A., Dandonneau, Y., Falkowski, P. G., Kiefer, D. A., Legendre, L., et al. (1997). Parameters of photosynthesis: definitions, theory and interpretation of results. J. Plankton Res. 19, 1637–1670. doi: 10.1093/plankt/19.11.1637
Savelli, R., Dupuy, C., Barillé, L., Lerouxel, A., Guizien, K., Philippe, A., et al. (2018). On biotic and abiotic drivers of the microphytobenthos seasonal cycle in a temperate intertidal mudflat: a modelling study. Biogeosciences 15, 7243–7271. doi: 10.5194/bg-15-7243-2018
Schreiber, U., and Klughammer, C. (2013). Wavelength-dependent photodamage to Chlorella investigated with a new type of multi-color PAM chlorophyll fluorometer. Photosynth. Res. 114, 165–177. doi: 10.1007/s11120-013-9801-x
Schreiber, U., Klughammer, C., and Kolbowski, J. (2011). High-end chlorophyll fluorescence analysis with the MULTI-COLOR-PAM. I. Various light qualities and their applications. PAM Appl. Notes 1, 1–21.
Schreiber, U., Klughammer, C., and Kolbowski, J. (2012). Assessment of wavelength-dependent parameters of photosynthetic electron transport with a new type of multi-color PAM chlorophyll fluorometer. Photosynth. Res. 113, 127–144. doi: 10.1007/s11120-012-9758-1
Serôdio, J. (2003). A chlorophyll fluorescence index to estimate short-term rates of photosynthesis by intertidal microphytobenthos. J. Phycol. 39, 33–46. doi: 10.1046/j.1529-8817.2003.02043.x
Serôdio, J., and Catarino, F. (1999). Fortnightly light and temperature variability in estuarine intertidal sediments and implications for microphytobenthos primary productivity. Aquat. Ecol. 33, 235–241. doi: 10.1023/A:1009989229098
Serôdio, J., and Catarino, F. (2000). Modelling the primary productivity of intertidal microphytobenthos: time scales of variability and effects of migratory rhythms. Mar. Ecol. Prog. Ser. 192, 13–30. doi: 10.3354/meps192013
Serôdio, J., Da Silva, J. M., and Catarino, F. (2001). Use of in vivo chlorophyll a fluorescence to quantify short-term variations in the productive biomass of intertidal microphytobenthos. Mar. Ecol. Prog. Ser. 218, 45–61. doi: 10.3354/meps218045
Serôdio, J., Vieira, S., and Barroso, F. (2007). Relationship of variable chlorophyll fluorescence indices to photosynthetic rates in microphytobenthos. Aquat. Microb. Ecol. 49, 71–85. doi: 10.3354/ame01129
Serôdio, J., Vieira, S., and Cruz, S. (2008). Photosynthetic activity, photoprotection and photoinhibition in intertidal microphytobenthos as studied in situ using variable chlorophyll fluorescence. Cont. Shelf Res. 28, 1363–1375. doi: 10.1016/j.csr.2008.03.019
Serôdio, J., Vieira, S., Cruz, S., and Barroso, F. (2005). Short-term variability in the photosynthetic activity of microphytobenthos as detected by measuring rapid light curves using variable fluorescence. Mar. Biol. 146, 903–914. doi: 10.1007/s00227-004-1504-6
Sousa, A. I., Calado, R., Cleary, D. F. R., Nunes, C., Coimbra, M. A., Serôdio, J., et al. (2017). Effect of spatio-temporal shifts in salinity combined with other environmental variables on the ecological processes provided by Zostera noltei meadows. Sci. Rep. 7:1336. doi: 10.1038/s41598-017-01359-2
Suggett, D. J., Moore, C. M., and Geider, R. J. (2010). “Estimating aquatic productivity from active fluorescence measurements,” in Chlorophyll a Fluorescence in Aquatic Sciences: Methods and Applications, Developments in Applied Phycology 4, eds D. J. Suggett, O. Prasil, and M. A. Borowitzka, (Dordrecht: Springer), 103–127. doi: 10.1007/978-90-481-9268-7_6
Tian, T., Merico, A., Su, J., Staneva, J., Wiltshire, K., and Wirtz, K. (2009). Importance of resuspended sediment dynamics for the phytoplankton spring bloom in a coastal marine ecosystem. J. Sea Res. 62, 214–228. doi: 10.1016/j.seares.2009.04.001
Tomás, L. M., Rodrigues, M., Fortunato, A. B., Azevedo, A., Leitão, P. C., Oliveira, A., et al. (2014). Salinity modelling accuracy of a coastal lagoon: a comparative river flow analysis of basin model vs. traditional approaches. J. Coast. Res. 70, 586–591. doi: 10.2112/SI70-099.1
Ubertini, M., Lefebvre, S., Gangnery, A., Grangeré, K., Le Gendre, R., and Orvain, F. (2012). Spatial variability of benthic-pelagic coupling in an estuary ecosystem: consequences for microphytobenthos resuspension phenomenon. PLoS One 7:e44155. doi: 10.1371/journal.pone.0044155
Underwood, G. J. C., and Kromkamp, J. (1999). Primary production by phytoplankton and microphytobenthos in estuaries. Adv. Ecol. Res. 29, 93–153. doi: 10.1016/s0065-2504(08)60192-0
Vajravelu, M., Martin, Y., Ayyappan, S., and Mayakrishnan, M. (2018). Seasonal influence of physico-chemical parameters on phytoplankton diversity, community structure and abundance at Parangipettai coastal waters, Bay of Bengal, South East Coast of India. Oceanologia 60, 114–127. doi: 10.1016/j.oceano.2017.08.003
Van Colen, C., Underwood, G. J. C., Serôdio, J., and Paterson, D. M. (2014). Ecology of intertidal microbial biofilms: mechanisms, patterns and future research needs. J. Sea Res. 92, 2–5. doi: 10.1016/j.seares.2014.07.003
Vaz, N., and Dias, J. M. (2008). Hydrographic characterization of an estuarine tidal channel. J. Mar. Syst. 70, 168–181. doi: 10.1016/j.jmarsys.2007.05.002
Vaz, N., Vaz, L., Serôdio, J., and Dias, J. M. (2019). A modeling study of light extinction due to cohesive sediments in a shallow coastal lagoon under well mixed conditions. Sci. Total Environ. 694:133707. doi: 10.1016/j.scitotenv.2019.133707
Vidal, T., Calado, A. J., Moita, M. T., and Cunha, M. R. (2017). Phytoplankton dynamics in relation to seasonal variability and upwelling and relaxation patterns at the mouth of Ria de Aveiro (West Iberian Margin) over a four-year period. PLoS One 12:e0177237. doi: 10.1371/journal.pone.0177237
Vieira, S., Coelho, H., Nolasco, R., Serôdio, J., Barnes, R. S. K. K., and Queiroga, H. (2012). Repeated cycles of immersion and emersion amplify the crawling rhythm of the intertidal gastropod Hydrobia ulvae. J. Mar. Biol. Assoc. U. K. 92, 565–570. doi: 10.1017/S0025315411000853
Keywords: chlorophyll a fluorescence, estuaries, diatoms, microphytobenthos, photoacclimation, photosynthesis, phytoplankton, productivity
Citation: Frankenbach S, Ezequiel J, Plecha S, Goessling JW, Vaz L, Kühl M, Dias JM, Vaz N and Serôdio J (2020) Synoptic Spatio-Temporal Variability of the Photosynthetic Productivity of Microphytobenthos and Phytoplankton in a Tidal Estuary. Front. Mar. Sci. 7:170. doi: 10.3389/fmars.2020.00170
Received: 04 December 2019; Accepted: 04 March 2020;
Published: 24 March 2020.
Edited by:
Dongyan Liu, East China Normal University, ChinaReviewed by:
Yujue Wang, Yantai Institute of Coastal Zone Research (CAS), ChinaGang Li, South China Sea Institute of Oceanology, China
Li Zou, Ocean University of China, China
Copyright © 2020 Frankenbach, Ezequiel, Plecha, Goessling, Vaz, Kühl, Dias, Vaz and Serôdio. This is an open-access article distributed under the terms of the Creative Commons Attribution License (CC BY). The use, distribution or reproduction in other forums is permitted, provided the original author(s) and the copyright owner(s) are credited and that the original publication in this journal is cited, in accordance with accepted academic practice. No use, distribution or reproduction is permitted which does not comply with these terms.
*Correspondence: Silja Frankenbach, cy5mcmFua2VuYmFja0B1YS5wdA==
†These authors share first authorship
‡Present address: João Ezequiel, RAIZ –Instituto de Investigação da Floresta e Papel, Aveiro, Portugal Sandra Plecha, Instituto Dom Luiz, Faculty of Sciences, University of Lisbon, Lisbon, Portugal