 Eva-Maria Nöthig1*
 Simon Ramondenc1,2
 Antonie Haas1Laura Hehemann1Andreas Walter1
 Astrid Bracher1,3Catherine Lalande1,4
 Katja Metfies1
 Ilka Peeken1
 Eduard Bauerfeind1
 Antje Boetius1,2
- 1Alfred Wegener Institute Helmholtz Centre for Polar and Marine Research (AWI), Bremerhaven, Germany
- 2MARUM, University of Bremen, Bremen, Germany
- 3Institute of Environmental Physics, University of Bremen, Bremen, Germany
- 4Amundsen Science, Université Laval, Québec, QC, Canada
Sea ice in the Arctic Ocean (AO) has been undergoing dramatic changes during the last two decades. In addition, the water temperature of the inflow of Atlantic water masses at the gateway Fram Strait has recently increased. Long-term data may help to evaluate the impact of these physical changes on the biological processes in surface waters. Over a 25-year period, and mostly in summer, water samples were collected at discrete depths within the uppermost 100 m of the Fram Strait and other regions of the AO to investigate chlorophyll a (Chl a) and particulate organic carbon (POC) standing stocks. Stations sampled from 1991 to 2015 were located in the Fram Strait, Barents Sea (BS), on the Eurasian shelf, and over the Nansen, Amundsen, and parts of the Amerasian basins (AB). Discrete Chl a and POC measurements obtained during 33 and 24 expeditions, respectively, were integrated over the upper 100 m of the water column to monitor spatial and interannual variations in distribution patterns of standing stocks. In general, the highest Chl a and POC standing stocks were observed in the eastern Fram Strait (EFS) and in the BS, while the lowest biomasses were observed in the heavily ice-covered regions of the central AO, mainly in the Amundsen and ABs. Whereas summertime Chl a stocks sharply decreased northward from the Fram Strait and Barents Sea toward high latitudes, the decline in POC standing stocks was less pronounced. Over the sampling period, summertime Chl a stocks slightly increased in the EFS but remained more or less constant in the central AO. In contrast to Chl a, standing stocks of POC eventually increased over the last 25 years in the central AO, possibly as an effect of increasing air temperatures, decreasing sea ice extent and thickness, and increasing light availability. Moreover, variations in riverine discharge and in sea ice export within the Transpolar Drift may have contributed to the enhanced POC stock in the central AO surface waters. Overall, the objective of the present study was to provide baseline datasets of Chl a and POC to better track the effects of environmental changes due to global warming on the Arctic pelagic system.
Introduction
The Arctic environment is in rapid transition and is severely impacted by climate change, with air temperatures increasing twice as fast in the Arctic as in other regions of the planet (Schiermeier, 2007; Serreze et al., 2007; IPCC, 2014, 2019). The effects of climate change are clearly visible in the Arctic Ocean (AO) through the recent massive reduction in sea ice volume and extent. Although sea ice remains present during the entire year in the AO, the summer minimum sea ice extent decreased from ∼ 6 millions km2 in the early 1990s to a record low of 3.4 millions km2 in 2012. The perennial decadal loss accounts to about 11% of sea ice extent (Comiso et al., 2017) and at this rate, nearly ice-free summers are predicted within the next 20–30 years for the AO (Nghiem et al., 2007; Wang and Overland, 2012; Liu et al., 2013).
Sea ice loss results in more light penetrating into the Arctic Ocean surface waters (Nicolaus et al., 2012). A resulting increase in primary productivity following the recent drastic reduction in sea ice has already been observed and is due to a longer phytoplankton growing season (Arrigo et al., 2008; Arrigo and Van Dijken, 2015). While Kahru et al. (2011) reported an earlier onset of phytoplankton blooms, Ardyna et al. (2014) observed and forecast an increase in the occurrence of fall blooms based on remote sensing observations in ice-free, open waters. However, fresher Arctic surface waters due to enhanced ice melt and larger riverine input, together with warmer water, lead to a more stabilized water column (Ardyna et al., 2013; Tremblay et al., 2015). A stronger water column stratification may prevent nutrient repletion into the sunlit surface layers, unless local upwelling of nutrient-rich waters brings nutrients to the surface (Codispoti et al., 2005; Tremblay and Gagnon, 2009; Tremblay et al., 2015). The interplay between less nutrients and more light for growth of primary producers in the changing Arctic surface waters is not well understood, as evidenced by massive under-ice blooms observed under less compact sea ice (Fortier et al., 2002; Arrigo et al., 2012, 2014; Assmy et al., 2017). Slagstad et al. (2015) predicted that productivity will remain low for Arctic waters until 2100 due to stronger stratification following ice melt and warmer water, except in regions of weak stratification such as the northern Barents Sea and the Kara Sea shelf break. In summary, the dynamics of nutrient supply and the impact of the changing freshwater budget are unknown for a warmer AO. Both may have a severe impact on the future standing stocks and on the biogeochemical processes in the pelagic system, with implications for the food web (Wassmann, 2011; Wassmann and Reigstad, 2011; Bluhm et al., 2015). Besides the consequences for the pelagic food web, the vertical export of particulate matter and carbon may affect the benthic organisms feeding on the nutrient-rich particle rain from above, modifying their distribution patterns (Boetius et al., 2013; Wiedmann et al., 2020).
In the Fram Strait, identified as the main gateway to the AO, water of Atlantic origin is transported northward via the West Spitsbergen Current to the AO on the eastern side, while sea ice of the AO is transported southward via the Transpolar Drift on the western side, where it leaves the AO on top of the cold Polar Water. The drastic thinning and shrinking of the sea ice in the central AO therefore also affects the Fram Strait, mainly east of Greenland (Hansen et al., 2013; Renner et al., 2014; Krumpen et al., 2015, 2019) while the Atlantic Water entering the AO via the Fram Strait has in turn an influence on the AO (Vernet et al., 2019; Wassmann et al., 2019). Mixing, eddies, and recirculating water of the warm West Spitsbergen Current add to the hydrographic complexity observed in the Fram Strait (Gascard et al., 1988; Walczowski, 2013; Von Appen et al., 2015). Increasing water temperature and heat flux have been observed in the West Spitsbergen Current off Svalbard during the last two decades (Schauer et al., 2008; Piechura and Walczowski, 2009; Walczowski, 2013; Walczowski et al., 2017) causing an increasing influence of warmer Atlantic waters (Atlantification) in the Arctic domain (Piechura and Walczowski, 2009; Beszczynska-Möller et al., 2012; Polyakov et al., 2017). In addition, a warm water anomaly in the eastern Fram Strait was observed from 2004 to 2008 (Beszczynska-Möller et al., 2012) that was accompanied by changes in phytoplankton species during summer and changes in vertical particle fluxes obtained with moored sediment traps during the entire year. Biogeographical shifts within higher trophic levels were also observed (Bauerfeind et al., 2009; Lalande et al., 2013; Nöthig et al., 2015b; Soltwedel et al., 2016; Gluchowska et al., 2017; Schröter et al., 2019). These changes due to slightly higher water temperatures may propagate through the Arctic food web, affecting predators and potentially reaching the central AO should the warming trend continue (Wȩsławski et al., 2006).
Here, time-series datasets of chlorophyll a (Chl a) and particulate organic carbon (POC) obtained from the Long-Term Ecological Research (LTER) observatory HAUSGARTEN (HG) and in the eastern and central AO were used to assess spatial and temporal variations in phytoplankton standing stocks, here expressed as Chl a and carbon stocks during summer. Sampling first started during the joint European Polarstern Study (EPOS 2) around Svalbard in 1991 and continued almost every year as part of a variety of expeditions (25 between 1991 and 2015) with varying focus on the Arctic physical and biological systems. The establishment of the HG observatory in 1999 and of the FRontiers in Arctic Monitoring (FRAM) in 2014 by the Alfred Wegener Institute Helmholtz Centre for Polar and Marine Research (AWI) has provided to obtain data on a routine yearly basis in the eastern Fram Strait, enabling the detection of long-term trends in environmental and biological parameters in the pelagic and benthic systems. Sampling in the other regions of the AO (eight expeditions between 1993 and 2015) were conducted less routinely as part of other projects.
For a comprehensive overview and comparison summer Chl a and POC are shown as standing stocks per square meter per station, integrated by means of concentrations obtained by discrete measurements at several depths between 0 and 100 m water depth. The Chl a and POC results presented here provide a baseline against which to assess natural variability and the impact of climate change on these AO regions. More precisely, the dataset was evaluated to analyze how the different geographical locations in the Arctic can be characterized by patterns of Chl a and POC content. Further, it is discussed whether increasing water temperatures and decreasing sea ice extent and thickness have affected Chl a and POC standing stocks during summer months.
Materials and Methods
Seawater samples were obtained mostly between June and September during 33 expeditions from 1991 to 2015, with eight expeditions to the Arctic Ocean and 25 expeditions to the Fram Strait (Table 1). Almost all expeditions were conducted on board the research icebreaker RV Polarstern (Supplementary Table S1) except for a few expeditions on board RV Lance and Maria S. Merian (Supplementary Table S2). Not all regions/stations were revisited depending on the individual expedition plans (Figure 1 and Supplementary Tables S1, S2; see also PANGAEA data publisher for RV Polarstern expeditions)1.
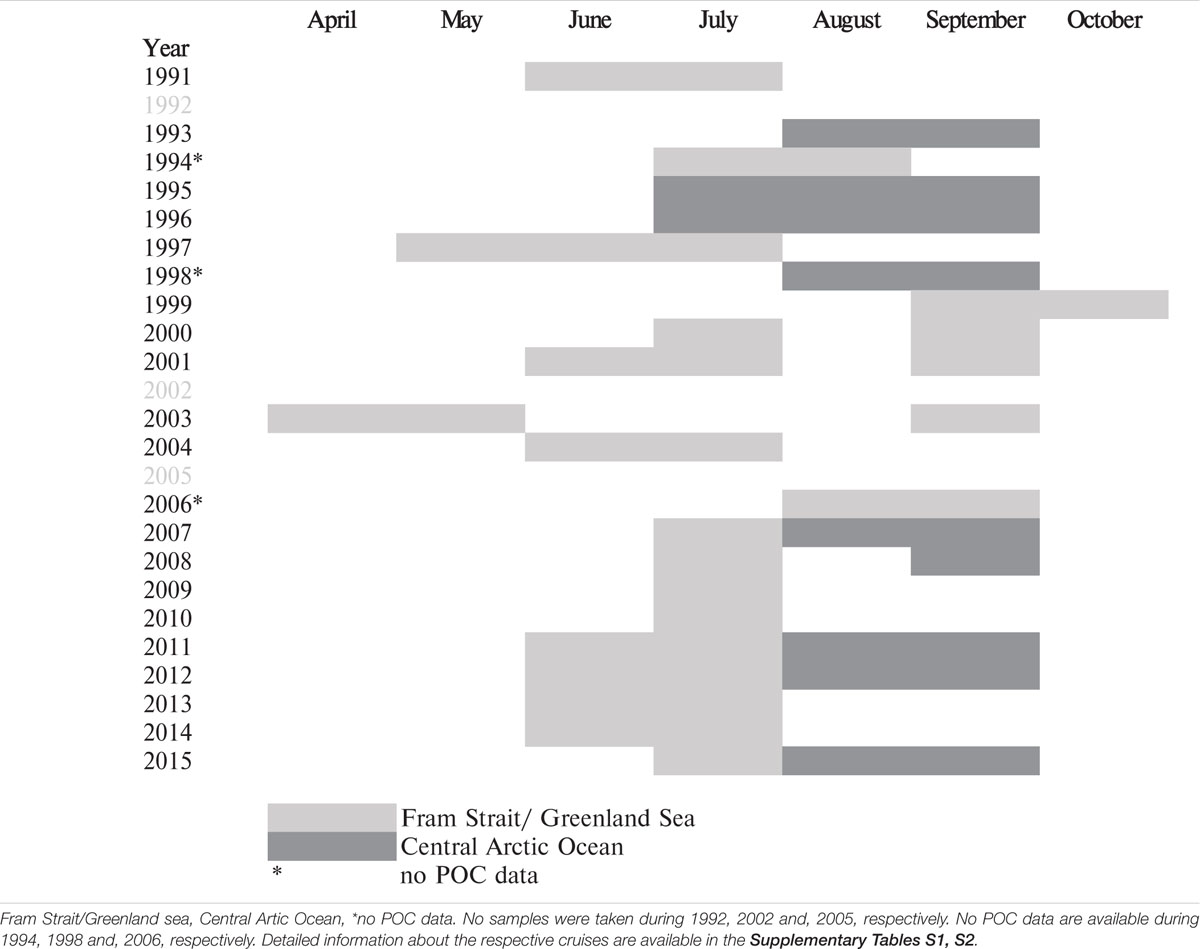
Table 1. Bar chart of location and sampling month covered between 1991 and 2015.
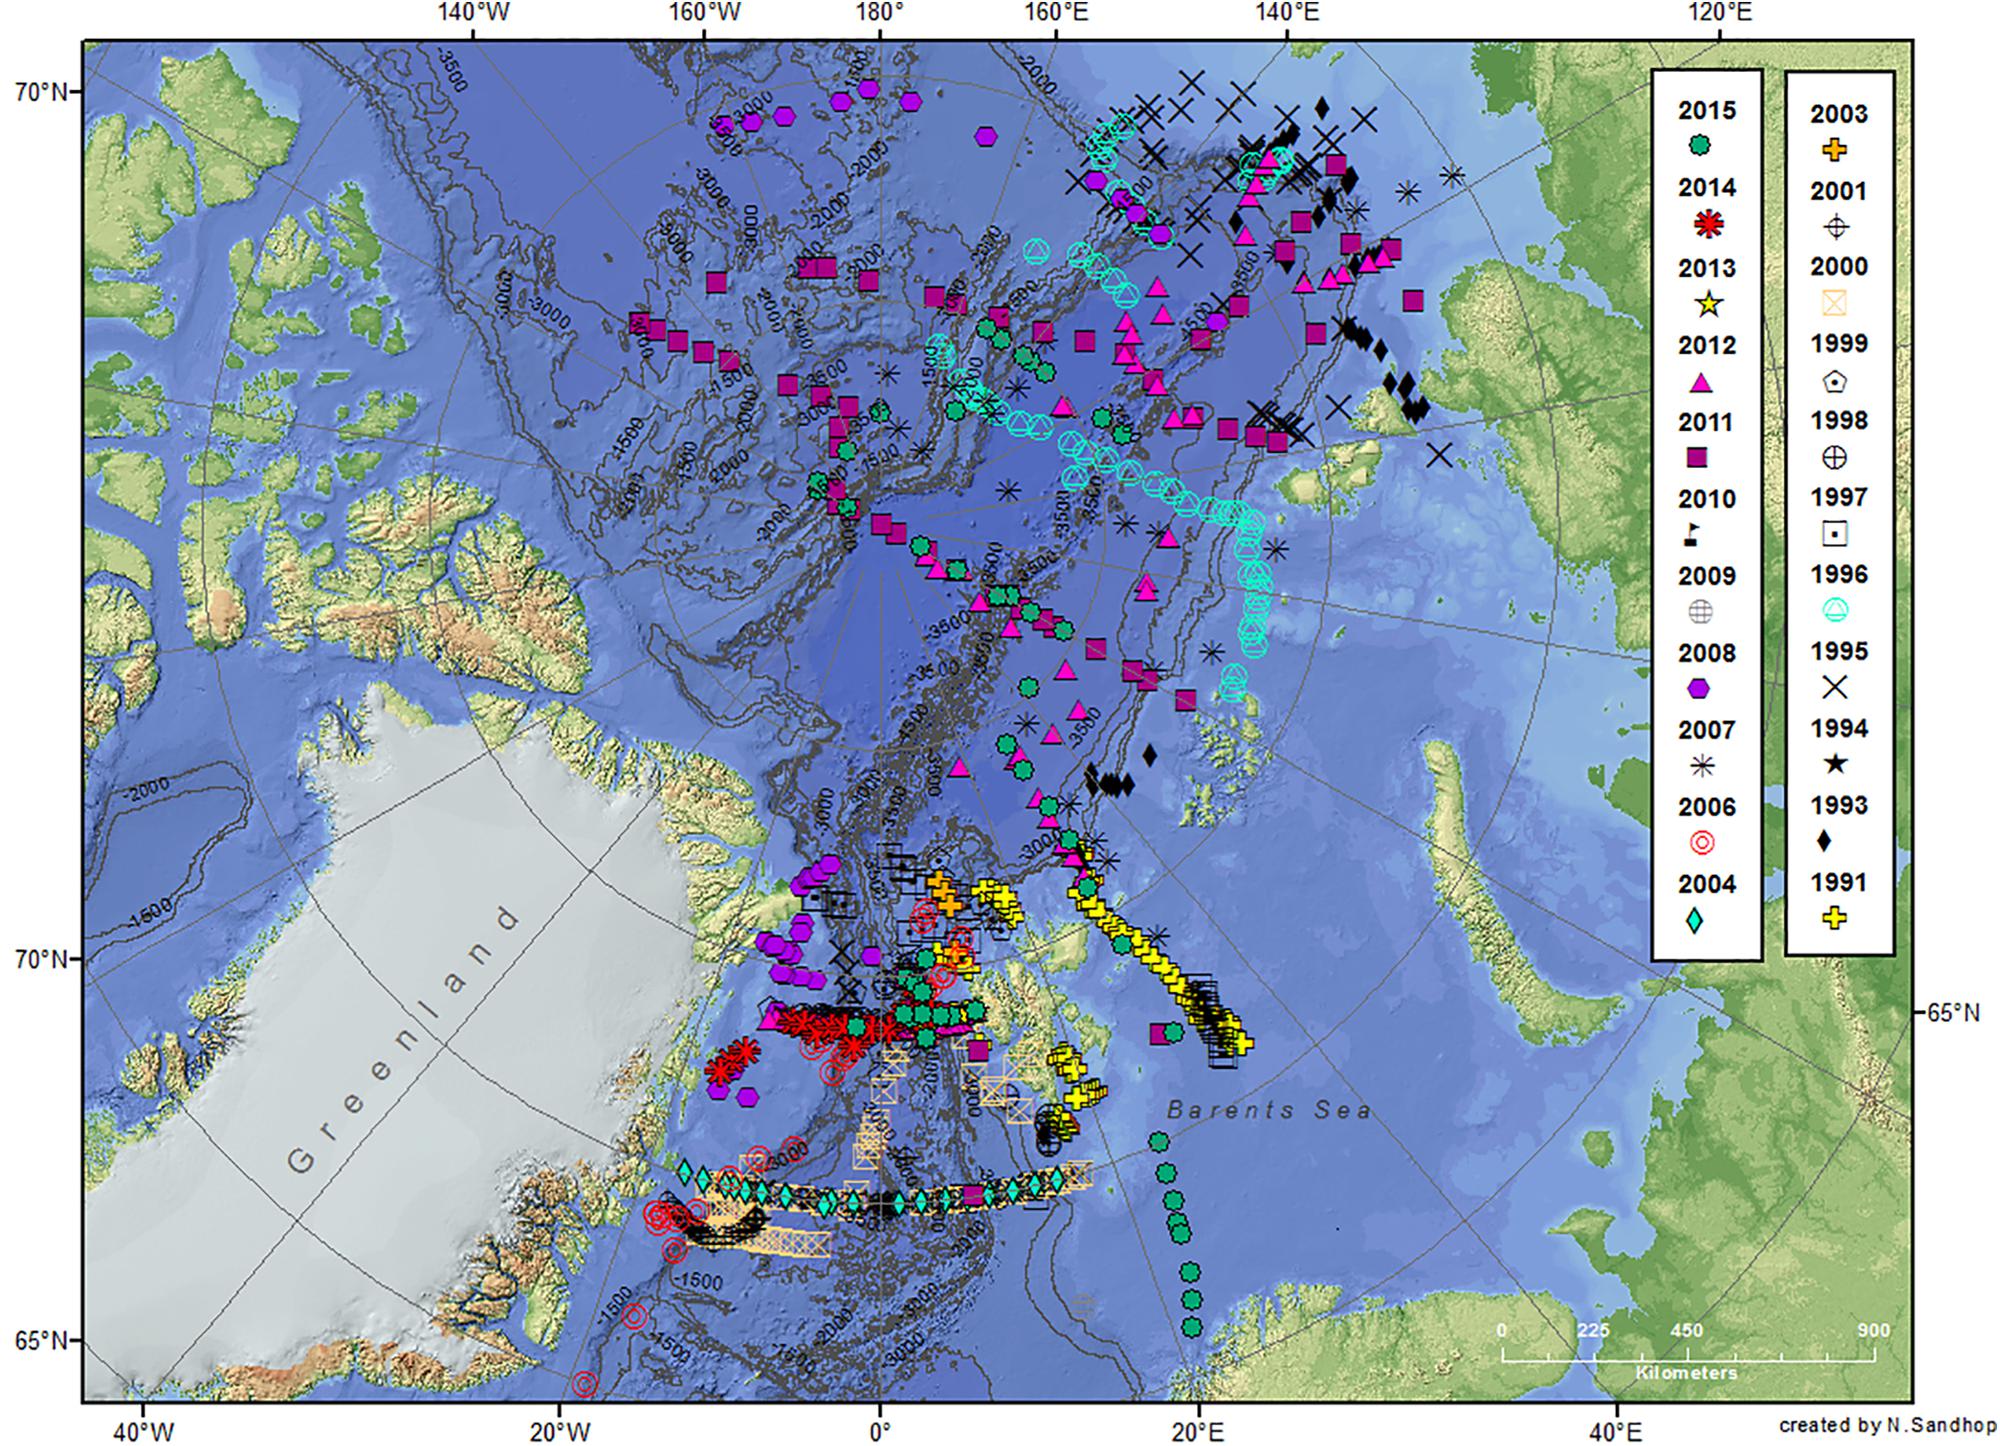
Figure 1. Stations occupied during the different summer expeditions on board RVs Polarstern, Maria S Merian and Lance to the Arctic Ocean and the Fram Strait between the years 1991 and 2015. Details for each expedition can be found in the Supplementary Tables S1, S2. The map was created using ArcGIS and based on the General Bathymetric Chart of the Oceans (GEBCO)-08 grid, version 20100927, http://www.gebco.net, with permission from the British Oceanographic Data Centre (BODC) with the help of Nadja Sandhop. More details can also be obtained by maps produced by AWI: https://maps.awi.de/map/map.html?cu=chl_a_water_ column_main#home.
All seawater samples were collected at five to eight water depths between the sea surface (2–10 m) and 100 m using a rosette equipped with a SEA-BIRD CTD system and 24 Niskin bottles (12 L). While the sampling depths were not always constant, samples were consistently taken at the surface, as well as above, in, and below the Chl a maximum (according to the fluorescence probe that was attached to the CTD) during casts, with 100 m being the deepest sample. Seawater subsamples were collected in PE bottles and filtered on board immediately after sampling. In few cases (<5%) samples were not taken in 100 m water depth. In these cases a 100 m value from nearby stations was used, or the values of 90 m were taken for the 100 m in order to always allow an integration from 0 to 100 m water depth.
Sampling for Chl a was conducted during 33 cruises (22 summers, at 864 stations, 6588 data points) while sampling for POC was conducted during 24 cruises (19 summers, at 472 stations, 2469 data points; Table 1, Figures 2, 3). Subsets of the dataset (mainly Chl a data) from the Fram Strait and the central AO have been published with a different focus elsewhere (Cai et al., 2010; Cherkasheva et al., 2013, 2014; Nöthig et al., 2015b; Soltwedel et al., 2016; Engel et al., 2019). All Chl a and POC data are available in PANGAEA (Chl a: Nöthig et al., 2015a, 2018 and POC: in prep., and Supplementary Table S4). In addition to the here presented integrated data of the different stations a table of the data of Chl a and POC concentrations measured at the discrete depths is attached in the Supplementary Material as an excel spreadsheet. Combined vertical profiles of the datasets for the different regions are shown with standard deviation in the supplements (Supplementary Figure S1).
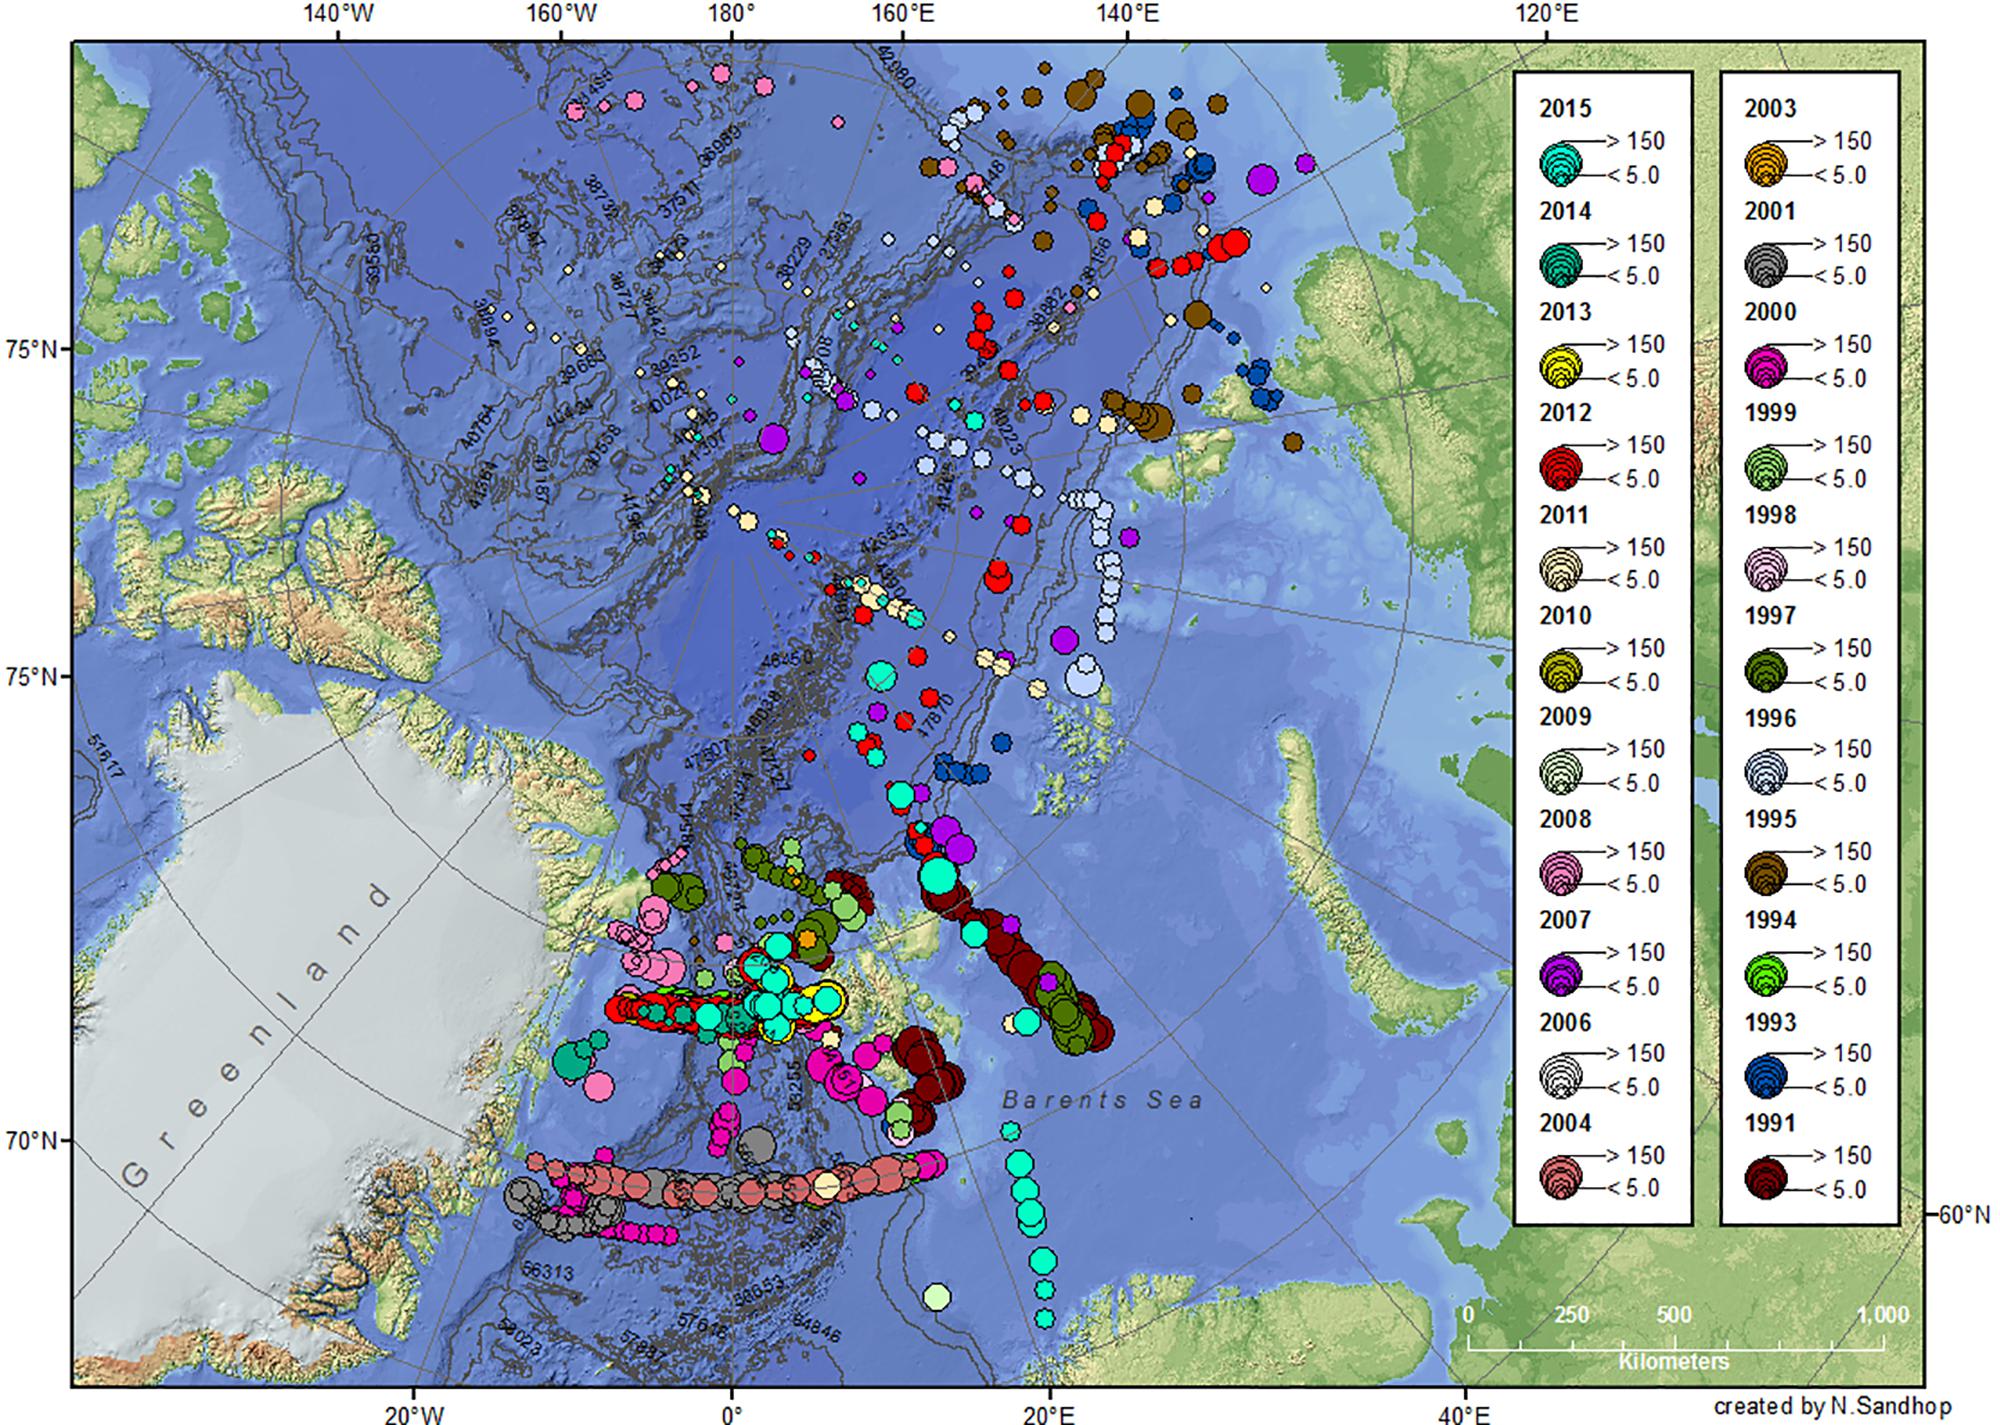
Figure 2. Chl a (mg m–2) integrated over 0–100 m water depth from 1991 to 2015. For more details see legend Figure 1.
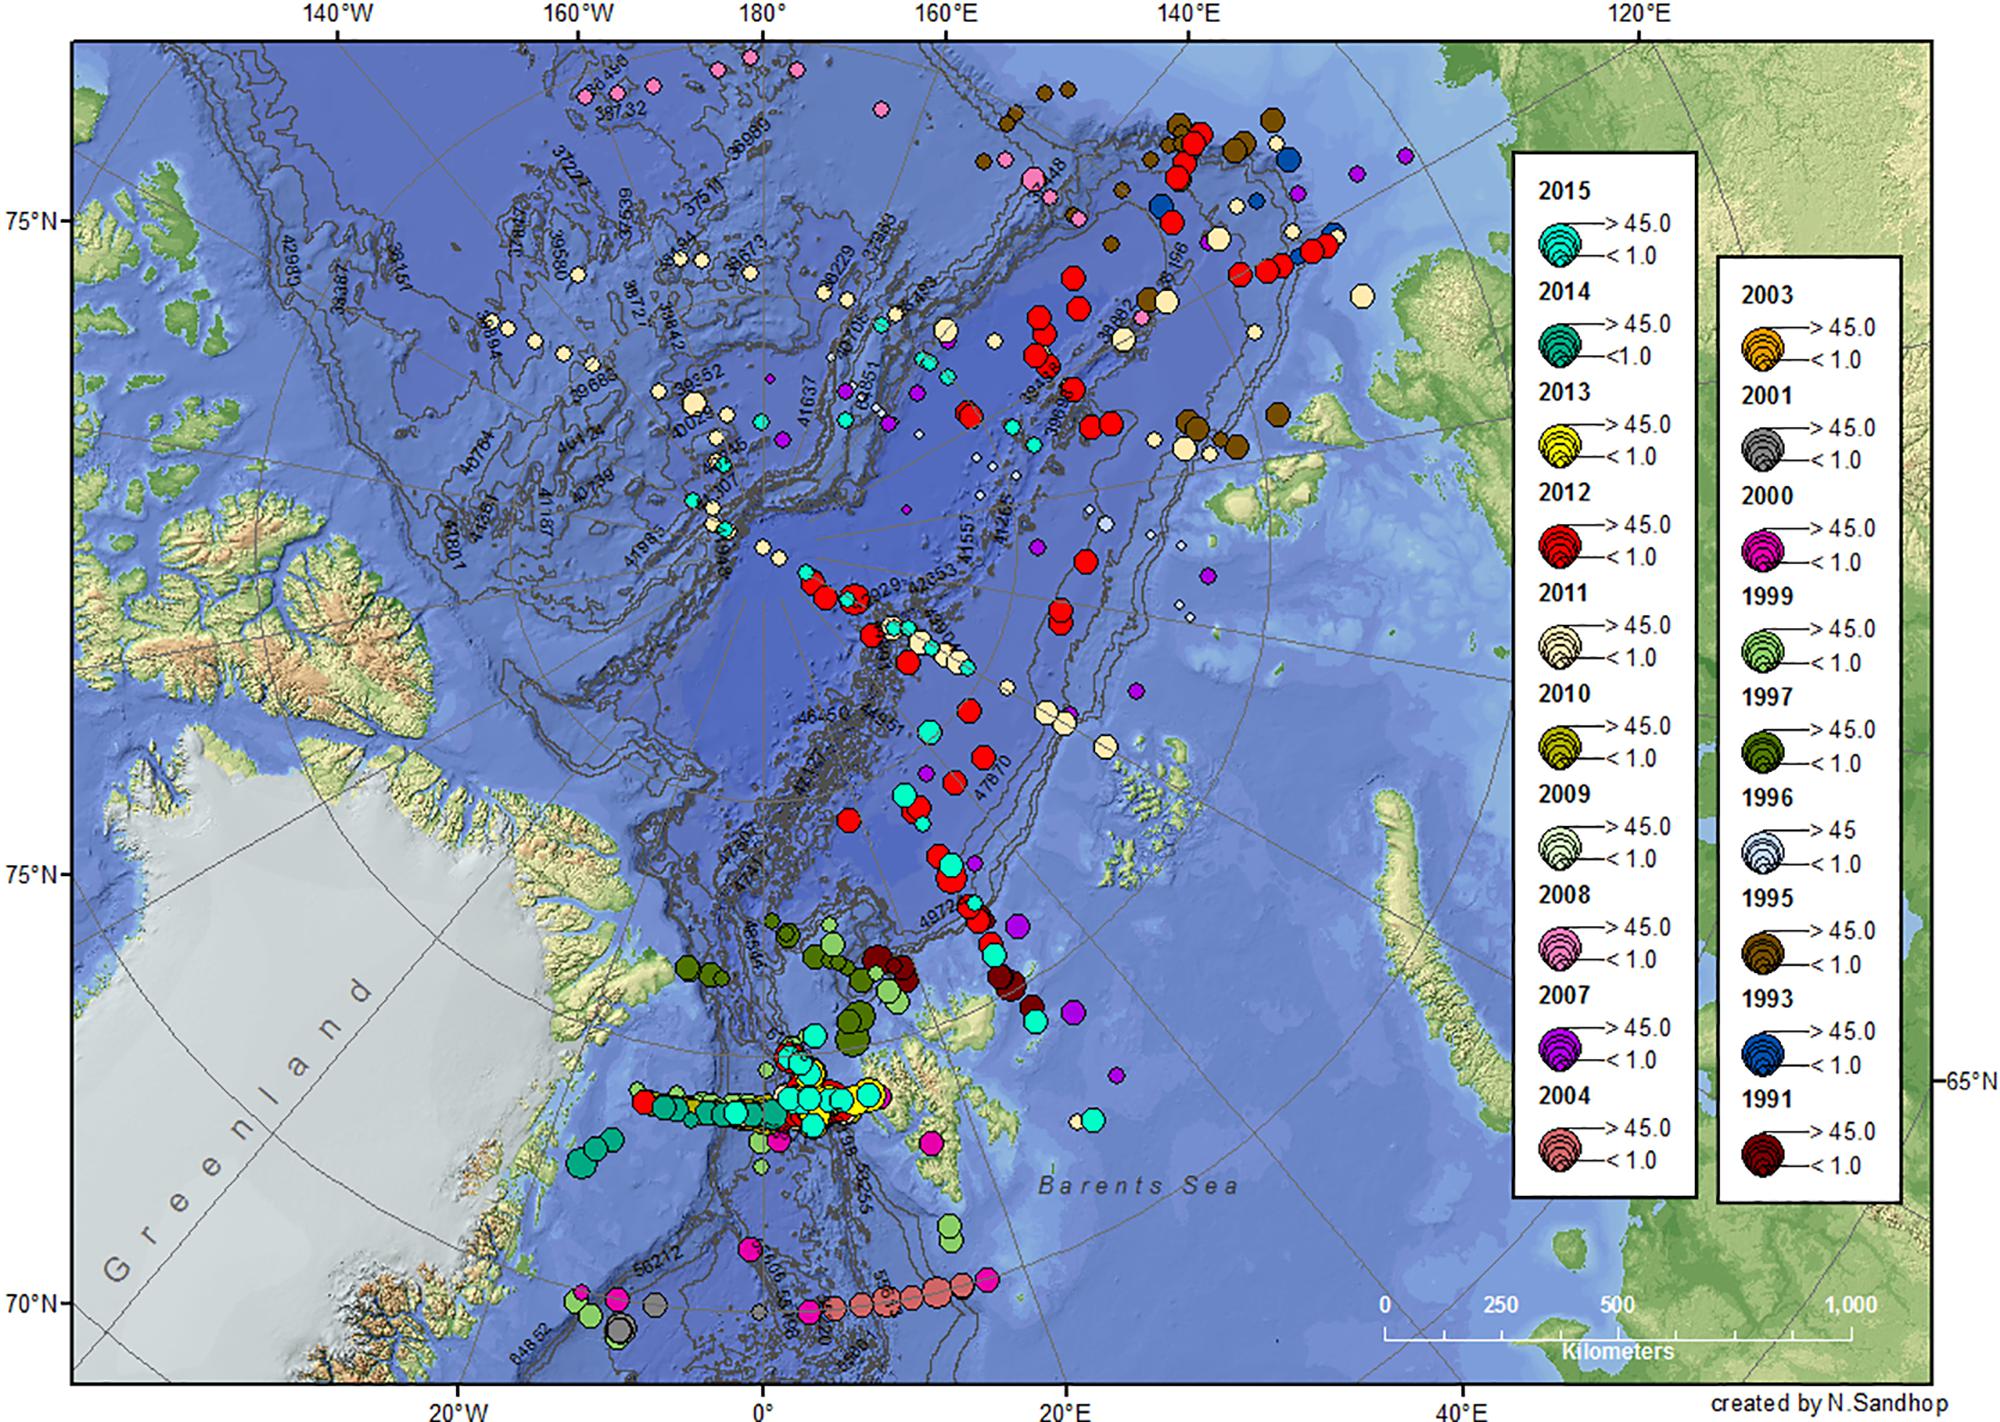
Figure 3. POC values (g m–2) integrated over 0–100 m water depth from 1991 to 2015. For more details see legend Figure 1.
Chlorophyll a
Chlorophyll a concentrations were determined from 0.25 to 2 L of seawater filtered onto glass fiber filters (Whatman GF/F) under low vacuum (<400 mbar). Filters were stored at −20°C until analysis. During 1991, 1993, and 1996 filters were analyzed on board; filters of all other cruises were analyzed in the home laboratory after the ship has returned to Bremerhaven about 3–4 months after the cruise. Pigments were extracted in 5–10 ml of 90% acetone. In order to destroy the cells, filters were treated with an ultrasonic device in an ice bath for less than a minute, and further extracted at 4°C for 2 h. After 2012 the cell disruption was carried out with a Precellys® 24. All filters were then centrifuged for 10 min at 5000 rpm at 4°C prior to Chl a measurement on a fluorometer (Turner Designs) using a modification of the method described in Edler (1979); Evans and O’Reily (1980).
Particulate Organic Carbon
Particulate organic carbon contents were determined by filtering aliquots of 1–10 L of seawater at low vacuum (<400 mbar) onto GF/F filters (pore size: 0.7 μm) pre-combusted for 4 h at 500°C. Filters were also stored at −20°C until analysis in the home lab after the ship has returned to Bremerhaven about 3–6 month after the cruise. Prior to analysis, filters were soaked in 0.1N HCl for removal of inorganic carbon and dried at 60°C. POC concentrations were determined with a Carlo Erba CHN elemental analyzer.
WebGIS
In this study we only use the data of Chl a and POC that were integrated from 0 to 100 m (Figures 2, 3). In addition to the here presented data on standing stocks, Chl a and POC (1991 to 2016) are displayed in WebGIS (licensed under CC BY 4.0) with another focus for instance Chl a concentrations in the Chl a maximum, Chl a mean concentrations obtained at 0–10 m and 0–50 m depths, and POC mean and integrated concentrations at 0–100 m depths. Furthermore, gridded interpolations of integrated Chl a values from 0 to 100 m were created for the long-term dataset of the Fram Strait on either a yearly basis or over selected time periods. In addition, sea ice concentrations and sea surface temperatures can be used as overlay. Further details are available at: https://maps.awi.de/awimaps/projects/public/?cu=chl_a_water_column_main#home.
Statistics
To evaluate differences of one or more regions in Chl a and POC concentrations, non-parametric Kruskal–Wallis tests were performed. For the significant Kruskal–Wallis tests, pairwise Wilcoxon tests were used to identify which sub-basins differed significantly to the others. A second analysis intended to compare the correlation between Chl a and POC in the Fram Strait and central Arctic Ocean sub-basins (Supplementary Table S3). For this, both concentrations were log-transformed and the regressions were tested by Pearson or Spearman tests (Spearman, 1904) following initial conditions (normal distribution, homoscedasticity).
Results
Spatial Distribution of Chl a and POC Stocks
In order to assess differences in Chl a and POC standing stocks of different arctic geographical provinces during summertime, stations sampled were separated into seven sub-geographical regions: the ESF and the western Fram Strait (WFS), the Barents Sea (BS), the Eurasian shelf (ESf), the Nansen Basin (NB), the Amundsen Basin (AmB), and the Amerasian Basin (AB, including Makarov and Canada basins). The separation of the WFS and EFS was done by the 0° meridian. During most of the cruises, Polarstern sailed through partially or totally ice-covered regions, especially in the central AO (see also Figure 7, upper panel). The spatial distribution of Chl a and POC standing stocks showed a clear difference between the Fram Strait and Barents Sea with higher concentrations compared to all other regions, especially the AO sub-basins (Figures 2–4).
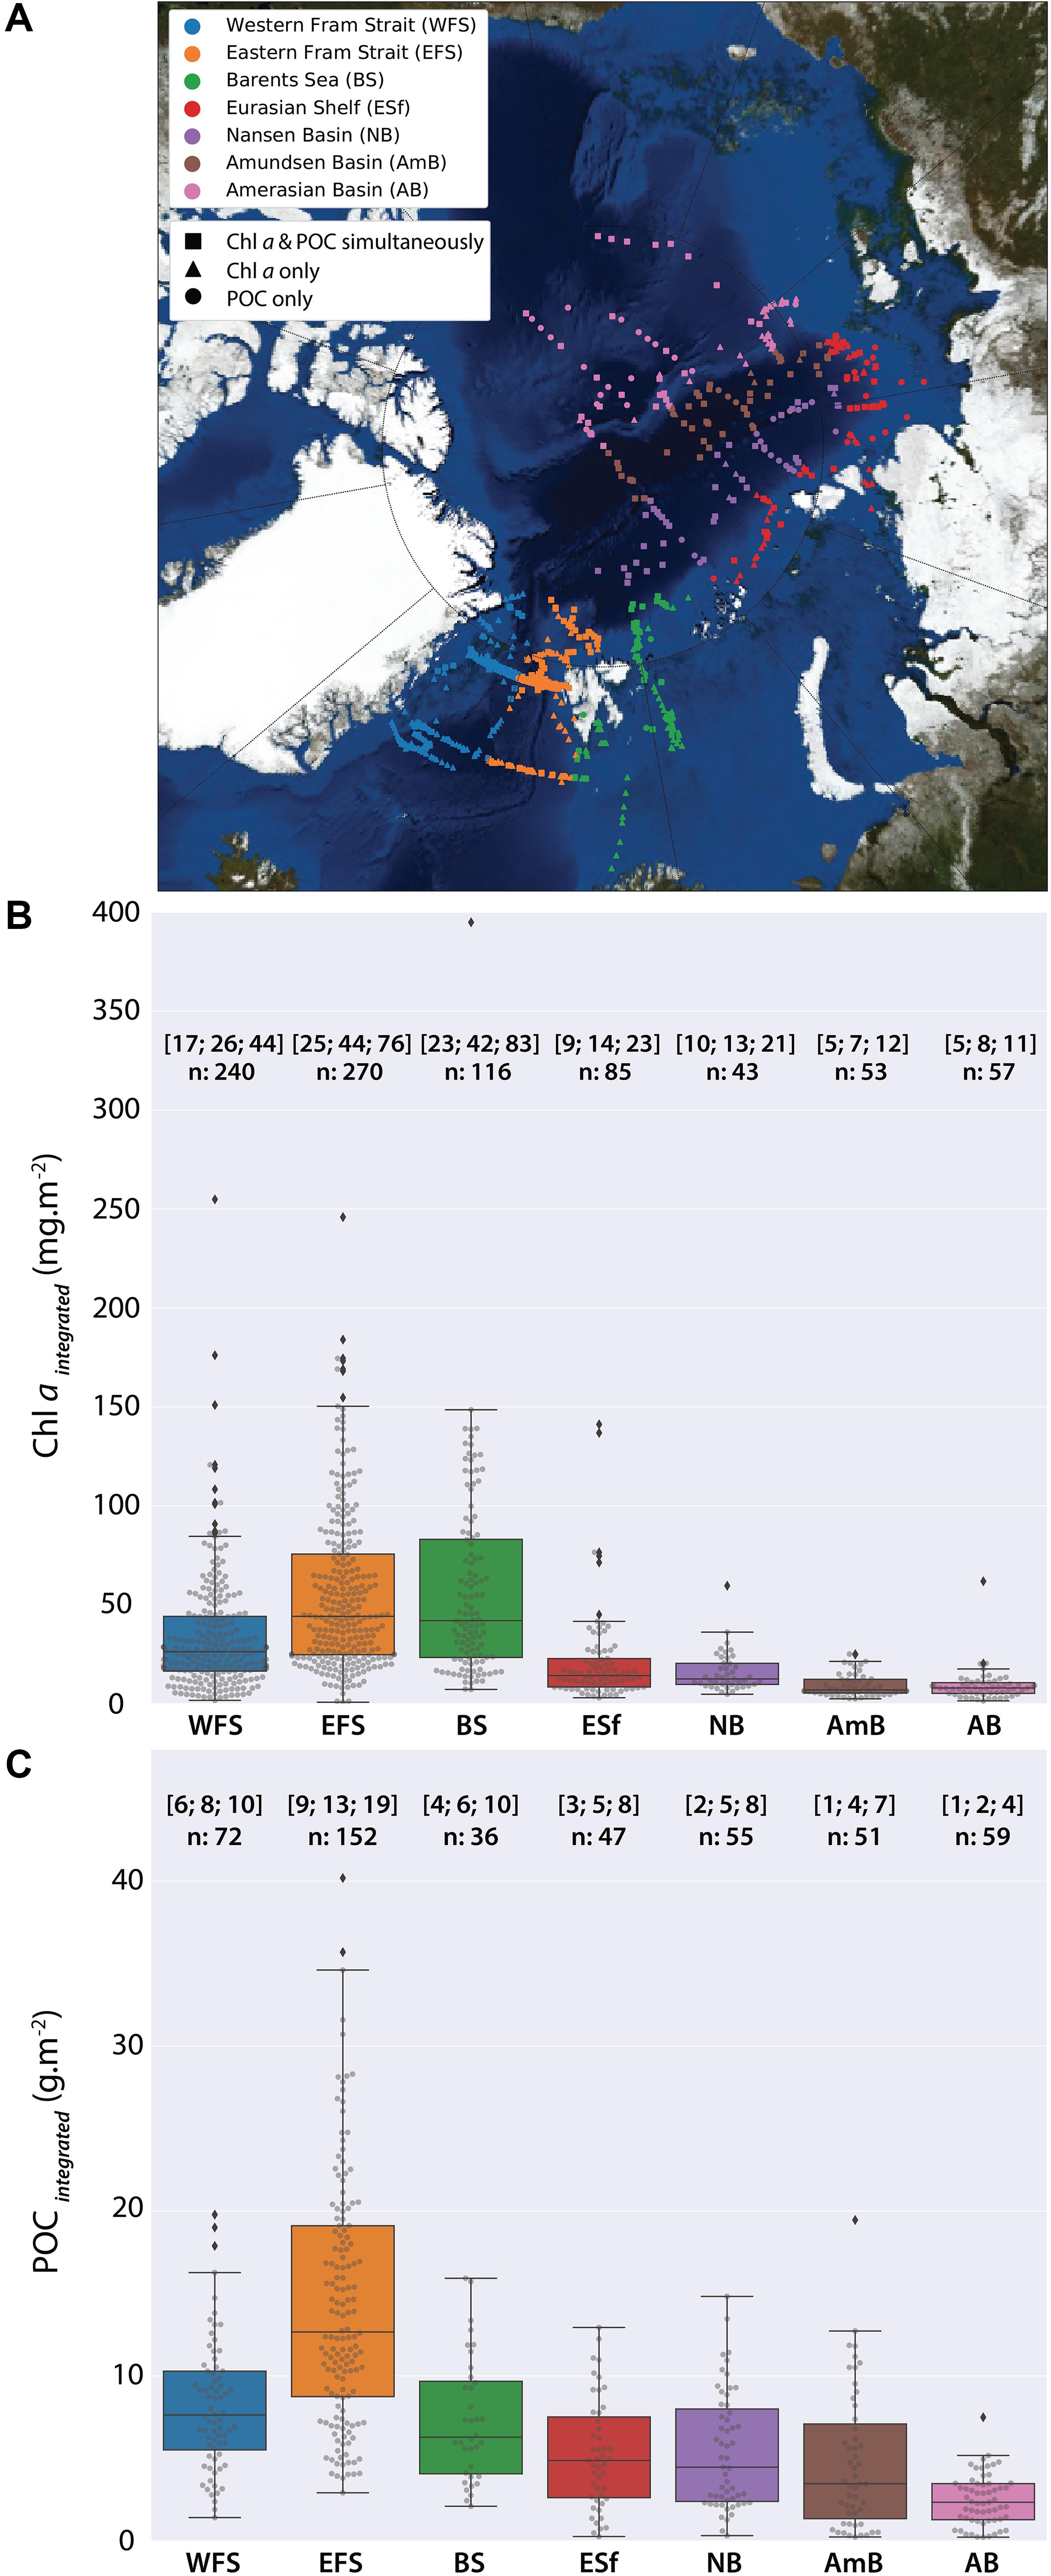
Figure 4. (A) Sub-regions for the comparison of regional differences. Western Fram Strait (WFS), eastern Fram Strait (EFS), Barents Sea (BS), Eurasian shelf (ESf), Nansen Basin (NB), Amundsen Basin (AmB), and Amerasian Basin (AB, including Makarov and Canadian basins); (B) Chl a values (mg m–2) and, (C) POC values (g m–2) integrated over 0–100 m from 1991 to 2015. Black line represents the median; numbers in the brackets on the top are the 1st, 2nd (median), and 3rd quantile, n, number of data points.
The highest standing stocks of Chl a were observed in the EFS and in the BS (median 44.2 and 42.0 mg m–2, respectively), followed by the WFS with standing stocks nearly twice as low (median 26.3 mg m–2) (Figure 4B). In all other regions of the Arctic Ocean, Chl a concentrations were low, with median Chl a values of 14.3 mg m–2 for the ESf regions, 12.6 mg m–2 for the NB, 7.0 mg m–2 for the AmB, and 8.0 mg m–2 for the AB (Figure 4B).
Particulate organic carbon stocks displayed less spatial variability than Chl a. The highest median POC concentrations of 12.7 g m–2 was observed in the EFS. All other regions exhibited median concentrations below 8 g m–2, ranging between 2.3 g m–2 in the AB and 7.6 g m–2 in the WFS. The BS had median POC concentrations of 6.3 g m–2 similar to those in the WFS. For the ESf regions, the NB, and the AmB, the median POC concentrations were similar (4.9, 4.3, and 3.5 g m–2, respectively; Figure 4C).
The log transformed POC and Chl a data in the EFS were significantly correlated (Spearman test; p < 0.001). The WFS and the NB also showed a significant correlation. The correlations were much weaker in the BS (p = 0.19) and the ESf (p = 0.09), nearly no statistically significant correlations were found for the AmB and the AB (Figure 5 and Table 2). However, when all data are plotted a close relationship of the two parameters are obvious.
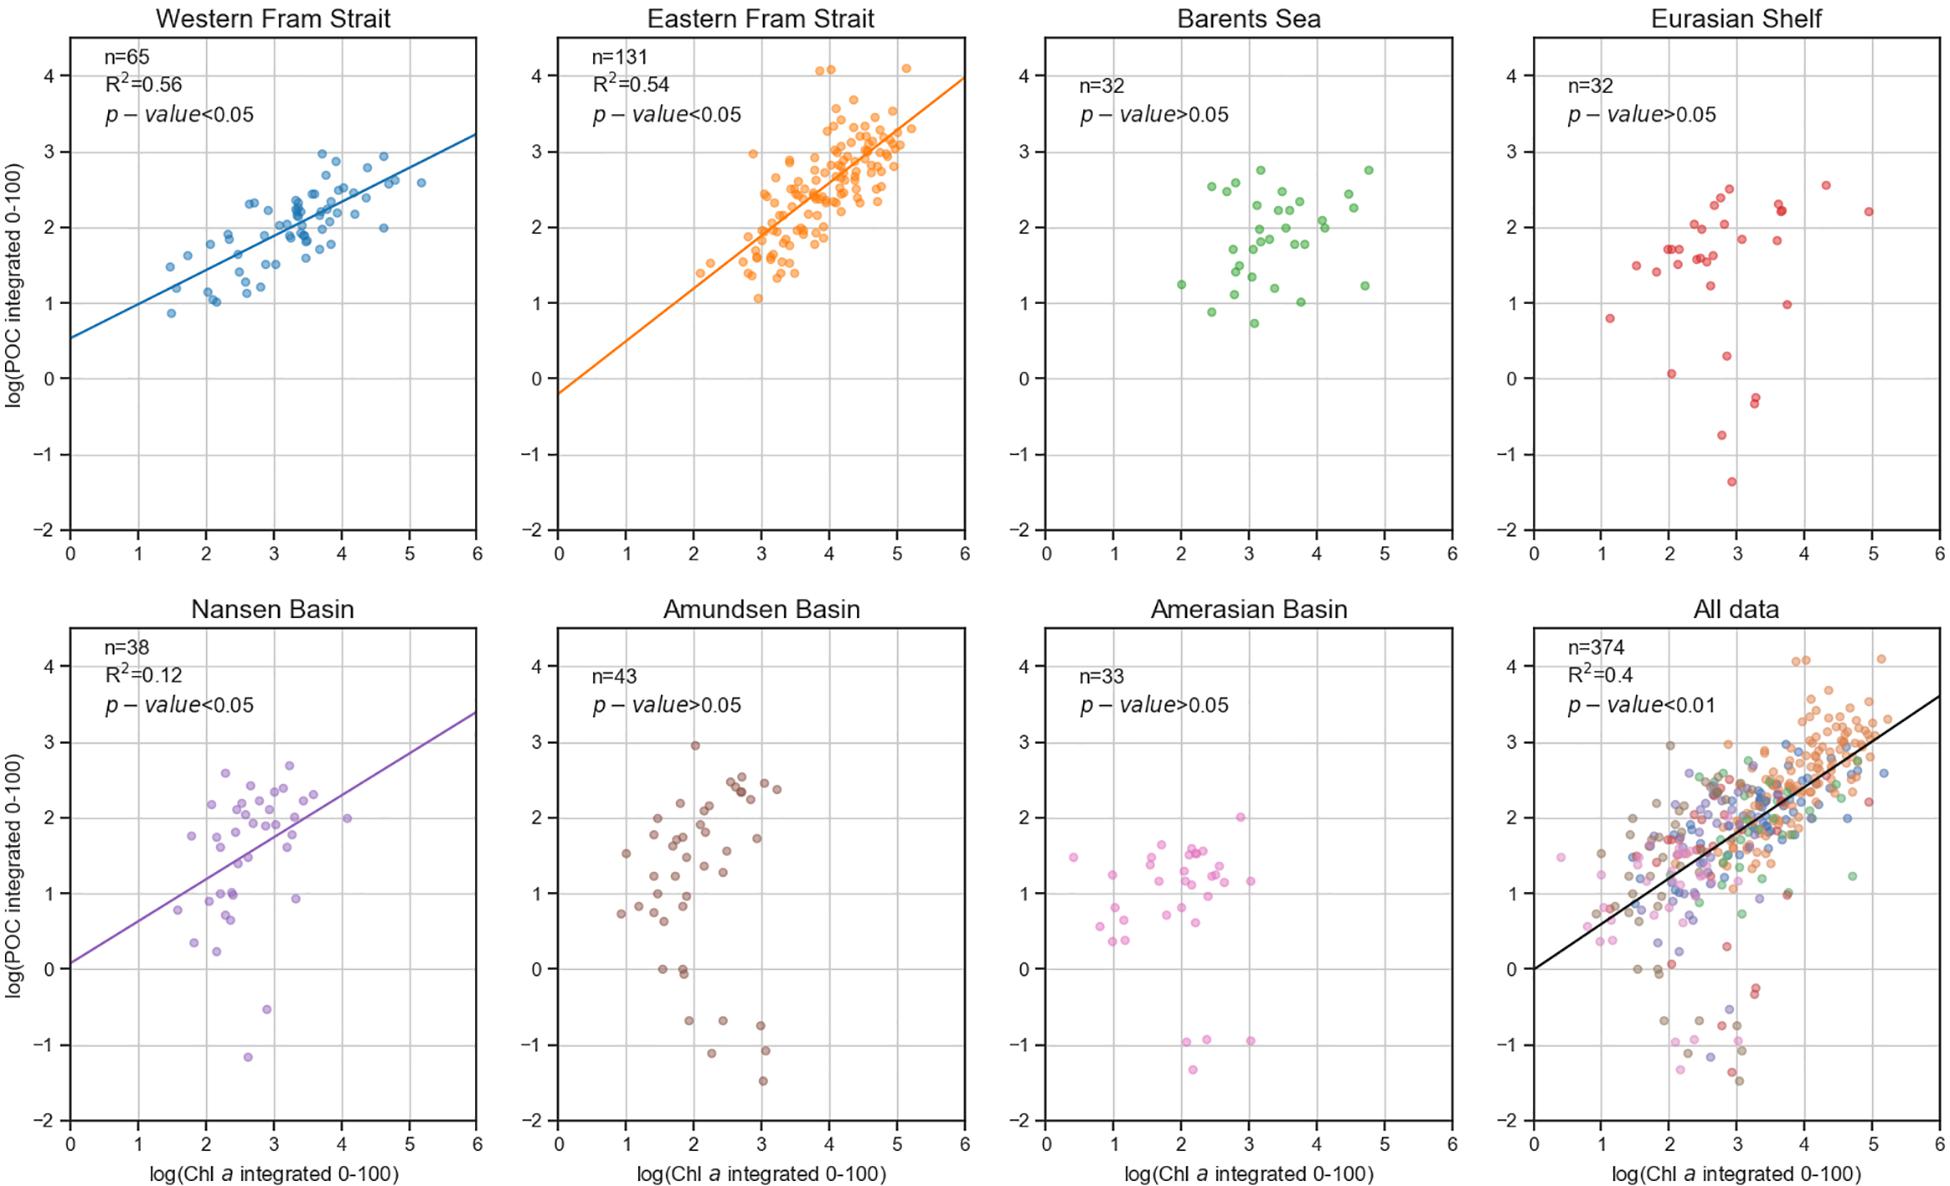
Figure 5. Logarithmic relationship between Chl a and POC values for each sub-region sampled from 1991 to 2015. Statistics are shown in Table 2.
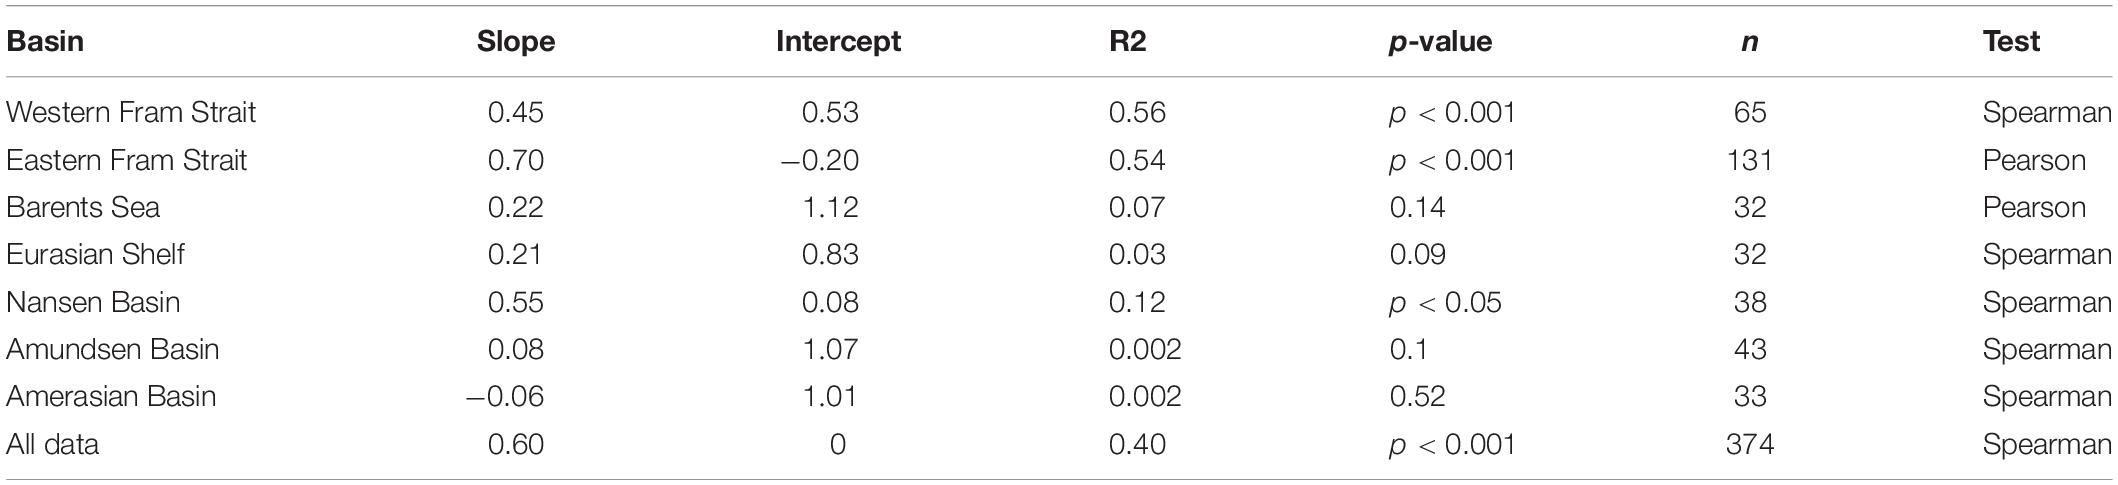
Table 2. Log POC/Chla correlations of samples taken during 19 summer expeditions with RVs Polarstern, Maria S Merian and Lance to the Central Arctic Ocean and the Fram Strait including parts of the Greenland Sea between 1991 and 2015.
Long-Term Patterns of Chl a and POC Stocks
Due to the fact that we have not always taken samples during the same days and not always at the same positions during all expeditions direct comparisons are possible only locally. Nevertheless, in the areas where we had the highest sampling density, here for the Fram Strait and for the central AO, we detected differences which are possibly trends over the more than 20 years of study period. According to the duration of the respective expeditions (Table 1) we chose the stations in the EFS and WFS during July and the NB and AmB during August/September. Thus, only few Chl a and POC stock values obtained during the same time interval and in the same region were left to analyze long-term trends (Table 1 and Figure 6).
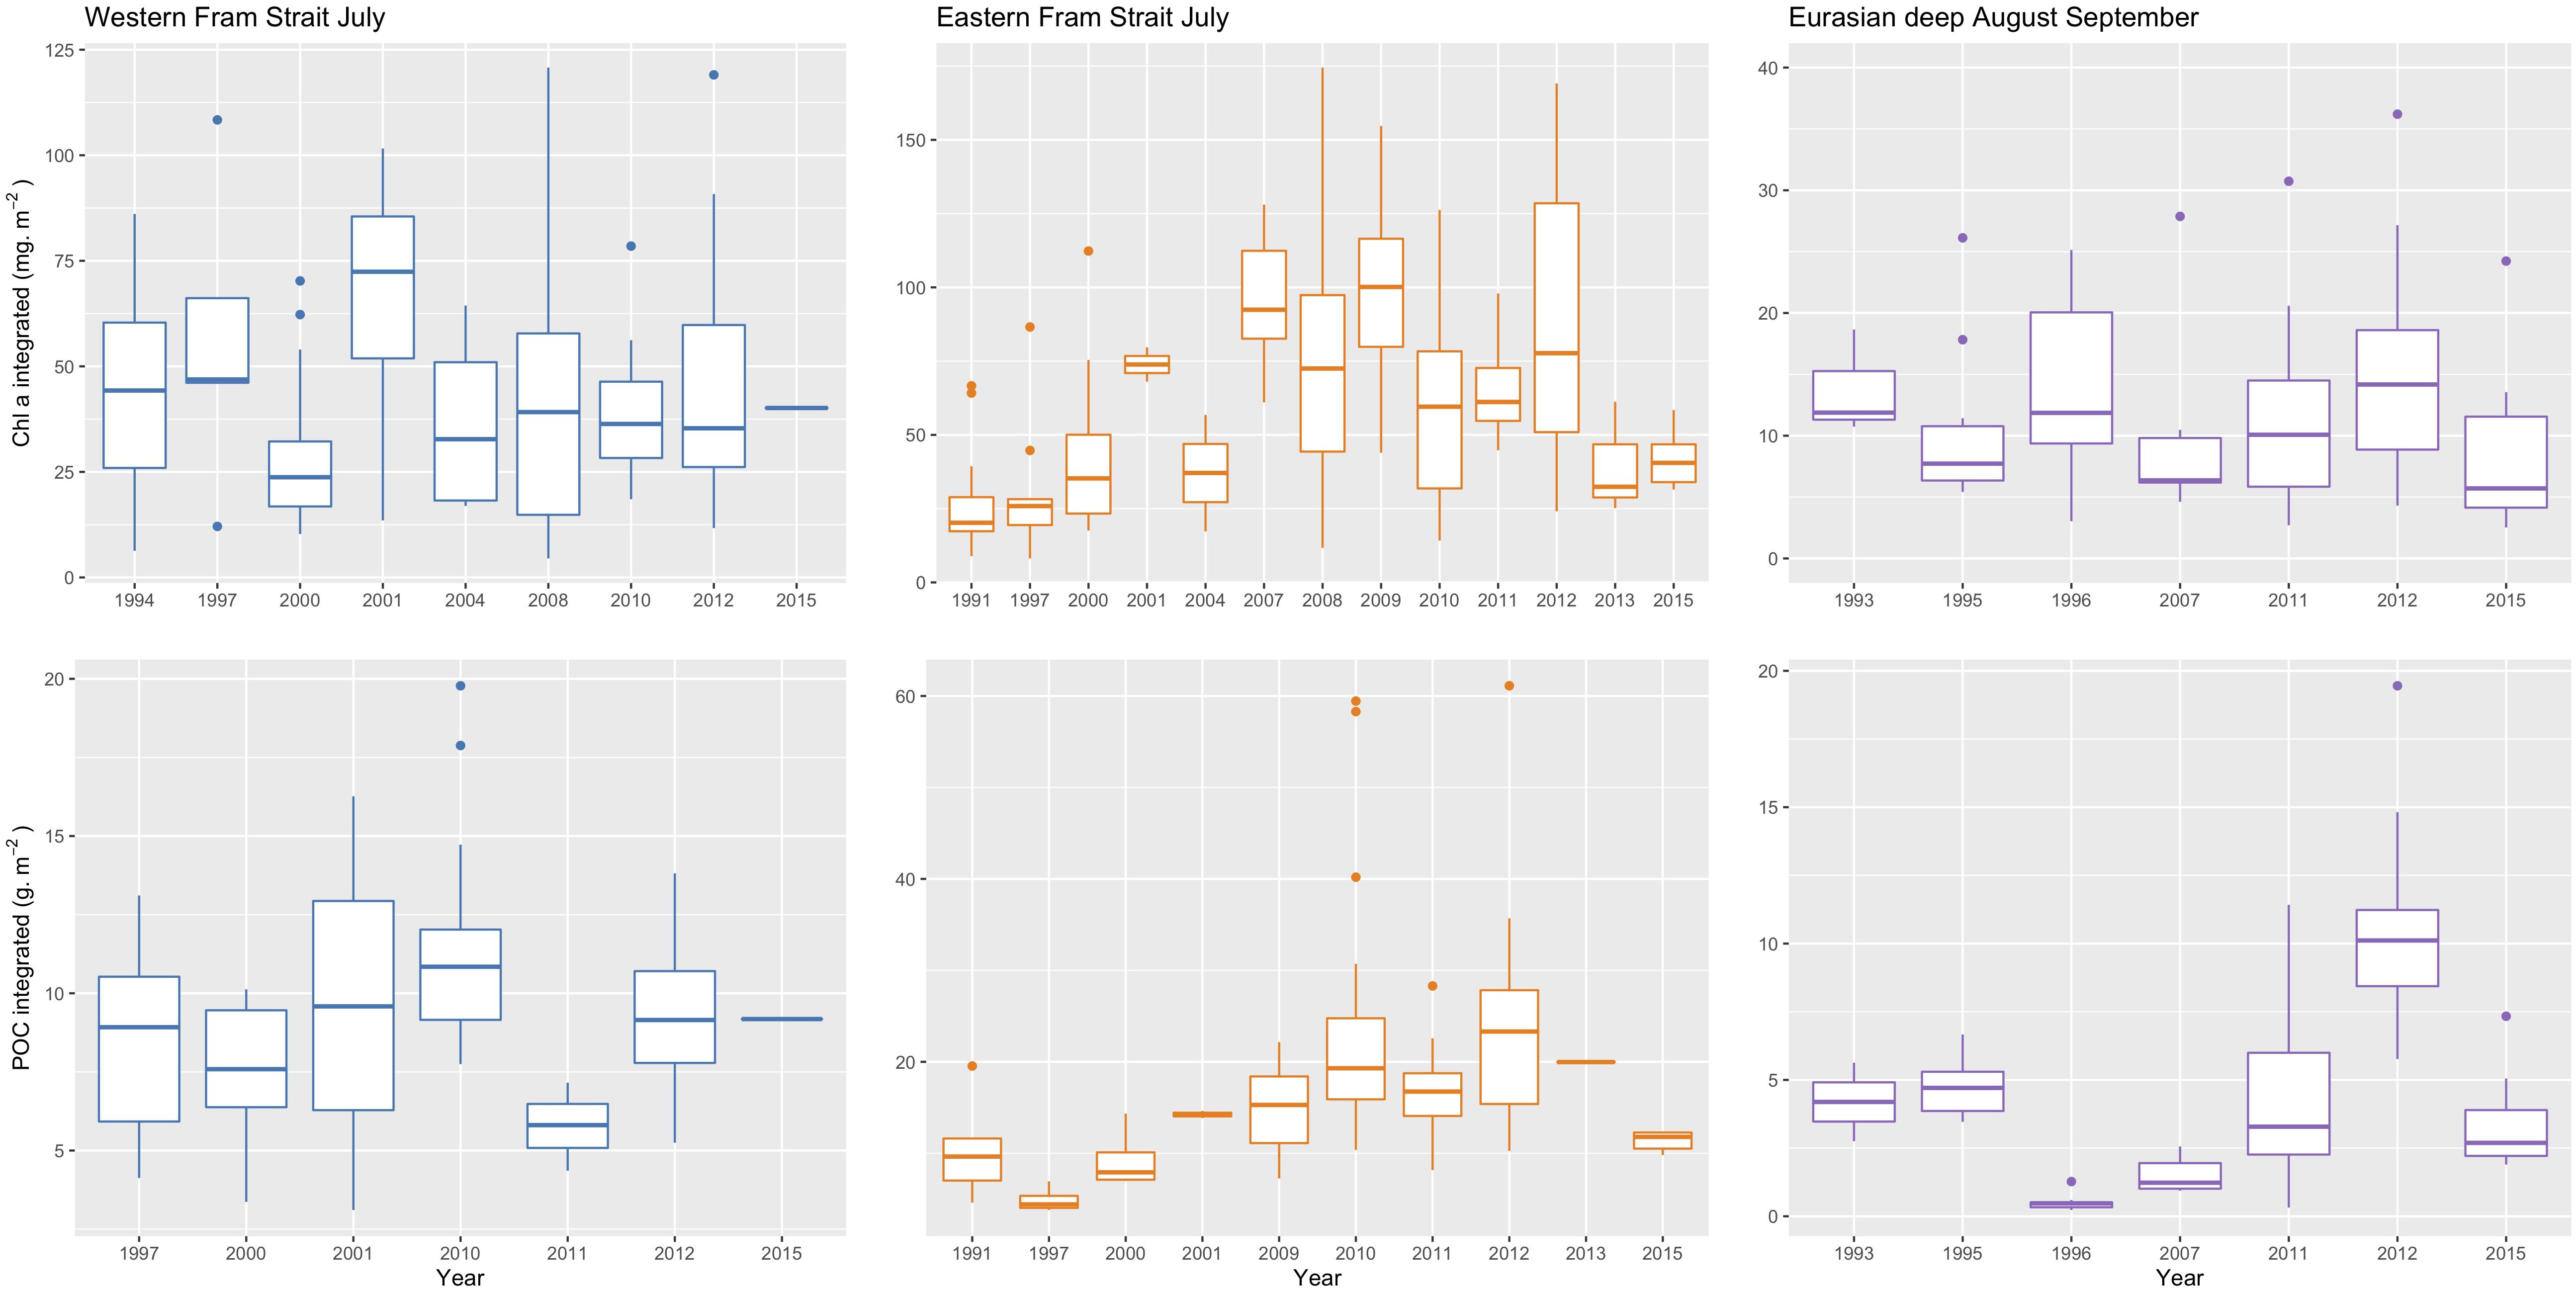
Figure 6. Trends in upper: Chl a values (mg m–2) and lower: POC values (g m–2) integrated over 0–100 m water depth in the Fram Strait during July 1991–July 2015 and, the Eurasian Basin during August/September 1993–2015. Note the different scales.
In the EFS, an increase in Chl a stocks was observed until 2009, after which July median values decreased but never reached values as low as before 2000. Similar patterns were observed for POC stocks. No trends in Chl a stocks were observed for the WFS and the deep Eurasian Basin. Whereas in the WFS POC standing stocks showed no trends, we suspected an increase of POC in the central AO due to less sea ice. In order to assess the influence of shrinking sea ice on POC standing stocks in the central AO, data collected during the eight expeditions to the high Arctic regions were compared (Figure 7). The high latitude stations were separated into three zones (85°–90°N, 80°–85°N and < 80°N). An increase in the POC inventory was observed in all regions under reduced sea ice conditions, with the most pronounced augmentation observed north of 85°N. Chl a summer standing stocks were not shown because no such change was observed. In 2015 Chl a summer standing stocks were even lower than in other years due to a thick snow cover on top of the sea ice.
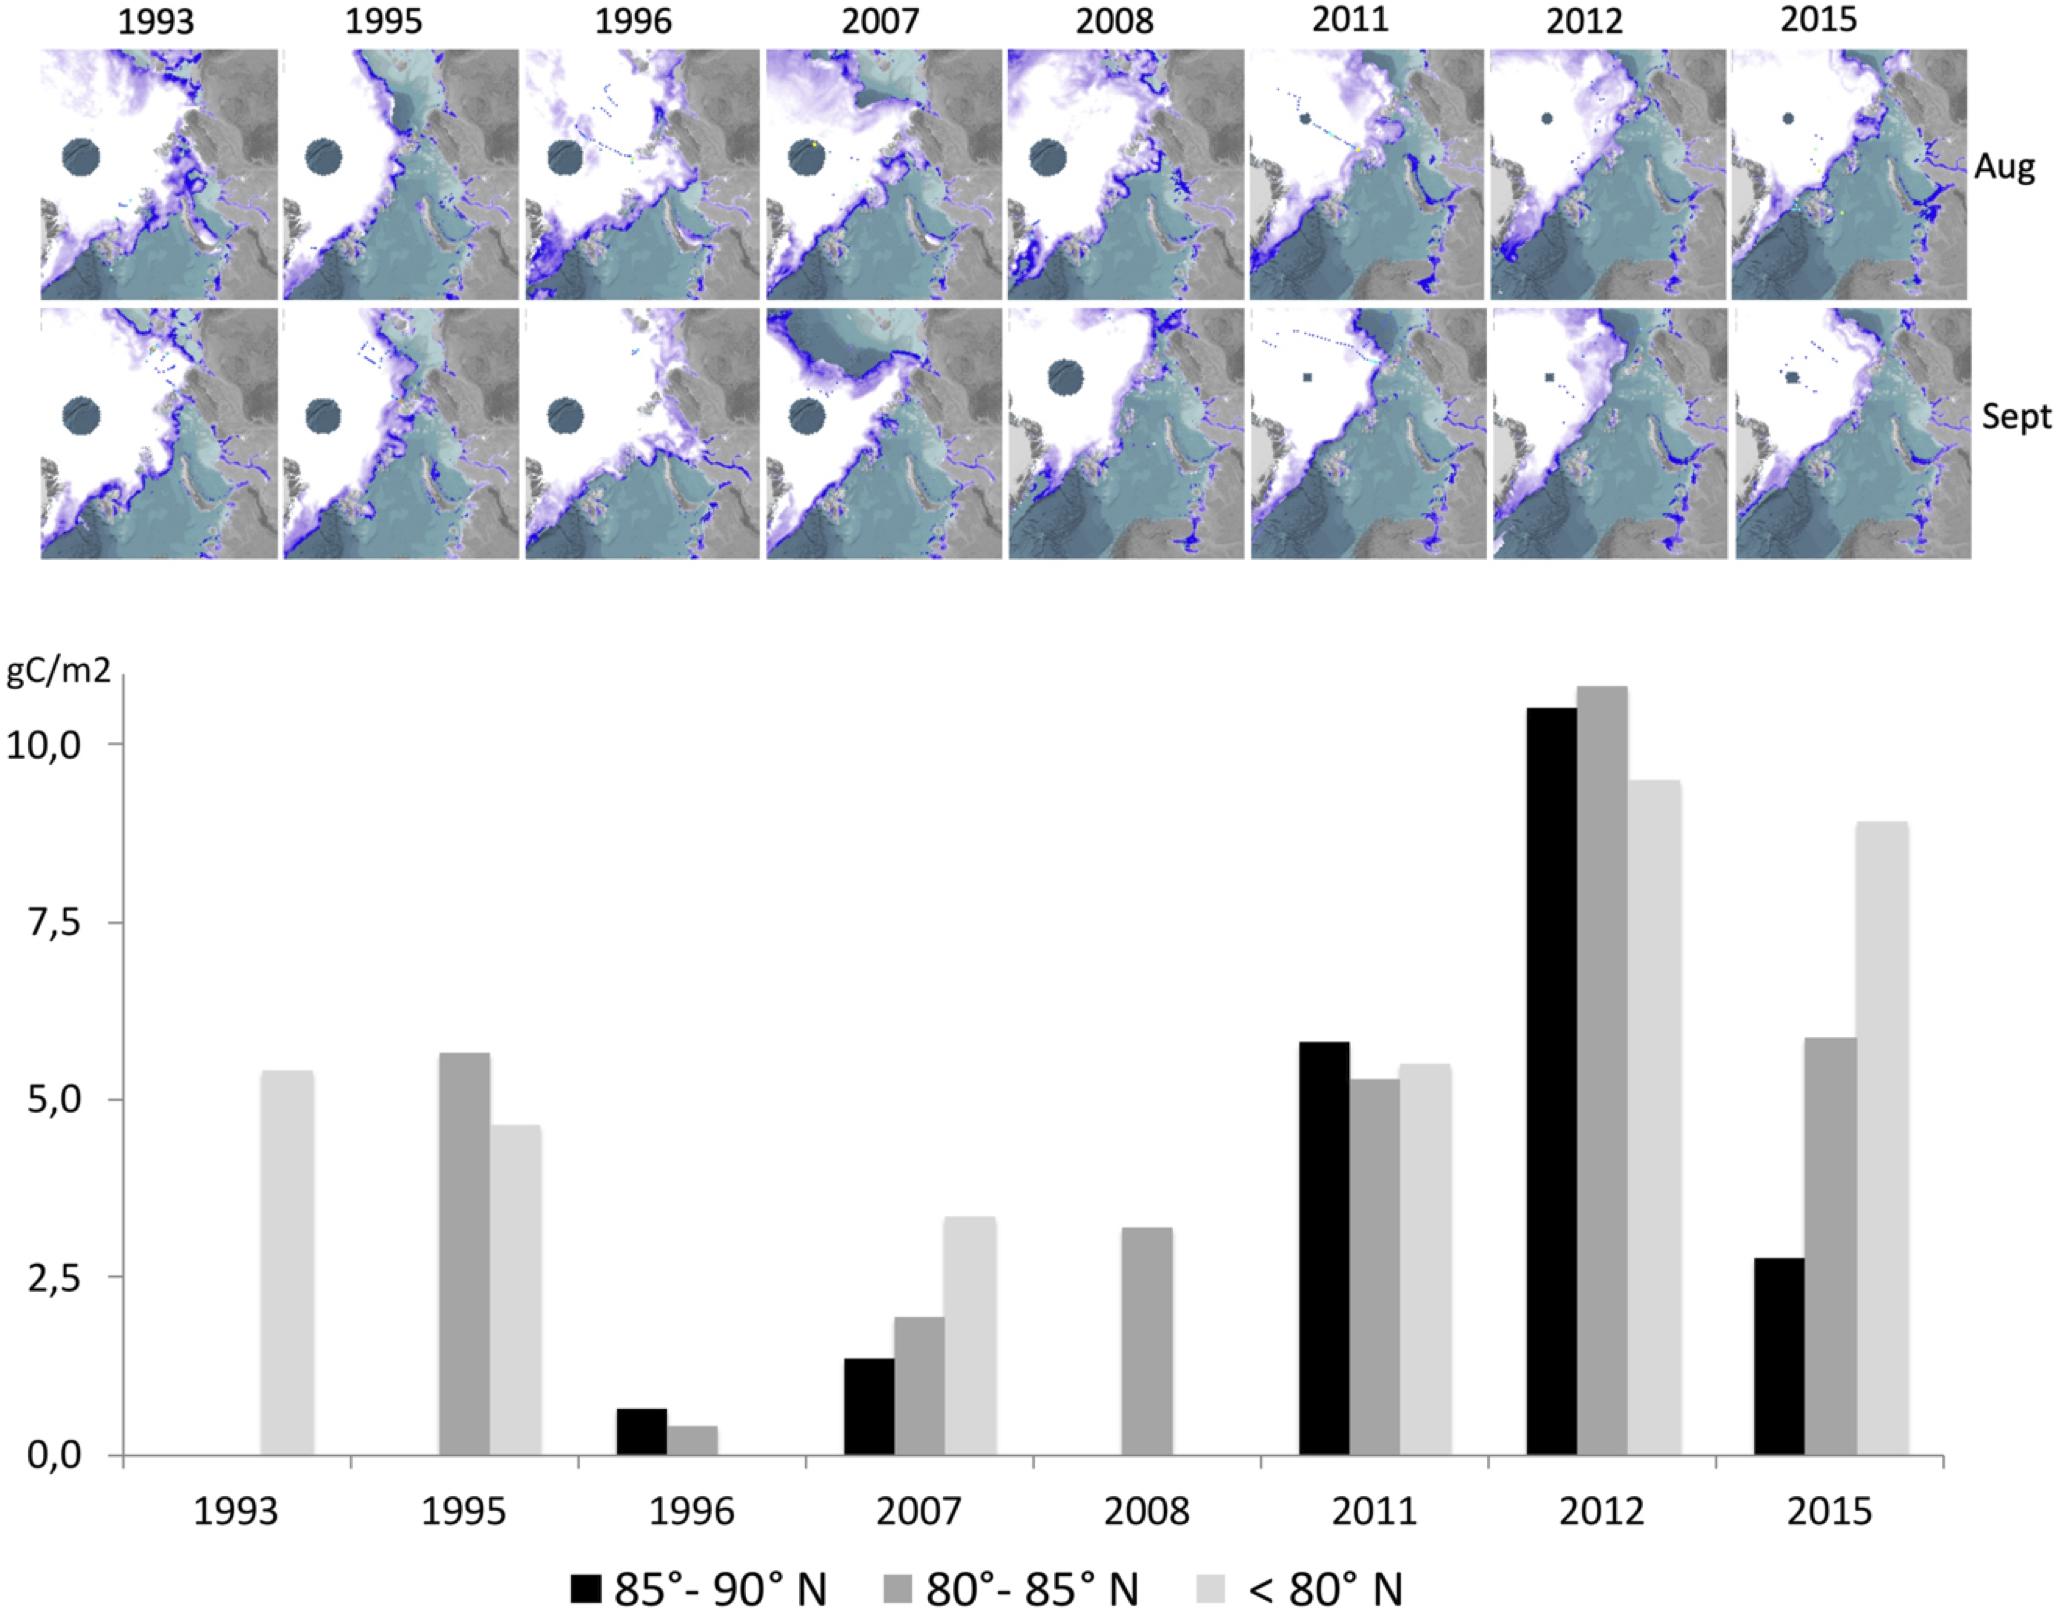
Figure 7. Upper: Sea ice extent for investigated years during September and August, small dots indicate stations; lower: comparison of POC integrated 0–100 m water depth obtained in August and, September 1993 – 2015 (8 expeditions) at different latitudes (°N) in the central Arctic Ocean (85°–90° N, 80°–85° N and < 80° N). Data are available only for < 80° N for 1993, < 80°N and from 80° to 85°N for 1995, and from 80° to 85°N for 2008. Sea ice concentration were obtained from http://www.meereisportal.de (grant: REKLIM-2013-04); (Spreen et al., 2008).
Discussion
While the AO is experiencing rapid changes, field measurements are relatively rare in the central AO due to the strongly limited accessibility, caused by thick multi-year ice (Polyak et al., 2010). Although the presented dataset includes data from the ice-covered central AO it has limitations due to heterogeneity of sampling areas particularly for the central AO. Summertime Chl a standing stocks decreased from the EFS, the BS and shelf regions toward the central AO basins (Figures 2, 4B), lowest values were recorded at the few stations sampled in the Amerasian Basins. A remarkable increase in Chl a and POC stocks during summertime was observed when a warm anomaly (Beszczynska-Möller et al., 2012; Lalande et al., 2013; Cherkasheva et al., 2014) passed through the EFS for a few years from 2004 to 2008 (Figure 6). A relevant explanation for this cannot yet be given (Soltwedel et al., 2016). Besides warmer Atlantic water masses reaching the EFS (Beszczynska-Möller et al., 2012) differences in sea ice exported out of the WFS may have had influences on the productivity of the phytoplankton, due to changes in the water column stratification (Mayot et al., 2020).
Another increase but only in POC standing stocks was observed in late summer 2012 close to the North Pole (Figure 6 bottom right), but the latter was not accompanied by higher Chl a standing stocks. In this context, it is important to note again that variations in the location and the timing of sampling during the various expeditions undoubtedly affected the interpretation of our data. As explained above, for an analysis of the long-term data (discussion below) we have selected only the months in which we had the longest time series and the best matches. These were July for Fram Strait and August/September for the central AO. Thus, the expeditions to the central AO have been carried out relatively late in the season after most of the primary production had already taken place, even at those high latitudes (Melnikov and Pavlov, 1978). The discrepancy between the expected main production phase (late May to July) and our sampling in August/September is evidenced by the peaks in sedimentation of organic matter (including sea ice algae) observed during June and July from sediment trap deployments (Fahl and Nöthig, 2007; Lalande et al., 2009, 2019). The year 2012 with the record sea ice minimum in the AO coincided with the observation of mass sedimentation of Melosira arctica aggregates that were seen on the sea floor during September (Boetius et al., 2013). Also recently, the rapid sinking of a Phaeocystis bloom due to ballasting with gypsum crystals from melting sea ice was observed already in May/June (Wollenburg et al., 2018). From those observations it is clear that our dataset can only give a snapshot for the summertime Chl a standing stock under almost 100% sea ice in the central AO. They can be regarded as a complement to satellite-derived Chl a data that cannot at all detect sympagic and under-ice blooms at high latitudes due to the high solar zenith angle and the ice coverage of most parts of the central AO. Overall, satellite-derived surface Chl a concentrations capture less than 20% of the entire variance in the Arctic Ocean surface waters (Matrai et al., 2013) which may change in the future due to less sea ice.
Spatial Distribution of Chl a and POC Stocks
Light and nutrient supply determine phytoplankton growth in all oceans and in polar oceans sea ice constitutes another influencing factor (Sakshaug et al., 1991; Leu et al., 2015). While the productive growth season is shorter with increasing latitude due to decreasing incident light and generally thicker sea ice with heavier snow cover (Massicotte et al., 2019) the amount of nutrients is the main factor limiting new production (Tremblay and Gagnon, 2009; Tremblay et al., 2015). Accordingly, the highest summertime Chl a and POC standing stocks were recorded at lower latitudes in the EFS and the BS during our expeditions. The EFS is under the influence of relatively warm modified North Atlantic water passing with the West Spitsbergen Current and exhibits almost no sea ice cover year-round. The BS and WFS in turn experience fronts where the Atlantic Water masses meet the Polar Water and have additionally a seasonally receding sea ice cover with a formation of marginal ice zones (Meier et al., 2014). The NB is ice-covered nearly all year with decreasing sea-ice thickness, increasing open water zones or zones with thinner sea ice with growing leads in the summertime (Maslanik et al., 2011). Regarding the Chl a and POC it represents the transition zone between high and very low Chl a standing stocks. The AmB and AB, i.e., the regions with the thickest sea ice and longest sea ice-cover duration, had extremely low standing stocks in the upper 100 m. Lowest Chl a concentrations were obtained when sampling was conducted in the completely ice-covered Amerasian Basin in 2011 (Figures 2, 4B and Supplementary Table S4). Very few standing stock data are available for the high Arctic regions. In agreement with our observations, Wheeler et al. (1996) reported low standing stock concentrations of Chl a in the water column of the Canada, Makarov, and AmBs (1–22 mg m–2) and in the NB (60 mg m–2). The Chl a standing stocks presented here were approximately twice lower for the AB and AmB and five times lower for the NB. This may be due to later sampling or to the earlier onset of blooms. Standing stocks for BS and Fram Strait are more in accordance with other investigations (Hop et al., 2006; Cherkasheva et al., 2014). POC data for the central AO are nearly absent.
Sea ice seems to strongly affect the distribution patterns of Chl a and POC content in the Fram Strait and central AO by controlling the timing of summer phytoplankton blooms (Janout et al., 2016). Besides the sea ice cover, a decrease in mixed layer depth, with potentially shallower mixed layers in melt water lenses at the northernmost stations, may also explain the integrated lower productivity in the central AO and AB, as lower surface nutrient concentrations due to stronger stratification, limited remineralization during winter, or limited advection of nutrient rich surface waters may also lead to the low standing stocks observed at high latitudes (Tremblay et al., 2015). Furthermore, nutrient availability in surface waters varies across the Arctic Ocean (Codispoti et al., 2013; Randelhoff et al., 2017). Rijkenberg et al. (2018) even reported an iron limitation during a summer bloom in the NB.
The Arctic sea ice summer minimum extent has declined by ∼50% since the late 1970s (e.g., National Snow and Ice Data Center, Colorado; Maslanik et al., 2011; Comiso et al., 2017). Marginal ice zones (MIZ) develop when Arctic sea ice melts during summertime or when warmer water encounters sea ice, as is the case in the Fram Strait and the Barents Sea. Biologically MIZ are now more often observed shifting toward the high Arctic. MIZ are described as regions where most of the primary production occurs in polar oceans, exhibiting short and intense phytoplankton blooms (Arrigo et al., 2012; Barber et al., 2015). These ice edge blooms may occur every year, but a lack of nutrients late in summer and above the deep basins along with substantial grazing pressure can also prevent the build-up of a considerable biomass (Falk-Petersen et al., 2000). In our investigations, the most productive zones were found at the dynamic ice edge of the Fram Strait where warm and nutrient rich Atlantic water partly recirculates at the surface and comes into contact with the sea ice cover of the western Fram Strait, resulting in a permanent MIZ, or, where short-term frontal systems/filaments bringing nutrients up by upwelling may lead to elevated summer production (Von Appen et al., 2018). Due to thinner sea ice leaving the Fram Strait off east Greenland (Renner et al., 2014) these filamental blooms may occur more frequently in the future, allowing higher Chl a and POC standing stocks. In the Barents Sea, a receding ice edge develops from south to north when warmer Atlantic water subducts the Polar water and forms the Polar Front moving northward during summer, with a band of higher productivity following the seasonal sea ice retreat. Here as well as in other regions, deep Chl a maxima can develop once nutrients are depleted in the shallow surface waters (Sakshaug et al., 1991; Strass and Nöthig, 1996; Owrid et al., 2000). In the central AO, intense under-ice blooms were recently observed very early in the season (May, June, July) when nutrient rich water of the Atlantic or Pacific oceans prevail under thin sea ice (Arrigo et al., 2014; Assmy et al., 2017). However, our data set might not have captured this type of events.
A significant correlation between Chl a and POC standing stocks was revealed in the Fram Strait and the Nansen Basin. POC concentrations in the upper water column of the Fram Strait were clearly linked to the phytoplankton biomass proxy Chl a. The correlation between Chl a and POC standing stocks decreased toward the Canadian side of the Arctic Ocean (Figure 5). Earlier blooms (Assmy et al., 2017) as well as variations in riverine discharge and in sea ice export within the Transpolar Drift (Krumpen et al., 2019) may have contributed to the lack of correlation between POC and Chl a in the central AO surface waters. As we sampled in late summer, POC stocks in those regions may be more independent of phytoplankton growth than of the given sea ice situation and river run-off. While the Chl a concentrations decreased more northward, heterotrophic carbon of both marine (Flores et al., 2019) and terrestrial origin (Krumpen et al., 2019) may have caused higher POC levels.
Long-Term Trends
The occurrence of a warm Atlantic Water anomaly from 2004 to 2008 in the EFS allowed us to speculate on the influence of increasing temperatures on the Chl a and POC standing stocks (Beszczynska-Möller et al., 2012; Nöthig et al., 2015b; Soltwedel et al., 2016). The Chl a concentrations showed a distinct biomass pattern before, during, and after the warm anomaly event (Figure 8). Before the anomaly (1991–2003), low Chl a biomass were observed in the WFS together with high Chl a biomass in the EFS, with an intermediate zone around the prime meridian (Figure 8). During the warm anomaly period (2004–2008), Chl a biomass were more evenly distributed across the entire Fram Strait (Figure 8). After the warm anomaly (2009–2015), summertime Chl a biomass were once again low in the WFS and higher in the EFS, but not as clearly defined as before the period of anomalously warm waters (Figure 8). The Chl a standing stock patterns indicates a relationship with the water temperature patterns of the surface waters (Walczowski et al., 2017). The warmer conditions probably induced more filaments/small fronts as described above (Von Appen et al., 2018) possibly leading to higher summertime production, meaning a longer production period, and therefore higher Chl a and POC standing stocks (Engel et al., 2019). Interestingly, the change of biomass in the surface layers as well as the shift in phytoplankton species reported from the Fram Strait in this warm period did not have a strong influence on the amount of carbon exported (Lalande et al., 2013). This has also been shown in two different model approaches by Forest et al. (2010); Vernet et al. (2017). In accordance with the change in the Chl a standing stocks during summertime, species compositions changed (Nöthig et al., 2015b). Temperature anomalies from five sites of the International Long Term Ecological Research (ILTER) network in the North-Eastern Pacific, Western Arctic Ocean, Northern Baltic Sea, South-Eastern North Sea and in the Western Mediterranean in 2000 and 2010 have also led to sudden changes in biodiversity of phytoplankton, benthic fauna and temperate reef fish at four of the five sites (Kröncke et al., 2019). We assume that our findings in the Fram Strait could possibly also reflect the larger atmospheric temperature anomaly of the northern hemisphere.
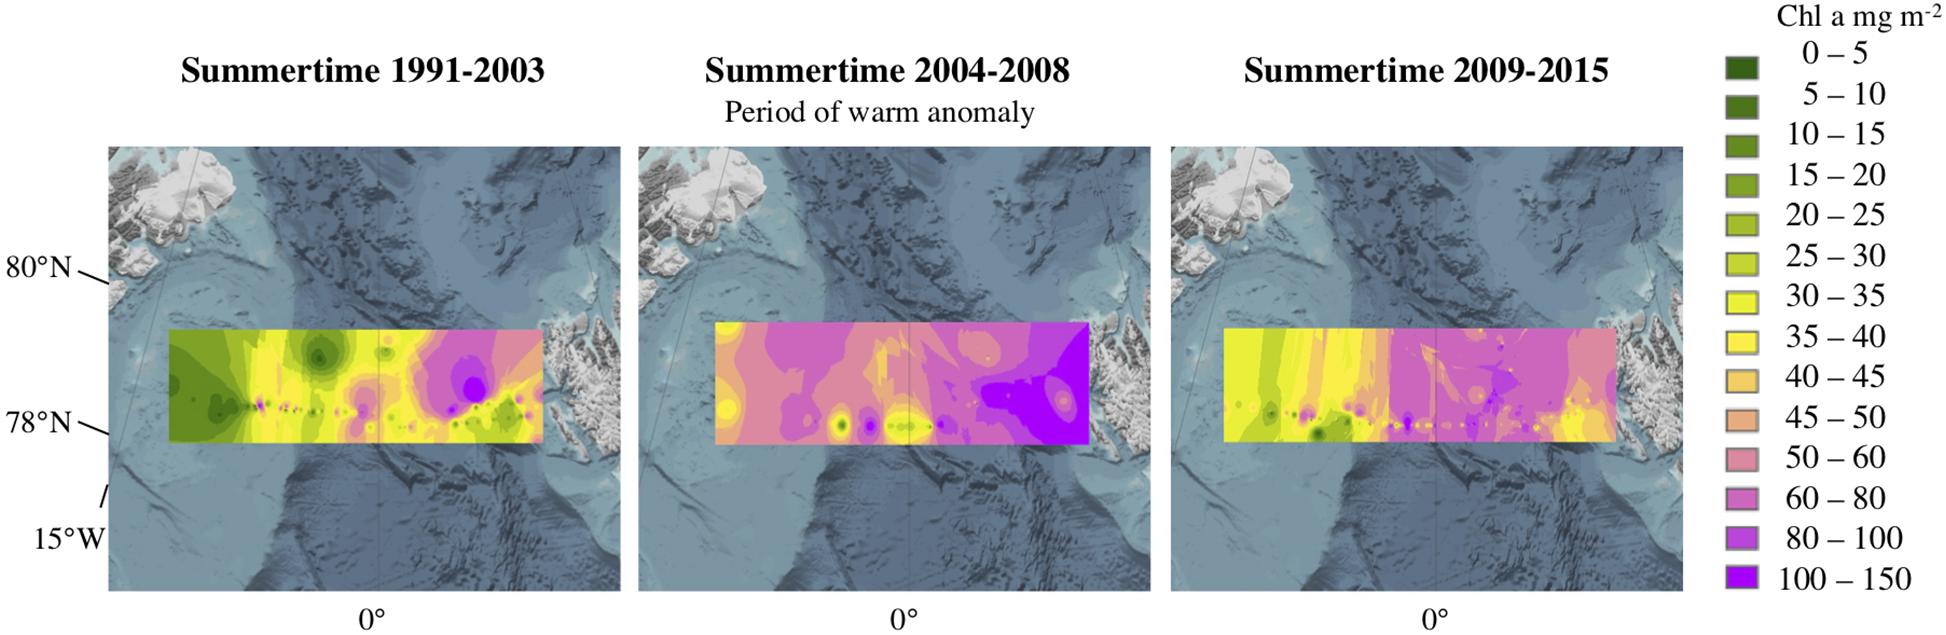
Figure 8. Interpolation of Chl a values (mg m–2) integrated over 0–100 m water depth under (left) strong-ice-cover from 1991 to 2003, (middle) period of a warm anomaly from 2004 to 2008, and (right) reduced sea ice cover from 2009 to 2015.
Although having measured POC only at very few spots in the central AO, shrinking sea ice extent and much thinner sea ice in the central AO (Maslanik et al., 2011; Comiso et al., 2017) probably led to an absolute increase in POC standing stocks, particularly north of 85°N. Increases in POC stocks may be the result of larger areas of open water leading on the one hand to higher production (Arrigo et al., 2014) or may reflect, on the other hand, an increasing release of terrestrial and marine sediments transported with the Transpolar Drift into the upper water column due to the earlier sea ice melt (Eicken et al., 2000; Wegner et al., 2005; Lalande et al., 2014, 2019; Krumpen et al., 2019). Kinney et al. (1971); Gordon and Cranford (1985) reported about 1 g C m–2 in the upper 100 m in the AB in April/May in the late 1970s, most probably prior to a bloom (Wheeler et al., 1997). Wheeler et al. (1997) measured POC stocks nearly five times higher than these previous values of the 1970s in August 1994, however, filters were not acidified during their study and results may therefore also contain inorganic material. Nevertheless POC standing stocks reported by Wheeler et al. (1997) are similar to the POC stocks we obtained from 1991 to 2007. From 2011 to 2015, the POC standing stocks of the upper 100 m increased by a factor of two in our dataset, mostly north of 85°N (see Figure 6 bottom right, Figure 7) after the first record low in sea ice reduction in 2007. POC values were about two times higher in August in the Amerasian Basin than those obtained in April/May by Kinney et al. (1971); Gordon and Cranford (1985) hence, seasonality is of strong impact on POC concentrations. Our results may still lead to the assumption that POC stocks have possibly increased but very slowly over the last 20 years, probably due to different sea ice conditions and low nutrient inventories in the uppermost surface waters of the central AO. With the exception of the ice-free eastern Fram Strait, all regions investigated here fall into similar POC ranges previously observed in the AO (Wheeler et al., 1997). Thus, overall only small changes of POC standing stocks can be postulated over the last 20 years. On the other hand, summer sea ice extent has been nearly halved, and satellite-derived net primary production from open water has also doubled up to nearly twice as much in the upper water masses within the high deep Arctic (Arrigo and Van Dijken, 2015). There are only few other modeling results showing that a further reduction in ice cover only has a minor effect on the total carbon accumulation and storage of the AO (Armstrong et al., 2019). They claim that horizontal advection may possibly become more important. Advection of biomass of organisms from the North Atlantic into the NB have been investigated by Vernet et al. (2019) and Wassmann et al. (2019). Armstrong et al. (2019) postulated according to simulation results that the biological contribution to increased carbon storage accounts only to 0,024%, although the summer biomass is expected to double by the end of the century. Lawrence et al. (2015) concluded, based on simulations of primary productivity, that under low ice scenarios future spatial changes are associated with reduced surface nitrate concentration, increased light and deeper phytoplankton biomass maxima. These model results suggested a 10–30% increase in production in a seasonally ice-free AO by the end of the century. Slagstad et al. (2015) are predicting an increase in production on Arctic shelves areas, a decrease in production in the European Arctic and, only a slight change over the deep central AO. It is important to consider that the very deep AO is storing huge volumes of water with a fairly slow circulation and limited deep-water exchange. Therefore, the stored carbon will likely be isolated from the atmosphere for a long time. It is clear from the few different model projections for carbon production and storage that it is essential to continue with the observations of carbon stocks from field samples to study the future changes of the carbon cycle in the AO.
Conclusion
Chl a and POC standing stocks in the upper 100 m of the water column have been presented over a 25-year period (1991 to 2015) for several regions of the Arctic deep basins and the Fram Strait. Due to the lack of standardized long-term observation in the AO, too few data are available for a comprehensive comparison of all regions. Spatial and temporal variations in Chl a and POC stocks in the Arctic Ocean are assumed to follow sea ice distribution and water temperatures in the respective geographical regions. Our data show that the relationships are not so strong, partially due to natural variation in the composite of data presented here. Our data suggest that bulk productivity indicators like quantities of Chl a and POC show a certain resilience to increases in water temperatures and reductions in sea ice cover. Although their standing stocks may not drastically change in a future Arctic Ocean, ongoing variations in the composition and timing of biological processes of the pelagic system may have consequences on all trophic levels and for the vertical carbon flux exported out of the euphotic zone down to the benthic ecosystem of the deep Arctic Ocean.
Data Availability Statement
The datasets generated for this study are available on request to the corresponding author. Chlorophyll a data are avaiable at PANGAEA under https://doi.pangaea.de/10.1594/PANGAEA.855814 and https://doi.pangaea.de/10.1594/PANGAEA.887882. POC data will be made available in PANGAEA but can also already be found in the Supplementary Material.
Author Contributions
E-MN wrote the manuscript together with SR, CL, IP, and KM. AH, EB, ABo, ABr, LH, CL, KM, IP, and AW were involved in data sampling and processing. All authors were involved in discussions about the long-term perspective of environmental change in the Arctic Ocean and revised and approved the manuscript.
Funding
This work has been supported by the Helmholtz Association since 1991 and from 2004 on through the MARCOPLI, PACES programmes of the Helmholtz Association. It contributes to the Helmholtz-funded infrastructure program Frontiers in Arctic Marine Research (FRAM). This study also presents baseline data and, thus, is a contribution to the project MicroARC (03F0802A), part of the Changing Arctic Ocean program, jointly funded by the UKRI Natural Environment Research Council (NERC) and the German Federal Ministry of Education and Research (BMBF). ABr contribution was partly supported by the Transregional Collaborative Research Center (TR 172) “ArctiC Amplification: Climate Relevant Atmospheric and SurfaCe Processes, and Feedback Mechanisms (AC)3” via the subproject C03. Parts of the study were also supported by funds of the BMBF to the ARKTIEF project (Project No. O3PLO3OB).
Conflict of Interest
The authors declare that the research was conducted in the absence of any commercial or financial relationships that could be construed as a potential conflict of interest.
Acknowledgments
We thank C. Lorenzen, N. Knüppel, S. Murawski, and E. Bonk (Alfred Wegener Institute Helmholtz Centre for Polar and Marine Research) for lab assistance and Nadja Sandhop for her support by preparing tables and maps. We also thank all the student helpers taking samples on board and the AWI Physical Oceanography section, the AWI Deep Sea group and captains and crews of RVs Polarstern, Maria S. Merian, and Lance for their support during all the years.
Supplementary Material
The Supplementary Material for this article can be found online at: https://www.frontiersin.org/articles/10.3389/fmars.2020.00350/full#supplementary-material
Footnotes
References
Ardyna, M., Babin, M., Gosselin, M., Devred, E., Beìlanger, S., Matsuoka, A., et al. (2013). Parameterization of vertical chlorophyll a in the Arctic Ocean: Impact of the subsurface chlorophyll maximum on regional, seasonal, and annual primary production estimates. Biogeosciences 10, 4383–4404. doi: 10.5194/bg-10-4383-2013
Ardyna, M., Babin, M., Gosselin, M., Devred, E., Rainville, L., and Tremblay, J. E. (2014). Recent Arctic Ocean sea ice loss triggers novel fall phytoplankton blooms. Geophys. Res. Lett. 41, 6207–6212. doi: 10.1002/2014GL061047
Armstrong, C. W., Foley, N. S., Slagstad, D., Chierici, M., Ellingsen, I., and Reigstad, M. (2019). Valuing blue carbon changes in the Arctic Ocean. Front. Mar. Sci. 6:331. doi: 10.3389/fmars.2019.0033113
Arrigo, K. R., Perovich, D. K., Pickart, R. S., Brown, Z. W., van Dijken, G. L., Lowry, K. E., et al. (2012). Massive phytoplankton blooms under Arctic sea ice. Science 336:1408. doi: 10.1126/science.1215065
Arrigo, K. R., Perovich, D. K., Pickart, R. S., Brown, Z. W., van Dijken, G. L., Lowry, K. E., et al. (2014). Phytoplankton blooms beneath the sea ice in the Chukchi Sea. Deep Sea Res. Part 2 105, 1–16. doi: 10.1126/science.162512150651626
Arrigo, K. R., van Dijken, G., and Pabi, S. (2008). Impact of a shrinking Arctic ice cover on marine primary production. Geophys. Res. Lett. 35:L19603. doi: 10.1029/2008GL035028
Arrigo, K. R., and Van Dijken, G. L. (2015). Continued increases in Arctic Ocean primary production. Prog. Oceanogr. 136, 60–70. doi: 10.1016/j.pocean.2015.05.002
Assmy, P., Fernández-Méndez, M., Duarte, P., Meyer, A., Randelhoff, A., Mundy, C., et al. (2017). Leads in Arctic pack ice enable early phytoplankton blooms below snow- covered sea ice. Sci. Rep. 7:40850. doi: 10.1038/srep40850
Barber, D. G., Hop, H., Mundy, C. J., Else, B., Dimitrenko, C. A., Tremblay, J. E., et al. (2015). Selected physical, biological and biogeochemical implications of a rapidly changing Arctic Marginal Ice Zone. Prog. Oceanogr. 139, 122–150. doi: 10.1016/j.pocean.2015.09.003
Bauerfeind, E., Nöthig, E.-M., Beszczynska, A., Fahl, K., Kaleschke, L., Kreker, K., et al. (2009). Particle sedimentation patterns in the eastern Fram Strait during 2000-2005: Results from the Arctic long-term observatory HAUSGARTEN. Deep Sea Res. Part I 56, 1471–1487. doi: 10.1016/j.dsr.2009.04.011
Beszczynska-Möller, A., Fahrbach, E., Schauer, U., and Hansen, E. (2012). Variability in Atlantic water temperature and transport at the entrance to the Arctic Ocean, 1997-2010. Ices J. of Mar. Sci. 69, 852–863. doi: 10.1093/icesjms
Bluhm, B. A., Kosobokova, K. N., and Carmack, E. C. (2015). A tale of two basins: An integrated physical and biological perspective of the deep Arctic Ocean. Prog. in Oceanogr. 139, 89–121. doi: 10.1016/j.pocean.2015.07.011
Boetius, A., Albrecht, S., Bakker, K., Bienhold, C., Felden, J., Fernaìndez-Meìndez, M., et al. (2013). Export of algal biomass from the melting Arctic sea ice. Science 339, 1430–1432. doi: 10.1126/science.1231346
Cai, P., Rutgers, V. D., Loeff, M., Stimac, I., Nöthig, E. M., Lepore, K., et al. (2010). Low export flux of particulate organic carbon in the central Arctic Ocean as revealed by 234Th:238U disequilibrium. J. Geophys. Res. Oceans 115:C10037. doi: 10.1029/2009JC005595
Cherkasheva, A., Bracher, A., Melsheimer, C., Köberle, C., Gerdes, R., Nöthig, E.-M., et al. (2014). Influence of the physical environment on polar phytoplankton blooms: A case study in the Fram Strait. J. Mar. Sys. 132, 196–207. doi: 10.1016/j.jmarsys.2013.11.008
Cherkasheva, A., Nöthig, E.-M., Bauerfeind, E., Melsheimer, C., and Bracher, A. (2013). From the chlorophyll-a in the surface layer to its vertical profile: a Greenland Sea relationship for satellite applications. Ocean Sci. 9, 431–445. doi: 10.5194/os-9-431-2013
Codispoti, L. A., Flag, C., Kelly, V., and Swift, J. H. (2005). Hydrographic conditions during the 2002 SBI process experiments. Deep Sea Res. Part 2 52, 3199–3226. doi: 10.1016/j.dsr2.2005.10.007
Codispoti, L. A., Kelly, V., Thessen, A., Matrai, P., Suttles, S., Hill, V., et al. (2013). Synthesis of primary production in the Arctic Ocean: III. Nitrate and phosphate based estimates of net community production. Prog. Oceanogr. 110, 126–150. doi: 10.1016/j.pocean.2012.11.006
Comiso, J. C., Meier, W. N., and Gersten, R. (2017). Variability and trends in the Arctic Sea ice cover: Results from different techniques. Geophys. Res. Lett. 122, 6067–6964. doi: 10.1002/2017JC012768
Edler, L. (1979). Recommendations on methods for marine biological studies in the Baltic Sea in Phytoplankton and Chlorophyll. Dordrecht: Baltic Marine Biologists Publication, 5.
Eicken, H., Kolatschek, J., Freitag, J., Lindemann, F., Kassens, H., and Dmitrenko, I. (2000). Identifying a major source area and constraints on entrainment for basin-scale sediment transport by Arctic sea ice. Geophys. Res. Lett. 27, 1919–1922. doi: 10.1029/1999GL011132
Engel, A., Bracher, A., Dinter, T., Endres, S., Grosse, J., Metfies, K., et al. (2019). Inter-Annual Variability of Organic Carbon Concentration in the Eastern Fram Strait During Summer (2009–2017). Front. Mar. Sci. 6:187. doi: 10.3389/fmars.2019.00187
Evans, C. A., and O’Reily, J. E. (1980). A Manual for Measurement of Chlorophyll a In Netplankton and Nannoplankton. Ocean Pulse Technical Manual No. 3, Report No. SHRL. Grand Forks, ND: BIOMASS, 80–81.
Fahl, K., and Nöthig, E.-M. (2007). Lithogenic and biogenic particle fluxes on the Lomonosov Ridge (central Arctic Ocean) and their relevance for sediment accumulation: Vertical vs. lateral transport. Deep Sea Res. Part 2, 1256–1272. doi: 10.1016/j.dsr.2007.04.014
Falk-Petersen, S., Hop, H., Budgell, W. P., Hegseth, E. N., Korsnes, R., Loyning, T. B., et al. (2000). Physical and ecological processes in the marginal ice zone of the northern Barents Sea during the summer melt period. J. Mar. Syst. 27, 131–159. doi: 10.1007/s00300-014-1482-1
Flores, H., David, C., Ehrlich, J., Hardge, K., Kohlbach, D., Lange, B., et al. (2019). Sea-ice properties and nutrient concentration as drivers of the taxonomic and trophic structure of high-Arctic protist and metazoan communities. Polar Biol. 42, 1377–1395. doi: 10.1007/s00300-019-02526-z
Forest, A., Wassmann, P. F., Slagstadt, D., Bauerfeind, E., Nöthig, E.-M., and Klages, M. (2010). Relationships between primary production and vertical particle export at the Atlantic-Arctic boundary (Fram Strait. HAUSGARTENN). Polar Biol. 33, 1733–1746. doi: 10.1007/s00300-010-0855-3
Fortier, M., Fortier, L., Michel, C., and Legendre, L. (2002). Climatic and biological forcing of the vertical flux of biogenic particles under seasonal Arctic sea ice. Mar. Ecol. Progr. Ser. 225, 1–16. doi: 10.3354/meps225001
Gascard, J.-C., Kergomard, C., Jeannin, P.-F., and Fily, M. (1988). Diagnostic study of the Fram Strait marginal ice zone during summer from 1983 and 1984 Marginal Ice Zone Experiment Lagrangian observations. J. Geophys. Res. 93, 3613–3641. doi: 10.1029/JC093iC04p03613
Gluchowska, M., Dalpadado, P., Beszczynska-Möller, A., Olszewska, A., Ingvaldsen, R. B., and Kwasniewski, S. (2017). Interannual zooplankton variability in the main pathways of the Atlantic water flow into the Arctic Ocean (Fram Strait and Barents Sea branches). ICES J. Mar. Sci. 74, 1921–1936. doi: 10.1093/icesjms/fsx033
Gordon, D. C., and Cranford, P. J. (1985). Detailed distribution of dissolved and particulate organic matter in the Arctic Ocean and comparison with other oceanic regions. Deep Sea Res. 32, 1221–1232. doi: 10.1016/0198-0149(85)90005-6
Hansen, E., Gerland, S., Granskog, M. A., Pavlova, O., Renner, A. H. H., Haapala, J., et al. (2013). Thinning of Arctic sea ice observed in Fram Strait: 1990-2011. J. Geophys. Res. 118, 5202–5221. doi: 10.1002/jgrc.20393
Hop, H., Falk-Petersen, S., Svendsen, H., Kwasniewski, S., Pavlov, V., Pavlova, O., et al. (2006). Physical and biological characteristics of the pelagic system across Fram Strait to Kongsfjorden. Prog. Oceanogr. 71, 182–231. doi: 10.1016/j.pocean.2006.09.007
IPCC (2014). Climate Change 2014: Syntesis Report Contribution of Working Groups I, II and III to the Fifth Assessment report of the Intergovernmental. Geneva: IPCC.
Janout, M. A., Hölemann, J., Waite, A. M., Krumpen, T., Von Appen, W.-J., and Martynov, F. (2016). Sea-ice retreat controls timing of summer plankton blooms in the Eastern Arctic Ocean. J. Geophys. Res. Lett. 43, 12493–12501. doi: 10.1002/2016GL071232
Kahru, M., Brotas, V., Manzano-Sarabia, M., and Mitchell, B. G. (2011). Are phytoplankton blooms occurring earlier in the Arctic? Glob. Change Biol. 17, 1733–1739. doi: 10.1111/j.1365-2486.2010.02312.x
Kinney, P. J., Loder, T. C., and Groves, J. (1971). Particulate and dissolved organic matter in the Amerasian Basin of the Arctic Ocean. Limnol. Oceanogr. 16, 132–137. doi: 10.4319/lo.1971.16.1.0132
Kröncke, I., Neumann, H., Dippner, J. W., Holbrook, S., Lamy, T., Miller, R., et al. (2019). Comparison of biological and ecological long-term trends related to northern hemisphere climate in different marine ecosystems. Nat. Conserv. 34, 311–341. doi: 10.3897/natureconservation.34.30209
Krumpen, T., Belter, H. J., Boetius, A., Damm, E., Haas, C., Hendricks, S., et al. (2019). Arctic warming interrupts the Transpolar Drift and affects long-range transport of sea ice and ice- rafted matter. Sci. Rep. 9:5459. doi: 10.1038/s41598-019-41456-y
Krumpen, T., Gerdes, R., Haas, C., Hendricks, S., Herber, A., Selyuzhenok, V., et al. (2015). Recent summer sea ice thickness surveys in the Fram Strait and associated volume fluxes. Cryosphere Discuss. 9, 5171–5202. doi: 10.5194/tcd-9-5171-2015
Lalande, C., Bauerfeind, E., Nöthig, E.-M., and Beszczynska-Möller, A. (2013). Impact of a warm anomaly on export fluxes of biogenic matter in the eastern Fram Strait. Progr. Oceanogr. 109, 70–77. doi: 10.1016/j.pocean.2012.09.006
Lalande, C., Bélanger, S., and Fortier, L. (2009). Impact of a decreasing sea ice cover on the vertical export of particulate organic carbon in the northern Laptev Sea, Siberian Arctic Ocean. Geophys. Res. Lett. 36:L21604. doi: 10.1029/2009GL040570
Lalande, C., Nöthig, E.-M., and Fortier, L. (2019). Algal Export in the Arctic Ocean in Times of Global Warming. Geophys. Res. Lett. 46, 5959–5967. doi: 10.1029/2019gl083167
Lalande, C., Nöthig, E.-M., Somavilla, R., Bauerfeind, E., Shevchenko, V., and Okolodkov, Y. (2014). Variability in under-ice export fluxes of biogenic matter in the Arctic Ocean. Glob. Biogeochem. Cycles 28, 571–583. doi: 10.1002/2013GB004735
Lawrence, J., Popova, A., Yool, E., and Srokosz, M. (2015). On the vertical phytoplankton response to an ice-free Arctic Ocean. J. Geophys. Res. Oceans 120, 8571–8582. doi: 10.1002/2015JC011180
Leu, E., Mundy, C. J., Assmy, P., Campbell, K., Gabrielsen, T. M., Gosselin, M., et al. (2015). Arctic spring awakening – Steering principles behind the phenology of vernal ice algal blooms. Progr. Oceanogr. 139, 151–170. doi: 10.1016/j.pocean.2015.07.012
Liu, J., Song, M., Horton, R. M., and Hu, Y. (2013). Reducing spread in climate model projections of a September ice-free Arctic. Proc. Natl. Acad. Sci. U.S.A. 110, 571–12676. doi: 10.1073/pnas.1219716110
Maslanik, J., Stroeve, J., Fowler, C., and Emery, W. (2011). Distribution and trends in Arctic sea ice age through spring 2011. Geophys. Re. Lett. 38:L13502. doi: 10.1029/2011GL047735
Massicotte, P., Peeken, I., Katlein, C., Flores, H., Huot, Y., Castellani, G., et al. (2019). Sensitivity of phytoplankton primary production estimates to available irradiance under heterogeneous sea-ice conditions. J. Geophys. Res. 128:JC015007. doi: 10.1029/2019JC015007
Matrai, P., Olson, E., Suttles, S., Hill, V., Codispoti, L., Light, B., et al. (2013). Synthesis of primary production in the Arctic Ocean: I. Surface waters, 1954-2007. Progr. Oceanogr. 110, 93–106. doi: 10.1016/j.pocean.2012.11.004
Mayot, N., Matrai, P., Arjona, A., Bélanger, S., Marchese, C., Jaegler, T., et al. (2020). Springtime export of Arctic sea ice influences phytoplankton production in the Greenland Sea. J. Geophys. Res. 125:e2019JC015799. doi: 10.1029/2019JC015799
Meier, W. N., Hovelsrud, G. K., Van Oort, B. E. H., Key, J. R., Kovacs, K. M., Michel, C., et al. (2014). Arctic sea ice in transformation: A review of recent observed changes and impacts on biology and human activity. Rev. Geophys. 52, 185–217. doi: 10.1002/2013RG000431
Melnikov, I. A., and Pavlov, G. L. (1978). Characteristics of organic carbon distribution in the waters and ice of the Arctic Ocean. Oceanology 18, 163–167.
Nghiem, S. V., Rigor, I. G., Perovich, D. K., Clemente-Colón, P., Weatherly, J. W., and Neumann, G. (2007). Rapid reduction of Arctic perennial sea ice. Geophys. Res. Lett. 34, 1–6. doi: 10.1029/2007GL031138
Nicolaus, M., Katlein, C., Maslanik, J., and Hendricks, S. (2012). Changes in Arctic sea ice result in increasing light transmittance and absorption. Geophys. Res. Lett. 39:L24501. doi: 10.1029/2012GL053738
Nöthig, E.-M., Bauerfeind, E., Lorenzen, C., Lalande, C., Knüppel, N., et al. (2018). Chlorophyll a in Arctic Ocean, Fram Strait, and Greenland Sea 2013 - 2016. Bremerhaven: Alfred Wegener Institute, Helmholtz Centre for Polar and Marine Research, doi: 10.1594/PANGAEA.887882
Nöthig, E.-M., Bracher, A., Engel, A., Metfies, K., and Niehoff, B. (2015a). Chlorophyll a in Arctic Ocean, Fram Strait, and Greenland Sea, 1991-2012. London: PANGAEA, doi: 10.1594/PANGAEA.855814
Nöthig, E.-M., Bracher, A., Engel, A., Metfies, K., Niehoff, B., Peeken, I., et al. (2015b). Summertime plankton ecology in Fram Strait - a compilation of long- and short-term observations. Polar Res. 34:23349. doi: 10.3402/polar.v34.23349
Owrid, G., Socal, G., Civitarese, G., Luchetta, A., Wiktor, J., Nöthig, E. M., et al. (2000). Spatial variability of phytoplankton, nutrients and new production estimates in the waters around Svalbard. Polar Res. 19, 155–171. doi: 10.1111/j.1751-8369.2000.tb00340.x
Piechura, J., and Walczowski, W. (2009). Warming of the West Spitsbergen Current and sea ice north of Svalbard. Oceanologia 5, 147–164. doi: 10.5697/oc.51-2.147
Polyak, L., Alley, R. B., Andrews, J. T., Brigham-Grette, J., Cronin, T. M., Darby, A. B., et al. (2010). History of sea ice in the Arctic. Quat. Sci. Rev. 29, 1757–1778. doi: 10.1016/j.quascirev.2010.02.010
Polyakov, I. V., Pnyushkov, A. V., Alkire, M. B., Ashik, I. M., Baumann, T. M., Carmack, E. C., et al. (2017). Greater role for Atlantic inflows on sea-ice loss in the Eurasian Basin of the Arctic Ocean. Science 356, 285–291. doi: 10.1126/science.aai8204
Randelhoff, A., Fer, I., and Sundfjorf, A. (2017). Turbulent Upper-Ocean Mixing Affected by Meltwater Layers during Arctic Summer. Massachusetts: American Meteorological Society, doi: 10.1175/JPO-D-16-0200.1
Renner, A. H. H., Gerland, S., Haas, C., Spreen, G., Beckers, J. F., Hansen, E., et al. (2014). Evidence of Arctic sea ice thinning from direct observations. Geophys. Res. Lett. 41, 5029–5036. doi: 10.1002/2014GL060369
Rijkenberg, M. J. A., Slagter, H. A., van der Loeff, M. R., van Ooijen, J., and Gerringa, L. J. A. (2018). Dissolved Fe in the Deep and Upper Arctic Ocean With a Focus on Fe Limitation in the Nansen Basin. Front. Mar. Sci. 5:88. doi: 10.3389/fmars.2018.00088
Sakshaug, E., Hopkins, C. C. E., and Oritsland, N. A. (1991). Proceedings of the Pro Mare Symposium on Polar Marine Ecology, Trondheim, Norway, 12-16 May 1990. Polar Res. 10, 1–4. doi: 10.1111/j.1751-8369.1991.tb00629.x
Schauer, U., Beszczynska-Möller, A., Walczowski, W., Fahrbach, E., Piechura, J., and Hansen, E. (2008). “Variation of Measured Heat Flow Through the Fram Strait Between 1997 and 2006,” in Arctic-subarctic Ocean Fluxes: Defining the Role of the Northern Seas in Climate, eds R. R. Dickson, J. Meincke, and P. Rhines (Berlin: Springer), 65–85. doi: 10.1007/978-1-4020-6774-7_4
Schröter, F., Havermans, C., Kraft, A., Knueppel, N., Beszczynska-Möller, A., Bauerfeind, E., et al. (2019). Pelagic Amphipods in the Eastern Fram Strait With Continuing Presence of Themisto compressa Based on Sediment Trap Time Series. Front. Mar. Sci. 6:311. doi: 10.3389/fmars.2019.00311
Serreze, M. C., Holland, M. M., and Stroeve, J. (2007). Perspectives on the Arctic’s shrinking sea-ice cover. Science 315, 1533–1536. doi: 10.1126/science.1139426
Slagstad, D., Wassmann, P. F. J., and Ellingsen, I. (2015). Physical constrains and productivity in the future Arctic Ocean. Front. Mar. Sci. 2:85. doi: 10.3389/fmars.2015.00085
Soltwedel, T., Bauerfeind, E., Bergmann, M., Bracher, A., Budaeva, N., Busch, K., et al. (2016). Natural variability or anthropogenically-induced variation? Insights from 15 years of multidisciplinary observations at the arctic open-ocean LTER site HAUSGARTEN. Ecol. Indic. 65, 89–102. doi: 10.1016/j.ecolind.2015.10.001
Spearman, C. (1904). The Proof and Measurement of Association between Two Things. Am. J. Psychol. 15:72. doi: 10.2307/1412159
Spreen, G., Kaleschke, L., and Heygster, G. (2008). Sea ice remote sensing using AMSR-E 89 GHz channels. J. Geophys. Res. 113:C02S03. doi: 10.1029/2005JC003384
Strass, V., and Nöthig, E.-M. (1996). Seasonal shifts in ice edge phytoplankton blooms in the Barents Sea related to the water column stability. Polar Biol. 16, 409–422. doi: 10.1007/bf02390423
Tremblay, J. É, and Gagnon, J. (2009). “The effects of irradiance and nutrient supply on the productivity of Arctic waters: a perspective on climate change,” in Influence of Climate Change on the Changing Arctic and Sub-Arctic Conditions. NATO Science for Peace and Security Series C: Environmental Security, eds J. C. J. Nihoul and A. G. Kostianoy (Dordrecht: Springer), doi: 10.1007/978-1-4020-9460-6_7
Tremblay, L. B., Schmidt, G. A., Pfirman, S., Newton, R., and Derepentigny, P. (2015). Is ice-rafted sediment in a North Pole marine record evidence for perennial sea-ice cover? Philos. Trans. R. Soc. A Math. Phys. Eng. Sci. 373:20140168. doi: 10.1098/rsta.2014.0168
Vernet, M., Ellingsen, I. H., Seuthe, L., Slagstad, D., Cape, M. R., and Matrai, P. A. (2019). Influence of Phytoplankton Advection on the Productivity Along the Atlantic Water Inflow to the Arctic Ocean. Front. Mar. Sci. 6:583. doi: 10.3389/fmars.2019.00583
Vernet, M., Richardson, T. L., Nöthig, E.-M., Metfies, K., and Peeken, I. (2017). Models of plankton community changes during a warm water anomaly in Arctic waters: altered trophic pathways without substantial changes in carbon export. Front. Mar. Sci. 4:160. doi: 10.3389/fmars.2017.00160
Von Appen, W.-J., Schauer, U., Somavilla, R., Bauerfeind, E., and Beszczynska-Möller, A. (2015). Exchange of warming deep waters across Fram Strait. Deep Sea Res. Part I 103, 86–100. doi: 10.1016/j.dsr.2015.06.003
Von Appen, W.-J., Wekerle, C., Hehemann, L., Schourup-Kristensen, V., Konrad, C., and Iversen, M. H. (2018). Observations of a submesoscale cyclonic filament in the marginal ice zone. Geophys. Res. Lett. 45, 6141–6149. doi: 10.1029/2018GL077897
Walczowski, W. (2013). Frontal structures in the West Spitsbergen current margins. Ocean Sci. 9, 957–975. doi: 10.5194/os-9-957-2013
Walczowski, W., Beszczynska-Möller, A., Wieczorek, P., Merchel, M., and Grynczel, A. (2017). Oceanographic observations in the Nordic Sea and Fram Strait in 2016 under the IO PAN long-term monitoring program AREX. Oceanologica 59, 187–194. doi: 10.1016/j.oceano.2016.12.003
Wang, M., and Overland, J. E. (2012). A sea ice free summer Arctic within 30 years: An update from CMIP5 models. Geophys. Res. Lett. 39, 6–11. doi: 10.1029/2012GL052868
Wassmann, P. (2011). Arctic marine ecosystems in an era of rapid climate change. Progr. Oceanogr. 90, 1–17. doi: 10.1016/j.pocean.2011.02.002
Wassmann, P., and Reigstad, M. (2011). Future Arctic Ocean seasonal ice zones and implications for pelagic-benthic coupling. Oceanography 24, 220–231. doi: 10.5670/oceanog.2011.74
Wassmann, P., Slagstad, D., and Ellingsen, I. (2019). Advection of Mesozooplankton Into the Northern Svalbard Shelf Region. Front. Mar. Sci. 6:458. doi: 10.3389/fmars.2019.00458
Wegner, C., Hölemann, J. A., Dmitrenko, I., Kirillov, S., and Kassens, H. (2005). Seasonal variations in Arctic sediment dynamics—evidence from 1-year records in the Laptev Sea (Siberian Arctic). Glob. Planet. Change 48, 126–140. doi: 10.1016/j.gloplacha.2004.12.009
Wȩsławski, J. M., Kwasniewski, S., Stempniewicz, L., and Blachowiak-Samolyk, K. (2006). Biodiversity and energy transfer to top trophic levels in two contrasting Arctic fjords. Polish Polar Res. 27, 259–278.
Wheeler, P. A., Gosselin, M., Sherr, E., Thibault, D., Kirchman, D. L., Benner, R., et al. (1996). Active cycling of organic carbon in the central Arctic ocean. Nature 380, 697–699. doi: 10.1038/380697a0
Wheeler, P. A., Watkins, J. M., and Hansing, R. L. (1997). Nutrients, organic carbon and organic nitrogen in the upper water column of the Arctic Ocean: implications for the sources of dissolved organic carbon. Deep Sea Res. Part 2 44, 1577–1592.
Wiedmann, I., Ershova, E., Bluhm, B. A., Nöthig, E.-M., Gradinger, R. R., Kosobokova, K., et al. (2020). What feeds the benthos in the arctic basins? Assembling a carbon budget for the deep arctic ocean. Front. Mar. Sci. 7:224. doi: 10.3389/fmars.2020.00224
Keywords: long-term data, summertime surface waters, chlorophyll a, particulate organic carbon, Fram Strait and Arctic Ocean
Citation: Nöthig E-M, Ramondenc S, Haas A, Hehemann L, Walter A, Bracher A, Lalande C, Metfies K, Peeken I, Bauerfeind E and Boetius A (2020) Summertime Chlorophyll a and Particulate Organic Carbon Standing Stocks in Surface Waters of the Fram Strait and the Arctic Ocean (1991–2015). Front. Mar. Sci. 7:350. doi: 10.3389/fmars.2020.00350
Received: 29 November 2019; Accepted: 27 April 2020;
Published: 19 June 2020.
Edited by:
Paul F. J. Wassmann, The Arctic University of Norway, NorwayReviewed by:
Karley Lynn Campbell, University of Bristol, United KingdomPatricia A. Matrai, Bigelow Laboratory for Ocean Sciences, United States
Randi Brunvær Ingvaldsen, Norwegian Institute of Marine Research (IMR), Norway
Marcel Babin, Laval University, Canada
Copyright © 2020 Nöthig, Ramondenc, Haas, Hehemann, Walter, Bracher, Lalande, Metfies, Peeken, Bauerfeind and Boetius. This is an open-access article distributed under the terms of the Creative Commons Attribution License (CC BY). The use, distribution or reproduction in other forums is permitted, provided the original author(s) and the copyright owner(s) are credited and that the original publication in this journal is cited, in accordance with accepted academic practice. No use, distribution or reproduction is permitted which does not comply with these terms.
*Correspondence: Eva-Maria Nöthig, RXZhLU1hcmlhLk5vZXRoaWdAYXdpLmRl