 Corrado Costa
 Emanuela Fanelli2,3†
 Simone Marini
 Roberto Danovaro
 Jacopo Aguzzi
- 1Consiglio per la Ricerca in Agricoltura e l’Analisi dell’Economia Agraria, Centro di Ricerca Ingegneria e Trasformazioni Agroalimentari, Rome, Italy
- 2Department of Life and Environmental Sciences, Polytechnic University of Marche, Ancona, Italy
- 3Stazione Zoologica Anton Dohrn, Naples, Italy
- 4Institute of Marine Sciences, National Research Council of Italy, La Spezia, Italy
- 5Instituto de Ciencias del Mar, Consejo Superior de Investigaciones Científicas, Barcelona, Spain
The scientific literature available on deep-sea biodiversity is ample and covers a wide array of objectives, geographic areas, and topics. It also explores the links between ecosystem functioning and productivity as well as modeling, management, and exploitation. New statistical analytical tools now allow the comprehensive monitoring of the status of deep-sea research to highlight global research topics and their trends, which deserve further development and economic investments. Here, we used a science mapping approach to provide a global and systematic bibliometric synthesis of these current research topics and their trends to identify the size, growth, trajectory, and geographic distribution of scientific efforts as well as to highlight the emerging topics. A total of 1287 deep-sea biodiversity publications were retrieved from the Scopus database from 1993 to the present. Both established and emerging research topics were identified: (i) biogeochemical, microbial, and molecular analyses; (ii) biodiversity assessments; (iii) ecosystem conservation and management; and, finally, (iv) zoology and taxocoenosis. The temporal change in research activity (which was assessed by subdividing publications into blocks from 1993 to 2010 and 2011 to 2019) demonstrated that the “biogeochemical, microbial, and molecular analyses” cluster was not present from 1993 to 2010 since it was included in the cluster for “biodiversity assessments,” which it eventually diverged from in the following couple of decades. The United States took the dominant role in research, followed by the United Kingdom; Germany and France were also evidenced. China was particularly associated with the United States.
Introduction
Deep-Sea Biodiversity Knowledge and Exploration
The deep sea (i.e., below 200 m in depth) is the largest biome on Earth; 84% of the ocean area is below 2000 m (Costello et al., 2010a; Ramirez-Llodra et al., 2011). Notwithstanding, only 16% of all named species on Earth are marine (Costello and Chaudhary, 2017), although oceans cover 71% of the Earth’s surface (Grosberg et al., 2012) and are likely to host the majority of as yet undescribed species (Costello et al., 2012). In recent decades, dozens of new geomorphological features and habitats have been discovered at depths below 200 m, such as seamounts, canyons, ridges, cold seeps, hydrothermal vents, polymetallic nodule fields, and asphalt fields or brine pools (Levin and Sibuet, 2012). However, recent investigations conducted in one of the largest polymetallic fields in the ocean, the Clarion-Clipperton Zone in the eastern Pacific Ocean, demonstrated that there are major gaps in deep-sea knowledge (Glover et al., 2018; Wiklund et al., 2018; Brix et al., unpublished; Christodoulou et al., 2019), including for hydrothermal vent fields, despite their discovery in the 1970s (Ramirez-Llodra et al., 2011).
In vast abyssal plains as well as in continental margins, the level of environmental heterogeneity still has unknown effects on species distribution and dispersal (Danovaro et al., 2020a). Apparently, the environmental conditions at the bathyal and abyssal depths produce a collection of heterogeneous habitats over different geographic and bathymetric scales (Ramirez-Llodra et al., 2011; Riehl et al., 2018), although a vast gap of ecological knowledge still exists to date (Danovaro et al., 2017; Ramírez et al., 2017; Afán et al., 2018; Glover et al., 2018; Wiklund et al., 2018; Brix et al., unpublished; Christodoulou et al., 2019). Thus far, the contribution of these habitats to the maintenance of other pelagic and shallow-water species in terms of energy fluxes through predator–prey relationships or in provision of shelter (i.e., nursery areas) for the early life stages is still largely unknown (De Leo et al., 2010; Morato et al., 2010). Most of the described geomorphologies and habitats present specific interactions with hydrographic and biogeochemical cycles, resulting in the concentration of species into potential hotspots for biodiversity (de Forges et al., 2000). The dispersal routes are largely unknown, and species may have larger distribution ranges in deep water than in shallow water and in pelagic environments than in benthic environments (Costello and Chaudhary, 2017).
Mora et al. (2011) suggested that some 86% of existing species on Earth and 91% of species in the ocean remain unknown, with likely ∼8.7 million (± 1.3 million SE) species globally, of which ∼2.2 million (± 0.18 million SE) are marine. The trend of species discovery is supposed to increase in deep-sea areas as explorations via robotic autonomous technologies progress further (Aguzzi et al., 2019). In the near future, the number of deep-sea species could even exceed that of coastal areas. This could be true when considering the potential discovery and description of new endemic, parasitic, and microbial species (Bass et al., 2007; Costello, 2016; Costello and Chaudhary, 2017). In the UN Decade on Biodiversity (2000–2010), deep-sea ecological research has accelerated in the context of large transnational projects such as the Census of Marine Life (CoML), enabling cooperation among more than 80 countries to discover the biodiversity of the oceans (Costello et al., 2010a; McIntyre, 2010; Snelgrove, 2010). Even so, the census of species remains in its infancy (e.g., Mora et al., 2011).
Measuring Deep-Sea Biodiversity for Ecosystem Functioning, Productivity, and Management
Ecosystem functioning and productivity depend on the quantity and rate of biogeochemical cycling (e.g., the exchange of carbon as energy flux) among species within a community (Smith et al., 2009). Accordingly, the trophic web architecture can be described by assigning to each species a certain role (based on life traits spanning from behavior to reproduction and growth cycles and prey–predator relationships) (Woodward et al., 2005; Brose et al., 2019). In this framework, measuring deep-sea biodiversity and associating it with flux performance is a major challenge of deep-sea ecology. At the same time, species loss has had unpredicted effects on overall functioning, which creates a feedback loop that alters species biomass productivity (Danovaro et al., 2008b; Johnson et al., 2017; Turner et al., 2017), while high biodiversity levels increase ecosystem resilience to perturbations (e.g., Elmqvist et al., 2003; Hughes et al., 2007). Therefore, biodiversity maintenance is a significant management objective in the pursuit of the sustainable use of resources (Kachelriess et al., 2014).
Identifying priority areas for biodiversity management and conservation is important for policy programs, for example, the European Commission’s Marine Strategy Framework Directive (Marine Strategy Framework Directive [MSFD], 2018, Directive 2008/56/EC), identified as “Biodiversity” descriptor no. 1. Similarly, United Nations efforts have been dedicated to the characterization of biodiversity beyond the national jurisdiction (BBNJ; Ardron et al., 2014; Danovaro et al., 2017). Considering the insufficient ecological information in deep-sea ecosystems, more species life history data collection, e.g., distribution, trophic level, and behavioral interactions, is required to drive sound conservation and management policies (e.g., Danovaro et al., 2020a).
Danovaro et al. (2020a) provided a list of biodiversity components to be measured for the monitoring and conservation of deep-sea ecosystems. Organisms ranging in body size from macrofauna to megafauna were considered as conservation targets because they are the top-down controllers of ecosystem functioning in both the pelagic and benthic realms (i.e., predators and prey in mid-superior trophic levels). In contrast, knowledge gaps on biodiversity and ecosystem functioning were identified at the level of intermediate-sized species, such as meiofauna and macrofauna. These components also play a major role in the regulation of deep-sea ecosystems and the global biosphere (Fanelli et al., 2017, 2011a,b; Gambi et al., 2014; Baguley et al., 2015; Van der Grient and Rogers, 2015; Rosli et al., 2017), similar to the dominant microbial fraction (i.e., viral and bacterial; Danovaro et al., 2015).
Our Objectives
The scientific literature produced on biodiversity is vast and diverse in terms of objectives and covered aspects. New informatics-based statistical tools could be used to monitor its comprehensive status to highlight global research topics and their spatiotemporal trends. Science mapping (Zupic and Ćater, 2015; van Eck and Waltman, 2017) is an emerging method of research review designed to synthesize patterns of knowledge production within a discipline, as opposed to synthesizing substantive findings (White and McCain, 1998; Nerur et al., 2008; Zupic and Ćater, 2015). This is an interdisciplinary field emerging from traditional library information science in the areas of scientometrics, citation analysis, and computer science within the sub-areas of information visualization, visual analytics, data mining, and knowledge discovery.
In this study, we aimed to comprehensively review the status of deep-sea biodiversity research as emerging categories and their spatiotemporal trends with a “science mapping” approach. Such an approach serves to provide a systematic, comprehensive bibliometric synthesis of the deep-sea ecology literature topics and trends to (i) document the size, growth trajectory, and geographic distribution of research efforts and (ii) highlight its established and emerging topics for management and conservation.
Materials and Methods
Database Search
The Scopus database is highly representative of scientific publications in the field of natural sciences (Mongeon and Paul-Hus, 2016) and was consulted on August 21, 2019 to retrieve bibliographic records related to deep-sea biodiversity research for the 1993–2019 period. No substantial and consistent records existed in Scopus before 1993 (only two records). A random check of 25% of publications was conducted to ensure consistency in the datasets and avoid false records. To identify relevant “deep-sea” and “biodiversity” publications, the following keywords were used in the combined fields of Title, Abstract, and Keywords (per publication): deep-sea and biodiversity. The search was restricted to all published or in press manuscripts with digital object identifier (DOI; articles, reviews, books, and chapter of books) for Scopus (see all EndNote input files for the Scopus analyses in Supplementary Data Sheet 1).
Bibliometric Analysis
A preliminary general quantitative description of the bibliographic records was conducted, and the trends in deep-sea biodiversity publications from 1993 to 2019 were reported. Then, the temporal change in the research activity was evaluated by subdividing the publications into two blocks of similar sample sizes: 1993–2010 and 2011–2019, which had 617 and 670 publications, respectively. This temporal subdivision was created to obtain two temporal blocks encompassing a statistically relevant number of publications to significantly evidence modifications in research topics. From 1993 to 2000, only 73 publications were found, so the first block mostly encompassed publications produced from 2000 to 2010. The maps of the deep-sea biodiversity publications around the world and in EU countries (considering the affiliation of all authors contributing to each paper) were created using color intensities related to the number of publications. The number of publications was counted considering all co-authors of a paper.
Bibliometric maps were created with the retrieved publications using the software “visualization of similarities” (VOS) viewer (version 1.6.5.0)1. This software was specifically developed for visualizing and exploring bibliometric maps of scientific topics (van Eck and Waltman, 2010). We produced “term maps” as two-dimensional representations of a research field, in which strongly related terms were located close to each other (see below). Natural language processing techniques and a linguistic filter were employed by the software, and terms occurring in titles, abstracts, and keywords of publications were extracted and represented on the map as circles (van Eck and Waltman, 2011). Only terms that occurred at least 10 times were extracted from the retrieved publications. Thus, the term maps provided overviews for identifying the content structure of a topic.
Before starting with the analysis in VOSviewer, a thesaurus file was created to ensure consistency for different spellings and synonyms of the same term (Supplementary Data Sheet 2). VOSviewer also offers the possibility to clean the data by omitting those terms that are not considered for analyses. Using this software functionality, we cleaned the data by omitting terms related to time, publishers’ names, and geographical locations (i.e., names of cities or countries) or terms that could be used ambiguously (e.g., addition, view, objective, and opinion). It should be noted, however, that a term map represents a simplified version of reality, which can lead to loss of information and to a partial representation of the investigated field (van Raan, 2014).
To display the elements on maps, the software uses a VOS mapping technique that is closely related to the multidimensional scaling method (van Eck and Waltman, 2010). The mapping technique minimizes the weighted sum of squared Euclidean distances between all pairs of items through an optimization process. This mapping approach allows the terms on the map to be aligned in a way that the distance between each pair of terms represents their similarity as accurately as possible. In a term map, similarities among terms are calculated based on their number of co-occurrences in the title or abstract of the same publication (for further explanation of the method, see van Eck and Waltman, 2010; Pallottino et al., 2018; Costa et al., 2019). The larger the number of publications in which two terms co-occur, the more strongly the terms are related to each other. Therefore, terms that often co-occur in the same publications are located close to each other in a term map, and less strongly related terms (low co-occurrence) are located further away from each other. Each term is represented by a circle, where its diameter and the size of its label indicate the number of publications where the term appears in the title, abstract, or keywords. Once the terms are on the map, the next step is to identify clusters of related terms.
For the clustering of terms, the software uses a weighted and parameterized variant called the VOS clustering technique (Waltman et al., 2010; Waltman and van Eck, 2013). The assignment of terms to the same cluster depends on their co-occurrences in the titles or abstracts of publications. More specifically, terms that often co-occur are strongly related to each other and are assigned automatically to the same cluster. In contrast, terms with a low co-occurrence or no-occurrences at all are assigned to different clusters. A cluster that is made up of terms of the same colors represents a research theme in which one or more research topics can be identified. Although VOSviewer offers the possibility to change the number of clusters by changing the resolution parameters, we used the default setting, which is equal to one. Three different maps were generated. The first included all bibliographic records (from 1993 to 2019), and the other two split the entire dataset into two periods: earlier (from 1993 to 2010) and later (from 2011 to 2019) (see above).
We also produced “term citation” and a “term year” maps. A term citation map analyzes the scientific impact of a specific topic, whereas a term year map performs a timeline analysis of the research topics. More specifically, in the term citation map, the color of a term is determined by the average citation impact of the publications where the term occurs, thus reflecting the term by average citation impact rather than by cluster (as in the term map). To avoid biases related to the age of a publication (older publications are expected to cited more frequently), the number of citations in each publication is divided by the average number of citations of all publications appearing in the same year. This produces a publication’s normalized citation score, which ranges from 0 to 2. On the map, colors were assigned according to score and range from blue (average score of 0) to green (average score of 1) to red (average score of 2). Therefore, blue (cold) or red (hot) terms indicate those publications in which the term had low and high average citation impacts, respectively (van Eck et al., 2013). On term year maps, the color of a term indicates the average publication year of all the publications in which the term occurs. For the term citation map, we used colors that ranged from blue (mean year term presence in 2008 or earlier) to green (2011) and to red (2014 or later). Therefore, the blue terms were those that occurred mainly in older publications, while red terms occurred mainly in more recent publications. To avoid overlapping labels, only a subset of these was displayed on the maps. To navigate the maps with all labels, VOSviewer Map and Network files are available as Supplementary Data Sheets 3 and 4, respectively.
Results
A total of 1287 scientific publications were recorded from Scopus that fit the search query for “deep-sea” and “biodiversity.” Approximately 88% were research papers, 7.8% were review papers, 3.2% were book chapters, and the remaining 1.1% were books.
Studies were published in 148 journals, mostly in Deep Sea Research Part II (Topical Studies in Oceanography; N = 140; 12.9%), Deep Sea Research Part I (Oceanographic Research Papers; N = 101; 9.3%), PLoS One (N = 80; 7.4%), Zootaxa (N = 34; 3.1%), and, finally, Frontiers in Marine Science (N = 30; 2.8%). One should notice that PLoS One was created more recently than the others (2006), which highlights its presence in the deep-sea biodiversity research field.
Publication Trends
The analysis of the trend in the number of deep-sea biodiversity publications from 1993 to 2019 (Figure 1) indicated a progressive increase, with an accelerated rate after 2002, and the total number of publications was only approximately 6.9 per year. The number of publications generally increased at a higher rate after 2003. As the search was conducted on October 1, 2019, the number of publications for that year is underestimated, so the drop in their number does not correspond to a real trend.
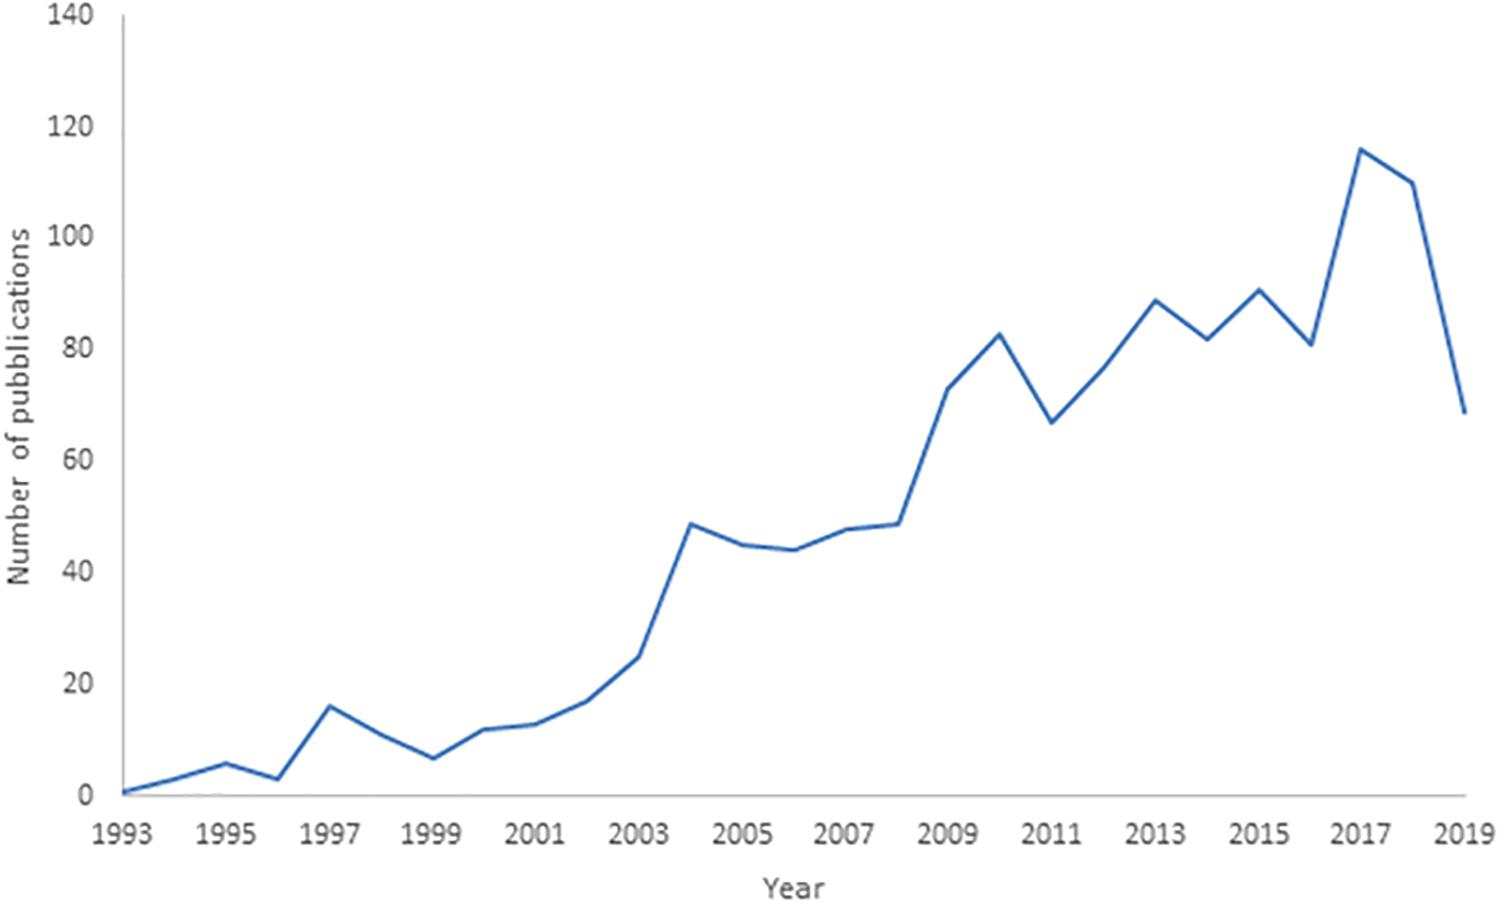
Figure 1. Trend in deep-sea biodiversity as number of publications per year from 1993 to 2019 in Scopus. Note that publications of 2019 in the Scopus database are underestimated (being not yet all included).
The overall analysis of the number of publications dealing with deep-sea biodiversity in the world and in EU countries (Figure 2) showed that research outcomes were published by authors working in 77 different countries. EU scientists authored half (49.9%) of all publications (N = 1176) and were followed by those from the United States (15.6%; N = 370), Japan (4.4%; N = 105), Australia (4.0%; N = 94), Canada (3.5%; N = 82), and finally from the Russian Federation (3.3%; N = 78). In the EU, the United Kingdom led the ranking with 21.4% (252) of all publications, followed by Germany (20.2%, N = 238), France (14.5%; N = 171), Italy (9.9%; N = 117), and Spain (8.8%, N = 104).
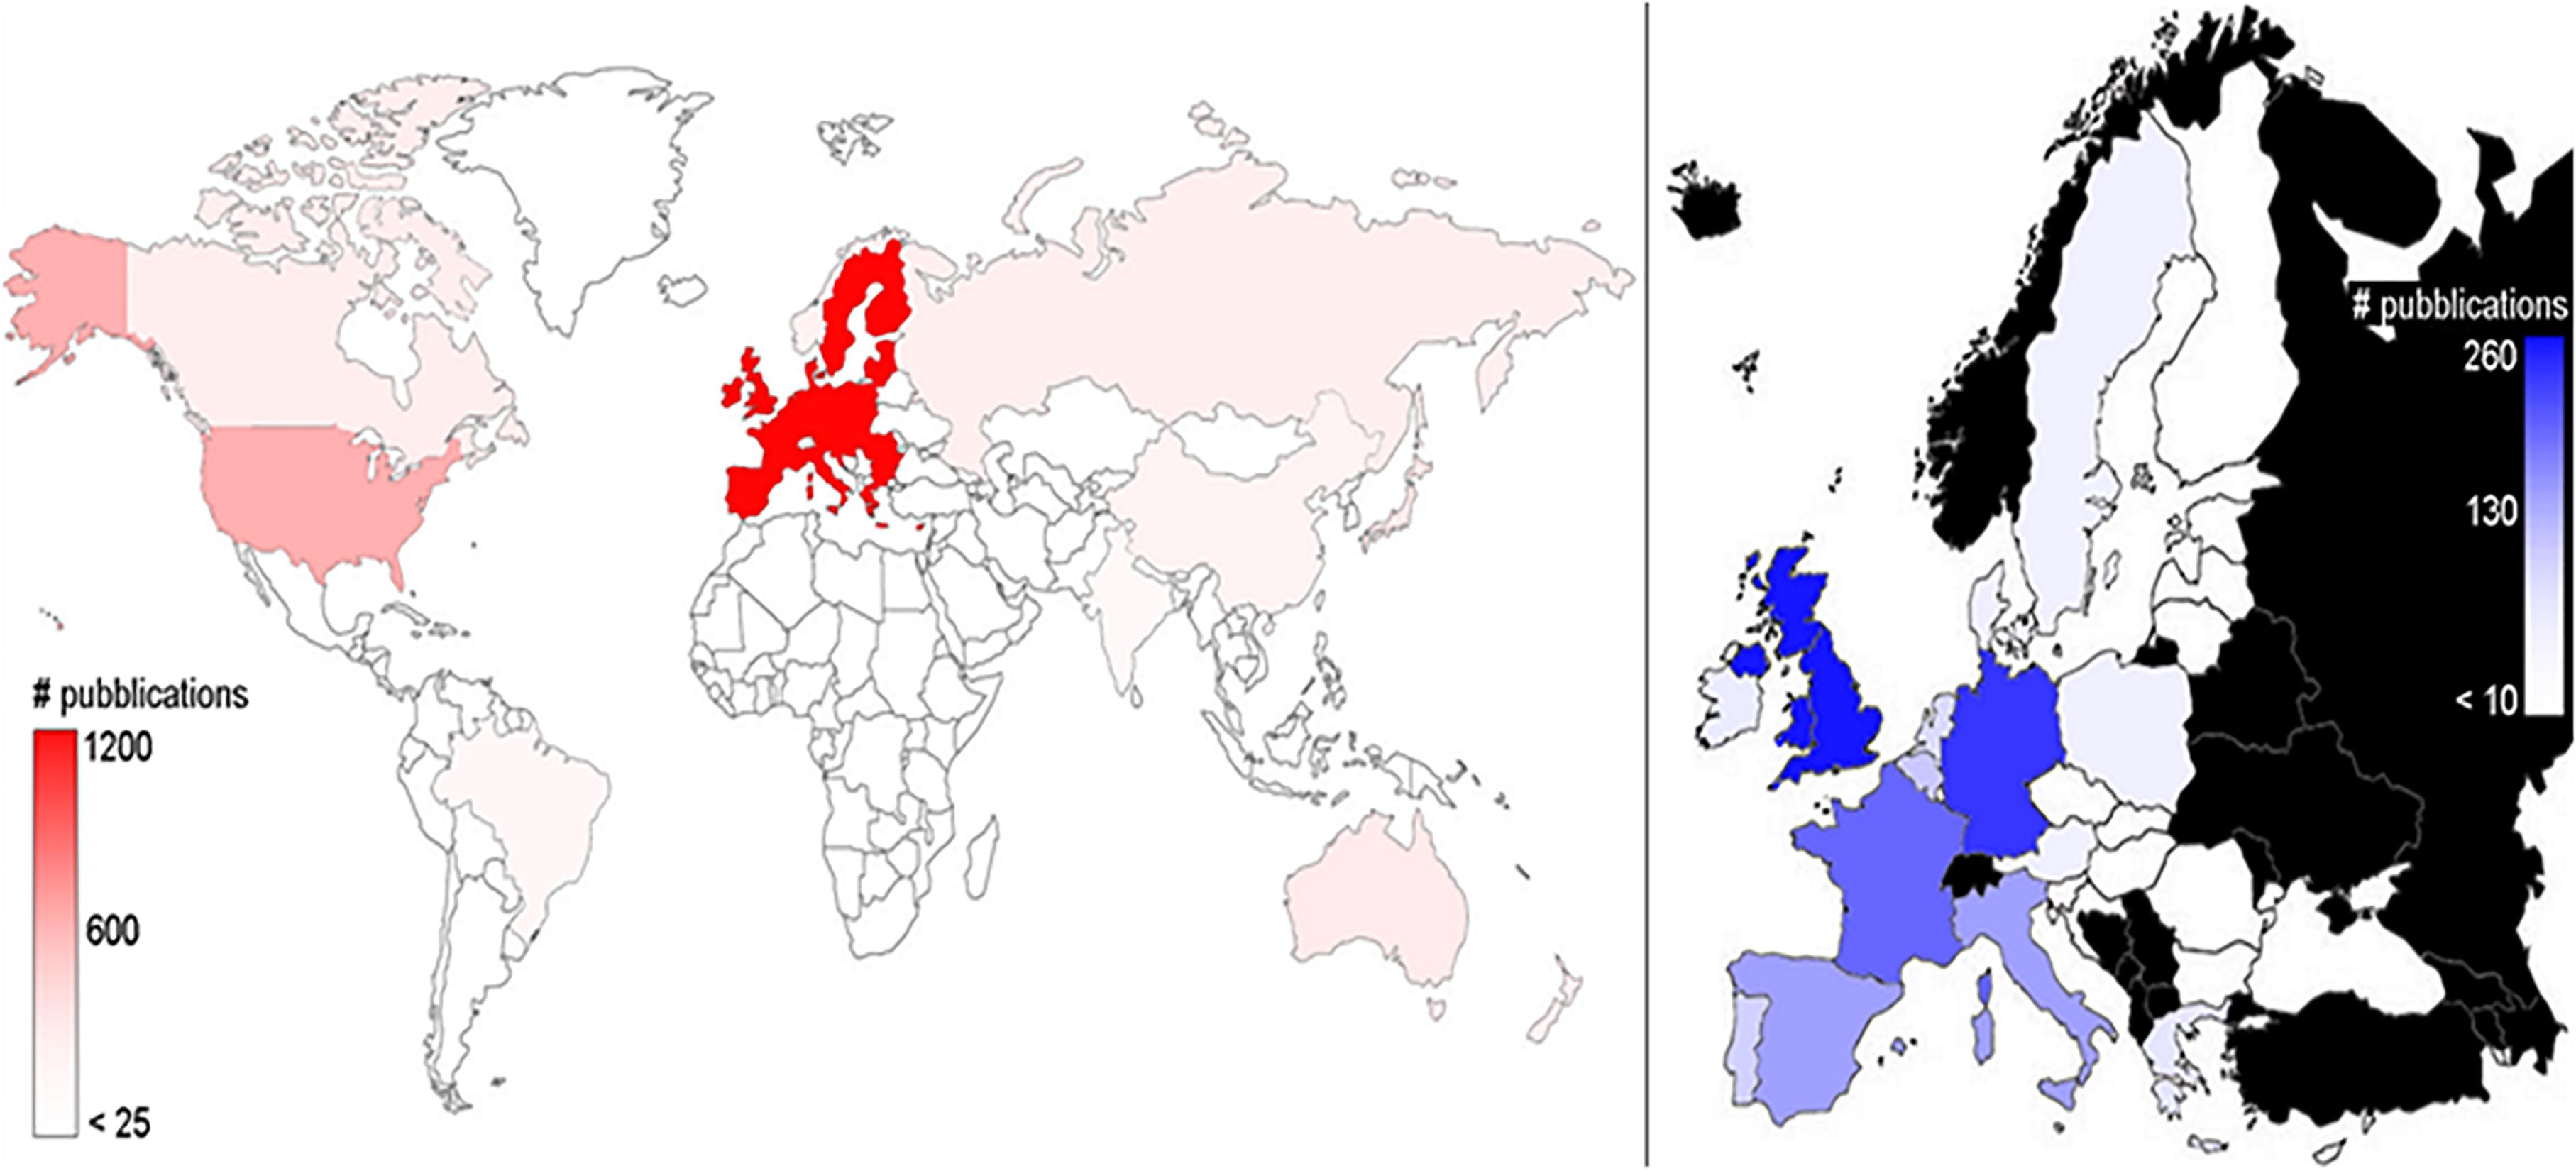
Figure 2. Geographic distribution of the publications on deep-sea biodiversity (1993–2019). Illustrated is the world distribution (left panel) and the European Union distribution (right panel; in black are countries that do not belong to the EU, for which results are not shown). The color intensities are related to the number of publications, as highlighted in the lateral bars.
Evolution of Research Topics and Their Citation Impacts
The term map analysis output for all publications from 1993 to 2019 (Figure 3) depicted major established and emerging topics for deep-sea biodiversity publications. In total, 503 terms were displayed and grouped into four different clusters, which partially overlapped and can be globally summarized by the following informative titles (based on synthetic judgment): (i) biogeochemical, microbial, and molecular analyses (yellow); (ii) biodiversity assessment (blue); (iii) ecosystems conservation and management (green); and, finally, (iv) zoology and taxocoenosis (red).
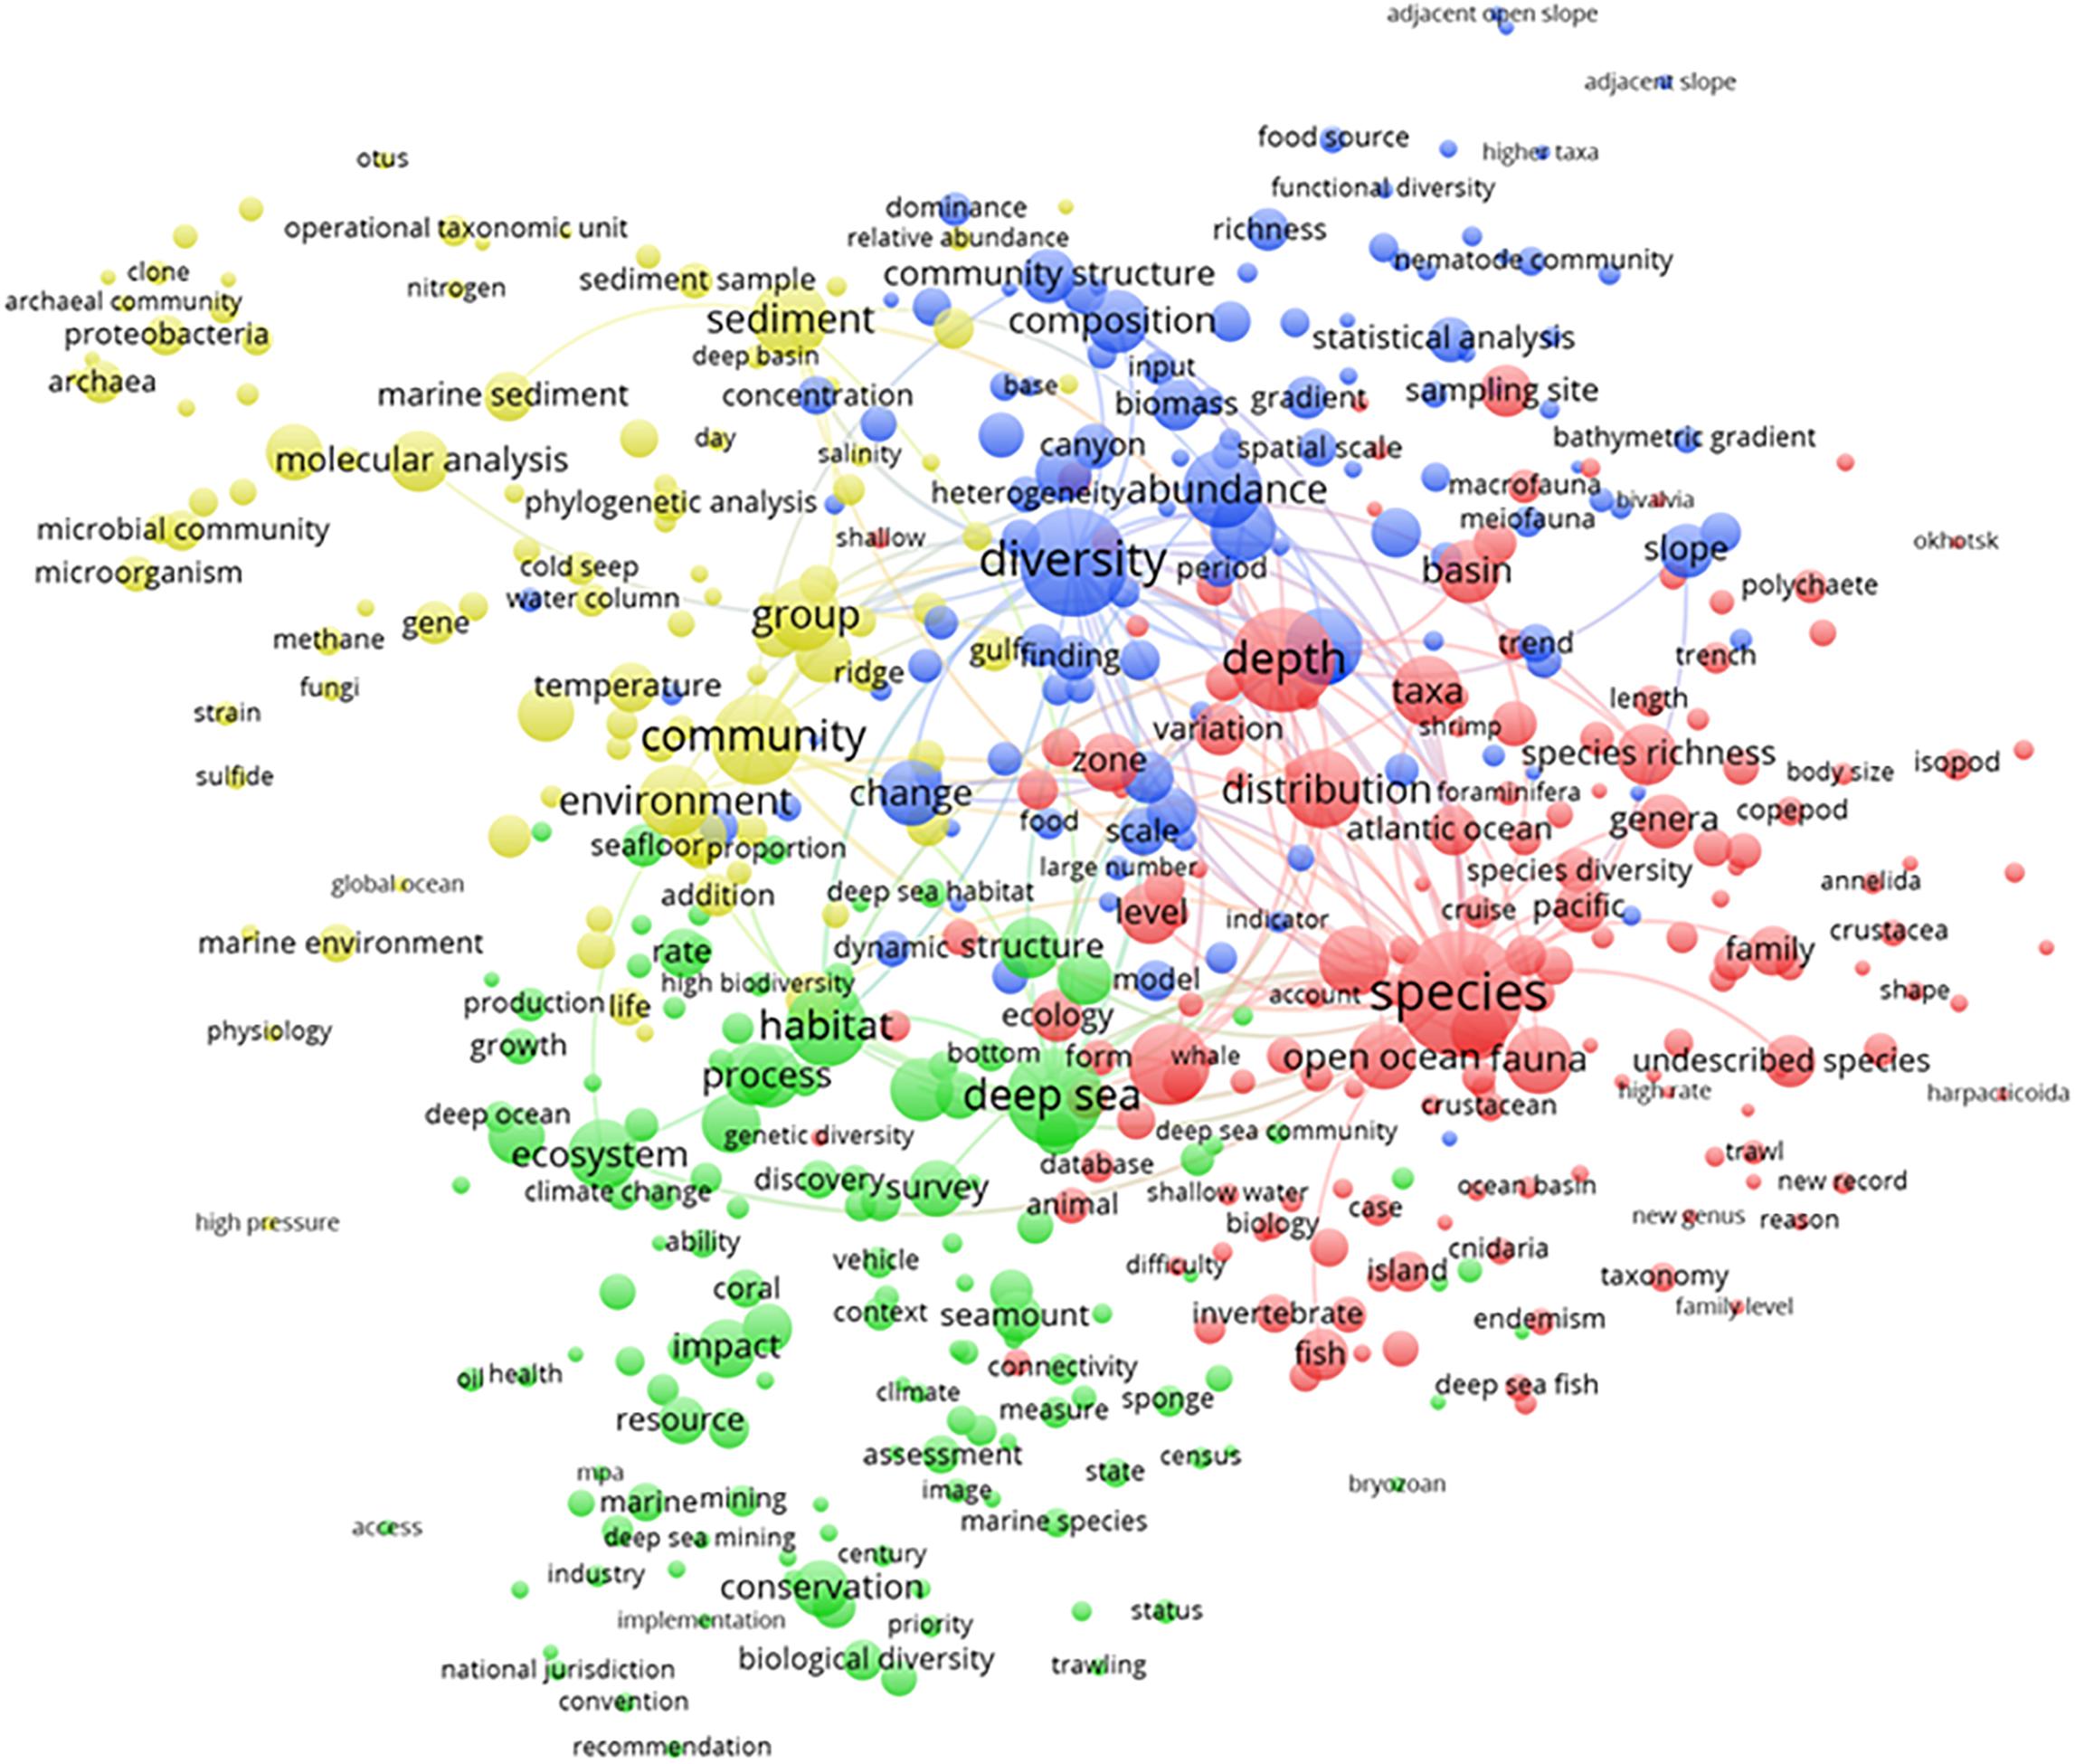
Figure 3. Term map analysis output from 1993 to 2019 depicting the four major clusters, as major established and emerging topics for deep-sea biodiversity publications. Colors are used to identify clusters of related terms and are chosen arbitrarily. Different colors represent the terms belonging to different clusters (see detailed explanation in the text). Lines indicate at least 100 co-occurrence links between terms.
The biogeochemical, microbial, and molecular analyses cluster (yellow; 99 terms) showed the scientific research conducted on benthic microbial communities (i.e., bacteria and archaea) as promoters of biogeochemical cycles in specific geomorphological areas relevant to deep-sea research, such as hydrothermal cold seeps and ridges. Such research mostly focused on phylogenetic analysis through molecular tools to define the operational taxonomic units in seafloor sediment samples.
The biodiversity assessment cluster (blue; 115 terms) mostly indicated studies conducted in relation to species abundance, including geographic and bathymetric gradients, and how these gradients result in a richness, dominance, and taxonomic and trophic structure of the communities, with special reference to meio- and megafauna.
The description of the ecosystems conservation and management cluster (green; 133 terms) mainly referred to research efforts dedicated to the study of the impact of industrial extractive activities for the extraction of resources and energy (e.g., deep-sea fisheries, oil/gas drilling, and mining) in relation to the climate change scenario. Studies have focused on the impacts of those activities on species statuses in iconic seabed areas dominated by coral and sponge aggregates as well as seamounts to promote the conservation of biological diversity. The implementation of management, jurisdiction, and convention practices was evidenced in this domain in association with guidelines for the sustainable use of resources. The correct use of resources was based on the reliable assessment of ecosystem health despite impacts (e.g., via platform technologies).
The description of the zoology and taxocoenosis cluster (red; 156 terms) chiefly referred to research dedicated to the exploration of deep-sea ecosystems in terms of species demographic indicators in abundance, biomass, and distribution as well as geographic ranges. Scientific sampling outcomes were presented in terms of the taxonomic composition of major faunal groups of different body sizes (i.e., meio-, macro-, and megafauna). Data on the discovery of new taxonomical units and the description of cryptic species also appeared in this research area.
Temporal Trends in Deep-Sea Biodiversity Research
The temporal change in research activity is presented in Figure 4. The blue cluster (“biodiversity assessments”) included the yellow cluster (“biogeochemical, microbial, and molecular analyses”) in the period from 1993 to 2010 (Figure 4A). During the following period (Figure 4B), microbial research (as part of the yellow cluster) separated from the biodiversity assessments (the blue) cluster. From 2011 to the present day, the research on biodiversity was separated and bridging research on the “biogeochemical, microbial, and molecular analyses” (yellow cluster) and those on fauna (the red cluster). Research on microbial communities (within the yellow cluster) and fauna was dedicated to the quantification of ecosystem functioning and service status to promote their management and conservation (as the green cluster). As a result, the clustering status of the deep-sea research was quite similar to the status and relationships of the clusters appearing in the term map analysis for the total period (see Figure 3). Interestingly, the ecosystem conservation and management cluster (green), which had the highest number of publications from 1993 to 2010, contracted over time. In the 2010–2019 period, it decreased and was outnumbered by the red cluster.
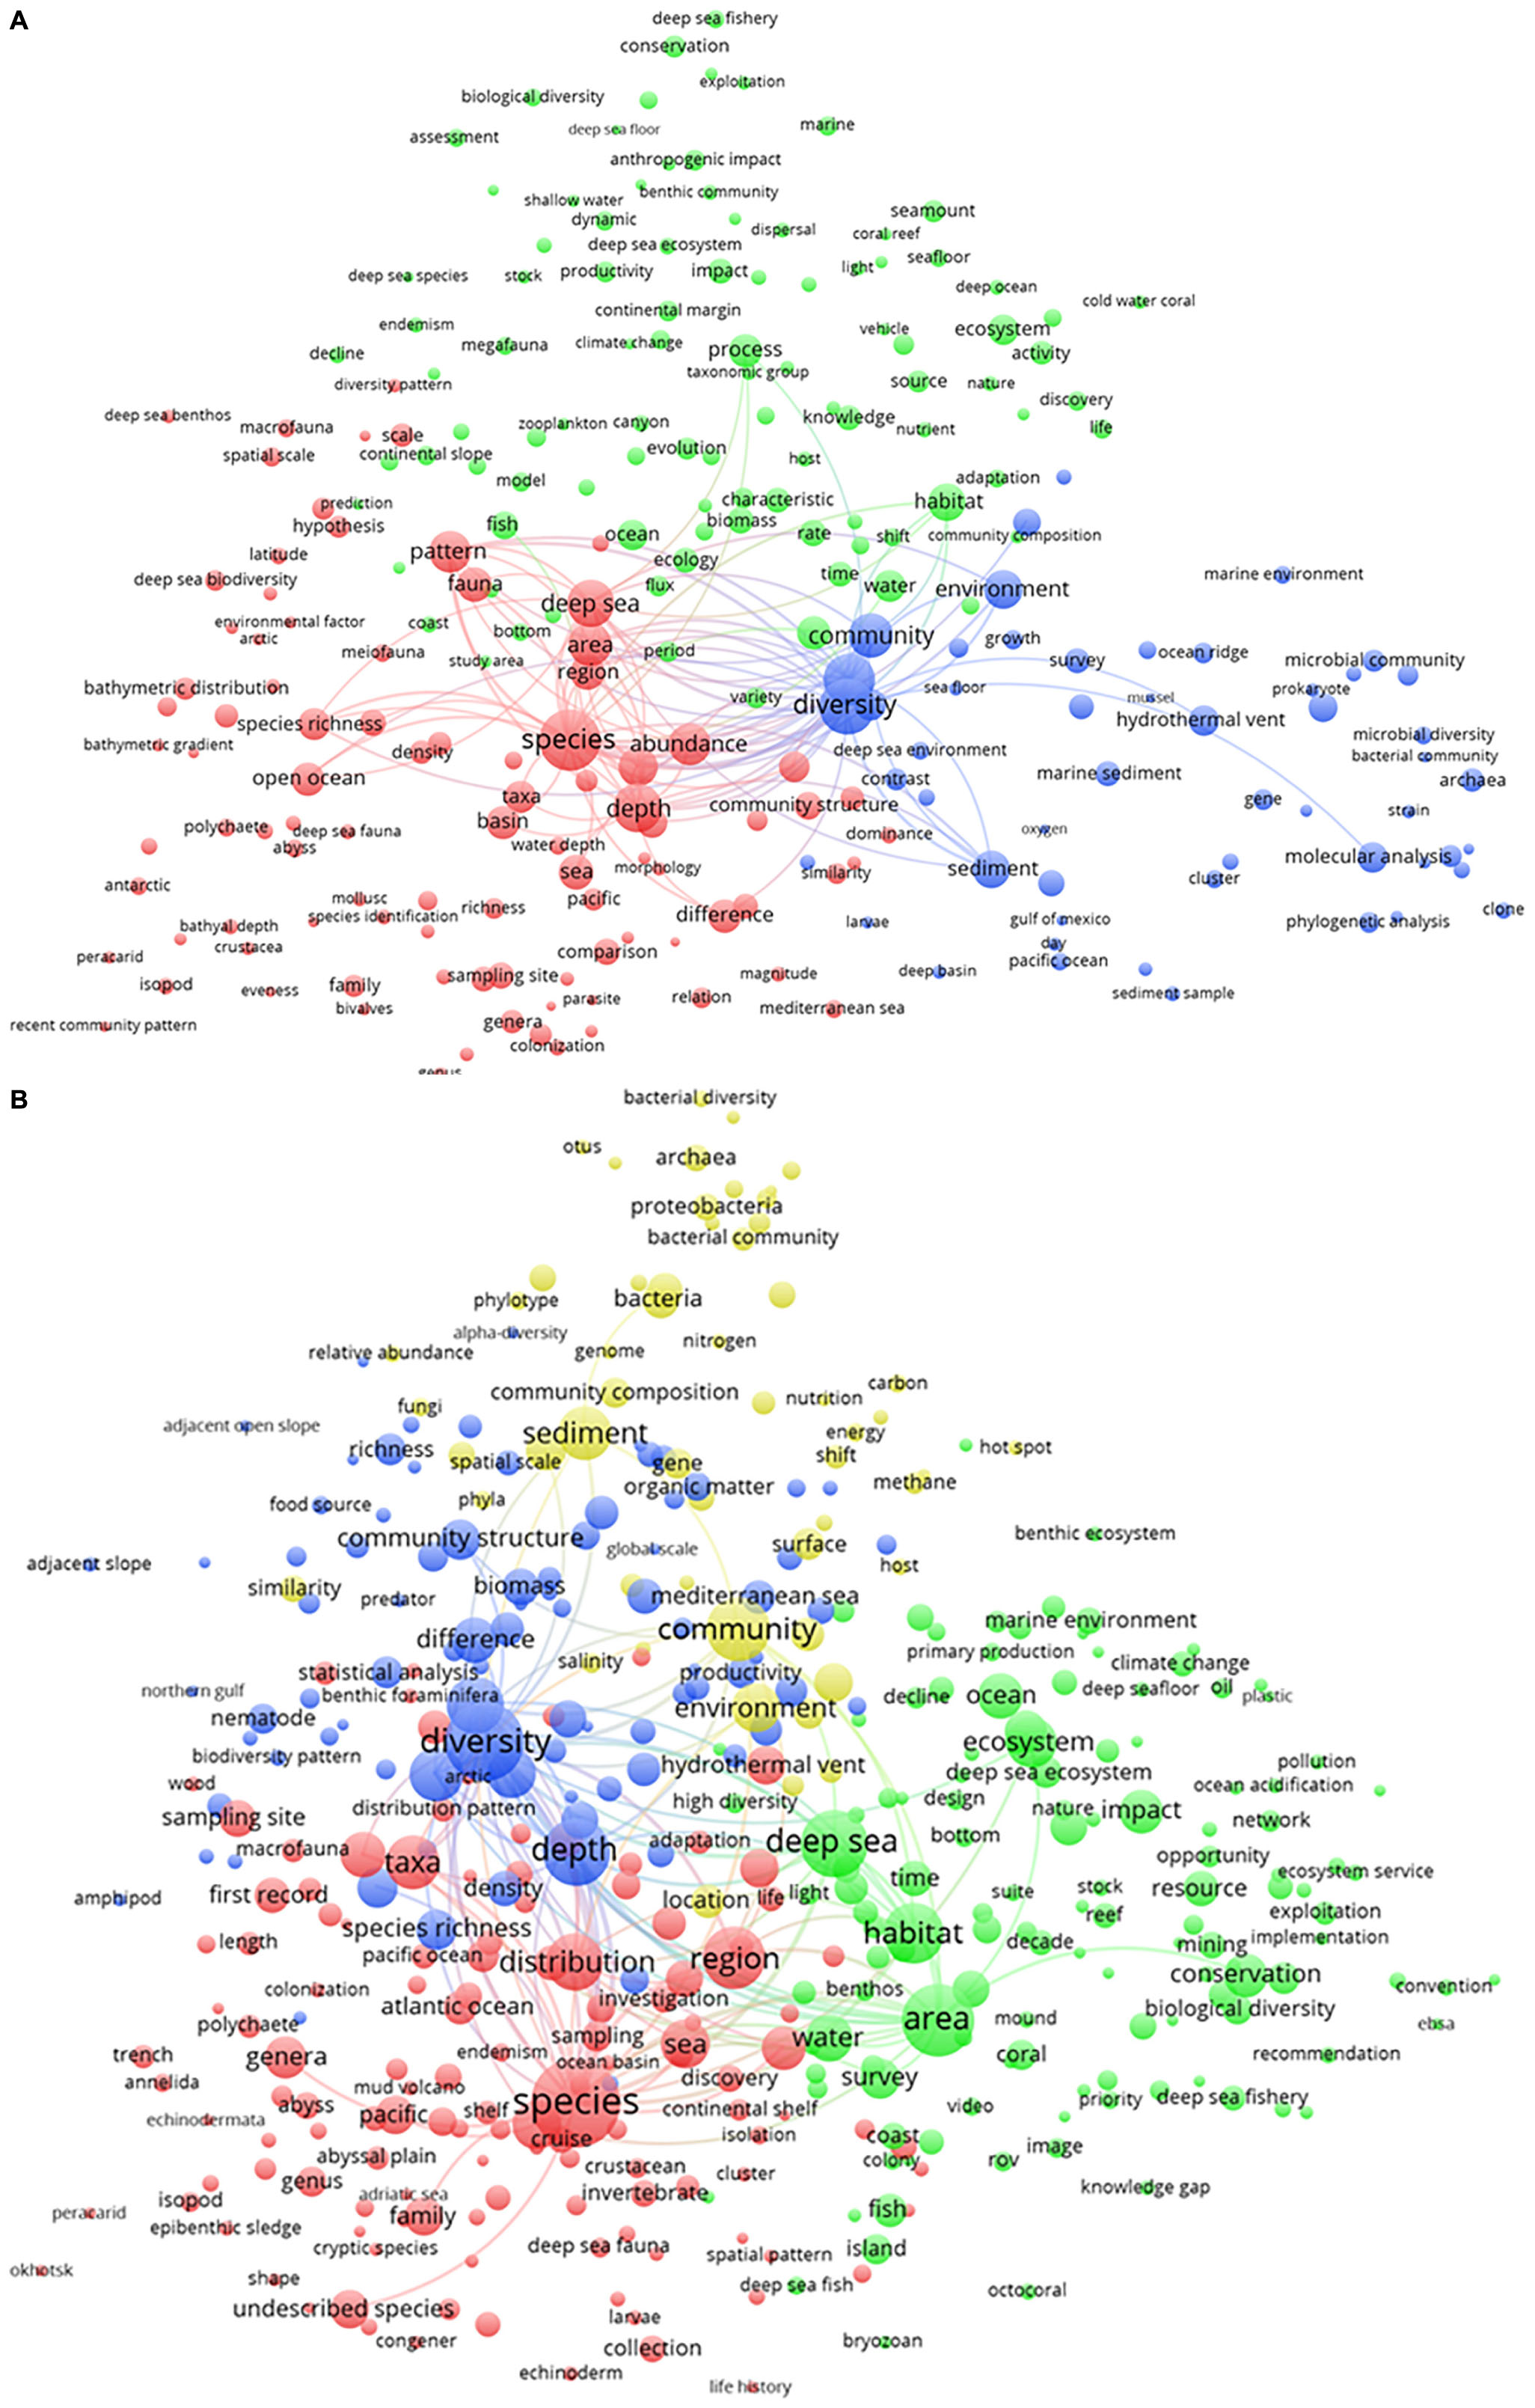
Figure 4. Term map analysis conducted on two different periods: (A) from 1993 to 2010 and (B) from 2011 to 2019. Colors are used to identify clusters of related terms and are chosen arbitrarily. Different colors represent the terms belonging to different clusters (see detailed explanation in the text). Lines indicate at least 100 co-occurrence links between terms.
The description of temporal trends in deep-sea biodiversity research is presented via term year map analysis (Figure 5). We commented only on small peripheral dots because they reflect recent and hence emergent trends that still have few publications in comparison to those that were more persistent (and therefore larger) and located in the central part of the chart. For example, some terms such as “oil,” “services,” “implementation,” and “hot spots,” among others, were emerging elements that chiefly appeared in the previous global analysis shown in Figure 3 and were included in the green cluster of “ecosystems conservation and management.”
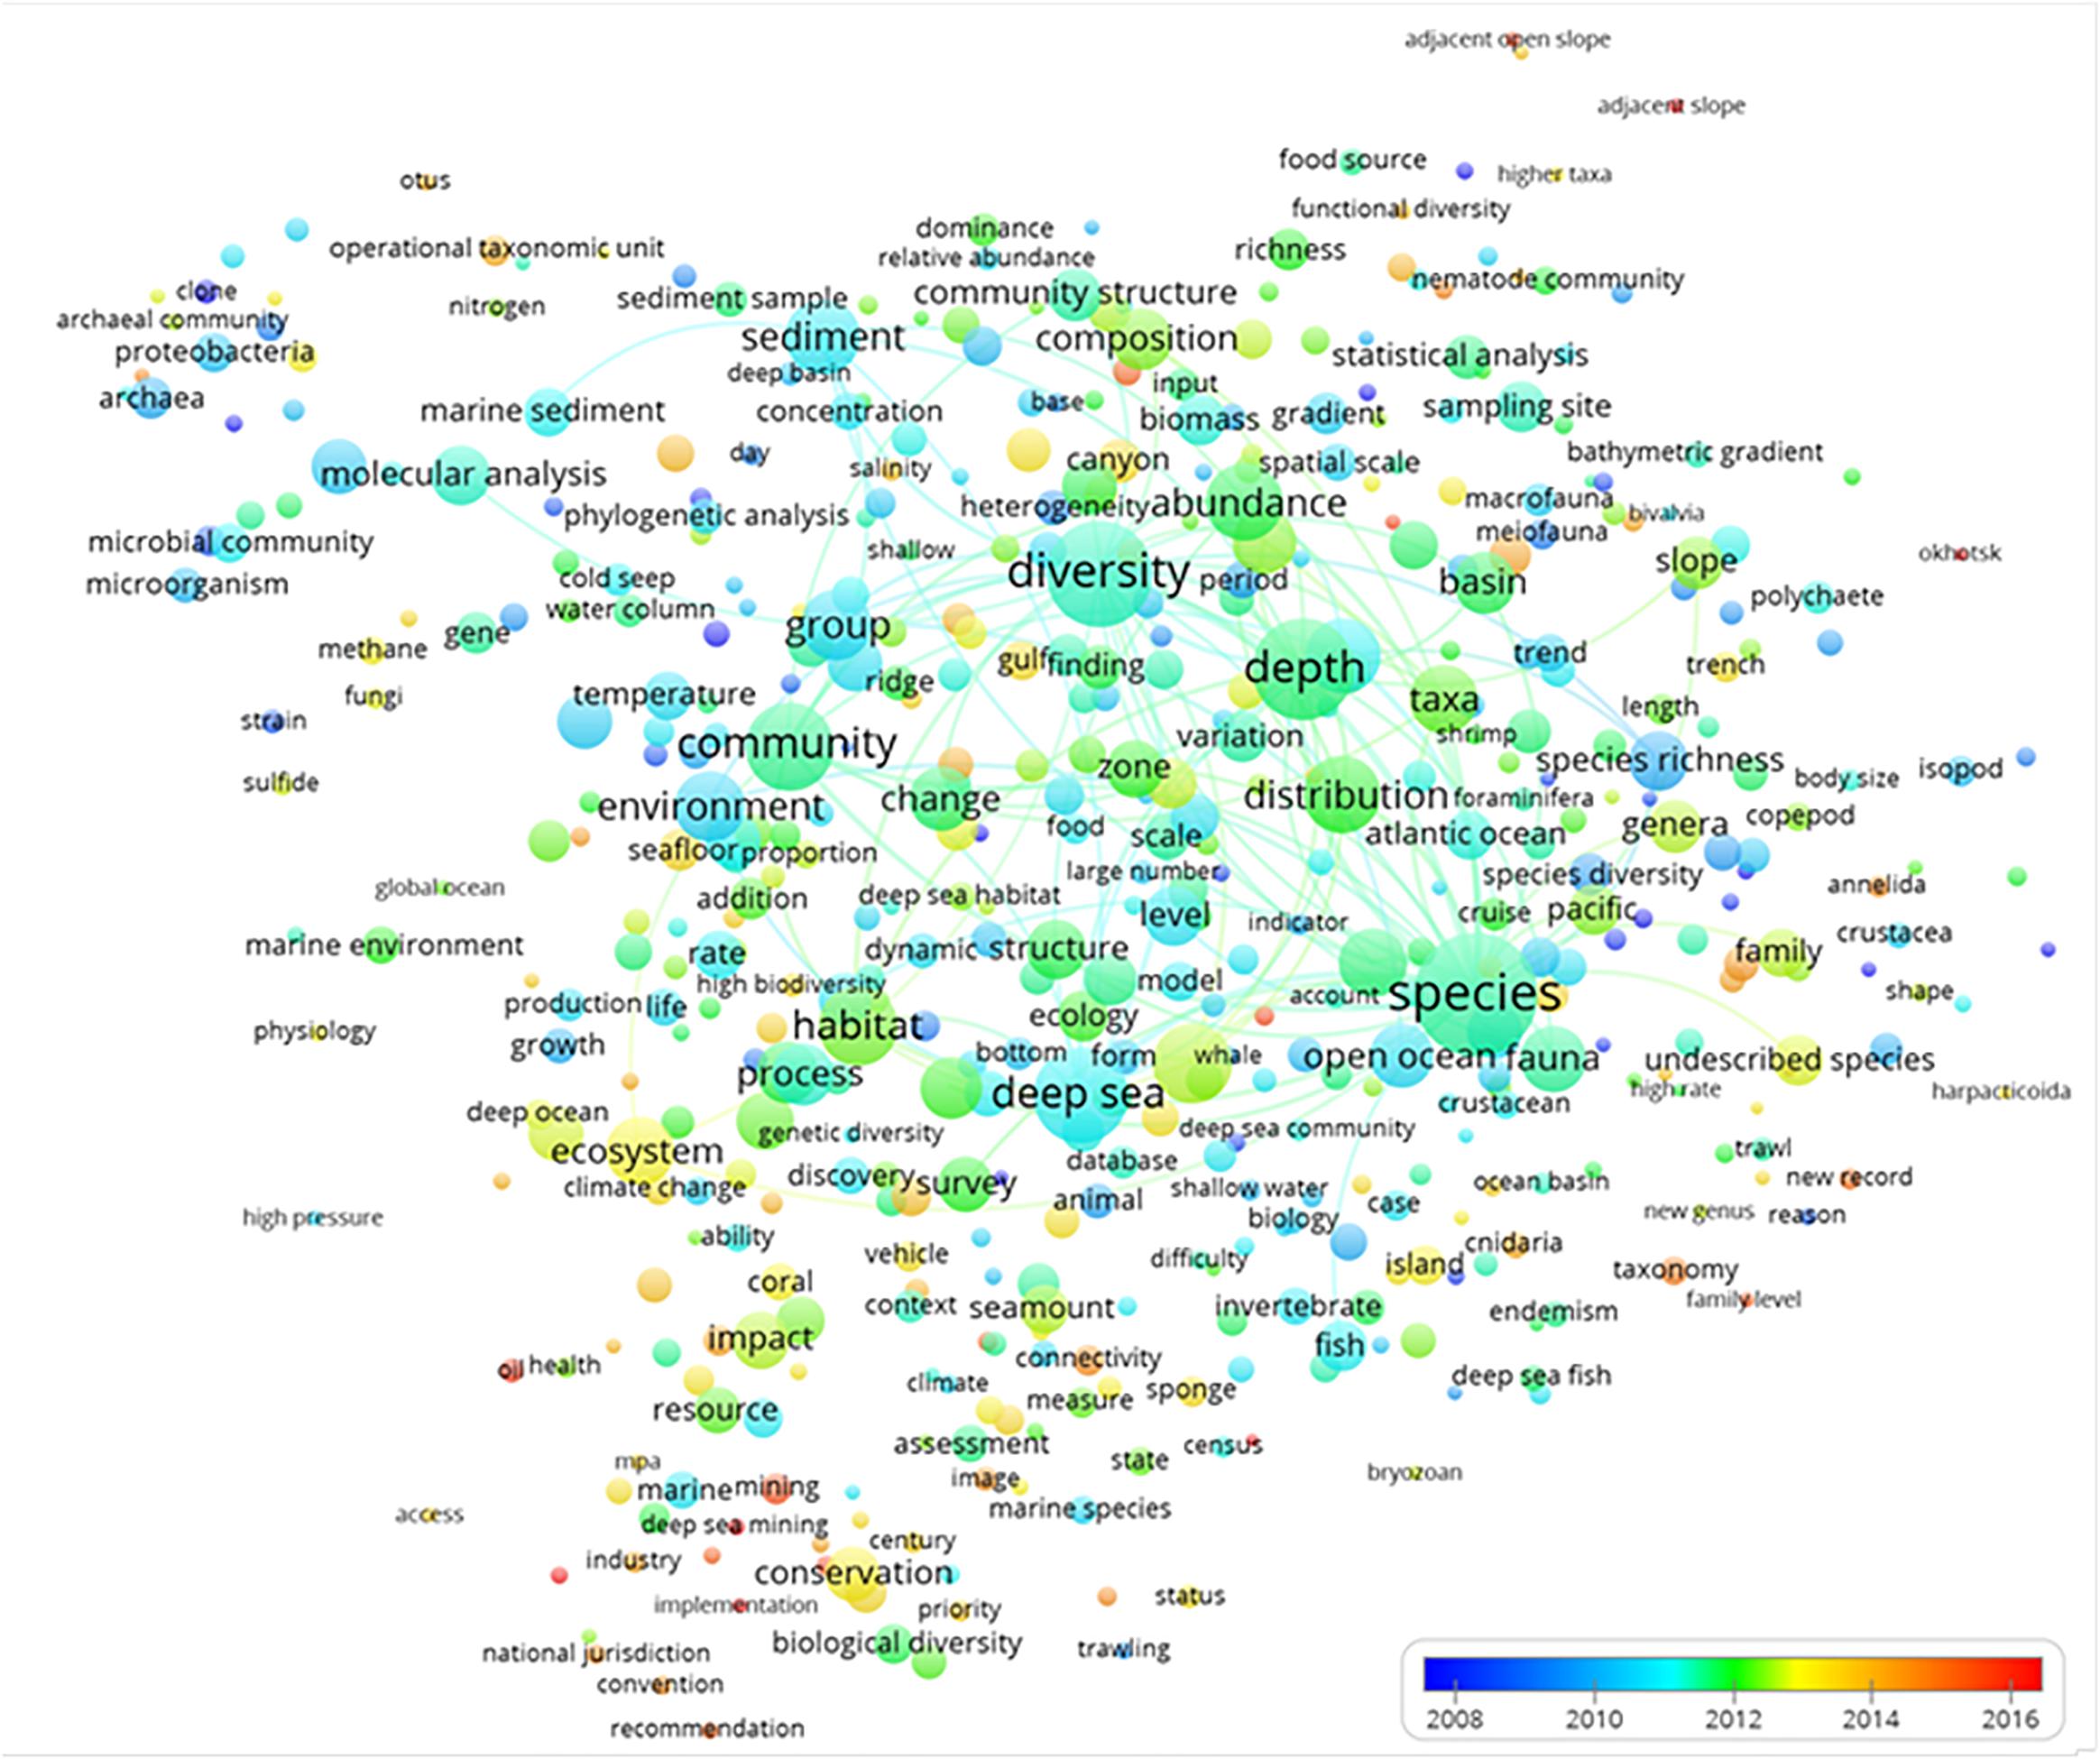
Figure 5. The term average normalized map analysis based on deep-sea biodiversity publications per year. The colors are used to identify clusters of year of publication, with a scale that represents the earlier (blue) or more recent (red) years when the term appeared. Lines indicate at least 100 co-occurrence links between terms.
The normalized term citation map analysis (Figure 6) indicated which hot topics (in red) were receiving more citations. Most of the highly cited terms were small because they had low occurrence rates in the titles, abstracts, or keywords of publications. There were a number of highly cited terms that all belonged to the clusters yellow (“biogeochemical, microbial, and molecular analyses”) and green (“ecosystem conservation and management”), as shown in Figure 3. There were a mix of studies addressing the biogeochemical and microbial aspects of ecosystem functioning in the framework of impact assessment and management. Biogeochemical cycling in terms of carbon flux budgets was considered in relation to microbial communities and their phylogenetic diversity at a global scale despite deep-sea floor alterations produced by industrial activities, which should be governed by national jurisdictions.
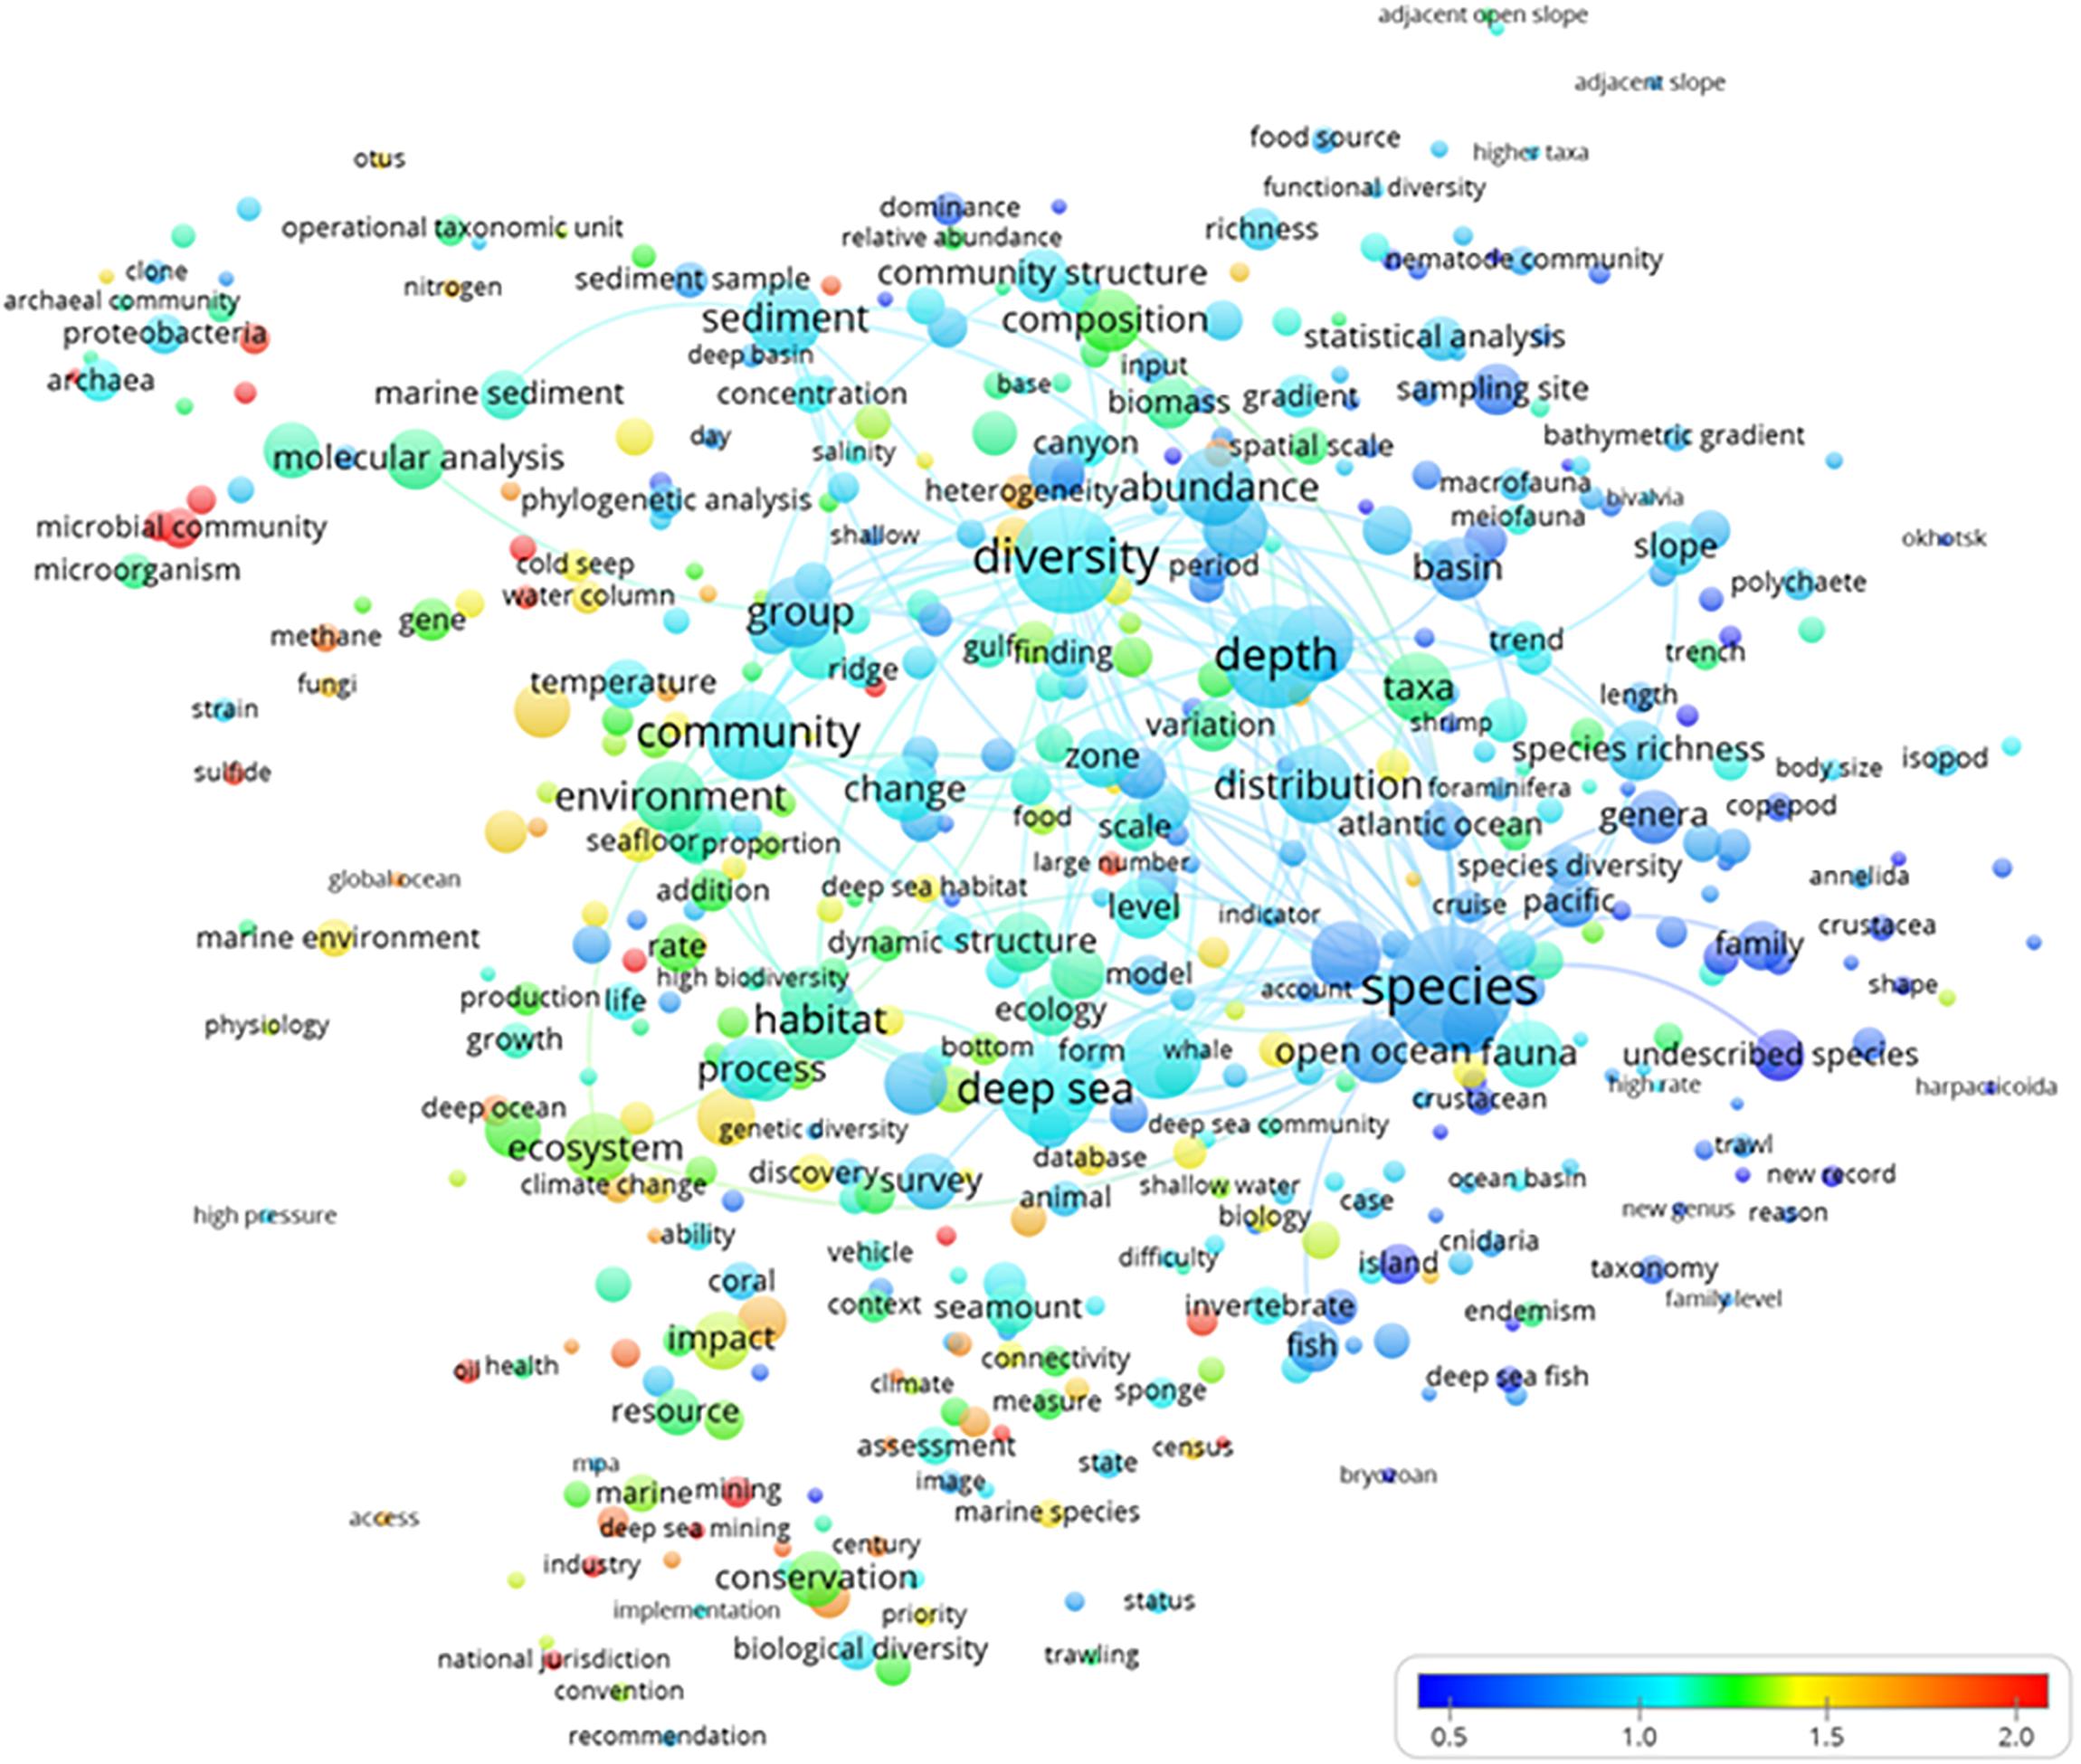
Figure 6. The term average map based on deep-sea biodiversity publications normalized citations. Colors indicate the average citation impact of publications where the term occurs (blue is low; red is high). Lines indicate at least 100 co-occurrence links between terms.
The Contributions of Countries in Deep-Sea Ecological Research
The analyses of the contribution of different countries in the production of deep-sea biodiversity research, which was based on the affiliation of authors in the same paper, as proof of production and collaboration are shown in Figure 7. In that plot, the nodes are the number of authors from the same country, and the node diameter is the interest of that country in deep-sea biodiversity. The presence of the arch between nodes indicates collaboration among researchers from different countries. The cluster indicates that scientific research occurred through established collaborations. In this framework, country-level collaborations were the result of strategic interest in the exploration of different oceans. The United States collaborated with all countries, and the United Kingdom, Germany, and France followed this trend of international collaboration, since all led research in different areas of the Atlantic and the Pacific. China was particularly closely related to the United States in this research area. The United States also collaborated with other northern countries in Europe. In contrast, southern EU countries more frequently collaborated with each other, which indicated that Mediterranean deep-sea research is chiefly driven by the collaborative efforts of Greece, Italy, and Spain.
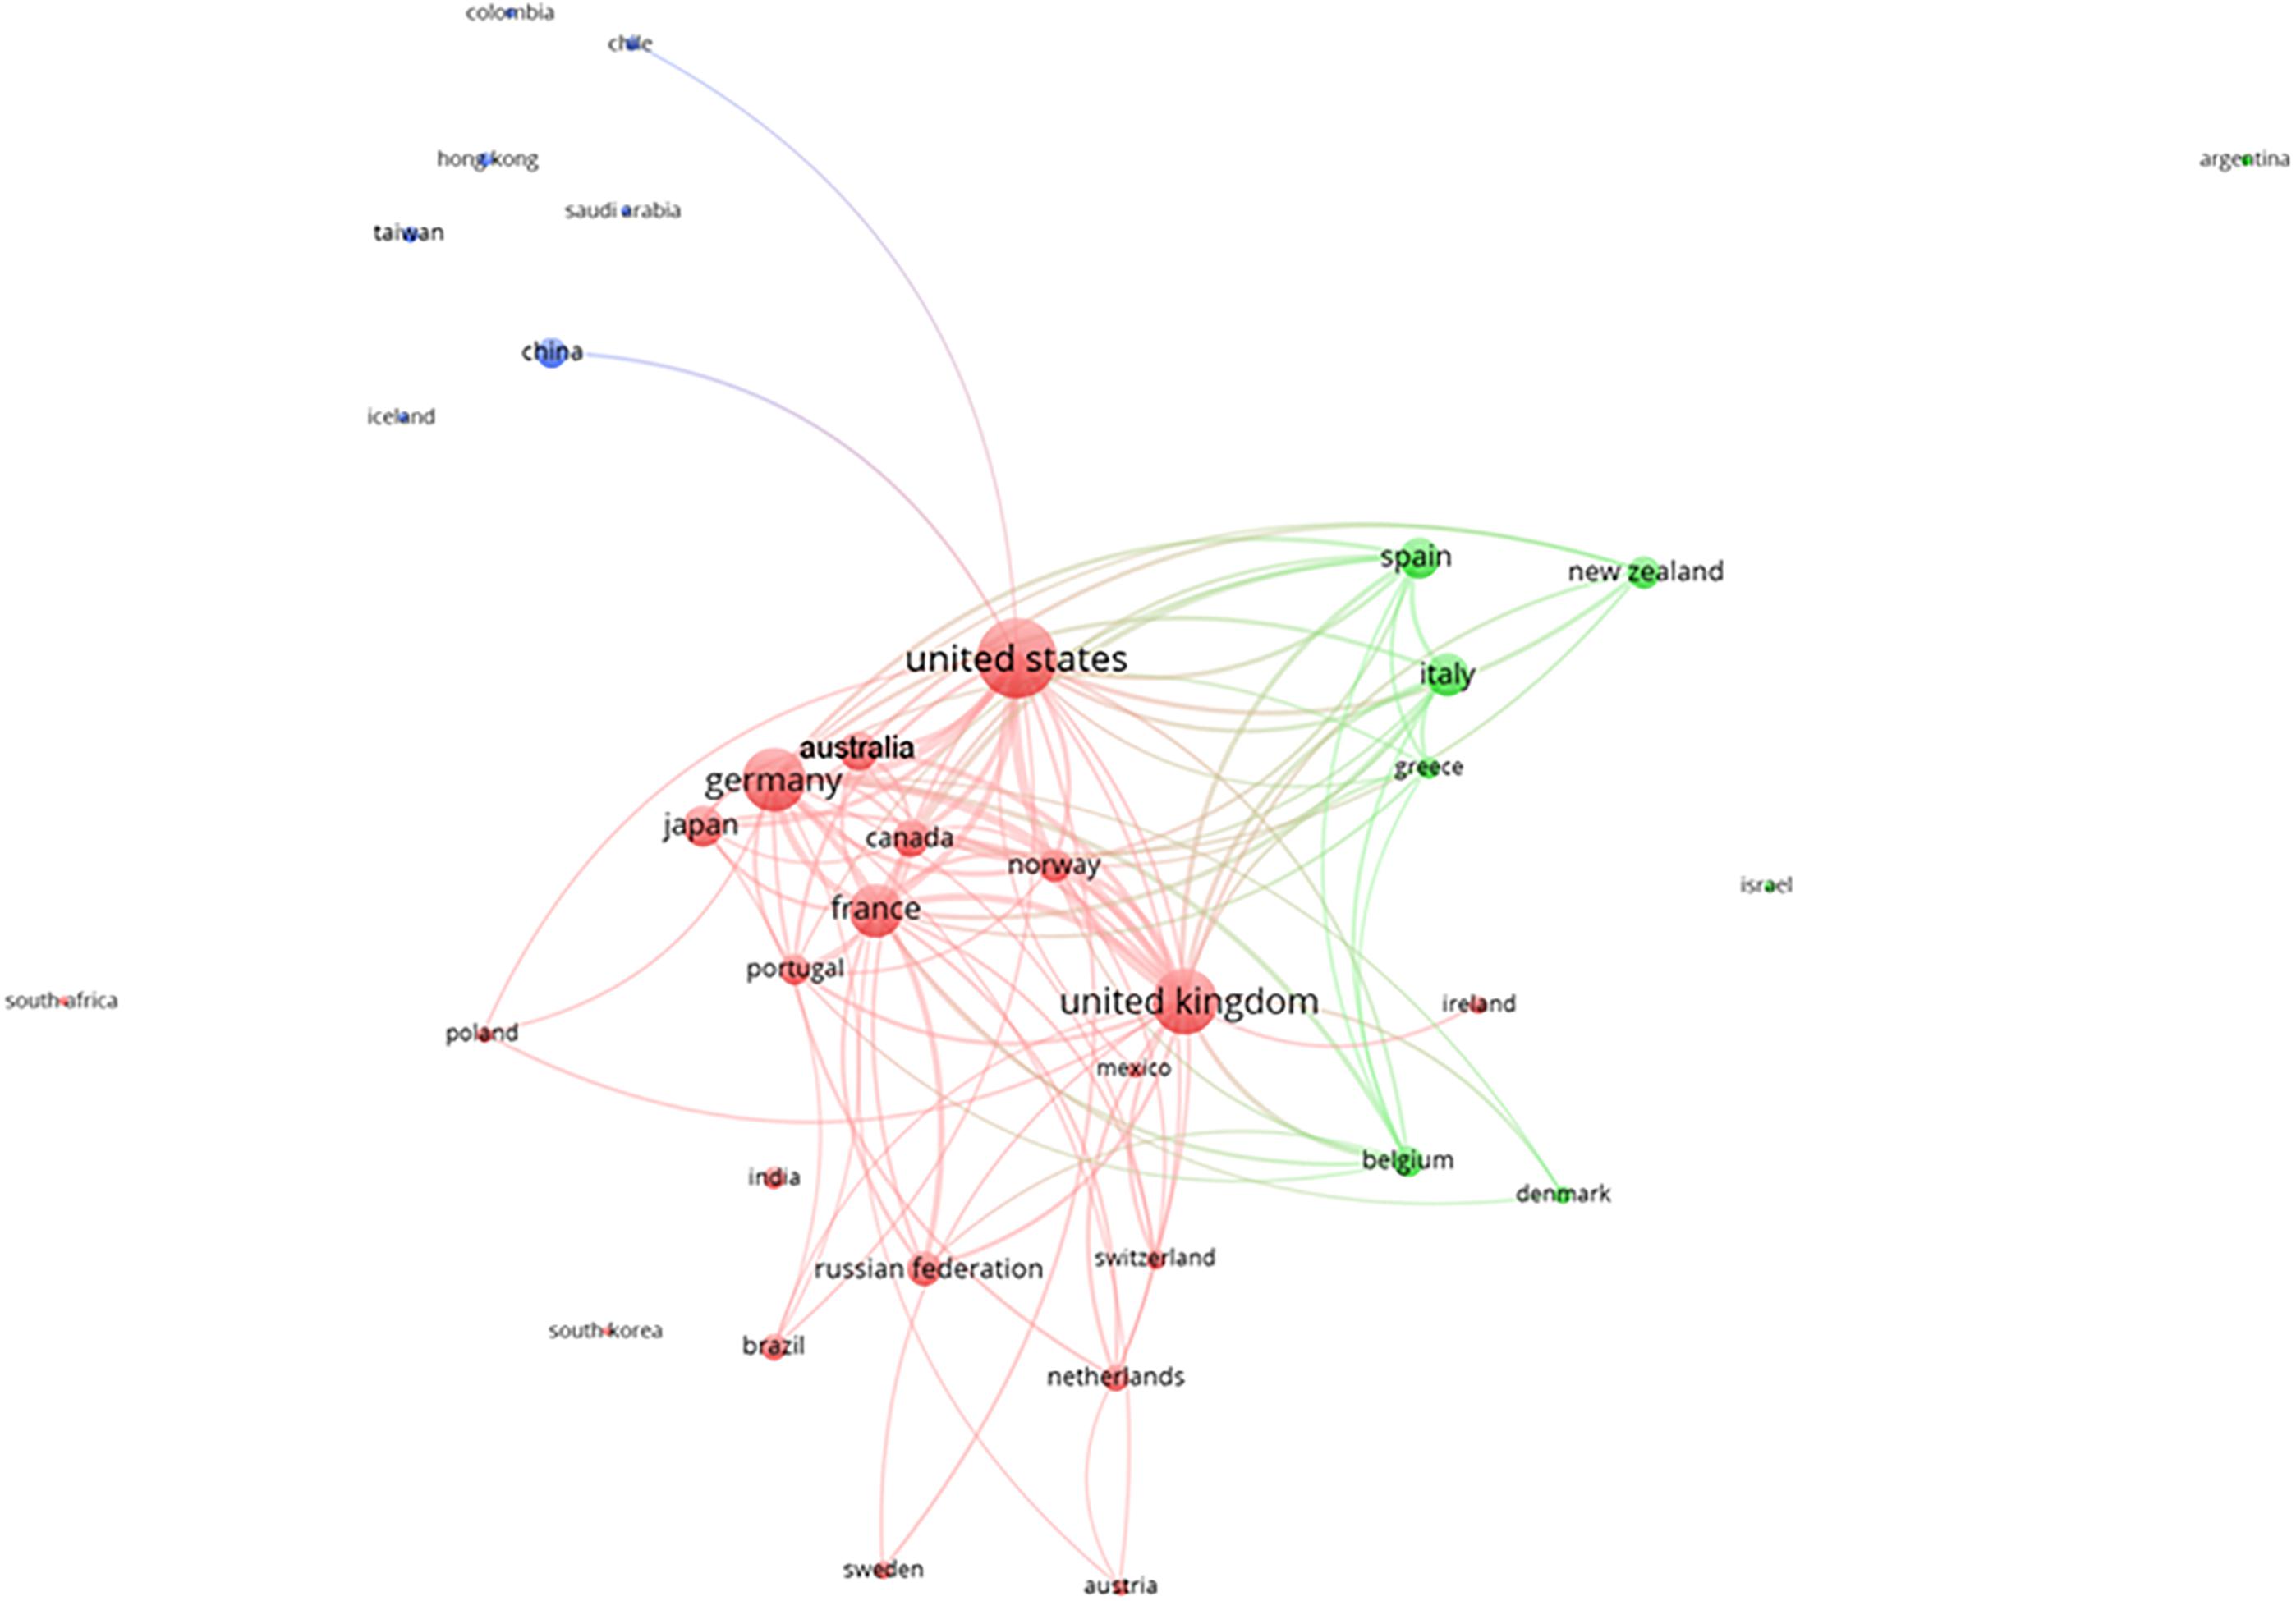
Figure 7. Clustering of the collaborations among different countries (based on deep-sea biodiversity publications co-authored by scientists of different institutions). Different colors represent different clusters of countries. Lines indicate at least 100 co-occurrence links between terms.
Discussion
Our results indicated that an initial phase of description of deep-sea ecosystems and their functioning occurred in relation to the need to establish biotic indices for the management of human impacts. Although our analysis started in 1993 and previous landmark studies on deep-sea ecology were available (e.g., Grassle and Maciolek, 1992) with a historical pedigree of pioneering discovery expeditions (Levere, 1988; Harold and Trujillo, 1999; Anderson and Rice, 2006), we highlighted a starting phase of deep-sea exploration dedicated to the identification of faunal elements in the size range between meio- and megafauna. Later, such analytic focus was progressively redirected toward new biological components, such as viruses, bacteria, and archaea, which was due to new genetic technological applications. Finally, our data indicated that deep-sea research is still linked to great investments within developed countries. Although some of these observations are known to researchers within different sectors of deep-sea research, the presented topics and trends (and the methods of their elaboration) may be of broad utility to a wide spectrum of marine-oriented scientific users, such as administrators and public bodies. These latter groups may aim to identify strategic areas and actions for the additional allocation of funds.
Methodological Approach
Our network analysis of deep-sea biodiversity research evidenced that term map plotting is a valid tool to support experts in improving their knowledge of a certain domain. In our analysis, the elements of a term map and their correlations disclosed the expertise of thousands of scientists and could potentially be used to enrich existing ontologies, thesauri or vocabularies; to identify concept gaps in the corresponding domain conceptualization; and to improve the ocean data management systems and the corresponding potentialities (Del Río et al., 2018). In this context, term map analysis naturally produces a structured conceptualization of a specific scientific domain, which in our case was deep-sea biodiversity. The natural language analysis performed on the scientific publications identified a set of terms representing the expertise of the scientists that co-authored the publications. The cluster membership and the edges connecting the graph nodes representing the terms suggested ontological relations among concepts. Our methodological effort was in line with procedures already established for several data services that are based on the conceptualization of specific scientific domains, such as the Semantic Web for Earth and Environmental Terminology (SWEET) ontology (DiGiuseppe et al., 2014) and the Natural Environment Research Council (NERC) vocabulary2. Ontologies define the terms in a domain, provide constraints on the value and define formal semantics that enable automated reasoning. Terms are organized in a manner similar to taxonomic groups, which are structured by rules and relationships such that they can be automatically used by computer algorithms for data and instrument interoperability (Zheng et al., 2015).
Nevertheless, there were two kinds of limitations regarding both the production and the exploration of term maps: the limitations generated by the data and those imposed by the map. First, during the creation of the bibliometric dataset, the availability of records could have been limited mainly due to the arbitrary choice of keywords for the primary search as well as by the choice of synonyms and homonyms (which we solved with an accurate thesaurus evaluation) (Glänzel, 2003; Pallottino et al., 2018). Second, the interpretation of bibliometric maps is not always straightforward. Visualization with maps is normally used for orientation, with the map itself being a simplified representation of reality (van Eck and Waltman, 2010). VOSviewer may cause some loss of information due to the two-dimensional representation of terms from a Euclidean space.
Deep-Sea Research Topics and Trends in Recent Decades
Our results regarding the research trends between the two temporal periods (i.e., 1993–2010 and 2011–2019) highlighted a shift from an initial descriptive phase to more quantitative ecosystem-based deep-sea research. In this transition, a more comprehensive and multidisciplinary approach was considered because of the complexity of the impacts produced by human activities on deep-sea ecosystems (Levin and Le Bris, 2015). Our results indicated a shift from simple descriptions of ecosystem functioning, which were mostly focused on organisms in the size range between meio- and megafauna, to viruses, bacteria, and archaea due to the important technological development of molecular tools (see the next section).
The results of our analysis showed that descriptive ecology based on imaging was also experiencing a spectacular increase (Bicknell et al., 2016). The quantification of large-sized components (macro- and megafauna), which was usually approached with traditional tools (e.g., dredging and trawling), now occurs through different fixed-cabled and mobile platforms equipped with a wide variety of imaging devices, which allow seascape characterization approaches (Danovaro et al., 2020a). In fact, imaging-based classification of species and the counting of individuals as well as the computing of different biological variables (e.g., size class frequencies, surface densities, and biomass) and life-trait labeling (e.g., predator–prey relationships, scavenging, and bioturbation) allow the calculation of more complex ecological indicators (Rountree et al., 2019; Aguzzi et al., 2020).
Currently, scientific and technological initiatives for the observation of oceans [e.g., European Multidisciplinary Seafloor and Water Column Observatories (EMSO), Ocean Network Canada (ONC), and Argo] produce a large amount of multidisciplinary biological and environmental data (Aguzzi et al., 2011, 2012). Temporally intensive and prolonged monitoring over large areas (by networks of observatories and their moving platforms; see Aguzzi et al., 2019) is disclosing relevant data on life traits affecting ecosystem functioning and, in turn, the status of the services they provide. Behavioral rhythms affect perceptions of biodiversity due to timing of sampling procedures that is too temporally scattered (e.g., repetition-limited trawling and ROV surveying). This influences our perception of biodiversity and derived information on species interactions (to establish food web architectures) (Aguzzi and Company, 2010). More sound data will be obtained with multisensory cabled and docked mobile platforms in a high-frequency, prolonged, and remote fashion (Aguzzi et al., 2019; Rountree et al., 2019).
Marine big data are being organized and structured to be integrated, accessed, and exploited to produce both new knowledge and effective policies for marine environmental management (Huang et al., 2018; Boucquey et al., 2019; Aguzzi et al., 2020). In this framework, the results of our analysis indicate that greater research effort is being devoted to the establishment of monitoring tools and standardized protocols for the assessment of the Good Environmental Status (GES), which is at the core of important international management strategies such as those of the European community (i.e., MSFD) and the United States [i.e., the Integrated Ecosystem Assessment (IEA)] as support for ecosystem-based management (EBM; Samhouri et al., 2014). In Europe, there are currently two main research projects, the IDEM in the Mediterranean Sea (Danovaro et al., 2020b) and the ATLAS project in the North Atlantic3, plus other specific actions (e.g., Fabri et al., 2019) that are working on the implementation of the MSFD. At international levels, it is worth mentioning that the establishment of monitoring tools and standardized protocols for measuring biodiversity is also benefiting the United Nations initiative of biodiversity beyond national jurisdiction (BBJN) (Danovaro et al., 2017).
Currently Expanding and Established Research Fields
Deep-sea microbiology is certainly an expanding field of research according to our analytics. Microbial community components have been quantified to close the loop in modern modeling approaches to ecosystem functioning since they represent an important and often missing link and condition biogeochemical cycles in carbon fluxes and energetic budgets due to their chemosynthetic primary production and remineralization capabilities (Sogin et al., 2006). Studies on deep-sea microbes are therefore carried out in relation to their overall contribution to biodiversity (Sogin et al., 2006), energy flows and ecosystem functioning control (Brandt, 2008; Danovaro et al., 2008a), as well as in relation to their biotechnological potential (Corinaldesi, 2015). Omics technologies (i.e., genomics, transcriptomics, proteomics, and metabolomics plus metabarcoding; Horgan and Kenny, 2011) are currently being used to quantify the genetic diversity of this elusive ecological component (Deiner et al., 2017).
Biodiversity conservation has also resulted in a major expanding trend for deep-sea research and thus an increasing number of papers have been published on related subjects from 2011 to 2019 compared with during the previous periods. The deep sea is being considered progressively more frequently as the final frontier for the exploitation of new genetic resources, deep-sea fisheries, oil and gas extraction, and minerals, but at the same time, it is continuously submitted to more “old-fashioned” activities, such as land-based and maritime pollution and dumping (Morato et al., 2006; Ramirez-Llodra et al., 2011; Serrão Santos et al., 2012; Levin and Le Bris, 2015; Wedding et al., 2015). In this scenario, the research on a diversity of extreme ocean ecosystems has increased as marine technology has developed, which has made sensors and platforms more widely available for use. On the one hand, the relevant ecological information still covers a very small area of the seafloor and is temporally extremely scattered and incomplete (e.g., the longest time series available cover approximately 30 years at Station M4 as well as at the Porcupine Abyssal Plain-PAP station5), while on the other, a new technologically based accessibility to remote ecosystems is producing an expansion of baseline knowledge. These new data are required to inform strategies for conservation and management (see the next section). At the same time, increased accessibility provides new opportunities to discover valuable resources and compounds of potential application to the food, industrial and pharmaceutical sectors, among others. Deep-sea organisms are expected to have greater genetic diversity than their shallow-water counterparts and a have high probability of containing unique molecules with potential applications in biotechnology (Skropeta, 2008; Pettit, 2011).
Research Actions Provide Data to Strategies for Deep-Sea Management and Protection
Our data show that carbon/energy budgets in the deep sea are being calculated with increased frequency in an attempt to better assess the status of ecosystem services in the context of growing anthropogenic pressure from industrial extractive activities. The capability to monitor different areas at different depths and geographic gradients is of strategic relevance for understanding deep-sea ecosystem productivity and endurance despite direct (industry-related) and indirect (climate change-related) projected impacts (McClain and Etter, 2005; Rex and Etter, 2010; Ramirez-Llodra et al., 2011; Danovaro et al., 2017, 2020a). The assessment of the role of biodiversity in the stability and productivity of deep-sea ecosystems is the object of increasing research effort, which had produced results that have stimulated the debate on conservation and management in national and transnational oceanic areas (e.g., Danovaro et al., 2008b; Mengerink et al., 2014; Pusceddu et al., 2014). The establishment of Marine Protected Areas (MPAs) and Other Effective Area-based Conservation Measures (OECM) is increasingly being based on the identification of unique geomorphologies hosting hotspots of biodiversity, around which the conservation strategies are built (e.g., Fanelli et al., 2017; O’Leary et al., 2012; Kachelriess et al., 2014; Fox et al., 2016, 2019). Some of this debate is centered on species endemicity and rarity, which may be a better metric than species richness for assessing the role of biodiversity in ecosystem functioning (Sigwart et al., 2019; Danovaro et al., 2020a). Unfortunately, these indices cannot be accurately calculated or interpreted due to several constraints, including the sampling tools and the exploration/monitoring technologies utilized (Aguzzi et al., 2019; Rountree et al., 2019). In contrast, a better metric for marine biodiversity evaluation could be based on the measurement of cryptic (genetic) diversity rather than “species” diversity, as these factors are not necessarily correlated (Costello and Chaudhary, 2017). Genetic diversity appears to be inversely correlated with species diversity across all domains of life. For example, viruses have greater genetic diversity than bacteria, and bacteria have greater genetic diversity than protists (Suttle, 2005).
Interestingly, our results highlight how indirect and direct marine impacts (i.e., noise and litter) have different projections in the deep-sea literature. Maritime noise from deep-sea mining or prospecting with air guns seems to still be poorly considered in deep-sea studies. In contrast, marine litter is becoming a hot topic that is being targeted by studies focusing on descriptions, distributions, and sites of accumulation, such as canyons or seamounts (Woodall et al., 2015). Even so, few papers are dedicated to the characterization and quantification of the effects of marine litter on biodiversity in deep-sea environments, although it has been suggested to be a serious concern for animal health through microplastic ingestion and diffusion into the food web (Pham et al., 2014; Woodall et al., 2014; Courtene-Jones et al., 2019; La Beur et al., 2019). In this scenario, our data indicate that microplastics still have poor projections in the published literature because the research field is too novel. Additionally, the constraints of working in deep-sea areas probably prevent more quantitative studies on the effects of litter on species biological traits, such as physiological functions sustaining growth and reproduction.
The Differential Contribution of Countries to Deep-Sea Research
We evidenced that deep-sea research is still linked to great investments as its realization is associated with developed countries. After 2008, the number of publications increased in coincidence with major international project initiatives (i.e., the two EU-funded projects, HERMES and HERMIONE, targeting deep-sea hotspots of biodiversity and investigations on continental margins, among many others) and the wrap-up analysis and integration phase of the CoML project outcomes.
EU member states and the United States co-led the current deep-sea biodiversity research, with few relationships with Asian countries (apart from a strong liaison with Japan). Some relevant international projects brought together transatlantic collaboration (EU, Canada, and United States) for studies of deep-sea biodiversity, such as ATLAS (see above for link) and SponGES6. The iAtlantic project7 assesses the health of deep-sea ecosystems across the Atlantic and is a collaboration among the EU, United States, Canada, and countries in South America and Africa. Future studies may address in greater detail the reasons for the success and failure of research collaborations among different countries and, in particular, between Western organizations and those in Asia (i.e., authors and authorities).
To date, the presence of large European research funding schemes is still promoting deep-sea research. Since the 1st European Union Framework Program (FP1) from 1984 to 1987 to the present Horizon 2020 from 2014 to 2020, rules to build research consortia have allowed the inclusion of non-EU countries as third-member states (Veugelers and Cincera, 2015). Further, while until FP7 science was a major driver of action, the European Commission is seeking more applied research from Horizon 2020, with Europe only in third place (after the United States and Japan) in the transformation of results into commercial and societal products for industry. In this scenario, larger investments have benefited European researchers.
United States leadership in deep-sea biological research, as evidenced by our literature survey, is the product of a clear societal strategy. In 2004, the U.S. Commission on Ocean Policy released an ocean blueprint for the 21st century, which included 212 recommendations for a “coordinated and comprehensive national ocean policy” (Upton and Buck, 2010). At the same time, several mechanisms for funding, including science, have been in place for a long time, including governmental actions from the National Science Foundation (NSF; e.g., Kanuss, 2000) and NOAA’s National Under Research Program (NURP; National Oceanic and Atmospheric Administration’s [NOAA], 2018), as well as private grants, such as those from foundations (e.g., the Monterey Bay Aquarium Research Institute (MBARI) is supported by the private Packard Foundation8). Furthermore, the considerable increase in deep-sea biology publications in the last decade by the United States researchers largely reflects the $100 million CoML initiative, which is sustained by the Sloan Foundation (Vanden Berghe et al., 2010).
Missing Aspects of Deep-Sea Research and Future Priorities
Our results indicate that deep-sea biodiversity research around the world in the coming years will be progressively dedicated to the quantification of services provided by ecosystems in terms of both biotic (i.e., deep-sea fisheries and genetic resources for biotechnology) and abiotic (minerals and hydrocarbons) resources. Although fundamental information on deep-sea ecosystems is progressively being gathered in terms of biodiversity (species richness, abundance, and biomass), large gaps in knowledge still exist on the effects that the interaction between geo- and bioprocesses plays on ecosystem functioning. A major gap concerns the identification of essential variables for the assessment of the ecological status of deep-sea ecosystems (Danovaro et al., 2020a). Greater research effort is being dedicated to measuring the response of communities to human-driven changes; therefore, ecological monitoring to define ecosystem functioning will become more relevant. Such scientific effort is taking place in the context of growing competition between the sciences dedicated to the exploration and conservation of deep-sea ecosystems and the industries that want to exploit these areas at an increasing pace (Danovaro et al., 2017). It is likely that more intersectoral collaborations between academia and industry will allow for infrastructural access and technology transfer as required to accelerate marine exploration (Murray et al., 2018). For example, there is a need to implement research on the life traits of deep-sea species and the biodiversity of deep-sea ecosystems and to better explore iconic regions, such as the Arctic, where the reduction in sea ice cover will have impacts on deep-sea life and will allow the initiation of drilling activities for oil and gas extraction.
With the development of monitoring technologies, relevant information can be gathered on the dynamics of communities living in and around highly impacted areas (e.g., from mining) at unprecedented spatiotemporal scales (Aguzzi et al., 2019). Such an expansion in sampling capability is presently occurring according to some major guidelines, such as the use of artificial intelligence in efficient processing of large volumes of data (Piechaud et al., 2019), which is also favored by the increase in consistency/standardization of protocols for data collection, storage, and sharing (e.g., via large cyberinfrastructure-based data portals such as PANGAEA9 or EMODnet10), with special reference to imaging (Howell et al., 2019; Aguzzi et al., 2020). These data can be interpolated with the use of species distribution models to scale to larger geographic and hence more representative areas (e.g., Kenchington et al., 2019), producing quantitative data on the connectivity and life cycles of the species and dynamics of the species composition changes at different spatiotemporal scales. This procedure is relevant to the study of ecological responses to ocean acidification and oxygen minimum zones and for the assessment of ecotoxicological effects (e.g., from microplastics and xenobiotic medical compounds) (Danovaro et al., 2020a). Spatial modeling is relevant not only for litter distribution and accumulation but also for cases where direct exposure to resuspended metals and other materials occurs in association with the mining processes (Rogers et al., 2015). In all these cases, the development of oceanographic models forecasting litter dispersion and mining plume diffusion is of value for both the pelagic and benthic communities.
Data Availability Statement
All datasets generated for this study are included in the article/Supplementary Material.
Author Contributions
All authors listed have made a substantial, direct and intellectual contribution to the work, and approved it for publication.
Funding
RD was supported by the DG ENV project IDEM (Implementation of the MSFD to the Deep Mediterranean Sea; contract EU No 11.0661/2017/750680/SUB/EN V.C2).
Conflict of Interest
The authors declare that the research was conducted in the absence of any commercial or financial relationships that could be construed as a potential conflict of interest.
Acknowledgments
This study was developed within the framework of the Tecnoterra (ICM-CSIC/UPC) and the following project activities: ARIM (Autonomous Robotic sea-floor Infrastructure for benthopelagic Monitoring; MartTERA ERA-Net Cofound) and RESBIO (TEC2017-87861-R; Ministerio de Ciencia, Innovación y Universidades).
Supplementary Material
The Supplementary Material for this article can be found online at: https://www.frontiersin.org/articles/10.3389/fmars.2020.00384/full#supplementary-material
Footnotes
- ^ http://www.vosviewer.com
- ^ https://vocab.nerc.ac.uk/
- ^ https://www.eu-atlas.org/
- ^ https://www.mbari.org/station-m-time-series/
- ^ https://projects.noc.ac.uk/pap/
- ^ http://www.deepseasponges.org/
- ^ http://www.iatlantic.eu/
- ^ www.packard.org
- ^ https://www.pangaea.de/
- ^ https://www.emodnet.eu/
References
Afán, I., Giménez, J., Forero, M. G., and Ramírez, F. (2018). An adaptive method for identifying marine areas of high conservation priority. Conservat. Biol. 32, 1436–1447. doi: 10.1111/cobi.13154
Aguzzi, J., Chatzievangelou, D., Francescangeli, M., Marini, S., Bonofiglio, F., del Río, J., et al. (2020). The hierarchic treatment of marine ecological information from spatial networks of benthic platforms. Sensors 20:1751. doi: 10.3390/s20061751
Aguzzi, J., Chatzievangelou, D., Marini, S., Fanelli, E., Danovaro, R., Flögel, S., et al. (2019). New high-tech interactive and flexible networks for the future monitoring of deep-sea ecosystems. Env. Sci. Technol. 53, 6616–6631.
Aguzzi, J., and Company, J. B. (2010). Chronobiology of deep-water decapod crustaceans on continental margins. Adv. Mar. Biol. 58, 155–225. doi: 10.1016/b978-0-12-381015-1.00003-4
Aguzzi, J., Company, J. B., Costa, C., Matabos, M., Azzurro, E., Mànuel, A., et al. (2012). Challenges to assessment of benthic populations and biodiversity as a result of rhythmic behaviour: video solutions from cabled observatories. Ocean. Mar. Biol. Ann. Rev. 50, 235–286. doi: 10.1201/b12157-6
Aguzzi, J., Company, J. B., Costa, C., Menesatti, P., Garcia, J. A., Bahamon, N., et al. (2011). Activity rhythms in the deep-sea: a chronobiological approach. Front. Biosci. 16:131. doi: 10.2741/3680
Anderson, T. R., and Rice, T. (2006). Deserts on the sea floor: edward forbes and his azoic hypothesis for a lifeless deep ocean. Endeavour 30, 131–137. doi: 10.1016/j.endeavour.2006.10.003
Ardron, J. A., Rayfuse, R., Gjerde, K., and Warner, R. (2014). The sustainable use and conservation of biodiversity in ABNJ: what can be achieved using existing international agreements? Mar. Pol. 49, 98–108. doi: 10.1016/j.marpol.2014.02.011
Baguley, J. G., Montagna, P. A., Cooksey, C., Hyland, J. L., Bang, H. W., Morrison, C., et al. (2015). Community response of deep-sea soft-sediment metazoan meiofauna to the deepwater horizon blowout and oil spill. Mar. Ecol. Prog. Ser. 528, 127–140. doi: 10.3354/meps11290
Bass, D., Howe, A., Brown, N., Barton, H., Demidova, M., Michelle, H., et al. (2007). Yeast forms dominate fungal diversity in the deep oceans. Proc. R. Soc.B. 274, 3069–3077. doi: 10.1098/rspb.2007.1067
Bicknell, A. W. J., Godcley, J. B., Sheehan, E., and Votier, S. C. (2016). Camera technology for monitoring marine biodiversity and human impact. Front. Ecol. Environ. 8:424–432. doi: 10.1002/fee.1322
Boucquey, N., Martin, K. S., Fairbanks, L., Campbell, L. M., and Wise, S. (2019). Ocean data portals: performing a new infrastructure for ocean governance. Environm. Plan. D 37, 484–503. doi: 10.1177/0263775818822829
Brandt, A. (2008). Deep-Sea Ecology: infectious impact on ecosystem function. Cur. Biol. 18, 1104–1106.
Brose, U., Archambault, P., Barnes, A. D., Bersier, L.-F., Boy, T., Canning-Clode, J., et al. (2019). Predator traits determine food-web architecture across ecosystems. Nat. Ecol. Evol. 3, 919–927.
Christodoulou, M., Timothy, T. D. D. O., Hara, A., and Martinez Arbizu, P. (2019). Dark Ophiuroid biodiversity in a prospective abyssal mine field. Curr. Biol. 29, 3909–3912.
Corinaldesi, C. (2015). New perspectives in benthic deep-sea microbial ecology. Front. Mar. Sci. 2:17. doi: 10.3389/fmars.2015.00017
Costa, C., Schurr, U., Loreto, F., Menesatti, P., and Carpentier, S. (2019). Plant phenotyping research trends, a science mapping approach. Front. Plant Sci. 9:1933. doi: 10.3389/fpls.2018.01933
Costello, M. J. (2016). Parasite rates of discovery, global species richness and host specificity. Int. Comp. Biol. 56, 588–599. doi: 10.1093/icb/icw084
Costello, M. J., and Chaudhary, C. (2017). Marine biodiversity, biogeography, deep-sea gradients, and conservation. Cur. Biol. 27, 511–527.
Costello, M. J., Cheung, A., and De Hauwere, N. (2010a). Topography statistics for the surface and seabed area, volume, depth and slope, of the world’s seas, oceans and countries. Environ. Sci. Technol. 44, 8821–8828. doi: 10.1021/es1012752
Costello, M. J., Coll, M., Danovaro, R., Halpin, P., Ojaveer, H., and Miloslavich, P. (2010b). A census of marine biodiversity knowledge, resources, and future challenges. PLoS One 5:e12110. doi: 10.1371/journal.pone.0012110
Costello, M. J., Wilson, S. P., and Houlding, B. (2012). Predicting total global species richness using rates of species description and estimates of taxonomic effort. Systematic Biol. 61, 871–883.
Courtene-Jones, W., Quinn, B., Ewins, C., Grey, S., and Narayanaswamy, B. E. (2019). Consistent microplastic ingestion by deep-sea invertebrates over the last four decades (1976-2015), a study from the North East Atlantic. Environ. Poll. 244, 503–512. doi: 10.1016/j.envpol.2018.10.090
Danovaro, R., Corinaldesi, C., Dell’Anno, A., and Snelgrove, P. V. R. (2017). The deep-sea under global change. Curr. Biol. 27, R461–R465.
Danovaro, R., Corinaldesi, C., Rastelli, E., and Anno, A. D. (2015). Towards a better quantitative assessment of the relevance of deep-sea viruses, Bacteria and Archaea in the functioning of the ocean seafloor. Aquat. Microb. Ecol. 75, 81–90. doi: 10.3354/ame01747
Danovaro, R., Dell’Anno, A., Corinaldesi, C., Magagnini, M., Noble, R., Tamburini, C., et al. (2008a). Major viral impact on the functioning of benthic deep-sea ecosystems. Nature 454, 1084–1087. doi: 10.1038/nature07268
Danovaro, R., Gambi, C., Dell’Anno, A., Corinaldesi, C., Fraschetti, S., Vanreusel, A., et al. (2008b). Exponential decline of deep-sea ecosystem functioning linked to benthic biodiversity loss. Curr. Biol. 18, 1–8. doi: 10.1016/j.cub.2007.11.056
Danovaro, R., Fanelli, E., Aguzzi, J., Billett, D., Carugati, L., Corinaldesi, C., et al. (2020a). Ecological indicators for an integrated global deep-ocean strategy. Nat. Ecol. Evol. 4, 181–192.
Danovaro, R., Fanelli, E., Canals, M., Ciuffardi, T., Fabri, M.-C., Taviani, M., et al. (2020b). Towards a marine strategy for the deep Mediterranean Sea: analysis of current ecological status. Marine Policy 112:103781. doi: 10.1016/j.marpol.2019.103781
de Forges, B., Koslow, J. A., and Poore, G. C. B. (2000). Diversity and endemism of the benthic seamount fauna in the southwest Pacific. Nature 405, 944–947. doi: 10.1038/35016066
De Leo, F. C., Smith, R., Rowden, A., Bowden, D. A., and Clark, M. R. (2010). Submarine canyons: hotspots of benthic biomass and productivity in the deep-sea. Proc. Royal Soc. B 277, 2783–2792. doi: 10.1098/rspb.2010.0462
Deiner, K., Bik, H. M., Mächler, E., Seymour, M., Lacoursière-Roussel, A., Altermatt, F., et al. (2017). Environmental DNA metabarcoding: transforming how we survey animal and plant communities. Mol. Ecol. 26, 5872–5895. doi: 10.1111/mec.14350
Del Río, J., Thoma, D. M., Martínez, E., O’Reilly, T., Delory, E., Pearlman, J. S., et al. (2018). A sensor web architecture for integrating smart oceanographic sensors into the semantic sensor web. IEEE J. Ocean. Engin. 43, 830–842. doi: 10.1109/joe.2017.2768178
DiGiuseppe, N., Pouchard, L. C., and Noy, N. F. (2014). SWEET ontology coverage for earth system sciences. Earth Sci. Inform. 7, 249–264. doi: 10.1007/s12145-013-0143-1
Elmqvist, T., Folke, C., Nystrom, M., Peterson, G., Bengtsson, J., Walker, B., et al. (2003). Response diversity, ecosystem change, and resilience. Front. Ecol. Env. 1:488–494. doi: 10.1890/1540-9295(2003)001[0488:rdecar]2.0.co;2
Fabri, M.-C., Vinha, B., Allais, A.-G., Bouhier, M.-E., Dugornay, O., Gaillot, A., et al. (2019). Evaluating the ecological status of cold-water coral habitats using non-invasive methods: an example from cassidaigne canyon, northwestern Mediterranean Sea. Prog. Oceanogr. 178:102172. doi: 10.1016/j.pocean.2019.102172
Fanelli, E., Cartes, J. E., and Papiol, V. (2011a). Trophodynamics of zooplankton fauna on the catalan slope (NW Mediterranean): insight from (13C and (15N analysis. J. Mar. Syst. 87, 79–89.
Fanelli, E., Papiol, V., Cartes, J. E., Rumolo, P., Brunet, C., and Sprovieri, M. (2011b). Food web structure of the megabenthic, invertebrate epifauna on the Catalan slope (NW Mediterranean): evidence from (13C and (15N analysis. DeepSea Res. I 58, 98–109. doi: 10.1016/j.dsr.2010.12.005
Fanelli, E., Delbono, I., Cocito, S., Ivaldi, R., and Peirano, A. (2017). Cold-water coral Madrepora oculata in the eastern Ligurian Sea (NW Mediterranean): Historical and recent findings. Mar. Freshw. Ecosyst. 27, 965–975. doi: 10.1002/aqc.2751
Fox, A. D., Corne, D. W., Mayorga, A. C. G., Polton, J. A., Henry, L.-A., and Roberts, J. M. (2019). An efficient multi-objective optimization method for use in the design of marine protected area networks. Front. Mar. Sci. 6:17. doi: 10.3389/fmars.2019.00017
Fox, A. D., Henry, L., Corne, D. W., and Roberts, J. M. (2016). Sensitivity of marine protected area network connectivity to atmospheric variability. R. Soc. Open Sci. 3:160494. doi: 10.1098/rsos.160494
Gambi, C., Pusceddu, A., Benedetti-Cecchi, L., and Danovaro, R. (2014). Species richness, species turnover and functional diversity in nematodes of the deep Mediterranean Sea: searching for drivers at different spatial scales. Global Ecol. Biogeogr 23, 24–39. doi: 10.1111/geb.12094
Glänzel, W. (2003). Bibliometrics as a Research Field: A Course on Theory and Application of Bibliometric Indicators. Budapest: Magyar Tudományos Akadémia.
Glover, A. G., Wiklund, H., Chen, C., and Dahlgren, T. G. (2018). Managing a sustainable deep-sea ‘blue economy’ requires knowledge of what actually lives there. eLife 7:e41319.
Grassle, J. F., and Maciolek, N. J. (1992). Deep-sea species richness: regional and local diversity estimates from quantitative bottom samples. Am. Nat. 139, 313–341. doi: 10.1086/285329
Grosberg, R. K., Vermeij, G. J., and Wainwright, P. C. (2012). Biodiversity in water and on land. Cur. Biol. 22, 900–903.
Harold, T., and Trujillo, A. (1999). Essentials of Oceanography. Englewood Cliffs, NJ: Prentice Hall.
Horgan, R. P., and Kenny, L. C. (2011). ‘Omic’ technologies: genomics, transcriptomics, proteomics and metabolomics. Obstet. Gynaecol. 13, 189–195. doi: 10.1576/toag.13.3.189.27672
Howell, K. L., Davies, J. S., Allcock, A. L., Braga-Henriques, A., Buhl-Mortensen, P., Carreiro-Silva, M., et al. (2019). A framework for the development of a global standardised marine taxon reference image database (SMarTaR-ID) to support image-based analyses. PLoS One 14:e0218904. doi: 10.1371/journal.pone.0218904
Huang, D., ZhangJian, Q., and Zhu, W. (2018). “Marine information system based on ocean data ontology construction,” in Proceeding of the 2018 IEEE International Conference on Systems, Man, and Cybernetics (SMC), Miyazaki, 2018.
Hughes, T. P., Bellwood, D. R., Folke, C. S., McCook, L. J., and Pandolfi, J. M. (2007). No-take areas, herbivory and coral reef resilience. Trends Ecol. Evol. 22, 1–3. doi: 10.1016/j.tree.2006.10.009
Johnson, C. N., Balmford, A., Brook, B. W., Buettel, J. C., Galetti, M., Guangchun, L., et al. (2017). Biodiversity losses and conservation responses in the Anthropocene. Science 356, 270–275. doi: 10.1126/science.aam9317
Kachelriess, D., Wegmann, M., Gollock, M., and Pettorelli, N. (2014). The application of remote sensing for marine protected area management. Ecol. Ind. 36, 169–177. doi: 10.1016/j.ecolind.2013.07.003
Kanuss, J. A. (2000). “50 years of ocean discovery: national science foundation 1950-2000,” in National Research Council (US) Ocean Studies Board, (Washington DC: National Academies Press).
Kenchington, E., Callery, O., Davidson, F., Grehan, A., Morato, T., Appiott, J., et al. (2019). Use of species distribution modeling in the Deep Sea. Can. Tech. Rep. Fish. Aquat. Sci. 3296.
La Beur, H. L.-A., Kazanidis, G., Hennige, S., McDonald, A., Shaver, M. P., and Roberts, J. M. (2019). Baseline assessment of marine litter and microplastic ingestion by cold-water coral reef benthos at the East Mingulay Marine Protected Area (Sea of the Hebrides, western Scotland). Front. Mar. Sci. 6:80. doi: 10.3389/fmars.2019.00080
Levere, T. H. (1988). Science and the Canadian Arctic, 1818-76, from Sir John Ross to Sir George Strong Nares. Arctic 41, 127–137.
Levin, L., and Le Bris, N. (2015). The deep-ocean under the climate change. Science 350, 766–768. doi: 10.1126/science.aad0126
Levin, L. A., and Sibuet, M. (2012). Understanding continental margin biodiversity: a new imperative. Annual. Rev. Mar. Sci. 4, 79–112. doi: 10.1146/annurev-marine-120709-142714
Marine Strategy Framework Directive [MSFD] (2018). Directive 2008/56/EC of the European Parliament and of the Council of 17 June 2008 Establishing a Framework for Community Action in the Field of Marine Environmental policy. Brussels: Commission of the European Communities.
McClain, C. R., and Etter, R. J. (2005). Mid-domain models as predictors of species diversity patterns: bathymetric diversity gradients in the deep sea. Oikos 109, 555–566. doi: 10.1111/j.0030-1299.2005.13529.x
McIntyre, A. (2010). in Life in the World’s Oceans: Diversity, Distribution, and Abundance, ed. A. McIntyre (Chichester: Wiley-Blackwell), 361.
Mengerink, K. J., Van Dover, C. L., Ardron, J., Baker, M., Escobar-Briones, E., Gjerde, K., et al. (2014). A call for deep-ocean stewardship. Science 344, 696–698. doi: 10.1126/science.1251458
Mongeon, P., and Paul-Hus, A. (2016). The journal coverage of web of science and scopus: a comparative analysis. Scientometrics 106, 213–228. doi: 10.1007/s11192-015-1765-5
Mora, C., Tittensor, D. P., Adl, S., Simpson, A. G., and Worm, B. (2011). How many species are there on Earth and in the ocean? PLoS Biol. 9:e1001127. doi: 10.1371/journal.pbio.1001127
Morato, T., Hoyle, S. D., Allain, V., and Nicol, S. J. (2010). Seamounts are hotspots of pelagic biodiversity in the open ocean. Proc. Nat. Acad. Sci. U.S.A. 107:9707–9711. doi: 10.1073/pnas.0910290107
Morato, T., Watson, R., Pitcher, T. J., and Pauly, D. (2006). Fishing down the deep. Fish Fisher. 7, 24–34. doi: 10.1111/j.1467-2979.2006.00205.x
Murray, F., Needham, K., Gormley, K., Rouse, S., Coolen, J. W. P., Billett, D., et al. (2018). Data challenges and opportunities for environmental management of North Sea oil and gas decommissioning in an era of blue growth. Mar. Pol. 97, 130–138. doi: 10.1016/j.marpol.2018.05.021
National Oceanic and Atmospheric Administration’s [NOAA] (2018). “Deep sea coral research, and. (Technology)program 2018,” in Report to Congress, eds W. L. Ross and T. Gallaudet (Silver Spring, MA: NOAA).
Nerur, S. P., Rasheed, A. A., and Natarajan, V. (2008). The intellectual structure of the strategic management field: an author Co-citation analysis. Strateg. Manag. J. 29, 319–336. doi: 10.1002/smj.659
O’Leary, B. C., Brown, R. L., Johnson, D. E., Von Nordheim, H., Ardron, J., Packeiser, T., et al. (2012). The first network of marine protected areas (MPAs) in the high seas: the process, the challenges and where next. Mar. Pol. 36, 598–605. doi: 10.1016/j.marpol.2011.11.003
Pallottino, F., Biocca, M., Nardi, P., Figorilli, S., Menesatti, P., and Costa, C. (2018). Science mapping approach to analyze the research evolution on precision agriculture: world. EU and Italian situation. Prec. Agric. 19, 1011–1026. doi: 10.1007/s11119-018-9569-2
Pettit, R. K. (2011). Culturability and secondary metabolite diversity of extreme microbes: expanding contribution of deep sea and deep-sea vent microbes to natural product discovery. Mar. Biotechnol. 13, 1–11. doi: 10.1007/s10126-010-9294-y
Pham, C. K., Ramirez-Llodra, E., Alt, C. H. S., Amaro, T., Bergmann, M., Canals, M., et al. (2014). Marine Litter Distribution and Density in European Seas, from the Shelves to Deep Basins. PLoS ONE 9:e95839. doi: 10.1371/journal.pone.0095839
Piechaud, N., Hunt, C., Culverhouse, P. F., Foster, N. L., and Howell, K. L. (2019). Automated identification of benthic epifauna with computer vision. Mar. Ecol. Prog. Ser. 615, 15–30. doi: 10.3354/meps12925
Pusceddu, A., Bianchelli, S., Martín, J., Puig, P., Palanques, A., Masqué, P., et al. (2014). Chronic and intensive bottom trawling impairs deep-sea biodiversity and ecosystem functioning. Proc. Nat. Acad. Sci. U.S.A. 111, 8861–8866. doi: 10.1073/pnas.1405454111
Ramírez, F., Afán, I., Davis, L. S., and Chiaradia, A. (2017). Biodiversity losses and conservation responses in the Anthropocene. Sci. Adv. 3:e1601198.
Ramirez-Llodra, E., Tyler, P. A., Baker, M. C., Bergstad, O. A., Clark, M. R., Escobar, E., et al. (2011). Man and the last great wilderness: human impact on the deep sea. PLoS One 6:e22588. doi: 10.1371/journal.pone.0022588
Rex, M. A., and Etter, R. J. (2010). Deep-sea Diversity: Pattern and Scale. Cambridge, MA: Harvard University Press.
Riehl, T., Lins, L., and Brandt, A. (2018). The effects of depth, distance, and the Mid-Atlantic Ridge on genetic differentiation of abyssal and hadal isopods (Macrostylidae). Deep Sea Res. II 148, 74–90. doi: 10.1016/j.dsr2.2017.10.005
Rogers, A. D., Brierley, A., Croot, P., Cunha, M. R., Danovaro, R., Devey, C., et al. (2015). “Delving deeper: critical challenges for 21st century deep-sea research,” in Position Paper 22 of the European Marine Board, Ostend, Belgium, eds K. E. Larkin, K. Donaldson, and N. McDonough (Ostend: European Marine Board), 224.
Rosli, N., Leduc, D., Rowden, A. A., and Probert, P. K. (2017). Review of recent trends in ecological studies of deep-sea meiofauna, with focus on patterns and processes at small to regional spatial scales. Mar. Biod. 48, 13–34. doi: 10.1007/s12526-017-0801-5
Rountree, R., Aguzzi, J., Marini, S., Fanelli, E., De Leo, C. F., and Del, Rio J, et al. (2019). Towards an optimal design for ecosystem-level ocean observatories. Oceanography 50:58.
Samhouri, J. F., Haupt, A. J., Levin, P. S., Link, J., and Shuford, R. (2014). Lessons learned from developing integrated ecosystem assessments to inform marine ecosystem-based management in the USA. ICES J. Mar. Sci. 71, 1205–1215. doi: 10.1093/icesjms/fst141
Serrão Santos, R., Morato, T., and Barriga, F. J. A. S. (2012). “Increasing pressure at the bottom of the ocean,” in Natural Resources, Sustainability and Humanity: A Comprehensive View, eds A. Mendonca, A. Cunha, and R. Chakrabarti (Berlin: Springer).
Sigwart, J. D., Chen, C., Thomas, E. A., Allcock, L. A., Böhm, M., and Seddon, M. (2019). Red listing can protect deep-sea biodiversity. Nat. Ecol. Evol. 3:1134. doi: 10.1038/s41559-019-0930-2
Smith, K. L. Jr., Ruhl, H. A., Bett, B. J., Billett, D. S., Lampitt, R. S., and Kaufmann, R. S. (2009). Climate, carbon cycling, and deep-ocean ecosystems. Proc. Nat. Acad. Sci. U.S.A. 106, 19211–19218. doi: 10.1073/pnas.0908322106
Snelgrove, P. V. R. (2010). Discoveries of the Census of Marine Life: Making ocean life count. Cambridge: Cambridge University Press.
Sogin, M. L., Morrison, H. G., Huber, J. A., Welch, D. M., Huse, S. M., Neal, P. R., et al. (2006). Microbial diversity in the deep sea and the underexplored “rare biosphere”. Proc. Natl. Acad. Sci. U.S.A. 103, 12115–12120. doi: 10.1073/pnas.0605127103
Turner, P. J., Campbell, L. M., and Van Dover, C. L. (2017). Stakeholder perspectives on the importance of rare-species research for deep-sea environmental management. Deep Sea Res. I 125, 129–134. doi: 10.1016/j.dsr.2017.05.004
Upton, H. F., and Buck, E. H. (2010). Ocean commissions: ocean policy review and outlook. Congressional Res. Serv. 5700:RL33603.
Van der Grient, J. M., and Rogers, A. D. (2015). Body size versus depth: regional and taxonomical variation in deep-sea meio-and macrofaunal organisms. Adv. Mar. Biol. 71, 71–108.
van Eck, N. J., and Waltman, L. (2010). Software survey: VOSviewer, a computer program for bibliometric mapping. Scientomet 84, 523–538. doi: 10.1007/s11192-009-0146-3
van Eck, N. J., and Waltman, L. (2011). Text mining and visualization using VOSviewer. arXiv [Preprint]. doi: 10.13140/RG.2.2.29722.18889
van Eck, N. J., and Waltman, L. (2017). Citation-based clustering of publications using CitNetExplorer and VOSviewer. Scientomet 111, 1053–1070. doi: 10.1007/s11192-017-2300-7
van Eck, N. J., Waltman, L., van Raan, A. F., Klautz, R. J., and Peul, W. C. (2013). Citation analysis may severely underestimate the impact of clinical research as compared to basic research. PLoS One 8:e62395. doi: 10.1371/journal.pone.0062395
van Raan, A. F. (2014). “Advances in bibliometric analysis: research performance assessment and science mapping,” in Bibliometrics. Use and Abuse in the Review of Research Performance, eds W. Blockmans, L. Engwall, and D. Weaire (London: Portland Press), 17–28.
Vanden Berghe, E., Stocks, K. I., and Grassle, F. (2010). “Data integration: the ocean biogeographic information system,” in In: Life in the World’s Oceans: Diversity, Distribution, and Abundance, ed. A. McIntyre (Hoboken, NJ: Wiley-Blackwell).
Veugelers, R., and Cincera, M. (2015). How to turn on the innovation growth machine in Europe. Intereconomics 50, 4–9.
Waltman, L., and van Eck, N. J. (2013). A smart local moving algorithm for large-scale modularity-based community detection. Eur. Phys. J. B 86:471. doi: 10.1140/epjb/e2013-40829-0
Waltman, L., van Eck, N. J., and Noyons, E. C. (2010). A unified approach to mapping and clustering of bibliometric networks. J. Informet. 4, 629–635. doi: 10.1016/j.joi.2010.07.002
Wedding, L. M., Reiter, S. M., Smith, C. R., Gjerde, K. M., Kittinger, J., Friedlander, A. M., et al. (2015). Managing exploitation of thedeep seabed. Science 349, 144–145. doi: 10.1016/j.joi.2010.07.002
White, H. D., and McCain, K. W. (1998). Visualizing a discipline: an author co-citation analysis of information science, 1972-1995. J. Am. Soc. Inf. Sci. 49, 327–355. doi: 10.1002/(sici)1097-4571(19980401)49:4<327::aid-asi4>3.0.co;2-w
Wiklund, H., Neal, L., Glover, A. G., Drennan, R., Rabone, M., and Dahlgren, T. G. (2018). Abyssal fauna of polymetallic nodule exploration areas, eastern clarion-clipperton zone, central pacific ocean: annelida: capitellidae, opheliidae, scalibregmatidae, and travisiidae. ZooKeys 883, 1–82.
Woodall, L. C., Robinson, L. F., Rogers, A. D., Narayanaswamy, B. E., and Paterson, G. L. J. (2015). Deep-sea litter: a comparison of seamounts, banks and a ridge in the Atlantic and Indian Oceans reveals both environmental and anthropogenic factors impact accumulation and composition. Front. Mar. Sci. 2:3. doi: 10.3389/fmars.2015.00003
Woodall, L. C., Sanchez-Vidal, A., Canals, M., Paterson, G. L. J., Coppock, R., Sleight, V., et al. (2014). The deep sea is a major sink for microplastic debris. R. Soc. Open Sci. 1:40317. doi: 10.3389/fmars.2015.00003
Woodward, G., Ebenman, B., Emmerson, M., Montoya, J. M., Olsen, J. M., Valido, S. A., et al. (2005). Body size in ecological networks. Trends Ecol. Evol. 20, 402–409.
Zheng, J. G., Fu, L., Ma, X., and Fox, P. (2015). SEM+: tool for discovering concept mapping in Earth science related domain. Earth Sci. Inform. 8:95. doi: 10.1007/s12145-014-0203-1
Keywords: deep-sea biodiversity, terms mapping, Scopus, bibliometric, VOSviewer, publications trend
Citation: Costa C, Fanelli E, Marini S, Danovaro R and Aguzzi J (2020) Global Deep-Sea Biodiversity Research Trends Highlighted by Science Mapping Approach. Front. Mar. Sci. 7:384. doi: 10.3389/fmars.2020.00384
Received: 22 November 2019; Accepted: 05 May 2020;
Published: 16 June 2020.
Edited by:
Stefán Áki Ragnarsson, Marine and Freshwater Research Institute, IcelandReviewed by:
Saskia Brix, Senckenberg Museum, GermanyGeorgios Kazanidis, The University of Edinburgh, United Kingdom
Copyright © 2020 Costa, Fanelli, Marini, Danovaro and Aguzzi. This is an open-access article distributed under the terms of the Creative Commons Attribution License (CC BY). The use, distribution or reproduction in other forums is permitted, provided the original author(s) and the copyright owner(s) are credited and that the original publication in this journal is cited, in accordance with accepted academic practice. No use, distribution or reproduction is permitted which does not comply with these terms.
*Correspondence: Jacopo Aguzzi, amFndXp6aUBpY20uY3NpYy5lcw==
†These authors have contributed equally to this work