 Mario N. Tamburri1*
 Ian C. Davidson2,3Matthew R. First4
 Christopher Scianni5
 Katherine Newcomer3
 Graeme J. Inglis6
 Eugene T. Georgiades7Janet M. Barnes1
 Gregory M. Ruiz3
- 1Chesapeake Biological Laboratory, University of Maryland Center for Environmental Science, Solomons, MD, United States
- 2Cawthron Institute, Nelson, New Zealand
- 3Smithsonian Environmental Research Center, Edgewater, MD, United States
- 4U.S. Naval Research Laboratory, Washington, DC, United States
- 5Marine Invasive Species Program, California State Lands Commission, Sacramento, CA, United States
- 6National Institute of Water and Atmospheric Research Ltd., Christchurch, New Zealand
- 7Biosecurity Science and Risk Assessment Directorate, Ministry for Primary Industries, Wellington, New Zealand
Biofouling is a long-standing challenge for ships because it can interfere with operations and increases vessel drag, fuel consumption and exhaust emissions. More recently, ship biofouling has also been recognized as a leading vector for global transfers and introductions of marine non-indigenous species. Ship in-water cleaning and capture (IWCC) systems, to remove and collect macrofouling organisms and associated antifouling coating compounds, are now becoming available as a possible solution to both problems. However, independent and rigorous evaluations of IWCC efficacy and environmental safety are needed to facilitate technology maturation, support vessel operator biofouling management decisions, aid IWCC approvals and permitting, and inform future biosecurity regulations. We developed a formal protocol for evaluating an IWCC system, on two ships with varying biofouling levels and under different environmental conditions, to quantify biofouling removal and capture efficacy as well as impacts on water quality. The IWCC system reduced hull biofouling by 82–94%. Concentrations of dissolved and particulate Cu and Zn in effluent from the IWCC onshore processing varied by orders of magnitude between trials, in one case greatly exceeding water quality standards. Our results demonstrate that rigorous, quantitative assessments of IWCC system performance are possible, even under challenging conditions. This initial evaluation also identifies the major factors that impact performance of in-water cleaning, and key needs for future research to consider in advancing standardized testing and independent evaluations needed for all in-water cleaning systems.
Introduction
Like all substrates placed in coastal waters, the wetted surfaces of ships are quickly colonized by a succession of diverse sessile or sedentary micro- and macro-organisms (Flemming, 2002). This biological fouling (biofouling) of ships has been a long-standing challenge for vessel owners and operators (Woods Hole Oceanographic Institute [WHOI], 1952), increasing drag, the cost of ship operations, and sometimes corrosion. Macrofouling, commonly considered individual organisms or colonies visible to the human eye (International Maritime Organization [IMO], 2011; California Code of Regulations, 2017; Ministry for Primary Industries New Zealand [MPI], 2018), is of particular concern for ship performance, because it can greatly reduce propulsion efficiency relative to clean or micro-fouled (biofilm or slime layer) hulls, causing dramatic increases in fuel consumption and greenhouse gas emissions (Schultz, 2007; Buhaug et al., 2009; Schultz et al., 2011). Furthermore, ship biofouling is a significant transfer mechanism (vector) for the translocation and introduction of non-indigenous species throughout the world (Hewitt and Campbell, 2010; Davidson et al., 2018), which can cause a range of impacts to various economic, ecological, societal, and cultural values (Ruiz et al., 1997; Grosholz, 2002; Hewitt et al., 2004).
A multi-billion-dollar antifouling industry has developed to combat the negative consequences of biofouling accumulation on ships. This is primarily achieved through application of surface paints that inhibit macrofouling attachment (using biocides) or reduce adhesion (non-biocidal) to wetted surfaces (Dafforn et al., 2011). Coatings are applied during dry-docking, which typically occurs every three to 5 years for ships, and are the foundation of a biofouling management approach by the shipping industry. Antifouling coatings that have biocides render surfaces toxic to potential colonizing organisms, preventing their attachment. A variety of biocides have been used throughout history, some of which have been subsequently banned (e.g., tributyl tin), due to their non-target effects on the marine environment (Sonak et al., 2009). Copper (Cu) and zinc (Zn) are two commonly used contemporary coating biocides (Dafforn et al., 2011). Foul-release coatings are usually non-biocidal (e.g., silicone-based) and function to minimize surface tension (roughness), preventing organisms from maintaining adhesion once a ship is underway. Other non-biocidal coatings include those designed to be “hard” and mechanically resistant to abrasive cleaning (Dafforn et al., 2011). Despite coating improvements over time, coating applications during dry-docking do not prevent all biofouling accumulation during in-service periods (time between dry-docking) (Georgiades and Kluza, 2017). There are also substantial areas of ships’ wetted surfaces that are challenging to coat (e.g., dry-dock blocking areas) or sub-optimal for coating performance (e.g., niche areas) and often act as biofouling hotspots on ships (Coutts and Taylor, 2004; Davidson et al., 2009; Davidson et al., 2016).
In-water cleaning is the current approach used to remedy biofouling accumulation during in-service periods and typically involves diver or remotely operated cleaning or cart systems (e.g., submersible cleaning and maintenance platforms [SCAMPs]) that remove biofouling from hull surfaces (Jones, 1999; McClay et al., 2015; Morrisey and Woods, 2015). While proactive approaches to in-water cleaning are also emerging (i.e., periodic cleaning to prevent or remove biofilms in order to inhibit/limit macrofouling growth), typically the initiation of in-water cleaning is triggered by a change in operational performance metrics, such as loss of speed or increased fuel usage (Tribou and Swain, 2010; Scianni and Georgiades, 2019). Importantly, while in-water cleaning is performed to reset hull surfaces to a more hydrodynamically smooth state, it can also result in several unintended consequences, including: (a) increased discharge of coating biocides to ambient waters; (b) increased biosecurity risk through the active release of live biofouling species to local habitats; and (c) diminished coating condition that reduces antifouling performance in subsequent months and years (Scianni and Georgiades, 2019). Until recently, approaches to in-water cleaning did not adequately address these water quality and biosecurity risks, but the development of capture technology in conjunction with in-water cleaning systems provides a possible solution that aims to mitigate these shortcomings. A transition from simple in-water cleaning to safe and effective in-water cleaning and capture [IWCC; similarly described by Scianni and Georgiades (2019) as proactive or reactive in-water cleaning and capture] would retain a key tool for global fleet hull husbandry while ensuring the cleaning events themselves do not exacerbate local water quality and biosecurity concerns, which are increasingly subject to regulation (International Maritime Organization [IMO], 2011; Department of the Environment [DOE] and New Zealand Ministry for Primary Industries [MPI], 2015; California Code of Regulations, 2017; Ministry for Primary Industries New Zealand [MPI], 2018).
Despite the frequent use of in-water cleaning to remove macrofouling, quantitative and independent assessments of biofouling removal efficacy or environmental safety are largely unavailable [however, see Davidson et al. (2008); Lewis (2013)]. As with all new innovations designed to address specific environmental concerns (and perhaps current or future regulatory requirements), independent, standardized and rigorous evaluations to quantify the performance of in-water cleaning systems are essential (Scianni and Georgiades, 2019). The aim of this study was to develop and refine test approaches and methods, conduct an initial demonstration performance evaluation of an IWCC system, and to provide a model to help advance third-party, comprehensive and predictive data that support: (a) technology developers or service providers, (b) vessel owners/operators, (c) permitting/approval authorities, and (d) regulatory agencies. This performance evaluation was based on two IWCC events, one each on the East and West Coasts of the United States, providing details of testing protocols and results for cleaning efficacy, capture efficacy, water quality impacts, biofouling waste removal, and quality control and quality assurance throughout this process. This study was not designed as an all-inclusive, definitive assessment of particular IWCC systems because of a priori uncertainty regarding logistics and response variables. Nonetheless, this study provides a framework, robust data from this particular testing regime, and a broader understanding of considerable logistical challenges and practicalities for future testing. Furthermore, we did not attempt to quantify impacts of cleaning events on ship coatings (beyond diver observations and photographs) although we recognize that this is also an important consideration to minimize the impact on coating service life.
Materials and Methods
This research followed processes and procedures used in third-party evaluations of aquatic instrumentation and ballast water treatment systems conducted by the Alliance for Coastal Technologies (ACT) and Maritime Environmental Resource Center (MERC), respectively, and builds upon several existing models for the verification and validation of environmental technologies (Environmental Technology Verification [ETV] Program, 2010; Waldmann et al., 2010; Drake et al., 2014). Two ships were used as test platforms, while docked in ports on the East and West Coasts of the United States, and provided a useful contrast in biofouling, coating, and local environmental conditions for testing the IWCC system. The U.S. Department of Transportation (DOT) Maritime Administration’s (MARAD) NS Savannah (Vessel 1), based in Baltimore, Maryland, is a retired, former nuclear-powered ship that had a 10-year-old, copper-based antifouling coating and an extensive accumulation of biofouling across hull surfaces consisting of barnacles, hydroids, mussels, tubeworms and bryozoans [FR 100 using the fouling rating [FR] scale developed by the United States Navy, Naval Ships’ Technical Manual Naval Sea Systems Command [Navsea] (2006)]. The MARAD MV Cape Orlando (Vessel 2), based in Alameda, California, is an a ready reserve force that had 3-year-old copper-based coating and biofouling that consisted primarily of heavy biofilms (FR 20) and patchy macrofouling (macro-algae, bryozoans, tunicates, and bivalves; FR 100). Therefore, Vessel 1 presented a cleaning and capture challenge at the upper levels of biofouling prevalence (high percent cover of calcareous macrofouling) and lower scale biocidal-release (long out-dated coating), whereas Vessel 2 presented a less severe biofouling challenge (less macrofouling and percent cover) but a higher-level coating biocide capture test (coating well within service-life specifications).
The IWCC system tested was the Subsea Global Solutions (SGS) Remora (clean and capture unit) plus Whale Shark (multi-stage shore- or barge-based waste treatment) arrangement. At the time of this study, SGS only had one Remora plus Whale Shark arrangement in commercial operations, so a single individual IWCC system was transported to both Baltimore and Alameda for testing. The Remora is diver-controlled cleaning unit equipped with rotating brushes designed to remove hard macrofouling from the hull. The brushes make contact with the ship surface to remove biofouling and create a turbulent flow under the cleaning unit shroud and impeller system. This flow regime is designed to capture the removed debris and water, which is subsequently forced up through an umbilical hose to a debris collection and effluent processing system on the surface. For debris and waste water treatment, the Whale Shark surface processing system (housed in a modified shipping container) was on shore adjacent to the ships, and included settling, coagulation, and filtration units down to 5 μm. Captured biofouling and coating debris were collected from the settling/filtration system, quantified and disposed of in accordance with local hazardous waste requirements from these tests.
The participating IWCC service provider (SGS) supplied a detailed list of physical and logistical requirements and constraints for safe and effective operations in the form of a Cut Sheet [see Alliance for Coastal Technologies [ACT] and Maritime Environmental Resource Center [MERC], 2019]. This sheet summarized the performance and other technical characteristics of the system in sufficient detail to allow design engineers to understand the role of each component in the overall system. To comply with existing regulatory requirements, a third party was contracted by the service provider to handle and dispose of the captured waste material created during testing at both test locations. The total mass and/or volume was recorded and copies of all records and forms produced in the handling and disposal of captured material were collected.
The same overall experimental design was used on each test vessel to measure the effect of cleaning and capture (test) events on both biofouling removal and water quality impacts. To identify potential hull sections designated for cleaning and control measurements, adjacent sections of the underwater ship hull surface were examined initially by ROV to estimate biofouling type and extent (FR ratings described above), and to confirm that biofouling conditions were similar (i.e., not so patchy as to confound a test). These large hull areas, which extended tens of meters of each ship’s length and from the waterline to the bottom of the ship (including under the flat-bottom where present), were then randomly assigned to serve as control or treated (cleaned) areas (Figure 1A). These paired control and treated areas were near the bow of Vessel 1 and near the stern for Vessel 2. Water quality parameters were measured at different locations and distances away from the treated area during the cleaning event (Figure 1A). In addition, water quality parameters were also collected at three adjacent stations, both before and during cleaning events to characterize temporal variation in background port conditions independent of IWCC system operation.
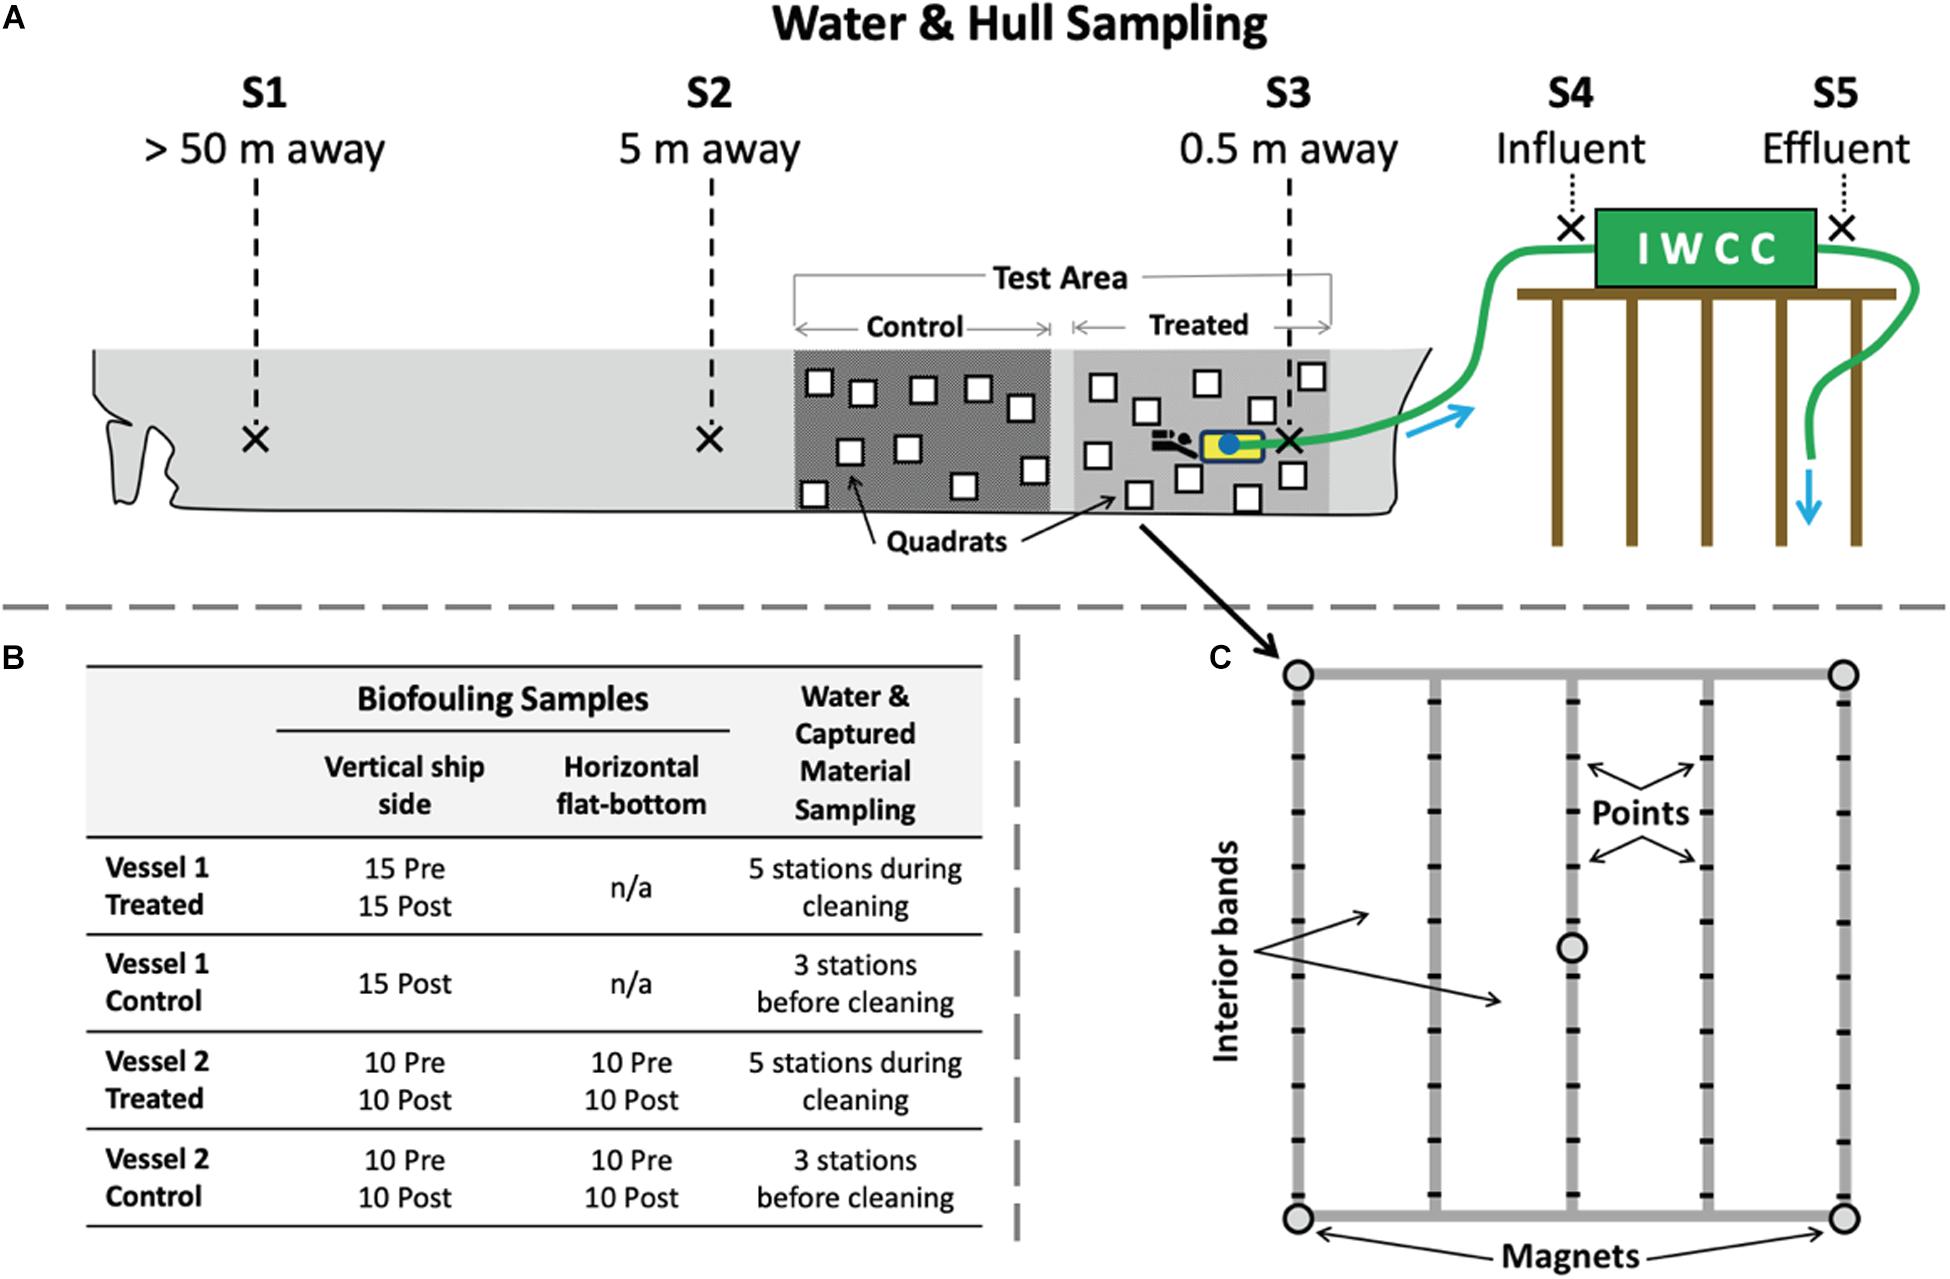
Figure 1. Overview of sampling design for biofouling and water quality testing. (A) Diagram (not to scale) showing locations of large hull areas in which quadrat samples were taken to measure biofouling before and after the cleaning event for each designated control and treated (cleaned) areas. Flat-bottom test areas were also included for Vessel 2. Water quality sampling took place at shipside stations S1 to S5, at distances of 50 m (S1), 5 m (S2), and 0.5 m (S3, attached to the cleaning device) from the cleaning event. Station S4 sampled the captured influent that was pumped from the cleaning unit prior to its entry to the processing container on the dock. Station S5 sampled effluent discharged from the processing container. Water quality sampling occurred at three additional background stations (B1, B2, and B3, not shown) to measure ambient conditions away from the vessel before and during tests. (B) Number of replicate quadrat measures for vertical and horizontal (flat-bottom) test areas by vessel, time, and sampling area and for water quality measures. (C) The 1 m2 quadrat used for measuring biofouling communities throughout testing, which included 50 points and four interior bands.
Given existing local permitting requirements for in-water cleaning, and emerging biofouling regulations, independent testing with an appropriate level of quality control and quality assurance (QA/QC) is essential. The ACT and MERC Quality Management Systems (QMS) were employed for all aspects of this evaluation to minimize uncertainties, document data quality, and ensure transparency of all aspects of the evaluation. The QA/QC for this work was based on both United States EPA and International Organization for Standardization (ISO) standards and practices (e.g., ISO/IEC 17025 and EPA QA/R-5). It included independent assessments and audits for the QC of samples and analyses, QA of the technical testing protocols, and data quality assessments. The third-party technical system and data audits (including data quality reviews, assessments, verifications and validations) found this study met all relevant EPA and ISO standards and QMS requirements of ACT and MERC. To our knowledge, this level of quality management has never been performed previously for tests of any ship biofouling in-water cleaning system.
Assessment of Biofouling Removal Efficacy
A Before-After-Control-Impact (BACI) sampling design was implemented to estimate change in biofouling assemblages associated with cleaning events for each vessel, comparing control to treated (i.e., cleaned) areas. For each treated and control area, divers used quadrats (1 m2, Figures 1B,C) to estimate extent of biofouling using both point counts and visual identification. To quantify percent cover and composition of biofouling, we identified organisms attached to the hull at each of 50 systematically spaced points in the quadrat. All organisms were identified in situ into broad taxonomic groups (e.g., mussels, barnacles, hydroids, solitary tunicates, etc.), and some sample collections were made for species-level identifications in the laboratory (not reported here). “Bare hull” was recorded at quadrat points under which there was no visible biofilm or macrofouling. Within each quadrat, four vertical bands of space (1 × 0.25 m) were evaluated to visually estimate FR and percent cover to augment the point count data and examine small-scale (within quadrat) patchiness in biofouling cover.
For test Vessel 1 (in Baltimore, MD, United States), a severe (50-year) rainfall event prevented initial data collection in the control area of the hull, prior to the cleaning event, while a full BACI design was used for test Vessel 2 (in Alameda, CA, United States). For both vessels, we compared adjacent treated and control areas on the vertical (side) underwater hull surface. For the second test vessel (in Alameda, CA, United States), we also had paired control and treated areas on the horizontal (flat-bottom) surfaces of the vessel (Figure 1B). At each time of sampling, quadrats (n = 10 to 15) were randomly placed within each sampling stratum (control and test areas, vertical and flat-bottom hull areas) to measure biofouling coverage (point counts, percent cover, FR ratings per quadrat; Figure 1C). All pre- and post-cleaning surveys for biofouling organisms were conducted within 5 days, to minimize possible confounding with temporal changes to biofouling assemblages. Due to extremely low visibility in both tests, our planned photographic sampling at the quadrat- or even quarter-quadrat- scale was not possible because time constraints prevented close-up images of each point on the quadrat. As a result, all point count measurements were taken by divers in the field using visual surveys per point recorded on in-water data sheets, with an additional dive to collect qualitative images included at the end of each sampling event.
Biofouling composition was compared among strata (control/treated, vertical/horizontal) using PERMANOVA tests and plotted using non-metric multidimensional scaling (nMDS). Differences in biofouling percent cover were tested using generalized linear models in a quasi-poisson distribution, with Pre/Post (both vessels), Control/Treated (both vessels), and Vertical/Horizontal (Vessel 2 only) compared as fixed factors. During sampling, divers also recorded whether the following coating conditions were visible within the quadrat: scratches, brush marks, paint flakes, pits, bare metal/polish through, dock block, or no blemishes (coating observation not reported here).
Assessment of Capture and Effluent Processing Efficacy
On the day of each IWCC test, the background hydrographic conditions, such as general current direction and velocity, were recorded using an acoustic Doppler current profiler (ADCP, a type of current meter). Background water quality conditions were recorded using a multiparameter sensor package and a Secchi disk. Observations of weather and tidal state were also recorded.
The efficacy of debris and biocide capture was determined by sampling five set station locations during testing (S1–S5, Figure 1A), plus an additional three background water quality condition locations (B1, B2, B3, Figure 1B). Sampling at S1, S2, S3, and S5 was continuous and time-integrated, and commenced as soon as cleaning operations began and continued until cleaning operations ceased, to fill a 20 L carboy (15 to 20 L total volume collected). Because of large amounts of debris and particulate material, station S4 samples could not be collected with the same approach described above. Instead, separate 20 L samples were collected at station S4 at three separate time points: 5 min after hull cleaning had started, at the predicted midpoint of cleaning, and 5 min prior to predicted end of cleaning. Sampling at S5 began when the effluent discharge started (5–10 min after cleaning began) and continued until effluent discharge from the onshore processing was complete (Figure 1A). Sampling at B1, B2, and B3 stations occurred a day prior, 1 h before the start of cleaning operations, and at the midpoint of the cleaning operation. These results are available as Supplementary Material, since they did not affect or impede the testing protocols or interpretation of results. Samples were analyzed by preapproved, certified laboratories for total suspended solids (TSS), dissolved, particulate, and total metals (copper and zinc), and particle size distributions for S5 effluent samples (also reported in Supplementary Material) using certified United States Environmental Protection Agency (EPA) methods, when possible.
A dye-capture visualization method was also attempted to characterize the performance of the cleaning unit’s suction during the test events. Small dye packs with 4 g/L of fluorescein sodium salt and a magnet were placed on the hull so that they would be torn open, releasing the dye, when the cleaning unit passed over them. Video of the dye advection was captured on two underwater video cameras affixed to the front and rear of the vehicle. Sequences of frames that contained dye release and uptake were selected for image analysis.
Results
Biofouling Removal Efficacy
There was a significant effect of cleaning on biofouling percent cover and organism composition for both vessels. Mean percent cover of biofouling declined in the treated area from 99.3% pre-clean to 17.6% (3.2 SE) post-clean on Vessel 1, and from 100% to 6.3% (3.7 SE) on Vessel 2 (Figure 2). Results from diver estimates of percent cover within quadrats were almost identical to point count data, suggesting no within-quadrat or sample area patchiness or sources of scale-dependent variation in biofouling cover were present within the sampling areas. Percent cover data that follows are from the point count method only. For Vessel 2 (Alameda), the effect of cleaning was significant and pronounced for both vertical and horizontal surfaces, and there was no difference between post-cleaning controls and pre-cleaning treated or control areas. However, biofouling percent cover did differ significantly between post-cleaning control areas and post-cleaning treated areas (all p > 0.05) for Vessel 2 (Figure 2). It is also important to note that cleaning efficacy was fairly consistent between the two different vessels and variability in the percent cover of post-clean biofouling that remained was relatively low.
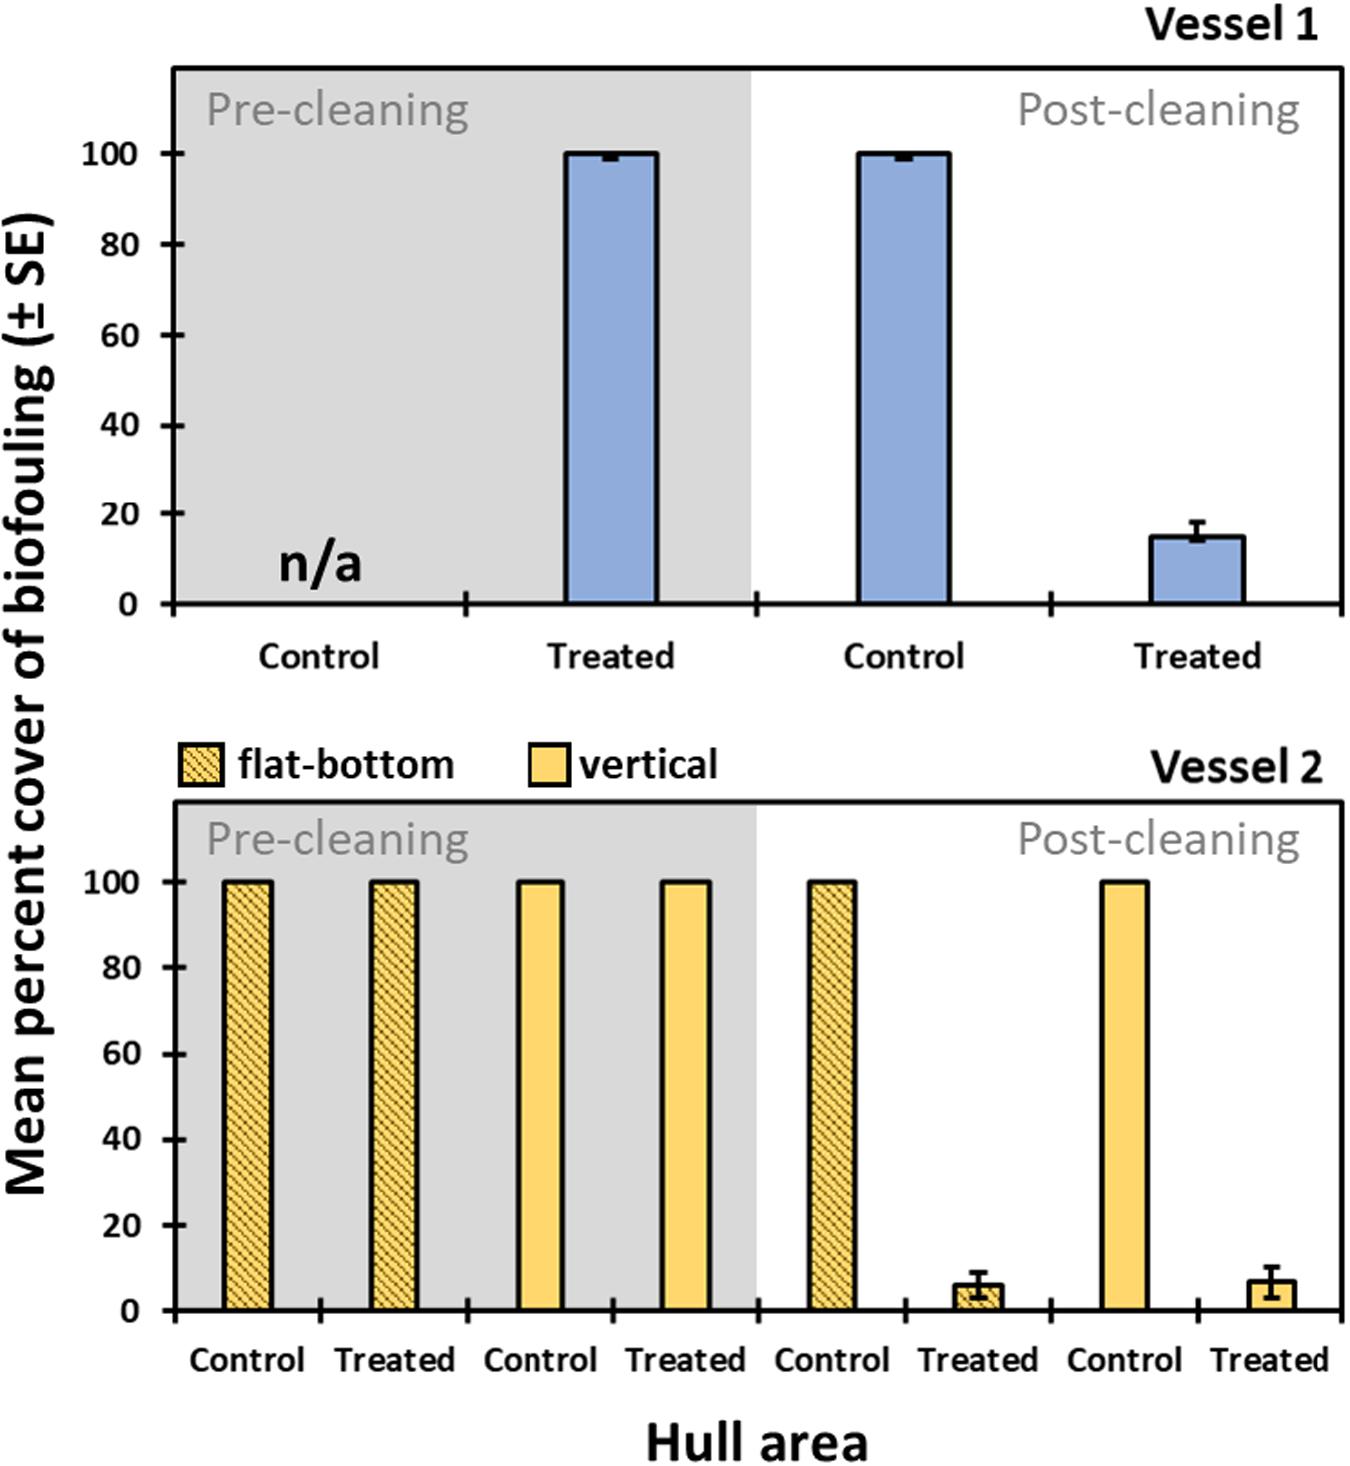
Figure 2. Percent cover of biofouling (mean ± SE) for different hull areas (treated and control) prior to cleaning and after cleaning. Data are based on point-count surveys for Vessel 1 (top) and Vessel 2 (bottom).
Multivariate analyses of biofouling showed distinct differences in post-cleaning samples compared to pre-cleaning and control samples on Vessel 1 (Figure 3; PERMANOVA, df = 1, f = 93.56, p = 0.001). Similar analysis of biofouling for Vessel 2 also showed distinct differences in treated (cleaned) areas compared to pre-clean and control samples (Figure 3; PERMANOVA, df = 1, f = 187.75, p = 0.001). Thus, there was a clear shift in species composition associated with cleaning events across both vessels, driven by significant reductions in biofouling cover, for vertical and horizontal (flat-bottom) hull surfaces. There was no particular taxonomic or morphological pattern for residual biofouling that remained in treated areas after cleaning on both test vessels. For example, we did not observe certain hard taxa (e.g., barnacles) or low-profile organisms (e.g., encrusting bryozoans) that remained compared to all other organisms present in pre-cleaning samples. Rather, residual biofouling was observed along narrow bands of hull surface that were simply missed during cleaning or in multi-species aggregations that were not completely cleared by the cleaning unit.
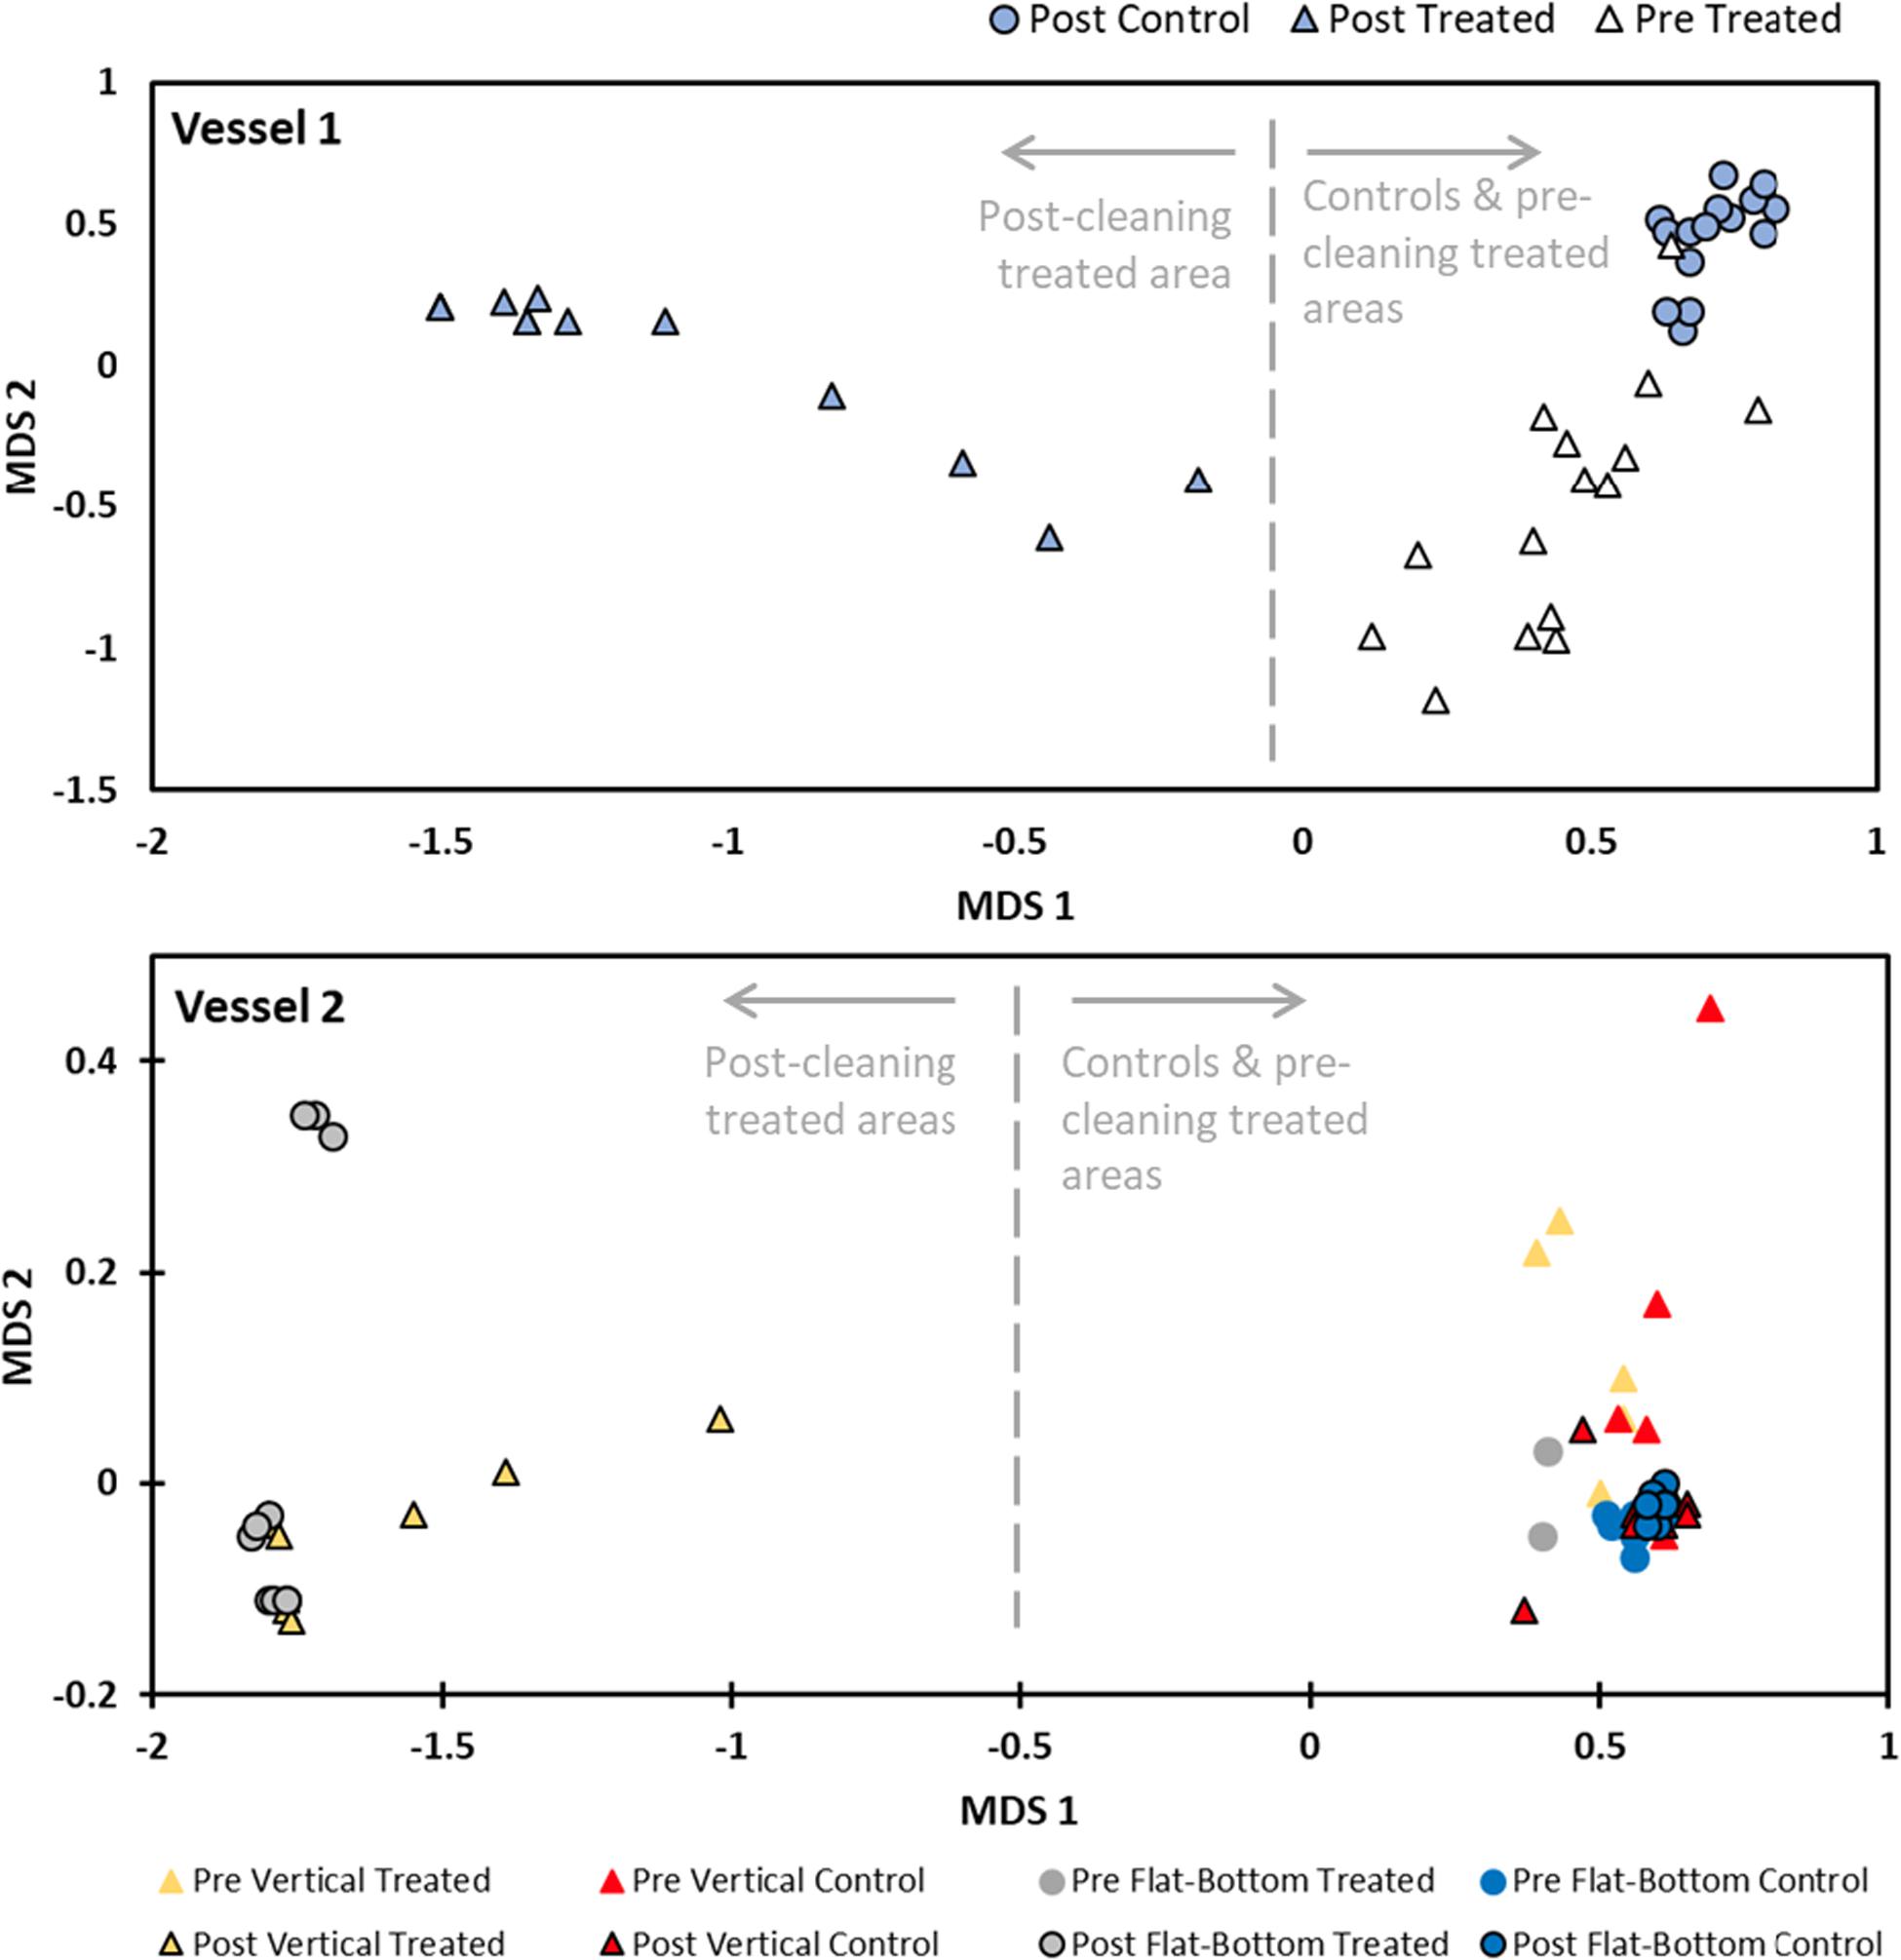
Figure 3. Non-metric multidimensional scaling (nMDS) plots based on biofouling composition in replicate samples for Vessel 1 (top) and Vessel 2 (bottom). There was clear distinction among biofouling communities that were subjected to cleaning compared to those that were not (see text for associated PERMANOVA results).
While our analyses demonstrated significant effects of cleaning on both cover and composition of biofouling for both vessels, the magnitude of effects differed between test vessels, largely based on the type of biofouling present. Both vessels had a high percent cover of biofouling (Figure 2) but Vessel 1 had a far higher extent of calcareous macro-organisms, including barnacles and mussels, and dense cover of the low salinity tolerant bryozoan Victorella (cf. pavida) (Figure 4). As a consequence of this well-established and dense biofouling cover (corresponding to FR 100 at essentially 100% cover), the post-cleaning residual biofouling on Vessel 1 (Figure 2) was higher than for Vessel 2. This excluded basal plates or scars of barnacles (which were scored as zero biofouling) but included remnant patches of Victorella in particular (Figure 4), as well as occasional live barnacles and mussels. By contrast, pre-cleaned surfaces of Vessel 2 were dominated by thick biofilms and patches of macro-organisms (corresponding to FR 20 for a majority of surface area), much of which was removed during cleaning except for smaller patches of biofilm and clusters of macro-organisms (for example, on dry-dock block surfaces) that were depleted of organisms but not completely cleaned. Post-cleaning measurements revealed a significant increase in bare space for Vessel 2, with 14 out of 20 quadrats being 100% free of biofouling (GLM quasi-poisson; estimate = 2.76, t = 13.64, p < 0.0001; Figure 4).
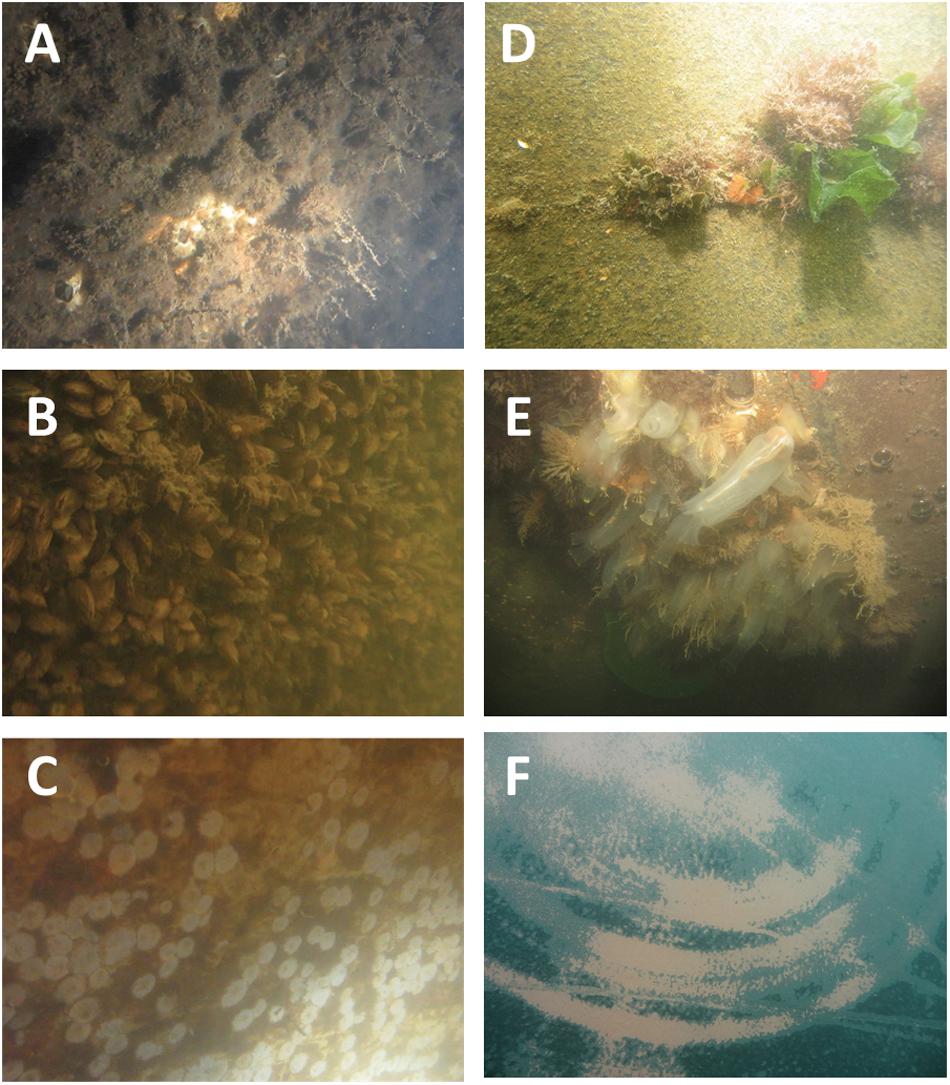
Figure 4. Examples of biofouling cover for Vessel 1 (A–C) and Vessel 2 (D-F). Biofouling on Vessel 1 consisted of dense cover of barnacles, hydroids, mussels, and bryozoans (A,B), which was subsequently removed in the treated area during cleaning to leave barnacle scars and residual organisms, mainly bryozoans (C). Biofouling on Vessel 2 comprised thick biofilms and clusters of macro-organisms (D,E) which were removed to a large extent during cleaning (F).
The difference in composition of biofouling is also important because most current biosecurity rules do not intend to regulate fouling of FR20 or lower (i.e., biofilms) (International Maritime Organization [IMO], 2011; Department of the Environment [DOE] and New Zealand Ministry for Primary Industries [MPI], 2015; California Code of Regulations, 2017; Ministry for Primary Industries New Zealand [MPI], 2018). It is assumed that for biosecurity, efficacy is most important for FR30 or greater where there are soft macrofouling or calcareous organisms (Scianni and Georgiades, 2019). Therefore, changes in percent cover of total biofouling (biofilms and macrofouling) may not by themselves provide a useful regulatory measure of in-water cleaning efficacy. Our analysis included biofilms (with associated micro-organisms) in the measure of IWCC biofouling removal efficacy because they can present ship operational concerns (Schultz et al., 2011) and may present biosecurity risks (Scianni and Georgiades, 2019). If we only include macrofouling organisms in percent cover estimates, the results are unchanged for Vessel 1, which was dominated by invertebrates (Figure 2). In contrast, Vessel 2 was dominated by biofilms with low percent cover of macrofouling prior to cleaning, and there was little measurable effect of cleaning on invertebrates, due to low signal or sensitivity (Supplementary Figure 1). This underscores the importance of defining initial challenge conditions (community composition and cover) in assessing IWCC performance and capability, which is context dependent.
Assessment of Capture and Effluent Processing Efficacy
A major storm event in Baltimore preceding the in-water cleaning test on Vessel 1, caused elevated background TSS levels during the trial that greatly reduced diver visibility and the ability to use elevated TSS as an indicator of incomplete or inadequate cleaning debris capture. TSS from the sampling stations in Baltimore (S1, S2, and S3) ranged from a mean (and S.D.) of 6.6 (0.2) to 15.2 (0.7) mg/L, increasing with proximity to the cleaning unit. While low visibility conditions did not allow for visual/video assessment of the possible sources of increased suspended material (e.g., leaking shroud around cleaning unit, diver contact with vessels, umbilical contact with vessel, etc.), it appeared that cleaning operations in general had measurable impacts on local TSS levels. Not surprisingly, the TSS measurement for the pre-processing influent (station S4) was extremely high, at 311.6 (115.7) mg/L, and was reduced to 63.7 mg/L following onshore effluent processing (effluent sampled at station S5). This relatively high TSS level effluent returning back to the surrounding waters was likely a result of both high ambient suspended solids and large amounts of captured debris clogging and overwhelming the ability of the filtration system to be cleaned or self-cleaned during processing. TSS values recorded in Alameda (Vessel 2) were much lower overall, with TSS at stations S1, S2, and S3 ranging from 5.5 (0.3) to 6.2 (0.6) mg/L. The pre-processed TSS at station S4 was 138.8 (102.9) mg/L and was reduced to 11.9 (1.0) mg/L following effluent processing (station S5).
In Baltimore (Vessel 1), dissolved copper measured at stations S1, S2, and S3 ranged from a mean (SD) of 1.65 (0.03) to 1.82 (0.00) μg/L (Figure 5), which are both below local acute water quality standards of 6.1 μg/L. This was not surprising given the age of the antifouling coating on the vessel hull. The particulate fraction was also low (Figure 5), ranging from 0.50 (0.02) to 1.28 (0.10) μg/L. The values remained low for the dissolved portion of samples collected from the influent waste stream prior to debris processing (station S4), ranging from 1.66 (0.05) to 2.85 (0.09) μg/L. However, compared to stations S1–S3 the station S4 particulate portion was elevated approximately 20-fold, ranging from 10.87 (6.3) to 34.21 (6.13) μg/L (Figure 5). The post-processing effluent values (station S5) were reduced to Below Detection Limit (BDL < 0.5 μg/L) for the dissolved portion and 7.29 (0.97) μg/L for the particulate fraction.
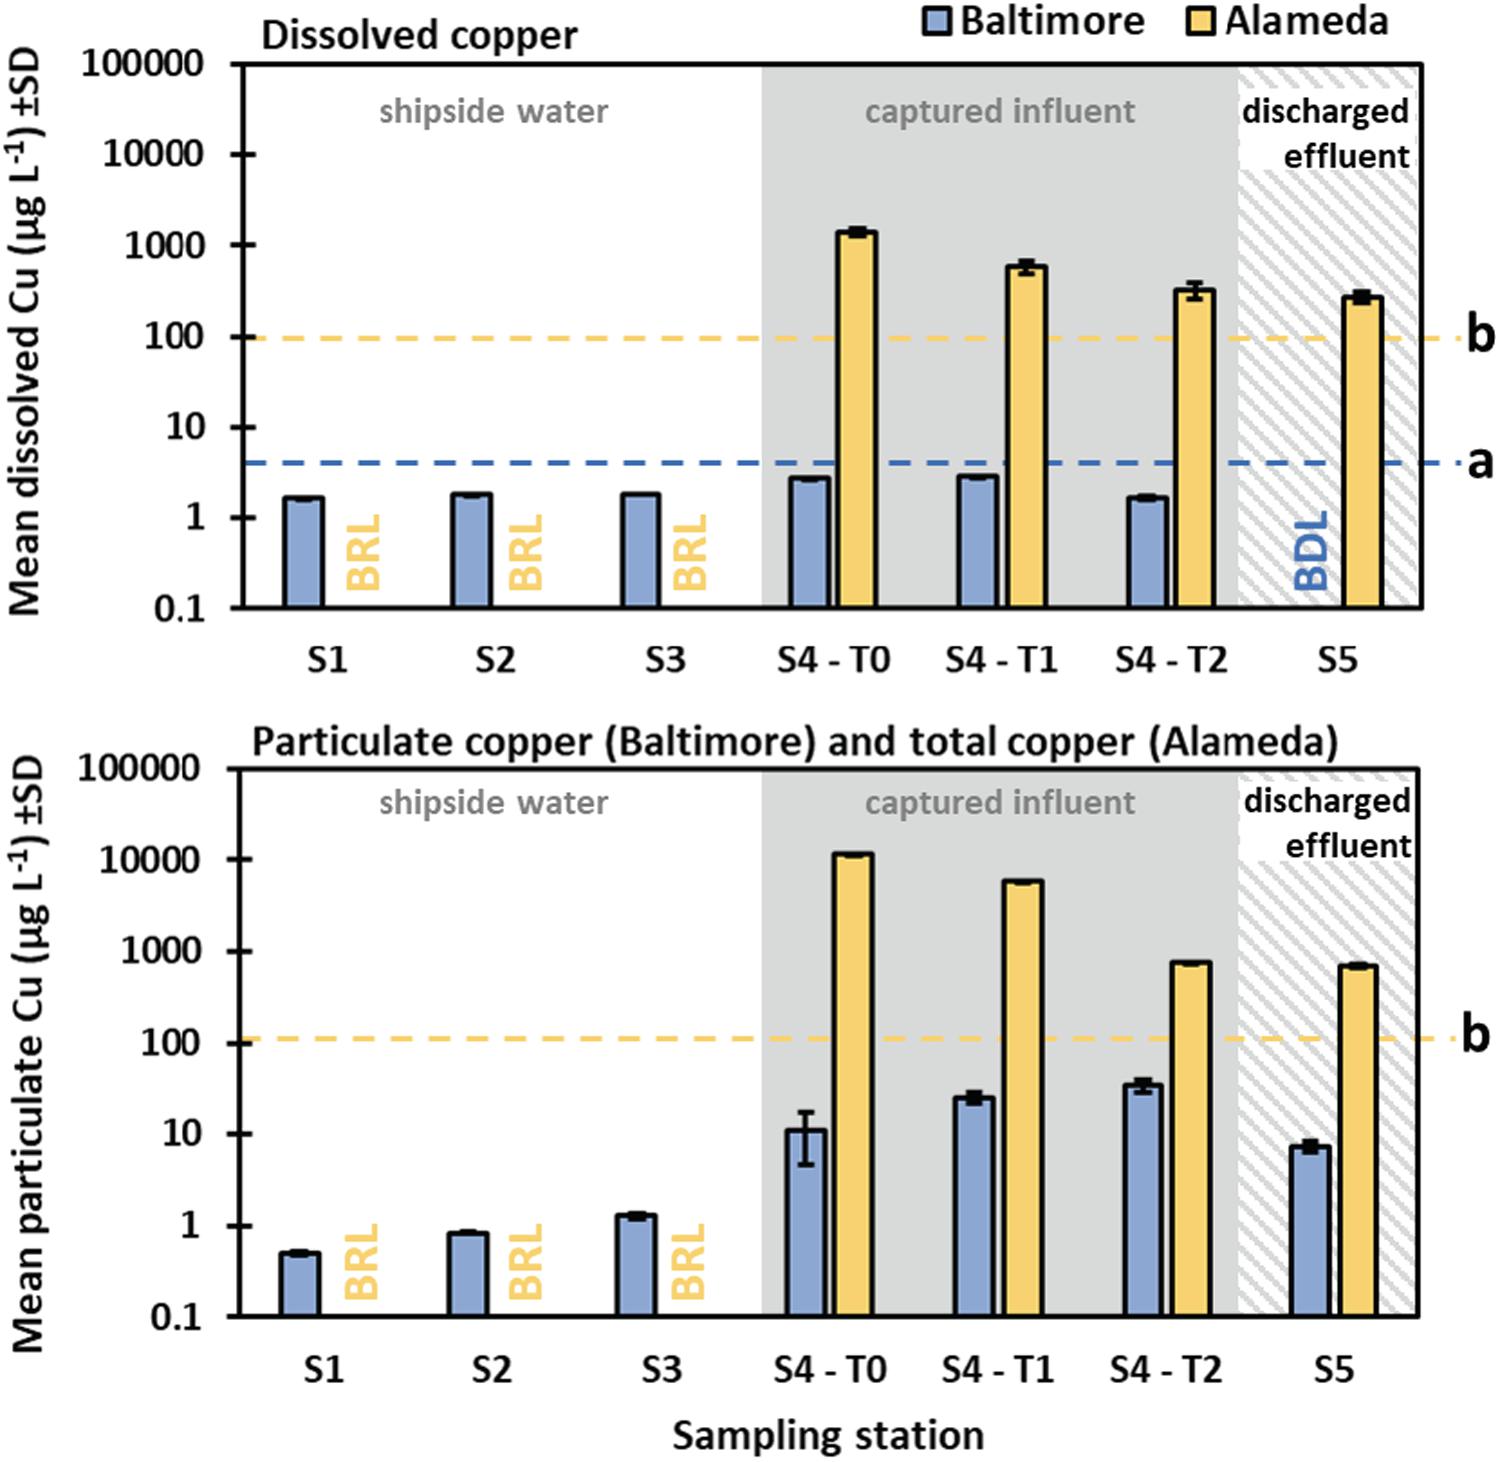
Figure 5. Dissolved and particulate (Vessel 1, Baltimore) or total (Vessel 2, Alameda) copper concentrations from water sampling stations during IWCC trials in Baltimore (Maryland) and Alameda (California). BDL (Baltimore) is below detection limits. BRL (Alameda) is below reporting limits. Note the logarithmic scale of the y-axes. The blue dashed line (a) indicates the toxic substance criteria for Maryland waters for dissolved inorganic copper acute standard for estuarine waters of 6.1 μg/L (no chronic standard). The yellow dashed line (b) indicates the total inorganic copper chronic standard for surface waters in San Francisco Bay of 100 μg/L (no particulate and dissolved standards). Note that appropriate water quality agencies were alerted and they have since required the vendor to include an additional media metal separation step to ensure that future discharges meet local standards.
In Alameda (Vessel 2), the dissolved and total copper measurements from stations S1, S2, and S3 were all Below Reporting Limits (BRL). However, copper values collected from the influent and effluent (just before and after onshore processing, S4 and S5) for the Alameda trial were considerably higher than those for the Baltimore trial (Figure 5), which reflects a more recent antifouling coating application to the test vessel (i.e., antifouling coating was within its service life). Pre-processing (S4) measurements were two to three orders of magnitude greater than in Baltimore, ranging from 320.9 (59.6) to 1,414.5 (140.5) μg/L. Total copper was approximately another order of magnitude greater, ranging from 753.2 (14.0) to 11,518.3 (66.0) μg/L. Although reduced following processing, copper values from station S5 in Alameda were still elevated, measuring 273.3 (39.8) μg/L for the dissolved portion and 703.6 (31.1) μg/L for total copper. These values would clearly exceed water quality standards as they are currently established within Maryland, California and other jurisdictions, indicating additional effluent processing would be required to reduce copper values to acceptable (permitted) levels. In many cases, filtration alone (even down to 5 μm) is unlikely to be sufficient in eliminating the risks of elevated coating biocide release into the environment (as fine particles or in a dissolved form). Therefore, the addition of a sorbent media for the removal of heavy metals from effluent water should be considered for IWCC systems, when used on biocidal antifouling coatings.
In Baltimore, zinc measurements followed a similar pattern to copper (Figure 6). Dissolved zinc from stations S1, S2, and S3 ranged from BDL (BDL = 1.0 μg/L) to a mean (SD) of 1.71 (0.37) μg/L, and particulate zinc ranged from BDL to 2.61 (0.94) μg/L. Pre-processing influent (S4) ranged from 5.21 (0.36) to 12.02 (0.11) μg/L for the dissolved fraction and from 82.47 (9.71) to 235.13 (20.28) μg/L for particulate zinc. Post-processing effluent (station S5) zinc was BDL for the dissolved portion and 13.36 (1.42) μg/L for particulate zinc. In Alameda, stations S1, S2, and S3 had dissolved and total zinc measurements all below reporting limits. The pre-processing influent (S4) mean (SD) values ranged from 976.9 (171.9) to 1,785.1 (209.1) μg/L for the dissolved portion, and 2696.7 (67.1) to 13,086.7 (71.5) μg/L for total zinc. Post-processing effluent discharges (S5) had values of 1,354 (177.3) μg/L for the dissolved portion and 1,744.3 (86.3) μg/L for total zinc. Similar to results for copper, the capture of zinc during the Maryland trial resulted in effluent discharges that fell below the standards for local waters, whereas additional steps would be required to achieve a similar result for California waters.
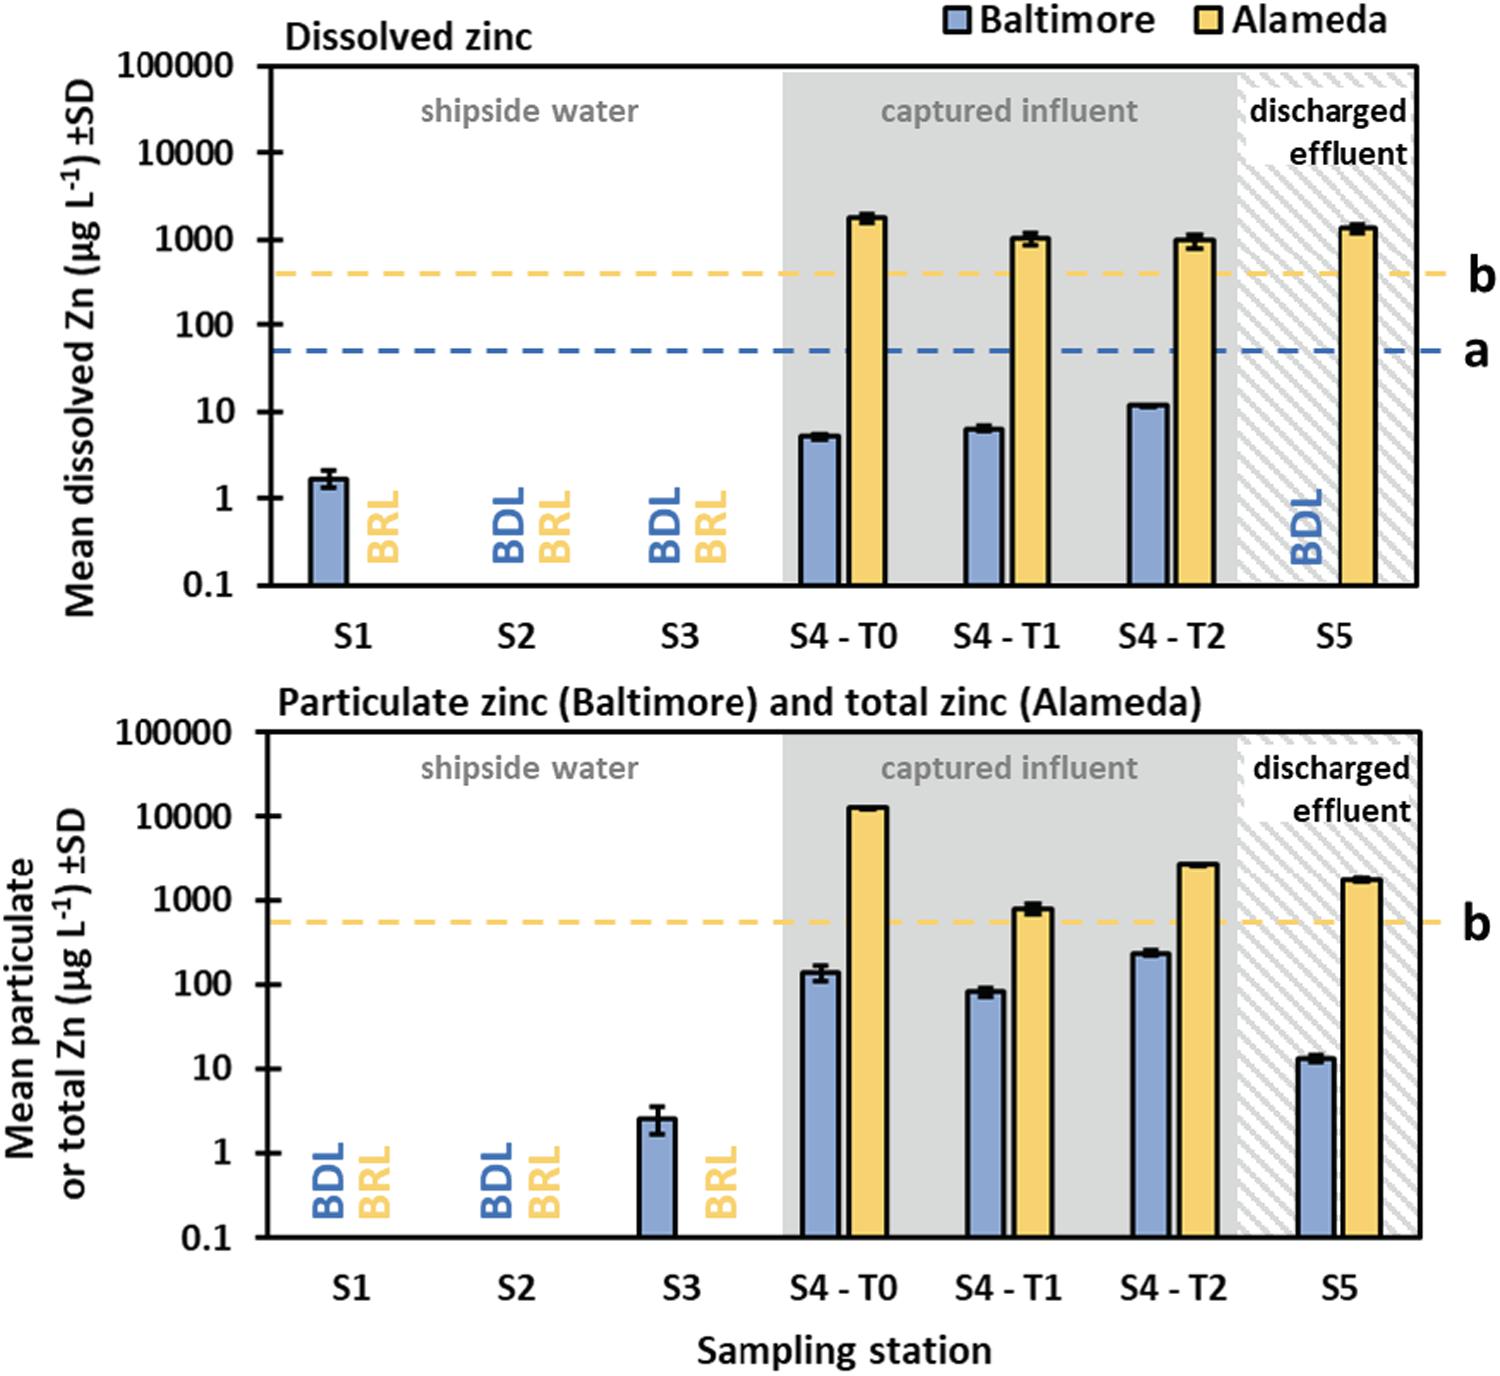
Figure 6. Dissolved and particulate (Vessel 1, Baltimore) or total (Vessel 2, Alameda) zinc concentrations from water quality sampling during the Baltimore and Alameda IWCC trials. BDL (Baltimore) is below detection limits and BRL (Alameda) is below reporting limits. The blue dashed line (a) refers to the chronic dissolved standard for zinc in Maryland marine surface waters of 81 μg/L (no standard for estuarine waters but freshwater standard is 120 μg/L). The yellow dashed line (b) refers to the chronic total zinc standard for San Francisco Bay surface waters of 700 μg/L (no particulate and dissolved standard).
To verify containment of debris from the system’s cleaning head through to onshore surface processing, a dye-release test was performed using dye packs attached to the hull with magnets. The pack’s magnetic adherence to the hull was not sufficient, however, and the cart pushed the dye packs forward thus keeping them out of the shrouded cleaning area under the cleaning apparatus. The method was modified so that the operating diver released the dye near the shroud’s opening (Morrisey et al., 2015). Video collected during the approximate 10 s following dye release showed the color signature of the fluorescein dye removed in 2.5 s following its release. While two cameras were mounted, dye was only visible from one camera, which was insufficient to indicate the extent of dye plume. Nonetheless, the dye trial indicated that water was rapidly advected into the shroud, presumably through the intake piping to the processing system. In future studies, improved dye pack design and employment of an omnidirectional, 360°camera may enable better assessment of system debris containment. Future testing should also consider frame rates, lighting requirements, and visibility levels (Morrisey et al., 2015) that could allow for particle image velocimetry of debris and particulates in the area around the cleaning apparatus.
Finally, as an estimate of the amount of debris captured by the cleaning unit and removed as part of onshore effluent processing, volumes of IWCC system operations waste disposal in both Baltimore and Alameda were documented. Biofouling debris filled fifteen 55-gallon drums (1A2/X400/S steel salvage containers) for Vessel 1 and three drums for Vessel 2.
Discussion
Our results show that statistically appropriate measures of the performance of IWCC systems are feasible and practicable. In this initial and limited study, evaluating only one IWCC on two vessels, reductions in biofouling (biofilms and macrofouling) were quantified by diver surveys of control and treated locations on the vessels after individual cleaning events, even under challenging conditions. Although these sampling events were completed with in situ direct diver observations (and provided robust and repeatable measures of biofouling under low visibility conditions common to ports), we also recommend that photographic and/or video data be collected (when conditions allow) to create additional records for validation and potential further analyses (Morrisey et al., 2015). Camera systems do exist (e.g., camera water-box, Hearin et al., 2015) that may be able to accomplish much of this even under low visibility conditions, but they have limitations for use on curved surfaces, and require specific equipment and additional time. Thus, constraints and tradeoff for photo or video documentation need to be considered up front.
Sampling and analyses for possible water quality impacts (i.e., coating-associated biocides and TSS) were conducted to determine if in-water cleaning and post-processing discharges met relevant regulatory requirements. This will be essential as in-water cleaning systems evolve to address the capture of both particulate and dissolved material released during operations. Ambient levels of metals (e.g., copper) in industrial port waters can often be relatively high and variable (Hall et al., 1988; Jahan and Strezov, 2017) and sampling efforts for background conditions should be designed to collect a series of multiple discrete samples over time to capture this ambient variability. We found from this initial evaluation that: (a) a relatively large number of samples and sample positions is needed on each survey occasion to capture variability in background levels of water quality parameters, (b) samples should be collected directly from the cleaning unit itself to capture subtle changes in parameters of interest associated with cleaning events (tests), and (c) target water quality parameters should be customized based on the coating type(s) being cleaned. Future testing is likely to be focused on regulatory compliance, meaning measurements taken in the vicinity of the cleaning event (i.e., hull side and near the cleaning apparatus) and from the effluent discharge line will be prioritized over background levels of water quality parameters.
Overall, a wide range of issues can affect the performance of in-water cleaning systems. Biofouling can vary in the types of organisms present, the percent cover present, and the distribution of that cover across hull surfaces. It is critical to challenge in-water cleaning systems to a range of these conditions, including the maximum levels they are designed to handle, to provide a reliable record of performance and without precluding the value of associated testing (i.e., capture of debris and biocides during cleaning). Similarly, the ability to assess performance of cleaning systems may be constrained in certain environmental conditions. For example, storm conditions in Baltimore (Vessel 1) had severe effects on shipside visibility impeding or preventing some pre-cleaning sampling, photographic capability, and implementation of the full scope of the intended research. Diver point counts were sufficient for the purposes of this study and in the absence of image collection would work more broadly for evaluations of cleaning systems under poor visibility. While this does not follow the recommendations on such evaluations in Morrisey et al. (2015), which included a minimum visibility of 2 m, determination of standards for in-water cleaning evaluations (including visibility) will fall to regulatory bodies. Such decision making needs to balance the acquisition and verification of quality data to underpin the decisions made regarding system approvals against the operation of such systems in less ideal conditions (e.g., low visibility port environments).
Our study was designed explicitly to consider a single ship as the appropriate level of replication for these types of tests rather than multiple sections of a single ship (Morrisey et al., 2015). Using a ship as the level of replication measures variation in IWCC operation and performance across ships and conditions, to adequately capture the diverse range of variables that can affect performance. It also ensures the scale of testing approaches real-world needs for cleaning systems to operate over large surface areas of ships, potentially generating substantial amounts of captured debris which provides insight into capture and filtering capacity. Equally important is to characterize the specific test or challenge conditions being evaluated, in terms of biofouling community attributes (percent cover and community composition), ship characteristics (coatings), and environmental conditions. Thus, tests over a representative range of conditions (e.g., at least three replicate ships and more than one location) are needed to evaluate the strengths and constraints of particular IWCC systems and their appropriate applications for biofouling management. This initial study attempted to capture some of this important variability, with two distinct test vessel types and locations (e.g., different ship designs, operations, histories, coatings, coating ages, fouling levels and types, water clarity, currents, etc.). However, we were limited by ships available for testing and resources needed to conduct multiple replicate trials. While this limitation (n = 2) prevents a more complete understanding (and statistical analyses) of the performance of this one specific IWCC system, we were able to achieve our primary goal of developing and refining test approaches and methods, as a model to help advance third-party, comprehensive and predictive testing.
Based on our experience to date, we also suggest that future evaluations of water quality impacts collect a minimum of three different continuous, time-integrated samples during the designated cleaning period. The first should be collected by attaching a hose or pump directly to the cleaning unit, at a location of highest potential for elevated biocide levels during cleaning (based on cleaning unit design, direct observations and/or computational fluid dynamics). The second should be a parallel integrated sample collected from a location approximately 50 m from any cleaning operations, to capture potential variability in ambient waters during the same time period. The third continuous, time-integrated sample should be taken directly from the effluent line after onshore processing (prior to discharge back into the environment), corresponding to the time debris and wastewater was collected during the cleaning event. Further, any discrete samples taken should focus into parts of the unit’s operations that have greatest potential for release of material, such as turning of the unit and the cleaning of curved or uneven surfaces. While it may not be required for regulatory compliance, additional samples should be taken to measure influent wastewater and debris (from the cleaning unit and just prior to onshore processing) to quantify (before versus after) wastewater processing efficacy. Concentrations of biocide and TSS collected from the cleaning unit and processed effluent can then be directly compared to regulatory requirements as well as the range of biocides and TSS found in ambient waters.
In addition to the potential for in-water cleaning to result in increased levels of coating biocides (such as copper and zinc), a larger proportion of existing anticorrosive and antifouling marine coatings use microplastics as binding agents (Shtykova et al., 2006; Song et al., 2014), which have been recognized as a significant environmental concern (Browne et al., 2007; Zarfl et al., 2011; Boucher and Friot, 2017). These agents also may be released, causing elevated concentrations in localized areas as a result of in-water cleaning activities. Therefore, we propose that similar comparisons of ambient microplastics versus levels found during cleaning events be conducted using emerging methods for microplastic quantification and characterization (Yonkos et al., 2014; Masura et al., 2015).
It is also important to note that most existing in-water cleaning systems have been developed to specifically address vessel operations and fuel consumption, and without a debris capture process (Jones, 1999; Preiser and Laster, 2009). Therefore, most current in-water cleaning systems are focused exclusively on removing biofouling from the main hull surfaces to reduce drag, while ignoring ship niche areas (e.g., sea chests, thrusters and rudders), which can be “hot spots” for the transport of non-indigenous biofouling species (Coutts and Taylor, 2004; Davidson et al., 2009; Moser et al., 2017). This initial evaluation did not include the quantification of performance in ship niche areas because it was outside of the specific IWCC system design. However, as regulations focused on biosecurity evolve, we propose that the fundamental test methods and approaches presented here should be adapted to include external and internal niche area biofouling (Davidson et al., 2014; Morrisey et al., 2015; Growcott et al., 2019).
The widely used approach of ship in-water cleaning, without any attempt at debris capture, has not been evaluated for efficacy and environmental safety in any comprehensive or consistent way using quantitative measures. Previous assessments have typically been based on anecdotal observations or operational/economic measures [e.g., reductions in ship fuel consumption, Townsin et al. (1981); Schultz et al. (2011)]. While a few assessments of in-water cleaning with capture have been attempted, there is a conspicuous paucity in published results available and performance measures have been limited in scope (Davidson et al., 2008; Hopkins et al., 2010). Given operational costs of biofouling management to ships and growing environmental concerns, including potential for release of biocides and non-indigenous species associated with in-water cleaning, independent, standardized and rigorous evaluations of all in-water cleaning systems are essential. Fortunately, these fundamental test methods and approaches also can be adapted for comparable evaluations of conventional ship in-water cleaning without capture and for developing proactive in-water removal of biofilms systems (designed to prevent/limit macrofouling growth). Testing the efficacy of the latter systems would require the addition of repeated measures of biofouling (both biofilms and macrofouling) on control and test surfaces of ships over time.
While this evaluation of one specific IWCC system (on two different vessels, in two different locations) provides new insight, efforts to develop truly comprehensive, predictive and standardized testing can be quite complex. With over 70,000 commercial vessels in the global fleet, there is wide variation in ship design, age, operations, routes, biofouling management strategies, and biofouling occurrence. Moreover, no two in-water cleaning systems are identical. Each system has unique design features and operational requirements or procedures. Additionally, the systems may be localized to a specific port or region. Through this evaluation and broader discussions with this project’s Technical Advisory Committee and subject matter experts (see section “Acknowledgments”), several key variables were identified that can directly impact IWCC system performance and testing (Table 1). Although it is clearly not feasible to test all possible variables or combinations, these factors must be considered carefully when designing test protocols to adequately inform management decisions, approvals and policy, or to compare performance among technologies and service providers.
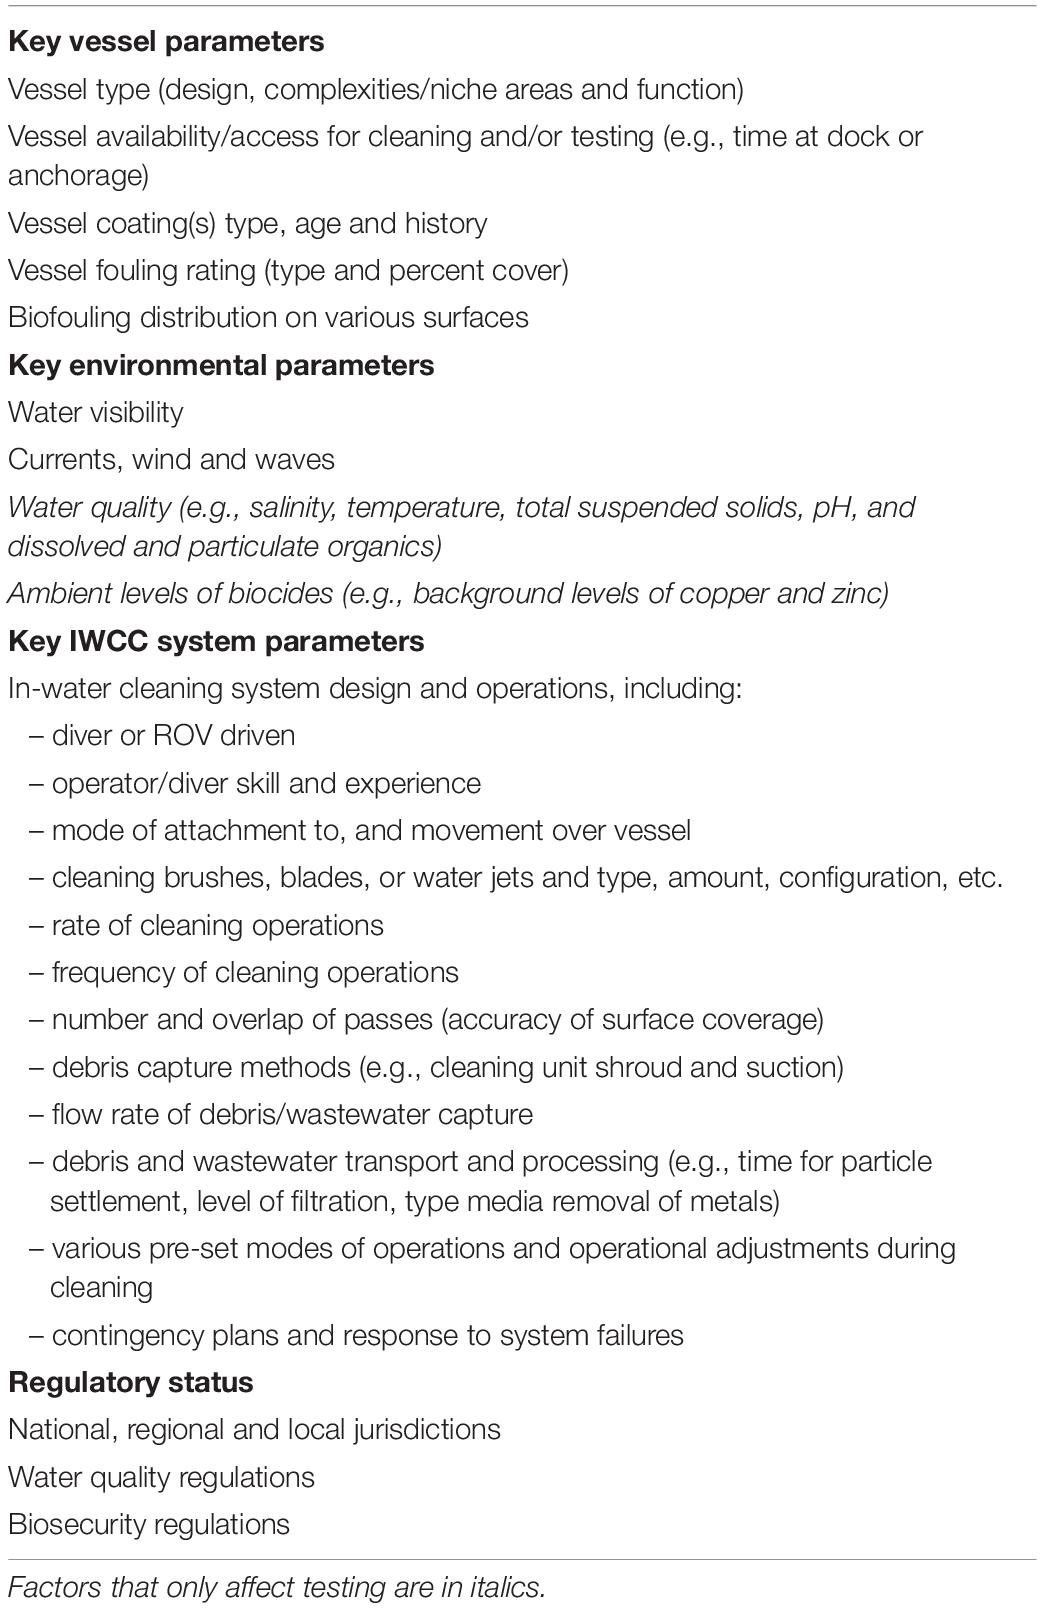
Table 1. Factors affecting IWCC performance that can also be considered when developing testing protocols.
In-water cleaning of biofouling from ships, combined with capture of debris and associated biocides, aims to address a significant market need (better operational performance and reduced fuel consumption) while also directly addressing critical global environmental challenges of reducing air and water pollution and risks of marine non-indigenous species introductions (Davidson et al., 2016; Scianni and Georgiades, 2019). This initial research shows promising results and provides a framework toward this goal. We hope this study will stimulate further development of standard methods and rigorous testing. Both are critically needed now to facilitate technology maturation, support vessel owner and operator biofouling management decisions, inform approval and permitting of in-water cleaning activities, and minimize the risks of non-indigenous species introductions associated with ship biofouling.
Data Availability Statement
Additional data generated for this study are included in the article/Supplementary Material.
Author Contributions
MT led the overall the project design, execution, data analysis and drafting of this manuscript. ID, MF, and CS led specific aspects of the experimental design, assisted in conducting the study and analyzing the data, and contributed to the manuscript development. KN and JB played significant roles in conducting the study, contributed to manuscript development, and KN assisted in analyzing the data. GI, EG, and GR contributed to the experimental design, data analysis and to the manuscript development.
Funding
This work was funded by the United States Department of Transportation Maritime Administration, Maryland Department of Transportation’s Port Administration, and California State Lands Commission, through the Maritime Environmental Resource Center, Solomons, MD, United States.
Conflict of Interest
ID was employed by the company Cawthron Institute (New Zealand).
The remaining authors declare that the research was conducted in the absence of any commercial or financial relationships that could be construed as a potential conflict of interest.
Acknowledgments
We would like to thank the Testing Team included: C. Arriola, J. Barnes, E. Buckley, L. Ceballos, I. Davidson, K. Davis, M. First, E. Friedel, M. Getrich, A. Heyes, C. Junemann, A. Kershen, J. Kuo, C. Martin, K. Mitchell, K. Newcomer, C. Packer, S. Robbins-Wamsley, G. Ruiz, C. Scianni, T. Shick, G. Smith, D. Sparks, B. Sturgess, M. Tamburri, and G. Ziegler. We would also like to thank our Technical Advisory Committee and several subject matter experts who have provided advice and guidance, including: J. Aguirre, G. Bergner, J. Chausson, L. Drake, D. Elias, J. Eliasson, S. Gorgula, W. Hertel, D. McClary, M. McManus, R. Sanchez, D. Schar, A. Sørensen, G. Swain, and A. Yunnie.
Supplementary Material
The Supplementary Material for this article can be found online at: https://www.frontiersin.org/articles/10.3389/fmars.2020.00437/full#supplementary-material
References
Alliance for Coastal Technologies [ACT] and Maritime Environmental Resource Center [MERC] (2019). Evaluation of Subsea Global Solutions In-Water Cleaning and Capture Technology for Ships. Available online at: http://www.maritime-enviro.org/Downloads/Reports/MERC_Inwater/ACT_MERC_SGS_IWCC_Evaluation_Report.pdf (accessed April 3, 2019).
Boucher, J., and Friot, D. (2017). Primary Microplastics in the Oceans: a Global Evaluation of Sources. Gland: IUCN.
Browne, M. A., Galloway, T. S., and Thompson, R. C. (2007). Microplastic-an emerging contaminant of potential concern? Integr. Environ. Assess. Manage. 3, 559–561. doi: 10.1002/ieam.5630030412
Buhaug, Ø, Corbett, J. J., Endresen, Ø, Eyring, V., Faber, J., Hanayama, S., et al. (2009). Second IMO GHG Study 2009. London: International Maritime Organization, 220.
California Code of Regulations (2017). Biofouling Management to Minimize the Transfer of Nonindigenous Species from Vessels Arriving at California Ports. California, CA: California Code of Regulations.
Coutts, A. D. M., and Taylor, M. D. (2004). A preliminary investigation of biosecurity risk associated with biofouling on merchant vessels in New Zealand. N. Z. J. Mar. Fresh. 38, 215–229. doi: 10.1080/00288330.2004.9517232
Dafforn, K. A., Lewis, J. A., and Johnston, E. L. (2011). Antifouling strategies: history and regulation, ecological impacts and mitigation. Mar. Pollut. Bull. 62, 453–465. doi: 10.1016/j.marpolbul.2011.01.012
Davidson, I. C., Brown, C. W., Sytsma, M. D., and Ruiz, G. M. (2009). The role of containerships as transfer mechanisms of marine biofouling species. Biofouling 25, 645–655. doi: 10.1080/08927010903046268
Davidson, I. C., McCann, L. D., Sytsma, M. D., and Ruiz, G. M. (2008). Interrupting a multispecies bioinvasion vector: the efficacy of in-water cleaning for removing biofouling on obsolete vessels. Mar. Pollut. Bull. 56, 1538–1544. doi: 10.1016/j.marpolbul.2008.05.024
Davidson, I. C., Scianni, C., Ceballos, L., Zabin, C., Ashton, G., and Ruiz, G. M. (2014). Evaluating Ship Biofouling and Emerging Management Tools for Reducing Biofouling-mediated Species Incursions. Report to the Marine Invasive Species Program of the California State Lands Commission. Sacramento, CA: California State Lands Commission.
Davidson, I. C., Scianni, C., Hewitt, C., Everett, R., Holm, E., Tamburri, M., et al. (2016). Mini-review: assessing the drivers of ship biofouling management – aligning industry and biosecurity goals. Biofouling 32, 411–428. doi: 10.1080/08927014.2016.1149572
Davidson, I. C., Scianni, C., Minton, M. S., and Ruiz, G. M. (2018). A history of ship specialization and consequences for marine invasions, management, and policy. J. Appl. Ecol. 55, 1799–1811. doi: 10.1111/1365-2664.13114
Department of the Environment [DOE] and New Zealand Ministry for Primary Industries [MPI] (2015). Antifouling and in-Water Cleaning Guidelines. Canberra: Department of Agriculture, 31.
Drake, L. A., Tamburri, M. N., First, M. R., Smith, G. J., and Johengen, T. H. (2014). How many organisms are in ballast water discharge? A framework for validating and selecting compliance monitoring tools. Mar. Poll. Bull. 86, 122–128. doi: 10.1016/j.marpolbul.2014.07.034
Environmental Technology Verification [ETV] Program (2010). Generic Protocol for the Verification of Ballast Water Treatment Technology, Version 5.1. EPA/600/R-10/146; U.S. Washington, DC: Environmental Protection Agency.
Flemming, H. C. (2002). Biofouling in water systems – cases, causes and countermeasures. Appl. Microbiol. Biotechnol. 59, 629–640. doi: 10.1007/s00253-002-1066-9
Georgiades, E., and Kluza, D. (2017). Evidence-based decision making to underpin the thresholds in New Zealand’s CRMS: biofouling on vessels arriving to New Zealand. J. Mar. Sci. Technol. 51, 76–88. doi: 10.4031/mtsj.51.2.5
Grosholz, E. (2002). Ecological and evolutionary consequences of coastal invasions. Trends Ecol. Evol. 17, 22–27. doi: 10.1016/50169-5347(01)02358-8
Growcott, A., Kluza, D., and Georgiades, E. (2019). Technical Advice: Evaluation of In-Water Systems to Reactively Treat or Remove Biofouling within Vessel Internal Niche Areas. Wellington: Ministry for Primary Industries.
Hall, W. S., Bushong, S. J., Hall, L. W., Lenkevich, M. J., and Pinkney, A. E. (1988). Monitoring dissolved copper concentrations in Chesapeake Bay, U.S.A. Environ. Monit. Assess. 11, 33–42. doi: 10.1007/BF00394510
Hearin, J., Hunsucker, K. Z., Swain, G., Stephens, S., Gardner, H., Lieberman, K., et al. (2015). Analysis of long term mechanical grooming on large scale test panels coated with an antifouling and a fouling release coating. Biofouling 31, 625–638. doi: 10.1080/08927014.2015.1081687
Hewitt, C. L., and Campbell, M. L. (2010). The Relative Contribution of Vectors to the Introduction and Translocation of Invasive Marine Species. Canberra: Department of Agriculture, Fisheries and Forestry.
Hewitt, C. L., Campbell, M. L., Thresher, R. E., Martin, R. B., Boyd, S., Cohen, B. F., et al. (2004). Introduced and cryptogenic species in Port Phillip Bay, Victoria, Australia. Mar. Biol. 144, 183–202. doi: 10.1007/s00227-003-1173-x
Hopkins, G. A., Forrest, B. M., and Coutts, A. D. M. (2010). The effectiveness of rotating brush devices for management of vessel hull fouling. Biofouling 26, 555–566. doi: 10.1080/08927014.2010.494330
International Maritime Organization [IMO] (2011). Guidelines for the Control and Management of Ships’ Biofouling to Minimize the Transfer of Invasive Aquatic Species. London: International Maritime Organization.
Jahan, S., and Strezov, V. (2017). Water quality assessment of Australian ports using water quality evaluation indices. PLoS One 12:e0189284. doi: 10.1371/journal.pone.0189284
Jones, D. F. (1999). Controlling Marine Fouling with Antifouling Paints and Underwater Hull Cleaning. Pittsburgh, PA: Technology Publishing Company.
Lewis, J. A. (2013). In-Water Hull Cleaning and Filtration System: In-Water Cleaning Trials — 26-28 November 2012. Available online at: http://www.fish.wa.gov.au/Documents/occasional_publications/fop114.pdf (accessed March 20, 2018).
Masura, J., Baker, J., Foster, G., and Arthur, C. (2015). Laboratory Methods for the Analysis of Microplastics in the Marine Environment: Recommendations for Quantifying Synthetic Particles in Waters and Sediments. NOAA Technical Memorandum NOS-OR&R-48. Seattle, WA: NMFS Scientific Publications Office.
McClay, T., Zabin, C., Davidson, I., Young, R., and Elam, D. (2015). Vessel Biofouling Prevention and Management Options Report. London: United States Coast Guard.
Ministry for Primary Industries New Zealand [MPI] (2018). Craft Risk Management Standard: Biofouling on Vessels Arriving to New Zealand. CRMS – BIOFOUL. Wellington: Ministry for Primary Industries.
Morrisey, D., and Woods, C. (2015). In-Water Cleaning Technologies: Review of Information. Available online at: http://www.mpi.govt.nz/document-vault/10814 (accessed February 11, 2018).
Morrisey, D., Inglis, G., Tait, L., Woods, C., Lewis, J., and Georgiades, E. (2015). Procedures for Evaluating in-Water Systems to Remove or Treat Vessel Biofouling. Available online at: http://www.mpi.govt.nz/document-vault/10811 (accessed February 11, 2018).
Moser, C. S., Wier, T. P., First, M. R., Grant, J. F., Riley, S., Robbins-Wamsley, S. H., et al. (2017). Quantifying the extent of niche areas in the global fleet of commercial ships: the potential for ‘super-hot spots’ of biofouling. Biol. Invasions 19, 1745–1759. doi: 10.1007/s10530-017-1386-4
Naval Sea Systems Command [Navsea] (2006). Naval Ships’ Technical Manual Chapter 081. Waterborne Underwater Hull Cleaning of Navy Ships, Revision 5. Washington, DC: Naval Sea Systems Command.
Preiser, H. S., and Laster, D. R. (2009). On optimization of underwater hull cleaning for greater fuel economy. Naval Eng. J. 93, 45–52. doi: 10.1111/j.1559-3584.1981.tb00644.x
Ruiz, G. M., Carlton, J. T., Grosholz, E. D., and Hines, A. H. (1997). Global invasions of marine and estuarine habitats by nonindigenous species: mechanisms, extent, and consequences. Am. Zool. 37, 621–632. doi: 10.1093/icb/37.6.621
Schultz, M. P. (2007). Effects of coating roughness and biofouling on ship resistance and powering. Biofouling 23, 331–341. doi: 10.1080/08927010701461974
Schultz, M. P., Bendick, J. A., Holm, E. R., and Hertel, W. M. (2011). Economic impact of biofouling on a naval surface ship. Biofouling 27, 87–98. doi: 10.1080/08927014.2010.542809
Scianni, C., and Georgiades, E. (2019). Vessel in-water cleaning or treatment: identification of environmental risks and science needs for evidence-based decision making. Front. Mar. Sci. 6:467. doi: 10.3389/fmars.2019.00467
Shtykova, L., Ostrovskii, D., Jacobsson, P., and Nydén, M. (2006). Interaction between medetomidine and alkyd resins: NMR and FTIR investigation of antifouling marine paint model systems. J. Appl. Polym. Sci. 99, 2797–2809. doi: 10.1002/app.22847
Sonak, S., Pangam, P., Giriyan, A., and Hawaldar, K. (2009). Implications of the ban on organotins for protection of global coastal and marine ecology. J. Environ. Manag. 90, 96–108. doi: 10.1016/j.envman.2008.08.017
Song, Y. K., Hong, S. H., Jang, M., Kang, J. H., Kwon, O. Y., Han, G. M., et al. (2014). Large accumulation of micro-sized synthetic polymer particles in the sea surface microlayer. Environ. Sci. Technol. 48, 9014–9021. doi: 10.1021/es501757s
Townsin, R. L., Byrne, D., Svensen, T. E., and Milne, A. (1981). Estimating the technical and economic penalties of hull and propeller roughness. Trans. SNAME 89, 295–318.
Tribou, M., and Swain, G. (2010). The use of proactive in-water grooming to improve the performance of ship hull antifouling coatings. Biofouling 26, 47–56. doi: 10.1080/08927010903290973
Waldmann, C., Tamburri, M. N., Prien, R., and Fietzek, P. (2010). Assessment of sensor performance. Ocean Sci. Discuss. 6, 235–245. doi: 10.5194/os-6-235-2010
Woods Hole Oceanographic Institute [WHOI] (1952). Marine Fouling and its Prevention. Contribution No. 580 from Woods Hole Oceanographic Institute. Annapolis, MD: United States Naval Institute, 388.
Yonkos, L. T., Friedel, E. A., Perez-Reyes, A. C., Ghosal, S., and Arthur, C. D. (2014). Microplastics in four estuarine rivers in the Chesapeake Bay, U.S.A. Environ. Sci. Technol. 48, 14195–14202. doi: 10.1021/es5036317
Keywords: ship biofouling, in-water cleaning, technology evaluation, non-indigenous species, pollution prevention
Citation: Tamburri MN, Davidson IC, First MR, Scianni C, Newcomer K, Inglis GJ, Georgiades ET, Barnes JM and Ruiz GM (2020) In-Water Cleaning and Capture to Remove Ship Biofouling: An Initial Evaluation of Efficacy and Environmental Safety. Front. Mar. Sci. 7:437. doi: 10.3389/fmars.2020.00437
Received: 20 February 2020; Accepted: 18 May 2020;
Published: 17 June 2020.
Edited by:
Rowan Trebilco, Centre for Marine Socioecology, AustraliaReviewed by:
Geoffrey Swain, Florida Institute of Technology, United StatesKelli Zargiel Hunsucker, Florida Institute of Technology, United States
Copyright © 2020 Tamburri, Davidson, First, Scianni, Newcomer, Inglis, Georgiades, Barnes and Ruiz. This is an open-access article distributed under the terms of the Creative Commons Attribution License (CC BY). The use, distribution or reproduction in other forums is permitted, provided the original author(s) and the copyright owner(s) are credited and that the original publication in this journal is cited, in accordance with accepted academic practice. No use, distribution or reproduction is permitted which does not comply with these terms.
*Correspondence: Mario N. Tamburri, dGFtYnVycmlAdW1jZXMuZWR1