 Stephanie Elferink
 Sylke Wohlrab
 Stefan Neuhaus
 Allan Cembella
 Lars Harms
 Uwe John
- 1Department of Ecological Chemistry, Alfred Wegener Institute, Helmholtz Centre for Polar and Marine Research, Bremerhaven, Germany
- 2Helmholtz Institute for Functional Marine Biodiversity, Oldenburg, Germany
Climate change alters environmental conditions that are expected to have a profound effect on the biodiversity, community composition, and metabolic processes of microeukaryotic plankton in Arctic and Subarctic coastal waters. The molecular biodiversity [large subunit (LSU) rRNA gene] of three plankton size-fractions (micro-, nano-, and picoplankton) from coastal waters of ice-influenced west Greenland was compared with fractions from ice-free northwest Iceland within their summer environmental context. Putative metabolic functions were determined by differentially expressed mRNA (metatranscriptomics) of the microplankton. Temperature and salinity variations were more closely correlated than inorganic macronutrients with metabolic functions and community composition. Temperature explained much of the community variance, approximately 20% among micro- and nanoplankton, whereas other environmental factors accounted for rather low fractional variance (<7%). Species of smaller cell-size were more evenly distributed (Pielou’s evenness index J) across regions, with a higher diversity and total abundance, and thereby indicating high plasticity. The metatranscriptomic profiles in these respective microeukaryotic communities revealed that diatoms were more plastic in their gene expression than dinoflagellates, but dinoflagellates had a more diverse, albeit homogeneously expressed, gene pool. This could be interpreted as expression of alternative lifestyle strategies, whereby the functionally more conservative diatoms fill their niches primarily through variable resource use, whereas dinoflagellates apparently differentiate their niches through more diverse lifestyles. Patterns of microeukaryotic diversity are thus primarily associated with differences in metabolic function and activity of diatom- versus dinoflagellate-dominated communities in Arctic and Subarctic waters during summer.
Introduction
Total extant richness of marine eukaryotes is estimated at up to 2.2 million species (Mora et al., 2011), of which 226,000 are described (Appeltans et al., 2012); known taxa informally regarded as “algae” (i.e., including cyanobacteria and eukaryotic macroalgae) comprise around 32,500 distinct species from marine and freshwater systems (Guiry, 2012). The “paradox of the plankton” (Hutchinson, 1961) poses the fundamental question of how it is possible for so many species to co-exist within an apparently homogeneous aquatic environment while competing for the same resources. The high diversity among microeukaryotic plankton may be attributable to “contemporaneous disequilibrium” of patchy phytoplankton distribution (Richerson et al., 1970), also reflected by differences in life history transitions (Huisman et al., 2001), species oscillations (Huisman and Weissing, 1999), environmental fluctuation (Roy and Chattopadhyay, 2007), cryptic intraspecific variation (Menden-Deuer and Rowlett, 2014), and differential niche partitioning (Connell, 1980). The resolution of this apparent plankton paradox involves defining the number and partitioning of ecological niches in the pelagic and determining to what extent species actually compete for limiting resources.
High-throughput next-generation sequencing has yielded a tremendous archive of genomic and transcriptomic data, including at the generic and species level for microeukaryotic plankton, and thereby uncovering the hidden richness of the ocean biome (De Vargas et al., 2015; Malviya et al., 2016). Interpreted with understanding that they represent subsampled sequences rather than whole genomes, metabarcoding can reveal the diversity of the community, irrespective of the physiological status and life history stages of the cells within a “species.” Similarly, metatranscriptomic approaches can discern species functional activity, i.e., differential expression of genes under specified environmental conditions. Metatranscriptomic analysis already addresses key issues in plankton functional ecology, such as resource partitioning and functional variation between diatom communities (Alexander et al., 2015a; Pearson et al., 2015), profiling characteristics of a harmful algal bloom (Cooper et al., 2014), and responses of phytoplankton to varying iron availability (Marchetti et al., 2012).
Microplankton species have unique strategies that allow them to specialize in the exploitation of certain resources, e.g., alternative nutrient forms, and thus exhibit different responses to resource shifts to minimize direct competition (Alexander et al., 2015a). At the higher group level, some broad functional traits are linked to microeukaryotic plankton community structures. For example, a shift from diatom- to dinoflagellate-dominated communities is thought to be associated with changes in nutrient and carbon export (Wasmund et al., 2017). Whereas diatoms quickly sink through the water column without significant decomposition to the seafloor and thereby export carbon and nutrients to the depth, dinoflagellates remain longer in the water column and increase the amount of nutrient recycling within the upper mixed layer (Heiskanen et al., 1998). Besides such broad, fixed functions, how other major ecosystem functions are linked to shifts in species composition remains unresolved. Such metabolic functions are tightly linked to the current niche of each species, and under changing environmental conditions, physiological adjustments of the community members to maintain community equilibrium can lead to changes in metabolic processes. Microeukaryotic communities may shift toward more subtle, but still critical, functions under environmental changes.
Functional traits are based upon the metabolic mechanisms that determine an organism’s effect on ecosystem processes (carbon fixation and export, biogeochemical cycling of other elements, system productivity). In the plankton (Reynolds, 2002), expressed functional traits define an organism’s response to environmental forcing and its adaptations and trade-offs to abiotic and biotic factors (Litchman et al., 2010). Metabolic trait diversity expressed within a certain community is therefore a consequence of both the members of the community and the prevailing environmental conditions. Hence, adaptations to different environments can change the dominance of specific metabolic traits in a community. Metabolic traits are essentially the results of the expression of genes in a community that translate into differentially interacting enzymes and other functional proteins. Metatranscriptomic approaches can therefore provide insights into metabolic trait diversity by analyzing the abundances of genes involved in metabolic trait expression (Alexander et al., 2015b). Furthermore, gene abundance estimates from metatranscriptomics can be used to track metabolic trait changes in different environments and communities. Broadly, metabolic trait changes in a community can be a result of functional specialization, i.e., the expression of genes unique to a certain environmental setting and of differentially expressing genes that are also common in other environmental settings. The adaptation of a community to the corresponding environment on the molecular level can be achieved either by the differential expression of conserved genes common to all members or the expression of species-specific genes (Wohlrab et al., 2018).
The waters surrounding the west coast of Greenland are strongly ice influenced, partly by sea-ice cover but also by the presence of adjacent glaciers and consequent glacial meltwater, particularly in summer. Nutrient upwelling in front of the marine-terminating glaciers leads to nutrient-rich surface water, which sustains high primary productivity in coastal areas (Meire et al., 2017). The study area along the northwest coast of Iceland is also affected by glaciation and associated meltwater runoff, but the ocean itself is not ice covered. The considerably milder climate in Iceland is primarily due to the Irminger Current, which runs along the southern and western coast as the residual flow of the Gulf Stream. The Uummannaq Fjord, Vaigat Strait, and Disko Bay area in west Greenland were selected as representative of strongly ice-influenced phytoplankton communities, whereas the Arnafjördur, Breidafjördur, and Faxaflóe fjord systems including adjacent waters along the northwest coast of Iceland served as proxies for microeukaryotic plankton communities in less strongly ice-influenced Subarctic waters.
Microeukaryotic plankton species in Arctic and Subarctic coastal waters may be under particular environmental stress due to climate change because accelerated temperature increase in these areas coincides with putatively cold-adapted (stenotherm) species for which migration to and survival in such regimes might be unsuccessful (Wesławski et al., 2011; Michel et al., 2012; Thomas et al., 2012). These general hypotheses about expected shifts in temperature and associated species distribution remain to be validated with respect to the acclimation and adaptive responses of individual species and ecotypes within the broader templates of microeukaryotic groups, such as diatoms versus dinoflagellates. These two distinct groups represent typical dominant components of spring and summer blooms, where diatoms tend to thrive under turbulent, nutrient-rich conditions and dinoflagellates (especially heterotrophs and mixotrophs) represent more diverse functional potential (Glibert, 2016).
In the current study, we first compared the overall molecular diversity of three operationally defined microeukaryotic plankton size-fractions, namely microplankton (20–50 μm), nanoplankton (3–20 μm), and picoplankton (0.2–3 μm). The molecular diversity of microeukaryotes, including toxigenic species, from strongly polar-influenced west Greenland coastal waters was previously analyzed in detail (Elferink et al., 2017), but here it is compared with summer populations from ice-free waters of northwest Iceland. The study extends the comparison at the higher group level with focus on the critical importance of cell size and expression of functional traits. Irrespective of group affiliation, cell size is known to play a key role in the dispersal patterns of microeukaryotes within the ocean. With respect to dispersal mechanisms and the importance of cell size, we identified diversity variation between the size-fractions but focused on how the community composition of diatoms versus dinoflagellates of each size-fraction was related to within- or between-region differences in ambient abiotic conditions. We expected to confirm the more homogeneous distribution but higher diversity of the small cell-size microeukaryotes, i.e., picoplankton, compared to larger celled species. Finally, we interpreted different functional strategies for diatoms and dinoflagellates within the microplankton, based upon transcriptomic analysis, and identified metabolic processes linked to metabolic traits in their respective communities that can change the composition on smaller spatio-temporal scales.
Materials and Methods
Field Sampling for Plankton and Environmental Parameters
Sampling was performed during the MSM-21/3 ARCHEMHAB expedition (Cembella et al., 2016) aboard the RV Maria S. Merian along the western coast of Greenland and within northwest Iceland fjord systems and adjacent waters between July 27 and August 8, 2012 (Figure 1). Water samples were collected in the epipelagic zone by Niskin bottles mounted on a rosette-sampler with conductivity, temperature, and depth (CTD) sensors to measure temperature and salinity and optical sensors for bio-optical parameters. In total, 15 stations were sampled within the surface layer (upper 30 m).
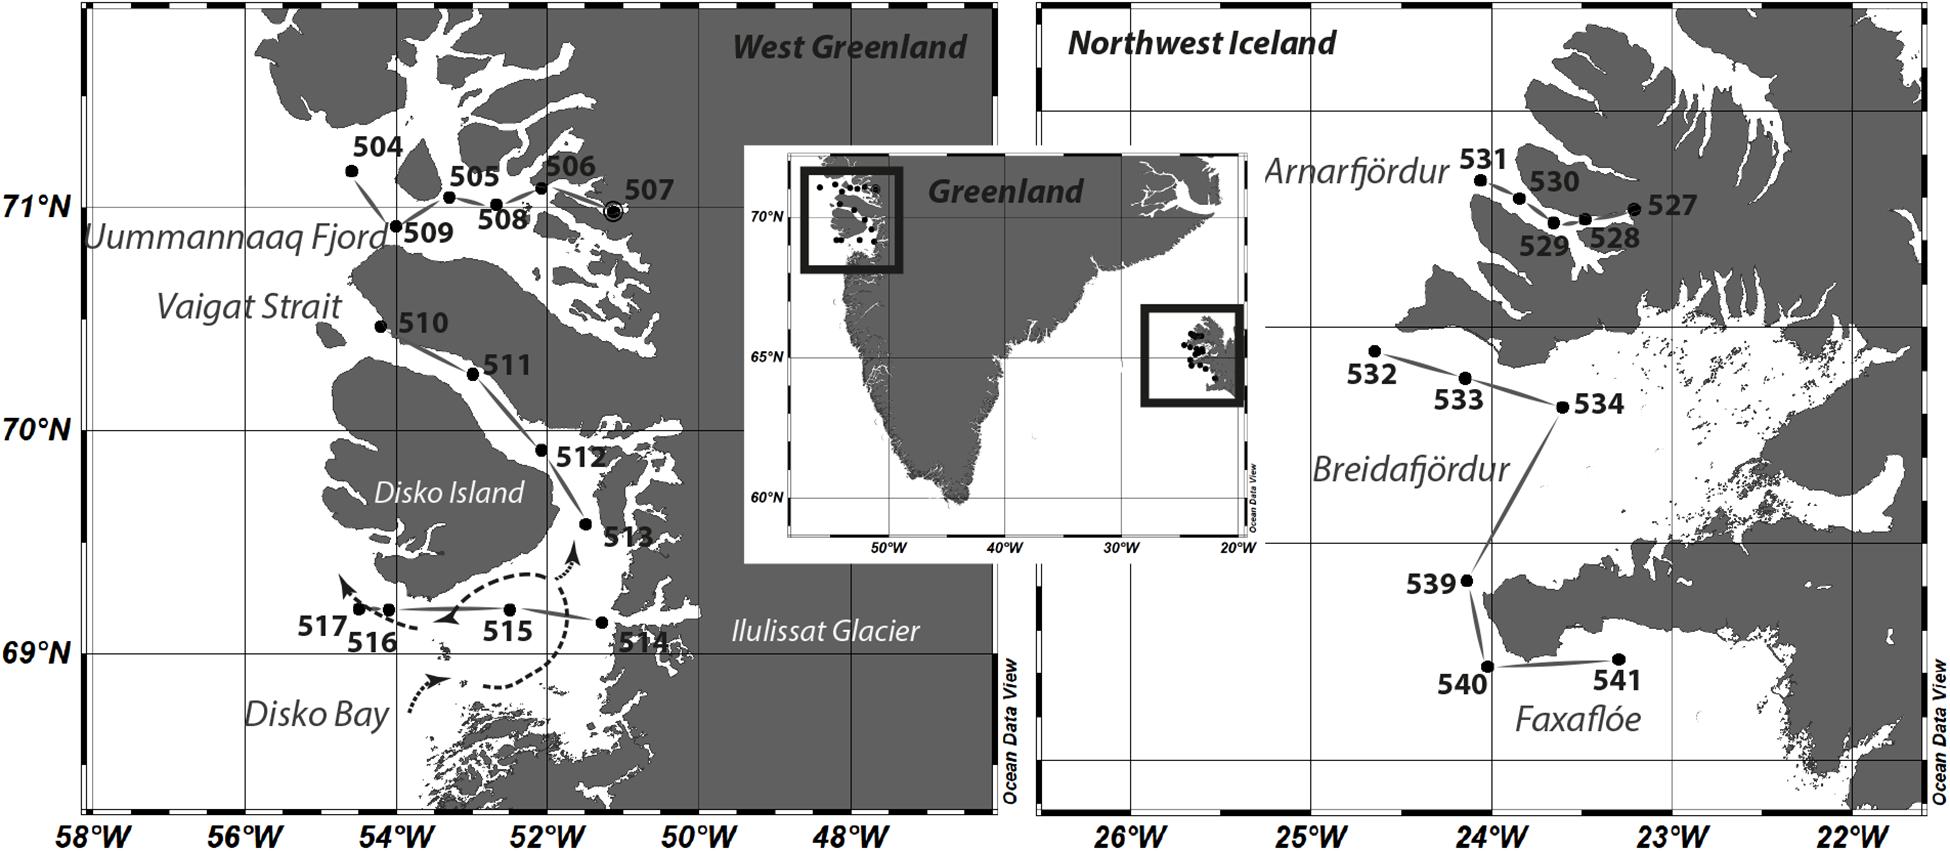
Figure 1. Study sites and sampling stations at the coast of west Greenland and northwest Iceland. A scheme of the dominating current pattern system within the Disko Bay is included as dashed lines. Stations belonging to one of the observed areas Uummannaq Fjord, Vaigat and Disko Bay, Arnafjördur, Breidafjördur, and Faxaflóe are connected with solid lines.
Samples for inorganic nutrient measurements (nitrate, nitrite, ammonium, phosphate, and silicate) were directly taken from the Niskin bottles at seven depths (3, 15, and 30 m and other depths depending on maximum depth of the particular station) per station and immediately stored frozen at −20°C. Nutrient samples were later analyzed with a continuous-flow autoanalyzer (Evolution III, Alliance Instruments, France) based upon standard seawater analytical methods for determination of nitrate and nitrite (Armstrong et al., 1967), ammonium (Koroleff, 1969), silicate (Grasshoff et al., 1983), and soluble reactive phosphate (Eberlein and Kattner, 1987). For each environmental parameter and station, the mean of the measurements of 3, 15, and 30 m was calculated. This corresponds to the depth from which DNA and RNA samples were taken.
Chlorophyll a concentrations were analyzed by filtering 1.0–2.0 L of seawater (in triplicate) from fixed depths (3, 15, and 30 m) through glass microfiber filters (Whatman GF/F, Whatman, United Kingdom; nominal pore size: 0.7 μm). The filtration unit was covered to exclude light, and sample filters were frozen immediately at −80°C until laboratory analysis. Pigments were extracted by sonication of filters in 10 mL 90% acetone and then incubated overnight in darkness at 4°C. The extract was centrifuged at 3,020 × g for 10 min, and the fluorescence of the supernatant was determined at 665 nm (TD-700 fluorometer, Turner Designs, United States). For each station, the mean of the triplicates from each of the three depths was calculated (n = 9). Extracted chlorophyll a data are archived in the data repository PANGAEA (Zielinski et al., 2013).
Plankton samples were sequentially size-fractionated into three operationally defined size classes: “microplankton” (20–50 μm), “nanoplankton” (3–20 μm), and “picoplankton” (0.2–3 μm); these nominal fractions do not correspond exactly to the classically defined size ranges. Seawater for DNA extraction was sampled from 3, 15, and 30 m using a shipboard membrane pump (QBY-25-SS; AGB-Pumpen, Germany), by sampling 20 L per depth. In total, 60 L of seawater per sampling station was passed over a sequential filter tower with progressively decreasing nylon mesh-sizes (200, 50, and 20 μm) to obtain distinct plankton size-fractions. Additionally, vertical plankton net tows (20 μm mesh-size, 50 cm net diameter) were performed from 30 m depth to surface. Cells larger than 20 μm were collected in the cod-end and subsequently size-fractionated using a filter tower as described above (samples with cells smaller than 20 μm were removed). For nano- and picoplankton size-fractions, 15 L of seawater from three fixed depths (30, 15, and 3 m) were collected with Niskin bottles. Water samples were mixed (45 L), then pre-filtered (20 μm), and then 1 L was further size-fractionated by filtration over 3 μm and 0.2 μm-cutoff polycarbonate membrane filters (TSTP and GTTP, respectively, Millipore, United States).
Retentates from the filter tower and membrane filters for molecular analyses were backwashed into centrifuge tubes with 0.2 μm-filtered seawater, adjusted to a total volume of 45 mL, and split into three 15- mL aliquots. Cell suspensions were centrifuged for 15 min at 3,600 × g at 4°C; the pellet aliquots were separated for subsequent DNA and RNA analysis. Pellets for DNA analysis were resuspended in 400 μL AP1 lysis buffer (Qiagen, Germany), whereas pellets for RNA analysis were resuspended in Tri Reagent (Sigma Aldrich, Germany), and then each was transferred to a microcentrifuge vial with 0.2 μm glass beads (Sigma Aldrich, Germany). Vials were shock-frozen in liquid nitrogen and kept at −20°C (for DNA) or –80°C (for RNA) until further processing.
Molecular Sample Preparation and Sequencing
For the micro- (20–50 μm) and nanoplankton (3–20 μm) size-fractions, DNA extraction was performed with the DNeasy Plant Kit (Qiagen, Germany). Picoplanktonic (0.2–3 μm) DNA was extracted using the Genomic DNA from Soil kit (Macherey-Nagel, Germany). The manufacturer’s protocol was followed for the two extraction methods. Genomic DNA was eluted from the column, and extracts were stored at −20°C. Amplification for subsequent 454-sequencing (Roche GS-Junior, United States), including polymerase chain reaction (PCR) amplification targeting the hypervariable LSU D1/D2 region and sequencing of the rRNA, were performed according to the method of Elferink et al. (2017). In this study we focused on the LSU rRNA D1/D2 region, which has a high taxonomic resolution to differentiate at the species level for many major microeukaryote groups, such as diatoms and dinoflagellates (Medlin et al., 1998; John et al., 2003; Sonnenberg et al., 2007; Moniz and Kaczmarska, 2009; Toebe et al., 2013; Kretschmann et al., 2015). Nevertheless, a lack of reference sequences for some groups may have limited full identification to genus or species level, particularly among the dinoflagellates [e.g., for Protoperidiniaceae (Peridiniales) and Suessiaceae (Suessiales)] and ciliates in general.
RNA isolation of microplankton (20–50 μm) from 12 stations was performed as described in Wohlrab et al. (2017). Libraries (150 bp paired-end) for sequencing on a HiSeq 500 instrument (Illumina, United States) were prepared with the TruSeq Stranded mRNA HT Library Preparation Kit (Illumina, United States), according to the manufacturer’s protocol. The libraries were quality checked and quantified with a Bioanalyzer 2100 and a DNA Chip assay (Agilent Technologies, United States).
Metabarcoding: rRNA Analysis and Taxonomic Assignment
In total, 63 plankton samples across size-fractions were sequenced on a 454-FLX+ sequencer (Roche, United States). Raw reads were deposited in the European Nucleotide Archive via the GFBio portal under Accession No. SRA PRJEB32397.
Sequencing errors and uncertainties in operational taxonomic unit (OTU) clustering may lead to an over- or underestimation of diversity (Reeder and Knight, 2009). Recent methodological advances in amplicon sequence denoising promises the capability to reconstruct the true biological sequences of amplicon surveys (Amir et al., 2017). These amplicon sequence variants (ASVs) are thus expected to replace the common OTUs as taxa proxies because ASVs resolve single-nucleotide differences and provide constant labels across studies (Callahan et al., 2017). The R package Dada2 (Callahan et al., 2016) was used in this study to obtain such ASVs. Cutadapt (Martin, 2011) was used to remove the leading forward primer from the reads. Reads without detected forward primer sequences were discarded. These pre-processed sequences were further processed with R version 3.5.2 (R Core Team, 2016) using functions of the Dada2 package (version 1.11.0). Sequences were truncated to a length of 400 bp. Reads shorter than 400 bp, with a number of expected base error above 5, and those containing any base with a Phred quality score ≤ 10 were discarded. ASVs were constructed, cleaned from chimera, and taxonomically annotated following the guidelines of the Dada2 online tutorial1, but settings were adapted to the recommendations for 454 data. The Parc version of the Silva 132 LSU dataset served as reference for taxonomic assignment (Glöckner et al., 2017), and the taxonomic labels were adjusted as described on http://blog.mothur.org/2018/01/10/SILVA-v132-reference-files/.
The ASVs thereby annotated as alveolates or stramenopiles were classified more accurately by PhyloAssigner version 6.166 (Vergin et al., 2013) with a phylogenetic placement onto reference trees based on 18S/28S concatenated alignments (doi: 10.5281/zenod), according to Elferink et al. (2017) (doi: 10.1016/j.dsr.2016.11.002).
Statistical analyses were performed in R. The sequence numbers per sample were not subsampled to the smallest sequence number of any sample, to avoid an increase in the number of potential false positives (McMurdie and Holmes, 2014) by comparison to the relative abundance of counts in samples. Diversity indices and Pielou’s evenness were calculated with the fossil package (Vavrek, 2011).
Rarefaction and ASV (“phylospecies”) accumulation curves of each station were calculated with the vegan package (Oksanen et al., 2013) using the function “rarecurve” and created after quality control and clustering to represent the local species richness and to serve as a reference for the diversity captured in a sample. The final ASV table was Hellinger-transformed (double square root transformation) as recommended for clustering or ordination of species abundance data (Rao, 1995; Legendre and Gallagher, 2001) with the “decostand” function. Non-metric multidimensional scaling (NMDS) with calculated Bray–Curtis dissimilarities was carried out to compare similarities among samples. Environmental factors were Hellinger-transformed to normalize the dataset and standardized by the factors’ maximum. A redundancy analysis (RDA) was applied to each region and size-fraction to examine if community variation can be explained by environmental factors. Significance was determined by analysis of variance (ANOVA) tests. Significant environmental parameters were determined with the function “forward.sel” from the Packfor package (Dray et al., 2009).
Linear models were used to identify taxa that increase or decrease in abundance along an environmental gradient. Therefore, linear regressions were fitted for each single environmental parameter (independent variable) and each ASV abundance value (dependent variable). Environmental parameters used for the correlation analysis comprised mean values of temperature, nutrients, and salinity (calculated as described in “Field Sampling for Plankton and Environmental Parameters”).
Prior to the analysis, ASV abundance tables were transformed into relative abundances based on mean values of 128 Dirichlet Monte Carlo instances of centered log ratio (clr) transformed data with the Aledx 2 package (Fernandes et al., 2014; Gloor and Reid, 2016). An ASV was considered to be significantly correlated with an environmental parameter for p-values < 0.05.
Metatranscriptomics: mRNA Analysis and Functional Assignment
Among the 25 samples of the microplankton (20–50 μm), 12 were selected for analysis (6 samples for each area), and raw Illumina paired-end sequencing reads of 12 reverse-transcribed mRNA samples were deposited in the European Nucleotide Archive via the GFBio portal under Accession No. SRA PRJEB37134. Raw reads from the obtained metatranscriptomes were mapped to reference transcriptomes consisting of the publicity available transcriptomes of the Marine Microbial Eukaryote Transcriptome Sequencing Project (Keeling et al., 2014). Contigs with positive mappings were extracted from the whole set and annotated by similarity search (blastx, e-value ≤ 10–7) against the SwissProt Database (Bateman, 2019) from which eukaryotic orthologous groups (KOG) identifiers were retrieved. Counts per contig, functional annotations, and taxonomic identity of each reference contig were merged into a list and stored for further analysis. The full contig list was subset to only contain contigs with taxonomic and functional KOG annotations. Counts tables were summarized based on KOG annotations only, and the taxonomic information was separately summarized per KOG annotation. This approach prevents falsely identifying gene functions as being differentially expressed between the two regions just because the gene-bearing taxa are absent from one of the regions. KOG gene summarized count tables were normalized with the DESeq2 package (Love et al., 2014). Differential gene expression between regions was estimated with the same package by treating samples from each region as replicates (n = 6 per region). Genes were considered differentially expressed when adjusted p-values were below 0.05, which resulted in a fold change cut-off of min. 1.5. Tests for significant enrichments of KOG categories within each environment were calculated by “sampling without replacing” with the R function “phyper” (R Core Team, 2016).
For all contigs coding for genes involved in the KOG group Metabolism, we calculated the transcriptome diversity Hj, the functional specialization index δ, and the Kullback–Leibler divergence Dj. In short, Hj is a measure of the relative transcript frequencies per gene and sample, comparable to the Shannon diversity index. Dj is a measure of how much the transcriptome departs from the average transcriptome, and increasing Dj values indicate an increasing expression of sample specific genes. The functional specialization δ is also a measure for the divergence from the average transcriptome; however, increasing values indicate an increasing differential expression of genes common to all samples (Martínez and Reyes-Valdés, 2008). Calculations were performed on count matrixes according to Martínez and Reyes-Valdés (2008) (Supplementary Table S1). Calculations were repeated for each subset of count matrixes containing either only diatom- or dinoflagellate-derived reference sequences. Statistical comparisons of transcriptomic indices between regions were performed with the lme4 package (Bates et al., 2015), where KOG categories were handled as random factors and regions as fixed factors. The comparison of diatom versus dinoflagellate indices was conducted the same way but by using the taxonomic group as the fixed factor. Correlations with environmental parameters were established by handling both KOG categories and regions as random factors and each environmental factor separately as a fixed effect. Statistical significance of all fixed effects was calculated by comparing the respective full model versus a reduced model; effects were considered significant for p-values < 0.05.
Results
Environmental Parameters
Surface water temperature (Figure 2) was typically higher in the northwest Icelandic fjord system (range: 10–12°C) where the water column was also more homogeneous compared to western Greenland (range: 1–10°C). Due to the high ice-melt runoff from the Ilulissat glacier close to Station 514 in western Greenland and the residual current pattern in this area, lower surface water temperatures were measured in the Vaigat Strait (< 4°C). Mean surface salinity (∼34.5) was also higher in Iceland and more homogeneous compared to Greenland. In west Greenland, salinity was generally lower (between 30 and 33) because of more Arctic freshwater inflow but reached as high as 34 at Stations 516 and 517 in association with warmer water and higher stratification with solar heating of the surface layer.
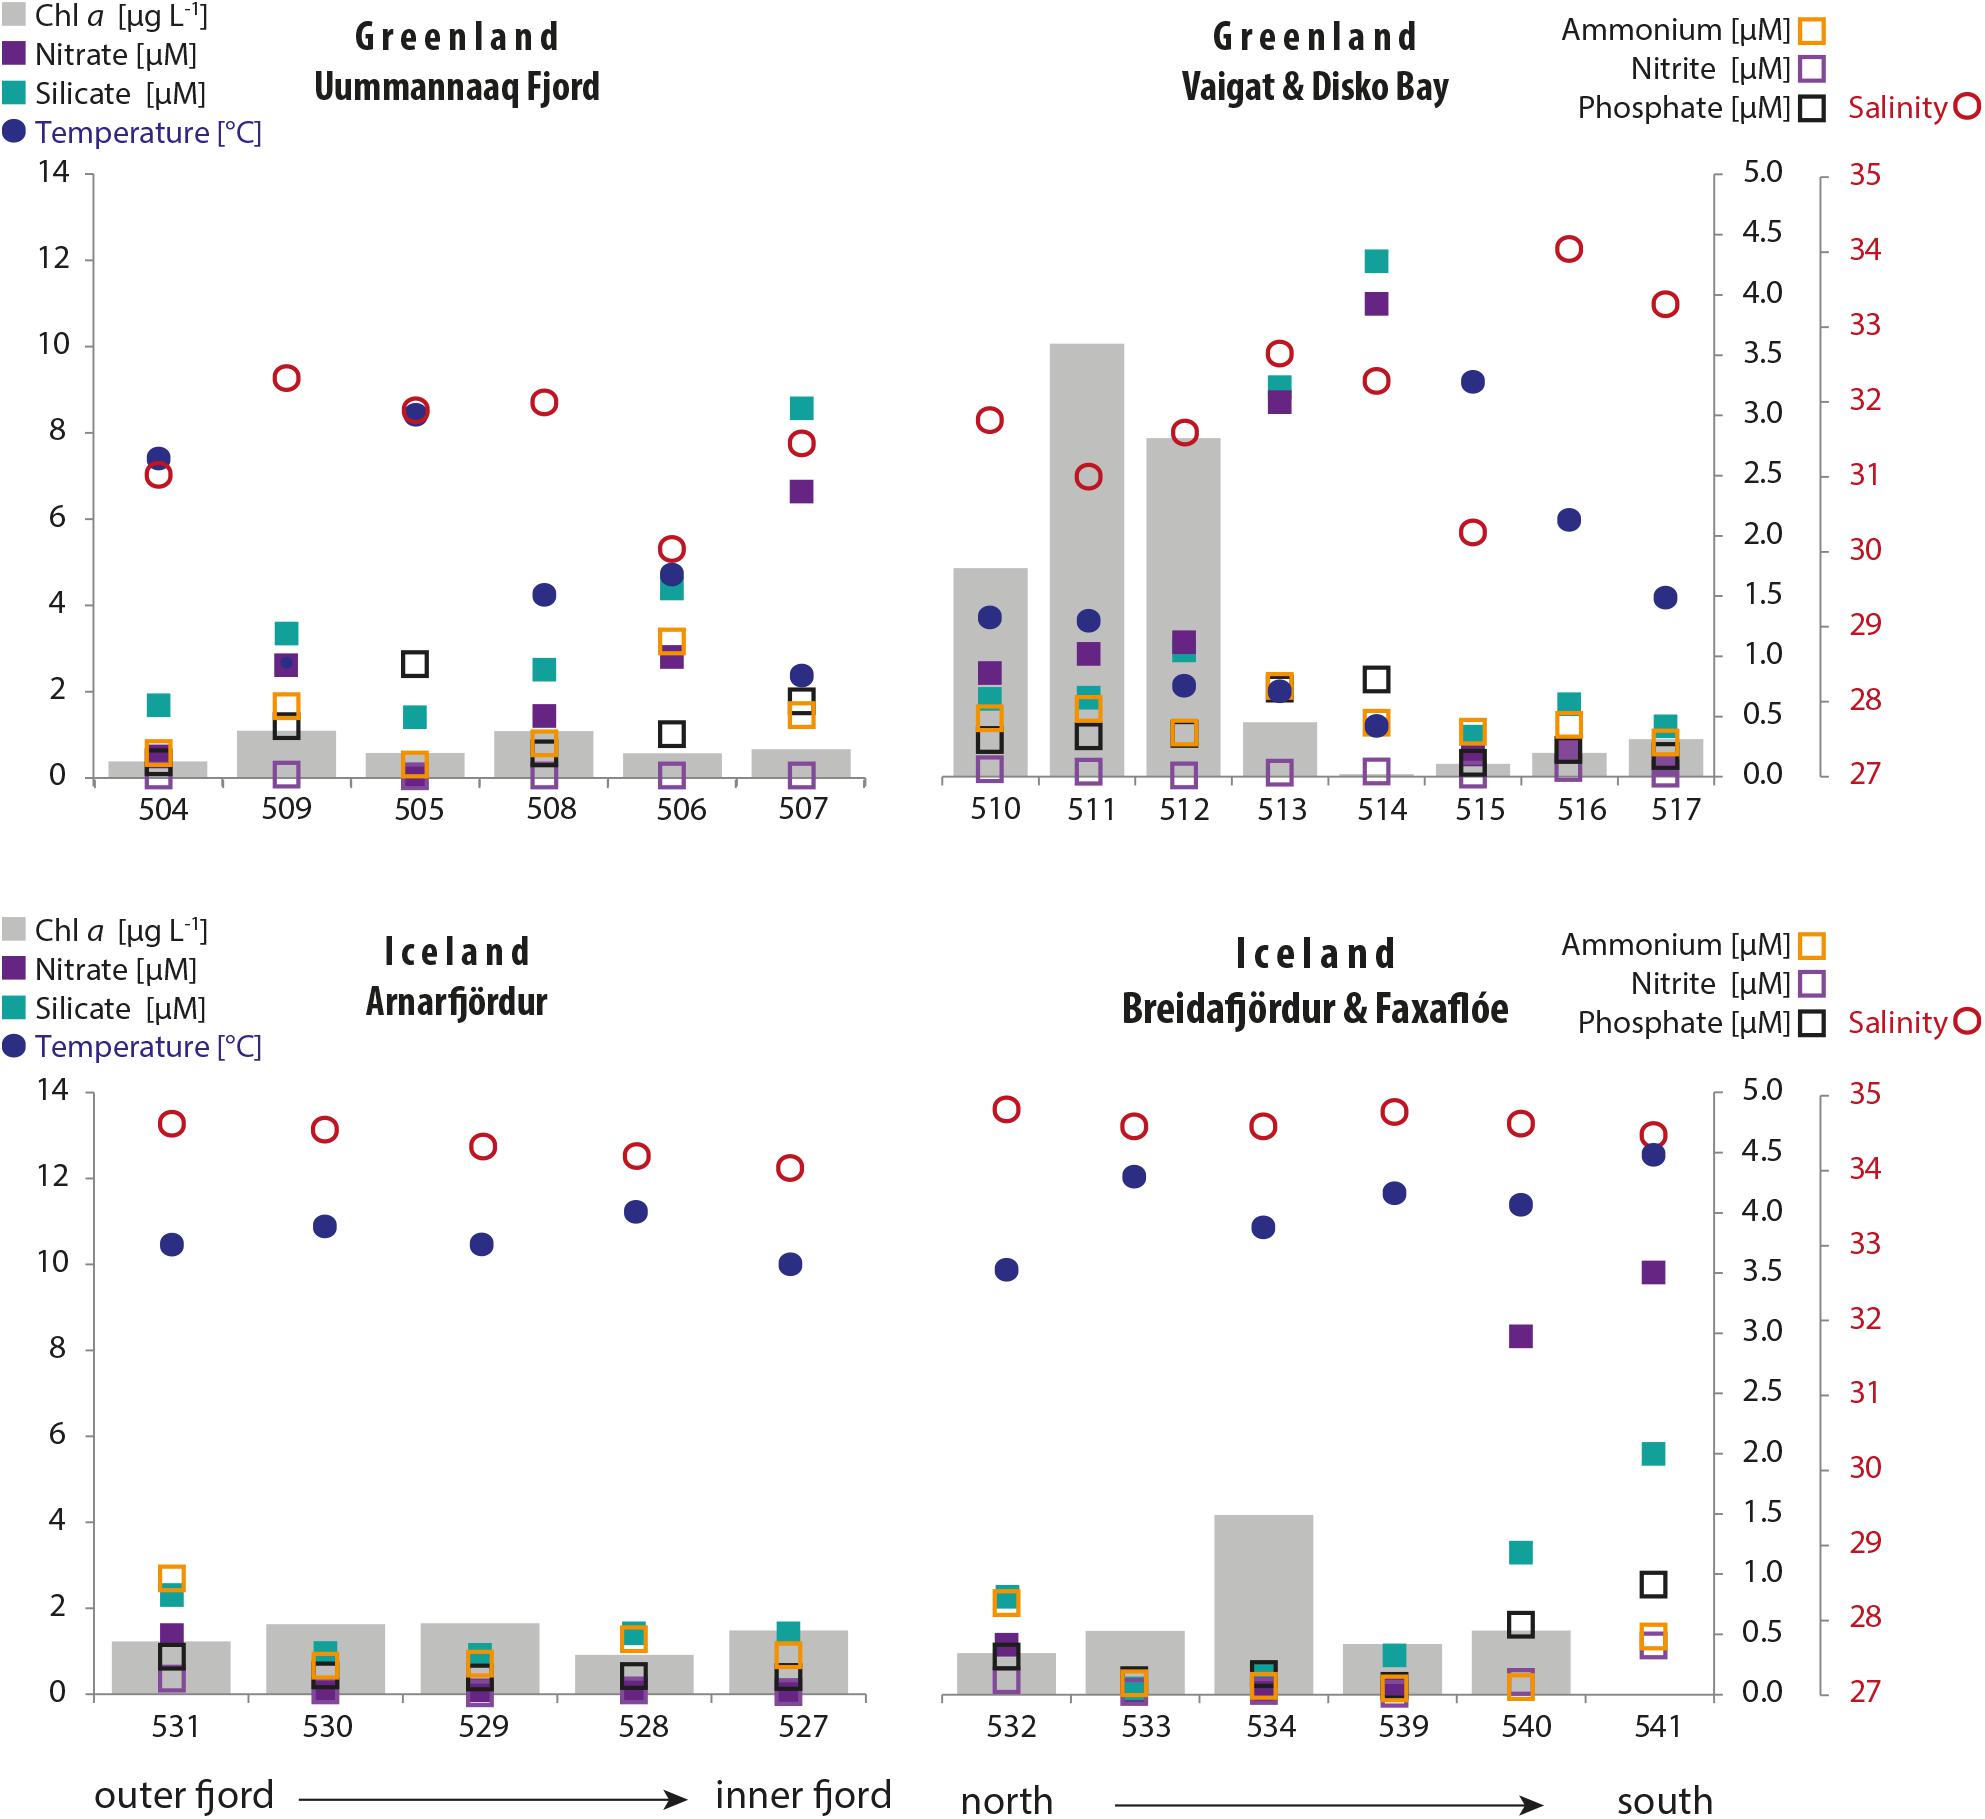
Figure 2. Distribution of environmental parameters of the sampling transects in Greenland (top graphs) and Iceland (bottom graphs). The parameters are temperature and salinity in the surface layer (10 m); inorganic nutrient concentrations and chlorophyll a concentrations in the surface layer (mean: 3–30 m).
Chlorophyll a concentrations (Figure 2) of the surface layer (mean from fixed depths over 3–30 m) were typically ≤ 1.5 μg L–1 but peaked within the Vaigat Strait (4.9–10 μg L–1) in Greenland and at Station 534 (4.2 μg L–1) in Iceland.
Generally low nitrite, phosphate, and ammonium concentrations (∼0.01–1.14 μM) were measured at all stations within the two regions (Figure 2). Silicate concentrations in Greenland were overall > 2 μg L–1 and peaked at Stations 507, 513, and 514 (8.6, 9.1, and 12 μM, respectively); in Iceland, silicate concentrations were typically < 2.0 μg L–1 but peaked at Stations 540 and 541 (3.4 and 5.6 μM, respectively). In Iceland, nitrate concentrations generally followed the pattern for silicate concentrations, but they were usually lower, except for higher levels at Stations 540 and 541 (8.3 and 9.8 μM, respectively).
Typically, a higher variability of temperature and salinity, as well as of silicate concentrations, was found in Greenland, whereas Icelandic waters were more variable in concentrations of the macronutrients phosphate and total inorganic nitrogen (nitrate, nitrite, and ammonium) (Supplementary Figure S1).
Diversity of Amplicon Sequence Variants
After quality processing of sequencing reads, removal of singletons, doubletons, and probable fungal and metazoan sequences, an average of 12,408 reads (range: 1,556–50,843, Supplementary Table S2) clustered into an average of 299 ASVs per sample (range: 27–632). Rarefaction curves interpreted to elucidate the degree of sequence saturation for each sample showed that saturation was reached for most size-fractionated samples, but picoplankton in particular showed exceptionally high diversity and did not reach saturation (Supplementary Figure S2). Among the total of 1,245 ASVs, 871 were found in all microplankton samples, 993 in all nanoplankton, and 1,129 in all picoplankton samples (Figure 3). This yielded 713 shared ASVs among all three size-fractions, and 50 (microplankton), 15 (nanoplankton), and 145 (picoplankton) unique ASVs for the respective size-fractions (Supplementary Figure S3). Within each size-fraction, 56.1–70.6% of ASVs were shared between samples from Greenland and Iceland (Figure 3).
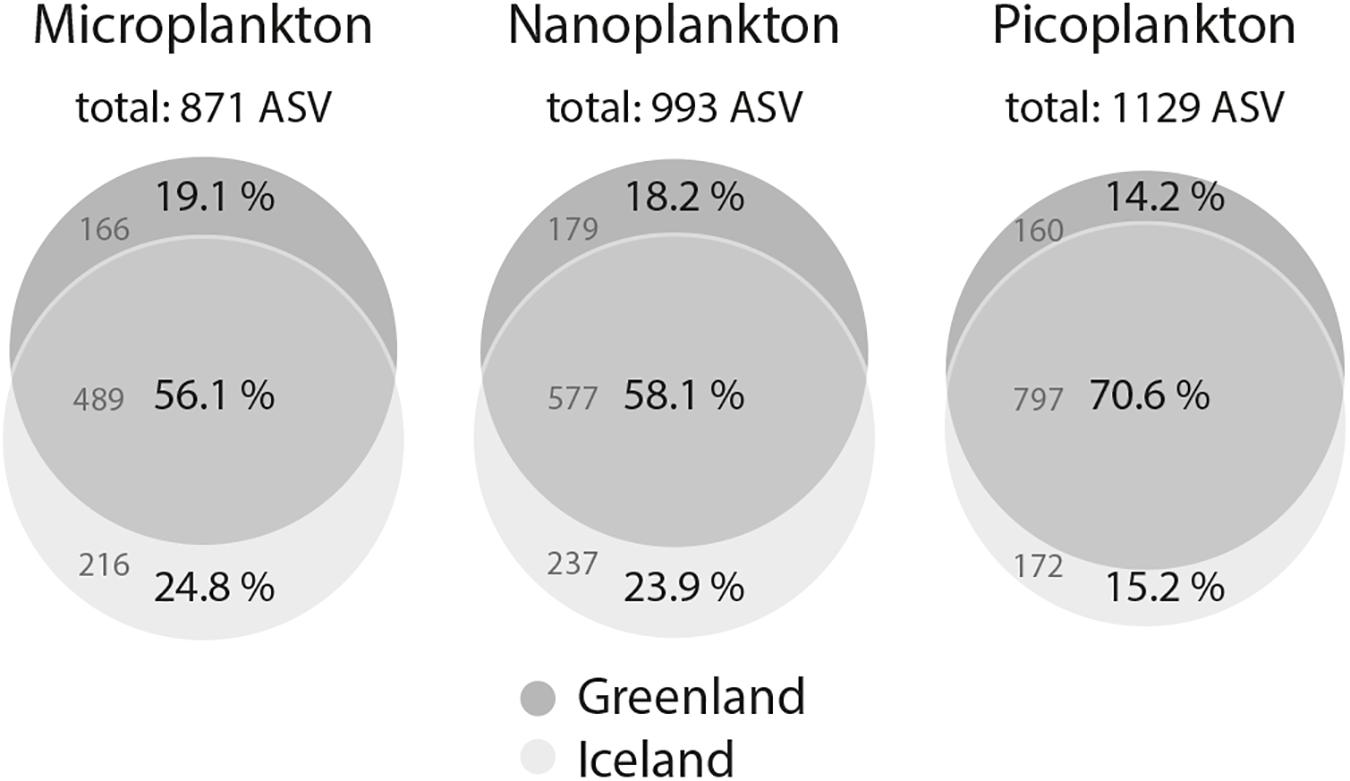
Figure 3. Venn diagrams of ASV intersections between water column samples from west Greenland and northwest Iceland for the microeukaryotic plankton size-fractions: microplankton (20–50 μm), nanoplankton (3–20 μm), and picoplankton (0.2–3 μm). ASVs were generated with a 98% similarity threshold.
Taxonomic Assignment
The preliminary taxonomic assignment conducted by the Dada2 pipeline revealed main groups of eukaryotic lineages. The number of alveolate reads (including dinoflagellates) in the microplankton, nanoplankton, and picoplankton differed between Greenland and Iceland by 4, 24, and 9%, respectively, with relatively more reads obtained at Iceland stations. Stramenopile reads (including diatoms) of the three size-fractions differed between the two regions by 11, 18, and 6%, respectively, with relatively more reads from Greenland stations. The alveolates and stramenopiles together accounted for 98 and 93% of the reads in the micro- and nanoplankton, respectively. Within the picoplankton, these two groups combined accounted for 70% of the reads, and 19% of the reads were assigned to the Archaeplastida, yielding an overall more homogeneous distribution of main taxa for this size-fraction (Supplementary Figure S4). The more homogeneous distribution is partly generated by the lack of dominance of dinoflagellates and diatoms in the sample.
ASV abundances that correlated significantly (p = 0.05) positive with temperature in Greenland coastal waters were mainly annotated as dinoflagellates, whereas negatively correlated ASVs were mainly annotated as diatoms (Figure 4). This trend was less clear for Iceland coastal waters. The effect of salinity was not as evident as for temperature, i.e., significantly positive or negative correlated ASVs did not mainly belong to one particular taxon group. However, both temperature and salinity were significantly correlated with the highest numbers of shifts in ASVs in the two regions, whereas the other environmental factors were associated with fewer significant shifts in ASV abundance (Supplementary Table S3). Variation in ammonium levels, in contrast to salinity and temperature, did not lead to striking differences in the ASV composition, i.e., only five (Greenland) or six (Iceland) ASVs were significantly correlated to changes in ammonium levels (Supplementary Table S3).
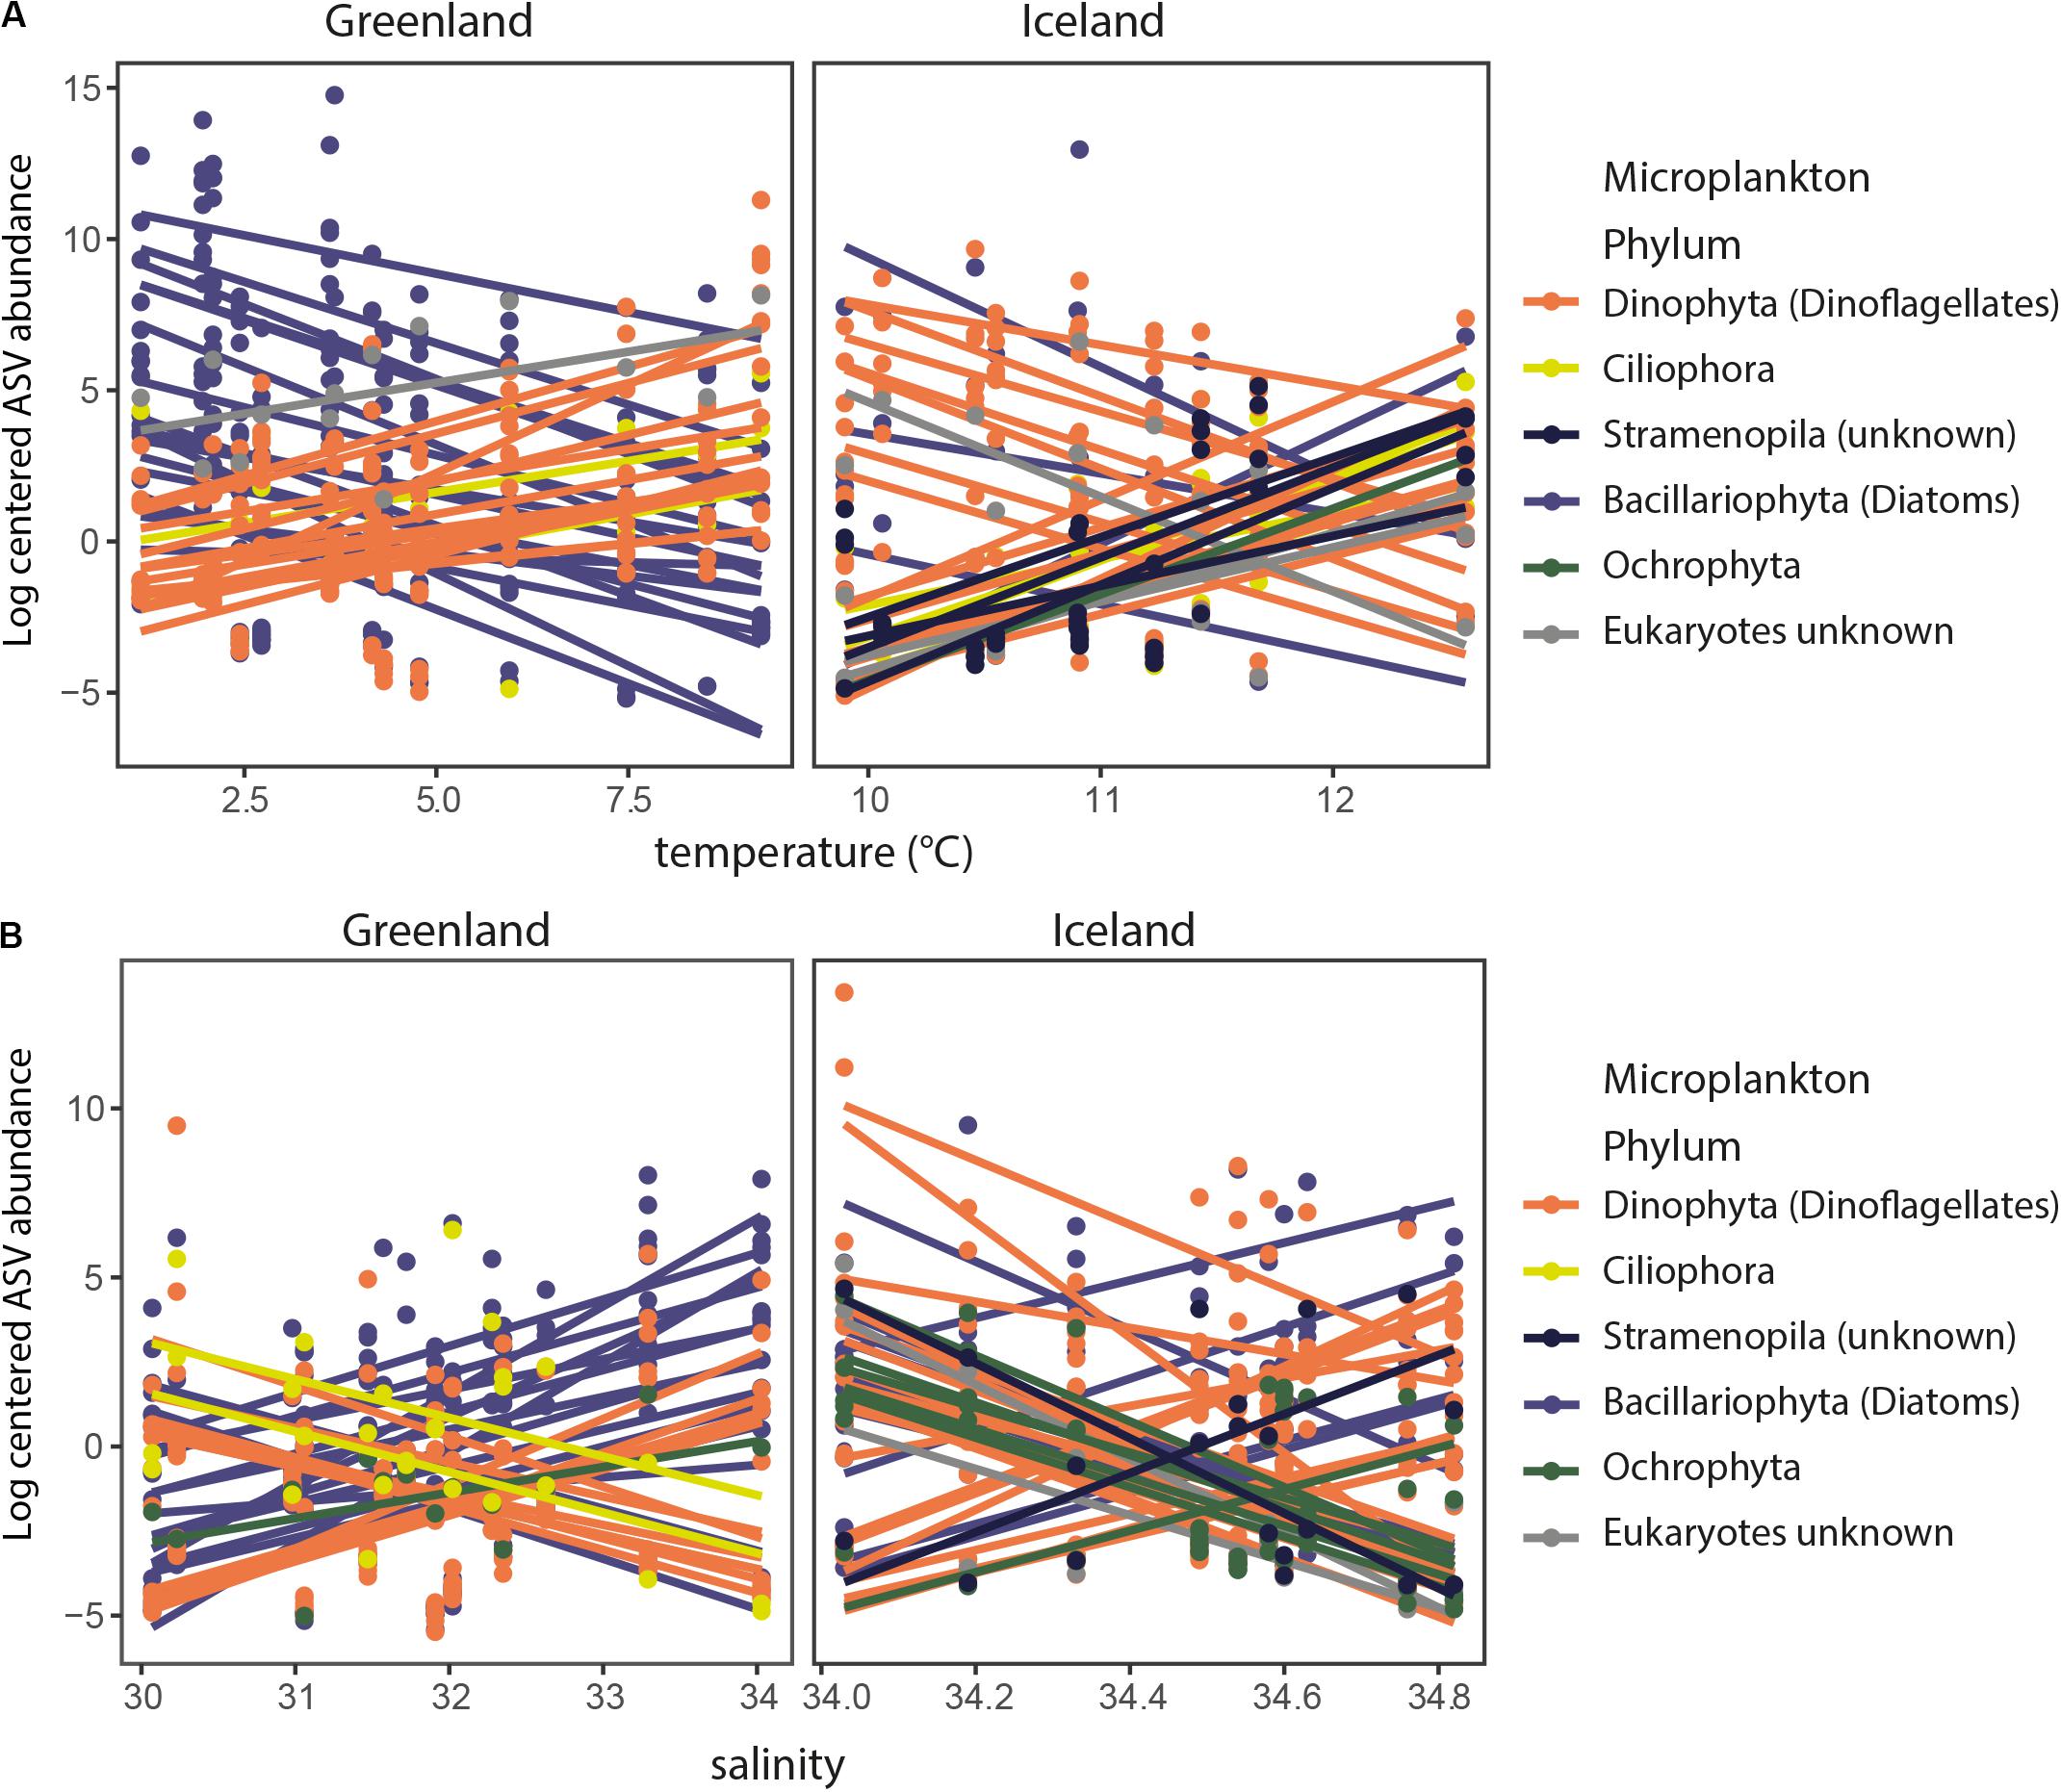
Figure 4. Significant correlations (p = 0.05) of log-centered ASV abundances with temperature (A) and salinity (B) for Greenland and Iceland coastal water samples. Taxonomic annotations of ASVs (dots) are colored by their phylum they represent. Lines are drawn when there was a significant correlation with temperature (A) or salinity (B), i.e., ASV abundances that correlated significantly (p = 0.05) positive with temperature in Greenland coastal waters were mainly annotated as dinoflagellates, whereas negatively correlated ASVs were mainly annotated as diatoms.
The Alveolates, With Focus on Dinoflagellates
Most of the alveolate reads were assigned to dinoflagellates (Dinophyta, 94%), with other reads associated with the phylum Ciliophora (6%). Among the alveolates, the dinoflagellate families Protoperidiniaceae (Peridiniales) and Suessiaceae (Suessiales) were predominant in Greenland, in the microplankton and nanoplankton fractions, respectively (Supplementary Figure S5A). Protoperidiniaceae accounted for most of the reads within the microplankton (26–72%, except at Station 509 with 10%), whereas Suessiaceae accounted for most of the reads in the nanoplankton (22–98%, except at Station 507 with 8%). In contrast to the Suessiaceae, which were not further assignable to genus, ASVs belonging to the Protoperidiniaceae were assigned to the genera Islandinium and Protoperidinium. Among Iceland stations, Protoperidiniaceae (<36%) and Suessiaceae (30–85%, except at Station 539 with 9%) reads were less abundant within the micro- and nanoplankton, respectively, compared to Greenland stations.
In the microplankton size-fraction, the dinoflagellate Tripos (Gonyaulacales) was predominant at the Arnafjördur stations 528 (45%) and 530 (56%), and at all open-shelf stations 532–541 (45–94%). Low read numbers (<16%) were found for the dinoflagellate genera Dinophysis (Dinophysiales), Peridinium (Peridiniales), and Scrippsiella (Peridiniales), but each peaked at different stations. Dinophysis showed high read abundance at Station 527 (73%), Peridinium at Station 529 (42%), and Scrippsiella at Stations 531 (62%) and 528–530 (10–20%).
Within the nanoplankton size-fraction, Scrippsiella reads were abundant at the Arnafjördur stations 527–530 (17–35%), whereas Protoperidinium dominated at the outer fjord Station 531 (21%) and reads belonging to the family Protoperidiniaceae at the open-shelf stations 539 to 541 (13–30%). The putatively toxigenic dinoflagellate Alexandrium (Gonyaulacales) was dominant at Station 539 (58%) but accounted for only 8% at Station 506 and ≤4% of the reads at all other stations.
The group structure within the picoplankton (0.2–3 μm) was different to that within the micro- and nanoplankton, primarily because the parasite Amoebophrya (Syndiniales) and other unclassified Syndiniales, as well as Ciliophora, were represented in high abundance. Both groups together accounted for 40–80% of the reads at each station within the picoplankton. The number of reads accounting for Syndiniales was higher in Iceland (14–50%), especially in the Arnafjördur (30–50%), compared to Greenland (5–33%). In Greenland samples (except from Station 516), most reads accounted for the class Spirotricheae (40–65%) within the Ciliophora, whereas in picoplankton samples from Iceland, reads assigned to Spirotricheae were found in lower relative abundance (7–50%).
The Stramenopiles, With Focus on Diatoms
In the superphylum Stramenopila, 87% of the reads were attributable to phylum Bacillariophyta (diatoms), 0.4% for Bigyra, 7.2% for Ochrophyta, and 5.5% were only assignable at the stramenopile group level (Supplementary Figure S5B). The centric diatom genera Chaetoceros (Chaetocerotales), Skeletonema (Thalassiosirales), and Thalassiosira (Thalassiosirales) were the dominant groups within the micro- and nanoplankton at stations in Greenland and Iceland.
In Uummannaq Fjord in Greenland, reads assigned to Chaetoceros accounted for 14–65% of the stramenopile reads within the micro- and nanoplankton, except for much lower values at Stations 510 and 515 (>2%). Compared to Greenland, similar high relative abundance of reads of this genus (35–81%) was found among microplankton from Iceland, except for Stations 530, 531, and 534 (<4%), but overall lower ASV abundances were assignable for the nanoplankton (<4%). The centric diatom Porosira (Thalassiosirales) accounted for 74% of stramenopile reads within the microplankton at Station 515. This genus was occasionally present in microplankton samples from Greenland (<15%) but rarely found at other stations in any size-fractions (<5%). All ASVs associated with the genus Detonula (Thalassiosirales) were further assignable to D. pumila. This species yielded most reads in the microplankton at Station 510 (98%), accounted for 6–32% at other stations in Greenland, and was also common in the nanoplankton. In Iceland, D. pumila was abundant in the microplankton along the Arnafjördur at Stations 527 (17%), 530 (51%), and 531 (17%) but accounted for < 4% of the stramenopile reads from other stations and size-fractions. The diatom Thalassiosira yielded the most abundant reads in the microplankton size-fraction at Greenland Stations 512 (48%) and 514 (61%) and was similarly common in the nanoplankton along the Vaigat Strait and Disko Bay at Stations 511 to 517 (22–46%). Along the Uummannaq Fjord, the number of ASVs assigned to Thalassiosira accounted for 3–21% of the stramenopile reads in the microplankton and nanoplankton fraction. This genus was more homogeneously distributed but less dominant in the microplankton (<4%) and nanoplankton (<15%) at Iceland stations. The third most abundant genus Skeletonema contributed a high relative number of reads from the phytoplankton community of Uummannaq Fjord in Greenland (<39%) and at Station 514 (52%) but only comprised < 3% of the reads at other stations in Greenland and in micro- and nanoplankton size-fractions from Iceland. The potentially toxigenic pennate diatom Pseudo-nitzschia (Bacillariales) was found at highest read abundances in the Arnafjördur in Iceland at Stations 528 (microplankton: 53%; nanoplankton: 85%; picoplankton: 21%), 529 (microplankton: 23%; nanoplankton: 61%), and 530 (nanoplankton: 36%). Along the rest of the Greenland and Iceland transects, Pseudo-nitzschia accounted for <8% of the reads.
In comparison, for the picoplankton, a high number of reads (15–60%) were only assignable to the superphylum Stramenopila level. Among all stations, 40% of the picoplankton reads were assigned to the class Bacillariophyceae. The three centric diatom genera, Chaetoceros, Thalassiosira, and Skeletonema were occasionally rather well represented in the picoplankton but were typically more abundant in Greenland than at Icelandic stations (<2%), with relatively high reads for Chaetoceros along the Vaigat Strait 512 (23%). In total, Ochrophyta accounted for 42% of the picoplankton reads. In Greenland, Chrysophyceae and Dictyochophyceae, e.g., Florenciella, were present and occasionally relatively more abundant (<41%) among the stramenopiles. In Iceland, these groups were generally less abundant, but Florenciella and Pelagococcus (Pelagomonadales) accounted occasionally for up to 25% of the stramenopile reads.
Community Structure of Eukaryotic Phytoplankton and Correlating Environmental Parameter
The Bray–Curtis dissimilarity matrix of ASV abundances of the three size-fractions revealed a significant separation between the two Greenland and Iceland regions (ANOSIM statistics R = 0.4155, p = 0.001), as well as by size-class (ANOSIM statistics R = 0.5124, p = 0.001, Figure 5A). Environmental fitting onto NMDS ordinations resulted in significant (p ≤ 0.05) linear correlation with ranked distances between the samples (p-fitting for cell size, temperature, salinity, nitrite, and ammonium).
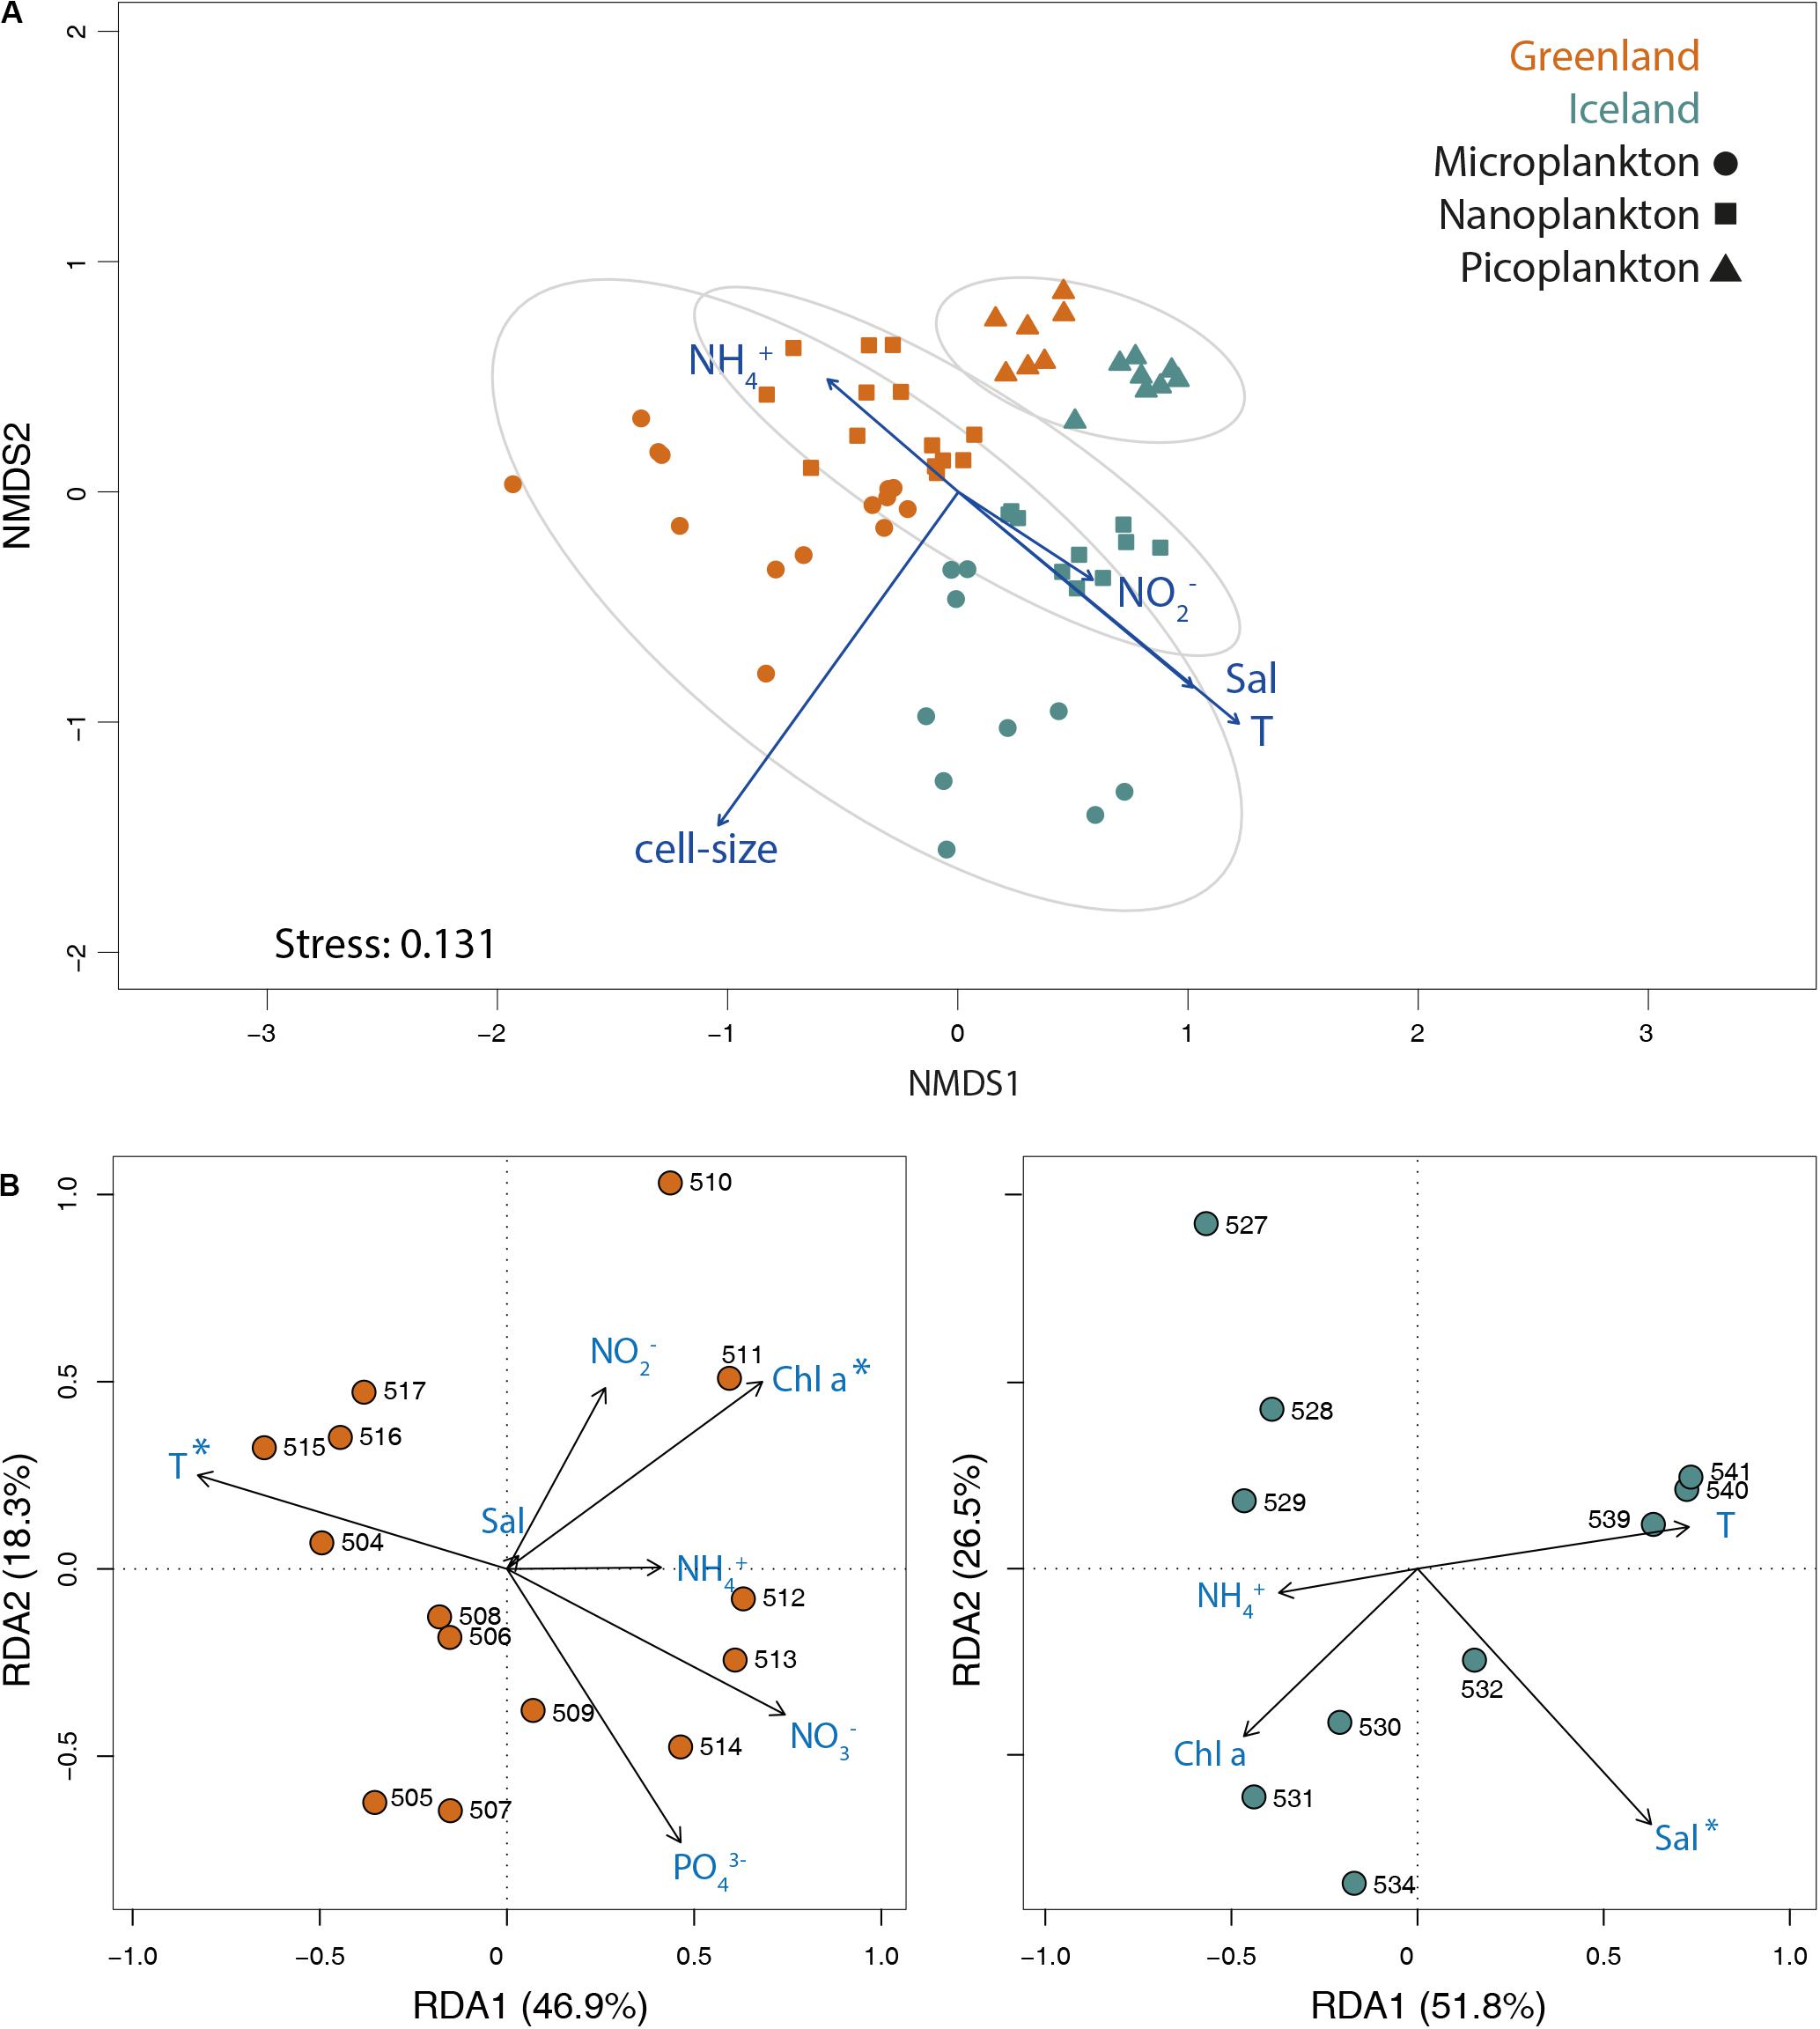
Figure 5. (A) NMDS biplot of the Bray–Curtis dissimilarity matrix of ASV abundances of all three size-fractions. Significant environmental vectors (p ≤ 0.05) were fitted onto the ordination plot. Ellipses are drawn at 95% confidence limit for the sampling areas in west Greenland and northwest Iceland. (B) RDA plots of Hellinger-transformed surface samples from Greenland and Iceland for the microplankton size-fraction significantly correlated with environmental variables ammonium (NH3–), salinity (Sal), temperature (T), and chlorophyll a (Chl a), as well as with nitrate (NO3–), nitrite (NO2–), and phosphate (PO43–) for Greenland coastal water samples. The percentage variance explained by each RDA axis is in parenthesis within axis labels. Asterisks represent statistical significance (ANOVA test: p ≤ 0.05) of environmental parameters.
RDA indicated the relationship among putative environmental factors and the community composition within each size-fraction (Supplementary Figure S6). For all three size-fractions, there was a clear partitioning along the first axis between the Greenland and Iceland stations, whereas the second axis revealed variation within each location. For the micro- and nanoplankton, temperature explained 21.9 and 19.0% of the community variance, respectively (ANOVA test: p ≤ 0.05). Chlorophyll a explained 4.8, 6.0, and 4.7%, respectively (ANOVA test: p ≤ 0.05). Other environmental factors, such as salinity and nutrients, accounted for significant but rather low fractional variances. For example, in the micro- and nanoplankton community, the variance was only partially explained by nitrate (5.3 and 6.1%, respectively) and salinity (3.4 and 2.9%, respectively; ANOVA test p ≤ 0.05); and in the picoplankton by salinity (14.5%, ANOVA test: p ≤ 0.05). Separate RDAs for Greenland and Iceland were conducted for the microplankton size-fraction (Figure 5B). Temperature and chlorophyll a explained 17.2 and 8% of the community variance in Greenland microplankton samples, respectively, and salinity explained 10% of the community variance among Iceland microplankton samples (ANOVA test p ≤ 0.05).
The Partial Mantel test verified that certain environmental parameters, e.g., ammonium, nitrate, nitrite, phosphate, silicate, and chlorophyll a concentrations, as well as temperature and salinity, which were independent of the variation due to geographical distance between stations, correlated with community variance of the microplankton (p = 0.001) and nanoplankton (p = 0.003) but not for the picoplankton (p = 0.248, Supplementary Table S4). The same test verified that differences between the two areas are independent from differences in the environmental parameter considered (p = 0.001).
The microeukaryotic diversity (calculated as Shannon diversity index) of the microplankton did not significantly differ between Greenland and Iceland samples (Figure 6 and Supplementary Table S5). In general, an overall significantly higher diversity was observed in the picoplankton compared separately to the microplankton and nanoplankton samples (t-test: p ≤ 0.05). This was accompanied by a significant higher evenness among picoplankton samples (Pielou’s evenness index J) compared with microplankton (t-test: p ≤ 0.05) size-fractions.
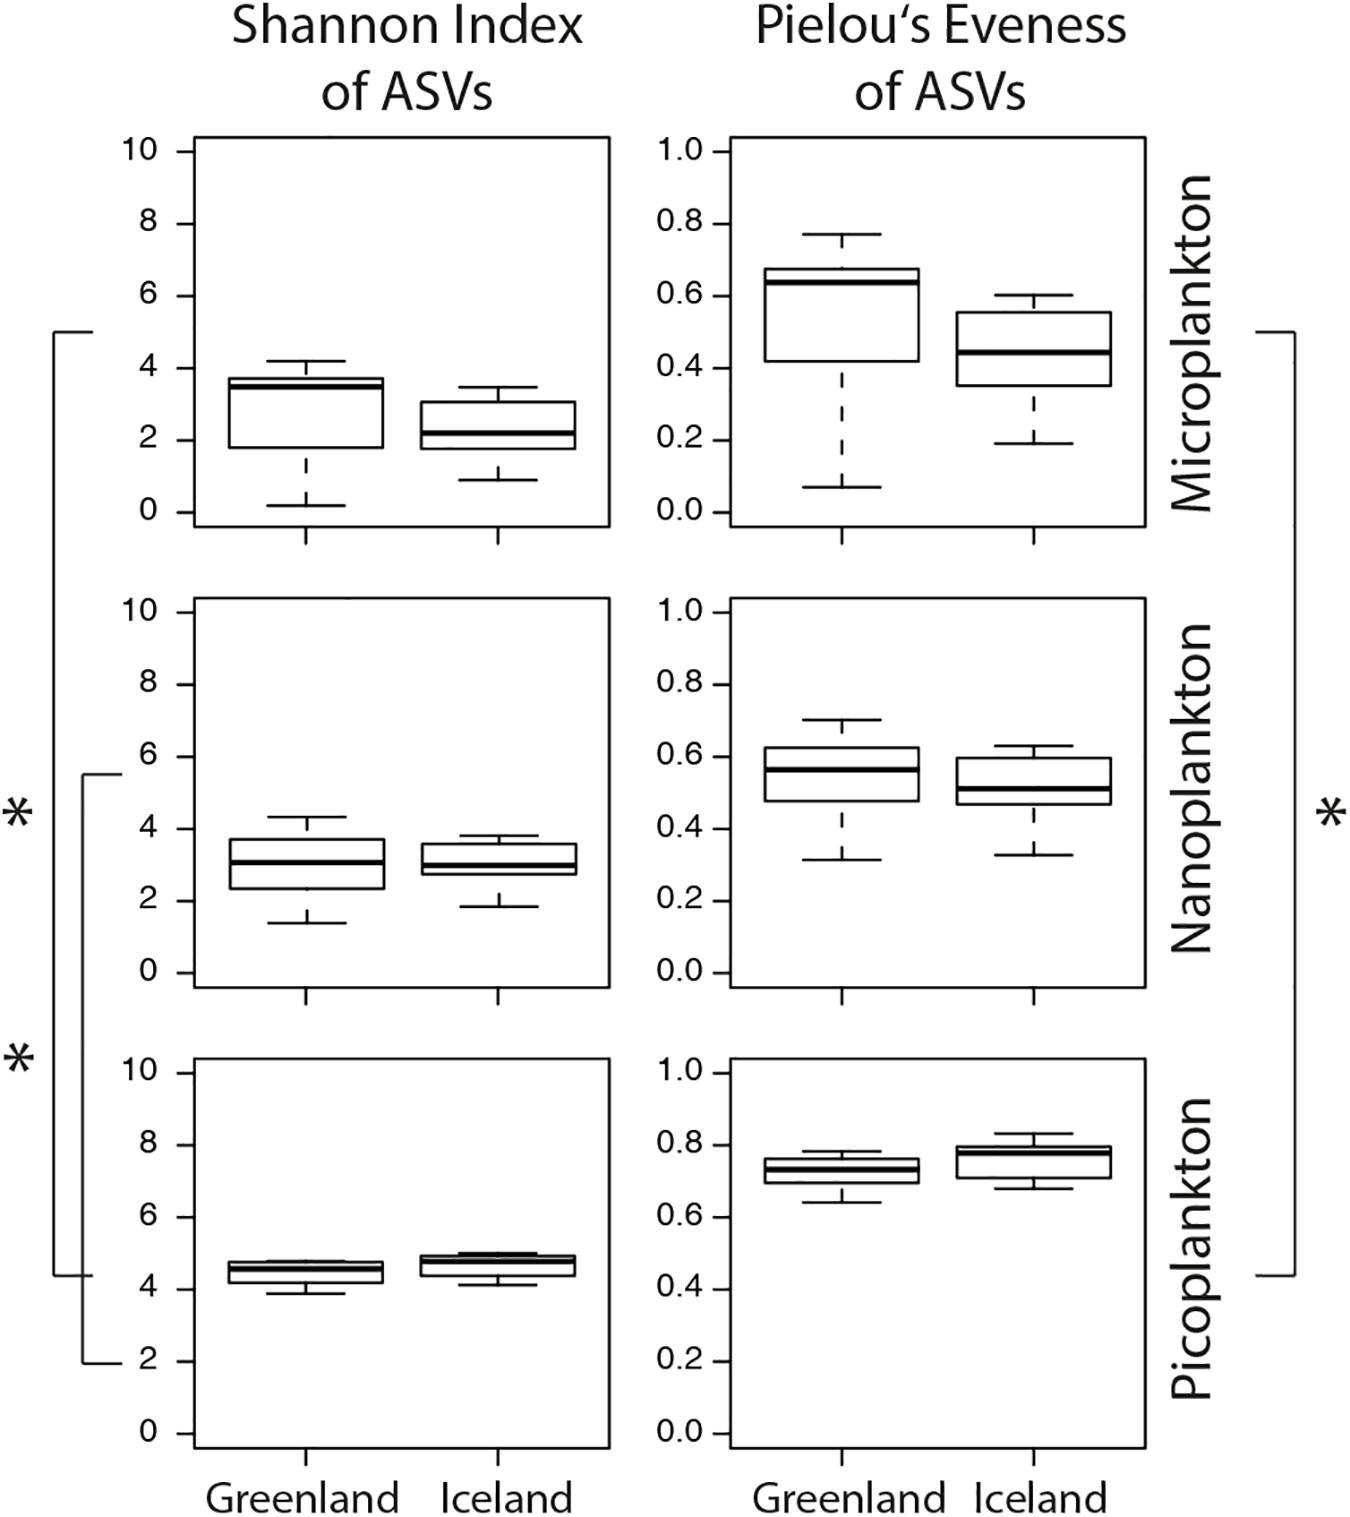
Figure 6. Calculations of the Shannon index of ASVs suggests higher microeukaryotic diversity in the picoplankton (0.2–3 μm) size-fraction as well as a higher evenness (Pielou’s evenness J). Boxplots illustrate the 25–75 percentile values (box), median (bar inside the box), standard deviation (whiskers), and outliers (circles). Asterisks represent statistical significance and were calculated with t-tests (p-values < 0.05).
Metatranscriptomic Trait Diversity and Environmental Effect
The overview of mRNA and rRNA diversity (Figure 7) in Greenland and Iceland waters also illustrates the regional separation between Greenland and Iceland samples. Overall, higher relative abundances were found for the dinoflagellates within the rRNA diversity compared to the mRNA diversity. Independent of the actual number of distinct ASVs and sequence reads, the ratios of the taxonomic groups in mRNA and rRNA were comparable.
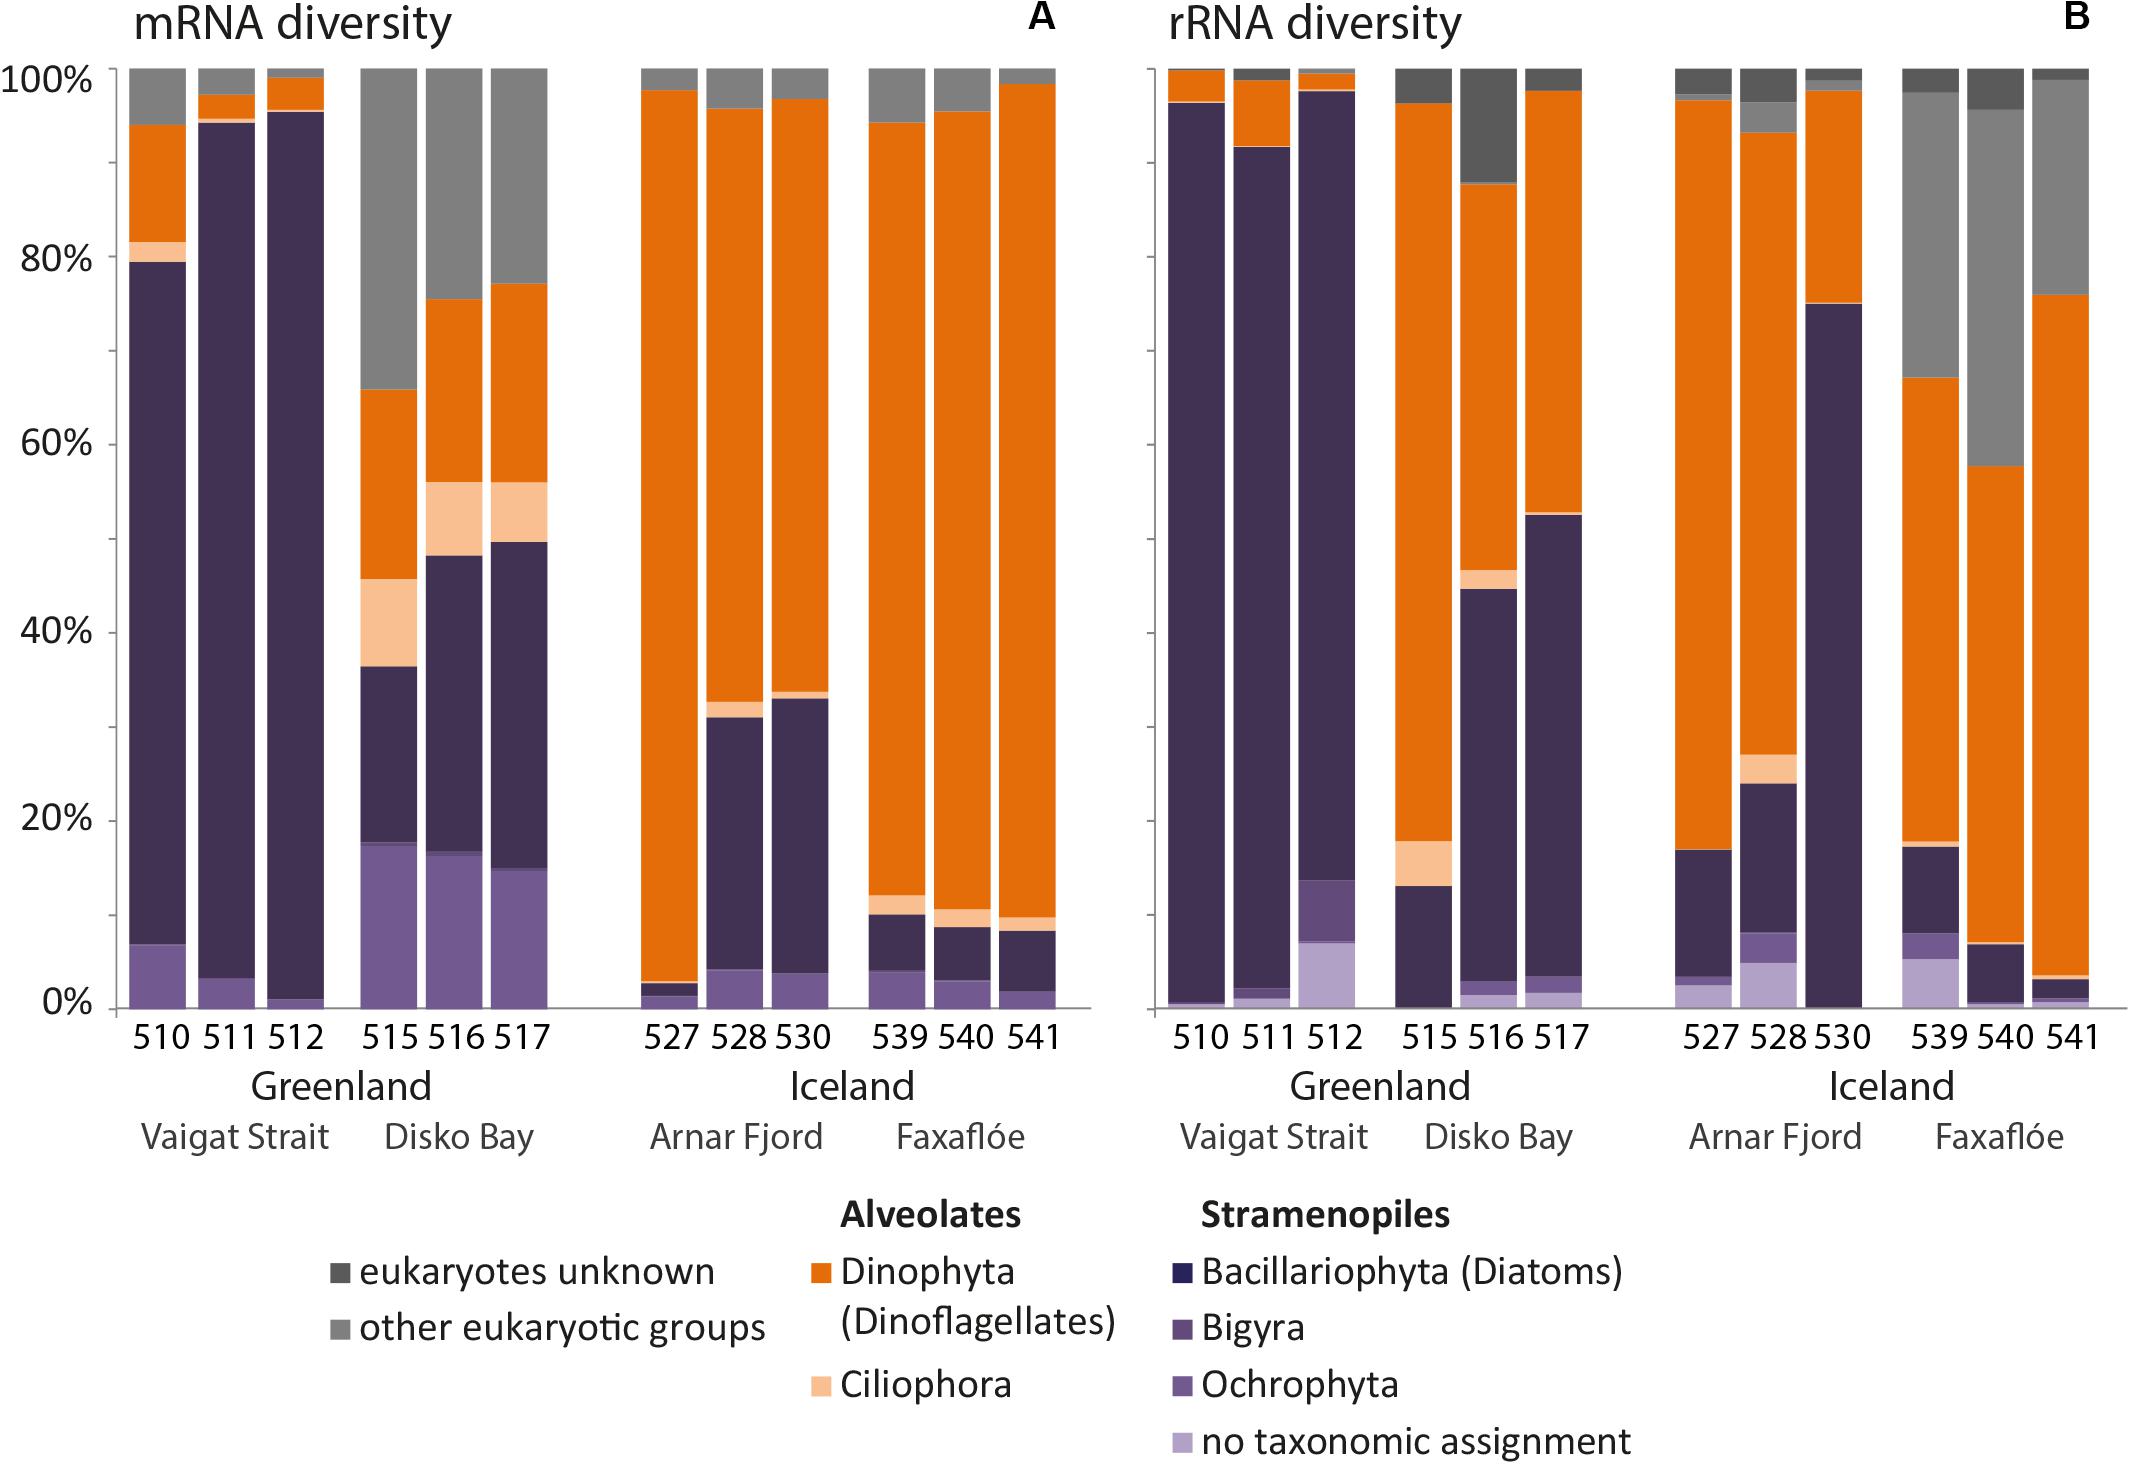
Figure 7. Bar chart of the relative mRNA (A) and rRNA (B) diversity of the microplankton size-fraction (20–50 μm) at stations in west Greenland and northwest Iceland coastal waters.
Metabolic Trait Diversity
Total metabolic trait diversity of the overall metatranscriptome and of the diatom-specific metatranscriptome was generally similar in the two environments, but significantly higher for dinoflagellates in Greenland waters (Figure 8A and Supplementary Table S6). Generally, higher values of indices for metatranscriptome diversity (Hj) were determined for the dinoflagellates compared to diatoms (Figure 8A: HJ first panel). However, compared to dinoflagellates, generally higher values of indices for functional specialization (FS) and differential gene expression (KL) were found for the diatoms (Figure 8A, FS/second panel). In the overall metatranscriptome pattern (ALL), significantly higher values for FS (expression unique traits) and KL (plasticity in common traits) were calculated for the diatom-dominated stations in Greenland.
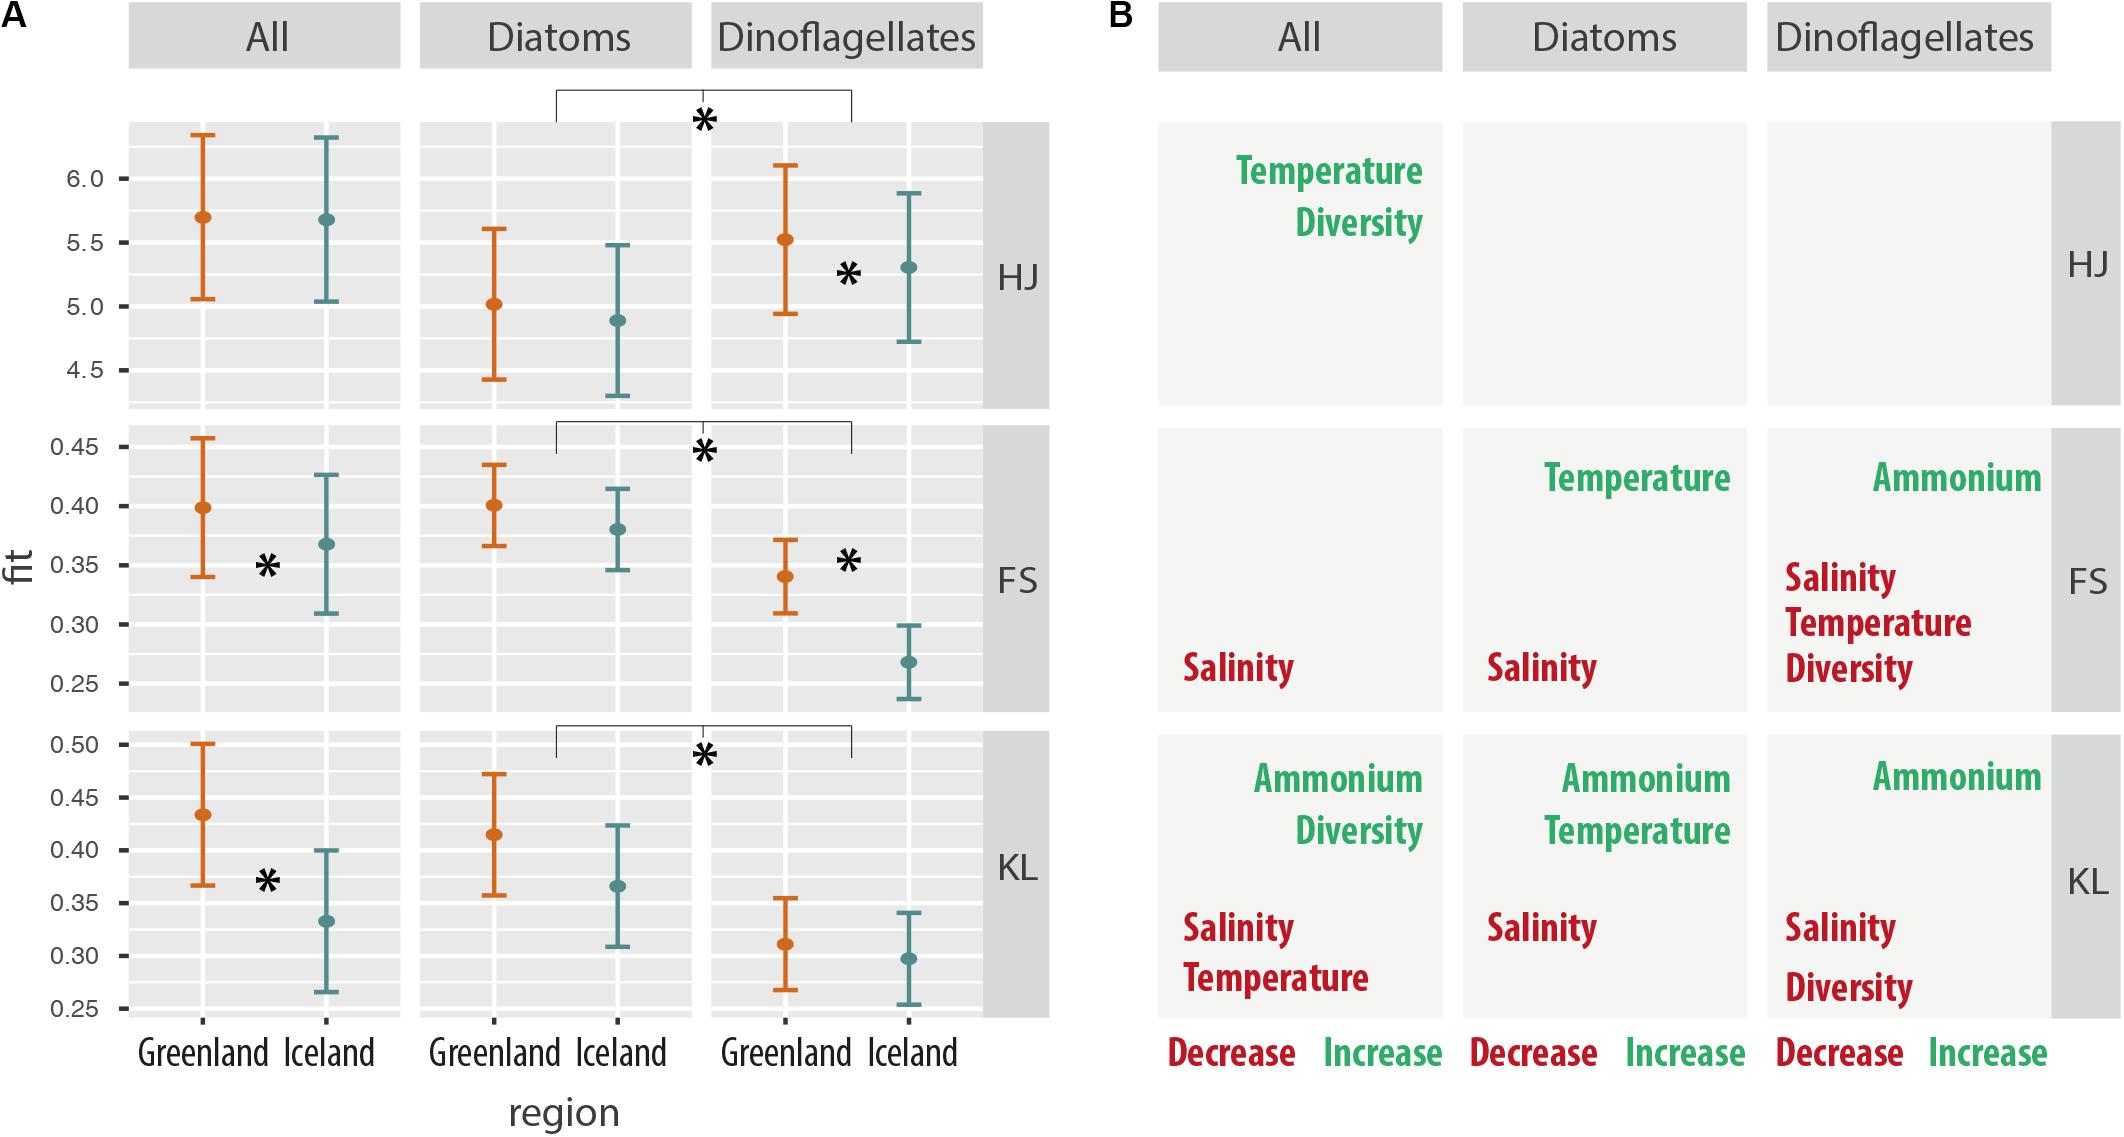
Figure 8. (A) Environmental independent effects on metabolic trait expression for Greenland and Iceland coastal samples for the whole community, as well as for diatoms and dinoflagellates considered independently. HJ: Metatranscriptome diversity Hj, a measure of the relative transcript frequencies per gene and sample, comparable to the Shannon diversity index. FS: functional specialization index δ is a measure for the divergence from the average transcriptome; however, increasing values indicate an increasing differential expression of genes common to all samples, thus is measure of functional specialization, i.e., expression of unique traits. KL: Kullback–Leibler divergence Dj is a measure of how much the transcriptome departs from the average transcriptome, and increasing Dj values indicate an increasing expression of sample-specific genes, thus is a measure of differential gene expression, i.e., plasticity in common traits. (B) Significant correlations of environmental factors with metabolic trait diversity and metabolic trait changes (HJ, FS, and KL) independent of the regions in Greenland and Iceland. Asterisks represent statistical significance (p < 0.05).
Environmental Independent Effects on Metabolic Trait Expression
Significantly negative correlations of salinity with metabolic trait changes were found for all combined taxa, as well as for the separate diatom and dinoflagellate communities (Figure 8B). Lower metabolic trait specialization (FS) and lower differential gene expression (KL) was observed under higher salinity conditions. Significant correlation with ammonium concentration was associated with higher differential gene expression of metabolic traits (KL), i.e., forcing metabolic trait plasticity, in all communities, and was also associated with increased functional specialization (FS) of metabolic traits in dinoflagellates (Figure 8B).
Results for all taxa (Figure 8B first column) indicate that increasing temperature had the same effect as increasing species diversity on metabolic trait diversity, as both were overserved with higher transcriptome diversity for metabolic traits, irrespective of the environment. However, biodiversity and temperature did not correlate within the dataset for diatoms and dinoflagellates. Biodiversity and temperature had contrasting effects on metabolic trait niches by differential gene expression (KL); whereas increased species diversity was associated with increased level of metabolic niche separation, temperature corresponded to decreased metabolic niche separation, i.e., leading to a more homogenous metabolic trait expression.
Furthermore, the results for the diatoms and dinoflagellates indicate a contrasting effect of temperature on their global metatranscriptome patterns: dinoflagellates exhibited decreased metabolic trait specialization (FS) with increasing temperature, whereas for diatoms both specialization (FS) and differential expression (KL) increased with increasing temperatures in the two environments.
Major Differences in Metabolic Trait Expression in the Two Environments
Differences in metabolic trait expression were assessed by differential expression analysis of annotated genes, with the taxonomic distribution kept as background information. The observed results revealed contrasting metabolic traits expressed by the two communities in their respective environment. The results broadly reflect the different abundance of diatoms and dinoflagellates in Greenland and Iceland sampling stations: genes more highly expressed in Greenland belonged mainly to diatoms, whereas genes more higher expressed in Icelandic fractions were mostly of dinoflagellate origin (Figure 9).
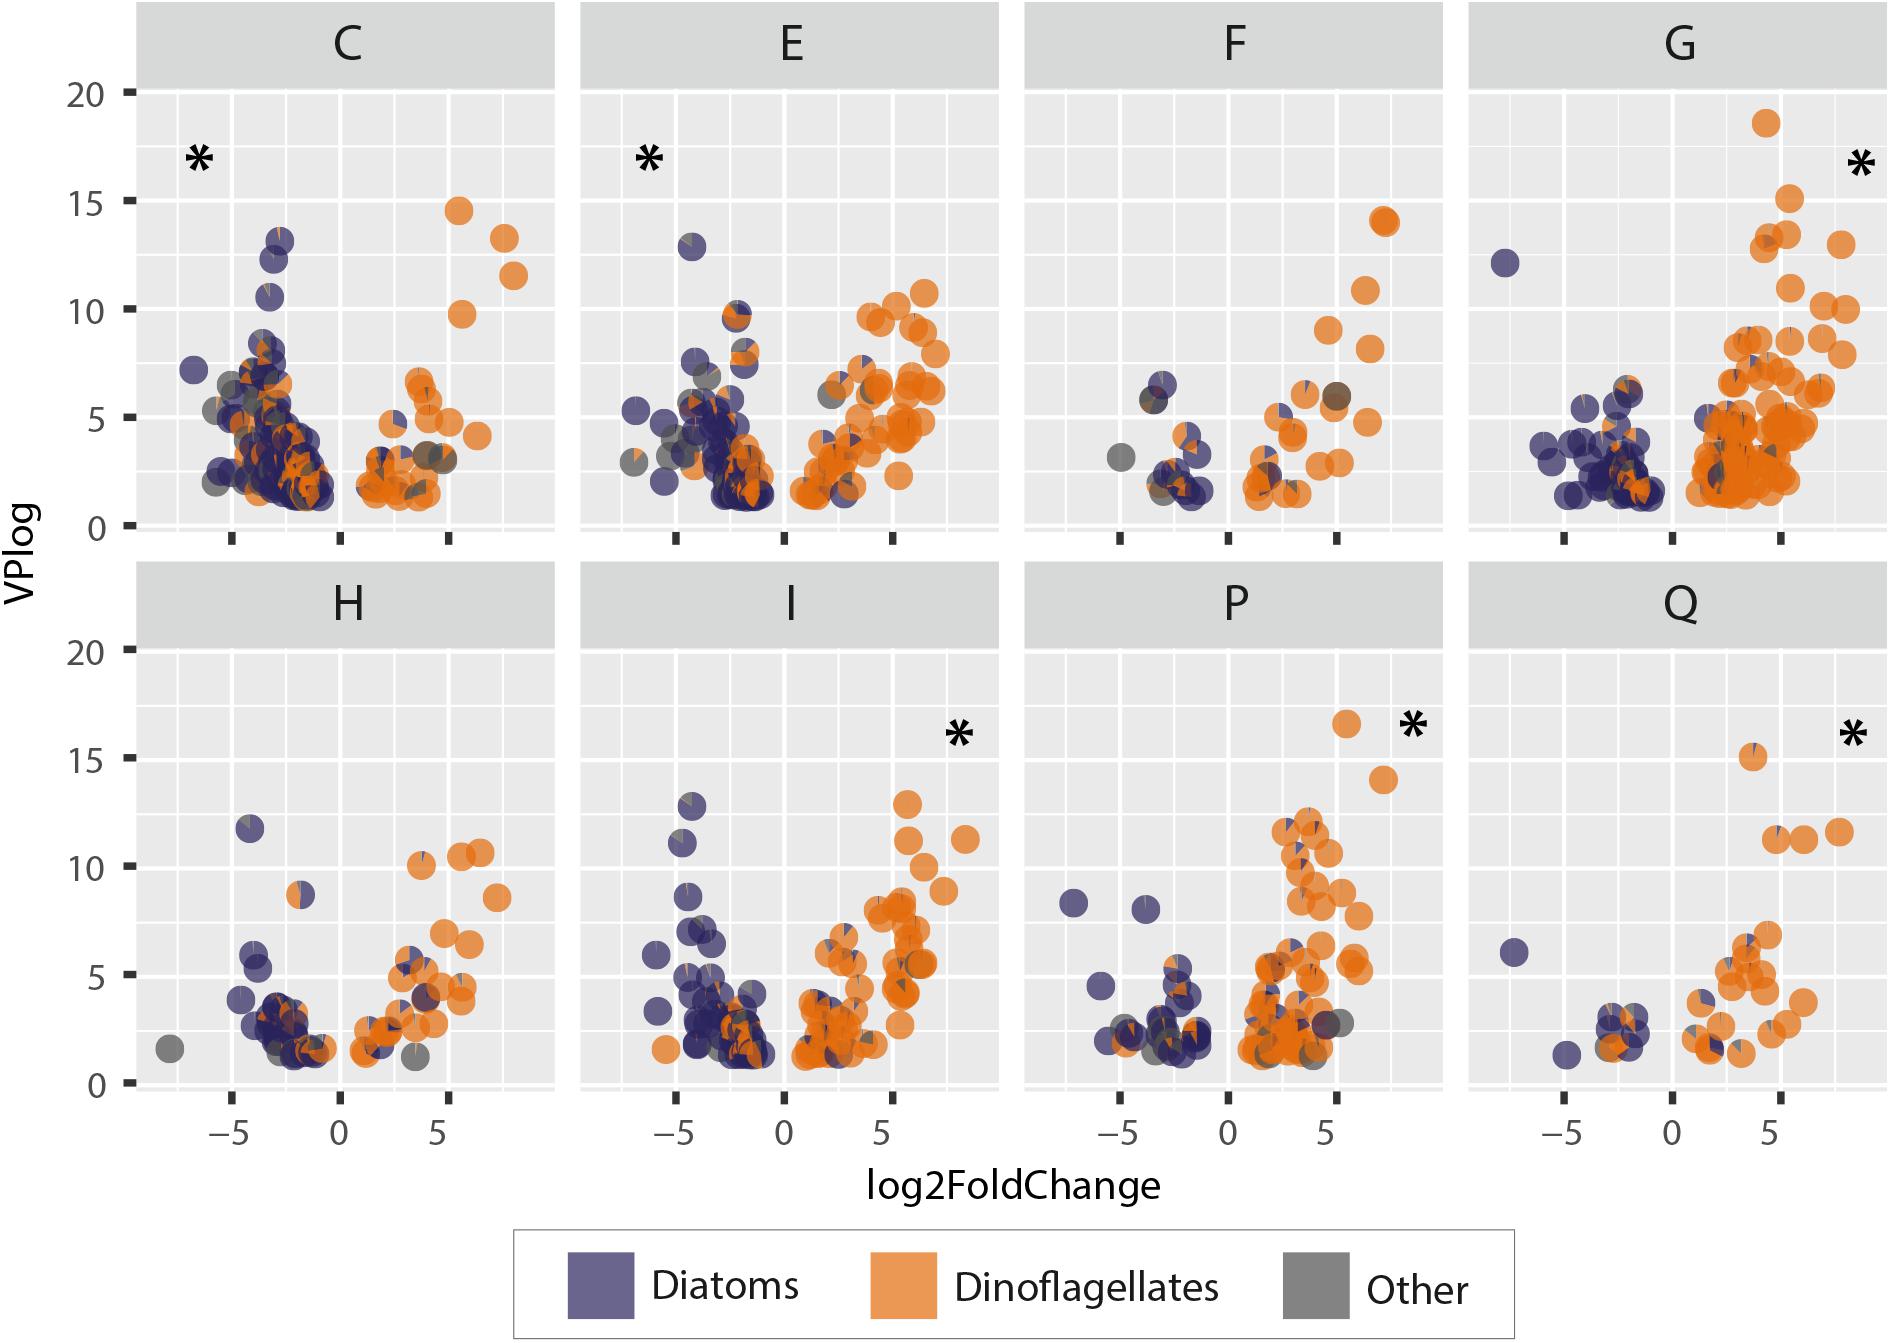
Figure 9. Differential gene expression in Greenland and Iceland coastal water samples. Negative values represent higher gene expression in Greenland samples; positive values represent higher gene expression in Iceland samples. Each point represents a pie chart representing a gene with its annotated relative taxonomic representation (diatoms, dinoflagellates, others). Each letter abbreviates a functional metabolic category; names of the functional categories are according to KOG: [C] energy production and conversion, [E] amino acid transport and metabolism, [F] nucleotide transport and metabolism, [G] carbohydrate transport and metabolism, [H] coenzyme transport and metabolism, [I] lipid transport and metabolism, [P] inorganic ion transport and metabolism, [Q] secondary metabolite biosynthesis, transport, and catabolism. Asterisks indicate a significant enrichment of genes in the respective category.
The metabolic processes in Greenland microeukaryotes were significantly enriched for energy production and amino acid metabolism genes (KOG categories C and E), whereas in Iceland samples an enrichment in carbohydrate, lipid, ion, and secondary metabolite metabolism and transport genes (KOG categories G, I, P, and Q, respectively) was observed. Additionally, the microeukaryote community in Greenland showed a higher gene activity in carbon fixation, i.e., a higher amount of photosynthetically active organisms, such as diatoms, and a higher rate for Citric Acid Cycle and ATP synthesis genes. In terms of amino acid metabolism, the processes were enriched for arginine, proline, and aromatic amino acids and in the genes driving the urea cycle.
Metabolic processes in the dinoflagellate-dominated community in Iceland samples showed a high activity associated with their glycogen metabolism and carbohydrate cleavage enzymes of various substrates. Dinoflagellate lipid metabolism is characterized by a high expression of fatty acid and triacylglycerol biosynthesis genes. Additionally, the Iceland community showed a higher expression of various nutrient transporter genes for micro- and macronutrients, as well as for voltage-gated ion channels. The metabolic traits comprising secondary metabolism indicate high-activity genes with potential involvement in polyketide synthesis (acyl transferase domain in polyketide synthase enzymes, O-methyltransferase involved in polyketide biosynthesis, polyketide synthase).
Discussion
Comparison of a diatom-dominated microeukaryotic community in west Greenland with a dinoflagellate-dominated species assemblage in northwest Iceland coastal waters yielded preliminary insights into the potential effects of changing environmental parameters on taxonomic and functional biodiversity. Fjords and adjacent coastal waters of western Greenland and northwest Iceland exhibit major differences in the physical and chemical environmental regime during summer, which directly affects the distribution and composition of microeukaryotic plankton communities, dominated by diatoms versus dinoflagellates, respectively. Differences in the environmental abiotic regime in these coastal waters may partially explain the respective community structure at the major group level, e.g., the relative dominance of diatoms versus dinoflagellates. The role of cell size in maintaining diversity in microeukaryotic plankton community composition can be interpreted as an adaptive response to prevailing abiotic environmental factors. Finally, transcriptomic analyses demonstrate how metabolic and regulative processes are linked to functional strategies associated with dinoflagellate- and diatom-dominated communities within the microplankton.
Comparative Taxonomic and Functional Diversity Within Geographical Regions
Typical seasonal succession in the microeukaryotic plankton in north temperate and Subarctic waters is characterized by a high-biomass spring bloom dominated by centric diatoms, succeeded by larger dinoflagellates, and followed by eukaryotic micrograzers, microflagellates, and picoplankton (Eilertsen et al., 1981; Degerlund and Eilertsen, 2010). This general pattern is consistent with the differences observed in microeukaryotic plankton species composition in the mid-summer Subarctic waters of northwest Iceland (early August) versus the Arctic fjords of west Greenland a week earlier (late July). The two regions reflect the typical successional sequence among all size-fractions, with a higher relative number of reads assigned to alveolates (mainly dinoflagellates, see Supplementary Figure S4) in Iceland, whereas stramenopiles (mainly diatoms, see Supplementary Figure S4) dominate in west Greenland samples. There is no significant difference in diatom ASV diversity between the two regions but rather a trend toward higher dinoflagellate diversity in Greenland than Iceland during the mid-summer succession (e.g., Supplementary Table S6). Independent of ASV abundance, diatoms have a higher diversity (Shannon index) than dinoflagellates in the two regions (e.g., Supplementary Table S6 and Figure 8A).
At the genus level, the occurrence of the centric diatoms Chaetoceros (Chaetocerales), Detonula (Thalassiosirales), and Thalassiosira (Thalassiosirales) in west Greenland and northwest Iceland coastal waters (Supplementary Figure S5B) is expected. Chaetoceros and Thalassiosira are well known for such high-latitude coastal areas, including Greenland (Zamora-Terol et al., 2013; Krawczyk et al., 2014) and Iceland (Jiang et al., 2001; Astthorsson et al., 2007). Species of Chaetoceros and Thalassiosira commonly dominate the phytoplankton spring bloom over the Icelandic shelf and still tend to be relatively abundant when dinoflagellates, e.g., Tripos (formerly as Ceratium) and Protoperidinium species, increase after the spring bloom (Astthorsson et al., 2007).
Three dinoflagellate genera: Protoperidinium (Peridiniales), Scrippsiella (Peridiniales), and Tripos (Gonyaulacales) warrant particular attention, as they are common to the two geographical regions but with radically different representation within samples. This biogeographical pattern is only partly in congruence with Astthorsson et al. (2007), because in the current study although dinoflagellate taxa were more abundant in Iceland coastal waters than diatoms, Chaetoceros was not abundant among the nanoplankton, and Thalassiosira was not abundant in any size-fractions from Iceland. Seasonality and associated succession patterns therefore broadly explain the differences in the microeukaryotic plankton community between Greenland and Iceland on the macroscale, but cannot account for interannual variation at lower taxonomic (genus and species) levels.
Local processes and species adaptations may generate community differences on smaller spatial scales, i.e., submesoscale (<10 km). In particular, differences in ambient temperature and salinity regime may affect the plankton community structure and composition either directly by effects on metabolic processes or indirectly due to hydrodynamic changes that affect stratification, advection, and dispersal of species (Figure 5). This local variability among different environmental factors in the two regions did not lead to discernable differences in the diversity of the communities, either in general or within individual size-fractions (Figure 6). The number of potential niches to be filled thus appears to be roughly equal, although taxonomically differentiated between the two regions and successional stages.
Coupling between taxonomic and functional diversity has been previously described for other coastal protistan communities (Ramond et al., 2019). The current comparative study of west Greenland and northwest Iceland reflects differences on the major group taxonomic scale when comparing the functional diversity of dinoflagellates versus diatoms. The diversity pattern for the metatranscriptome was similar to the taxonomic diversity, in that there was no statistically significant difference between the two regions (Figure 8A). Nevertheless, diatoms have a higher diversity (Shannon index) than dinoflagellates in the two regions (Supplementary Table S6), but metatranscriptomic diversity is higher for dinoflagellates than for diatoms (e.g., Figure 8A) during this mid-summer period. The taxonomic diversity of the microplankton is apparently linked to the functional diversity on a very broad scale but does not significantly differ between regions and successional stages.
The generally lower metatranscriptome diversity of diatoms is, however, more differentiated in the two regions than the dinoflagellate community metatranscriptome. The microeukaryotic metatranscriptome is more specialized in west Greenland but with a higher divergence between stations, i.e., at shorter spatial scales. This applies to both: expression of unique genes and of genes common to all community members (Figure 8A). This leads to the inference, therefore, that the metabolic traits estimated on the basis of gene expression patterns are more “plastic” or variable in west Greenland and relatively more conserved in northwest Iceland. This may reflect the different lifestyle strategies within the two taxonomic groups, with diatoms being functionally similar, i.e., all silicifying and primarily photoautotrophic, whereas dinoflagellates comprise highly diverse nutritional modes (autotrophic, mixotrophic, heterotrophic, etc.) and lifestyles (free-living, symbiotic, or parasitic) co-existing in the plankton. Dinoflagellates may therefore have created their niches through diverse lifestyles, with a stronger focus on species interactions, while diatoms with very similar lifestyle strategies may have occupied their ecological niches through diverse metabolic optimization by resource partitioning, as also suggested by Alexander et al. (2015a). Overall, the mix of different strategies within and between the two taxonomic groups clearly restricts communities from becoming too homogeneous in their metabolic functional traits. This is important to maintain biodiversity and can have ecosystemwide consequences for the transfer of energy and matter to higher trophic levels.
Irrespective of roughly equal diversity at ASV and metatranscriptome levels, the different taxonomic composition of the communities can indeed be associated with functional differences. The common phylogeny of a taxonomic group within a community may be linked to a particular set of metabolic functions. Within the seasonal successional sequence of diatoms to dinoflagellates, taxon-specific metabolic peculiarities may even lead to specific phenological adaptations at higher trophic levels. For example, comparing the gene abundances of diatom-dominated communities in west Greenland with the dinoflagellate-dominated assemblages in northwest Iceland reveals different preferred gene expression of specific metabolic pathways in the two communities (as illustrated in Figure 9). Such broad differences in expression of genes involved in core metabolic functions indeed lead to discernable characteristic biochemical composition of cells; group-specific metabolism may yield metabolites to which interacting species have adapted within the phenological cycle. In the current study, this is evidenced by the fact that dinoflagellates exhibited a higher activity of genes involved in lipid metabolism, carbohydrate storage, and in the biosynthesis of secondary metabolites (Figure 9). The observed expression profile of the dinoflagellates is potentially linked to differential evolution of ecological strategies, i.e., rather slow growing, with lower turnover rates compared to fast-growing diatoms but with diverse nutrient acquisition mechanisms. Hence, dinoflagellates may preferably invest in “storage and defend” compounds. Diatoms, in contrast, have a significantly higher expression of genes involved in energy production and conversion, and amino acid metabolism, in particular for synthesis of proline and arginine. Furthermore, the high expression of genes involved in the citric acid- and urea cycles (Figure 9), which are functionally linked in diatoms (Allen et al., 2011), is critical for arginine and proline biosynthesis (Krell et al., 2007; Rokitta et al., 2016). Arginine and proline are key precursors for long-chain polyamines required for silica precipitation during cell wall formation in diatoms. These upregulated processes clearly reflect the specific adaptations and requirements of diatoms, i.e., the need to silicify while growing fast.
Environmental Variability and Its Effect on Taxonomic and Functional Diversity
Temperature and salinity have been frequently cited as critical environmental factors most subject to global change (Pachauri et al., 2014; Bindoff et al., 2019) and as major abiotic determinants of species growth and selective processes. Within the current study areas, the significant correlation of temperature and salinity with the community structure of the microeukaryotic plankton (Figures 4, 6) is therefore not surprising. Differences in temperature and salinity, however, might be only indications of different water masses or different stages of the seasonal succession and thus are not necessarily causative drivers of biological selection. Nevertheless, temperature and salinity at least can serve as associated proxies for potential biological variables or traits, which still need to be assigned. Increasing temperatures might lead to more conserved and similar gene expression patterns in the two regions, but increases in biodiversity could also reveal a higher plasticity of genes coding for metabolic traits. Under this scenario, while increases in temperature might potentially compensate losses in functional biodiversity, this could yield a more conserved and homogenous distribution of metabolic niches.
The observed shift from diatoms to dinoflagellates along the temperature gradient in west Greenland indicates that local diatom species and populations are potentially seasonally adapted to meet growth conditions in early spring when nutrients are high but temperatures still low (Wesławski et al., 2011; Michel et al., 2012). On the other hand, a higher net growth effect on dinoflagellates compared to diatoms may also be expected with increasing water temperatures in the pelagic zone. This net positive effect could indeed be integrative, e.g., synergistically including indirect effects for mixotrophic species due to a temperature effect on picoplankton growth as nutrients and an increase in thermal stratification.
Common patterns in diversity and gene expression are also associated with salinity gradients in the two regions, as salinity changes correlate with both decreased FS and KL values (Figure 8B). Significant increases in salinity could lead to a more conserved and similar profile of genes associated with particular metabolic functions, independent of the underlying community members. Although the direct selective pressure of salinity variation or gradients has not been demonstrated here, comparison of different salinity regimes (or associated biological variables) may yield evidence of differential metabolic performance of the communities, thereby affecting community composition by selecting for similar metabolic traits among various taxa. This is in line with a related study (Elferink et al., 2020), which indicated that salinity can affect ion homeostasis, and thereby have a strong overall effect on the community composition, i.e., species-specific responses reflect fitness variation among community members.
Variation in ammonium levels found in combination with more differentially expressed metatranscriptomes in the two regions and within major taxonomic groups may be partly explained by elevated grazing pressure. Higher ambient ammonium concentration can result from increased grazing activity yielding ammonium excretion. However, in contrast to salinity and temperature, shifts in ammonium concentrations do not result in striking shifts in ASV composition (Supplementary Table S3). Changes in ammonium levels might be better compensated by physiological and ecological adjustments in the diatom- and dinoflagellate-dominated communities, whereas increases in salinity and temperature rather homogenize functional diversity. This homogenization effect can increase competition, and hence species dominances will be shifted as niches are reduced. This hypothetical scenario is reflected by the relatively high number of ASV reads correlated with changes in temperature and salinity (Figure 4 and Supplementary Table S3), rather than nutrients.
Cell Size Effect on Taxonomic and Functional Diversity
The future ocean regime is expected to favor smaller-celled species (i.e., picoplankton over microplankton) that may adapt faster to changing environmental conditions (Morán et al., 2010; Acevedo-Trejos et al., 2014) because of smaller plastic genomes and higher reproductive rates—an r-selection strategy. It is less obvious how larger unicellular species might adapt, given the relatively higher complexity, but there is the potential for more plasticity via alternative K-strategies in spite of typically lower reproduction rates.
In all cases, a higher ASV overlap between the Greenland and Iceland sampling areas was observed with decreasing cell size. On-board optical microscopic observations of cell breakage and size-selection (Cembella, unpublished) of size-fractions obtained by low pressure mechanical sieving into micro-, nano-, and picoplankton (0.2–3 μm) size-fractions indicated that such fractionation generally works well for microeukaryotic plankton assemblages from Arctic and Subarctic waters (see also e.g., Kilias et al., 2014). Nevertheless, these size-fractions are largely operational, not based on objective criteria, and may therefore differ among studies. Our ASV overlaps between size-fractions and among regions is somewhat higher than observed in other studies (Kilias et al., 2014; De Vargas et al., 2015; Massana et al., 2015). Explanations for size-frequency overlap may include differences in life history stages (e.g., presence of small gametes or spores) and alternative cell forms, the ability to form chains or colonies, or partial digestion via grazers without damage to DNA sequence integrity. Although low vacuum pressure was applied during sample fractionation and filtration to minimize cell breakage or disruption of cells in chains, some of the ASV overlap may constitute handling artifacts and thus may influence apparent diversity of each size class. In particular, fragile cell groups such as naked dinoflagellates and ciliates might have experienced high amounts of cell breakage, as they were heavily weighted in the picoplankton size-fraction but also often well represented among the micro- and nanoplankton.
Changing abiotic conditions are expected to play a major role in determining biogeographical distribution, species-specific biomass and cell abundance, and in structuring microeukaryotic plankton communities. There are additional determinants of community composition, which (partly) explain the high diversity of the smaller phytoplankton, in particular. Within the current dataset, the picoplankton showed a higher ASV overlap between the Greenland and Iceland sampling areas and higher evenness among picoplankton samples, compared to the micro- and nanoplankton (Figures 3, 5A, 6). Such biogeographical similarity and ubiquity of the small-size phytoplankton community across regions has been shown before, as well as the high diversity and evenness of the smaller phytoplankton size-fraction within stations (López-García et al., 2001; Vaulot et al., 2008; De Vargas et al., 2015; Villarino et al., 2018). Cell size can be viewed as a prime parameter imposing both constraints and limiting adaptive flexibility upon ecophysiological responses to the environment, but conferring certain advantages in enhanced metabolic rates and cell growth. Larger cell size allows for more complexity, both in morphology and metabolic machinery, which accounts for more plasticity and hence a higher diversity of potential acclimation and adaptive responses. The compensatory cost is a typically lower reproductive rate and longer behavioral response time, especially to sudden regime shifts (e.g., melting process of ice or heatwaves). In contrast, smaller cells have an advantage with respect to their higher cell surface area to volume ratio, which favors higher nutrient uptake rate and optimal light utilization (Litchman et al., 2007), e.g., to maintain a positive growth under low nutrient concentrations (Aksnes and Egge, 1991). Thus, the high diversity and total abundance of small phytoplankton found here in Arctic and Subarctic waters may account for more specialization and speciation and could compensate for the potentially higher plasticity of the larger cell-size taxa (Wohlrab et al., 2018). Consequently, the apparent “niche” of the small phytoplankton reduces the competition for resources and promotes the co-existence of species within the same environment.
Cell size also plays a role in the dispersal patterns of microeukaryotic plankton within the ocean. Historically, it was assumed that phytoplankton is transported with ocean currents and thus dispersal barriers in the ocean do not exist. This paradigm is based upon open-ocean communities, whereas in coastal systems there may be rather distinct hydrodynamic barriers, e.g., fronts and coastal jet currents, extreme stratification, and fjordal circulation, to restrict dispersion. Phytoplankton diversity was believed to be controlled only by local environmental processes (i.e., “everything is everywhere, but the environment selects”; Baas-Becking, 1934). Such temporary retention zones within coastal systems created by hydrodynamic features at the submesoscale are expected to have a profound impact on community structure and selective pressure upon diversity among local populations.
In any case, the introduction of molecular methods to examine the genetic diversity of organisms has clearly shown that unrestricted dispersal does not exist (Foissner, 2006; Martiny et al., 2006; Hanson et al., 2012; De Vargas et al., 2015). One “physical barrier” within the plankton community may be the body size (or “cell” in the case of unicellular microeukaryotes). Villarino et al. (2018) stated that less-abundant large-bodied communities have significantly shorter dispersal scales and larger spatial species-turnover rates than more abundant small-bodied plankton. In line with this view, a limitation of dispersal of the larger phytoplankton has been hypothesized (Finlay, 2002; Soininen and Luoto, 2014). Within the current study, the higher overlap of ASVs (Figure 3) and thus higher similarity for the picoplankton between Greenland and Iceland coastal water than for the nano- and microplankton size-fraction (Figure 6) is consistent with these hypothetical selection mechanisms. This also means that seasonality and succession do not play such a major role in the distribution of smaller-sized cells (i.e., picoplankton), at least at the taxonomic level. However, although taxonomically similar, the communities might differ on the functional level within and between the two regions. Such a divergence of taxonomic similarity but functional difference has been shown for nanodinoflagellates in the North Sea (Wohlrab et al., 2018) and might indicate a high degree of plasticity in physiological functions that is sufficient to maintain community composition along environmental and successional gradients (Arrigo, 2005; Wohlrab et al., 2018). Such clonal selection mechanisms are an apparently common feature for diverse small-celled marine microbial species (Moore et al., 1998; Rodríguez et al., 2005; Johnson, 2006; Martiny et al., 2009; Demir-Hilton et al., 2011; Kashtan et al., 2014; von Dassow et al., 2015; Sohm et al., 2016; Seeleuthner et al., 2018). A clonal selection of different genotypes or ecotypes that can manifest in the emergence of different subpopulations can also explain the observed homogeny.
Conclusion
Seasonal patterns of microeukaryotic diversity are primarily associated with lifestyle differences in metabolic function and activity of diatom- or dinoflagellate-dominated communities in Arctic and Subarctic waters during summer. The mix of different strategies within and between these two taxonomic groups clearly restricts communities from becoming too homogeneous in their metabolic functional traits. This is important to maintain biodiversity and can have ecosystemwide consequences for the transfer of energy and matter to higher trophic levels.
Among abiotic factors considered herein, salinity and temperature were most strongly associated with microeukaryotic community structure and also metabolic trait expression in the representative region in the Arctic (west Greenland) and Subarctic (northwest Iceland). As a community response to climate change, especially linked to increasing water temperature, there are indications of more conserved and similar gene expression patterns, but diversity patterns reveal a high plasticity of genes coding for metabolic traits. Hence, while further increases in temperature might potentially compensate losses in functional biodiversity, this might yield a more conserved and homogenous distribution of metabolic niches.
The apparent homogenous distribution of the smaller-sized cells across the two regions indicates that they are less affected by changes in environmental conditions. This confers an apparent advantage of the small cell-size community compared to larger cells in response to environmental regime shifts. The basis of this size effect remains unresolved but could be attributed to a higher degree of physiological plasticity or to clonal selection and the emergence of different ecotypes.
Data Availability Statement
The datasets generated for this study can be found in NCBI GenBank, GenBank Accession No. PRJEB32397 (rRNA samples) and PRJEB37134 (mRNA samples).
Author Contributions
SE performed the data analysis and interpretation, drafted and wrote the manuscript, with significant contributions of SW. AC, SW, and UJ did the field sampling of plankton communities and collection of environmental data. SE and SN performed phylogenetic analysis of the ASV data. SE and SW performed DNA and RNA sequencing and analysis, while LH supported the metatranscriptome analyses. SE, SW, and UJ conceived the study design. All the authors contributed to the final version of the manuscript.
Funding
The expedition was conducted within the framework of the SCOR/IOC GEOHAB Core Research Project on HABs in Fjords and Coastal Embayments and was financially and logistically supported under the PACES II program of the Alfred Wegener Institute, Helmholtz Centre for Polar and Marine Research, Germany. The research was funded by the Ministry for Science and Culture of Lower Saxony and the Volkswagen Foundation through the Niedersächsisches Vorab Grant Program (Grant Number ZN3285).
Conflict of Interest
The authors declare that the research was conducted in the absence of any commercial or financial relationships that could be construed as a potential conflict of interest.
Acknowledgments
We thank the captain and crew of RV Maria S. Merian for assistance during the ship cruise. We are grateful to Daniela Meier, Daniela Voß, and Rohan Henkel (ICBM, Oldenburg University) for operating the conductivity/temperature/depth-water sampler, to Nancy Kühne and Annegret Müller (AWI) for technical support in the laboratory, and Claudia Burau and Kai-Uwe Ludwichowski (AWI) for nutrient analysis. We acknowledge colleagues at the Max Planck Genome Center (Cologne, Germany) for conducting the gene sequencing.
Supplementary Material
The Supplementary Material for this article can be found online at: https://www.frontiersin.org/articles/10.3389/fmars.2020.00439/full#supplementary-material
Footnotes
References
Acevedo-Trejos, E., Brandt, G., Steinacher, M., and Merico, A. (2014). A glimpse into the future composition of marine phytoplankton communities. Front. Mar. Sci. 1:15. doi: 10.3389/fmars.2014.00015
Aksnes, D. L., and Egge, J. K. (1991). A theoretical model for nutrient uptake in phytoplankton. Mar. Ecol. Prog. Ser. 70, 65–72. doi: 10.3354/meps070065
Alexander, H., Jenkins, B. D., Rynearson, T. A., and Dyhrman, S. T. (2015a). Metatranscriptome analyses indicate resource partitioning between diatoms in the field. Proc. Natl. Acad. Sci. U.S.A. 112:201421993. doi: 10.1073/pnas.1421993112
Alexander, H., Rouco, M., Haley, S. T., Wilson, S. T., Karl, D. M., and Dyhrman, S. T. (2015b). Functional group-specific traits drive phytoplankton dynamics in the oligotrophic ocean. Proc. Natl. Acad. Sci. U.S.A. 112, E5972–E5979. doi: 10.1073/pnas.1518165112
Allen, A. E., Dupont, C. L., Oborník, M., Horák, A., Nunes-Nesi, A., McCrow, J. P., et al. (2011). Evolution and metabolic significance of the urea cycle in photosynthetic diatoms. Nature 473, 203–207. doi: 10.1038/nature10074
Amir, A., McDonald, D., Navas-Molina, J. A., Kopylova, E., Morton, J. T., and Zech, et al. (2017). Deblur rapidly resolves single-nucleotide community sequence patterns. mSystems 2, 1–7. doi: 10.1128/mSystems.00191-16
Appeltans, W., Ahyong, S. T., Anderson, G., Angel, M. V., Artois, T., Bailly, N., et al. (2012). The magnitude of global marine species diversity. Curr. Biol. 22, 2189–2202. doi: 10.1016/j.cub.2012.09.036
Armstrong, F. A. J., Stearns, C. R., and Strickland, J. D. H. (1967). The measurement of upwelling and subsequent biological process by means of the Technicon Autoanalyzer® and associated equipment. Deep Sea Res. Oceanogr. Abstr. 14, 381–389. doi: 10.1016/0011-7471(67)90082-4
Arrigo, K. R. (2005). Marine microorganisms and global nutrient cycles. Nature 437, 349–356. doi: 10.1038/nature0415
Astthorsson, O. S., Gislason, A., and Jonsson, S. (2007). Climate variability and the Icelandic marine ecosystem. Deep. Res. Part II Top. Stud. Oceanogr. 54, 2456–2477. doi: 10.1016/j.dsr2.2007.07.030
Baas-Becking, L. G. M. (1934). Geobiologie of Inleiding tot de Milieukunde. The Hague: WP Van Stockum & Zoon.
Bateman, A. (2019). UniProt: a worldwide hub of protein knowledge. Nucleic Acids Res. 47, D506–D515. doi: 10.1093/nar/gky1049
Bates, D., Mächler, M., Bolker, B., and Walker, S. (2015). fitting linear mixed-effects models using lme4. J. Stat. Softw. 67, 201–210. doi: 10.18637/jss.v067.i01
Bindoff, N. L., Cheung, W. W. L., Kairo, J. G., Arístegui, J., Guinder, V. A., Hallberg, R., et al. (2019). “Changing ocean, marine ecosystems, and dependent communities,” in Special Report on Ocean and Cryosphere in a Changing Climate, eds H.-O. Pörtner, D. Roberts, V. Masson-Delmotte, and P. Zhai (Geneva: Intergovernmental Panel on Climate Change), 447–587.
Callahan, B. J., McMurdie, P. J., and Holmes, S. P. (2017). Exact sequence variants should replace operational taxonomic units in marker-gene data analysis. ISME J. 11, 2639–2643. doi: 10.1038/ismej.2017.119
Callahan, B. J., McMurdie, P. J., Rosen, M. J., Han, A. W., Johnson, A. J. A., and Holmes, S. P. (2016). DADA2: high-resolution sample inference from Illumina amplicon data. Nat. Methods 13, 581–583. doi: 10.1038/nmeth.3869
Cembella, A. D., Zielinski, O., Anderson, D. M., Graeve, M., Henkel, R., John, U., et al. (2016). ARCHEMHAB: Interactions and feedback mechanisms between hydrography, geochemical signatures and microbial ecology, with a focus on HAB species diversity, biogeography and dynamics - Cruise No. MSM 21/3 - July 25 - August 10, 2012 - Nuuk (Greenland) - Reyk. doi: 10.2312/cr_msm21_3.pdf
Connell, J. H. (1980). Diversity and the coevolution of competitors, or the ghost of competition past. Oikos 35, 131–138. doi: 10.2307/3544421
Cooper, E. D., Bentlage, B., Gibbons, T. R., Bachvaroff, T. R., and Delwiche, C. F. (2014). Metatranscriptome profiling of a harmful algal bloom. Harmful Algae 37, 75–83. doi: 10.1016/j.hal.2014.04.016
De Vargas, C., Audic, S., Henry, N., Decelle, J., Mahé, F., Logares, R., et al. (2015). Eukaryotic plankton diversity in the sunlit ocean. Science 348:12616051.
Degerlund, M., and Eilertsen, H. C. (2010). Main species characteristics of phytoplankton spring blooms in NE atlantic and arctic waters (68-80° N). Estuar. Coast. 33, 242–269. doi: 10.1007/s12237-009-9167-7
Demir-Hilton, E., Sudek, S., Cuvelier, M. L., Gentemann, C. L., Zehr, J. P., and Worden, A. Z. (2011). Global distribution patterns of distinct clades of the photosynthetic picoeukaryote Ostreococcus. ISME J. 5, 1095–1107. doi: 10.1038/ismej.2010.209
Dray, S., Legendre, P., and Blanchet, F. G. (2009). Packfor: Forward Selection With Permutation (Canoco p.46). Avaliable at: https://rdrr.io/rforge/packfor/.
Eberlein, K., and Kattner, G. (1987). Automatic method for the determination of ortho-phosphate and total dissolved phosphorus in the marine environment. Fresenius’. Z. Anal. Chem. 326, 354–357. doi: 10.1007/BF00469784
Eilertsen, H. C., Schei, B., and Taasen, J. P. (1981). Investigations on the plankton community of Bals-fjorden. Northern Norway. Sarsia 66, 129–141. doi: 10.1080/00364827.1981.10414530
Elferink, S., John, U., Neuhaus, S., and Wohlrab, S. (2020). Functional genomics differentiate inherent and environmentally influenced traits in dinoflagellate and diatom communities. Microorganisms 8:567. doi: 10.3390/microorganisms8040567
Elferink, S., Neuhaus, S., Wohlrab, S., Toebe, K., Voß, D., Gottschling, M., et al. (2017). Molecular diversity patterns among various phytoplankton size-fractions in West Greenland in late summer. Deep. Res. Part I Oceanogr. Res. Pap. 121, 54–69. doi: 10.1016/j.dsr.2016.11.002
Fernandes, D. A., Reid, J., and Macklaim, M. J. (2014). Unifying the analysis of high-throughput sequencing datasets: characterizing RNA-seq, 16S rRNA gene sequencing and selective growth experiments by compositional data analysis. Microbiome 2, 1–13.
Finlay, B. J. (2002). Global dispersal of free-living microbial eukaryote species. Science 296, 1061–1063. doi: 10.1126/science.1070710
Foissner, W. (2006). Biogeography of microorganisms: a brief review emphasizing protists. Acta Protozool. 45, 111–136.
Glibert, P. M. (2016). Margalef revisited: a new phytoplankton mandala incorporating twelve dimensions, including nutritional physiology. Harmful Algae 55, 25–30. doi: 10.1016/j.hal.2016.01.008
Glöckner, F. O., Yilmaz, P., Quast, C., Gerken, J., Beccati, A., Ciuprina, A., et al. (2017). 25 years of serving the community with ribosomal RNA gene reference databases and tools. J. Biotechnol. 261, 169–176. doi: 10.1016/j.jbiotec.2017.06.1198
Gloor, G. B., and Reid, G. (2016). Compositional analysis: a valid approach to analyze microbiome high-throughput sequencing data. Can. J. Microbiol. 62, 692–703. doi: 10.1139/cjm-2015-0821
Grasshoff, K., Ehrhardt, M., and Kremling, K. (eds) (1983). Methods of Seawater Analysis, 2nd Edn. Germany: John Wiley & Sons.
Guiry, M. D. (2012). How many species of algae are there? J. Phycol. 48, 1057–1063. doi: 10.1111/j.1529-8817.2012.01222.x
Hanson, C. A., Fuhrman, J. A., Horner-Devine, M. C., and Martiny, J. B. H. (2012). Beyond biogeographic patterns: processes shaping the microbial landscape. Nat. Rev. Microbiol. 10, 497–506. doi: 10.1038/nrmicro2795
Heiskanen, A. S., Haapala, J., and Gundersen, K. (1998). Sedimentation and pelagic retention of particulate C, N and P in the Coastal Northern Baltic Sea. Estuar. Coast. Shelf Sci. 46, 703–712. doi: 10.1006/ecss.1997.0320
Huisman, J., Johansson, A. M., Folmer, E. O., and Weissing, F. J. (2001). Towards a solution of the plankton paradox: the importance of physiology and life history. Ecol. Lett. 4, 408–411. doi: 10.1046/j.1461-0248.2001.00256.x
Huisman, J., and Weissing, J. (1999). Biodiversity of plankton by species oscillations and chaos. Nature 402, 407–410. doi: 10.1038/46540
Jiang, H., Seidenkrantz, M.-S., Knudsen, K. L., and Eiríksson, J. (2001). Diatom surface sediment assemblages around Iceland and their relationships to oceanic environmental variables. Mar. Micropaleontol. 41, 73–96. doi: 10.1016/S0377-8398(00)00053-0
John, U., Fensome, R. A., and Medlin, L. K. (2003). The application of a molecular clock based on molecular sequences and the fossil record to explain biogeographic distributions within the Alexandrium tamarense “species complex” (Dinophyceae). Mol. Biol. Evol. 20, 1015–1027. doi: 10.1093/molbev/msg105
Johnson, Z. I. (2006). Niche partitioning among Prochlorococcus ecotypes along ocean-scale environmental gradients. Science 311, 1737–1740. doi: 10.1126/science.1118052
Kashtan, N., Roggensack, S. E., Rodrigue, S., Thompson, J. W., Biller, S. J., Coe, A., et al. (2014). Single-cell genomics reveals hundreds of coexisting subpopulations in wild Prochlorococcus. Science. 344, 416–420. doi: 10.1126/science.1248575
Keeling, P. J., Burki, F., Wilcox, H. M., Allam, B., Allen, E. E., Amaral-Zettler, L. A., et al. (2014). The marine microbial eukaryote transcriptome sequencing project (MMETSP): illuminating the functional diversity of eukaryotic life in the oceans through transcriptome sequencing. PLoS Biol. 12:e1001889. doi: 10.1371/journal.pbio.1001889
Kilias, E. S., Nöthig, E. M., Wolf, C., and Metfies, K. (2014). Picoeukaryote plankton composition off West Spitsbergen at the entrance to the Arctic Ocean. J. Eukaryot. Microbiol. 61, 569–579. doi: 10.1111/jeu.12134
Koroleff, F. (1969). Direct determination of ammonia in natural waters as indophenol blue. Int. Con. Explor. Sea 9, 1–6.
Krawczyk, D. W., Witkowski, A., Waniek, J. J., Wroniecki, M., and Harff, J. (2014). Description of diatoms from the Southwest to West Greenland coastal and open marine waters. Polar Biol. 37, 1589–1606. doi: 10.1007/s00300-014-1546-2
Krell, A., Funck, D., Plettner, I., John, U., and Dieckmann, G. (2007). Regulation of proline metabolism under salt stress in the psychrophilic diatom Fragilariopsis cylindrus (Bacillariophyceae). J. Phycol. 43, 753–762. doi: 10.1111/j.1529-8817.2007.00366.x
Kretschmann, J., Filipowicz, N. H., Owsianny, P. M., Zinssmeister, C., and Gottschling, M. (2015). Taxonomic clarification of the unusual dinophyte Gymnodinium limneticum Wołosz. (Gymnodiniaceae) from the Tatra Mountains. Protist 166, 621–637. doi: 10.1016/j.protis.2015.09.002
Legendre, P., and Gallagher, E. D. (2001). Ecologically meaningful transformations for ordination of species data. Oecologia 129, 271–280. doi: 10.1007/s004420100716
Litchman, E., de Tezanos Pinto, P., Klausmeier, C. A., Thomas, M. K., and Yoshiyama, K. (2010). Linking traits to species diversity and community structure in phytoplankton. Hydrobiologia 653, 15–28. doi: 10.1007/s10750-010-0341-5
Litchman, E., Klausmeier, C. A., Schofield, O. M., and Falkowski, P. G. (2007). The role of functional traits and trade-offs in structuring phytoplankton communities: Scaling from cellular to ecosystem level. Ecol. Lett. 10, 1170–1181. doi: 10.1111/j.1461-0248.2007.01117.x
López-García, P., Rodríguez-Valera, F., Pedrós-Alió, C., and Moreira, D. (2001). Unexpected diversity of small eukaryotes in deep-sea Antarctic plankton. Nature 409, 603–607. doi: 10.1038/35054537
Love, M. I., Huber, W., and Anders, S. (2014). Moderated estimation of fold change and dispersion for RNA-seq data with DESeq2. Genome Biol. 15, 1–21. doi: 10.1186/s13059-014-0550-8
Malviya, S., Scalco, E., Audic, S., Vincent, F., Veluchamy, A., Bittner, L., et al. (2016). Insights into global diatom distribution and diversity in the world’s ocean. Proc. Natl. Acad. Sci. U.S.A. 348:201509523. doi: 10.1073/pnas.1509523113
Marchetti, A., Schruth, D. M., Durkin, C. A., Parker, M. S., Kodner, R. B., Berthiaume, C. T., et al. (2012). Comparative metatranscriptomics identifies molecular bases for the physiological responses of phytoplankton to varying iron availability. Proc. Natl. Acad. Sci. U.S.A. 109, E317–E325. doi: 10.1073/pnas.1118408109
Martin, M. (2011). Cutadapt removes adapter sequences from high-throughput sequencing reads. EMBnet J. 17, 10–12. doi: 10.14806/ej.17.1.200
Martínez, O., and Reyes-Valdés, M. H. (2008). Defining diversity, specialization, and gene specificity in transcriptomes through information theory. Proc. Natl. Acad. Sci. U.S.A. 105, 9709–9714. doi: 10.1073/pnas.0803479105
Martiny, A. C., Huang, Y., and Li, W. (2009). Occurrence of phosphate acquisition genes in Prochlorococcus cells from different ocean regions. Environ. Microbiol. 11, 1340–1347. doi: 10.1111/j.1462-2920.2009.01860.x
Martiny, J. B. H., Bohannan, B. J. M., Brown, J. H., Colwell, R. K., Fuhrman, J. A., and Green, J. L. (2006). Microbial biogeography: putting microorganisms on the map. Nat. Rev. Microbiol. 4, 102–112. doi: 10.1038/nrmicro1341
Massana, R., Gobet, A., Audic, S., Bass, D., Bittner, L., Boutte, C., et al. (2015). Marine protist diversity in European coastal waters and sediments as revealed by high-throughput sequencing. Environ. Microbiol. 17, 4035–4049. doi: 10.1111/1462-2920.12955
McMurdie, P. J., and Holmes, S. (2014). Waste not, want not: why rarefying microbiome data is inadmissible. PLoS Comput. Biol. 10:e1003531. doi: 10.1371/journal.pcbi.1003531
Medlin, L. K., Lange, M., Wellbrock, U., Donner, G., Elbrächter, M., Hummert, C., et al. (1998). Sequence comparisons link toxic European isolates of Alexandrium tamarense from the Orkney Isands to toxic North American stocks. Eur. J. Protistol. 34, 329–335. doi: 10.1016/s0932-4739(98)80060-6
Meire, L., Mortensen, J., Meire, P., Juul-Pedersen, T., Sejr, M. K., Rysgaard, S., et al. (2017). Marine-terminating glaciers sustain high productivity in Greenland fjords. Glob. Chang. Biol. 23, 5344–5357. doi: 10.1111/gcb.13801
Menden-Deuer, S., and Rowlett, J. (2014). Many ways to stay in the game: individual variability maintains high biodiversity in planktonic microorganisms. J. R. Soc. Interface 11:20140031. doi: 10.1098/rsif.2014.0031
Michel, C., Bluhm, B., Gallucci, V., Gaston, A. J., Gordillo, F. J. L., Gradinger, R., et al. (2012). Biodiversity of Arctic marine ecosystems and responses to climate change. Biodiversity 13, 200–214. doi: 10.1080/14888386.2012.724048
Moniz, M. B. J., and Kaczmarska, I. (2009). Barcoding diatoms: is there a good marker? Mol. Ecol. Resour. 9, 65–74. doi: 10.1111/j.1755-0998.2009.02633.x
Moore, L. R., Rocap, G., and Chisholm, S. W. (1998). Physiology and molecular phylogeny of coexisting Prochlorococcus ecotypes. Nature 393, 464–467. doi: 10.1038/30965
Mora, C., Tittensor, D. P., Adl, S., Simpson, A. G. B., and Worm, B. (2011). How many species are there on earth and in the ocean? PLoS Biol. 9:e1001127. doi: 10.1371/journal.pbio.1001127
Morán, X. A. G., López-Urrutia, Á, Calvo-Díaz, A., and Li, W. K. W. (2010). Increasing importance of small phytoplankton in a warmer ocean. Glob. Chang. Biol. 16, 1137–1144. doi: 10.1111/j.1365-2486.2009.01960.x
Oksanen, J., Blanchet, F. G., Kindt, R., Legendre, P., Minchin, P. R., O’Hara, R. B., et al. (2013). Package ‘vegan.’. R Packag. ver. 2.0– 8. 254.
Pachauri, R. K., Allen, M. R., Barros, V. R., Broome, J., Cramer, W., Christ, R., et al. (2014). Climate Change 2014: Synthesis Report. Contribution of Working Groups I, II and III to the Fifth Assessment Report of the Intergovernmental Panel on Climate Change. Geneva: IPCC.
Pearson, G. A., Lago-Leston, A., Cánovas, F., Cox, C. J., Verret, F., Lasternas, S., et al. (2015). Metatranscriptomes reveal functional variation in diatom communities from the Antarctic Peninsula. ISME J. 9, 2275–2289. doi: 10.1038/ismej.2015.40
R Core Team (2016). R: A Language and Environment for Statistical Computing. Vienna: R Foundation for Statistical Computing.
Ramond, P., Sourisseau, M., Simon, N., Romac, S., Schmitt, S., Rigaut-Jalabert, F., et al. (2019). Coupling between taxonomic and functional diversity in protistan coastal communities. Environ. Microbiol. 21, 730–749. doi: 10.1111/1462-2920.14537
Rao, C. R. (1995). A review of canonical coordinates and an alternative to correspondence analysis using hellinger distance. Questiió Quad. Estadística, Sist. Inform. Investig. Oper. 19, 23–63.
Reeder, J., and Knight, R. (2009). The “rare biosphere”: a reality check. Nat. Methods 6, 636–637. doi: 10.1038/nmeth0909-636
Reynolds, C. S. (2002). Towards a functional classification of the freshwater phytoplankton. J. Plankton Res. 24, 417–428. doi: 10.1093/plankt/24.5.417
Richerson, P., Armstrong, R., and Goldman, C. R. (1970). Contemporaneous disequilibrium, a new hypothesis to explain the “paradox of the plankton”. Proc. Natl. Acad. Sci. U.S.A. 67, 1710–1714. doi: 10.1073/pnas.67.4.1710
Rodríguez, F., Derelle, E., Guillou, L., Le Gall, F., Vaulot, D., and Moreau, H. (2005). Ecotype diversity in the marine picoeukaryote Ostreococcus (Chlorophyta. Prasinophyceae). Environ. Microbiol. 7, 853–859. doi: 10.1111/j.1462-2920.2005.00758.x
Rokitta, S. D., von Dassow, P., Rost, B., and John, U. (2016). P- and N-Depletion trigger similar cellular responses to promote senescence in eukaryotic phytoplankton. Front. Mar. Sci. 3:109. doi: 10.3389/fmars.2016.00109
Roy, S., and Chattopadhyay, J. (2007). Towards a resolution of “the paradox of the plankton”: a brief overview of the proposed mechanisms. Ecol. Complex 4, 26–33. doi: 10.1016/j.ecocom.2007.02.016
Seeleuthner, Y., Mondy, S., Lombard, V., Carradec, Q., Pelletier, E., Wessner, M., et al. (2018). Single-cell genomics of multiple uncultured stramenopiles reveals underestimated functional diversity across oceans. Nat. Commun. 9:310. doi: 10.1038/s41467-017-02235-3
Sohm, J. A., Ahlgren, N. A., Thomson, Z. J., Williams, C., Moffett, J. W., Saito, M. A., et al. (2016). Co-occurring Synechococcus ecotypes occupy four major oceanic regimes defined by temperature, macronutrients and iron. ISME J. 10, 333–345. doi: 10.1038/ismej.2015.115
Soininen, J., and Luoto, M. (2014). Predictability in species distributions: a global analysis across organisms and ecosystems. Glob. Ecol. Biogeogr. 23, 1264–1274. doi: 10.1111/geb.12204
Sonnenberg, R., Nolte, A. W., and Tautz, D. (2007). An evaluation of LSU rDNA D1-D2 sequences for their use in species identification. Front. Zool. 4:6. doi: 10.1186/1742-9994-4-6
Thomas, M. K., Kremer, C. T., Klausmeier, C. A., and Litchman, E. (2012). A global pattern of thermal adaptation in marine phytoplankton. Science 338, 1085–1089. doi: 10.1126/science.1224836
Toebe, K., Alpermann, T. J., Tillmann, U., Krock, B., Cembella, A., and John, U. (2013). Molecular discrimination of toxic and non-toxic Alexandrium species (Dinophyta) in natural phytoplankton assemblages from the Scottish coast of the North Sea. Eur. J. Phycol. 48, 12–26. doi: 10.1080/09670262.2012.752870
Vaulot, D., Eikrem, W., Viprey, M., and Moreau, H. (2008). The diversity of small eukaryotic phytoplankton (≤3 μm) in marine ecosystems. FEMS Microbiol. Rev. 32, 795–820. doi: 10.1111/j.1574-6976.2008.00121.x
Vavrek, M. J. (2011). Fossil: palaeoecological and Palaeogeographical Analysis Tools. Palaeontol. Electron. 14:16.
Vergin, K. L., Beszteri, B., Monier, A., Thrash, J. C., Temperton, B., Treusch, A. H., et al. (2013). High-resolution SAR11 ecotype dynamics at the Bermuda Atlantic Time-series Study site by phylogenetic placement of pyrosequences. ISME J. 7, 1322–1332. doi: 10.1038/ismej.2013.32
Villarino, E., Watson, J. R., Jönsson, B., Gasol, J. M., Salazar, G., Acinas, S. G., et al. (2018). Large-scale ocean connectivity and planktonic body size. Nat. Commun. 9:142. doi: 10.1038/s41467-017-02535-8
von Dassow, P., John, U., Ogata, H., Probert, I., Bendif, E. M., Kegel, J. U., et al. (2015). Life-cycle modification in open oceans accounts for genome variability in a cosmopolitan phytoplankton. ISME J. 9, 1365–1377. doi: 10.1038/ismej.2014.221
Wasmund, N., Kownacka, J., Göbel, J., Jaanus, A., Johansen, M., Jurgensone, I., et al. (2017). The diatom/dinoflagellate index as an indicator of ecosystem changes in the Baltic Sea 1. principle and handling instruction. Front. Mar. Sci. 4:22. doi: 10.3389/FMARS.2017.00022
Wesławski, J. M., Kendall, M. A., Włodarska-Kowalczuk, M., Iken, K., Kedra, M., Legezynska, J., et al. (2011). Climate change effects on Arctic fjord and coastal macrobenthic diversity-observations and predictions. Mar. Biodivers. 41, 71–85. doi: 10.1007/s12526-010-0073-9
Wohlrab, S., Falcke, J. M., Lin, S., Zhang, H., Neuhaus, S., Elferink, S., et al. (2018). Metatranscriptome profiling indicates size-dependent differentiation in plastic and conserved community traits and functional diversification in dinoflagellate communities. Front. Mar. Sci. 5:358. doi: 10.3389/fmars.2018.00358
Wohlrab, S., Selander, E., and John, U. (2017). Predator cues reduce intraspecific trait variability in a marine dinoflagellate. BMC Ecol. 17:8. doi: 10.1186/s12898-017-0119-y
Zamora-Terol, S., Nielsen, T. G., and Saiz, E. (2013). Plankton community structure and role of oithona similis on the western coast of greenland during the winter-spring transition. Mar. Ecol. Prog. Ser. 483, 85–102. doi: 10.3354/meps10288
Keywords: arctic microplankton, DNA-barcoding, metabolic processes, microeukaryotic community, marine pelagic community, picoplankton
Citation: Elferink S, Wohlrab S, Neuhaus S, Cembella A, Harms L and John U (2020) Comparative Metabarcoding and Metatranscriptomic Analysis of Microeukaryotes Within Coastal Surface Waters of West Greenland and Northwest Iceland. Front. Mar. Sci. 7:439. doi: 10.3389/fmars.2020.00439
Received: 18 December 2019; Accepted: 19 May 2020;
Published: 26 June 2020.
Edited by:
Haiwei Luo, The Chinese University of Hong Kong, ChinaReviewed by:
Adriana Zingone, Stazione Zoologica Anton Dohrn, ItalyWiebe Hendrik Cornelis Frederik Kooistra, Stazione Zoologica Anton Dohrn, Italy
Copyright © 2020 Elferink, Wohlrab, Neuhaus, Cembella, Harms and John. This is an open-access article distributed under the terms of the Creative Commons Attribution License (CC BY). The use, distribution or reproduction in other forums is permitted, provided the original author(s) and the copyright owner(s) are credited and that the original publication in this journal is cited, in accordance with accepted academic practice. No use, distribution or reproduction is permitted which does not comply with these terms.
*Correspondence: Stephanie Elferink, c3RlcGhhbmllLndlc3RwaGFsQGF3aS5kZQ==; Uwe John, dXdlLmpvaG5AYXdpLmRl