 Thor N. Markussen1†
 Christian Konrad2,3
 Christoph Waldmann3
 Marius Becker4
 Gerhard Fischer3,5
 Morten H. Iversen2,3,5*
- 1Department of Geosciences and Natural Resource Management, Faculty of Science, University of Copenhagen, Copenhagen, Denmark
- 2Helmholtz Young Investigator Group SeaPump, Alfred Wegener Institute for Polar and Marine Research, Bremerhaven, Germany
- 3MARUM Center for Marine Environmental Sciences, University of Bremen, Bremen, Germany
- 4Institute of Geosciences, Faculty of Mathematics and Natural Sciences, University of Kiel, Kiel, Germany
- 5Geosciences Department, University of Bremen, Bremen, Germany
Settling marine aggregates, such as zooplankton fecal pellets and marine snow, transport organic matter from the surface ocean to the deep sea and are largely responsible for the ocean’s sequestration of carbon. However, our understanding of the functioning of the biological pump and the distribution of particulate organic matter in the water column often hinge on limited bulk data from sediment traps, large volume filtration or instantaneous snap-shots from in situ optical systems that only see a small part of the particle and aggregate spectra. We evaluated the added value of combining different optical systems to detect a range of organic and inorganic particle types during a case-study in the Cape Blanc upwelling region. Laboratory calibrations showed that one camera system detected large organic aggregates well and in situ data showed that it correlated positively with fluorescence. The other camera was better at detecting small, mainly inorganic particles which were not seen by the first camera and correlated positively with turbidity. The combined deployments of the two optical systems together with fluorescence and turbidity sensors showed potentials for added insights into spatial (depth) and temporal (diurnal) particle dynamics. The case study exemplified the different efficiencies of two camera systems to detect particles of different types in marine waters. From this, the results highlighted the importance of discriminating between qualitative and quantitative ranges of imaging systems, in order to understand the quantitative range of sizes as well as types of particles detected by a given system. This is especially important when optical systems are used to estimate carbon fluxes and particulate organic matter distribution in the water column from vertical profiles of particle size-distribution and abundance.
Introduction
The formation, distribution and transport of organic particles and aggregates from the surface ocean to the deep sea drives the biological carbon pump and, ultimately, the sequestration of organic matter at the seafloor. The magnitude and efficiency of organic matter export from the surface layers of the ocean is determined by the attenuation processes in the epipelagic zone, the upper roughly 200 m of the water column (Stemmann et al., 2004; Iversen and Ploug, 2010; Jackson and Checkley, 2011). However, our knowledge about particle and aggregate transport and transformation in the epipelagic zone is very limited. This is due to the heterogeneous nature of in situ aggregates, where one pool of particles and aggregates at any depth consists of different types with different age, origin, composition and sinking velocities (Iversen and Ploug, 2010). Hence, particles and aggregates at a specific depth may be a cluster of small single-celled phytoplankton and individual mineral particles, as well as large marine snow and fecal pellets formed from a mixture of organic and inorganic particles (e.g., lithogenic material). These particles and aggregates may range in size from μm to cm and generally sink between one to several hundred m per day (Simon et al., 2002; Iversen and Ploug, 2010; Turner, 2015). Furthermore, they may be from days to weeks old with origins in the surface ocean directly above or hundreds of km away (e.g., Siegel and Deuser, 1997; Iversen et al., 2010; Wekerle et al., 2018). This complicates our understanding of transport and transformation of settling organic matter, especially when studying bulk samples and averaging across all particle and aggregate types.
Inclusion of lithogenic and biogenic minerals within marine snow and fecal pellets has been shown to increase their density and size-specific sinking velocities (Passow and De La Rocha, 2006; De La Rocha et al., 2008; Iversen and Ploug, 2010; van der Jagt et al., 2018, Many et al., 2019). However, incorporation of mineral particles into marine snow can cause them to fragment into small and dense aggregates (Passow and De La Rocha, 2006; Engel et al., 2009) with higher size-specific sinking velocities than similar sized non-ballasted aggregates (Ploug et al., 2008; Iversen and Ploug, 2010; Iversen and Robert, 2015). This suggests that similar sized aggregates at any given depth in the water column may consist of a mixture of aggregates of widely different composition, densities, and sinking velocities, showing that size alone is a poor measure for aggregate settling and dynamics. While in situ camera systems are good at capturing sizes and abundance of particles and aggregates through the water column, they provide little direct information about aggregate composition and density. It is therefore difficult to extract information about mass and sinking velocities of the aggregates, which, however, is required to determine and understand the downward vertical flux of matter in the ocean.
Recent studies have combined in situ camera systems with sediment trap measurements to estimate regional and seasonal particulate organic carbon flux (e.g., Guidi et al., 2008; Iversen et al., 2010; McDonnell and Buesseler, 2010; Nowald et al., 2015; Fender et al., 2019). However, this is biased by the fact that sediment traps and camera systems may capture different particles and aggregates. A sediment trap collects all settling particles and aggregates at one depth over time and area, while a camera system determines instantaneous concentrations of both settling and suspended particles through the water column. Thus, the size-range of captured particles differs between camera systems and sediment traps. Minimum particle sizes captured by camera systems are determined by their optical resolution, while the capture efficiency of small particles by sediment traps are determined by the sinking velocities of the particles. Since large particles and aggregates are often rare in the water column, the maximum particle sizes captured by camera systems is determined by their concentrations in relation to the volume of water imaged by the camera systems and the duration of sampling by the sediment traps (Jackson and Checkley, 2011). Furthermore, conventional sediment traps lack information about individual particles but allow bulk biogeochemical analyses. In contrast, traps filled with viscous gels preserve the shape, size, and structure of each individual particle collected (Lundsgaard, 1995; Waite and Nodder, 2001; Ebersbach and Trull, 2008; Thiele et al., 2015). It is therefore difficult to evaluate if sediment traps and camera systems deployed at the same depth and region will capture similar particle and aggregate types.
Camera systems differ in configurations and, consequently, captured particle size ranges are not the same. More importantly, the configurations of individual camera systems also affect the particle types that the systems detect. For instance, holographic cameras can capture transparent particles (e.g., Bochdansky et al., 2013), Optical Laser Diffraction Instruments (e.g., LISST, Sequoia Sci) can size and count small particles (e.g., Graham et al., 2012; Markussen and Andersen, 2014; Gillard et al., 2019), while more traditional camera systems require particles that either shadow or reflect light, depending on whether the illumination is provided from the back, sides, or front (e.g., Ratmeyer and Wefer, 1996; Davis et al., 2005; Picheral et al., 2010; Lombard et al., 2019). Knowing the advantages and limitations of each applied system and using combinations of different optical systems together with sediment traps may allow detection of a wider range of particle types and provide information about aggregate and particle composition and dynamics (Jackson et al., 1997).
We evaluated two camera systems (Pcam and IRcam) in the laboratory and could show that they detected different particle types. Subsequently, we carried out a case study in which we combined several in situ optical systems (the two different camera systems, images of gel traps plus a CTD with a turbidity and fluorescence sensor) with drifting gel trap collections in the upper 250 m of the water column off Cape Blanc, Mauritania. The camera systems were deployed both as profiling from the ship’s winch system and drifting on a sediment trap array. We show examples of the added value of combining optical systems, but also highlight a few but important pitfalls and caveats when working with such systems.
Materials and Methods
Instruments Used
We tested the added value of simultaneously using two complementary camera systems which detected different particle types. The first camera system, the Pcam, was designed to detect and focus on lithogenic particles while the second camera system, the IRcam, images large, potentially organic, aggregates. The camera systems were calibrated in controlled laboratory settings prior to in situ deployment during the case study in the Cape Blanc upwelling region. The calibrations and comparisons between the Pcam and IRcam were made for different aggregate types and the size-detections by the two systems were calibrated against Coulter Counter measurements of the same particles. In the case study, both camera systems were deployed in a profiling mode in concert with a SeaBird SBE-19 CTD equipped with an oxygen sensor, a CHELSEA-fluorometer, and a WETLABS turbidity sensor, as well as in a drifting mode on sediment trap arrays together with gel traps.
Pcam
The Pcam consisted of a Canon D70 digital SLR camera with a 60 mm Canon EF-S macro lens inside a pressure housing rated to a depth of 300 m. The pixel size was 4.1 μm with a 1:1 aspect ratio, and a field of view of 22 × 15 × 5 mm (W×H×D). This provided a measuring volume of 1.69 × 10⁻³ L. The light source was a green (520 nm) 120 mW (max. output) laser with the beam collimated and spread to a sheet using line generating optics. The Pcam was originally designed and calibrated for use in highly turbid estuarine environments, where a strong and very precise light source is needed (Markussen et al., 2016). However, the laser sheet has two different positions to adjust to different particle concentrations, one position 2 mm from the pressure housing, and one position 10 mm from the house. The second position was used in this study, due to the relatively low particle concentrations in open marine waters. The camera was expected to quantitatively measure particles with equivalent spherical diameters (ESDs) between 10 and 1500 μm. Images were stored on an SD card in the camera and downloaded to a computer through a Raspberry Pi in the camera system. Processing of Pcam images was carried out using the ParChar code (Markussen, 2016).
IRcam
The IRcam consisted of an infrared camera (Basler) connected to a Raspberry Pi and equipped with a fixed focal length lens (16 mm Edmund Optics). The illumination was provided by an infrared LED (wavelength between 700–1000 nm) that was equipped as backlight, providing shadow images of the particle and aggregates. The IRcam captured two-three images per second. Each image had a field of view of 35 × 26.4 × 10 mm (W×H×D), yielding a measuring volume of 9.24 × 10⁻³ L. The pixel size was 27.8 μm and the camera was expected to quantitatively capture aggregates and particles with ESDs between 50 and 6000 μm. All images were stored on a hard drive and downloaded to a computer after each deployment via an Ethernet connection through the pressure housing. The same Ethernet connection was used to program the camera system before deployment. The image analyses were performed using the Image Processing Toolbox in MatLab (The MathWorks) using a method resembling that of the ParChar code (Markussen, 2016). Each image was converted into gray scale and the background was removed by applying a threshold value. The pixel numbers for each projected particle area was determined, and converted into ESD using the pixels to mm ratio. If particles were porous (contained holes), these areas would not be included as part of the particle area, i.e., we did not apply a ‘fill hole’ function, and all optical methods in this study would not include those areas as part of the particle when calculating the ESDs. Calibrations were done in the laboratory before field deployments by comparing the frequency size distribution of different particle types to Coulter Counter measurements. Since we excluded pore-spaces in our ESD calculations, the ESD should be considered as solid mass diameter, which is similar to how a Coulter Counter considers sizes (e.g., Jackson et al., 1997).
Both camera systems were deployed simultaneously on one frame. The size of a particle was determined from its area and converted into ESD. Detected particles were sorted into 50 logarithmically spaced size bins based on their ESDs. The particle size distributions (nC) were calculated from the particle number concentration (ΔNC) within a given size range (Δd) of each image:
Sediment Gel Traps
Settling particles were collected at three depths using surface-tethered, freely drifting sediment traps filled with a viscous gel. The drifting traps were deployed as a drifting array that consists of a surface buoy equipped with a GPS satellite transmitter, four surface floats and 12 small buoyancy balls serving as wave breakers to reduce the hydrodynamic effects on the traps. Four gimbal mounted collection trap cylinders (100 × 10.4 cm) were deployed at 150, 200, and 400 m, respectively. At each depth, one of the collection cylinders was equipped with a gel-insert that was filled with 200 ml of a viscous gel (Tissue-Tek®, O.C.T.TM COMPOUND, Sakura) to intercept and preserve settling particles without destroying their original size and structure. Upon recovery, we allowed the particles a settling period of 12 h before we removed the gel-inserts from trap cylinders. The two in situ camera systems were deployed as part of the drifting array at 100 m depth and thus, in this study, we only focus on the gel trap collection from 150 m.
After retrieval, the gels were photographed using a Canon EOS Rebel T2i and a Sigma 105 mm Macro Lens. The images were illuminated with an even backlight. Each image had a field of view of 29.8 × 19.9 mm and a resolution of 5.75 μm per pixel and was expected to detect particles with ESDs from 10 μm to 3000 μm. The image analyses were again performed with a routine written in Matlab (The Mathworks). The obtained particle sizes for each gel trap were divided into 50 logarithmically spaced size bins. These bins were used to calculate the particle flux size spectrum (f) as a function of diameter (d), by dividing the flux of particles (ΔNF) in a given small size range (Δd) from the collection interval (Δt) (Jackson et al., 2005):
Acoustic Doppler Current Profiler (ADCP)
An ADCP (RDI, 600 kHz) was mounted on a frame and deployed from the ship in down-looking configuration at 50 m depth during the night of the drifting deployment. The cell size was set to 4 m and the time between pings to 30 s. In this study, we only used the acoustic backscatter profile. Backscatter (dB) was derived from the raw echo intensities (counts) correcting for beam spreading and water absorption (Mullison, 2017). Analysis was based on relative backscatter and the instrumental constant was omitted. The absorption coefficient (0.17 dB/m) was calculated according to Ainslie and McColm (1998) using average values for salinity and temperature, obtained from CTD data. The near-field correction was performed following Downing et al. (1994).
Case Study Region Off Cape Blanc, Mauritania
The Atlantic Ocean region off Cape Blanc in Mauritania, NW Africa, served as a case study site to evaluate the added value of deploying different optical systems simultaneously (Figure 1). This region is part of the Canary Current System, which is one of the four major Eastern Boundary Upwelling Ecosystems with a primary productivity of ∼0.33 Gt per year (Carr, 2002). This high production is supported by the year-round coastal upwelling of nutrient-rich deep water (Gabric et al., 1993; Cropper et al., 2014). Furthermore, this region has high dust deposition (Mahowald et al., 1999; Jickells et al., 2005). The combination of high productivity and high dust deposition makes this region optimal for our case study of the combined optical systems optimized for organic and lithogenic material. Numerous particle and export studies have been conducted in the region, including long-term sediment trap moorings that have measured seasonal fluxes since 1998 (Karakaş et al., 2006, 2009; Fischer and Karakaş, 2009; Fischer et al., 2009, 2016; Iversen et al., 2010; Nowald et al., 2015), as well as several studies combining optical measurements using camera systems and vertical flux measurements using sediment traps (Karakaş et al., 2009; Iversen et al., 2010; Nowald et al., 2015). Generally, these studies have shown large flux attenuation in the upper 250 m of the water column off Cape Blanc, suggesting that these depths have the highest rates of particle transformation and turnover (Iversen et al., 2010).
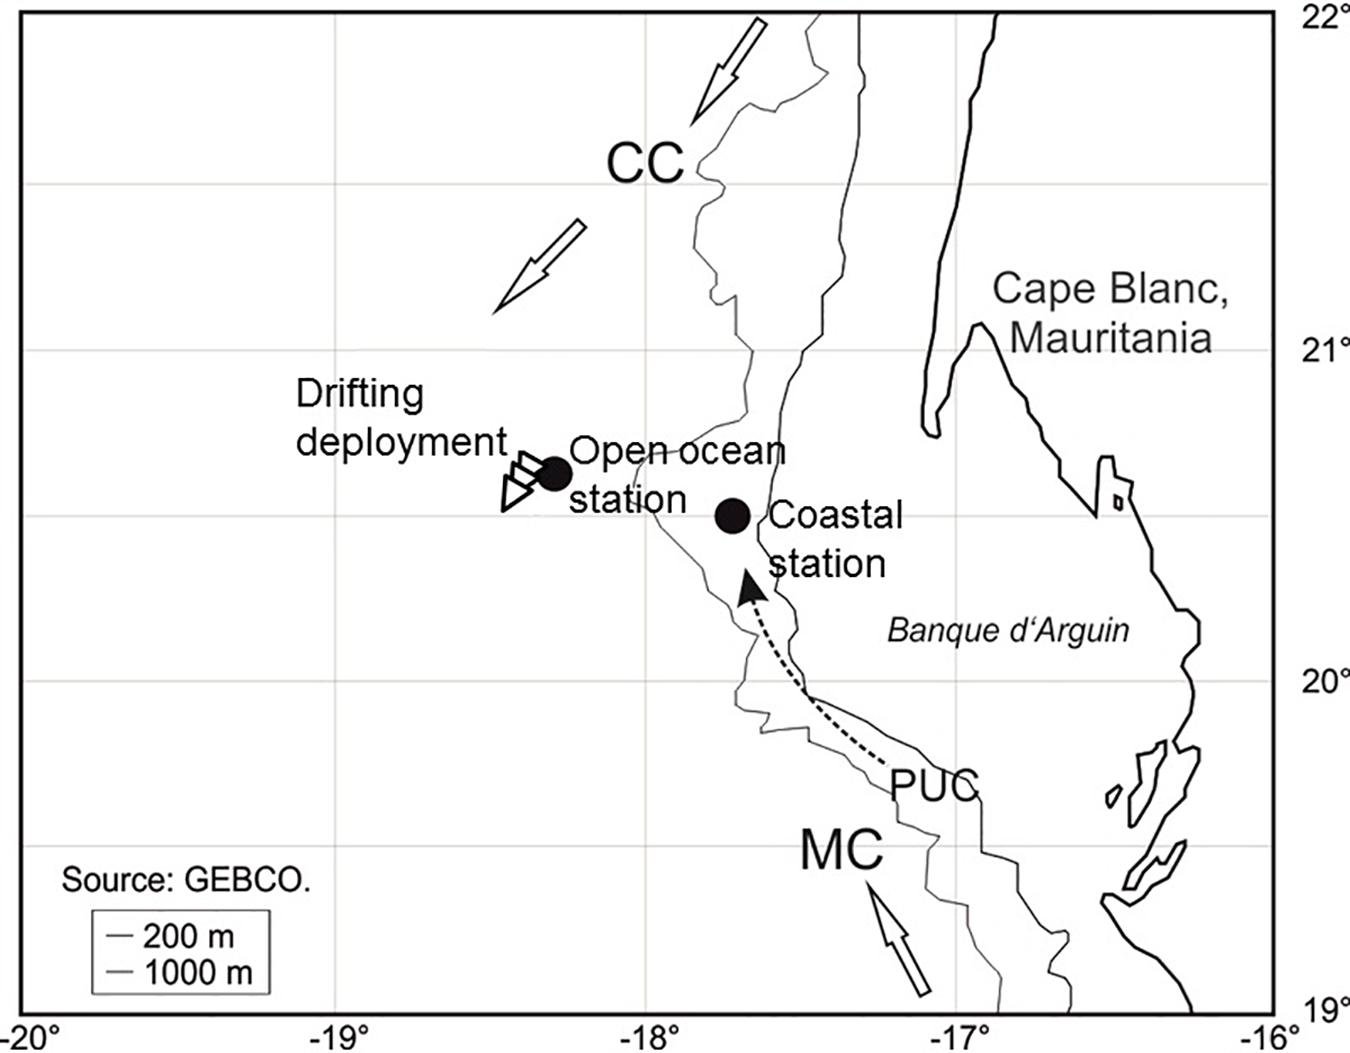
Figure 1. Location of the drifting deployment and the two profiling stations during POS cruise 481 (see Table 1 for more information). The three arrows show the direction and trajectory of the drifting deployment. CC, Canary Current; MC, Mauritanian Current; PUC, Poleward Undercurrent (=slope current).
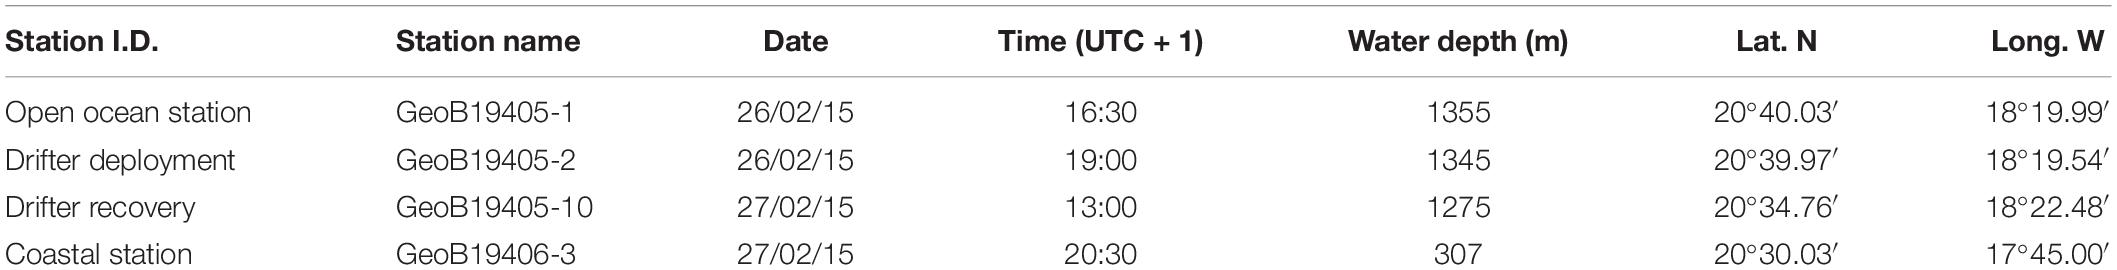
Table 1. Overview and metadata of the three deployments, including Station identification (Station I.D.), station name, date, time, full water depth, latitude (Lat. N) and longitude (Long. W).
Field Sampling
The case study was done during the R/V Poseidon cruise POS481 from the 15th of February to the 3rd of March, 2015. The data presented here consisted of two vertical profiles and one 18 h drifting deployment. One profile location was in an off-shore, open ocean setting and the other profile location was closer to the coast at the shelf-slope (Figure 1 and Table 1). The drifting deployment was launched from the location of the off-shore, open ocean station.
Results
Laboratory Evaluation of Particle Detection by the Two Camera Systems
We compared the detection of different particle types for the Pcam and the IRcam in the laboratory. Three calibrations are presented based on two different particles types; inorganic lithogenic material (sand and sediment) and transparent particles (glass spheres). The results from the cameras were tested against distributions measured by a Coulter Counter. The IRcam primarily detected grains with sizes larger than 150 μm and, thus, under detected the finer sand and silt grains, when comparing to the results of the Coulter Counter and visually evaluating the images (Figures 2, 3). The Pcam detected grains in the range from 10 to 600 μm, more in accordance with the Coulter Counter. Contrary, the Pcam underestimated the sizes of the glass beads and found a maximum size of 250 μm (Figures 2, 3). The IRcam captured glass beads in the size-range between 500 and 800 μm with a mean size of 650 ± 50 μm and returned similar size-distributions and mean size as those we measured with the Coulter Counter (Figures 2, 3). Finally, we formed porous organic aggregates from diatoms in roller tanks in the laboratory (see method in Iversen and Ploug, 2010). Visual comparison showed that the IRcam was reliably detecting organic, porous diatom aggregates, while the Pcam only detected parts of the aggregates (Figure 3).
Figure 2. The frequency distribution shows the size-distribution in a sample pool, i.e., the number fraction a certain size-class makes up of the total particle pool. Frequency distributions from the laboratory calibrations using two different sediment types and glass beads. The frequency distribution for Pcam is presented by blue lines, the frequency distribution for the IRcam is presented in red lines, and the frequency distribution measured by the Coulter Counter is presented in black lines.
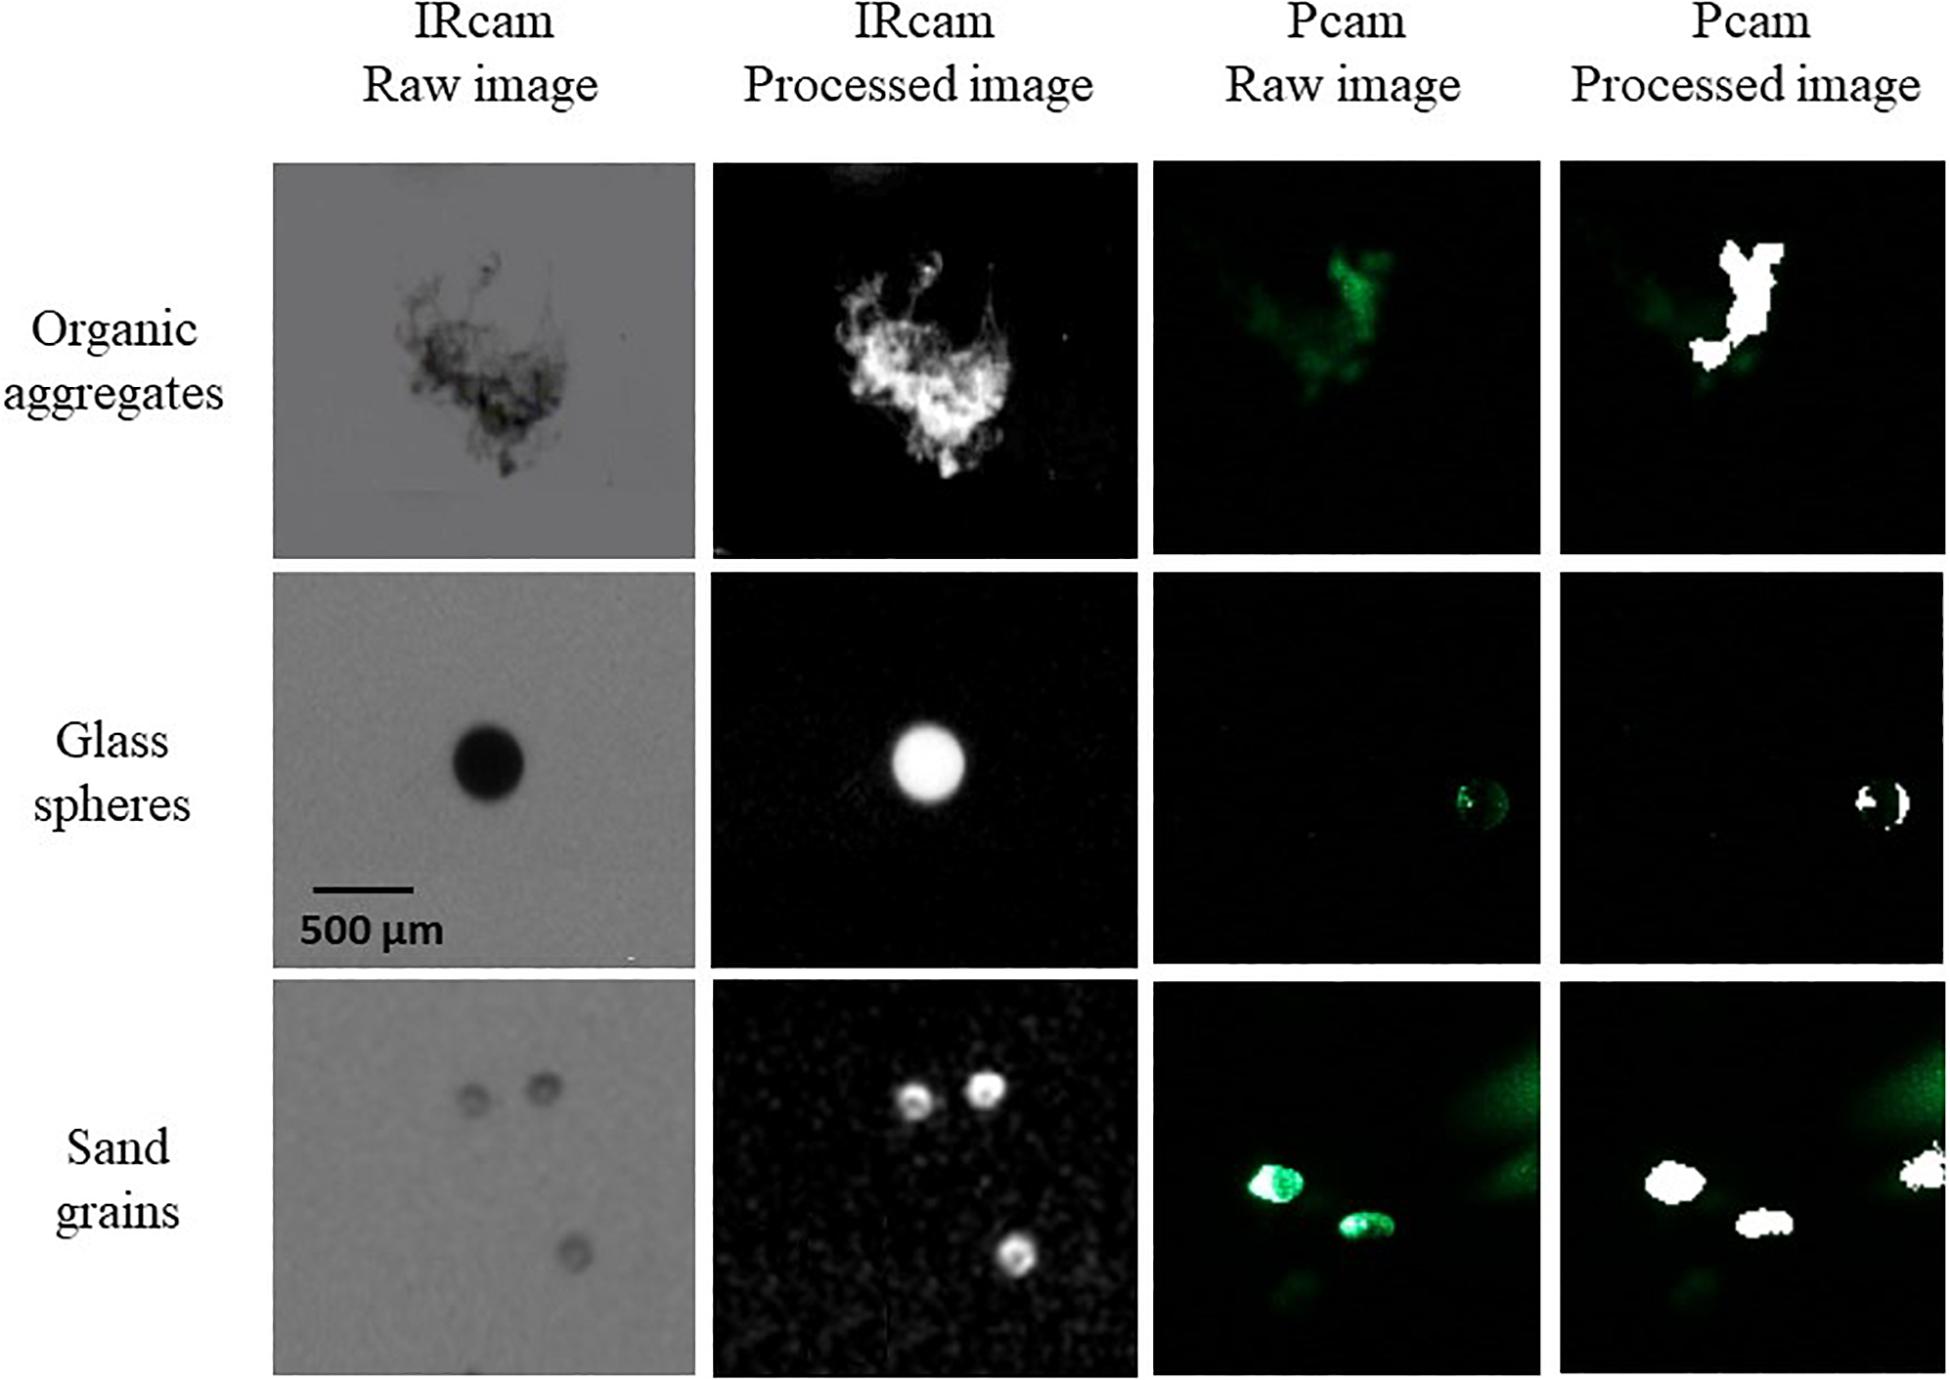
Figure 3. Examples of particles imaged by the two cameras, showing unprocessed IRcam particles (raw images, left column), processed IRcam particles (processed images, second column from left), unprocessed Pcam particles (raw images, third column from left) and processed Pcam particles (processed images, right column). The top row shows examples of marine snow aggregates (organic aggregates), the middle row shows glass beads (glass spheres), and the bottom row shows sediment particles (sand grains). The scale bar in panel is valid for all panels.
Evaluation of in situ Particle Size-Spectra
We deployed the two camera systems as part of the drifting trap array during a diurnal deployment at the open ocean station (Figure 1). The IRcam only stored images until midnight while the Pcam stored images for the full diurnal deployment. There were differences in the concentration particle size-spectra observed by the Pcam and the IRcam, due to their different detection efficiencies for different types of particles. Comparing the Pcam and IRcam, we measured higher abundance of particles smaller than 200 μm with the Pcam compared to the IRcam and vice versa for particles larger than 500 μm. In contrast, the gel trap is considered to be equally ideal for detection of all sizes of particles, our camera system allowed a quantifiable size-range between 10 and 2000 μm for the gel trap (lower and upper size-range determined by (i) the optical resolution and (ii) the trap area and deployment time, respectively). Combined, the two camera systems spanned a particle size-range similar to that collected in the gel trap (Figure 4). Note that the particle size spectra from the camera systems and the gel trap cannot be directly compared for two reasons: (i) the camera systems collect concentration particle size-spectra (i.e., # cm–4), while the gel traps collect flux particle size-spectra (i.e., # cm–3 min–1) and (ii) the camera systems observe both suspended and settling particles while the gel traps only collect settling particles. However, by comparing the patterns of the flux and concentration particle size-spectra, it can be inferred that the Pcam and IRcam detected all settling particles in the size-range between 20 and 2000 μm and between 200 to 2000 μm, respectively (Figure 4). Additionally, it seems that the IRcam detected suspended particles larger than 500 μm, which were not observed by either the Pcam or the gel trap (Figure 4). From the particles collected in the gel trap, we found that 19 ± 2% of the total particle volume was made of by zooplankton fecal pellets in the size-classes between 20 and 200 μm, while fecal pellets made up 32% of the intermediate-sized aggregates (200–500 μm), and 36% of aggregates between 500 and 1000 μm (Figure 4B). We did not observe any fecal pellets larger than 1000 μm or smaller than 20 μm (Figure 4B). The fecal pellets were primarily produced by copepods.
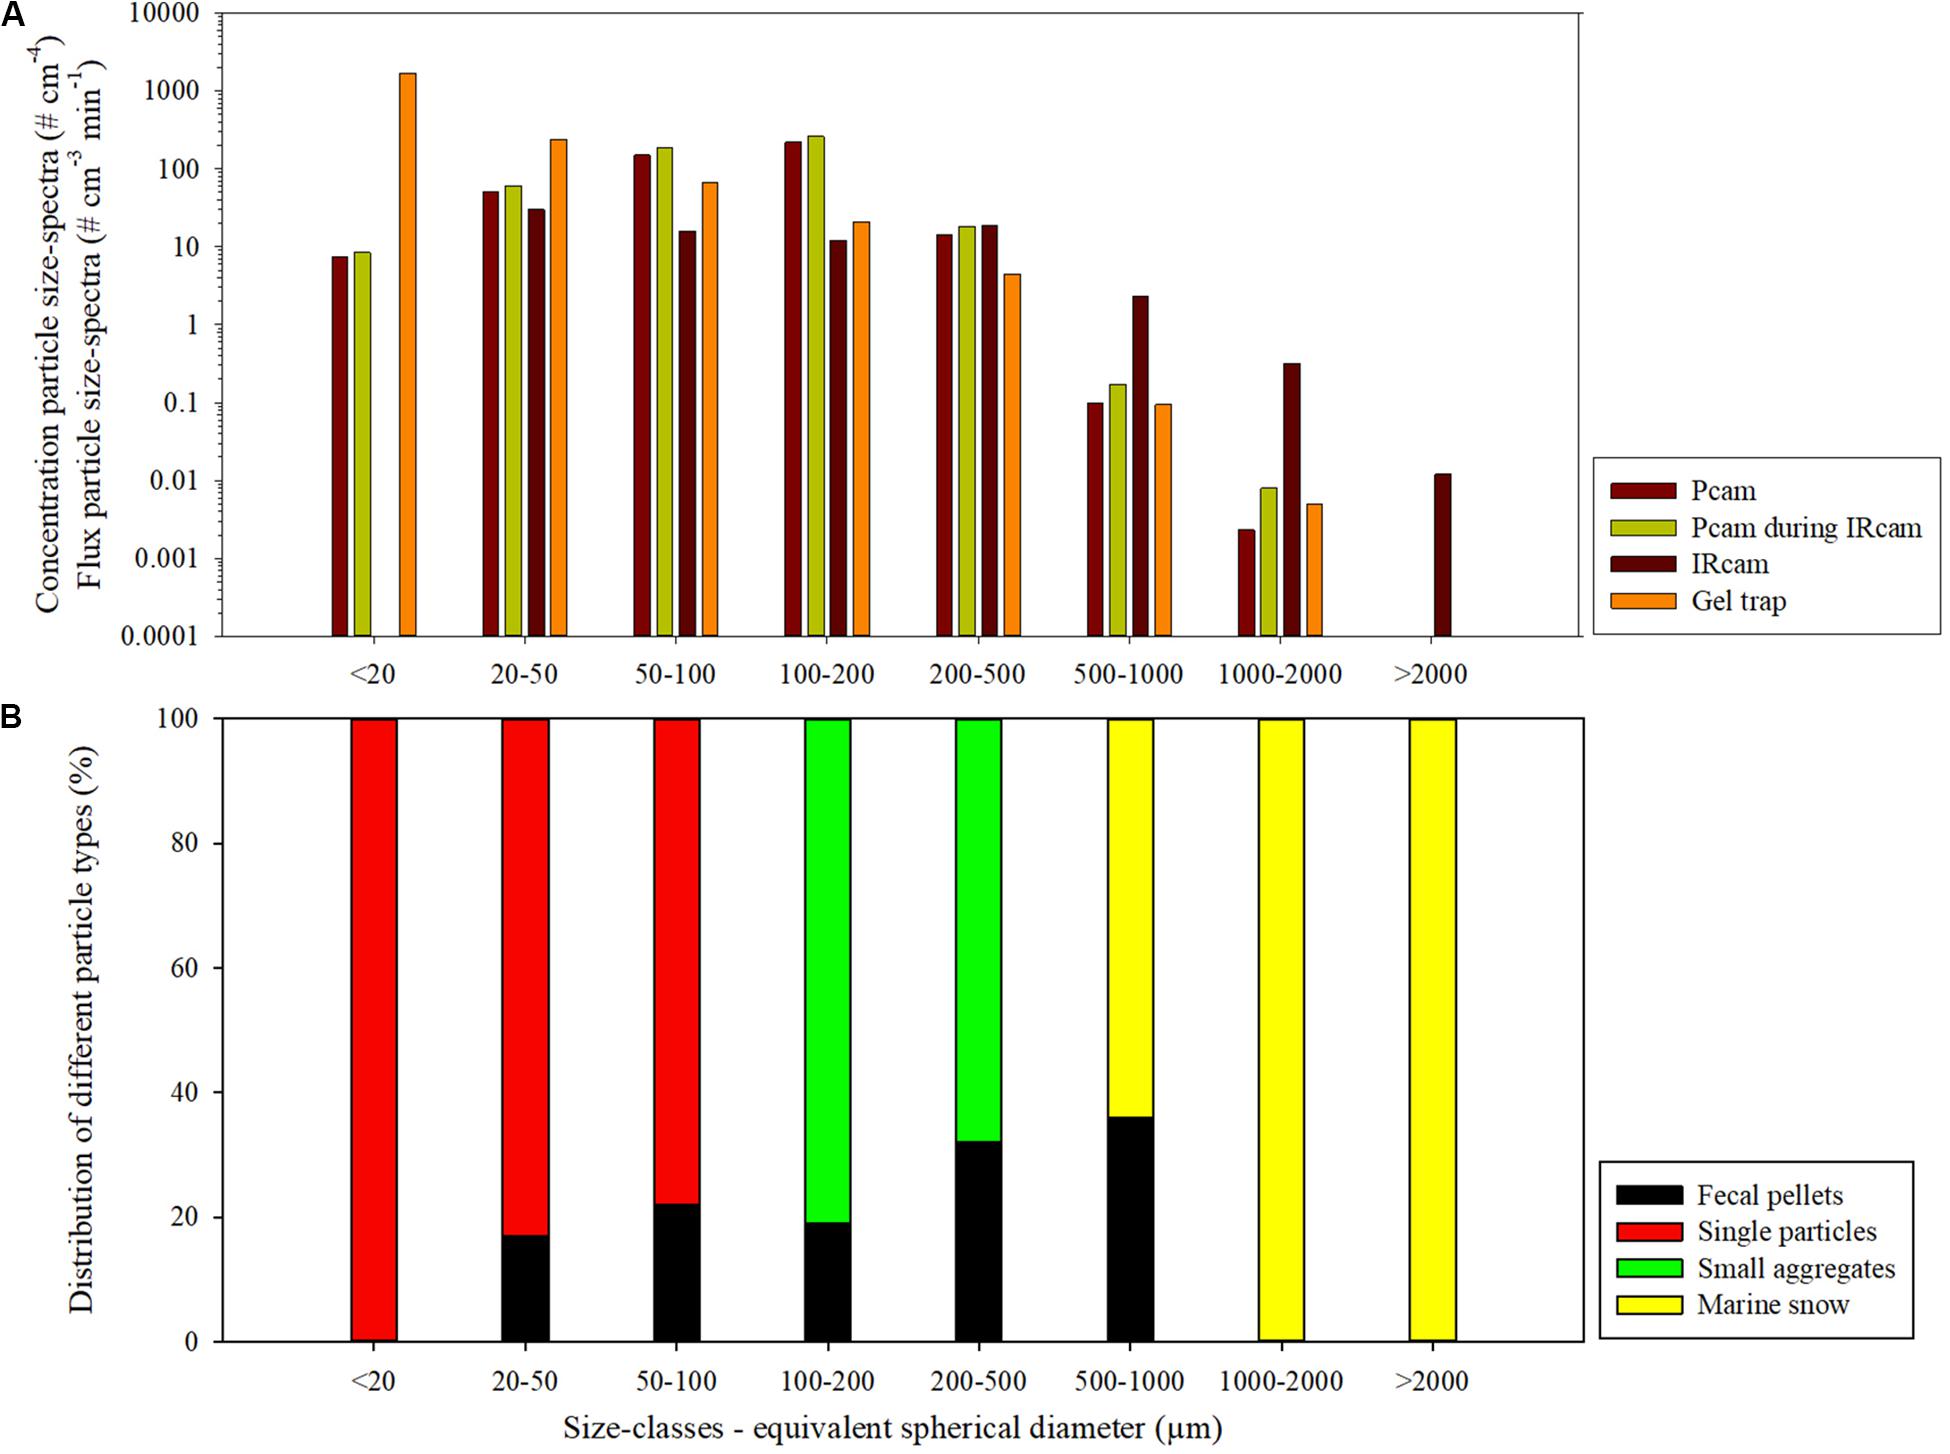
Figure 4. Particle size-spectra for the drifting deployment for the Pcam, IRcam, and gel trap. (A) The data from Pcam and the IRcam are presented as concentration particle size-spectra (# cm–3 cm–1) and the data from the gel trap is presented as flux particle size-spectra (# cm–2 cm–1 min–1). The particle size-spectra for all three measuring instruments are divided into eight size classes (x-axis, panel A). The number particle size-spectra for the Pcam is for the entire deployment period (dark blue) and for the period where the IRcam captured images (light blue). The concentration particle size-spectra for the IRcam data (yellow) and the flux particle size-spectra from the gel trap (dark red). The unit of the concentration particle size-spectra of the Pcam and the IRcam are in numbers of particles per cm4, the unit of flux particle size-spectra for the gel trap is as numbers of particles per cm3 per minute. (B) The particles types were identified from the gel trap and presented as percentage of fecal pellets, single phytoplankton and lithogenic particles, small aggregates, and marine snow for each size class.
Diurnal Particle Dynamics
We used a diurnal deployment to exemplify potentials of combining optical systems over time. The Pcam detected higher particle abundance and total volume during evening and morning compared to night-time (Figure 5 and Table 2). The decrease in both total volume and abundance of particles started after 21:00 and lasted until midnight, after which the values remained low and stable throughout the night. At 09:00 a rapid increase in abundance and volume occurred, but remained only 72% of the total particle volume observed during the previous evening (Figure 5 and Table 2). Despite some small variations in the average ESD throughout the deployment, the overall average ESD measured by the Pcam remained at roughly 120 μm. The average ESD measured by the IRcam was twofold higher than that of the Pcam and showed a slight increase at midnight. The total volumes measured by the IRcam were more than 20 times higher than those of the Pcam. However, IRcam values of abundance were lower than those of the Pcam until the last hour before midnight, with mean values in the evening (hours 20–22) being just two thirds of the abundances measured by the Pcam. The ADCP showed an almost constant backscattering signal at 50–70 m depth, higher at this depth than below, from the time of deployment until 07:30 in the morning. At this time, a strong downward directed signal was seen to a depth of 110 m at 08:00 (Figure 5).
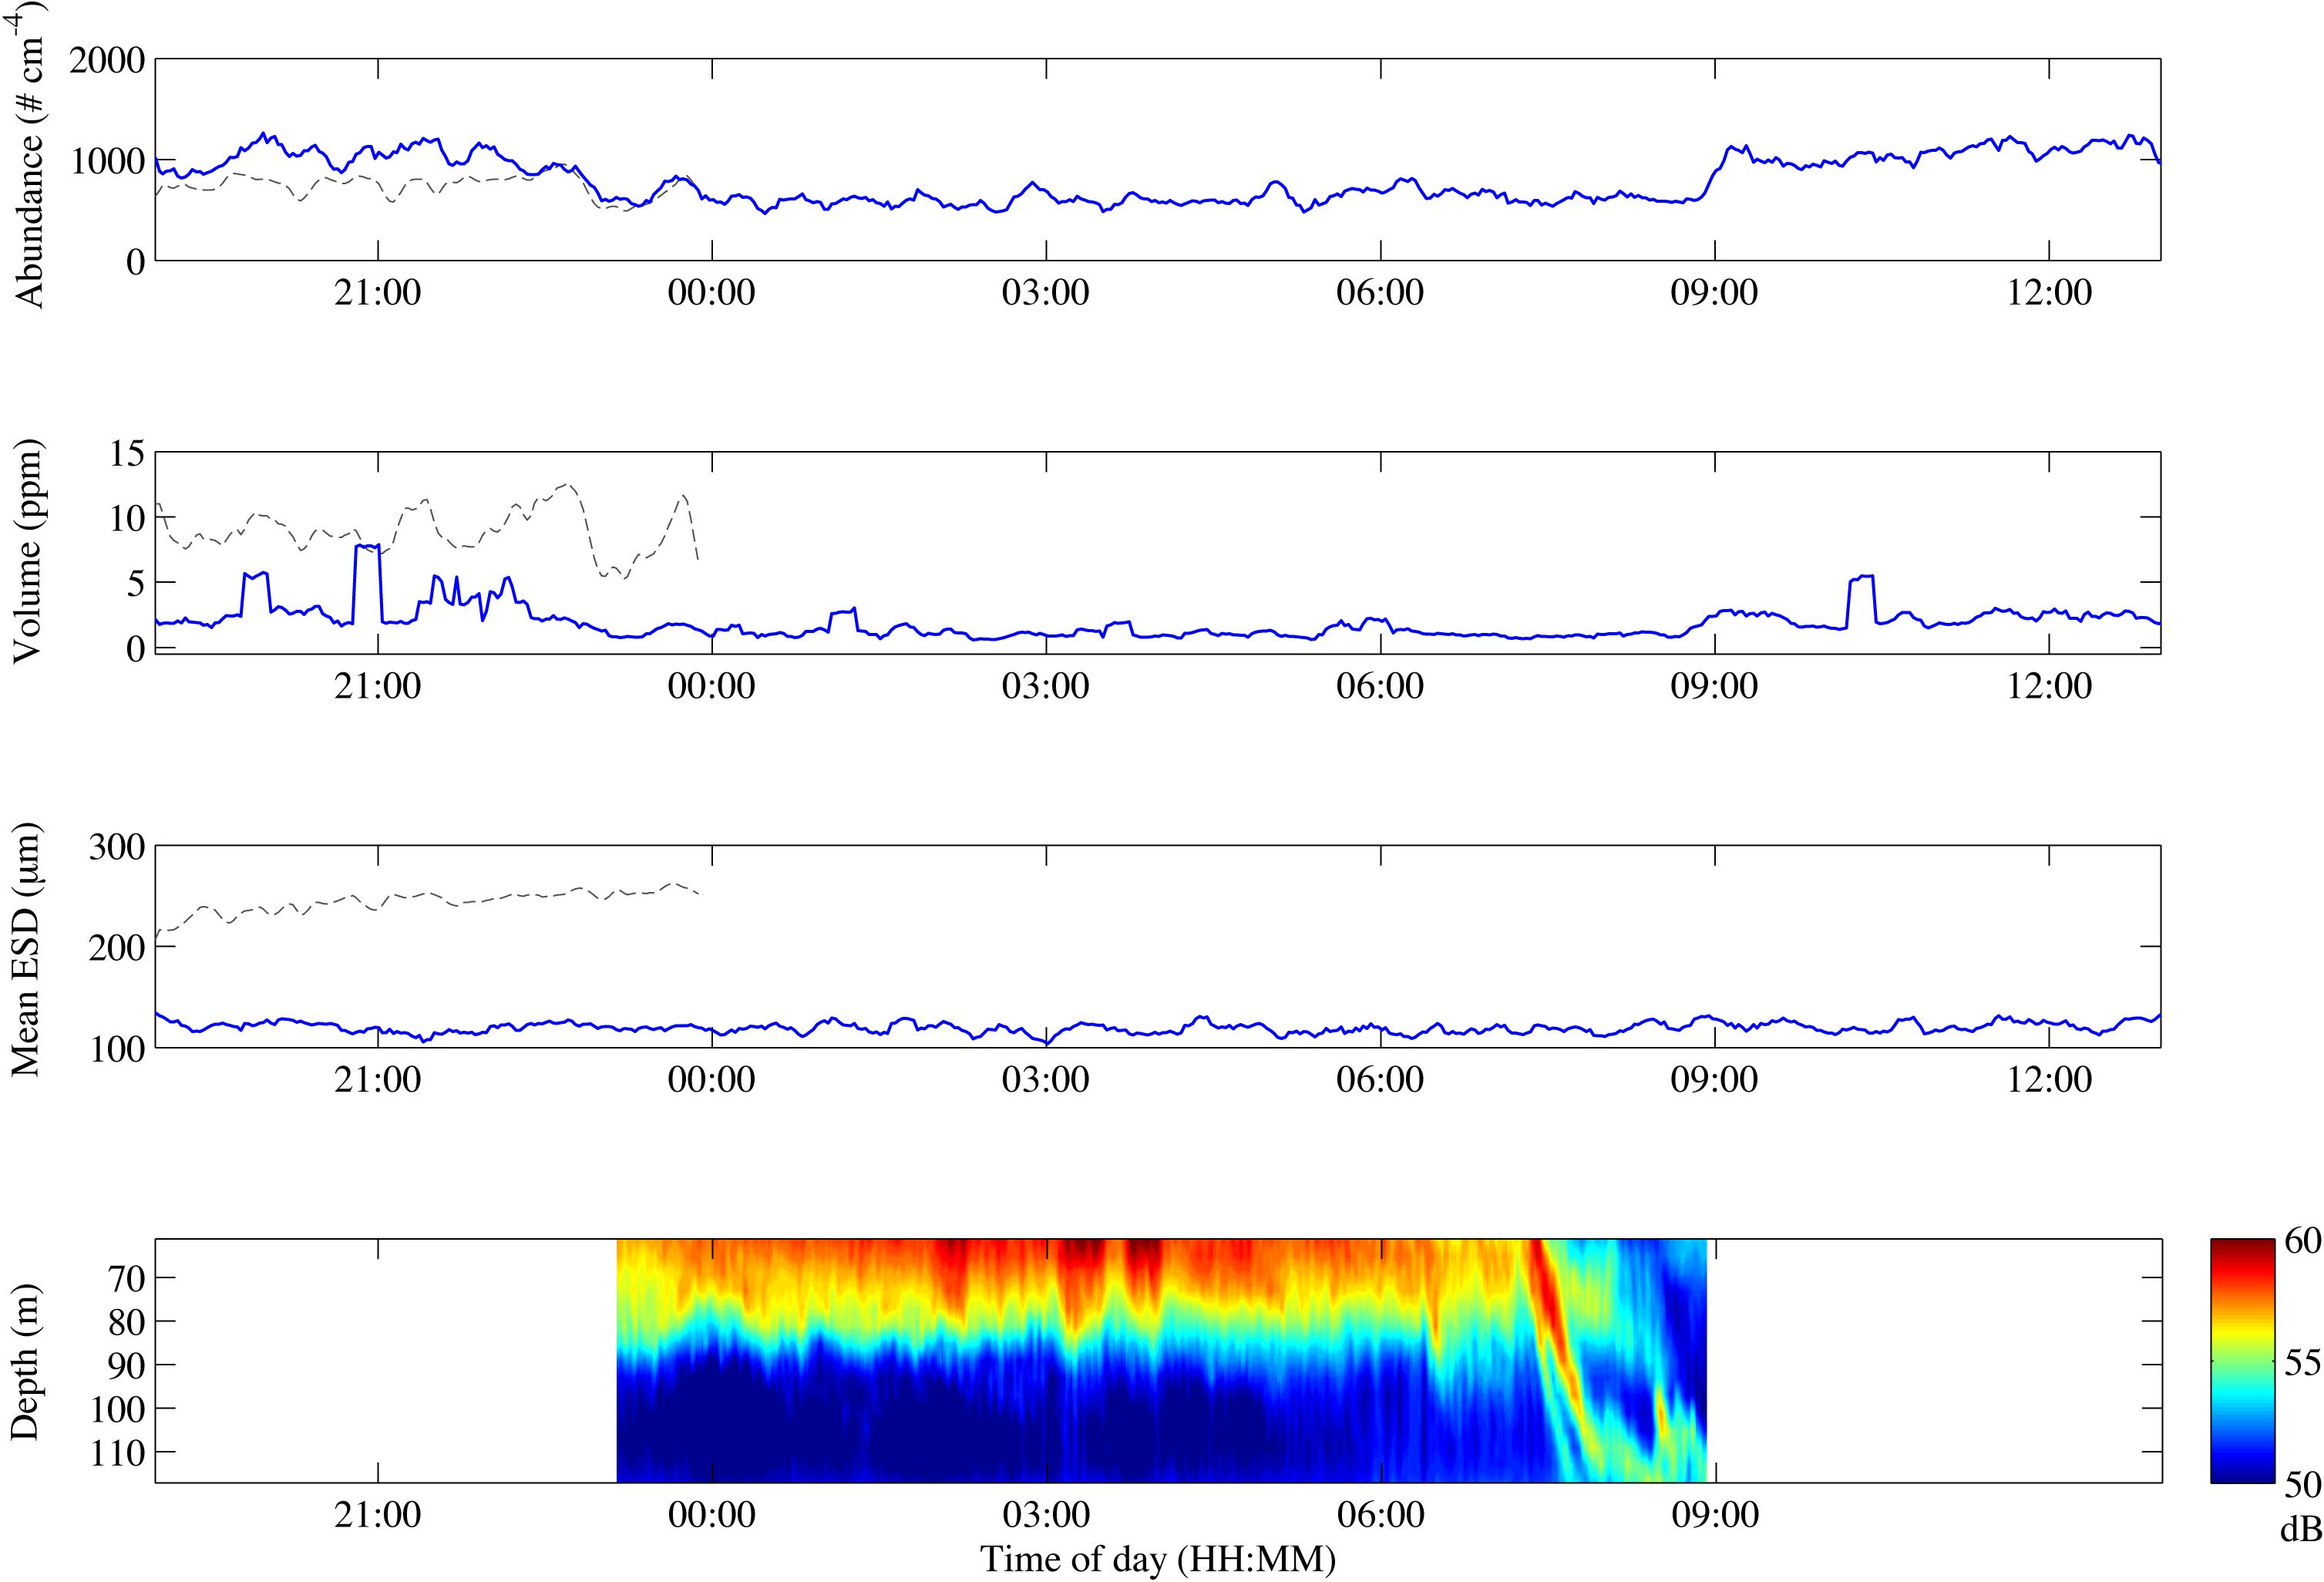
Figure 5. Change in particle abundance (A), particle volume (B), mean ESD (C) and ADCP backscatter over depth (D) over the course of the drifting deployment. Gray lines represent IRcam data, blue lines represent Pcam data. The time zone is UTC + 1.
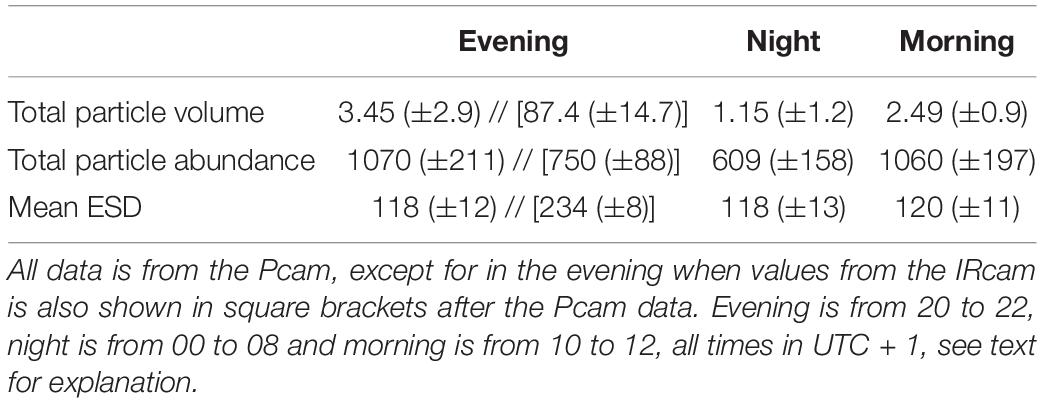
Table 2. Mean values of selected camera data for the three periods (evening, night, and morning) of the drifting deployment with standard deviations in brackets.
Vertical Particle Size-Distribution and Abundance
Particle abundance, total particle volume, turbidity and fluorescence decreased with increasing depth at the open ocean station (Figure 6). In contrast, there was little coherence between particle abundance and total volume at the coastal station, where the Pcam showed increasing particle abundances with increasing depth while the IRcam showed constant particle abundance with increasing depth and an order of magnitude lower than those observed with the Pcam (Figure 6). The abundances of large particles (>200 μm) were in the same order of magnitude at both stations (Figure 7). At the open ocean station the Pcam and IRcam detected roughly the same amount of both small and large particles, while the Pcam detected an order of magnitude higher abundance of small particles (<200 μm) compared to the IRcam at the coastal station.
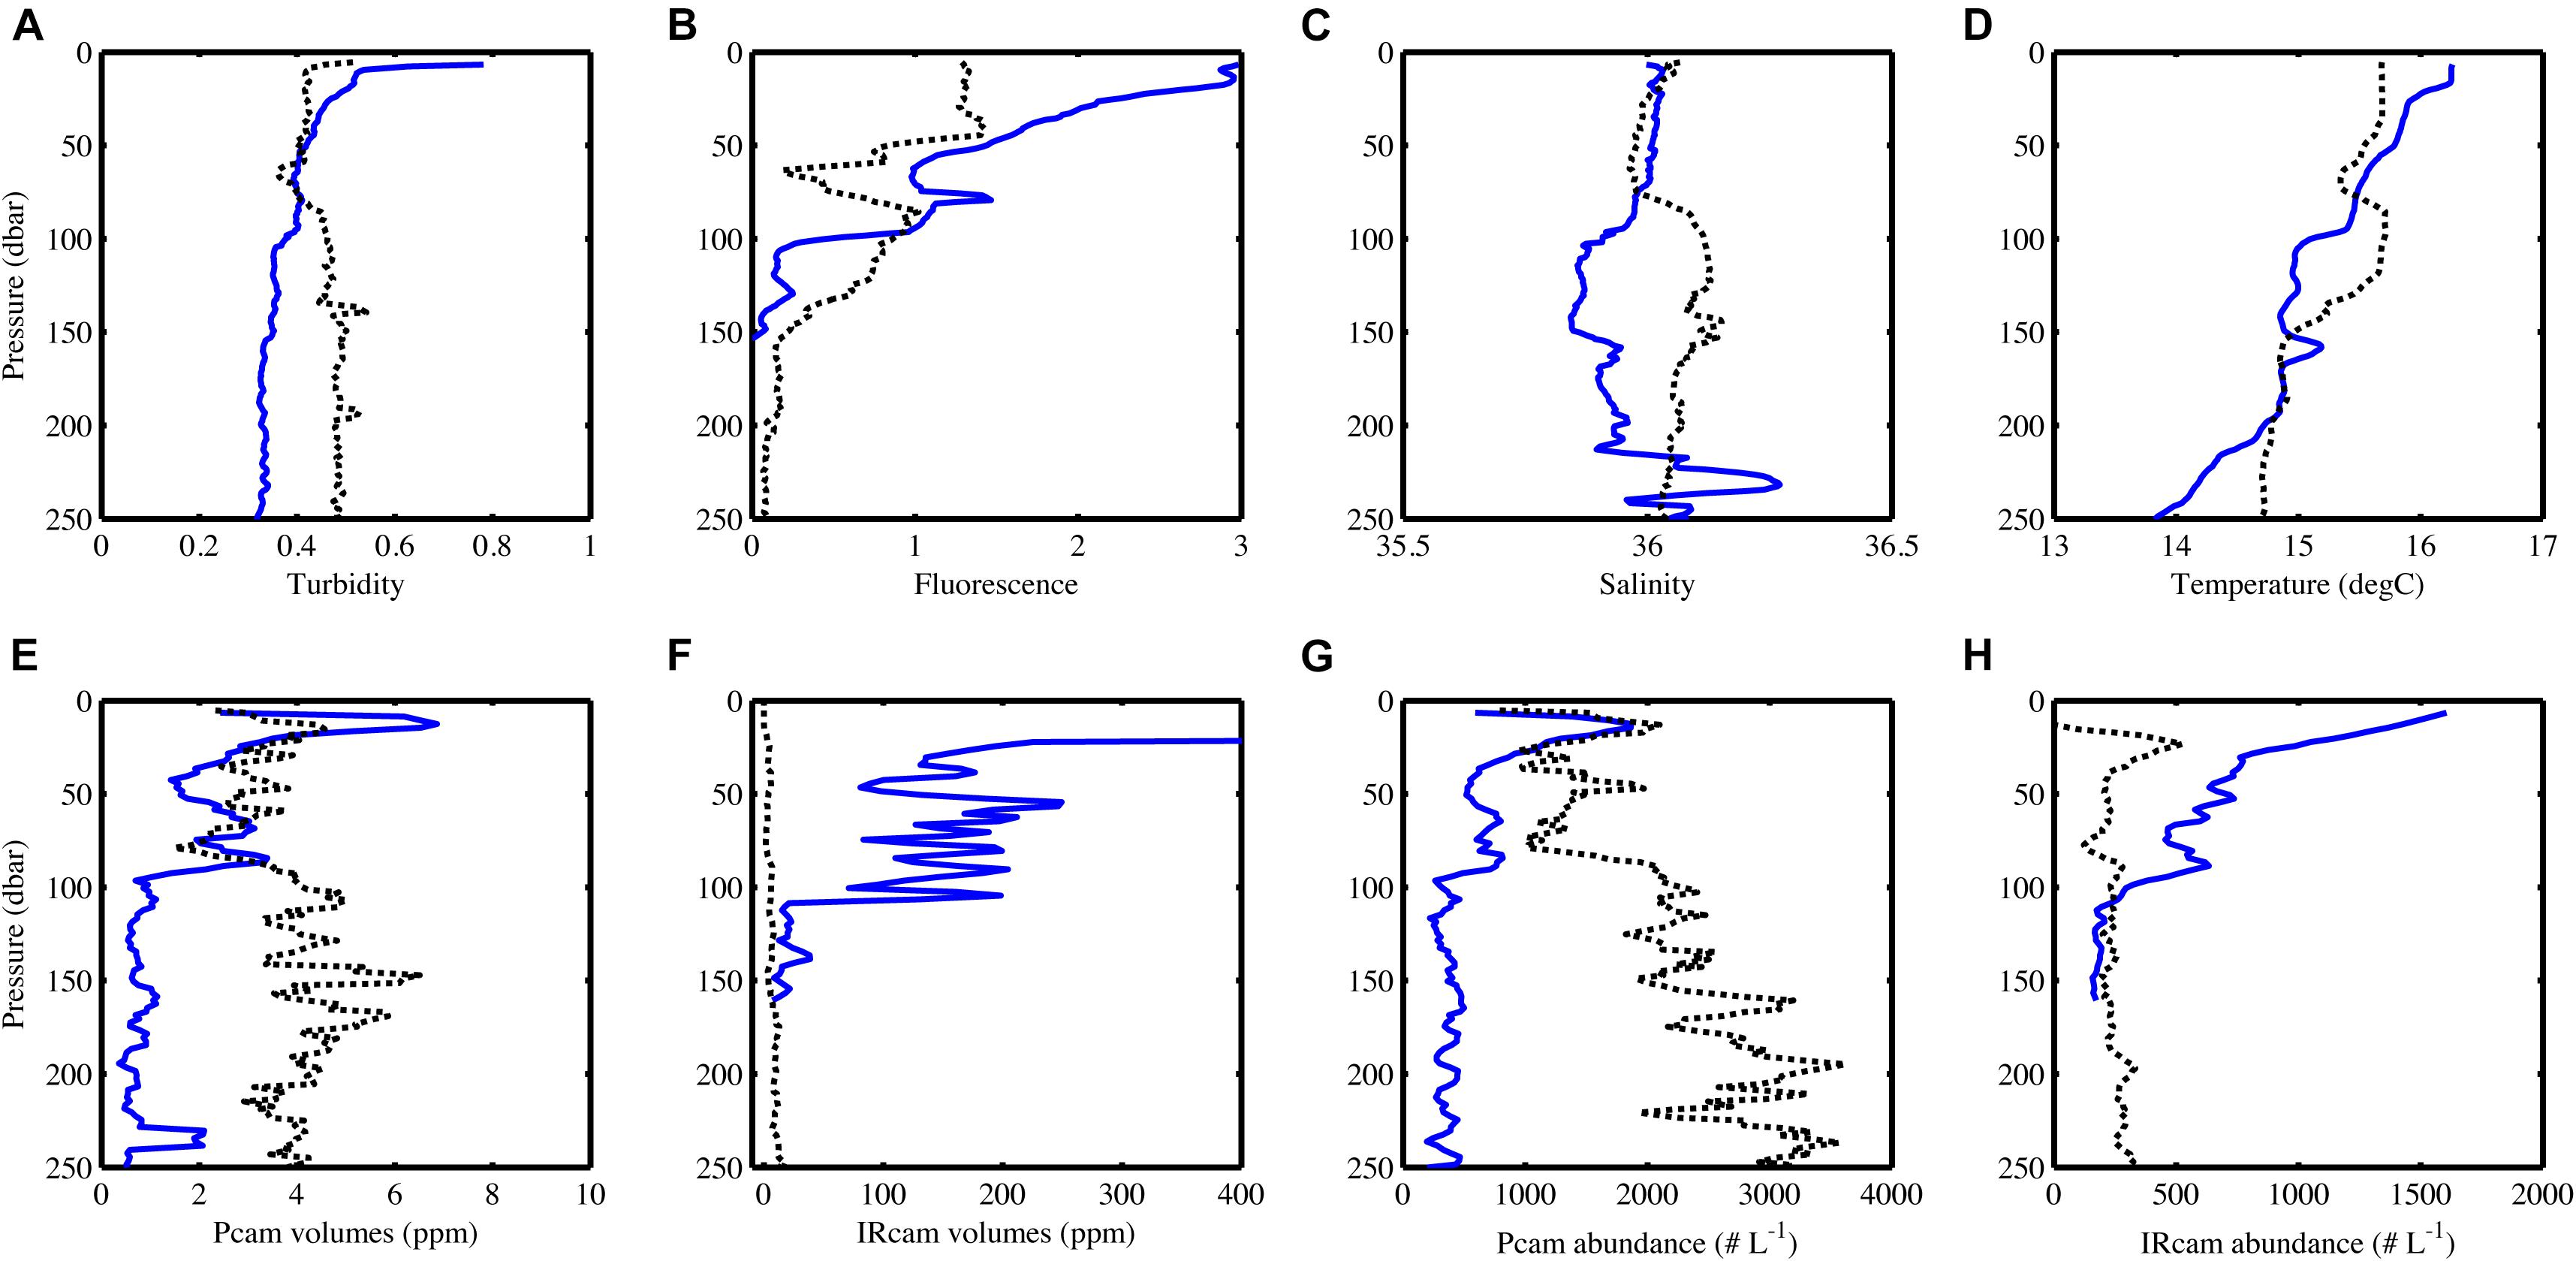
Figure 6. CTD-data (A–D) and camera data (E–H) changes with depth, blue lines are from the open ocean station and black dots are from the coastal station. Note the different x-axes on (E) and (F) and that the x-axis in (F) does not show the full range of values at the open ocean station. The volume decreases linearly from 11300 ppm at 10 m depth to what is shown on the graph. The IRcam only worked down to 150 m at the open ocean station. Data has been binned in 5 m depth bins. For station metadata, see Table 1.
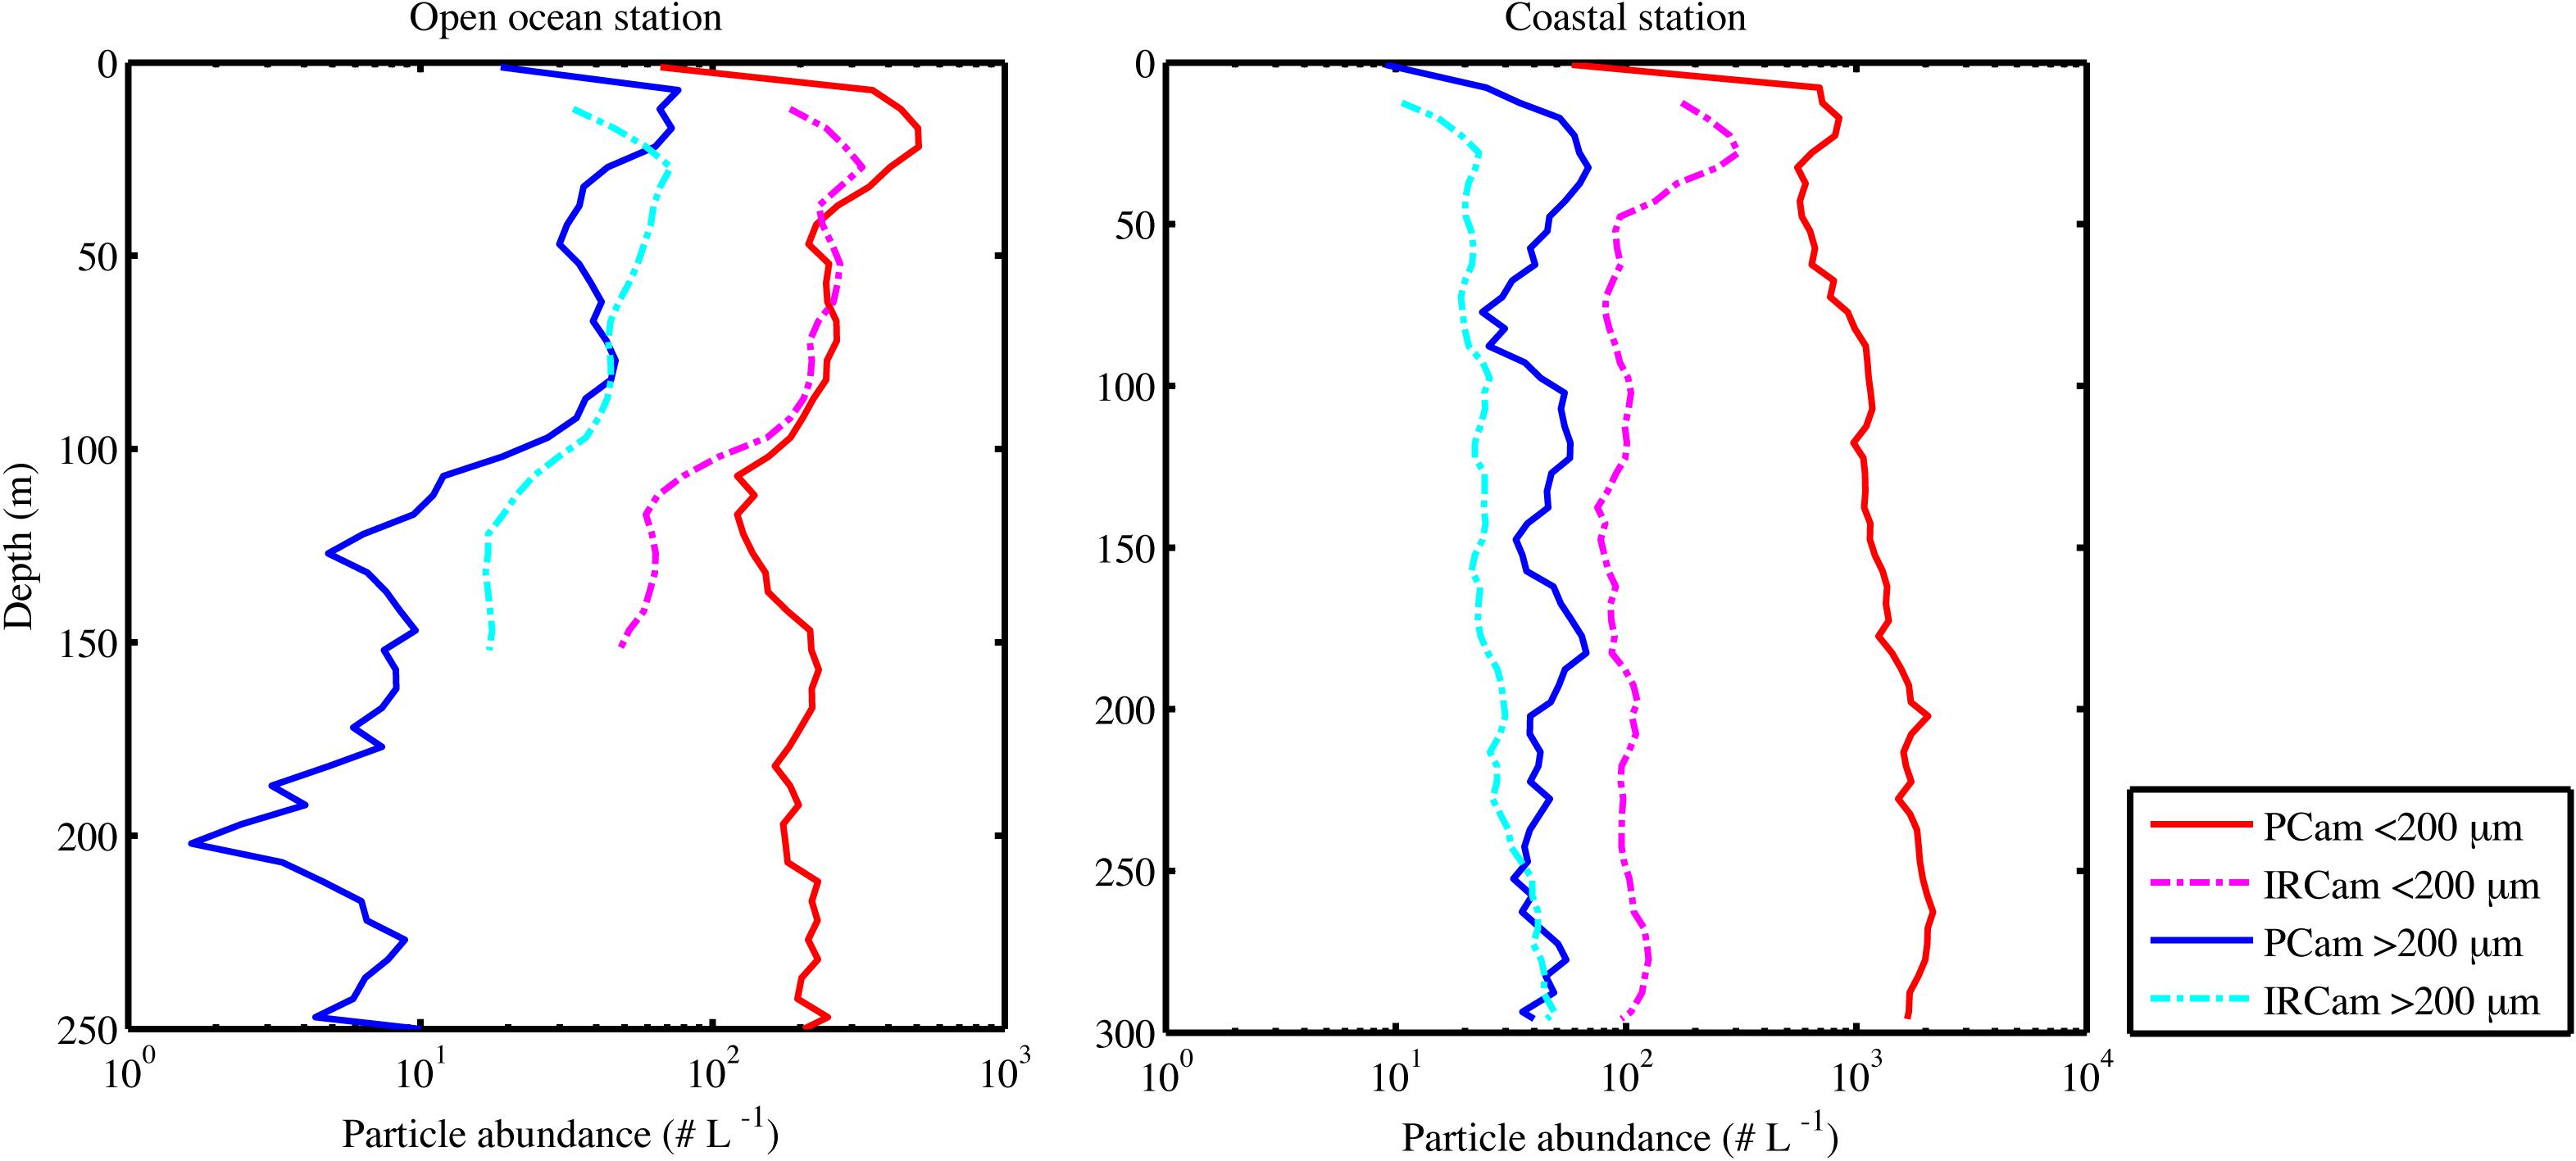
Figure 7. Particle abundances over depth when profiling, showing the open ocean station (Left) and the coastal station (Right), the particles are split in two size groups and shown for both camera systems (see legend). All measurements are from the upcast part of the profile and are binned in 5 m depth bins.
There was a positive significant correlation between turbidity and fluorescence at the open ocean station and a negative significant correlation at the coastal station (Table 3). The open ocean station had positive significant correlations of turbidity and fluorescence to particle abundances and volumes for both Pcam and IRcam, with the strongest correlations between fluorescence and IRcam abundance and volumes (Table 3). This shows that the particles at the open ocean station were dominated by phytoplankton, which was also observed from the presence of fecal pellets and phytoplankton aggregates in the gel trap (Figure 4). Hence, the particles and aggregates at the open ocean station were predominantly of organic origin. Note that we have not performed any corrections for non-photochemical quenching of the fluorescence signal near the surface, but the majority of the data are from depths with little influence from solar irradiation. At the coastal station, only Pcam particle abundance and IRcam volumes were significantly correlated to turbidity (positive correlations) and to fluorescence (negative correlation) (Table 3). This suggested that the particles at the coastal station were predominantly of inorganic origin, which was also observed during previous studies off Cape Blanc where nepheloid layers (Nowald et al., 2006) could be modeled by “releasing” particles from the shallow shelf area and allowing them to be advected off-shore (Karakaş et al., 2006; Fischer et al., 2009). It is therefore likely that the observed inorganic particles at the costal station were resuspended shelf sediment.
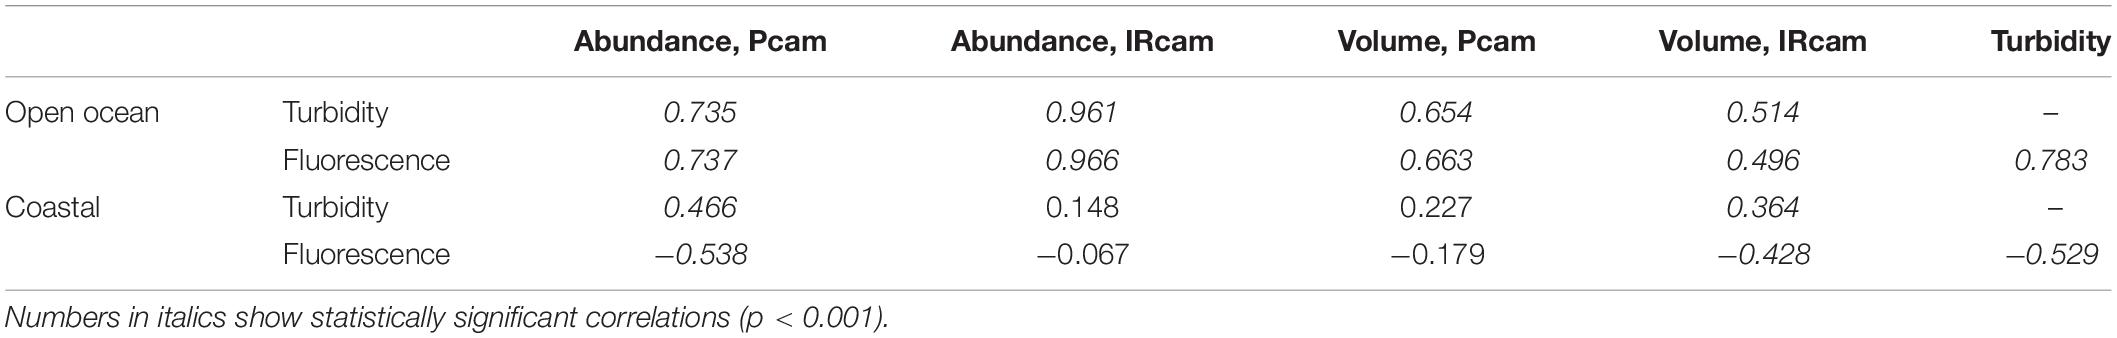
Table 3. Pearson correlation coefficients for selected parameters of the two profiling stations.
Discussion
The use of high magnification and a thin laser sheet made the Pcam optimal for detection of dense and small lithogenic particles, while transparent and/or porous organic aggregates were underrepresented during the laboratory calibrations (Figures 2, 3). The IRcam captured the full size of glass spheres and organic aggregates during the laboratory calibrations (Figures 2, 3). This was due to the use of backlight which imaged large and/or transparent particles well. Fine sand (<200 μm) and silt grains were underrepresented by the IRcam due to the low magnification chosen for this study, whereas the Pcam seemed to capture the entire spectra and potentially even at a finer detail in the low size range than the Coulter Counter. The low detection efficiency of the large organic aggregates by the Pcam is an example of the potential issues with the narrow laser sheet, as it sometimes limits large aggregates from being fully illuminated.
Generally, the Pcam was better at detecting particles smaller than 200 μm while the IRcam was better at detecting particles larger than 500 μm. This shows that our expected size-ranges for the two camera systems were different from the actual quantifiable size-ranges detected during field and laboratory measurements. This highlights a necessity to distinguish the qualitative size limit of a certain camera system from the quantitative size limit of the same system. Further, the differences between the coastal and the open ocean stations showed that even within one region, marine particles consisted of a wide range of types and sizes of inorganic and organic origin. Therefore, when using in situ camera systems to quantify particles and aggregates, it is important to understand and consider both the size-range and types of particles, that the applied systems can capture. To this end, combinations of different optical sensors, e.g., fluorescence and turbidity sensors in combination with in situ camera systems, can aide in the understanding of particle characteristics, as also shown by Jackson et al. (1997). Thus, it is important to base interpretations on data from instruments that are designed and adapted to the environment and particles that are being investigated. Specific optical instruments may detect different particle types (e.g., organic particles) better than others (e.g., inorganic particles) and therefore only capture a subset of the total in situ particles pool. This is further complicated by changes in the particle pool occurring on short temporal and spatial scales. For example, regions with nepheloid layers may have a water layer dominated by inorganic, lithogenic particles while shallower and deeper layers are dominated by organic aggregates (e.g., Karakaş et al., 2006; Seifert et al., 2019), which may or may not be detected by the camera system used to determine vertical profiles of particle size-distribution and abundances.
Combining Optical Systems
The different particle dynamics observed by the Pcam during the drifting deployment is an example of diurnal changes in particle characteristics. The high particle abundance and total volume observed during evening and morning compared to night-time, despite constant average particle sizes through the whole deployment period, suggested a particle loss across all particle sizes during night. The morning total volume was only 72% of that observed during the previous evening and may be explained by the time required for growth of new phytoplankton to a threshold level where aggregates formed and sank to the depth of the camera (Jackson and Kiørboe, 2008; Iversen et al., 2010). The low night-time particle abundance and total volume occurred while the ADCP backscatter was high in the water layers above the camera and after an increase in mean ESDs were observed by the IRcam. This suggests a shift toward larger particles during night, possibly vertically migrating zooplankton (Lavery et al., 2009), which would suggest that zooplankton migrated to the upper water column during night and were feeding on the particles. Related to this is the fact that particles were lost across the whole quantifiable size range, which points toward flux feeding from organisms intercepting sinking particles (Jackson, 1993). This would be in accordance with previous studies off Cape Blanc, where changes in particle size distributions through the water column was best described by flux feeding (Iversen et al., 2010). However, this data set is too limited to make any clear conclusions about the mechanisms governing the observed particle and aggregate dynamics, but it does show the potential added value from combining several optical measurements with other methods such as sediment traps, zooplankton and phytoplankton sampling, and hydroacoustics.
We notice that the lower qualitative size limit of the IRcam of 50 μm was not sufficient to capture the smallest particles that were caught in the gel trap (sizes down to 10 μm). When considering the quantitative minimum size limit being closer to 200 μm for the IRcam, this discrepancy between sediment traps and the optical system becomes even larger. Looking at the other end of the size-spectra, the largest particles caught in the gel traps were in the order of 2000 μm whereas the IRcam imaged particles with sizes up to 6000 μm. When comparing the gel trap and the IRcam, we have to consider that the trap only collected settling particles while the IRcam ‘saw’ both settling and suspended particles. The gel trap collected settling particles for an area of 85 cm2 during 18 h while the IRcam imaged a total water volume of 333 L during 5 h (9.24 mL per image and a capture frequency of two images per second). If we assume an average settling velocity of 50 m d–1, which is typical for small particles in this region (Iversen et al., 2010), then the gel trap sampled a similar volume (0.43 m3) as the IRcam (0.33 m3), suggesting that the additional large particles observed by the IRcam were suspended. The particle sizes quantified by the Pcam fitted well to those collected with the gel trap. However, since we now know that the Pcam underestimates the volume and abundance of organic particles, it is likely that the large suspended particles that were only detected by the IRcam were of organic origin. This once again highlights the importance of being aware of not only size-ranges of imaging systems, but also particle types imaged. Moreover, it becomes especially important when optical systems are used to estimate carbon fluxes from vertical profiles of particles size-distribution and abundance.
Our evaluations showed that the two camera systems detected different particle types. Additionally, when combining data from different optical systems, we gain added insights into spatial (depth) and temporal (diurnal) particle dynamics and compositions. Based on our data, we find that even in marine environments it is important to also focus on relatively small particles (ESD < 200 μm), which primarily consisted of inorganic particles in our study area. Our study suggests that drifting deployments of optical systems together with sediment traps and an ADCP can provide a link between short-term (scale of minutes) particle interactions and transformation to longer-term (scale of hours, possibly days) export and attenuation processes, which has been called for in the past as well (e.g., Hebbeln et al., 2014). However, we need to be careful when interpreting such results and ensure that the applied camera systems overlap well with the sediment traps in terms of types and sizes of detected and captured particles and aggregates in order to be able to calculate, for instance, reliable export carbon fluxes. Combining different optical systems with long-term deployment of instruments, such as sediment traps and acoustic backscattering devices on moorings and landers, has the potential to improve our understanding of the biological carbon pump and oceanic carbon sequestration, throughout all seasons, as well as in different regions, without the necessity of ship access.
In recent years many camera systems have been developed and deployed successfully to observe suspended and sinking particles in the water column, including inorganic lithogenic particles, phytoplankton, zooplankton, jellyfish, fish, and settling aggregates such as marine snow and fecal pellets (see Lombard et al., 2019). Several studies have reviewed these existing optical devices and methods (e.g., Boss et al., 2015; Lombard et al., 2019; Giering et al., 2020), however, there is still a lack of direct comparisons between different optical systems deployed simultaneously. Considering the rapid developments in optical devices, it is now essential for the scientific community to come together to continue comparing different systems to optimize ways in which they can be combined. In this way, we will be able to design platforms with multiple systems that allow us to constrain the full range of particles and organisms that are present in the oceans, and therefore gain better insights into the driving parameters for ecosystem structure and functioning. Such efforts are currently being undertaken in several international scientific networks focusing on optical methods and organic matter transport and transformation in the ocean, for example the SCOR working group TOMCAT1 and the Joint Exploration of the Twilight ZoneOcean Network JETZON2.
Data Availability Statement
The raw data supporting the conclusions of this article will be made available by the authors, without undue reservation, to any qualified researcher.
Author Contributions
All authors apart from MB took part in field sampling. MB analyzed ADCP data. TM and MI analyzed all other data, and wrote the manuscript with input from all other authors.
Funding
This study was supported by the Helmholtz Association, the Alfred Wegener Institute Helmholtz Centre for Polar and Marine Research and the DFG-Research Center/Cluster of Excellence “The Ocean in the Earth System” at MARUM. This publication was supported by the HGF Young Investigator Group SeaPump “Seasonal and regional food web interactions with the biological pump”: VH-NG-1000.
Conflict of Interest
The authors declare that the research was conducted in the absence of any commercial or financial relationships that could be construed as a potential conflict of interest.
The reviewer AB declared a past co-authorship with one of the authors MI to the handling editor.
Acknowledgments
We thank Cindy Lee, Stuart Wakeham, Kai-Uwe Hinrichs, Carol Arnosti, Anne Pearson, and Thorsten Dittmar for organizing the Marine Organic Biogeochemistry workshop held at the Hanse-Wissenschaftskolleg, Delmenhorst, Germany, April 27 – 30th 2019. We thank the crew of F.S. Poseidon cruise 481 for their assistance during the cruises. Thanks to Götz Ruhland, Marco Klann, and Helga van der Jagt for assistance during sediment trap deployments. We thank the reviewers for their valuable input and improvements.
Footnotes
References
Ainslie, M. A., and McColm, J. G. (1998). A simplified formula for viscous and chemical absorption in sea water. J. Acoust. Soc. Am. 103, 1671–1672. doi: 10.1121/1.421258
Bochdansky, A. B., Jericho, M. H., and Herndl, G. J. (2013). Development and deployment of a point-source digital inline holographic microscope for the study of plankton and particles to a depth of 6000 m. Limnol. Oceanogr.Methods 11, 28–40. doi: 10.4319/lom.2013.11.28
Boss, E., Guidi, L., Richardson, M. J., Stemmann, L., Gardner, W., Bishop, J. K. B., et al. (2015). Optical techniques for remote and in-situ characterization of particles pertinent to GEOTRACES. Prog. Oceanogr. 133, 43–54. doi: 10.1016/j.pocean.2014.09.007
Carr, M. E. (2002). Estimation of potential productivity in Eastern Boundary Currents using remote sensing. Deep Sea Res. II Top. Stud. Oceanogr. 49, 59–80. doi: 10.1016/s0967-0645(01)00094-7
Cropper, T. E., Hanna, E., and Bigg, G. R. (2014). Spatial and temporal seasonal trends in coastal upwelling off Northwest Africa, 1981-2012. Deep Sea Res. I Oceanogr. Res. Pap. 86, 94–111. doi: 10.1016/j.dsr.2014.01.007
Davis, C. S., Thwaites, F. T., Gallager, S. M., and Hu, Q. (2005). A three-axis fast-tow digital Video Plankton Recorder for rapid surveys of plankton taxa and hydrography. Limnol. Oceanogr.-Methods 3, 59–74. doi: 10.4319/lom.2005.3.59
De La Rocha, C. L., Nowald, N., and Passow, U. (2008). Interactions between diatom aggregates, minerals, particulate organic carbon, and dissolved organic matter: further implications for the ballast hypothesis. Glob. Biogeochem. Cycles 22:GB4005. doi: 10.1029/2007GB003156
Downing, A., Thorne, P. D., and Vincent, C. E. (1994). Backscattering from a suspension in the near field of a piston transducer. J. Acoust. Soc. Am. 97, 1614–1620. doi: 10.1121/1.412100
Ebersbach, F., and Trull, T. W. (2008). Sinking particle properties from polyacrylamide gels during the KErguelen Ocean and Plateau compared Study (KEOPS): zooplankton control of carbon export in an area of persistent natural iron inputs in the Southern Ocean. Limnol. Oceanogr. 53, 212–224. doi: 10.4319/lo.2008.53.1.0212
Engel, A., Szlosek, J., Abramson, L., Liu, Z. F., and Lee, C. (2009). Investigating the effect of ballasting by CaCO3 in Emiliania huxleyi: I. Formation, settling velocities and physical properties of aggregates. Deep Sea Res. II Top. Stud. Oceanogr. 56, 1396–1407. doi: 10.1016/j.dsr2.2008.11.027
Fender, C. K., Kelly, T. B., Guidi, L., Ohman, M. D., Smith, M. C., and Stukel, M. R. (2019). Investigating particle size-flux relationships and the biological pump across a range of plankton ecosystem states from coastal to oligotrophic. Front. Mar. Sci. 6:603. doi: 10.3389/fmars.2019.00603
Fischer, G., and Karakaş, G. (2009). Sinking rates and ballast composition of particles in the Atlantic Ocean: implications for the organic carbon fluxes to the deep ocean. Biogeosciences 6, 85–102. doi: 10.5194/bg-6-85-2009
Fischer, G., Karakaş, G., Blaas, M., Ratmeyer, V., Nowald, N., Schlitzer, R., et al. (2009). Mineral ballast and particle settling rates in the coastal upwelling system off NW Africa and the South Atlantic. Int. J. Earth Sci. 98, 281–298. doi: 10.1007/s00531-007-0234-7
Fischer, G., Romero, O., Merkel, U., Donner, B., Iversen, M. H., Nowald, N., et al. (2016). Deep ocean mass fluxes in the coastal upwelling off Mauritania from 1998 to 2012: variability on seasonal to decadal timescales. Biogeosciences 13, 3071–3090. doi: 10.5194/bg-13-3071-2016
Gabric, A. J., Garcia, L., Vancamp, L., Nykjaer, L., Eifler, W., and Schrimpf, W. (1993). Offshore Export of Shelf Production in the Cape Blanc (Mauritania) Giant Filament as Derived from Coastal Zone Color Scanner Imagery. J. Geophys. Res. Oceans 98, 4697–4712. doi: 10.1029/92jc01714
Giering, S. L. C., Cavan, E. L., Basedow, S. L., Briggs, N., Burd, A. B., Darroch, L. J., et al. (2020). Sinking organic particles in the ocean—flux estimates from in situ optical devices. Front. Mar. Sci. 6:834. doi: 10.3389/fmars.2019.00834
Gillard, B., Purkiani, K., Chatzievangelou, D., Vink, A., Iversen, M. H., and Thomsen, L. (2019). Physical and hydrodynamic properties of deep sea mining-generated, abyssal sediment plumes in the Clarion Clipperton Fracture Zone (eastern-central Pacific). Elementa 7:5. doi: 10.1525/elementa.343
Graham, G. W., Davies, E. J., Nimmo-Smith, W. A. M., Bowers, D. G., and Braithwaite, K. M. (2012). Interpreting LISST-100X measurements of particles with complex shape using digital in-line holography. J. Geophys. Res. Oceans 117:C05034. doi: 10.1029/2011JC007613
Guidi, L., Jackson, G. A., Stemmann, L., Miquel, J. C., Picheral, M., and Gorsky, G. (2008). Relationship between particle size distribution and flux in the mesopelagic zone. Deep Sea Res. I 55, 1364–1374. doi: 10.1016/j.dsr.2008.05.014
Hebbeln, D., Wienberg, C., Wintersteller, P., Freiwald, A., Becker, M., Beuck, L., et al. (2014). Environmental forcing of the Campeche cold-water coral province, southern Gulf of Mexico. Biogeosciences 11, 1799–1815. doi: 10.5194/bg-11-1799-2014
Iversen, M. H., Nowald, N., Ploug, H., Jackson, G. A., and Fischer, G. (2010). High resolution profiles of vertical particulate organic matter export off Cape Blanc, Mauritania: degradation processes and ballasting effects. Deep Sea Res. I 57, 771–784. doi: 10.1016/j.dsr.2010.03.007
Iversen, M. H., and Ploug, H. (2010). Ballast minerals and the sinking carbon flux in the ocean: carbon-specific respiration rates and sinking velocities of marine snow aggregates. Biogeosciences 7, 2613–2624. doi: 10.5194/bg-7-2613-2010
Iversen, M. H., and Robert, M. L. (2015). Ballasting effects of smectite on aggregate formation and export from a natural plankton community. Mar. Chem. 175, 18–27. doi: 10.1016/j.marchem.2015.04.009
Jackson, G. A. (1993). Flux feeding as a mechanism for zooplankton grazing and its implications for vertical particulate flux. Limnol. Oceanogr. 38, 1328–1331. doi: 10.4319/lo.1993.38.6.1328
Jackson, G. A., and Checkley, D. M. Jr. (2011). Particle size distribution in the upper 100 m water column and their implications for animal feeding in the plankton. Deep Sea Res. I 58, 283–297. doi: 10.1016/j.dsr.2010.12.008
Jackson, G. A., and Kiørboe, T. (2008). Maximum phytoplankton concentrations in the sea. Limnol. Oceanogr. 53, 395–399. doi: 10.4319/lo.2008.53.1.0395
Jackson, G. A., Maffione, R., Costello, D. K., Alldredge, A. L., Logan, B. E., and Dam, H. G. (1997). Particle size spectra between 1 μm and 1 cm at Monterey Bay determined using multiple instruments. Deep Sea Res. I 44, 1739–1767. doi: 10.1016/s0967-0637(97)00029-0
Jackson, G. A., Waite, A. M., and Boyd, P. W. (2005). Role of algal aggregation in vertical carbon export during SOIREE and in other low biomass environments. Geophys. Res. Lett. 32:L13607. doi: 10.1029/2005GL023180
Jickells, T. D., An, Z. S., Andersen, K. K., Baker, A. R., Bergametti, G., Brooks, N., et al. (2005). Global iron connections between desert dust, ocean biogeochemistry, and climate. Science 308, 67–71. doi: 10.1126/science.1105959
Karakaş, G., Nowald, N., Blaas, M., Marchesiello, P., Frickenhaus, S., and Schlitzer, R. (2006). High-resolution modeling of sediment erosion and particle transport across the northwest African shelf. J. Geophys. Res. 111:C06025. doi: 10.1029/2005JC003296
Karakaş, G., Nowald, N., Schafer-Neth, C., Iversen, M., Barkmann, W., Fischer, G., et al. (2009). Impact of particle aggregation on vertical fluxes of organic matter. Prog. Oceanogr. 83, 331–341. doi: 10.1016/j.pocean.2009.07.047
Lavery, A. C., Chu, D., and Moum, J. N. (2009). Measurements of acoustic scattering from zooplankton and oceanic microstructure using a broadband echosounder. ICES J. Mar. Sci. 67, 1–16.
Lombard, F., Boss, E., Waite, A. M., Uitz, J., Stemmann, L., Sosik, H. M., et al. (2019). Globally consistent quantitative observations of planktonic ecosystems. Front. Mar. Sci. 6:196. doi: 10.3389/fmars.2019.00196
Lundsgaard, C. (1995). “Use of a high viscosity medium in studies of aggregates,” in Sediment Trap Studies in the Nordic Countries, eds S. Floderus, A. S. Heisakanen, M. Oleson, and P. Wassmann (Nurmijarvi: Nurmiprint Oy).
Mahowald, N., Kohfeld, K., Hansson, M., Balkanski, Y., Harrison, S. P., Prentice, I. C., et al. (1999). Dust sources and deposition during the last glacial maximum and current climate: a comparison of model results with paleodata from ice cores and marine sediments. J. Geophys. Res. Atmos. 104, 15895–15916. doi: 10.1029/1999jd900084
Many, G., Durrieu de Madron, X., Verney, R., Bourrin, F., Renosh, P. R., Jourdin, F., et al. (2019). Geometry, fractal dimension and settling velocity of flocs during flooding conditions in the Rhône ROFI. Estuar. Coast. Shelf Sci. 219, 1–13. doi: 10.1016/j.ecss.2019.01.017
Markussen, T. N. (2016). ParChar - Characterization of suspended particles through image processing in Matlab. J. Open Res. Softw. 4:p.e26. doi: 10.5334/jors.114
Markussen, T. N., and Andersen, T. J. (2014). Flocculation and floc break-up related to tidally induced turbulent shear in a low-turbidity, microtidal estuary. J. Sea Res. 89, 1–11. doi: 10.1016/j.seares.2014.02.001
Markussen, T. N., Elberling, B., Winter, C., and Andersen, T. J. (2016). Flocculated meltwater particles control Arctic land-sea fluxes of labile iron. Sci. Rep. 6:24033.
McDonnell, A. M. P., and Buesseler, K. O. (2010). Variability in the average sinking velocity of marine particles. Limnol. Oceanogr. 55, 2085–2096. doi: 10.4319/lo.2010.55.5.2085
Mullison, J. (2017). “Backscatter estimation using broadband acoustic doppler current profilers - updated,” in Proceedings of the ASCE Hydraulic Measurements & Experimental Methods Conference, Durham, NH.
Nowald, N., Iversen, M. H., Fischer, G., Ratmeyer, V., and Wefer, G. (2015). Time series of in-situ particle properties and sediment trap fluxes in the coastal upwelling filament off Cape Blanc, Mauritania. Prog. Oceanogr. 137, 1–11. doi: 10.1016/j.pocean.2014.12.015
Nowald, N., Karakaş, G., Ratmeyer, V., Fischer, G., Schlitzer, R., Davenport, R., et al. (2006). Distribution and transport processes of marine particulate matter off Cape Blanc (NW-Africa): results from vertical camera profiles. Ocean Sci. Discuss. 3, 903–938. doi: 10.5194/osd-3-903-2006
Passow, U., and De La Rocha, C. L. (2006). Accumulation of mineral ballast on organic aggregates. Glob. Biogeochem. Cycles 20:GB1013.
Picheral, M., Guidi, L., Stemmann, L., Karl, D. M., Iddaoud, G., and Gorsky, G. (2010). The Underwater Vision Profiler 5: an advanced instrument for high spatial resolution studies of particle size spectra and zooplankton. Limnol. Oceanogr. Methods 8, 462–473. doi: 10.4319/lom.2010.8.462
Ploug, H., Iversen, M. H., and Fischer, G. (2008). Ballast, sinking velocity, and apparent diffusivity within marine snow and zooplankton fecal pellets: implications for substrate turnover by attached bacteria. Limnol. Oceanogr. 53, 1878–1886. doi: 10.4319/lo.2008.53.5.1878
Ratmeyer, V., and Wefer, G. (1996). A high resolution camera system (ParCa) for imaging particles in the ocean: system design and results from profiles and a three-month deployment. J. Mar. Res. 54, 589–603. doi: 10.1357/0022240963213565
Seifert, M., Hoppema, M., Burau, C., Friedrichs, A., Geuer, J. K., John, U., et al. (2019). Influence of glacial meltwater on summer biogeochemical cycles in Scoresby Sund, East Greenland. Front. Mar. Sci. 6:412. doi: 10.3389/fmars.2019.00412
Siegel, D. A., and Deuser, W. G. (1997). Trajectories of sinking particles in the Sargasso Sea: modeling of statistical funnels above deep-ocean sediment traps. Deep Sea Res. I 44, 1519–1541. doi: 10.1016/s0967-0637(97)00028-9
Simon, M., Grossart, H. P., Schweitzer, B., and Ploug, H. (2002). Microbial ecology of organic aggregates in aquatic ecosystems. Aquat. Microb. Ecol. 28, 175–211. doi: 10.3354/ame028175
Stemmann, L., Jackson, G. A., and Gorsky, G. (2004). A vertical model of particle size distributions and fluxes in the midwater column that includes biological and physical processes; Part II, Application to a three year survey in the NW Mediterranean Sea. Deep Sea Res. I 51, 885–908. doi: 10.1016/j.dsr.2004.03.002
Thiele, S., Fuchs, B. M., Amann, R., and Iversen, M. H. (2015). Colonization in the photic zone and subsequent changes during sinking determine bacterial community composition in Marine Snow. Appl. Environ. Microbiol. 81, 1463–1471. doi: 10.1128/aem.02570-14
Turner, J. T. (2015). Zooplankton fecal pellets, marine snow, phytodetritus and the ocean’s biological pump. Prog. Oceanogr. 130, 205–248. doi: 10.1016/j.pocean.2014.08.005
van der Jagt, H., Friese, C. A., Stuut, J.-B. W., Fischer, G., and Iversen, M. I. (2018). The ballasting effect of Saharan dust deposition on aggregate dynamics and carbon export: aggregation, settling, and scavenging potential of marine snow. Limnol. Oceanogr. 63, 1386–1394. doi: 10.1002/lno.10779
Waite, A. M., and Nodder, S. D. (2001). The effect of in situ iron addition on the sinking rates and export flux of Southern Ocean diatoms. Deep Sea Res. II Top. Stud. Oceanogr. 48, 2635–2654. doi: 10.1016/s0967-0645(01)00012-1
Keywords: optical systems, particle and aggregate dynamics, marine snow, fecal pellets, spatial and temporal data
Citation: Markussen TN, Konrad C, Waldmann C, Becker M, Fischer G and Iversen MH (2020) Tracks in the Snow – Advantage of Combining Optical Methods to Characterize Marine Particles and Aggregates. Front. Mar. Sci. 7:476. doi: 10.3389/fmars.2020.00476
Received: 07 March 2020; Accepted: 28 May 2020;
Published: 26 June 2020.
Edited by:
Cindy Lee, Stony Brook University, United StatesReviewed by:
Adrian Benedict Burd, University of Georgia, United StatesEmilia Trudnowska, Institute of Oceanology, PAN, Poland
Copyright © 2020 Markussen, Konrad, Waldmann, Becker, Fischer and Iversen. This is an open-access article distributed under the terms of the Creative Commons Attribution License (CC BY). The use, distribution or reproduction in other forums is permitted, provided the original author(s) and the copyright owner(s) are credited and that the original publication in this journal is cited, in accordance with accepted academic practice. No use, distribution or reproduction is permitted which does not comply with these terms.
*Correspondence: Morten H. Iversen, bWl2ZXJzZW5AbWFydW0uZGU=; bW9ydGVuLml2ZXJzZW5AYXdpLmRl
†Present address: Thor N. Markussen, Jardin Jolivet, Cronat, France