 Yingying Ye
 Chengrui Yan
 Wansuk Senanan
 Baoying Guo
 Kaida Xu
 Zhenming Lü
- 1National Engineering Research Center for Marine Aquaculture, Zhejiang Ocean University, Zhoushan, China
- 2National Engineering Laboratory of Marine Germplasm Resources Exploration and Utilization, Zhejiang Ocean University, Zhoushan, China
- 3Department of Aquatic Science, Faculty of Science, Burapha University, Chon Buri, Thailand
- 4Scientific Observing and Experimental Station of Fishery Resources for Key Fishing Grounds, MOA, Key Laboratory of Sustainable Utilization of Technology Research, Marine Fisheries Research Institute of Zhejiang, Zhoushan, China
The hard clam Meretrix meretrix is ecologically and economically important in the coastal regions of China. We evaluated the genetic diversity and population structure among eight M. meretrix samples from the Yellow Sea (YS) and South China Sea (SCS) using nine microsatellite DNA loci. Both conventional and model-based population genetic analyses suggested significant genetic divergence between YS and SCS regions (pairwise FST values ranging from 0.014 to 0.056). Samples within each region were not genetically different, except for Zhanjiang which clearly differed from other the four SCS samples. Membership coefficients, estimated by STRUCTURE, suggested some genetic admixture of the two genetic clusters in ZJ. Population genetic structure was detected in SCS region. We detected moderate levels of genetic variation in all eight samples (mean A = 16.111–22.111, mean Ar = 14.512–19.029, mean Ho = 0.736–0.843, mean He = 0.823–0.868) and two genetic clusters (mean A = 27.167–29.833, mean Ae = 8.834–9.471, mean Ar = 26.032–27.005, mean Ho = 0.824–0.839, and mean He = 0.821–0.850). Low levels of Ne estimates were detected in M. meretrix populations. None of the genetic populations had signs of recent genetic bottlenecks. Knowledge on genetic variation and population structure of M. meretrix populations along the Chinese coasts will support the aquaculture management and conservation of M. meretrix, and will provide insights for stock selection in selective breeding programs for these species and delineating management units.
Introduction
The hard clam Meretrix meretrix (Linnaeus, 1758) is one of the largest clam species among the Venus-shells (Veneridae). It is an important marine bivalve with nutritive and medical value, and widely distributed in Korea, Japan, China, Vietnam, Thailand, India, and Saudi Arabian Gulf (Tang et al., 2006; Wang et al., 2006; Xie et al., 2012). Due to its high commercial value, the price has increased from ¥10 to more than ¥100 per kilogram of some areas in China, the clam has widely been cultured in China since 1992 (Ho and Zheng, 1994; Chen et al., 2004; Li et al., 2011). With the advances of breeding technologies, aquaculture of M. meretrix in China has been rapidly expanding, cultural production has reached 350,000–400,000 tons per year since the beginning of the 21st century (Chen et al., 2004). The aquaculture industry still relies heavily on natural spat (Wang et al., 2011). With the rapid increase in demand, natural stocks of M. meretrix have declined dramatically. For the past few years, over-exploitation, damage to natural habitat and bacteria or viruses was serious problems that restrict the culture industry (Tang et al., 2006; Wang et al., 2019). In 2003, about 10,000 tons of adults and juveniles died in Rudong County, Jiangsu Province, resulting in a tremendous economic loss of ¥100,000,000 (Zhan, 2003). A large number of individuals died suddenly indicated that a bottleneck may occur by a sharp reduction in the size of the population (Lande, 1988). Over the last decade, selective breeding programs were developed to improve the M. meretrix industry, particularly to provide cultivated seed with better performance than wild seed (Liu et al., 2006). However, inappropriate breeding programs could lead to reduction of genetic variability, as a result of inbreeding associated with the use of a small number of parents to establish and maintain a strain (Yu and Li, 2007). Therefore, the genetic conservation of M. meretrix is essential for the sustainable management of natural resources and to increase aquaculture production (Lu et al., 2011a). Lu et al. (2011a) developed 33 SSR loci for M. meretrix and performed further the parentage determination for this species (Lu et al., 2011b). Zhu et al. (2012) conducted the genetic analysis among four strains of different shell colors of M. meretrix using microsatellite markers without population genetic analysis along China coast. Knowledge of genetic diversity and population structure is critical for understanding population dynamics, which is important for delineating management units and maintaining a sustainable fishery (Thorpe et al., 2000). It can be used to guide the selection of high-quality parents.
Population genetic structure of marine organisms results from multiple processes, numerous factors may affect gene flow in planktonic life stages by promoting or limiting either the mean or the variance of larval dispersal distance, and these effects may be more widespread than previously thought (Benzie, 2000). Factors effecting gene flow can be divided roughly into biological and physical categories, although the interactions between them may be most important (Jackson, 1986). In the present study, we employed polymorphic microsatellite loci to make an initial exploration of the factors that contribute to population genetic structure of M. meretrix in the Yellow Sea (YS) and South China Sea (SCS). The fishing activities are abundant in both seas and the cultivation of M. meretrix in YS has overwhelming superiority along Chinese coast based on the sandy ecological environment which is easy for clam inhabiting. Our objectives were to characterize the genetic diversity within and between populations, identify management units for this clam species, and estimate levels of gene flow among them. The results can aid the design of spatial aquaculture management and conservation strategies for hard clam inhabiting the YS and SCS.
Materials and Methods
Sample Collections and Genomic DNA Preparation
A total of 374 individuals of M. meretrix were collected from eight coastal localities in the YS (Lianyungang: LYG, Yancheng: YC, and Nantong: NT) and SCS (Zhangzhou: ZZ, Zhuhai: ZH, Zhanjiang: ZJ, Haikou: HK, and Beihai: BH) areas (Figure 1 and Table 1). All individuals were collected between October 2014 and May 2015. To avoid confusion among specimens of other coexisting clam species, all the individuals were identified by experienced fisheries researchers according to the identification key of bivalve mollusks. The feature of apex of shell toward the front without radial grain was used to identify M. meretrix from similar clams. Tissues from adductor muscle were dissected from fresh specimens and preserved in 95% ethanol and stored frozen at −20°C prior to genetic analysis.
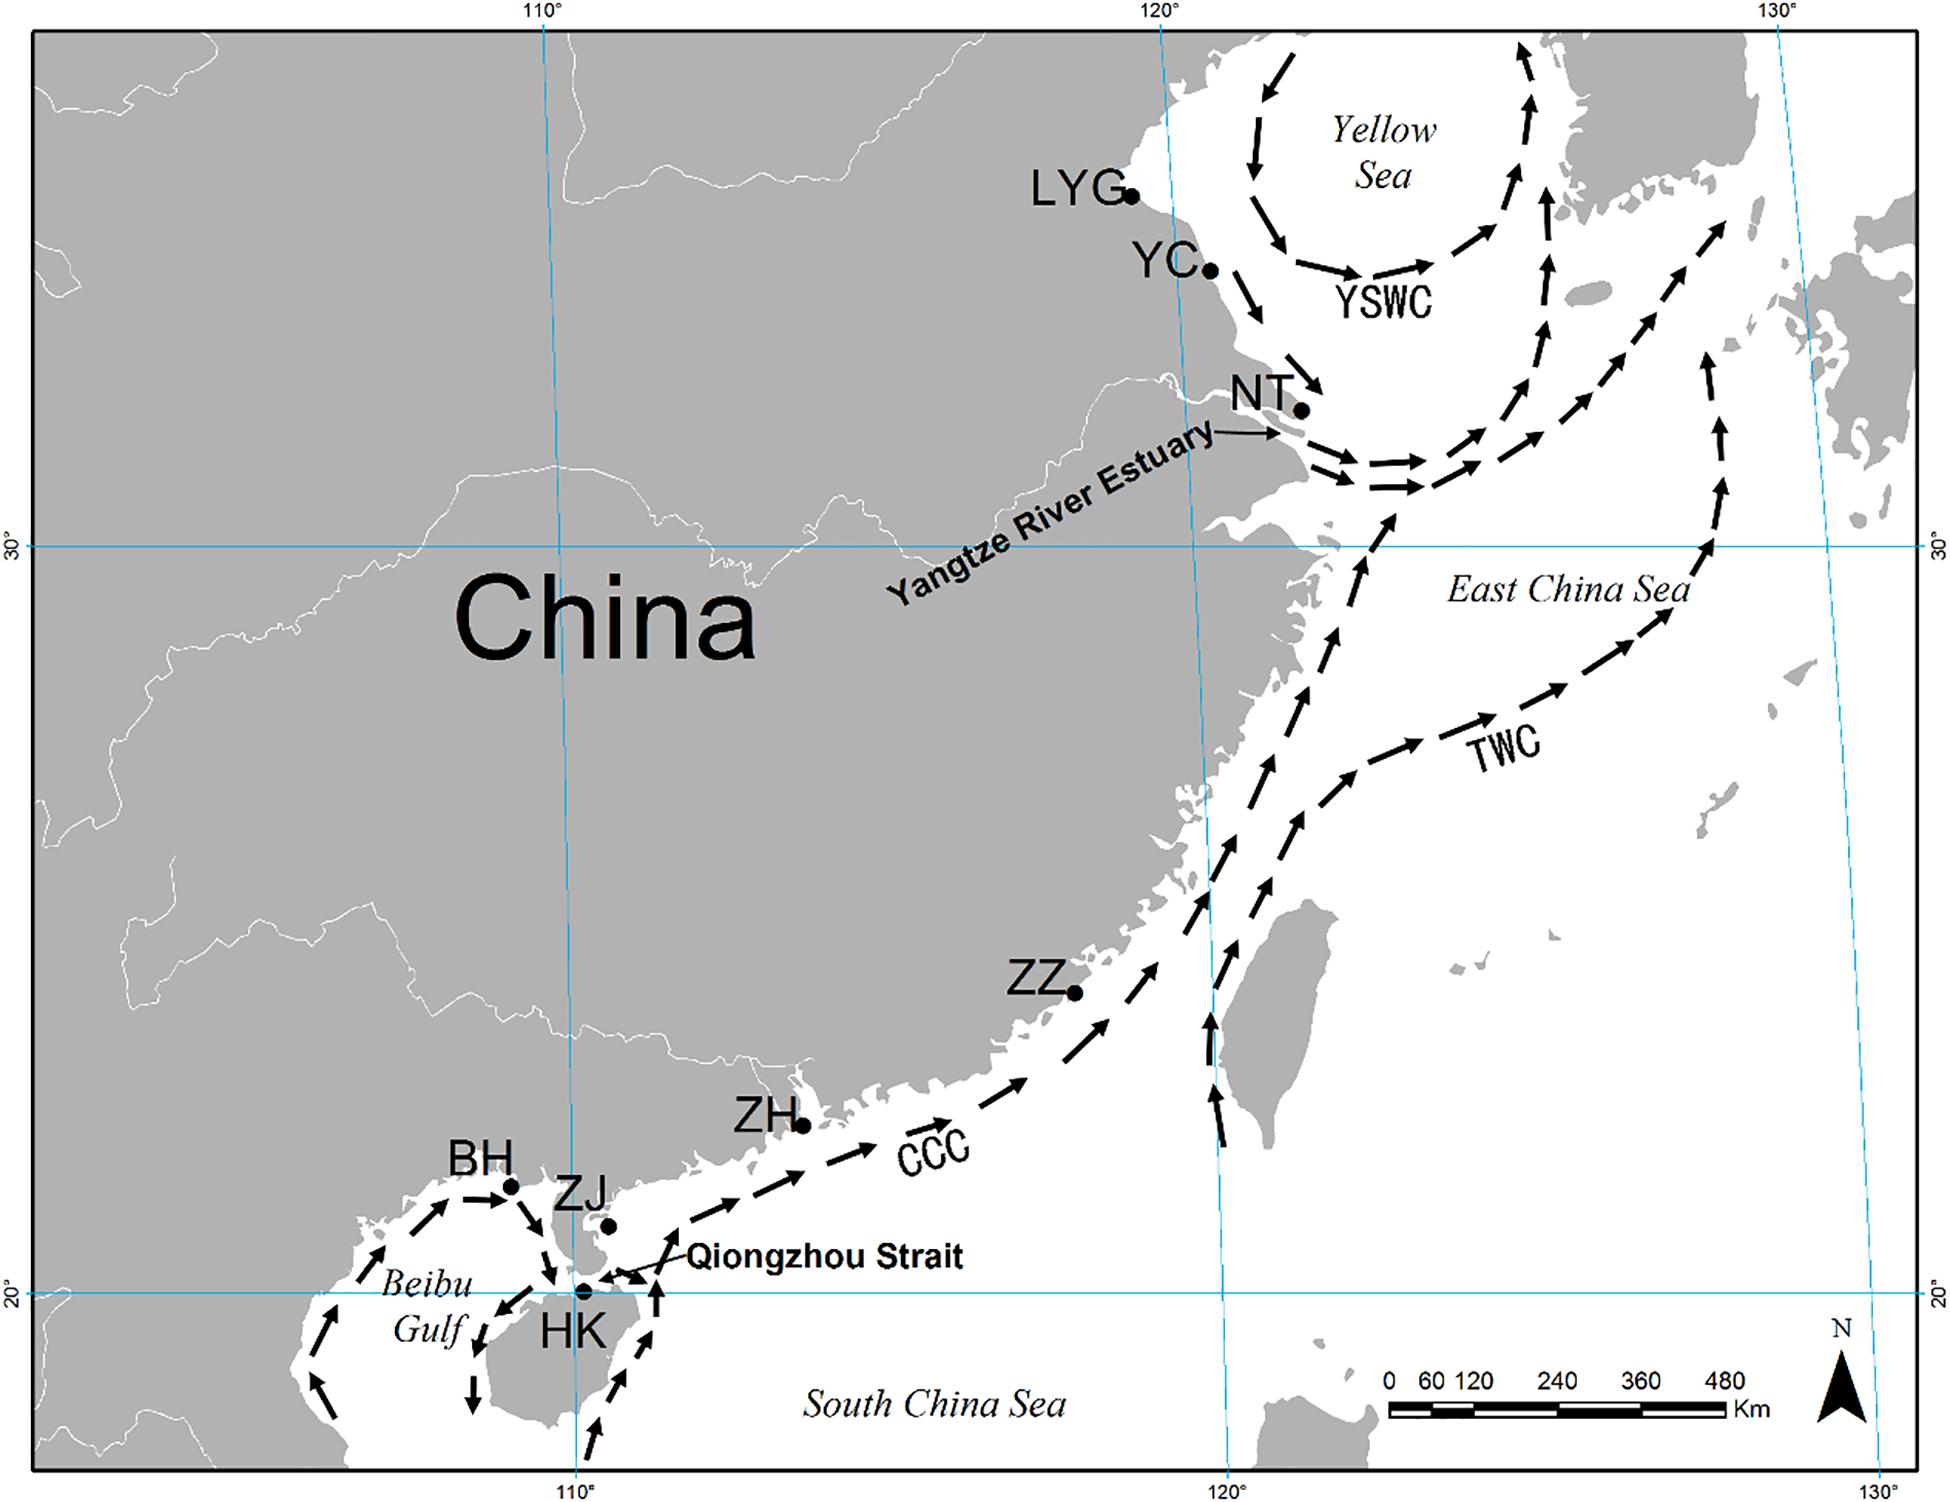
Figure 1. Map showing eight sampling localities for Meretrix meretrix and summer oceanic currents along the coast of China. CCC, China Coastal Current; YSWC, Yellow Sea Warm Current; TWC, Taiwan Warm Current.
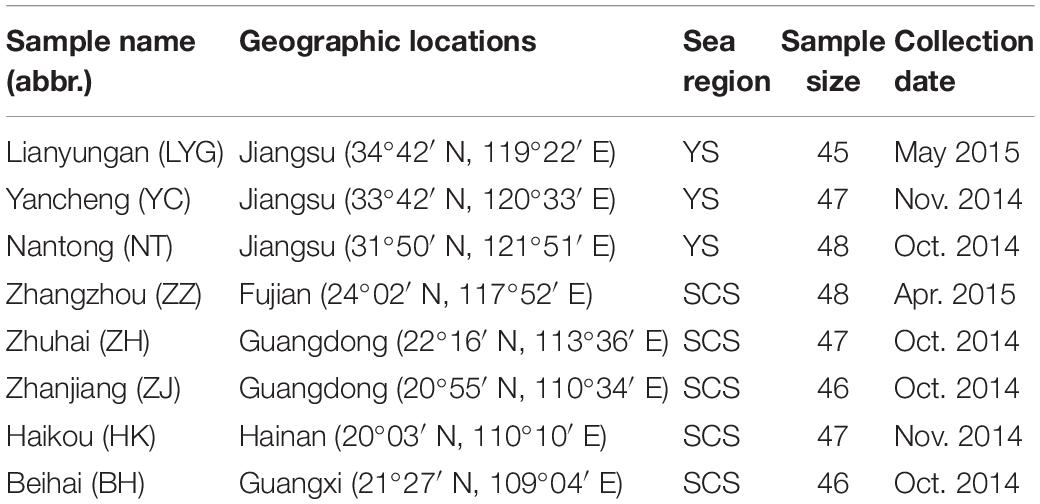
Table 1. Collection detail of clam M. meretrix samples.
Extraction of the total genomic DNA from each individual was performed using the salt-extraction procedure as described in Aljanabi and Martinez (1997) with slight modifications (i.e., 15 μl of 20 mg/ml protenase K and 10 μl of 10 mg/ml RNase were added and mixed well before overnight incubate). The quantity and quality of the isolated DNA was examined by NanoDrop 2000 spectrophotometer (Thermo Scientific) and by electrophoresis in agarose gel stained with SYBR Safe (Invitrogen Corp., Carlsbad, CA, United States); once extracted, DNA was stored in 1 × TE buffer, then quantified and diluted to approximately 20 ng/μl for further polymerase chain reactions (PCRs).
Microsatellite Loci
We selected nine microsatellite loci developed for M. meretrix based on their genetic diversity information (i.e., high level of heterozygosity and number of alleles were more than 10). These loci included the MM08, MM10, MM11, MM14, MM15, MM19, MM22, MM25, and MM26 (Lu et al., 2011a,b). Forward primer of each pair was labeled with a fluorescent dye (6-FAM or HEX; Applied Biosystems, Foster City, CA, United States) at the 5’end.
Polymerase chain reaction was performed in a final volume of 15 μl containing 20–50 ng template DNA, 1.5 pmol of each forward and reverse primer, 0.25 mM dNTPs (Fermentas), 1 × PCR buffer (Fermentas), 3.75 mM MgCl2, and 1 unit Taq DNA polymerase (Fermentas). Cycling conditions for all assays included an initial denaturation at 94°C for 3 min; 35 cycles of 94°C for 30 s (denaturation), 51–58°C for 30 s (annealing), and 72°C for 30 s (elongation) and a final elongation at 72°C for 5 min. PCR products were sent to a commercial genetic analysis service (Generay Biotech Co., Ltd., Shanghai, China) for electrophoresis and genotyping on an ABI Prism 3730 automatic DNA sequencer (Applied Biosystems). The alleles were scored using Gene Mapper software v5.0 (Applied Biosystems, Forest City, CA, United States) with a ROX 500 size standard, using an internal control for allele calling; each allele was coded by its size in nucleotides (base pairs).
Microsatellite Analyses
Before population genetic data analysis, we used MICRO-CHECKER v2.2.3 software (Van Oosterhout et al., 2004) to double-check the effect of null alleles and allele scoring errors. We removed individuals with more than two missing loci and loci with null alleles present across most of the individuals (the final number of individuals used and microsatellite loci see section “Results”).
We took two approaches to detect population genetic structure. First, we treated each sample as a separate unit and we performed conventional population genetic analysis [e.g., analysis of molecular variance (AMOVA), pairwise FST, and genetic distance measures]. Second, we performed a model-based clustering analysis. This latter approach does not presume genetic differentiation based on geographic locations, but instead it seeks for sets of multi-locus genotypes that minimize the departure from Hardy Weinberg equilibrium (HWE) and linkage disequilibrium (LD) (within set number K genetic clusters).
For the conventional approach, first we partitioned the overall genetic variation to three sources of variation, namely, among samples, among individuals within samples, and within individuals using AMOVA implemented in ARLEQUIN v3.5 (Excoffier and Lischer, 2010). P-values were obtained through 1,000 permutations. The pairwise F-statistics (FST) value and an exact-test P-value were estimated to assess the level of genetic divergence using ARLEQUIN v3.5 (10,000 permutations) (Excoffier and Lischer, 2010). The multiple simultaneous tests of FST values were adjusted using the sequential Bonferroni procedure (Rice, 1989). We generated a dendrogram illustrating relationships among samples based on Cavalli-Sforza and Edwards (1967) genetic distance (DC) by using the neighbor-joining algorithm (Saitou and Nei, 1987). The dendrograms based on multiple genetic distance matrixes (1,000 bootstrap replications), computed in the Microsatellite Analyzer software (Dieringer and Schlötterer, 2003) were constructed using NEIGHBOR and CONSENSE implemented in the PHYLIP v3.69 software package (Felsenstein, 2004). The heat map of pairwise FST values and the plot of the NJ tree were constructed by the R package ggtree (Yu et al., 2017). The consensus tree was visualized by MEGA v7.0 (Kumar et al., 2016).
The model-based Bayesian clustering procedure in the program STRUCTURE v2.3.4 (Pritchard et al., 2000) was used to investigate the most likely number of clusters (K) within and among the eight locations and the level of admixture within a cluster. We initially simulated likelihood values for a range of predetermined K values (i.e., 1–10; in our case) and examined the distribution of ΔK, an ad hoc statistic based on the rate of change in the log probability of the data between successive K values (Evanno et al., 2005). If population structure exists, the likelihood values of successive K values should show some drastic changes. The most likely K value is the modal value of this ΔK distribution. We performed 20 independent runs for each value of K (the number of putative populations) from 1 to 10; each with 300,000 MCMC iterations, following a burn-in period of 50,000. We used the admixture model with correlated allele frequencies, and default parameter settings. The ΔK statistics were determined by STRUCTURE HARVESTER v0.6.94 (Earl and vonHoldt, 2012). Then, we examined the averaged proportion of membership of each cluster against our samples.
We analyzed genetic diversity within each sample as well as within each genetically discrete unit identified by the Bayesian approach (K). We assessed the microsatellite variability in terms of the number of alleles per locus (A), effective number of alleles per locus (Ae), observed (Ho) and expected (He) heterozygosities, and inbreeding coefficient (Fis) using the program GENALEX v6.5 (Peakall and Smouse, 2012). To standardize the number of alleles across all samples based on equal number of individuals per sample, allelic richness (Ar) was estimated based on the smallest sample size (n = 40 and 135 for an assessment of the samples and the genetic clusters, respectively), using the program FSTAT v2.9.3 (Goudet, 2001).
GENEPOP v4.0 (Rousset, 2008) was used to determine for departure from HWE by using a Markov chain approximation (Guo and Thompson, 1992) with parameters set at 10,000 dememorizations, 100 batches, and 5,000 iterations per batch. We also used GENEPOP v4.0 (Rousset, 2008) to test for non-random association of alleles among loci (genotypic LD). Probability thresholds for the HWE and LD tests were adjusted for the number of simultaneous tests using the sequential Bonferroni correction (Rice, 1989).
The effective population size (Ne) in each sample based on the LD method was estimated by using NeESTIMATOR v2.0 (Do et al., 2014). We used 0.01 as the lowest allele frequency and putative 95% confidence intervals were calculated by using a parametric method (Do et al., 2014). The two-phase model (TPM) with 90% single-step mutations and 10% multiple-step mutations (1,000 replications) and the mode-shift test (Luikart et al., 1998) based on an L-shaped distribution of allele frequency under mutation-drift equilibrium were used to test for recent bottlenecks in each sample by using BOTTLENECK v1.2.02 (Piry et al., 1999). The significant heterozygote excess at each locus was used to determine the one-tailed Wilcoxon signed-rank test (Luikart and Cornuet, 1998).
Results
Variation of Markers
All nine microsatellite loci examined were polymorphic in all individuals. A total of 324 alleles were observed across nine loci in eight M. meretrix samples (Table 2). The total number of alleles per locus ranged from 18 (MM08 and MM22) to 63 (MM14). At a locus level, the average number of alleles per locus ranged from 9.250 (MM22) to 29.625 (MM14), the average effective number of alleles per locus across all samples ranged from 2.130 (MM22) to 16.951 (MM19), and the mean allelic richness ranged from 7.967 (MM22) to 24.055 (MM14). The observed and expected heterozygosities averaged across samples ranged from 0.410 (MM22) to 0.970 (MM25) and from 0.500 (MM22) to 0.912 (MM14), respectively.
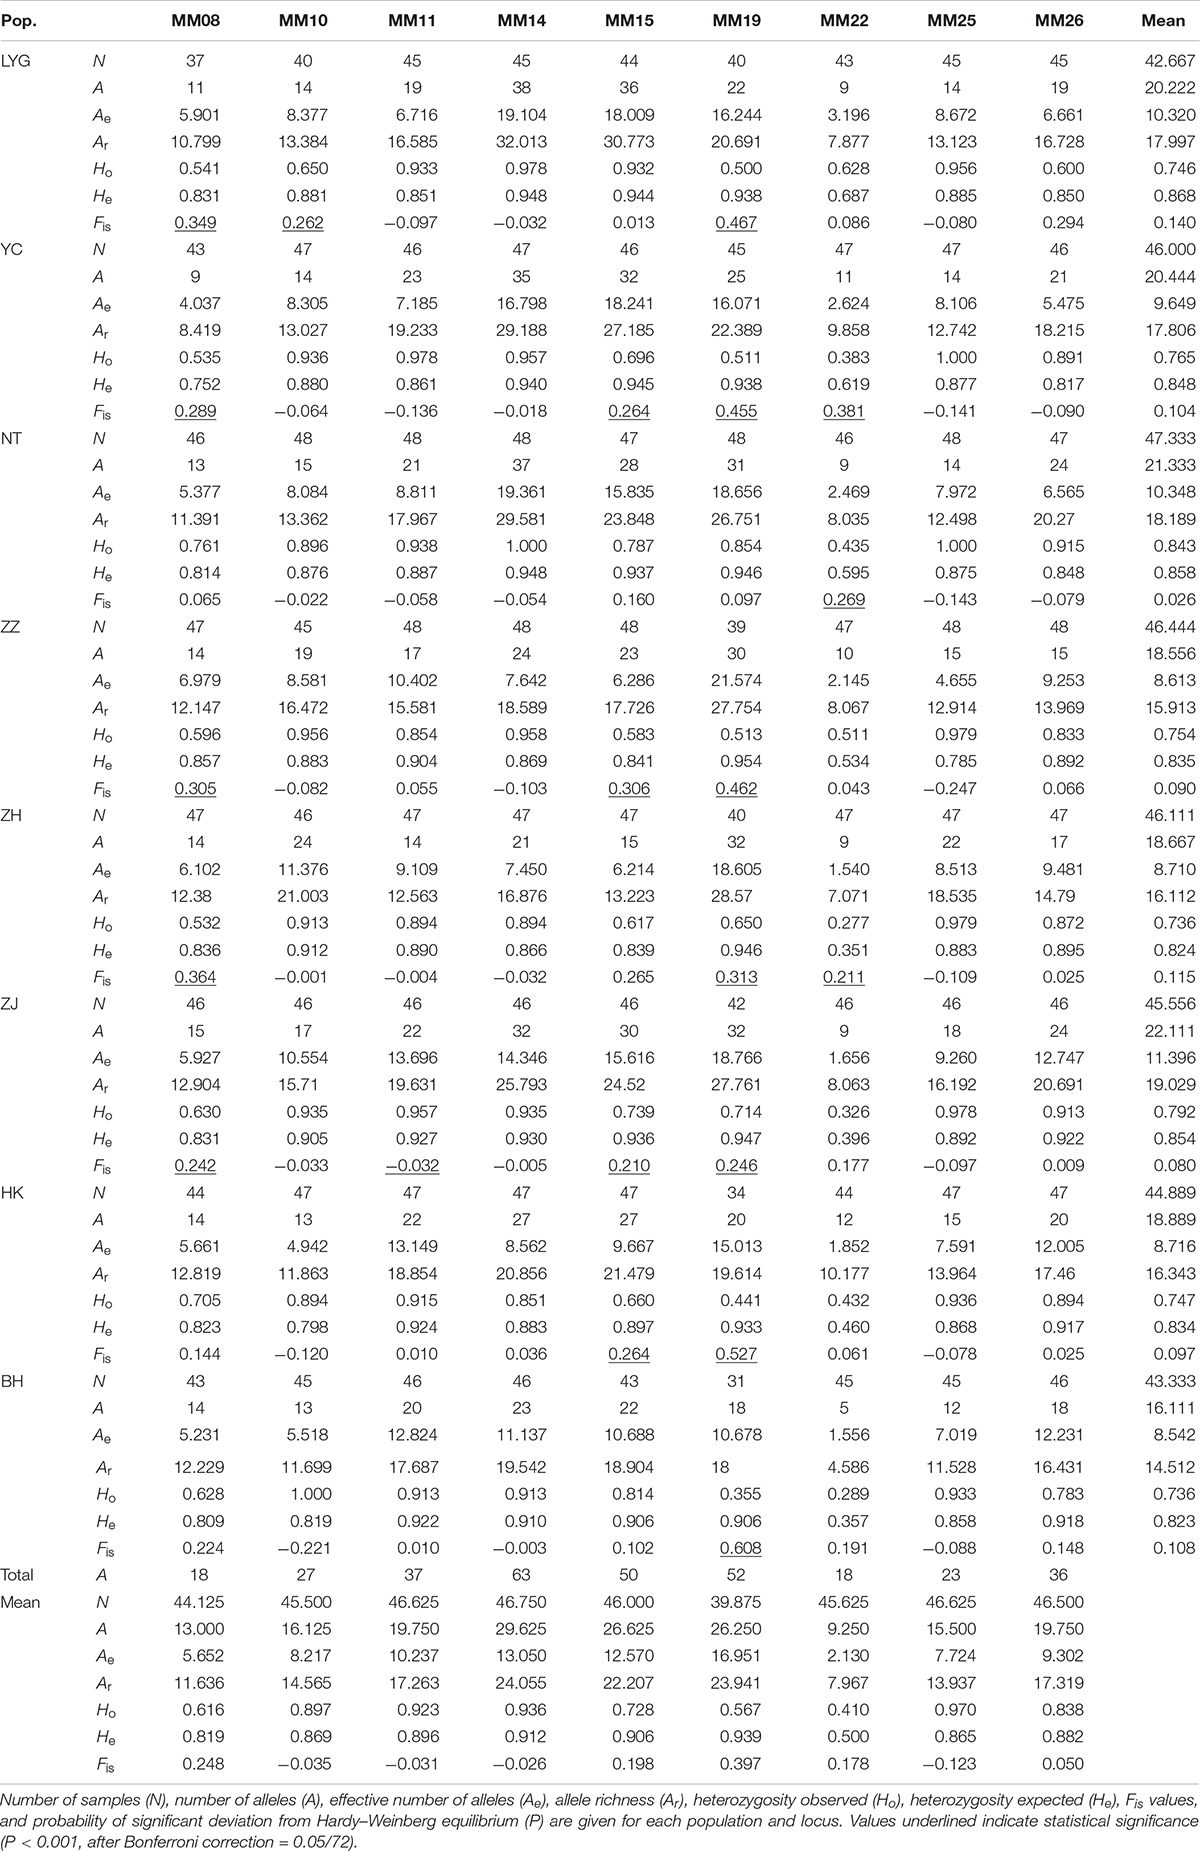
Table 2. Allelic variability at nine microsatellite loci in clam M. meretrix along the coasts of China.
The observed genotype frequencies were tested for agreement with HWE (Table 2). After sequential Bonferroni correction for multiple tests (Rice, 1989), of the 72 sample-locus cases (eight samples × nine loci), 21 cases (LYG, YC, ZZ, ZH, and ZJ at MM08; LYC at MM10; ZJ at MM11; YC, ZZ, ZJ, and HK at MM15; all the samples except NT at MM19; YC, NT, and ZH at MM22) showed significant deviations from HWE (P < 0.001, after Bonferroni correction = 0.05/72). Locus MM19 had the highest frequency of HWE departures (seven out of eight tests at this locus). Most of the 21 deviations displayed significant heterozygote deficiencies (Ho < He). Micro-checker analysis (Van Oosterhout et al., 2004) for the presence of null alleles suggested that the possible presence of null alleles at MM19 in all eight samples, MM08 in seven samples (except NT), and MM15 in seven samples (except LYG). Therefore, we removed genotypes at MM08, MM15, and MM19 from further analyses that required HWE. After removing MM08, MM15, and MM19, no LD was found among locus pairs after Bonferroni correction.
Genetic Differentiation Among Samples
Both conventional and Bayesian approaches suggested genetic divergence between two large coastal areas, YS (LYG, YC, and NT) and SCS (ZZ, ZH, ZJ, HK, and BH) (Figures 2, 3). AMOVA revealed that variation among-regions contributed 6% (P = 0.01), among-samples within regions contributed 1% (P = 0.01), and within-population accounted for 93% (P = 0.01) of genetic variation. Pairwise FST values between YS and SCS ranged from 0.014 to 0.056 (Figure 2). The lowest and highest divergences between YS and SCS populations were ZJ-NT and LYG-BH, respectively. Of 28 pairwise FST values, 22 values were statistically different from zero (P < 0.002; P-value after adjusting for multiple comparisons = 0.05/28). Three samples from the YS were not genetically different. Pairwise FST values revealed remarkable differentiation between YS samples and SCS samples. For the SCS samples, population subdivision was observed, with ZJ genetically distinct from the others. Pairwise FST analyses also suggested that ZZ–ZH, ZZ–BH, and ZH–HK pairs were genetically different. The estimated number of migrant per generation (Nm), a measure of gene flow among samples, ranged from 6.442 to 19.041 (among YS and SCS) and from 19.072 to 56.830 (within YS and SCS), which suggested considerable gene flow within each coastal region (Figure 3B).
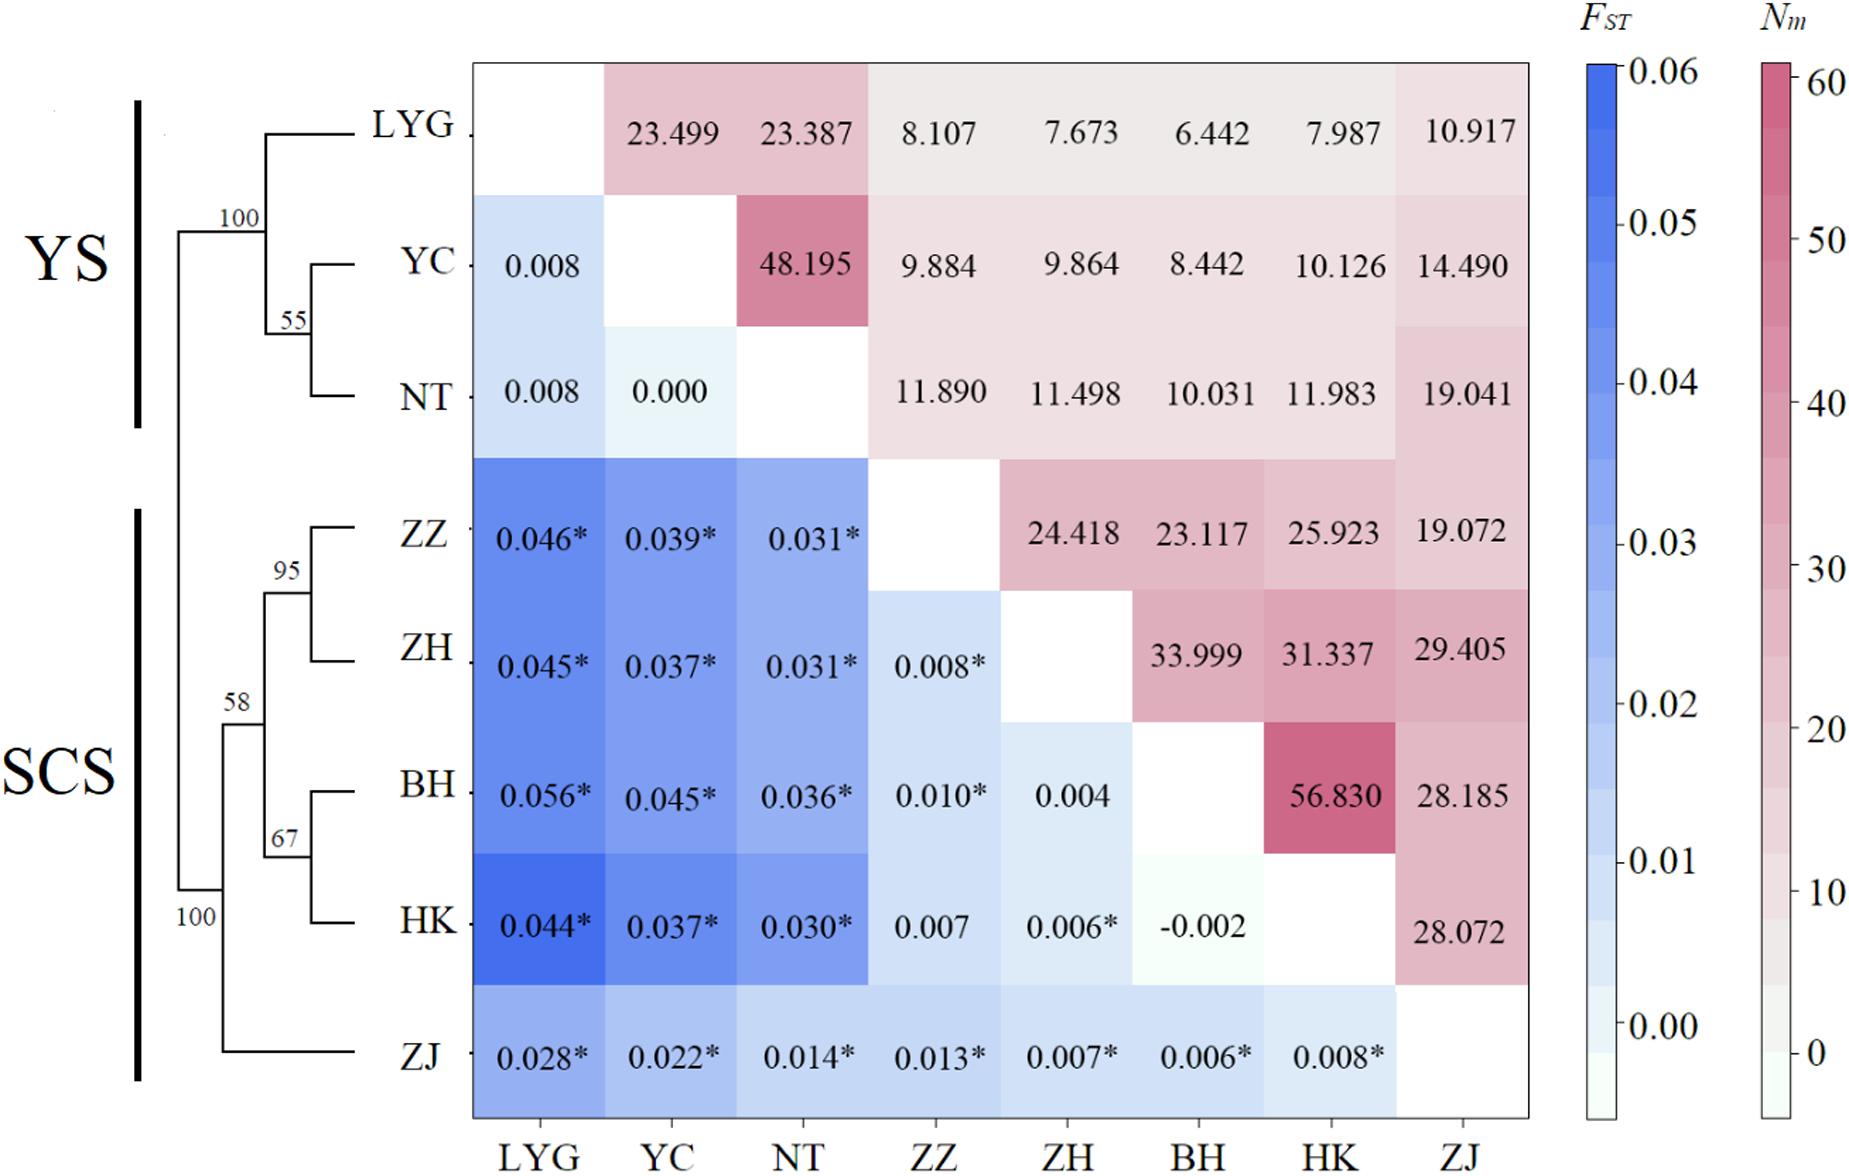
Figure 2. Matrix showing pairwise differentiation estimates (FST) between eight M. meretrix samples based on six microsatellite loci (below the diagonal), and estimated number of migrants per generation (Nm) among samples (above the diagonal). Values with * indicate statistical significant difference from zero (P < 0.002, P-values adjusted for multiple comparisons using Bonferroni correction = 0.05/28). Neighbor-joining dendrogram based on Cavalli-Sforza and Edwards’ genetic distance (DC) values among eight M. meretrix samples from Chinese coastal areas based on six microsatellite loci Bootstrap values supporting each node indicate the percentage of phylogenetic tree sharing that node among 1,000 bootstrap replicates.
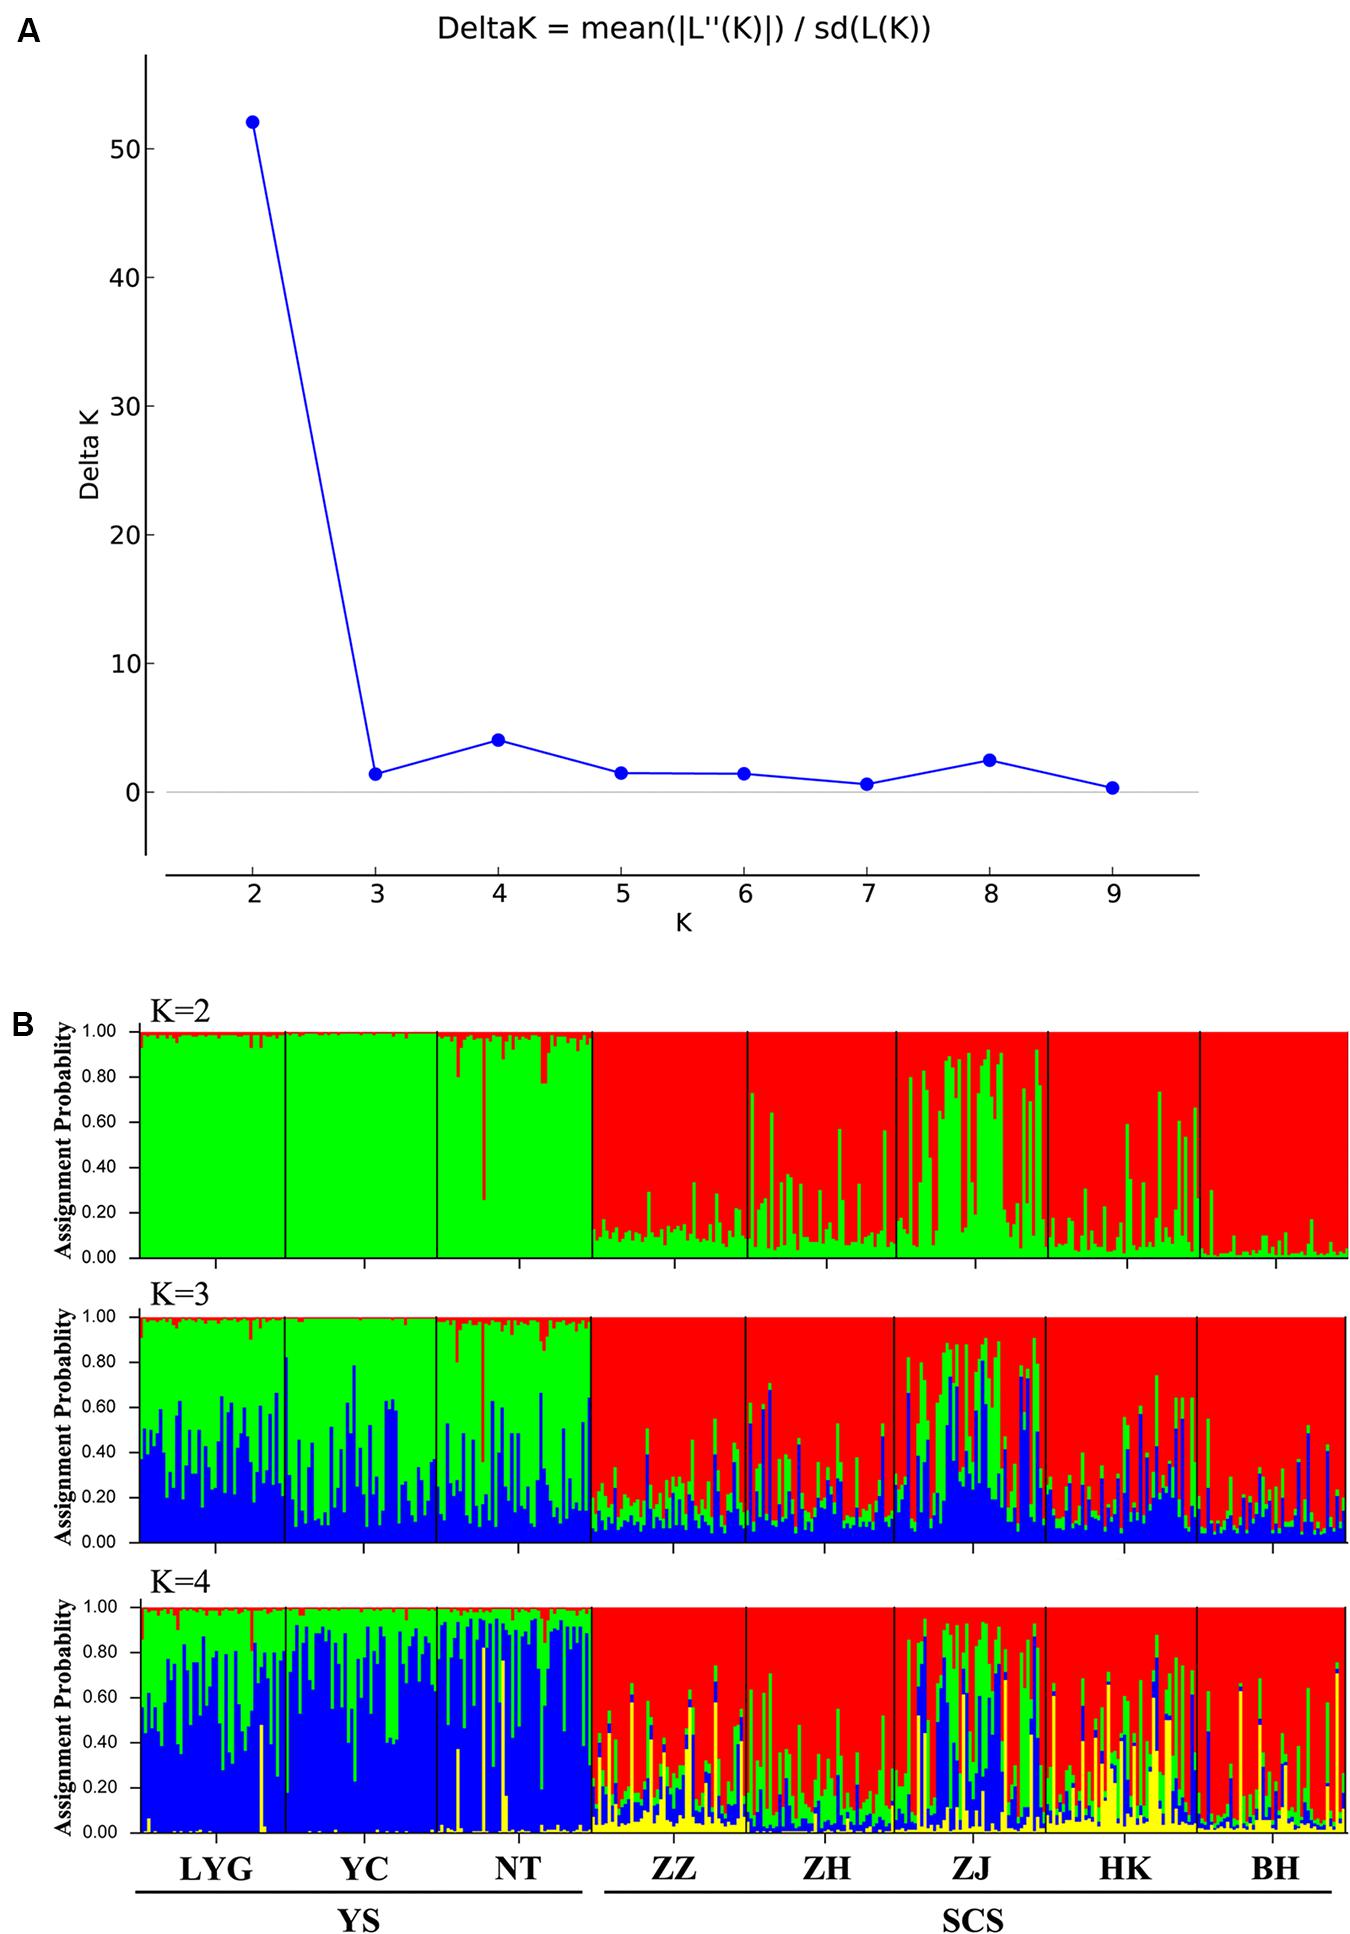
Figure 3. (A) Magnitude of ΔK statistics as a function of the number of putative genetic clusters, K, for Chinese populations of M. meretrix based on six microsatellite loci. (B) Results of STRUCTURE analysis with membership coefficients of 374 M. meretrix individuals for K = 2 collected from eight locations along the Chinese coast based on six polymorphic microsatellite loci.
The neighbor-joining phylogenetic tree also suggested two major clusters (the two major clusters bootstrap value 100; Figure 2). Samples from the YS formed one basal cluster and another cluster consisted of samples from the SCS. However, ZJ was clearly differentiated from the other four SCS samples.
The model-based STRUCTURE clustering analyses suggested two major genetic clusters (Figure 3A). The assignments of individuals within the clusters were consistent with geographic locations with samples in close proximity and within the same coastal areas being more genetically similar (Figure 3B). Within the SCS group, the ZJ sample had a distinct genetic composition from other samples and looked like a mixture of YS and SCS samples (Figure 3B).
Genetic Diversity Within Populations
The two inferred clusters of genetic populations, YS (mean A = 27.167, mean Ae = 9.471, mean Ar = 27.005, mean Ho = 0.839, and mean He = 0.850) and SCS (mean A = 29.833, mean Ae = 8.834, mean Ar = 26.032, mean Ho = 0.824, and mean He = 0.821) had a comparable levels of genetic diversity (Table 3). Of 12 tests (two populations × six loci), five tests (YS at MM22; SCS at MM10, MM11, MM22, and MM25) significantly deviated from HWE (P < 0.004, after Bonferroni correction = 0.05/12). No LD was found among microsatellite locus pairs after Bonferroni correction.
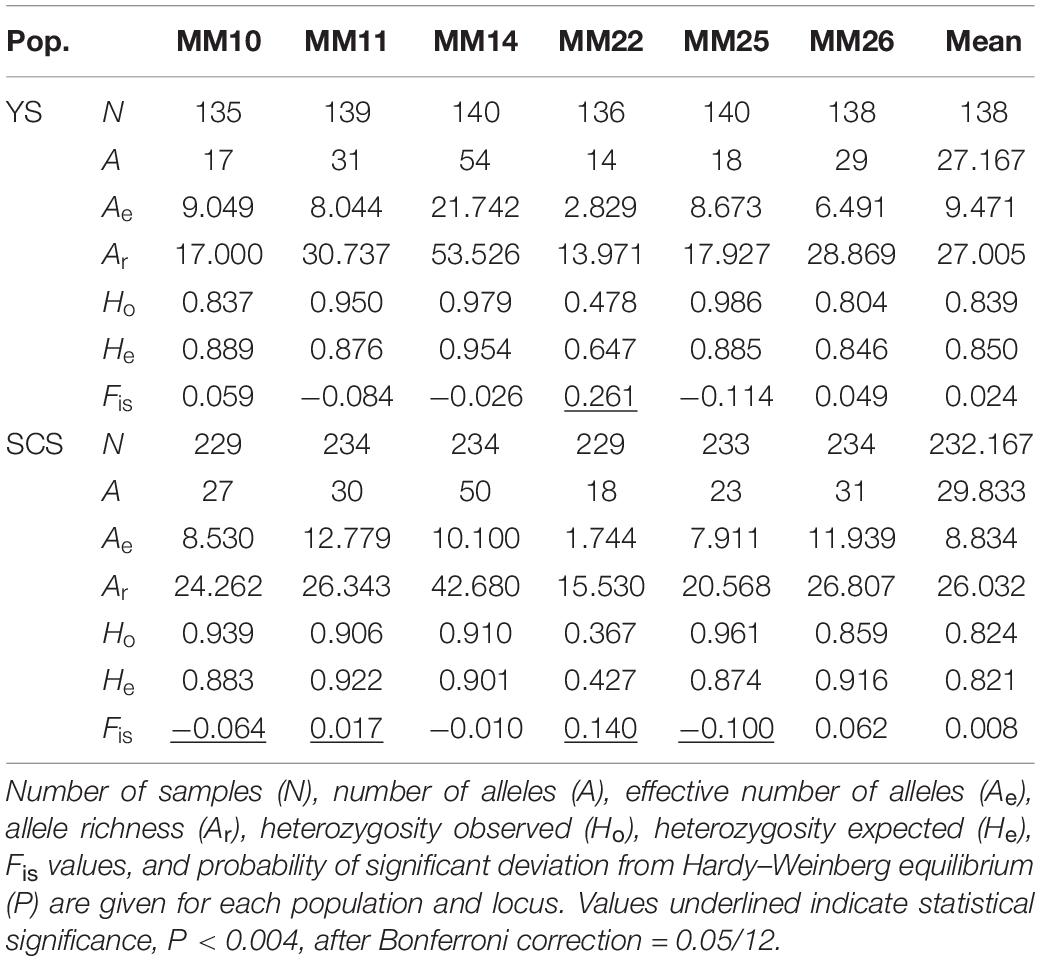
Table 3. Allelic variability at six microsatellite loci in two genetic clusters of M. meretrix.
The two inferred population clusters, YS and SCS, had similar effective population size (Ne) estimates with Ne for YS and SCS being 93.4 (CI = 82.4–106.7) and 78 (CI = 70.0–87.6). Excluding ZJ, the Ne estimate for SCS was 73.2 (CI = 64.7–83.2) (Table 4). For the bottleneck tests, under the TPM, we did not detect significant heterozygote excess in other of the clusters (Table 4). Additionally, the mode-shift test showed a normal L-shaped distribution pattern of allele frequencies in all samples. The results implied the lack of bottleneck events in the recent histories of these populations.
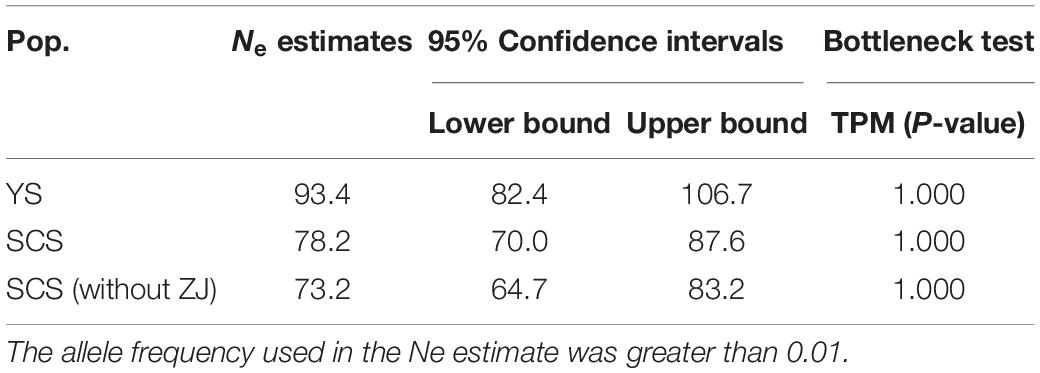
Table 4. Estimates and 95% confidence intervals of effective population size (Ne) based on linkage disequilibrium and the detection of bottlenecks based on Wilcoxon’s test for eight samples and the two genetic clusters of M. meretrix using six microsatellite loci.
Discussion
Population Genetic Structure of M. meretrix in the Yellow Sea and South China Sea
The samples of M. meretrix from across the coast of China, excluding the East China Sea area, consists of two genetically distinct groups, the YS (LYG, YC, and NT) and SCS (ZZ, ZH, ZJ, HK, and BH) samples. This genetic division may be due to geographic isolation and oceanographic characteristics of these two areas. The planktonic larval duration (PLD) of M. meretrix is about 1 week with the major spawning period from April to September (Liu and Yang, 2005; Liu et al., 2006). Even though M. meretrix releases pelagic eggs and its pelagic larvae can be transported by strong oceanic currents, the distance between the two locations may serve as a geographical barrier. In addition, the freshwater outflow of the Yangtze River in spring and summer can decrease salinity levels at the river mouth located at the YS/East China Sea. The dilute plume of Yangtze River water can affect nutrient concentrations (Jiang et al., 2006), subsequently phytoplankton biomass (Lin et al., 2011) and hence survival of larvae probably during the reproductive season of M. meretrix, which may act as a dispersal barrier to larval transport between the two coastal areas. Other researchers had detected similar results in other mollusks across a similar geographic scale regardless of different PLD. These species include Crassostrea gigas, Crassostrea ariakensis, Cellana toreuma, Scapharca broughtonii, Meretrix petechialis, Gomphina aequilatera, and Meretrix lamarckii (Yu and Li, 2007; Xiao et al., 2010; Dong et al., 2012; Yu et al., 2015; Wang et al., 2017; Ye et al., 2018; Feng et al., 2020; respectively). For example, Dong et al. (2012) studied population genetics of C. toreuma (PLD similar to M. meretrix) along the coasts of China covering SCS, East China Sea, and YS. They found genetic differentiate of the YS and other populations. Both geographic distance and contemporary oceanographic conditions played important roles in shaping the north-south division of population structure in C. toreuma. The intense discharge from the Yangtze River strongly isolates the YS group from the East and SCS groups.
Interestingly, the results strongly suggested that ZJ is genetically distinct from the SCS population. This sample exhibits the lowest FST values with samples from the YS compared to the other four samples from SCS. Membership coefficients, estimated by STRUCTURE, also suggested genetic admixture of the respective genetic clusters in this sample. It is possible the YS stock has been moved extensively to the SCS for aquaculture purposes. According to local farmers in Zhanjiang (ZJ), juveniles or broodstock used in this area typically are obtained from the largest breeding facility in China in Nantong (NT) located in the YS area. Hence, mixed individuals in ZJ cannot be divided truly from ZJ or NT leading a high membership in ZJ showed in Structure.
Low FST values among samples within the YS and SCS may be explained by local oceanic currents. M. meretrix larvae may circulate within each coastal area on oceanic currents during the spawning season (i.e., April through September, Liu et al., 2006). There are two separate currents, the China Coastal Current (CCC) and the YS Warm Current (YSWC) (Figure 1). Summer ocean currents along the China coast (i.e., CCC and YSWC) are regular during April and September in the northern continental shelf of the SCS (Su, 2004). In the SCS, the CCC may facilitate the high level of gene flow among SCS samples. Similarly, under the influence of the YSWC, the three samples from the YS had relatively low and non-significant genetic differences (FST values ranging from 0 to 0.008). Unfortunately, due to the scarcity of wild individuals by bedrock coast which is inhospitable for clam in the East China Sea region (Xu, 2009; Han, 2011), we failed to collect wild individuals there.
FST values suggested low, but significant genetic differentiation among some samples within the SCS. Except for ZJ, we detected low genetic differentiation between ZZ–ZH, ZZ–BH, and ZH–HK. This differentiation may be explained by the short PLD of this species (i.e., about 1 week). Similar to other species with short PLD, population genetic differentiation can occur over a small geographic scale, e.g., approximately 100 km in the surf clam Mactra chinensis in the YS region (Ni et al., 2015). The genetic differentiation in the SCS was inconsistent with geographic differences among of samples. The genetic homogeneity between BH–ZH and HK–ZZ may due to movements from BH to ZH and from HK to ZZ by aquaculture activities.
Genetic Diversity of M. meretrix in the Yellow Sea and South China Sea Populations
The genetic diversity of a population is critical for its evolutionary potential. In the present study, six microsatellite markers revealed a high level of genetic diversity within hard clam M. meretrix within YS and SCS groups of populations (mean A = 27.167–29.833, mean Ae = 8.834–9.471, mean Ar = 26.032–27.005, mean Ho = 0.824–0.839, and mean He = 0.821–0.850). The results suggest that wild populations of M. meretrix in China still contain considerable variation, which could be a valuable resource for a genetic breeding program. Also, this high variation can be arisen by the nature of the markers (i.e., microsatellite, highly polymorphics). The level of microsatellite variation detected in our study was a little higher than that detected in the parentage determination of M. meretrix by Lu et al. (2011b) (mean A, Ho, and He were 13.9, 0.725, and 0.839, respectively, with three of five loci identical to those used in our study, i.e., MM11, MM14, and MM15). This result may because the parentage study used just a handful of families in genetic analysis. The genetic diversity in this study also was higher than that in the study of four strains of different shell colors and decorative patterns of M. meretrix using nine microsatellite markers (mean A = 6.2–7.5, mean Ho = 0.511–0.626, mean He = 0.698–0.754) (Zhu et al., 2012). The first explanation may also reflect the genetic diversity from Zhu et al. (2012), due to sampling from same geographic location. The main object of Zhu et al. (2012) was to determinate the genetic difference between different color stains and the studied individuals are distributed in a smaller scale than our case that low genetic diversity is reasonable. The high level of genetic diversity in this study may be related to the wide distribution of M. meretrix studied. The lowest level of genetic diversity that we observed was in the BH sample (lowest levels of A, Ae, Ar, Ho, and He), which may be due to the Beibu Gulf being a semi-enclosed shallow water body with limited connectivity to the northern SCS through the Qiongzhou Strait (Figure 1).
Only small number of microsatellite tests (4/48 and 5/12 in all eight samples and two genetic clusters, respectively) exhibited significant deviations from HWE, which mostly was caused by heterozygote deficiency of microsatellite loci (Ho < He). We observed heterozygote deficiency at MM10 in LYG, MM11 in SCS, and MM22 in YC, NT, YS, and SCS. This may be due to the presence of null alleles at these two loci in those samples, and this pattern of deficiency did not occur at other loci. Null alleles are frequently reported at microsatellite loci in marine invertebrate species (Hedgecock et al., 2004). Null alleles can arise when mutations prevent primers from binding and can be avoided by redesigning primers (Callen et al., 1993). We also detected heterozygote excess at MM10 in SCS, MM11 in ZJ and MM25 in SCS (Ho > He).
Management Implications
To ensure the long-term sustainability of wild marine stocks, management programs should recognize genetic diversity both within and among populations. This goal is also crucial for an aquaculture industry in China that relies entirely on the collection of natural seed. In this study, genetics data revealed two independent management units (i.e., YS and SCS groups). The two management units needs separate management strategies. Management actions, especially those relevant to translocation and propagation, should strive to avoid genetic mixing by managing each unit separately and by restricting transfers of seedstock or broodstock across units. Existing management practices may need to be adjusted.
Low levels of effective population size (Ne) were detected in M. meretrix populations. Low Ne estimates indicate greater loss of genetic variation than what may be expected based on census size, especially of highly fecund and abundant species. The factors of low Ne for M. meretrix may include heavy exploitation and annual mass mortality. Therefore, management should aim to increase Ne for M. meretrix populations. Seedstock/broodstock should no longer be transferred from YS to the SCS. Our results and farmers’ interviews suggested regular transfers of M. meretrix seeds/broodstock from the YS to the SCS. The National Marine Fisheries Service in China should monitor aquaculture activities and production, especially transplantation activities. Then, measures should be implemented to relieve some fishing pressure on this species and to apply appropriate mating schemes to seedstock used for restocking programs (Miller et al., 2003).
None of the samples and populations from M. meretrix had significant signs of recent genetic bottlenecks, with P-values always greater than 0.05 based on the TPM. Also, the lack of signs of bottleneck in our microsatellite data indicates that there was enough gene flow, in spite of this low level detected in this case, to maintain genetically diverse and genetically connected populations.
Conclusion
In conclusion, we detected population genetic structure of M. meretrix in the SCS and the YS regions using nine microsatellite loci. We suggest separate management strategies for these two units to avoid genetic mixing by managing each unit separately and by restricting transfers of seedstock or broodstock across units.
Data Availability Statement
All datasets for this study are included in the article and the Supplementary Material.
Ethics Statement
All animal sampling and experiment procedures were reviewed and approved by the State Oceanic Administration of China and the Ethics Committee of Zhejiang Ocean University, and performed according to national laws and regulations.
Author Contributions
YY and WS designed the work, analyzed and acquired the data, interpreted the results, and wrote the manuscript. CY and KX collected samples and prepared genomic DNA, performed experimental works, and checked the data. BG and ZL designed the work, analyzed the data, wrote the manuscript, and provided funds for this study. All authors gave final approval for the publication of the article.
Funding
This work was financially supported by the Fundamental Research Funds for Zhejiang Provincial Universities and Research Institutes (Nos. 2019J00021 and 2019J00038), the Natural Science Foundation of Zhejiang Province (No. LQ18D060004), and the Project of Bureau of Science and Technology of Zhoushan (Nos. 2020C21026 and 2019F12004).
Conflict of Interest
The authors declare that the research was conducted in the absence of any commercial or financial relationships that could be construed as a potential conflict of interest.
Supplementary Material
The Supplementary Material for this article can be found online at: https://www.frontiersin.org/articles/10.3389/fmars.2020.00516/full#supplementary-material
References
Aljanabi, S. M., and Martinez, I. (1997). Universal and rapid salt-extraction of high quality genomic DNA for PCR-based techniques. Nucleic Acids Res. 25, 4692–4693. doi: 10.1093/nar/25.22.4692
Benzie, J. A. H. (2000). The detection of spatial variation in widespread marine species: methods and bias in the analysis of population structure in the crown of thorns starfish (Echinodermata: Asteroidea). Mar. Genet. 420:14.
Callen, D. F., Thompson, A. D., Shen, Y., Phillips, H. A., Richards, R. I., Mulley, J. C., et al. (1993). Incidence and origin of “null” alleles in the (AC) n microsatellite markers. Am. J. Hum. Genet. 52:922.
Cavalli-Sforza, L., and Edwards, A. W. F. (1967). Phylogenetic analysis models and estimation procedures. Am. J. Hum. Genet. 19:233.
Chen, L., Wang, X., and Chen, D. (2004). Research on the development of hard clam market in China mainland. J. Shanghai Ocean Univ. 3, 283–287.
Dieringer, D., and Schlötterer, C. (2003). Microsatellite analyser (MSA): a platform independent analysis tool for large microsatellite data sets. Mol. Ecol. Notes 3, 167–169. doi: 10.1046/j.1471-8286
Do, C., Waples, R. S., Peel, D., Macbeth, G., Tillett, B. J., and Ovenden, J. R. (2014). NeEstimator v2: re-implementation of software for the estimation of contemporary effective population size (Ne) from genetic data. Mol. Ecol. Resour. 14, 209–214. doi: 10.1111/1755-0998.12157
Dong, Y. W., Wan, H. S., Han, G. D., Ke, C. H., Zhan, X., Nakano, T., et al. (2012). The impact of Yangtze River discharge, ocean currents and historical events on the biogeographic pattern of Cellana toreuma along the China coast. PLoS One 7:e36178. doi: 10.1371/journal.pone.0036178
Earl, D. A., and vonHoldt, B. M. (2012). STRUCTURE HARVESTER: a website and program for visualizing STRUCTURE output and implementing the Evanno method. Conserv. Genet. Resour. 4, 359–361. doi: 10.1007/s12686-011-9548-7
Evanno, G., Regnaut, S., and Goudet, J. (2005). Detecting the number of clusters of individuals using the software STRUCTURE: a simulation study. Mol. Ecol. 14, 2611–2620. doi: 10.1111/j.1365-294X.2005.02553.x
Excoffier, L., and Lischer, H. E. (2010). Arlequin suite ver 35: a new series of programs to perform population genetics analyses under Linux and Windows. Mol. Ecol. Resour. 10, 564–567. doi: 10.1111/j.1755-0998.2010.02847.x
Felsenstein, J. (2004). PHYLIP (Phylogeny Inference Package) Version 36 Distributed by the author. Seattle: University of Washington.
Feng, J., Fu, Z., Guo, Y., Li, J., Guo, B., Lv, Z., et al. (2020). Strong genetic differentiation of the clam Meretrix lamarckii in the China Sea revealed by mitochondrial DNA marker. Mol. Biol. Rep. 47, 693–702. doi: 10.1007/s11033-019-05177-9
Goudet, J. (2001). FSTAT, A Program To Estimate And Test Gene Diversities And Fixation Indices (Version 2.9.3.). Available online at: https://www2.unil.ch/popgen/softwares/fstat.htm (accessed December, 2015).
Guo, S. W., and Thompson, E. A. (1992). Performing the exact test of Hardy-Weinberg proportion for multiple alleles. Biometrics 48, 361–372.
Han, Q. (2011). Research on the Status of Tidal Resources in China Using remote Sensing Technology. Master dissertation, Nanjing normal university, Nanjing.
Hedgecock, D., Li, G., Hubert, S., Bucklin, K., and Ribes, V. (2004). Widespread null alleles and poor cross-species amplification of microsatellite DNA loci cloned from the Pacific oyster, Crassostrea gigas. J. Shellf. Res. 23, 379–386.
Ho, J. S., and Zheng, G. X. (1994). Ostrincola koe (Copepoda, Myicolidae) and mass mortality of cultured hard clam (Meretrix meretrix) in China. Hydrobiologia 284, 169–173. doi: 10.1007/bf00006888
Jackson, G. A. (1986). Interaction of physical and biological processes in the settlement of planktonic larvae. Bull. Mar. Sci. 39, 202–212.
Jiang, C. B., Zhang, L. J., and Wang, F. (2006). A study of pCO2 in the surface water of the southern yellow sea in summer: the respective contribution of the upwelling and the yangtze river diluted water to the air-sea of CO2 flux. Period. Ocean Univers. China 36, 147–152.
Kumar, S., Stecher, G., and Tamura, K. (2016). MEGA7: molecular evolutionary genetics analysis version 70 for bigger datasets. Mol. Biol. Evol. 33, 1870–1874. doi: 10.1093/molbev/msw054
Lande, R. (1988). Genetics and demography in biological conservation. Science 241, 1455–1460. doi: 10.1126/science.3420403
Li, H. J., Liu, W. D., Gao, X. G., Zhu, D., Wang, J., Li, Y. F., et al. (2011). Identification of host-defense genes and development of microsatellite markers from ESTs of hard clam Meretrix meretrix. Mol. Biol. Rep. 38, 769–775. doi: 10.1007/s11033-010-0165-4
Lin, J., Zhu, J., Zhang, J., Wu, H., and Luo, W. (2011). Distribution of phytoplankton biomass and its relationships with the environmental factors off the Changjiang (Yangtze River) Estuary. J. Fish. China 35, 74–87.
Linnaeus, C. (1758). Systema Naturae per Regna Tria Naturae, Secundum Classes, Ordines, Genera, Species, Cum Characteribus, Differentiis, Synonymis, Locis. Editio Decima, Reformata [10th Revised Edition], vol. 1, 824. Laurentius Salvius: Holmiae. Available online at: https://biodiversitylibrary.org/page/726886
Liu, B., Dong, B., Tang, B., Zhang, T., and Xiang, J. (2006). Effect of stocking density on growth, settlement and survival of clam larvae Meretrix meretrix. Aquaculture 258, 344–349. doi: 10.1016/j.aquaculture.2006.03.047
Liu, S., and Yang, A. (2005). Healthy Aquaculture Technology of Marine Shellfish in China. Beijing: China Ocean Press. 234–243.
Lu, X., Wang, H., Dai, P., and Liu, B. (2011a). Characterization of EST-SSR and genomic-SSR markers in the clam, Meretrix meretrix. Conserv. Genet. Resour. 3, 655–658. doi: 10.1007/s12686-011-9426-3
Lu, X., Wang, H., Liu, B., and Xiang, J. (2011b). An effective method for parentage determination of the clam (Meretrix meretrix) based on SSR and COI markers. Aquaculture 318, 223–228. doi: 10.1016/j.aquaculture.2011.05.017
Luikart, G., Allendorf, F., Cornuet, J., and Sherwin, W. (1998). Distortion of allele frequency distributions provides a test for recent population bottlenecks. J. Hered. 89, 238–247. doi: 10.1093/jhered/89.3.238
Luikart, G., and Cornuet, J. M. (1998). Empirical evaluation of a test for identifying recently bottlenecked populations from allele frequency data. Conserv. Biol. 12, 228–237. doi: 10.1046/j.1523-1739.1998.96388.x
Miller, L. M., Kapuscinski, A. R., and Hallerman, E. (2003). Genetic Guidelines For Hatchery Supplementation Programs. Population Genetics: Principles And Applications For Fisheries Scientists. Bethesda, MA: American Fisheries Society.
Ni, G., Li, Q., Ni, L., Kong, L., and Yu, H. (2015). Population subdivision of the surf clam Mactra chinensis in the East China Sea: Changjiang River outflow is not the sole driver. PeerJ 3:e1240. doi: 10.7717/peerj.1240
Peakall, R., and Smouse, P. E. (2012). GenAlEx 65: genetic analysis in excel population genetic software for teaching and research an update. Bioinformatics 28, 2537–2539. doi: 10.1093/bioinformatics/bts460
Piry, S., Luikart, G., and Cornuet, J. M. (1999). Bottleneck: a computer program for detecting recent reductions in the effective population size using allele frequency data. J. Hered. 90, 502–503. doi: 10.1093/jhered/90.4.502
Pritchard, J. K., Stephens, M., and Donnelly, P. (2000). Inference of population structure using multilocus genotype data. Genetics 155, 945–959.
Rice, W. R. (1989). Analyzing tables of statistical tests. Evolution 43, 223–225. doi: 10.1111/j.1558-5646.1989.tb04220.x
Rousset, F. (2008). Genepop’007: a complete re-implementation of the genepop software for Windows and Linux. Mol. Ecol. Resour. 8, 103–106. doi: 10.1111/j.1471-8286.2007.01931.x
Saitou, N., and Nei, M. (1987). The neighbor-joining method: a new method for reconstructing phylogenetic trees. Mol. Biol. Evol. 4, 406–425.
Su, J. (2004). Overview of the South China Sea circulation and its influence on the coastal physical oceanography outside the Pearl River Estuary. Contin. Shelf Res. 24, 1745–1760. doi: 10.1016/j.csr.2004.06.005
Tang, B., Liu, B., Wang, G., Zhang, T., and Xiang, J. (2006). Effects of various algal diets and starvation on larval growth and survival of Meretrix meretrix. Aquaculture 254, 526–533. doi: 10.1016/j.aquaculture.2005.11.012
Thorpe, J., Solé-Cava, A. M., and Watts, P. C. (2000). Exploited marine invertebrates: genetics and fisheries. Hydrobiologia 420, 165–184. doi: 10.1007/978-94-017-2184-4_16
Van Oosterhout, C., Hutchinson, W. F., Wills, D. P., and Shipley, P. (2004). MICRO-CHECKER: software for identifying and correcting genotyping errors in microsatellite data. Mol. Ecol. Notes 4, 535–538. doi: 10.1111/j.1471-8286.2004.00684.x
Wang, G., Liu, B., Tang, B., Zhang, T., and Xiang, J. (2006). Pharmacological and immunocytochemical investigation of the role of catecholamines on larval metamorphosis by β-adrenergic-like receptor in the bivalve Meretrix meretrix. Aquaculture 258, 611–618.
Wang, H., Huan, P., Lu, X., and Liu, B. (2011). Mining of EST-SSR markers in clam Meretrix meretrix larvae from 454 shotgun transcriptome. Genes Genet. Syst. 86, 197–205. doi: 10.1266/ggs.86.197
Wang, X., Kong, L., Chen, J., Matsukuma, A., and Li, Q. (2017). Phylogeography of bivalve Meretrix petechialis in the northwestern pacific indicated by mitochondrial and nuclear dna data. PLoS One 12:e0183221. doi: 10.1371/journal.pone.0183221
Wang, Y., Wang, M., Wang, B., Liu, M., Jiang, K., Hou, X., et al. (2019). A preliminary attempt to explore the potential functions of a tetraspanin gene (MmTSPAN) in the innate immunity of hard clam Meretrix meretrix: sequence features and expression profiles. Fish Shellf. Immunol. 88, 135–141. doi: 10.1016/j.fsi.2019.01.048
Xiao, J., Cordes, J. F., Wang, H., Guo, X., and Reece, K. S. (2010). Population genetics of Crassostrea ariakensis in Asia inferred from microsatellite markers. Mar. Biol. 157, 1767–1781. doi: 10.1007/s00227-010-1449-x
Xie, W., Chen, C., Liu, X., Wang, B., Sun, Y., Yan, M., et al. (2012). Meretrix meretrix: active components and their bioactivities. Life Sci. J. 9, 756–762.
Xu, J. (2009). The CSS Evalution Of The Coastal Tourism Resources Of Zhejiang Province. Master dissertation, Zhejiang Normal University, Jinhua.
Ye, Y., Fu, Z., Tian, Y., Li, J., Guo, B., Lv, Z., et al. (2018). Pelagic larval dispersal habits influence the population genetic structure of clam Gomphina aequilatera in China. Genes Genom. 40, 1213–1223. doi: 10.1007/s13258-018-0718-9
Yu, G., Smith, D. K., Zhu, H., Guan, Y., and Lam, T. Y. (2017). Ggtree: an r package for visualization and annotation of phylogenetic trees with their covariates and other associated data. Methods Ecol. Evol. 8, 28–36. doi: 10.1111/2041-210x.12628
Yu, H., Gao, S., Chen, A., Kong, L., and Li, Q. (2015). Genetic diversity and population structure of the ark shell Scapharca broughtonii along the coast of China based on microsatellites. Biochem. Syst. Ecol. 58, 235–241. doi: 10.1016/j.bse.2014.12.003
Yu, H., and Li, Q. (2007). Genetic variation of wild and hatchery populations of the Pacific oyster Crassostrea gigas assessed by microsatellite markers. J. Genet. Genom. 34, 1114–1122. doi: 10.1016/s1673-8527(07)60127-1
Zhan, W. Y. (2003). Study on the cause of death of Meretrix meretrix in large area in Rudong Jiangsu. Mar. Fish. Res. 24, 62–65.
Keywords: genetic diversity, population structure, microsatellite, Meretrix meretrix, management strategies
Citation: Ye Y, Yan C, Senanan W, Guo B, Xu K and Lü Z (2020) Genetic Population Structure of the Hard Clam Meretrix meretrix Along the Chinese Coastlines Revealed by Microsatellite DNA Markers. Front. Mar. Sci. 7:516. doi: 10.3389/fmars.2020.00516
Received: 04 November 2019; Accepted: 04 June 2020;
Published: 30 June 2020.
Edited by:
Christian Marcelo Ibáñez, Andres Bello University, ChileReviewed by:
Zhang Yuehuan, South China Sea Institute of Oceanology (CAS), ChinaCristian B. Canales-Aguirre, Universidad de Los Lagos, Chile
Pablo A. Oyarzun, Andres Bello University, Chile
Copyright © 2020 Ye, Yan, Senanan, Guo, Xu and Lü. This is an open-access article distributed under the terms of the Creative Commons Attribution License (CC BY). The use, distribution or reproduction in other forums is permitted, provided the original author(s) and the copyright owner(s) are credited and that the original publication in this journal is cited, in accordance with accepted academic practice. No use, distribution or reproduction is permitted which does not comply with these terms.
*Correspondence: Yingying Ye, eWV5eUB6am91LmVkdS5jbg==