 Nina Bednaršek
 Greg Pelletier
 Anise Ahmed2
 Richard A. Feely
- 1Southern California Coastal Water Research Project, Costa Mesa, CA, United States
- 2Washington State Department of Ecology, Olympia, WA, United States
- 3NOAA Pacific Marine Environmental Laboratory, Seattle, WA, United States
Ocean acidification (OA) is projected to have profound impacts on marine ecosystems and resources, especially in estuarine habitats. Here, we describe biological risks under current levels of exposure to anthropogenic OA in the Salish Sea, an estuarine system that already experiences inherently low pH and aragonite saturation state (Ωar) conditions. We used the Pacific Northwest National Laboratory and Washington State Department of Ecology Salish Sea biogeochemical model (SSM) informed by a selection of OA-related biological thresholds of ecologically and economically important calcifiers, pteropods, and Dungeness crabs. The SSM was implemented to assess current exposure and associated risk due to reduced Ωar and pH conditions with respect to the magnitude, duration, and severity of exposure below the biological thresholds in the Salish Sea in comparison to the pre-industrial era. We further investigated the individual effects of atmospheric CO2 uptake and nutrient-driven eutrophication on changes in chemical exposure since pre-industrial times. Our model predicts average decreases in Ωar and pH since pre-industrial times of about 0.11 and 0.06, respectively, in the top 100 m of the water column of the Salish Sea. These decreases predispose pelagic calcifiers to increased duration, intensity, and severity of exposure. For pteropods, present-day exposure is below the thresholds related to sublethal effects across the entire Salish Sea basin, while mortality threshold exposure occurs on a spatially limited basis. The greatest risk for larval Dungeness crabs is associated with spatially limited exposures to low calcite saturation state in the South Sound in the springtime, triggering an increase in internal dissolution. The main anthropogenic driver behind the predicted impacts is atmospheric CO2 uptake, while nutrient-driven eutrophication plays only a marginal role over spatially and temporally limited scales. Reduction of CO2 emissions can help sustain biological species vital for ecosystem functions and society.
Introduction
Anthropogenically enhanced ocean acidification (OA) represents one of the most significant risks to coastal marine ecosystems (Feely et al., 2010, 2016, 2018; Bednaršek et al.,2016,2014,2017a,2018,2019,2020; Wallace et al., 2014; O’Neill et al., 2017; Evans et al., 2019). These concerns are especially relevant in highly productive eastern boundary upwelling systems, as well as the coastal and estuarine systems where OA impacts on key marine organisms are already detectable. These organisms face a high risk of impacts well before 2100, even under the low-emissions scenario (RCP2.6; Gattuso et al., 2015), that will negatively affect human benefits and services. The identification of major drivers and trends of OA variability is critical for understanding the biological changes related to OA.
The upwelling regime along the United States West Coast has experienced a pH decline of at least 0.1 pH unit since pre-industrial times (Chavez et al., 2017; Laruelle et al., 2018; Osborne et al., 2020). The results of intensifying OA have resulted in increased magnitude, duration, and frequency of OA exposure (Feely et al., 2008, 2016, 2018; Gruber et al., 2012; Hauri et al., 2013; Turi et al., 2016; Chan et al., 2017; Sutton et al., 2019). Experimental simulations of OA exposure demonstrate copious evidence of the detrimental effects of OA on a variety of ecologically and economically important calcifiers along the United States West Coast (Gaylord et al., 2011; Baumann et al., 2012; Lischka and Riebesell, 2012; Waldbusser et al., 2015; McLaskey et al., 2016; Miller et al., 2016; Osborne et al., 2016; Giltz and Taylor, 2017; Hales et al., 2017; Kapsenberg et al., 2018; Williams et al., 2019). Furthermore, synthesis and meta-analyses work indicate a much broader vulnerability with the ultimate impact on marine ecosystems (Kroeker et al., 2013; Busch and McElhany, 2016). Moreover, the impact is noticeable under present-day conditions, with field studies delineating effects in some of the most vulnerable marine species, such as oysters (Barton et al., 2012, 2015), copepods (Engström-Öst et al., 2019), foraminifera (Osborne et al., 2016, 2020), pteropods (Bednaršek et al.,2014,2016,2017a,2018,2019; Feely et al., 2016) and Dungeness crab larvae (Bednaršek et al., 2020). For the last three species in particular, robust attribution analyses have unequivocally demonstrated the impact of anthropogenic OA as a driver behind observed negative responses (Bednaršek et al.,2014,2020; Osborne et al., 2020). Due to the shortness of time series, population-specific measurements linked to in situ anthropogenic CO2 are still lacking.
It is particularly important to address the risks related to anthropogenic drivers on regional scales because of their connection to local economies based on marine resources, fisheries, and recreation (Barange et al., 2014; Gattuso et al., 2015). Fingerprinting of the anthropogenic OA signal is particularly essential in estuarine systems that support structural and functional biodiversity and productivity in order to evaluate, manage, and limit the risks to habitats. However, these systems are characterized by extensive spatial and seasonal variability and prolonged time of emergence (Cai et al., 2011; Sunda and Cai, 2012; Feely et al., 2018; Sutton et al., 2019), and conclusively linking anthropogenic attribution to baseline shifts is difficult. Despite this, recent studies have identified remarkably consistent bounds for anthropogenic CO2 concentrations for the coastal waters of the California Current Ecosystem and the Salish Sea (Feely et al., 2016; Evans et al., 2019).
The Salish Sea in the Pacific Northwest is one of the most productive estuarine systems in the United States with many ecologically, economically, and culturally significant species. Yet, the Salish Sea is rapidly changing because of its poor buffering capacity (Feely et al., 2010, 2012, 2018; Fassbender et al., 2018; Evans et al., 2019) and multiple anthropogenic and natural drivers that can simultaneously exacerbate OA, including freshwater (riverine) inputs, respiration processes, and other redox reactions (e.g., Feely et al., 2010, 2016, 2018; Alin et al., 2018; Evans et al., 2019, and references therein). Anthropogenic CO2 uptake and local eutrophication enhancing respiration have been recognized as the most important contributions to changing OA baseline conditions (Feely et al., 2010, 2012, 2018; Pelletier et al., 2017, 2018; Bianucci et al., 2018; Evans et al., 2019). Anthropogenic CO2 concentrations are changing surface ocean habitats following the exchange of CO2 across the air/water interface, with increased concentration of dissolved inorganic carbon (DIC) from the atmosphere.
While these processes are subjecting ecologically and economically important calcifying species to enhanced anthropogenic OA exposure (Feely et al., 2016, 2018), the understanding of OA’s impacts on important species to the Salish Sea ecosystem is currently restricted to experimental results and food web model outputs of projected OA changes. Several studies demonstrate the most damaging OA impacts on various pelagic calcifiers, including pteropods, benthic grazers, and Dungeness crabs (Busch et al., 2013, 2014; Miller et al., 2016). However, because of the uncertainties associated with extrapolating from experimental results to highly variable estuarine conditions, OA risk assessment across spatial and temporal windows of exposures is limited.
Pteropods are ecologically important as a food resource for various fish (Aydin et al., 2005), and are regarded as sensitive OA indicators of ecological health (Bednaršek et al., 2017b). Their OA sensitivity is related to multiple pathways ranging from shell dissolution, physiological and behavioral responses, and mortality (Lischka et al., 2011; Busch et al., 2014; Bednaršek et al., 2017a, b). As described by Wang et al. (2018) and Bednaršek et al. (unpublished), pteropod life history in the Salish Sea consists of are two major spawning events in the Salish Sea: a primary event occurs during the springtime (March–May) and a secondary event occurs in the fall (September–October), generating most sensitive early life stages that inhabit upper 100 m of their vertical habitat (Wang et al., 2018; Bednaršek et al., unpublished). A single field study so far in the Salish Sea shows evidence of negative biological effects, shell dissolution, under present OA gradients for pteropods (Bednaršek et al., unpublished); these findings are indicative of high pteropod sensitivity yet insufficient to accurately ascribe the risks for the pteropod community in the Salish Sea.
Dungeness crabs are the most important fishery in Washington State, with an estimated total value between $90 and $110 million annually (Childers, R., Washington Fish and Wildlife, personal communication). Exposure to OA conditions is pre-determined by the life history of larval Dungeness crabs occurring during the springtime (May–June), with early life stages inhabiting upper 160 m of water column considered to be their diel vertical habitat in the Salish Sea (Jamieson and Phillips, 1993). Experimental analyses of the Dungeness crab demonstrate delayed development and increased mortality in the zoea stages (Miller et al., 2016), while megalopae show evidence of increased exoskeleton dissolution (Bednaršek et al., 2020). There is consistent evidence of a regionally limited population collapse of Dungeness crabs (Childers, R., Washington Fish and Wildlife, personal communication) but causality behind the observed phenomenon has not yet been determined because the pathways of sensitivity or attribution analyses to specific drivers are lacking.
To evaluate OA-related risks and uncertainties on biological populations, an understanding of two factors, i.e., species sensitivity and associated exposure to unfavorable OA conditions, is needed. Standardizing sensitivity across species, life stages, studies, and different approaches is difficult and potentially biased. In the absence of a comprehensive understanding of species sensitivity, needed to predict future OA effects, the United Nations Intergovernmental Panel on Climate Change (IPCC) uses thresholds with associated confidence levels to communicate the risks (Mastrandrea et al., 2010). Biological thresholds are recommended tools for evaluating species sensitivity, especially when derived through the expert consensus process (Mastrandrea et al., 2010; Bednaršek et al., 2019). As such, they can be used to assess biological vulnerability when there are gaps in the empirical evidence. Although there is a significant gap of known OA thresholds for most marine organisms, such thresholds are currently available for different life stages of pteropods (Bednaršek et al., 2019). The biological thresholds cover a range of conditions specifically related to aragonite saturation state (Ωar) that can induce either sublethal (increased dissolution, reduced growth) or lethal (mortality) effects. Species life histories provide a context for interpreting sensitivity during their most sensitive biological stages (Bednaršek et al., 2019).
In regard to OA exposure in regionally specific coastal-estuarine ecosystems, downscaled biogeochemical models are among the best tools for evaluating current conditions and predicting changes against a background of ocean variability. More importantly, they can help delineate the location and potential impact of specific anthropogenic stressors, such as atmospheric CO2 addition or eutrophication, as well as quantitatively assess the changes to either of these two stressors. Biological thresholds can be incorporated easily into biogeochemical models as an application tool to identify spatially explicit OA hotspots and refugia, as well as temporal windows in which the biological risks will be most significant. Furthermore, applying thresholds to biogeochemical models with distinct “scenarios” can help delineate the extent of currently observed biological impacts due to a specific anthropogenic OA driver, e.g., CO2 emissions vs. nutrient loading.
The application of biological thresholds into the Salish Sea Model (SSM) to identify spatial and temporal windows of conditions that induce sublethal and/or lethal biological effects is a novel approach in assessing risk associated with OA. Here, we apply a highly resolved biogeochemical SSM to assess the changes in chemical exposure since the pre-industrial era using an attribution analysis of atmospheric CO2 emissions and nutrient-driven eutrophication in the Salish Sea. Metrics of exposure (duration, intensity, severity) were modeled to delineate predominant anthropogenic drivers, atmospheric CO2 and nutrient-related eutrophication, and discern their effects across spatial and temporal scales since the pre-industrial era. We conducted OA risk analyses using two pelagic calcifiers with the greatest predisposition to exposure and demonstrated vulnerability to OA conditions in the Salish Sea: pteropods (Limacina helicina) and larval stages of Dungeness crab (Metacarcinus magister). The interpretation of their biological risks was based either on the biological thresholds (pteropods, Bednaršek et al., 2019) or sensitivity equation related to the OA conditions (larval Dungeness crabs, Bednaršek et al., 2020). In doing so, we were able to determine current risks facing ecologically and economically important species in the Salish Sea, as well as delineate the anthropogenic drivers associated with the greatest risk for species sustainability.
Materials and Methods
Description of the Salish Sea Model
This project utilizes a recently completed physical-biogeochemical model for the Salish Sea coastal waters developed by the Pacific Northwest National Laboratory (PNNL) and the Washington State Department of Ecology (DOE) (Pelletier et al., 2017; Bianucci et al., 2018). Our project focus is on the Salish Sea; therefore, we call it the SSM, but the model domain also extends into the Strait of Juan de Fuca and Strait of Georgia. The hydrodynamic module of the SSM is an application of the Finite-Volume Community Ocean Model (FVCOM; Chen et al., 2003).
The SSM uses an unstructured grid that represents the complex shoreline, islands, bathymetry, and waterways of the Salish Sea. The unstructured SSM grid consists of 9,013 nodes and 13,941 elements. The vertical resolution of the model employs a sigma coordinate system with 10 layers. Layer thicknesses are distributed with highest density near the surface. The thickness of the surface layer ranges from about 0.16 m in the shallow nearshore areas to 7.6 m in the deepest areas, with an average thickness of about 1.9 m across the model domain. The thickness of the bottom layer ranges from about 0.75 m in the shallow nearshore areas to 35 m in the deepest areas, with an average thickness of about 8.6 m across the model domain. The number of model grid layers within the euphotic zone depth of approximately 20 m varies from all 10 layers in the nearshore regions to the top two layers in the deepest areas.
The biogeochemical module of the SSM is adapted from the Integrated Compartment Model (CE-QUAL-ICM; Cerco and Cole, 1993, 1994). Bianucci et al. (2018) extended the SSM to include carbonate system variables, i.e., total alkalinity (TA) and DIC in the water column and a two-layer sediment diagenesis module (Di Toro, 2001). The SSM is driven by boundary conditions at two open boundaries (Strait of Juan de Fuca and Strait of Georgia), nearly 100 freshwater sources, including rivers, other watershed sources, and wastewater treatment plants, and meteorological forcing at the water surface. The SSM tracks the following state variables: phytoplankton (two groups), nutrients (nitrate, ammonium, and phosphate), dissolved oxygen, dissolved and particulate organic carbon and nitrogen (labile and refractory), alkalinity, and DIC. The SSM is an offline model that uses input from a previously computed hydrodynamic solution. A detailed description of the SSM is provided by Yang et al. (2010), Khangaonkar et al. (2011), Khangaonkar et al. (2012), and Kim and Khangaonkar (2012).
The model setup for realistic historical conditions in 2008 is exactly the same as described by Bianucci et al. (2018), except for the following changes to better represent model boundary conditions:
– Monthly averages were used to represent alkalinity in rivers instead of using a constant value for each river for the entire year, using the same data sources described by Bianucci et al. (2018);
– Atmospheric xCO2 of 390 ppm was used instead of 400 ppm to better match the observed data off the coast of Washington during 2008 (PSEMP Marine Waters Workgroup, 2016).
Model Scenarios
Several model runs were used in this project to represent the following scenarios:
(1) Existing conditions in 2008. These are the realistic historical conditions observed in 2008 (referred as S1Ex);
(2) Hypothetical reference conditions in 2008 without regional human nutrients. This is the same as Scenario 1, except with regional anthropogenic sources of nutrients removed (e.g., wastewater treatment plant loads and freshwater anthropogenic nonpoint sources). The regional anthropogenic nutrient loads that were excluded from the reference condition scenario include anthropogenic inorganic N (nitrate and ammonium), dissolved and particulate organic N, and dissolved and particulate organic carbon (referred as S2Ex-nut);
(3) Hypothetical reference conditions without global anthropogenic CO2. This is the same as Scenario 1 except with atmospheric and ocean boundary partial pressure of CO2 (pCO2) and DIC reduced to pre-industrial conditions (referred as S3Ex-atm);
(4) Hypothetical pre-industrial conditions without global anthropogenic CO2 or local human nutrients. This is the same as Scenario 1, except with atmospheric and ocean boundary pCO2 and DIC reduced to pre-industrial conditions and regional anthropogenic nutrient sources excluded (referred as S4Ex-nut-atm);
(5) Hypothetical conditions from the years 1780 to 2100 in response to changing global CO2 under RCP 8.5. This is a set of 17 separate scenarios that are same as Scenario 1, except with atmospheric and ocean boundary pCO2 and DIC changed to reflect projected conditions between the years 1780 and 2100 with atmospheric increase from 280 to 910 ppm (Scenario 5, S5-Future).
The effects of regional anthropogenic nutrient sources on water quality were evaluated by analyzing the difference in results between the historical conditions in 2008 and the reference conditions with human nutrients excluded [difference between Scenario 1 (S1Ex) and 2 (S2Ex-nut)]. Regional anthropogenic nutrient sources that were removed in the reference conditions include the anthropogenic component of loading in the wastewater treatment plants and all freshwater sources within Washington State. The effects of global anthropogenic sources of CO2 were evaluated by analyzing the difference in results between the historical conditions in 2008 and the reference conditions with global anthropogenic CO2 excluded [difference between Scenario 1 (S1Ex) and 3(S2Ex-atm)]. The combined effect of global anthropogenic CO2 and human nutrient sources was based on the difference between Scenarios 1 (S1Ex) and 4 (S4Ex-nut-atm).
The method used to calculate DIC at the ocean boundary under pre-industrial conditions assumes that pCO2 in the water is increased at the same rate as in the atmosphere (Takahashi et al., 2009). Atmospheric CO2 was 390 ppm in 2008 and 280 ppm under pre-industrial conditions; therefore, the difference of 110 ppm was subtracted from the 2008 ocean boundary pCO2 in the water to estimate ocean boundary pCO2 under pre-industrial conditions, and pre-industrial DIC was calculated with CO2SYS (Lewis and Wallace, 1998; Evans et al., 2019).
The methods used to estimate the nutrient loading from all existing sources and reference conditions (with estimated regional anthropogenic sources excluded) are presented in Mohamedali et al. (2011) and Pelletier et al. (2017). Regional anthropogenic sources of nutrients that were removed from the reference conditions include wastewater treatment plant loads and freshwater anthropogenic nonpoint sources of nutrients, including anthropogenic inorganic N (nitrate and ammonium), organic N (dissolved and particulate), and organic carbon (dissolved and particulate). Natural reference conditions were established from the results of a meta-analysis considering concentration data from various sources (Mohamedali et al., 2011): ambient monitoring data, rainfall data, and data from other studies. Monthly 10th percentiles of ambient data were used to represent natural nutrient concentrations for different regions in Puget Sound and the Strait of Georgia. Monthly 50th percentiles were used for the Olympic Peninsula watersheds draining to the Strait of Juan de Fuca and Hood Canal.
We demonstrate the effects of the changes in carbonate chemistry conditions over the entire Salish Sea region through the model outputs, and additionally focus on the stations in Puget Sound, which represent the southern part of the Salish Sea where current OA monitoring is taking place (Figure 1). All of the model scenarios used in this study use the same hydrodynamic and physical conditions as the year 2008. Therefore, the differences between scenarios isolate the effects of only regional human nutrients and global anthropogenic CO2.
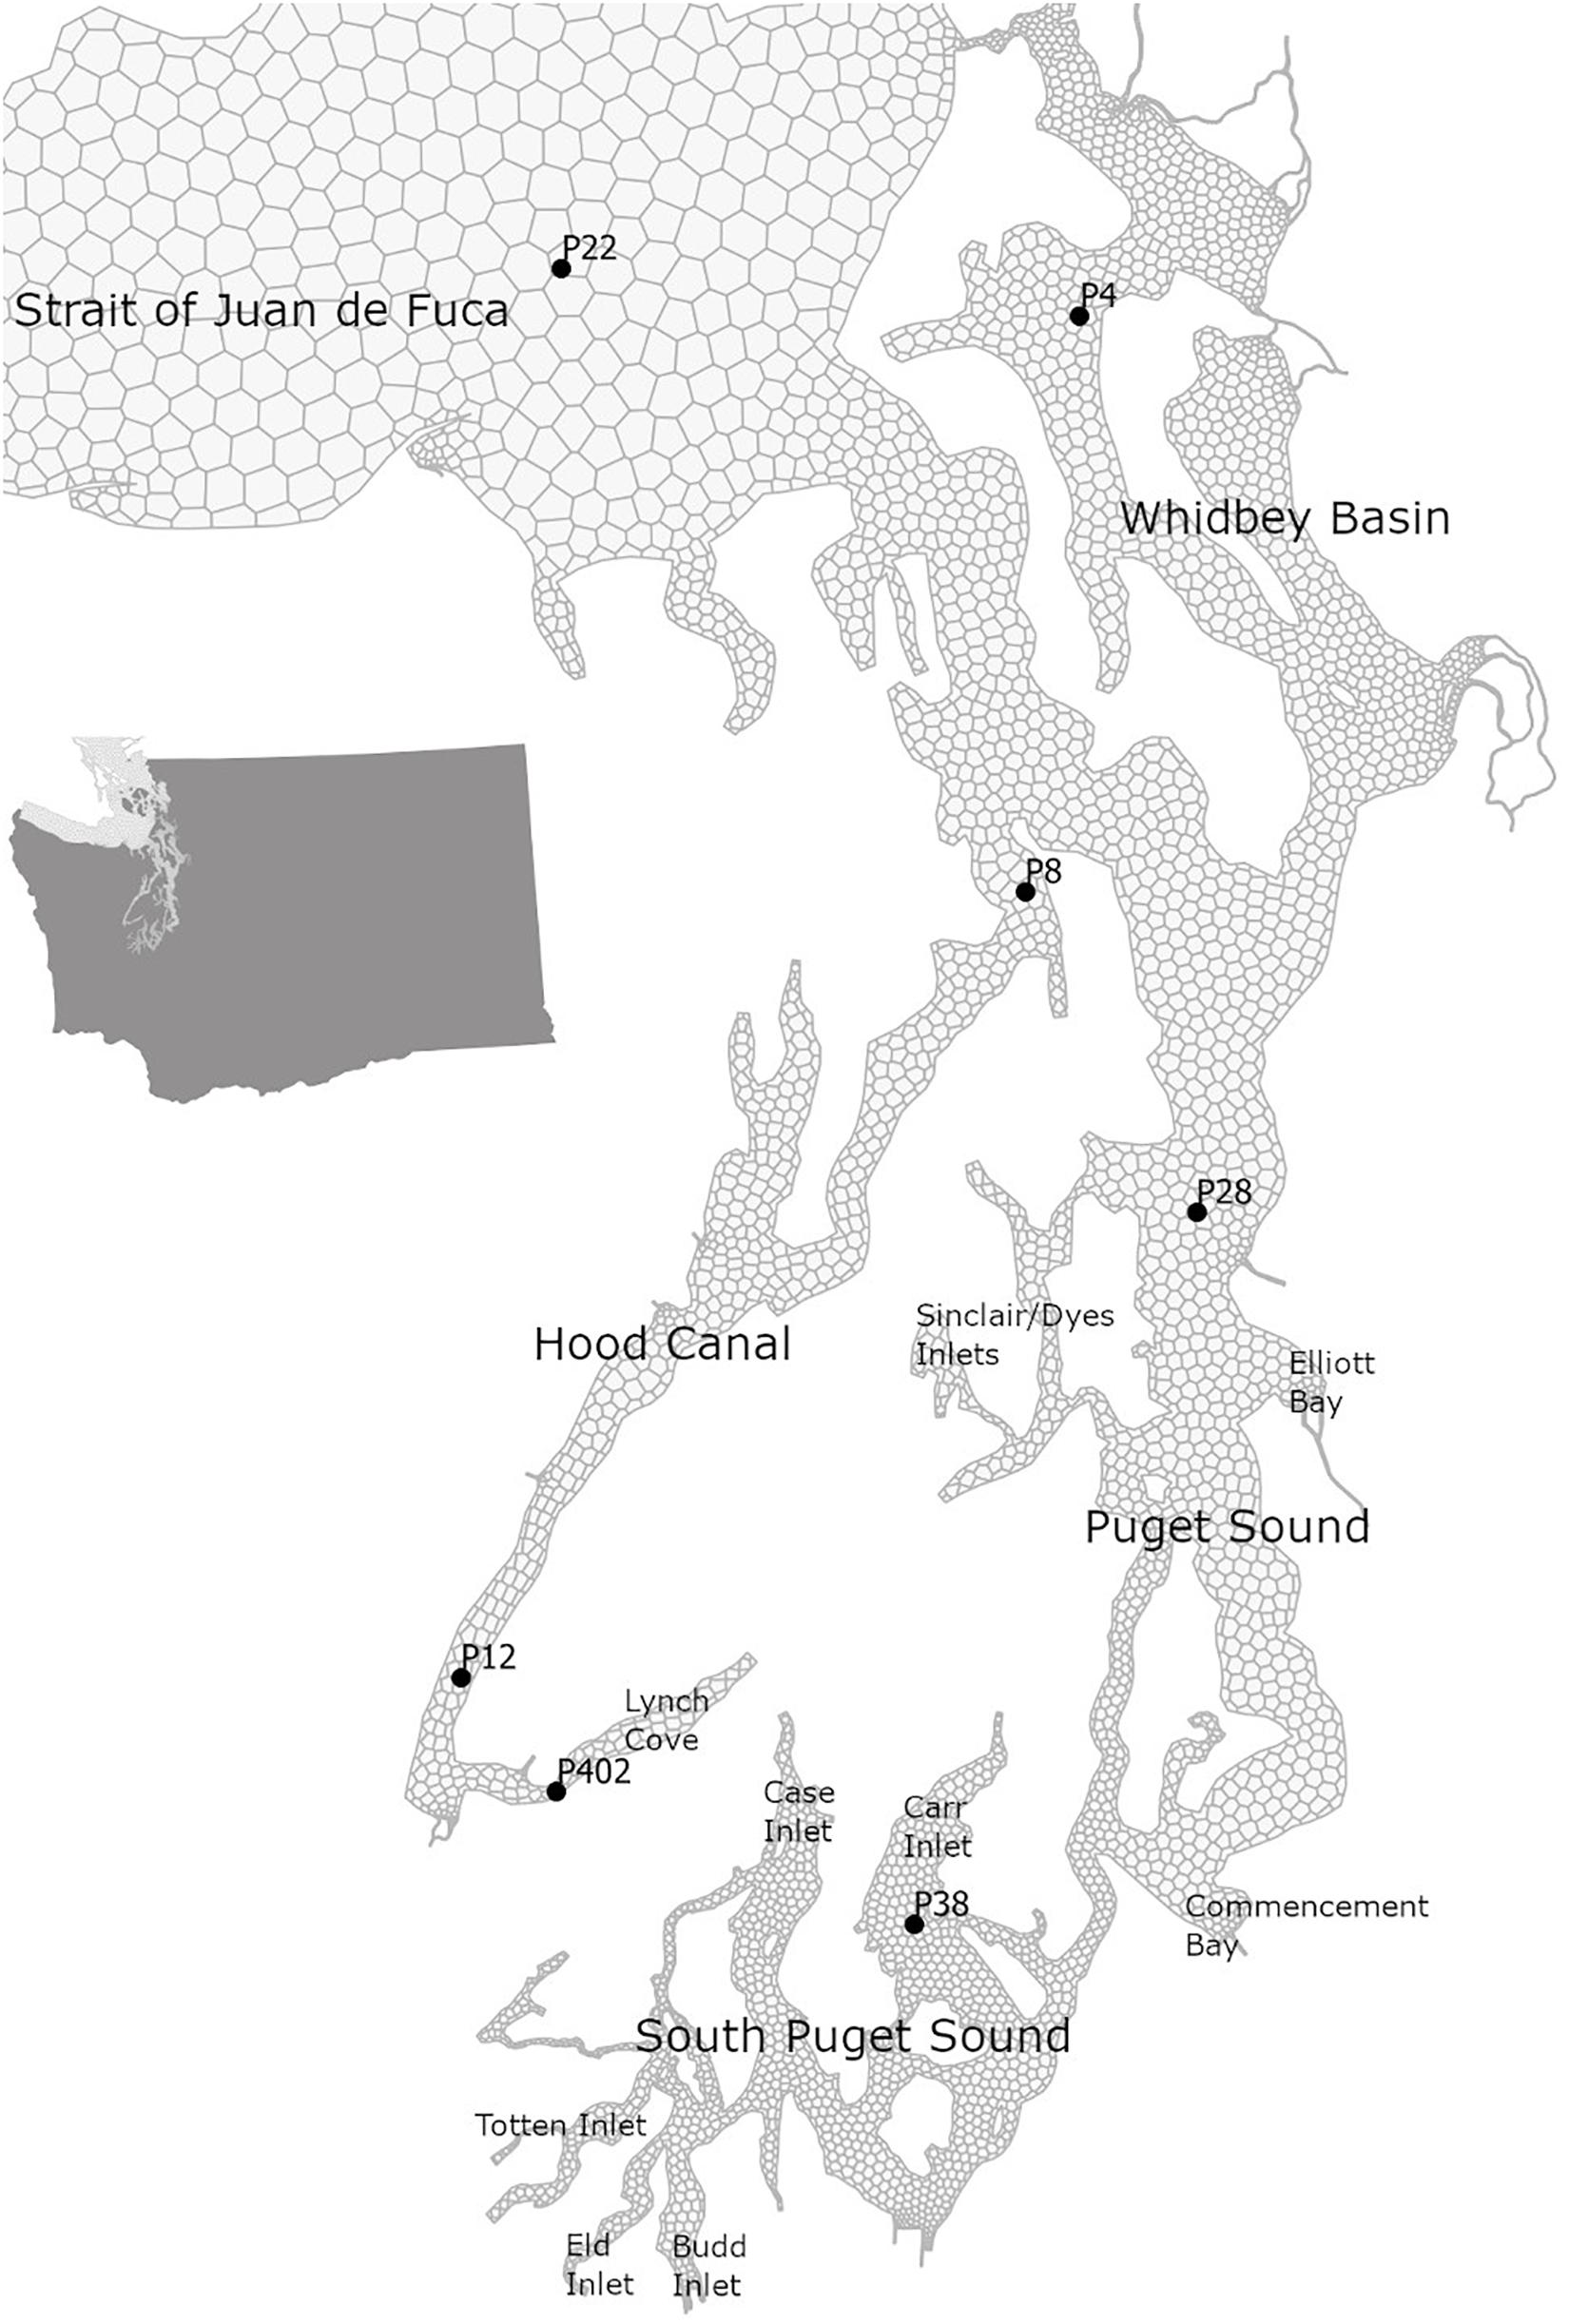
Figure 1. Map of the Salish Sea with selected stations in its southern part of Puget Sound with Main Basin (P28) that are part of the OA monitoring efforts in Washington state.
Determining the Exposure and Sensitivity for Two Groups of Marine Calcifiers
The availability of tools that allow interpretation of biological sensitivity, as well as model outputs that allow assessment of chemical exposure, made it possible to evaluate the risks for two pelagic calcifiers, i.e., pteropods and larval stages of Dungeness crabs.
Depending on the application of the tools in the biogeochemical model, the exposure can be assessed temporally and spatially. In assessing temporal exposure, we applied the sensitivity tools across different seasonal scales that align with the species life history, i.e., when the magnitude of seasonal exposure co-occurs with the most sensitive biological processes. Spatial sensitivity was assessed over the entire Salish Sea, which is the spatial domain of the SSM biogeochemical model.
Pteropods in the Salish Sea inhabit the upper 100 m water column and undergo two spawning events. One event occurs in the springtime (March–May) and the other occurs in the fall (September–October). For pteropods, biological sensitivity is based on thresholds describing the sublethal and acute biological responses that were derived through expert consensus (Bednaršek et al., 2019). Each of the six thresholds in the study was assigned a specific confidence score, which was based on the combination of evidence and agreement (Mastrandrea et al., 2010).
Life history context was used for assessing the OA risks to larval Dungeness crabs considering their diel vertical migration pattern within the upper 160 m during the spring (May–June). Biological thresholds, however, were not available for the larval Dungeness crabs. Consequently, we used the equation that best describes their sensitivity against regionally specific OA gradients (Bednaršek et al., 2020). Larval stages of the Dungeness crab are susceptible to OA exposure, which can induce internal and external exoskeleton carapace dissolution (Bednaršek et al., 2020). Internal dissolution was correlated against calcite saturation state (Ωcal; Eq. 1; p = 0.003), derived from in situ vertical coastal gradients at the stations along Washington’s coast that are interconnected with the waters of the Salish Sea. Because of the regional similarity, we extrapolated this equation to the waters of the Salish Sea. The extent of internal dissolution is associated with extracellular acid-base control, which is linked to increased energetic demands and thus related to physiological impairments (Michaelidis et al., 2005; Hans et al., 2014; Bednaršek et al., 2020).
While evaluating the risks of sublethal exposure is simple, interpreting the risks at the population level is more complex and multifaceted. Here, we consider population-level effects to be most significant if anthropogenically induced OA conditions result in exposure inducive to the mortality threshold, particularly during the most vulnerable early-life stages. Alternatively, if the magnitude of exposure inducive to sublethal effects prevails for a prolonged time, it can contribute to compromised organismal performance and thus indirectly induce mortality. As such, we delineate the exposure related to sublethal effects on either seasonal (September–October or January-February) or annual bases to provide us with different temporal windows of OA-associated risks.
Applied Thresholds or Sensitivity Equations for Pteropods and Dungeness Crabs
Pteropod thresholds describe biological condition gradients ranging from sublethal biological effects (mild to severe dissolution, growth impairment) to lethal effects (survival). Each pteropod threshold is associated with the magnitude (Tmag in units of Ωar) and duration (Tdur in units of days) of exposure at which significantly negative impacts occur. Each threshold is additionally characterized by a confidence score determined by using a combination of the evidence and agreement, as based on the IPCC approach (Mastrandrea et al., 2010; Bednaršek et al., 2019).
Pteropod thresholds were applied over the upper 100 m integrated water column, which delineates the vertical habitat of pteropods in the Salish Sea. We conducted the application for three thresholds:
1. Mild dissolution (sublethal response; Ωar = 1.5 for 5 days; high confidence score)
2. Growth impairment (sublethal response; Ωar = 1.0 for 7 days; medium confidence score)
3. Mortality (lethal response; Ωar = 0.95 for 14 days; low confidence score).
For larval Dungeness crab, we used the equation (Eq. 1) for Ωcal over the upper 160 m water column to delineate the sublethal effects in the Salish Sea. Since the megalopae build their exoskeleton of calcite, the model outputs are in calcite saturation state (Ωcal), which is linearly correlated to Ωar. Internal dissolution describes a relative extent of dissolution per each individual (Bednaršek et al., 2020).
Evaluation of Biological Thresholds Using Model Outputs
Conditions of adverse Ωar below biological thresholds for pteropods are defined as the cumulative length of time with duration (D, days) of Ωar less than the defined threshold magnitude value (Tmag) for all events that each have time periods greater than the defined threshold for duration of each event (Tdur). We adopt the approach of Hauri et al. (2013) to define the intensity (I, unitless) of adverse events as:
where Ωar, mean is the mean Ωar averaged over the time of the event. The intensity represents the average magnitude of decrease in Ωar below the threshold during events. Both duration and intensity have an impact on health of organisms (e.g., Beesley et al., 2008), therefore the combined effect of duration and intensity is represented by a metric called severity (S, omega-days):
The following steps are involved in processing the model outputs:
(1) Extract the time series of predicted Ωar values and adjust for average model bias of −0.08 units. Model outputs are a continuous time series of predicted Ωar values at intervals of every 6 h;
(2) Step through the time series of bias-adjusted omega values to identify all events that have magnitudes less than Tmag for event durations greater than Tdur;
(3) Calculate the cumulative duration integrated across all events for the time period being evaluated (e.g., annual or seasonal);
(4) Calculate the cumulative intensity during events integrated across all events using Eq. 2;
(5) Calculate the integrated severity across all events from the cumulative duration and intensity using Eq. 3.
Results
Carbonate Chemistry Changes Due to Anthropogenic Contributions
Under the current conditions (Scenario 1; S1Ex) in the upper 100 m, about 94% of surface area of the Salish Sea has an average Ωar < 1 annually, with the remaining 6% ranges of 1 < Ωar < 1.2 (Figure 2 and Table 1). The worst conditions, in terms of the intensity, are located in the stratified bays of Hood Canal (stations P12 and P402), Whidbey Basin (station P4), and the northern part of the Salish Sea (station P28; Figure 2 and Table 1). Since pre-industrial times, Ωar conditions have been significantly affected by anthropogenic inputs, particularly atmospheric CO2. The annual mean Ωar over the 0–100 m depth range was 0.91 in the pre-industrial period compared to the current value of 0.8. The difference between current and pre-industrial water-column averages is nearly the same regardless of depth, while the average Ωar is higher toward the shallower depths (Table 1). In comparison, the mean pH for 0–100 m across the entire system is currently 7.69, while in the pre-industrial it was 7.76. The carbonate chemistry in the Main Basin (station P28) and various sub-basins have been mostly affected by atmospheric CO2 uptake (Table 1 and Figures 2, 3). These changes indicate that anthropogenically induced OA significantly increases the exposure below biological thresholds of pelagic calcifiers, i.e., pteropods and larval crabs. Spatially, the most affected habitats are the stratified bays of Hood Canal (station P12, P402), South Sound (station P38), and Whidbey Basin (station P4). With respect to the nutrient impacts, the calculated annual mean change in pH and Ωar is everywhere close to or below the root mean squared error (RMSE) of the SSM.
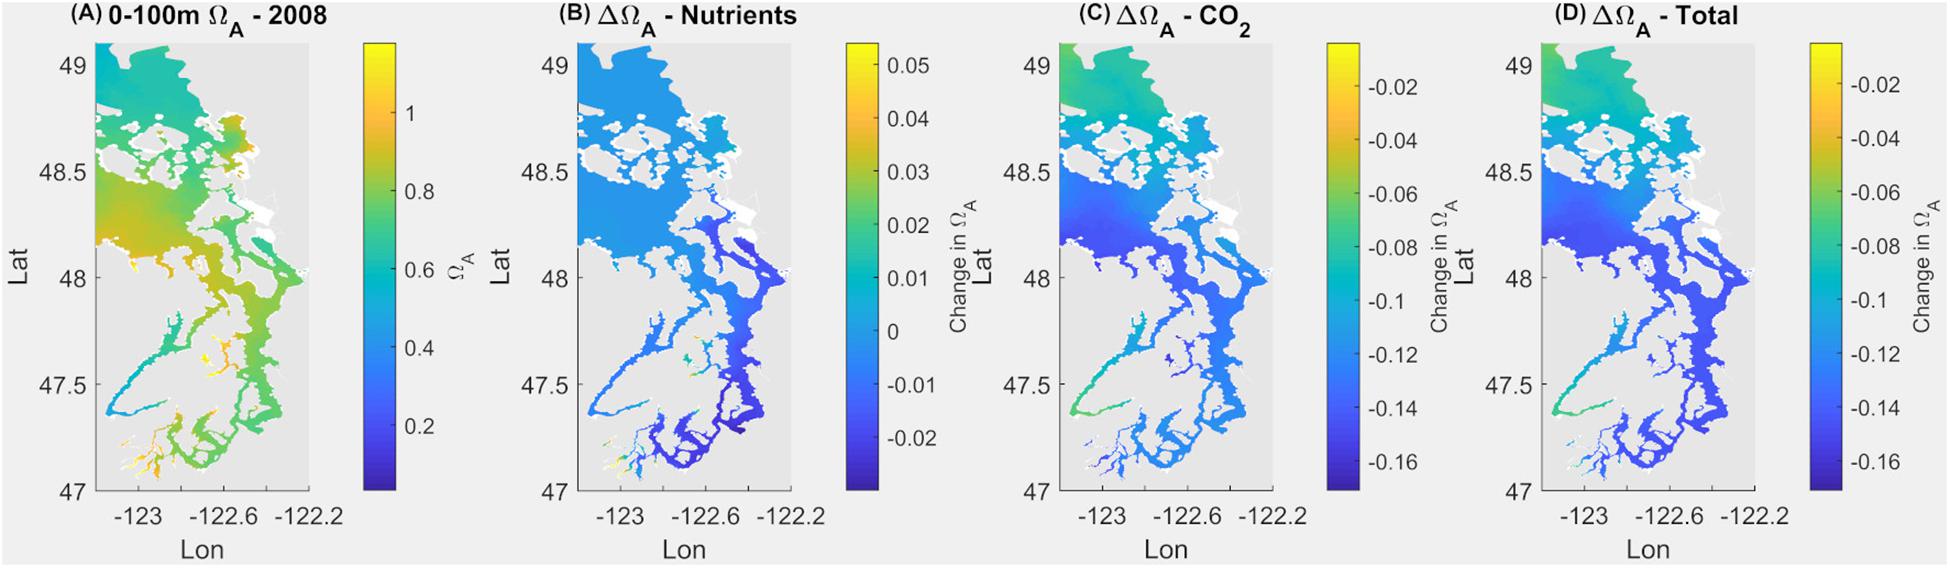
Figure 2. Current omega saturation state (Ωar) averaged over 100 m in the Salish Sea (A), with the changes in Ωar due to nutrients (B), atmospheric CO2 (C), and a combination of both (D).
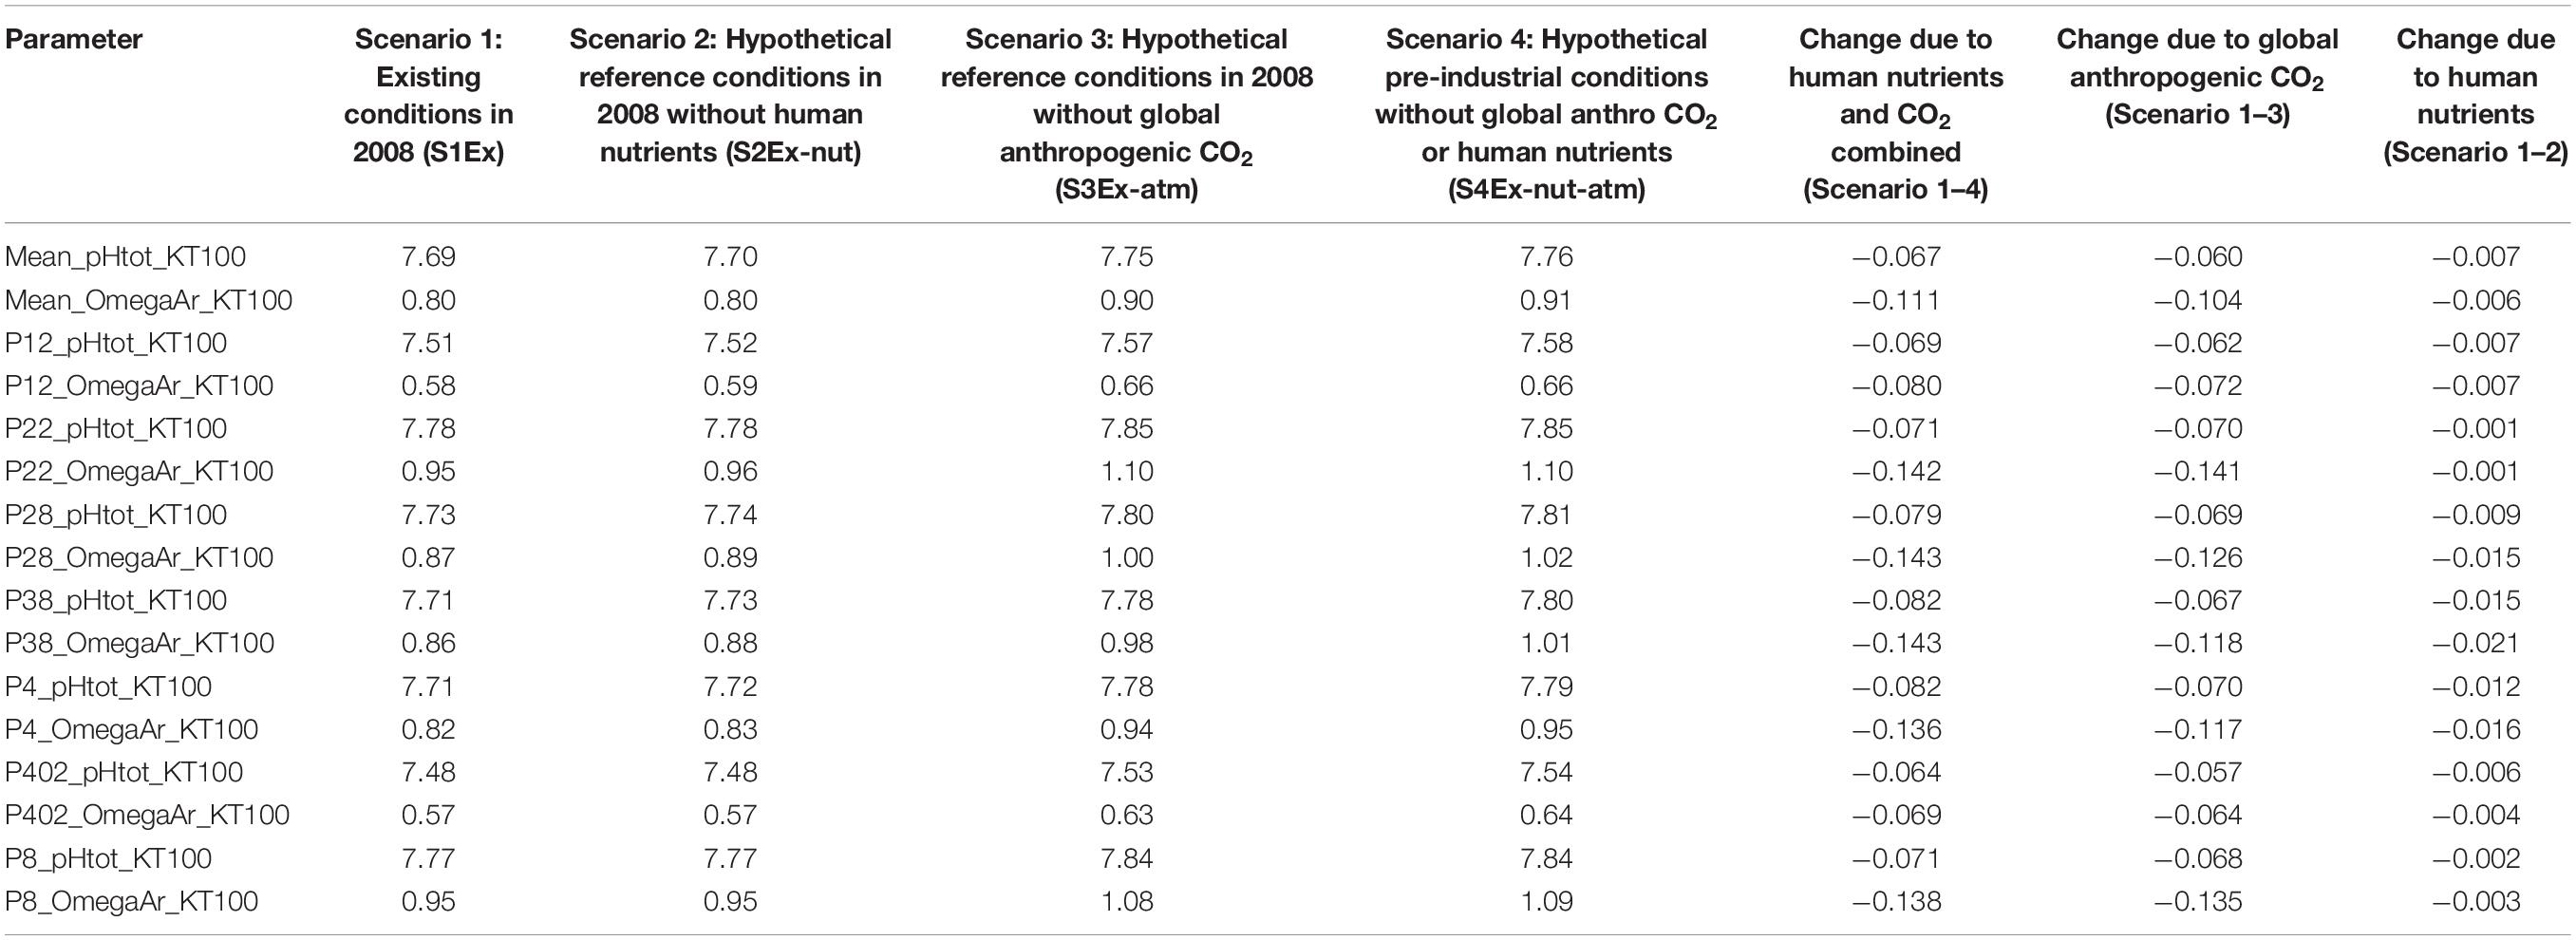
Table 1. Quantitative changes in omega saturation state due to nutrients, atmospheric CO2, and the combination of both at 100 m depth.
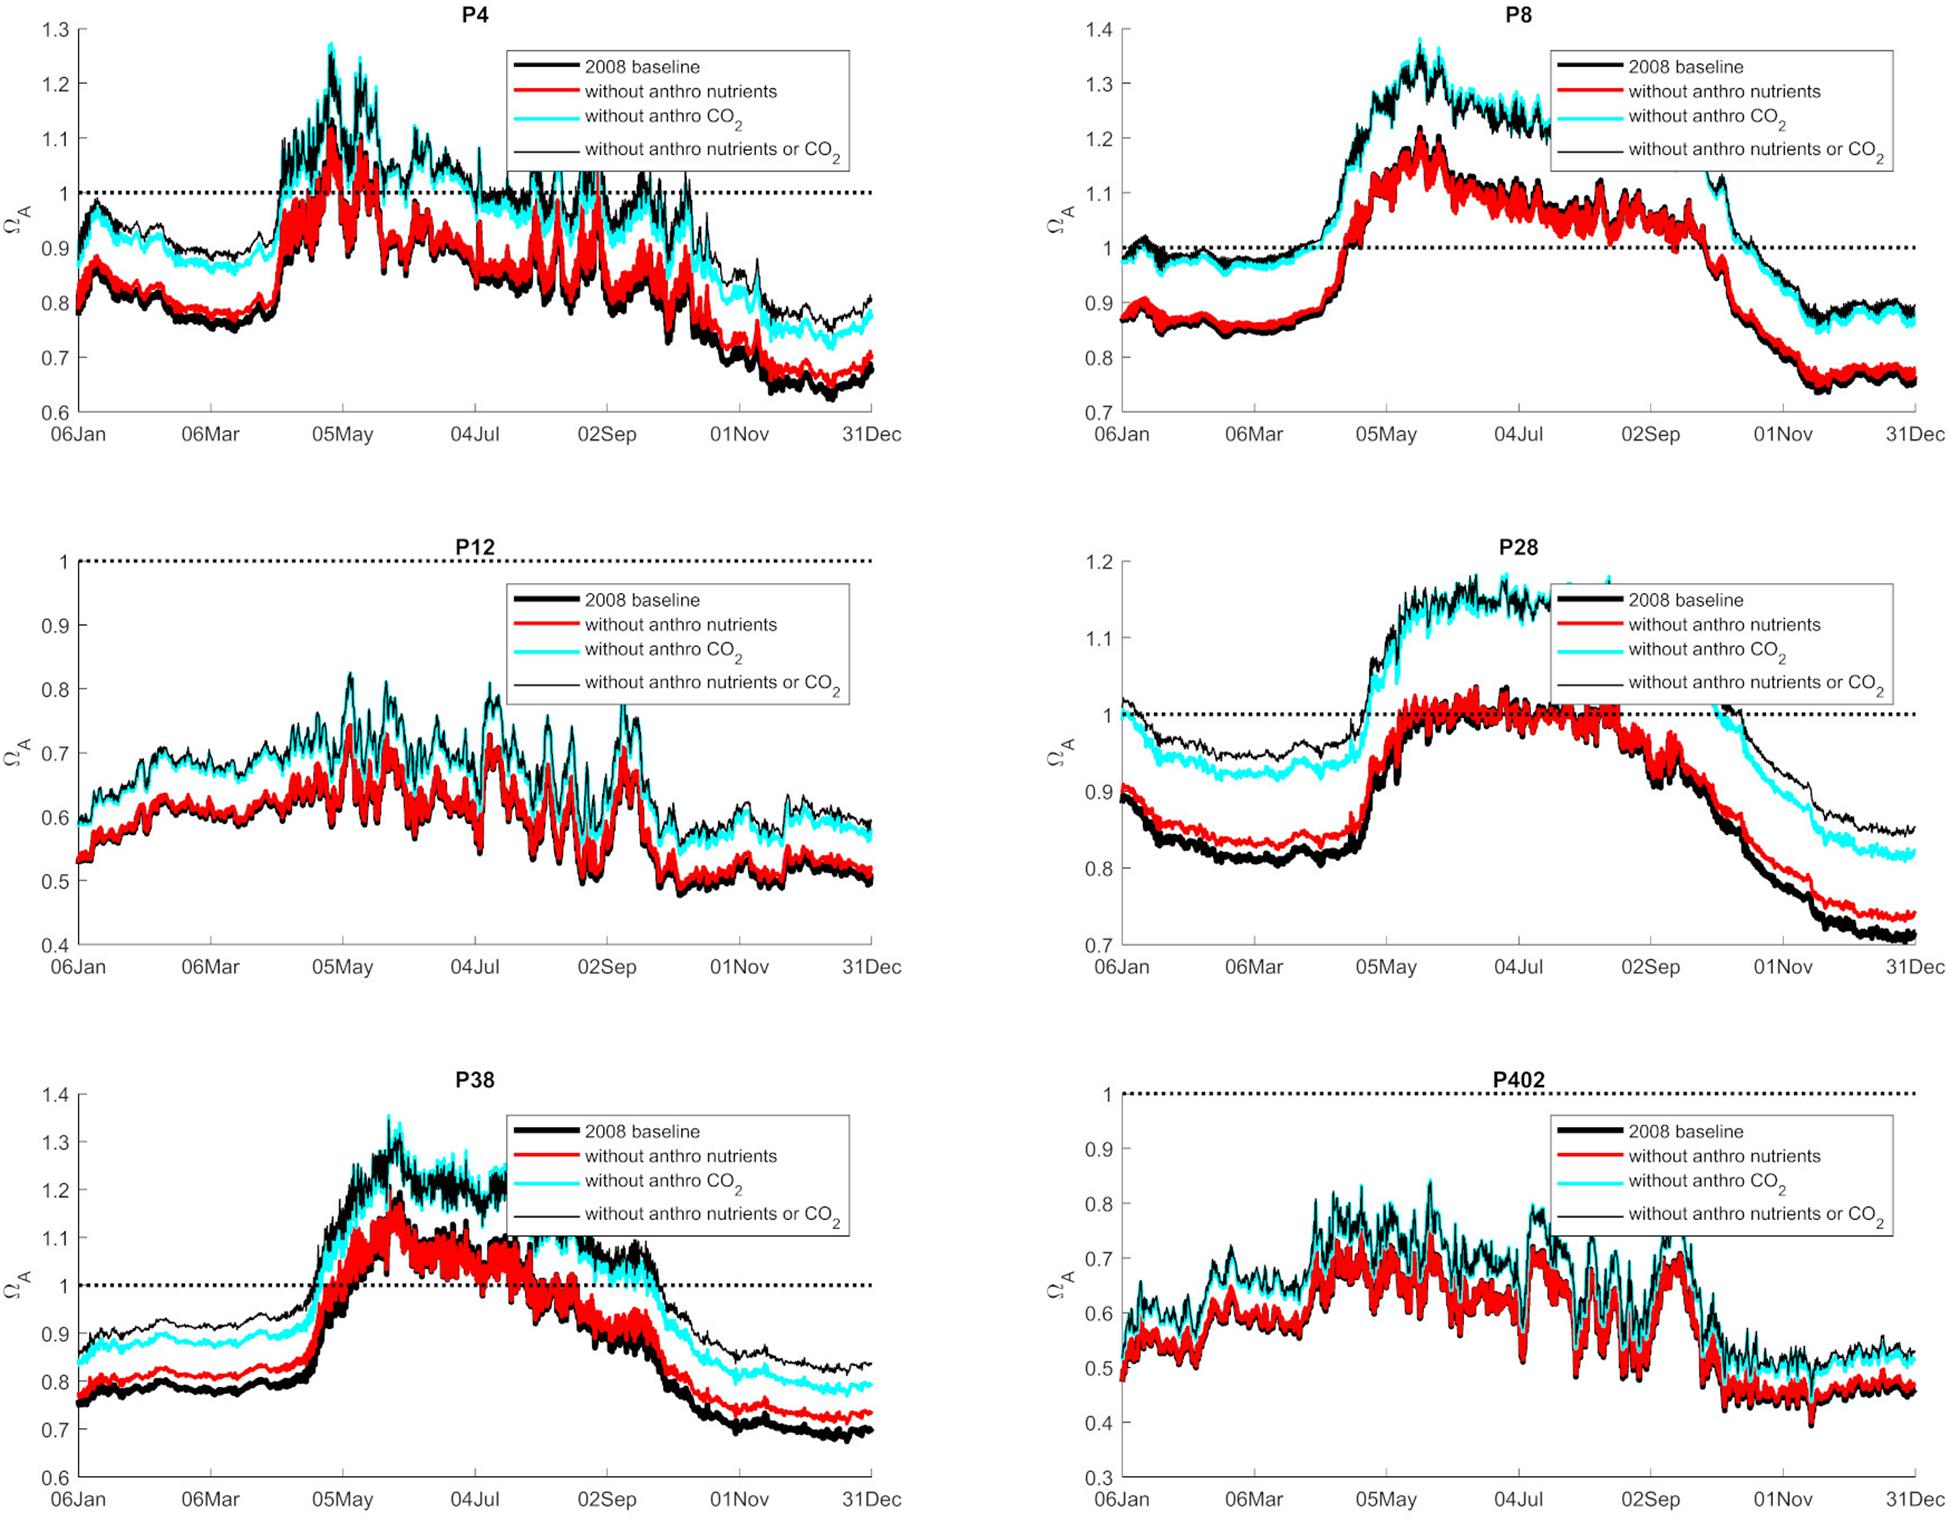
Figure 3. Graphical representation of the average annual 0–100 m values of Ωar (2008 baseline), and separated as a contribution to nutrients, atmospheric CO2, and both at six selected stations in Puget Sound (P4, P8, P12, P28, P38, P402 with locations shown in Figure 1).
Anthropogenic inputs play a major role in lowering Ωar on a seasonal basis, with unequal contributions to the baseline Ωar shifts during different seasons and locations. In terms of the latter, the underlying variability in carbonate chemistry dictates the changes due to anthropogenic inputs with a lower mean and amplitude of change, but the same frequency (Figure 3). In this manner, different regions exhibit different patterns. For example, the greatest difference in total change since the pre-industrial period appears to be at the deeper, well-mixed stations (e.g., P8, P28), while anthropogenic impacts are the smallest in the Hood Canal (P4 and P12; Figure 4).
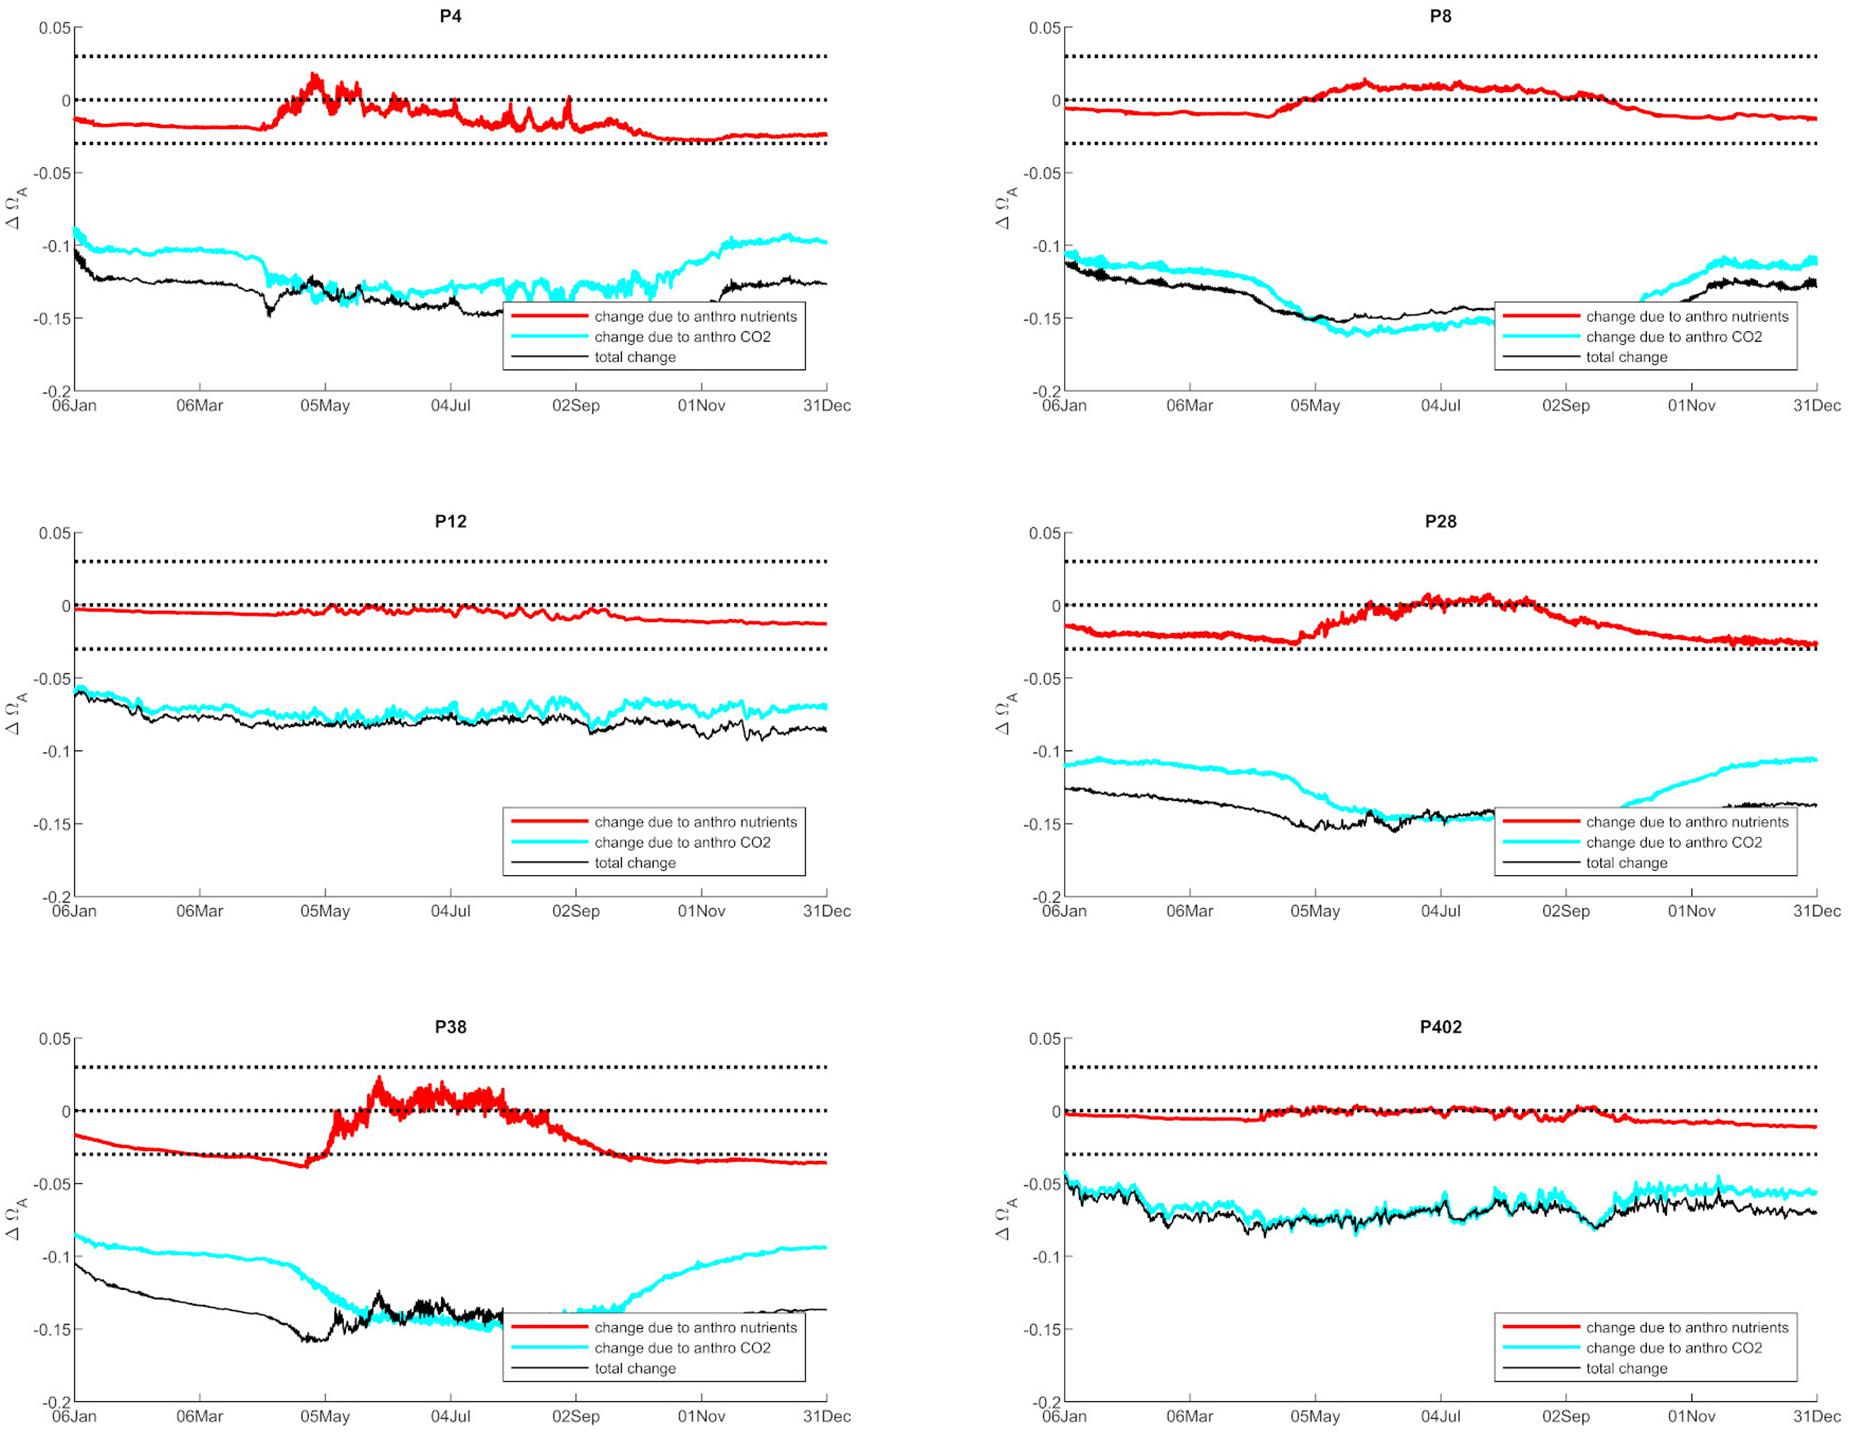
Figure 4. The changes in Ωar due to anthropogenic nutrients (red line) and atmospheric CO2 (blue line), while the black line represents the total change from both nutrients and atmospheric CO2 at six selected stations in Puget Sound (P4, P8, P12, P28, P38, P402 with locations shown in Figure 1).
When assessing estuarine habitat conditions, we separated habitats into two categories: first, the habitats with a low Ωar baseline level in which exposure can induce biological risk, while the anthropogenic component only adds to a minor extent of the overall change (0.06–0.08 Ωar). Such is the case at stations P12 and P402 (Figure 4). Second, the habitats with higher Ωar levels where the anthropogenic component contributes to more significant changes, with Ωar change up to 0.15 at stations P8, P4, P28, and P38 (Figure 4).
Impacts of Nutrient-Driven Eutrophication
The observed trends show that nutrient-driven eutrophication impacts on Ωar changes are largely dependent on primary production and respiration processes, and can have positive or negative effects, respectively, depending on spatial location and season. Based on the seasonally specific distributions, the greatest magnitude in Ωar change over the upper 100 m occurs during the early spring and late autumn period at stations P28 and P38 (Figures 3, 4). When Ωar is above 1–1.2 in the upper water column, the effect of added nutrients increases Ωar because the addition of eutrophication fuels primary production, which increases Ωar > 1 in near-surface waters. In this region, increased nutrient loading induces greater organic production and uptake of CO2 from the water by phytoplankton. When the additional phytoplankton settles to deeper depths, the decomposition of organic matter via respiration processes releases CO2. Consequently, the added nutrients contribute to greater decomposition of organic carbon, decreased pH, and lower Ωar values in deeper waters. This is reflected in the shape of the curve describing baseline vs. change in Ωar due to anthropogenic nutrients (at different regions throughout the year; Figures 3–5), the negative values of change in Ωar (indicating decrease in Ωar due to added nutrients), and the decreasing slope of the curve with decreasing Ωar < 1 values at most stations (Figure 5).
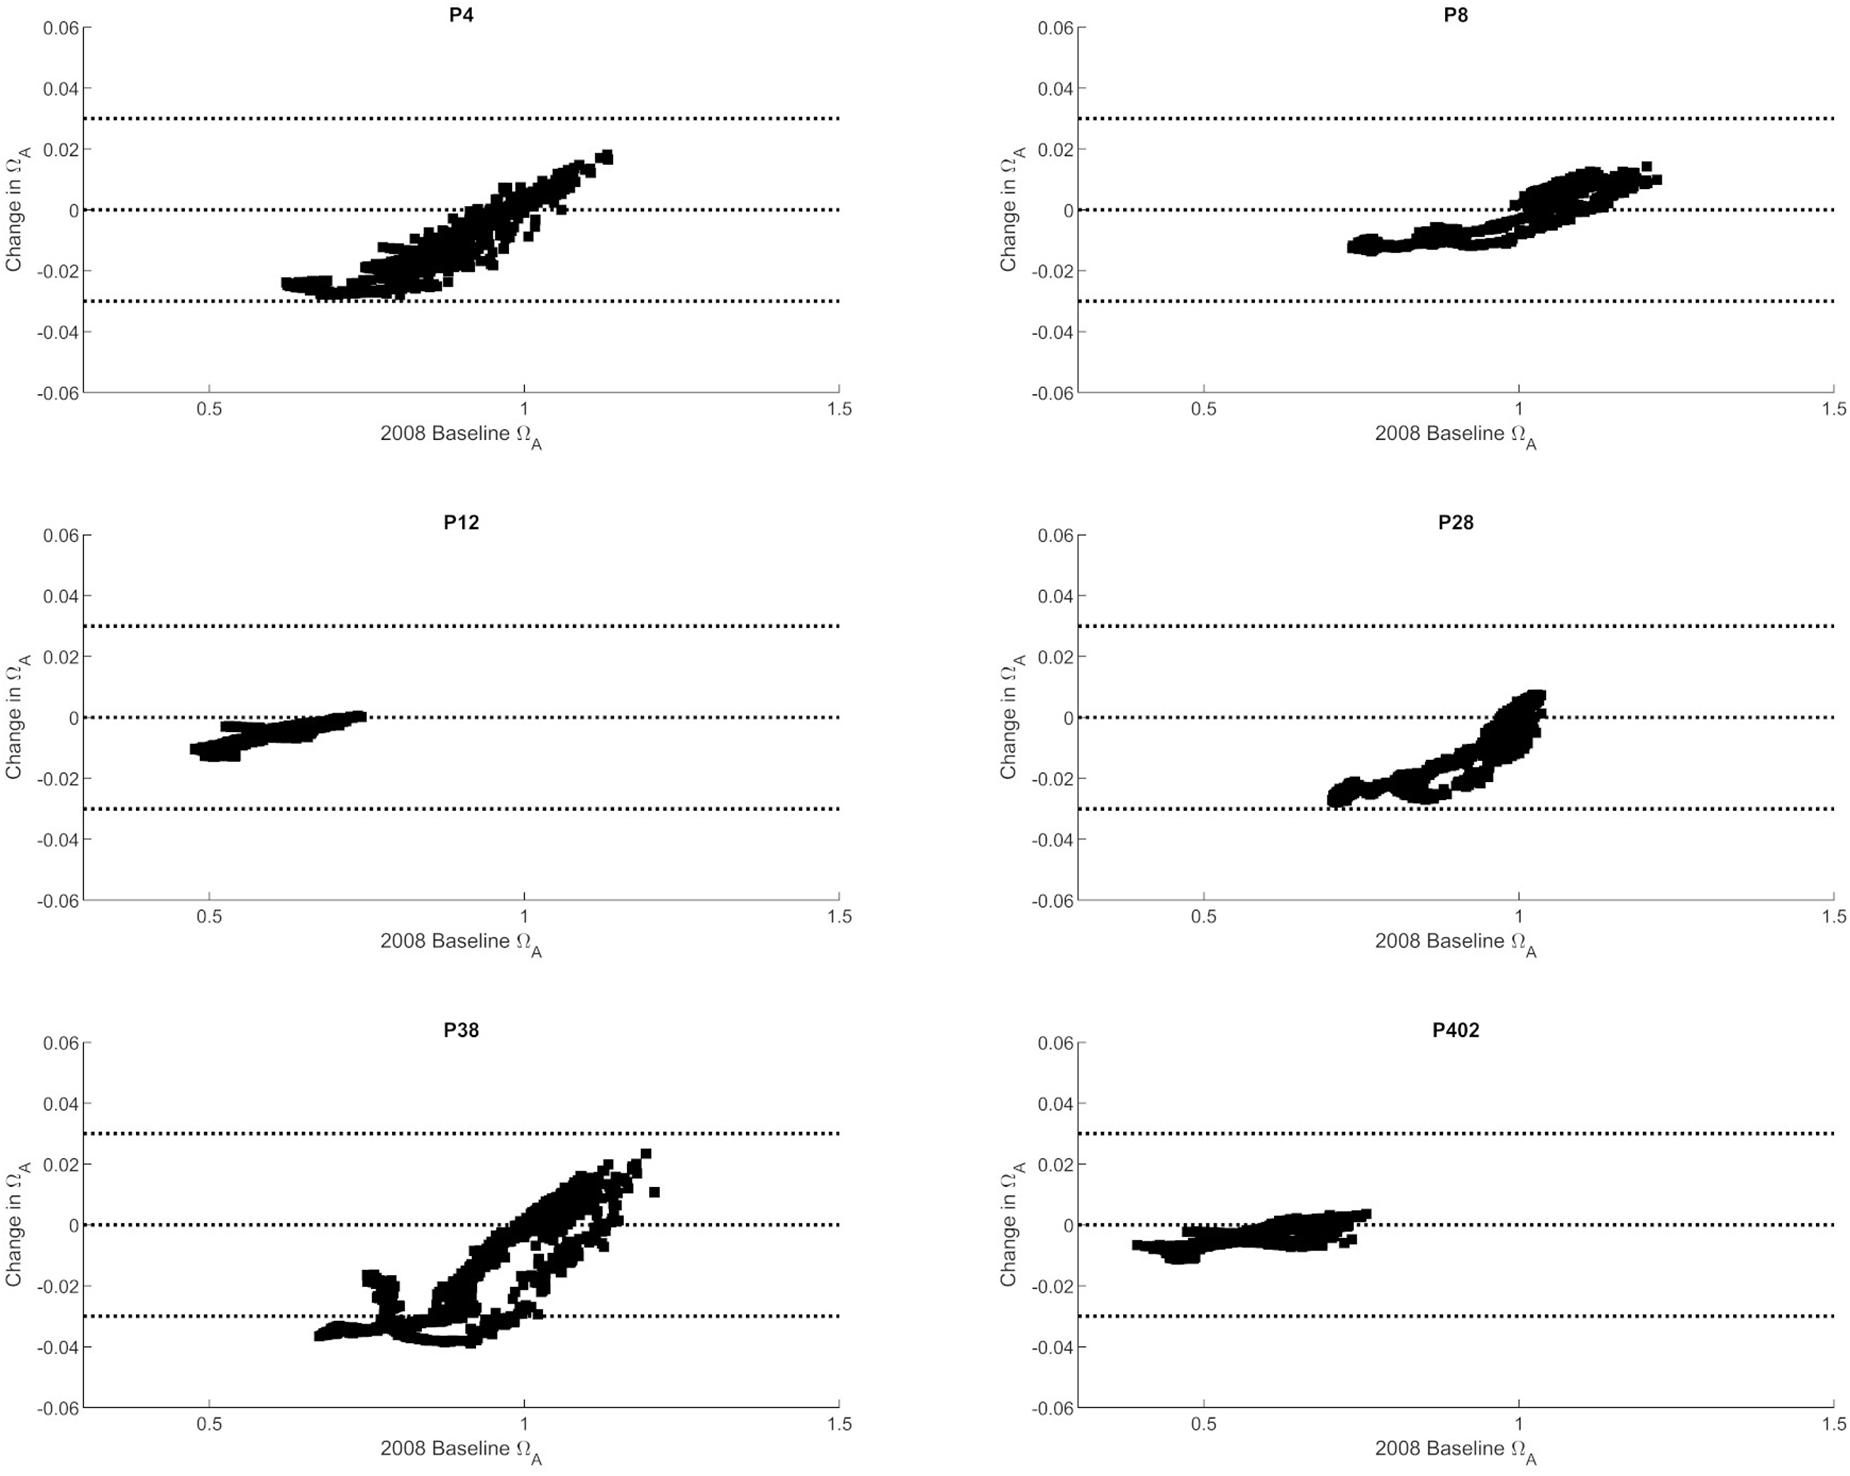
Figure 5. The correlation between baseline Ωar (as modeled for 2008) and changes in Ωar at six selected stations in the Puget Sound (P4, P8, P12, P28, P38, P402 with locations shown in Figure 1).
Model Skill
Root mean squared error and bias are appropriate measures of model skill for numerical biogeochemical models (Stow et al., 2009). Average model RMSE and bias for Ωar is ±0.29 and −0.08, respectively. Average RMSE and bias for pH is ±0.12 and −0.05, respectively. The model predictions of Ωar and pH were adjusted by the average model bias before reporting summary statistics or comparing with thresholds. In this report we use the model to calculate differences in carbonate system variables between realistic historical conditions in 2008 (Scenario 1: S1Ex, also referred to as “existing conditions”) and the other model scenarios to estimate the changes caused by anthropogenic CO2 and nutrients. Because the results of the different model scenarios are highly correlated with the existing conditions, the RMSE of the differences between scenarios is much less than the RMSE of the existing conditions. Pelletier et al. (2017) estimate the RMSE of predicted anthropogenic changes in pH and Ωar to be ±0.006 and ±0.03, respectively, using the SSM.
Threshold Application
Chemical Exposure Related to Pteropod Sublethal Thresholds
Sublethal and lethal pteropod thresholds were examined separately to ascribe the range of biological responses, from the subacute (dissolution and growth impairment) to the acute (mortality).
The most sensitive of the sublethal thresholds is mild shell dissolution (Ωar = 1.5 for 5 days), which describes the early warning stage of pteropod sensitivity (Figure 6). Under the current conditions, the duration of exposure for these thresholds occurs throughout the year (Figure 6A), with the intensity of exposure at 0.4–0.6 Ωar unit below the thresholds (Figure 6G), which is almost uniformly distributed within the Salish Sea basin. While the duration of exposure has not changed since pre-industrial times (Figure 6D), the intensity of exposure has increased from 0.06 in the smallest bays and inlets of the Hood Canal and the South Sound to 0.16 Ωar unit in the Main Basin (station P28) and most of the South Sound (station P38; Figure 6J), mostly due to the atmospheric CO2 uptake (60–90%; Figures 6I,L). Moreover, the nutrient-driven eutrophication contributes, on average, a 10% increase in the intensity of exposure across the wider Salish Sea, while up to 20–40% increase (up to 0.05 Ωar unit) occurs in the smaller inlets of the South Sound (Figure 6K). The increase in severity of exposure resembles the intensity (Figures 6M–R). Our results suggest that nutrient-driven eutrophication might increase pteropod exposure inducive of mild dissolution during the late fall to early spring period in the smaller inlets of the South Sound, an increase that is greater than the model RMSE of 0.03 Ωar unit (Figure 4).
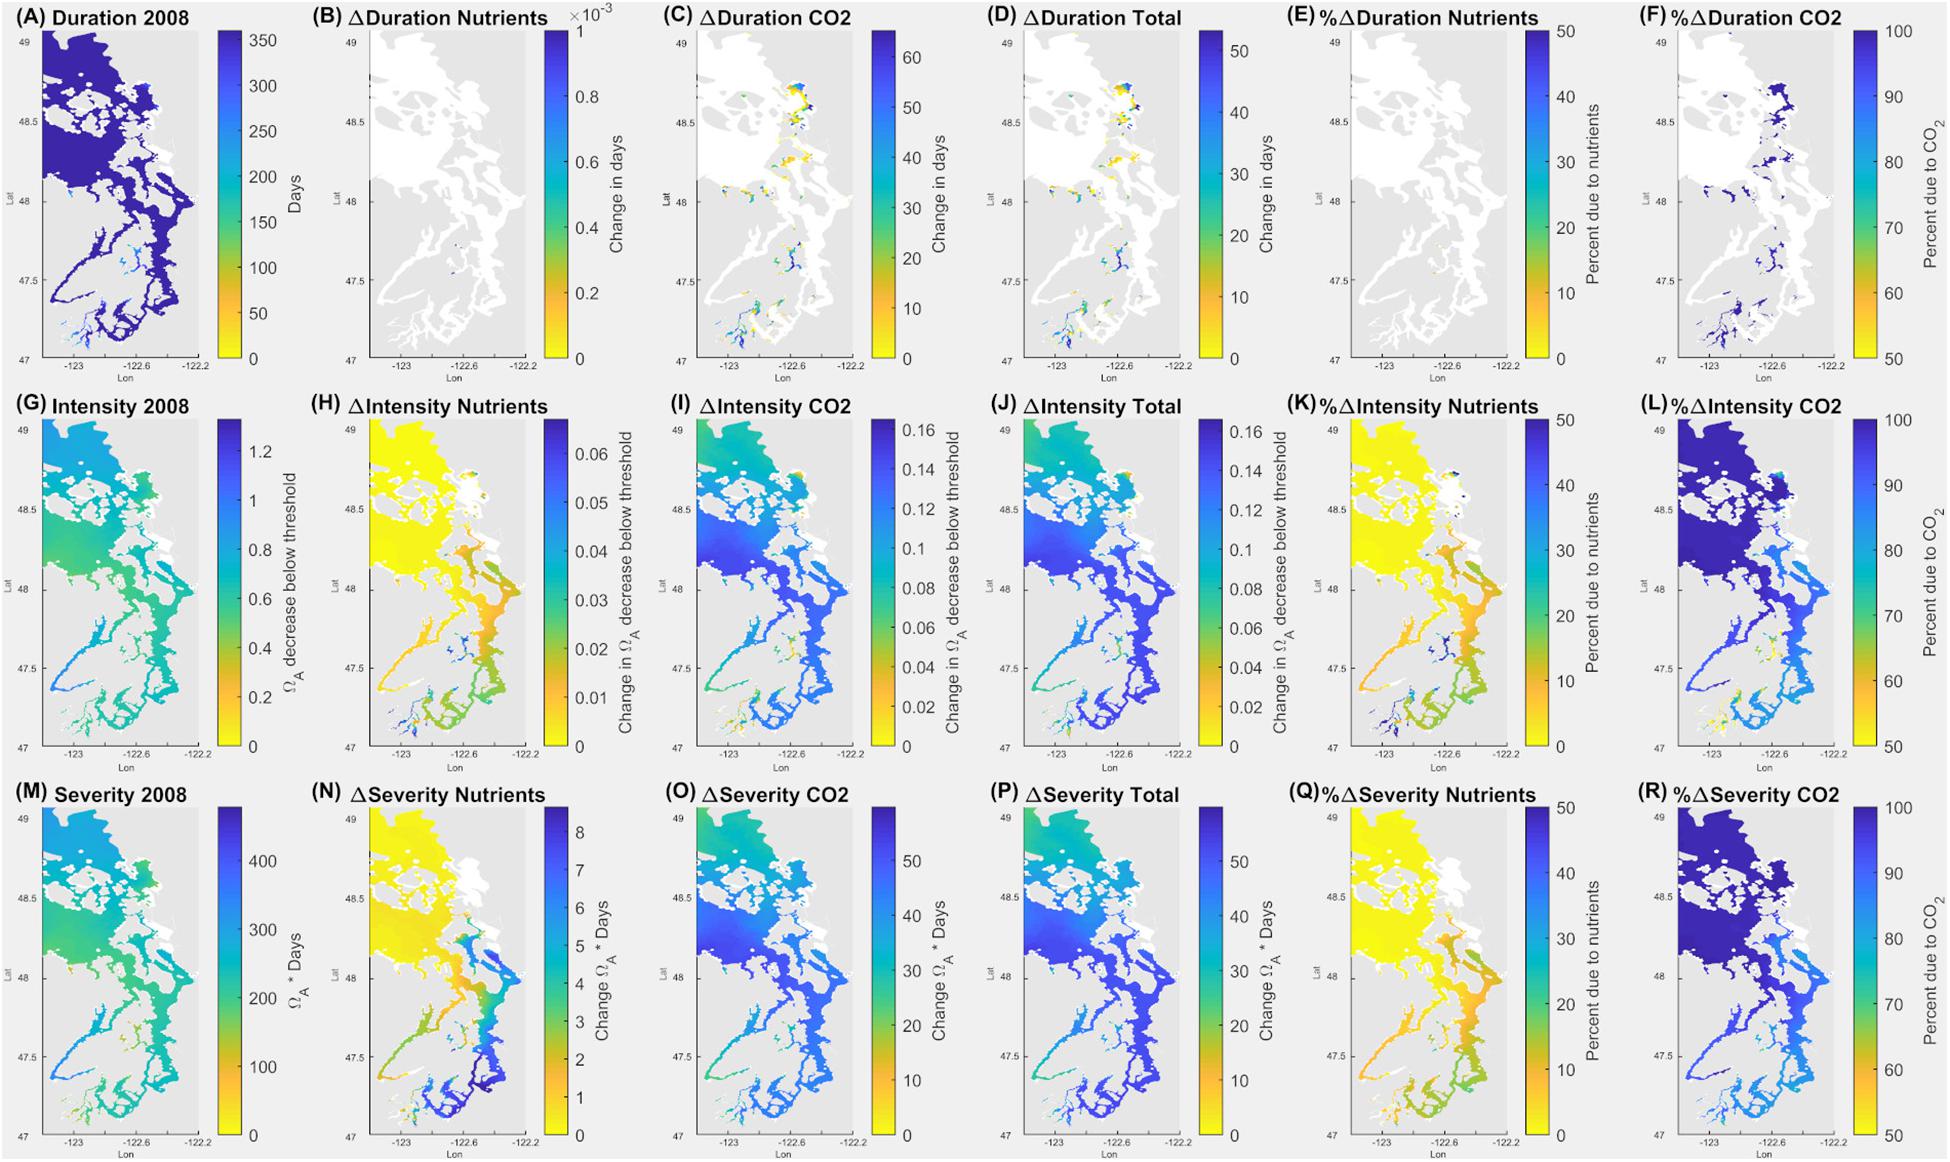
Figure 6. Application of pteropod threshold for mild dissolution (5 days at Ωar = 1.5) over the annual scale in the upper 100 m in the Salish Sea. Model outputs demonstrate current (2008) duration, intensity, and severity of the conditions (A,G,M). The second column indicates all the changes due to nutrients (B,H,N); the third column is related to the changes due to atmospheric CO2 (C,I,O); and the fourth column (D,J,P) shows total changes due to both nutrients and atmospheric CO2. The fifth column (E,K,Q) depicts % changes in Ωar due to nutrients, and the sixth column (F,L,R) is the % change in Ωar due to atmospheric CO2. Values of zero are masked in white.
The sublethal threshold of growth impairment (Ωar = 1.2 for 14 days; Figure 7) was applied in the SSM during the fall (September–October), co-occurring with the sensitive time period of growth of the secondary spawning pteropod cohort. During this period, the duration of exposure below the threshold is 40–60 days (Figure 7A). Since the pre-industrial period, this duration has increased from 10 to up to 50 days in the small inlets of the South Sound (station P38) and the Main Basin (station P28), respectively (Figure 7D). The model output of present-day Ωar exposure related to the intensity shows the conditions to be 0.1–0.4 Ωar unit below the growth impairment threshold (Figure 7G). The intensity-related conditions have changed considerably since pre-industrial times, with up to a 70–100% increase in the South Sound and the Main Basin due to atmospheric CO2 emissions (Figures 7J–L). A change of up to 30% (with more than 0.03 Ωar unit change) can be attributable to nutrient-driven eutrophication in the long, stratified embayments of the South Sound during the fall to spring period (Figure 7K), possibly triggering growth impairment. Moreover, when applying growth thresholds to the fall-winter period (November–February), the conditions can induce the same extent of sublethal responses as in the fall, indicating that pteropod sublethal processes are affected for a prolonged period, resulting in more severe exposure than predicted if only a limited time period is considered.
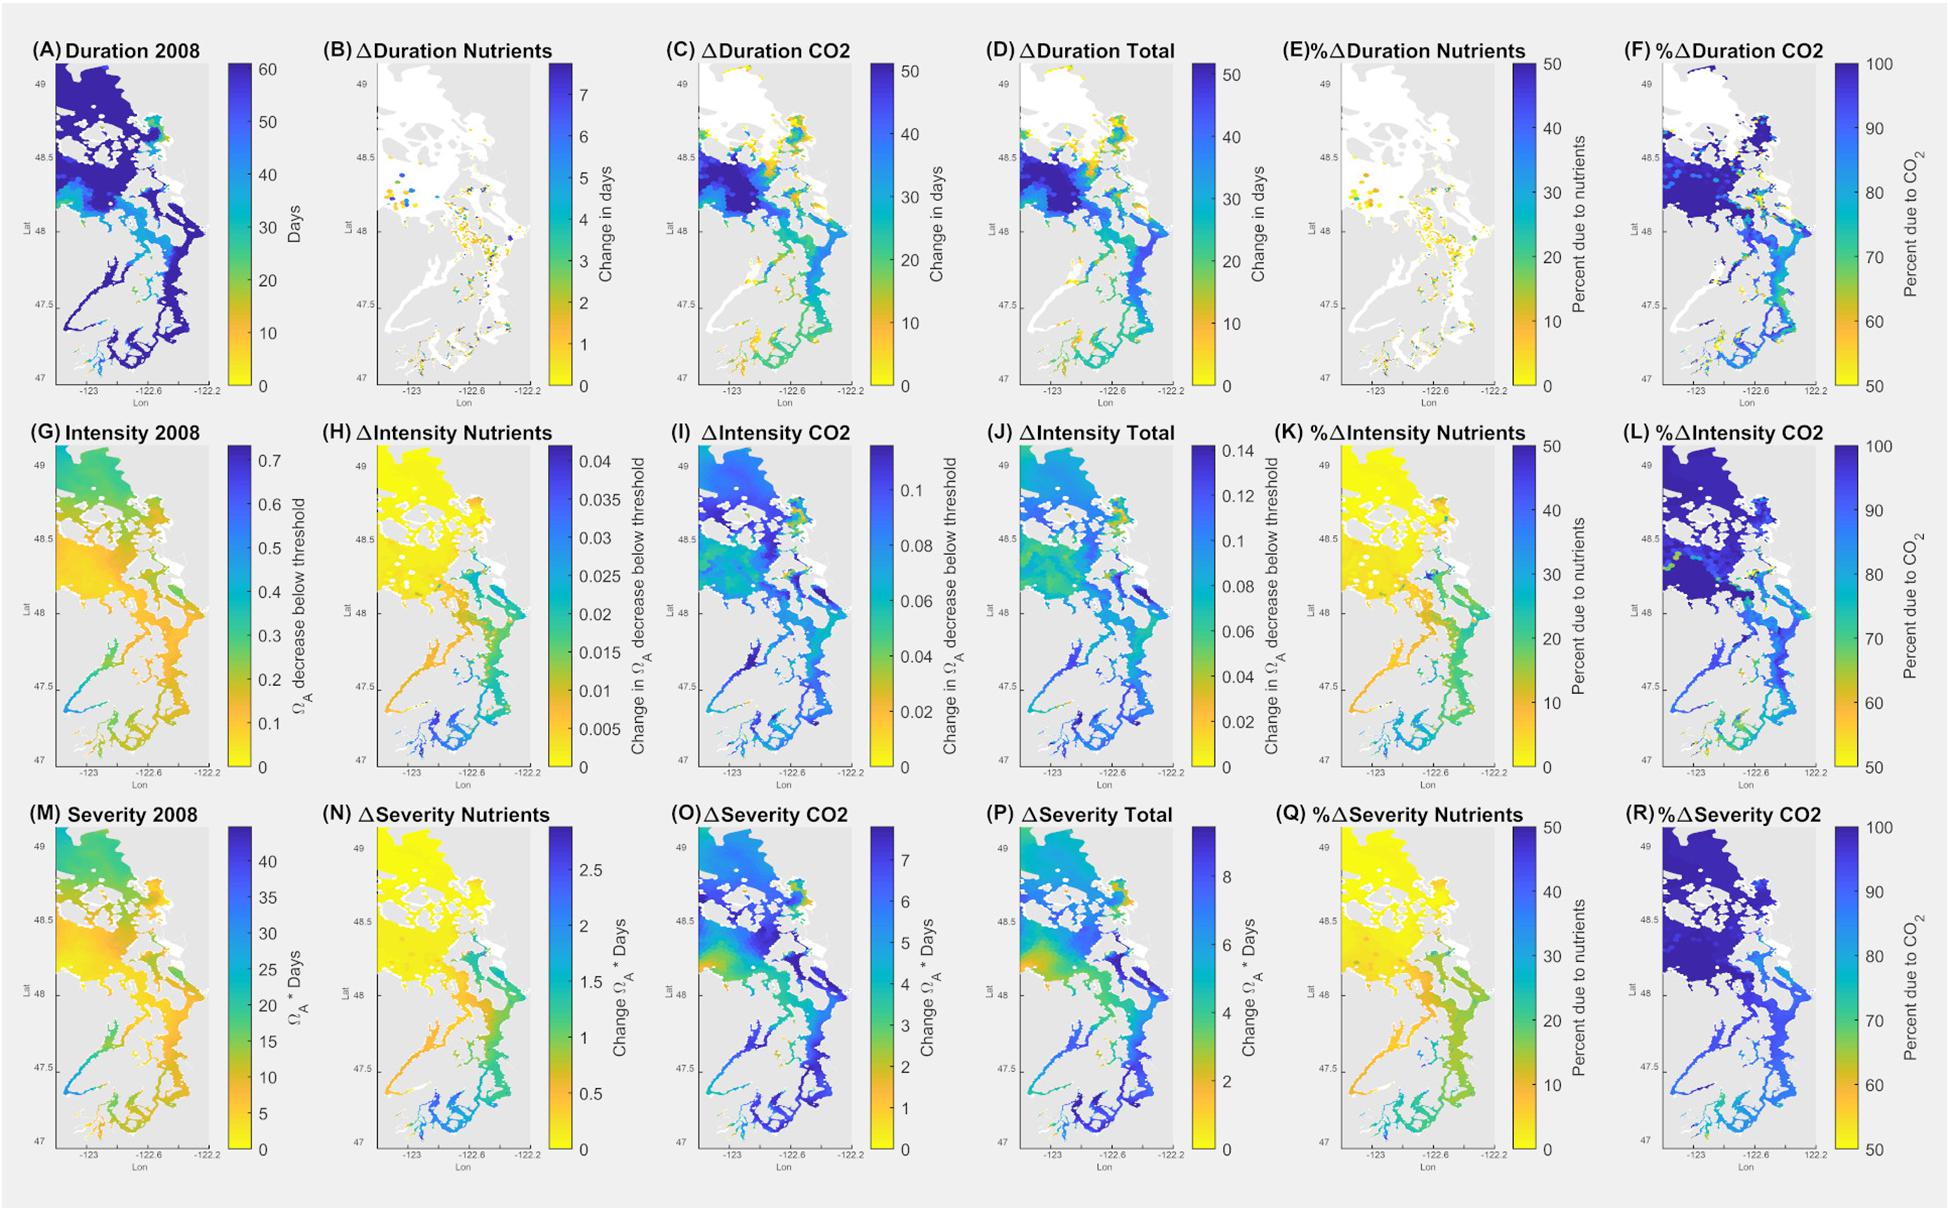
Figure 7. Application of pteropod threshold for growth impairment (7 days at Ωar = 1.0) over the seasonal scale in the upper 100 m of the Salish Sea during September–October. Model outputs demonstrate current (2008) duration, intensity, and severity of the conditions (A,G,M). The second column indicates the changes due to nutrients (B,H,N); the third column depicts the changes due to atmospheric CO2 (C,I,O); the fourth column (D,J,P) shows total changes due to both nutrients and atmospheric CO2. The fifth column (E,K,Q) depicts % changes in Ωar due to nutrients, and the sixth column (F,L,R) is % change in Ωar due to atmospheric CO2. Values of zero are masked in white.
Chemical Exposure Related to Pteropod Lethal Thresholds
Model outputs with applied mortality thresholds (Ωar = 0.95 for 14 days) demonstrate that various regions under present-day conditions are differentially affected in their duration of exposure on an annual basis. The largest duration and intensity of exposure is in the northern part of the Salish Sea (station P22), Whidbey Basin (station P4), and Hood Canal (Figure 8). The exposure is below the survival threshold for a considerable amount of time and magnitude, ranging from 70 to 300 days in the Main Basin (station P28) and Hood Canal (stations P402 and P12), respectively (Figure 8A), and intensity in the range of 0.1–0.4 Ωar (Figure 8B). When exposure was considered across the seasonal time scale, we observed conditions below the survival threshold to be prevalent during the late summer to early spring period. This indicates that vital population processes are affected for a prolonged duration and could subsequently result in changes on the population level.
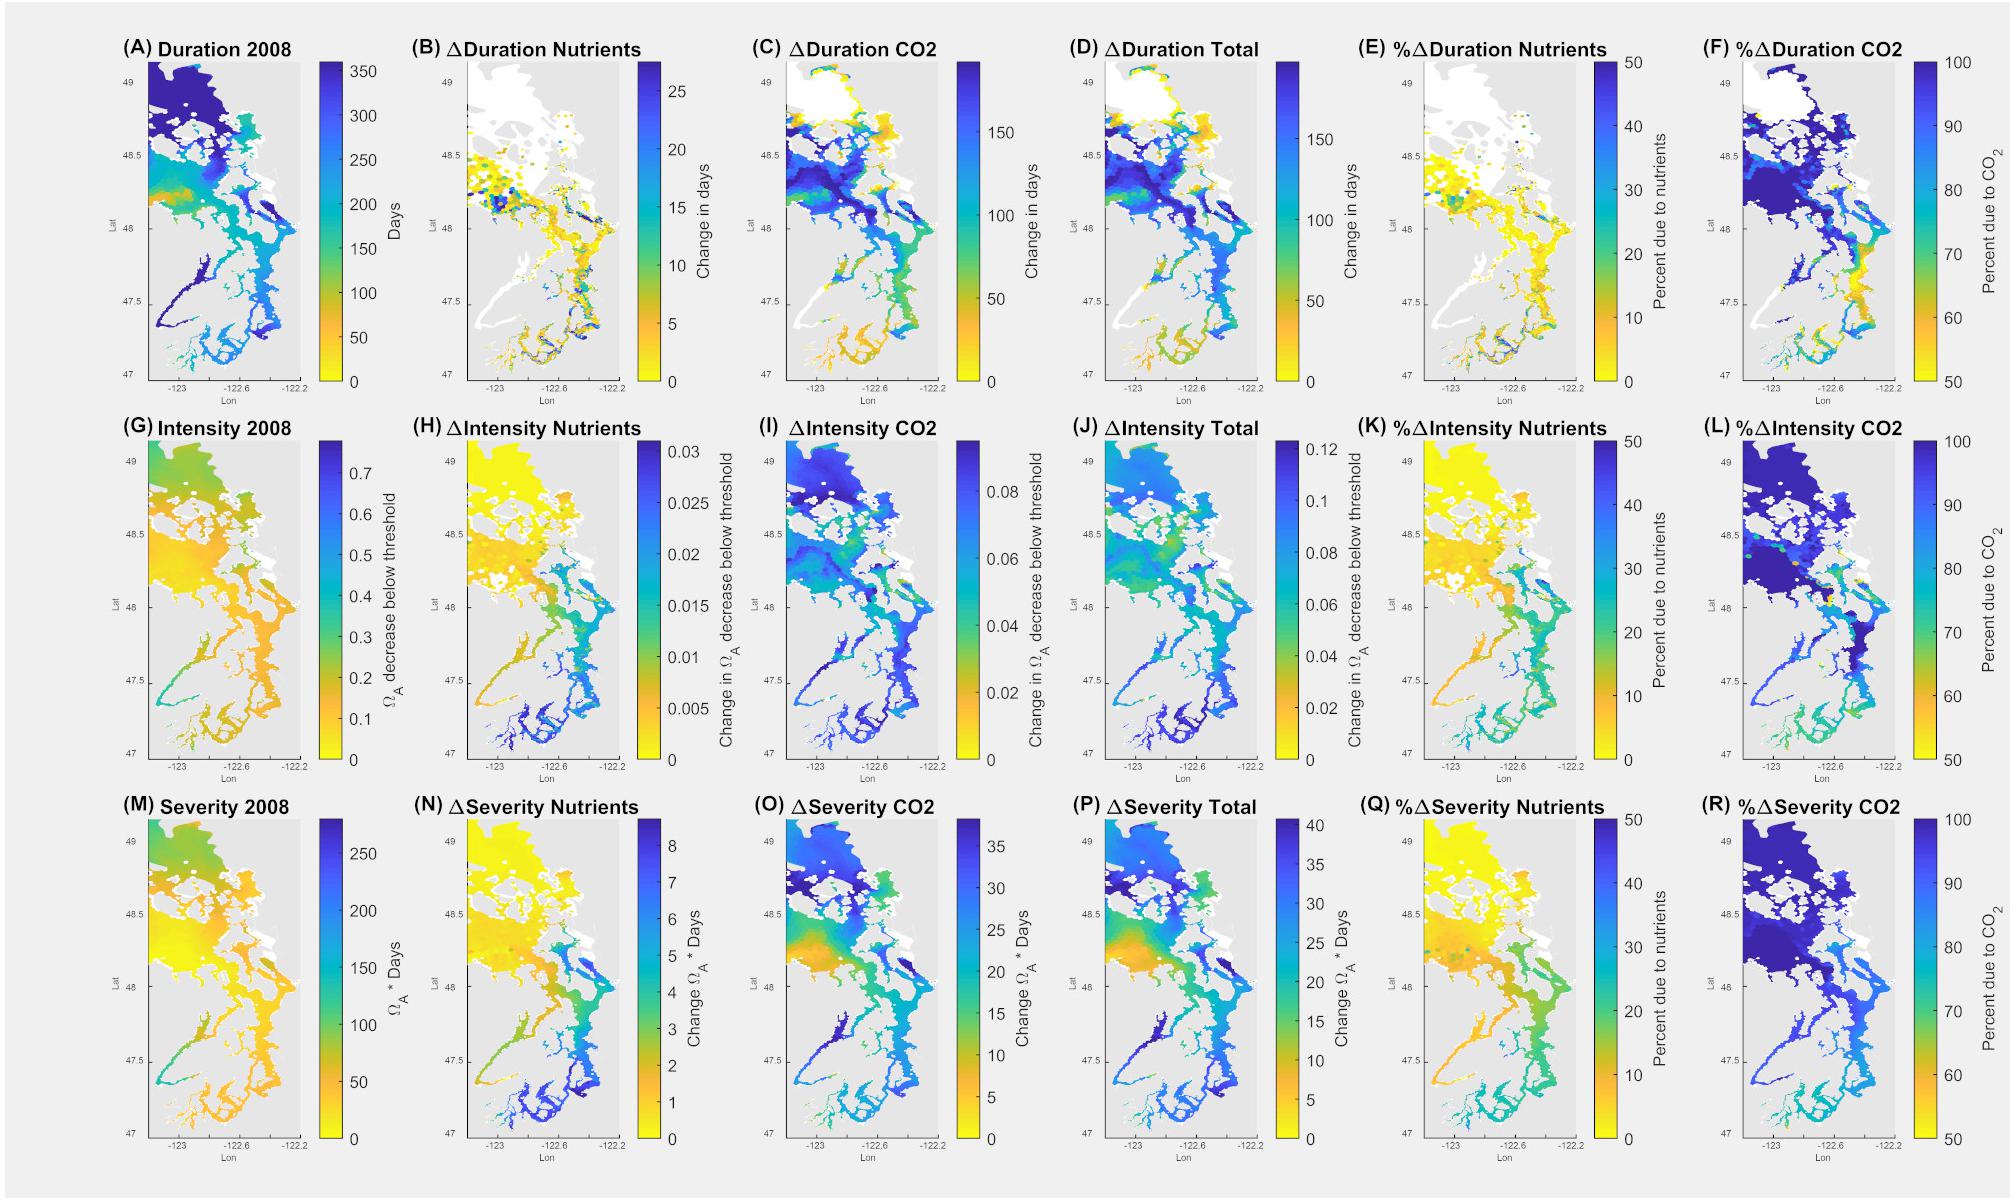
Figure 8. Application of pteropod threshold for survival in the upper 100 m (14 days at Ωar = 0.95) over the annual scale in the Salish Sea. Model outputs demonstrate current duration, intensity, and severity of the conditions (A,G,M). The second column indicates all the changes due to nutrients (B,H,N); the third column depicts the changes due to atmospheric CO2 (C,I,O), the fourth column (D,J,P) shows total changes due to both nutrients and atmospheric CO2. The fifth column (E,K,Q) depicts % changes in Ωar due to nutrients, and the sixth column (F,L,R) is % change in Ωar due to atmospheric CO2. Values of zero are masked in white.
Since pre-industrial times, the overall change of 0.11 Ωar (Figure 8J), with 70–90% of the change attributable to atmospheric CO2 uptake, occurred within the Main Basin, the northern part of the Salish Sea, and Hood Canal (Figures 8I,J). Comparatively, the impact of nutrient-driven eutrophication since pre-industrial times was not significant (Figures 8H,K).
Impact of Anthropogenic OA on the Larval Stages of Dungeness Crab
Exposure to current Ωcal during the springtime (May–June) induces a spatially differential extent of internal dissolution of the larval stages of the Dungeness crab (Figure 9). The most severe extent of internal dissolution occurs in the Hood Canal, Whidbey Basin, and partially in the South Sound (Figure 9A). The lowest baseline Ωcal, which occurs in the early spring and fall–winter periods (Figure 4), coincides with the increases in internal dissolution over the same seasonal scales. The magnitude of exposure since pre-industrial times has resulted in increased internal dissolution of 20–30% across the Salish Sea. A few spatially limited bays of the South Sound have experienced more than a 60% increase (Figure 9D). In terms of attribution, CO2 emissions uptake results in the greatest increase in internal dissolution (Figure 9C), while nutrient-related eutrophication caused an insignificant increase (Figure 9B). Areas currently exhibiting the most extensive dissolution are not always the same as the areas with the most rapid change. This is evident where changes related to the combination of both anthropogenic stressors are larger than the current state of internal dissolution (Figures 9A vs. 9C) regionally in the South Sound, Sinclair, and Dyes Inlets.
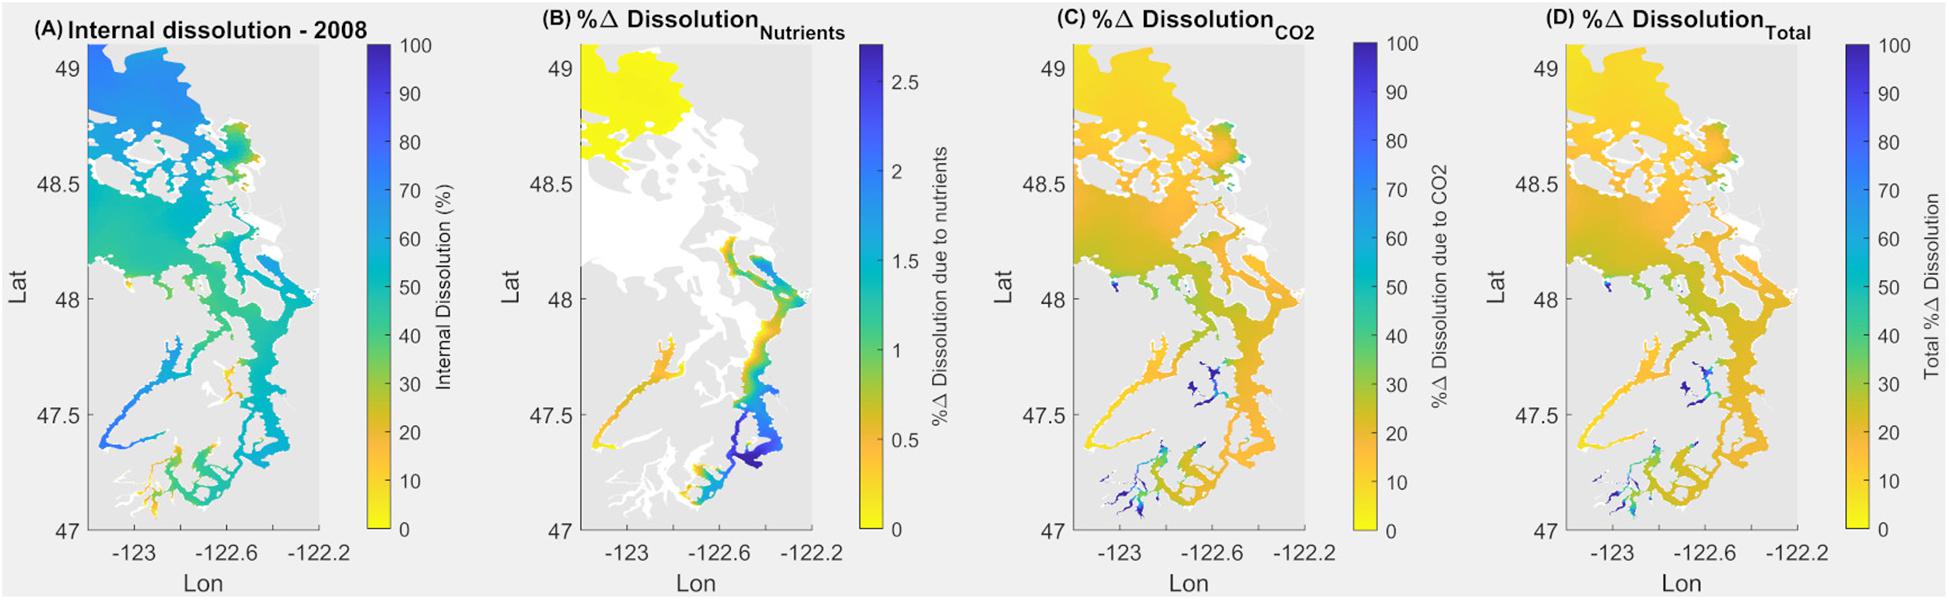
Figure 9. Application of equation for larval Dungeness crab dissolution over upper 160 m integrated water depth for May–June in the Salish Sea to demonstrate current (2008) state of internal dissolution in % (A); % change of dissolution due to nutrients (B); due to atmospheric CO2 (C); and combined % change due to both nutrients and atmospheric CO2 (D).
Temporal and Spatial Scale of Anthropogenic Drivers Inducing Negative Biological Responses
In evaluating the impact of the anthropogenic drivers since pre-industrial times, there are differences in the spatial and temporal extent of impact between two anthropogenic drivers, i.e., atmospheric CO2 emissions and nutrient-related eutrophication. As such, the contributions of each to driving the conditions below the biological thresholds are different. The results of the attribution analyses show a predominant impact of anthropogenic CO2 from atmospheric CO2 emissions that increase the influx of DIC from the open ocean boundary, as well as the exchange of CO2 across the air/water interface, driving Ωar,cal conditions below the sublethal and lethal thresholds. Such impacts have been observed over most spatial scales in the Salish Sea from the deeper basins to the inlets, although not to the same extent, with Ωar,cal conditions in the deep basins being significantly more susceptible to the changes compared to the smaller bays and inlets. The Main Basin is consistently more affected by atmospheric CO2 than the inlets of the South Sound (Figures 2–4). The temporal attribution of atmospheric CO2 impacts is equally noted across all the seasons, although at one station in the South Sound (station P38 in Carr Inlet), the greatest impact is during the fall to spring months (Figure 4). As such, atmospheric CO2 emissions directly contribute to the change in Ωar,cal, and thus related duration, magnitude, and severity of exposure for major sublethal (shell dissolution and growth) and, possibly, lethal (mortality) biological effects (Figures 6, 7 vs. Figure 8), and thus increase in risk for both pteropods and larval Dungeness crabs.
Eutrophication contributes to the change in Ωar,cal conditions below the thresholds to a much smaller extent than atmospheric CO2. Since the change in Ωar due to eutrophication is less than the model uncertainty, eutrophication plays an insignificant role across spatial and temporal scales for the annual mean (Figure 2). The change is the greatest when baseline Ωar,cal conditions are already low, which occurs during the late summer to early spring period. Spatially, the attribution of nutrient-driven eutrophication on conditions above the 0.03 Ωar threshold was mainly observed in smaller, less vertically mixed bays and inlets of the South Sound, representative of the conditions at station P38 in Carr Inlet (Figure 4).
From a biological standpoint, added nutrients may have more adverse impacts on the lower thresholds when Ωar is closer to or lower than 1.0 and can indirectly exacerbate biological status of organisms when they are already severely impacted (Figures 4, 5). This could happen by small-scale reductions of the initially low baseline conditions that result in the threshold crossing during some months that can affect the most critical life stages, in the early spring and the late summer-early fall period. Namely, around Ωar < 1.0, a very small reduction in Ωar can shift the conditions inducive to sublethal processes toward lethal processes. On the other hand, the addition of nutrients in the spring and summer periods can increase Ωar > 1, with nutrients having a less detrimental effect, or in fact, partially alleviating OA stress. Overall, however, because of spatially and temporally limited impacts, we conclude that eutrophication contributes minimally to the change in chemical exposure and, thus, associated biological risks.
Future Projections
Here, we demonstrate future projected changes related to the seasonal Ωar distribution under RCP 8.5 for the year 2100 integrated for 0–100 m. We chose station P28 to represent a centrally located region of the Main Basin, of Puget Sound (Figure 10A), with the future projection scenario as described in Scenario 5 (S5-Future; see section “Model Scenarios”). The projections show a dramatic decrease in Ωar. Pre-industrial summer conditions were mostly supersaturated (Ωar > 1). The increase in seasonal exposure is reflected in a reduced amount of time above the sublethal and lethal thresholds (Figure 9B). The conditions above the sublethal thresholds (Ωar of 1.5, 1.2, and 1.0) start to rapidly decline in the past few decades and disappear before the year 2050. In contrast, the conditions above the lethal threshold (Ωar = 0.9) since pre-industrial times at first decline gradually, then exponentially over the last few decades, and completely disappear by the year 2050. Such exposure below the thresholds can impose detrimental impacts on marine calcifiers’ sustainability.
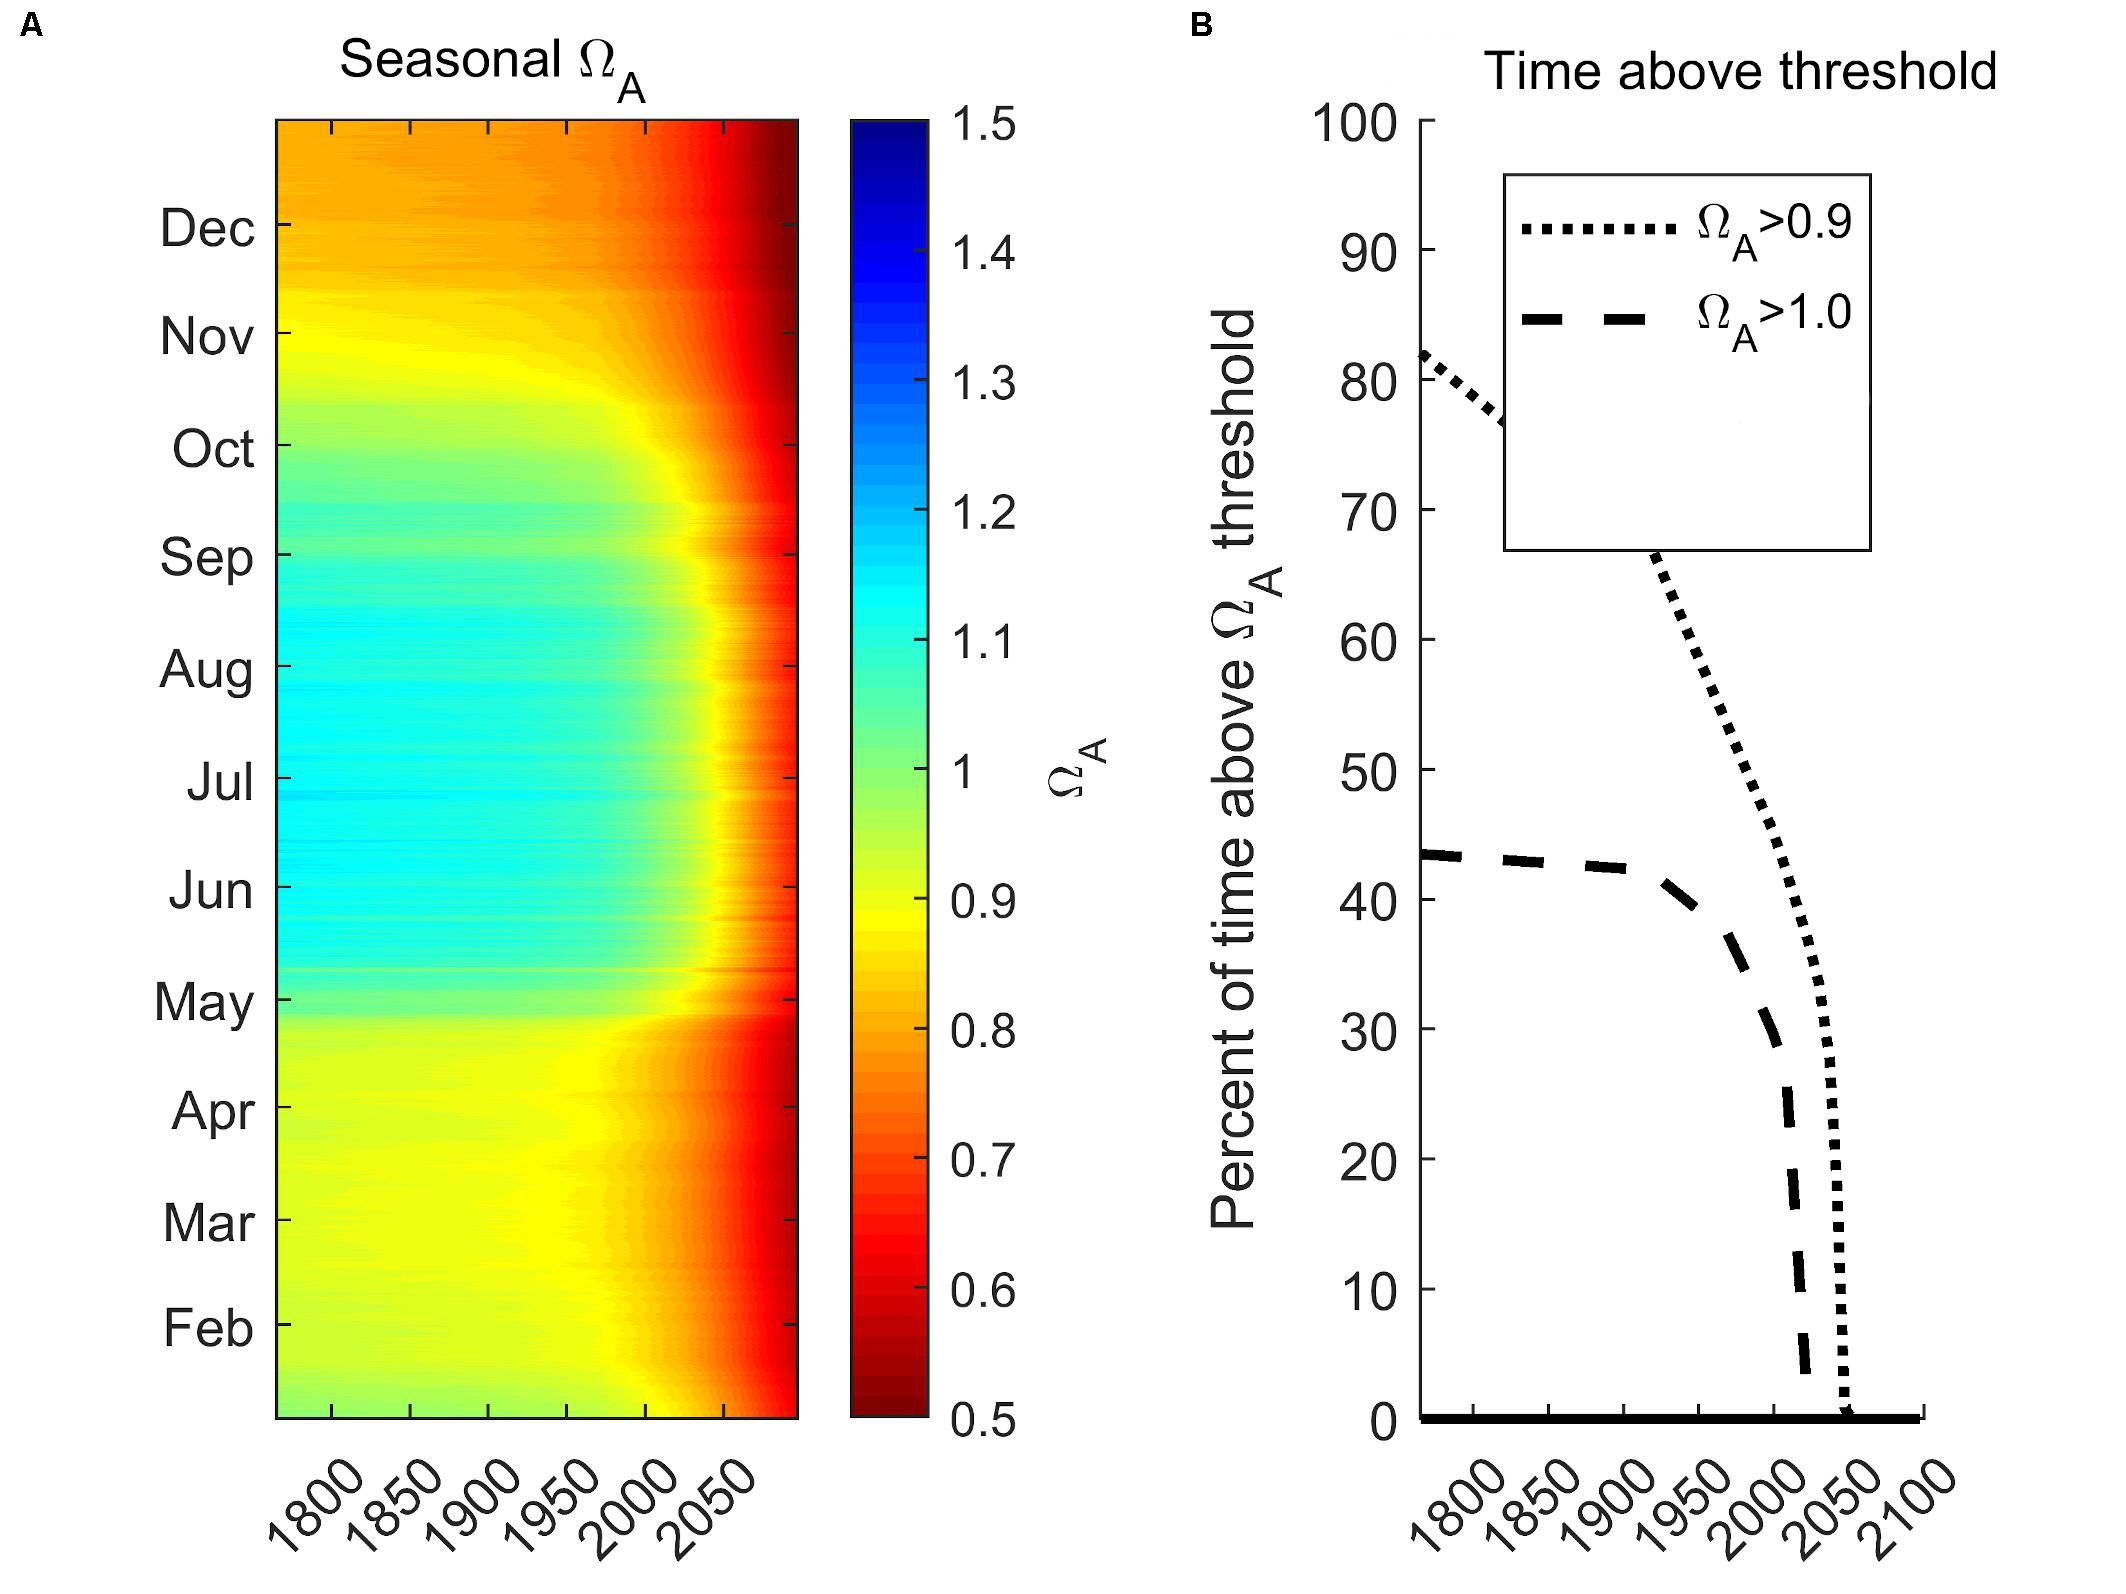
Figure 10. Future seasonal projections of vertically integrated (0–100 m) Ωar at the station P28 in the Main Basin under RCP 8.5 scenario for the year 2100 (A) and projected time above pteropod thresholds for sublethal (Ωar of 1.0) and lethal (Ωar of 0.9; B).
Discussion
Current and Future Exposures
This is the first study along the United States West Coast that has considered the changes in OA exposure and risk to estuarine habitats using a combination of sensitivity tools and a highly resolved biogeochemical model. Our results demonstrate that the most biologically relevant changes in carbonate chemistry in the Salish Sea since pre-industrial times are driven on seasonal time scales. Since the seasonal conditions are spatially dependent on the Ωar status, the interpretation of seasonal Ωar projections suggest that time-sensitive biological processes (spring and autumn spawning, spring growth) will be most affected. Habitats currently with the lowest OA baseline conditions (the greatest exposure) and those that are rapidly changing due to anthropogenic drivers will likely be the most affected. Based on seasonal exposure outputs, all of the species are exposed to unfavorable conditions below the thresholds for a considerable amount of time and, as such, important processes during various life stages can be impacted. However, while organisms in the regions currently characterized by low OA exposure could potentially have some time to adapt, that is not the case in the rapidly changing habitats (especially in the small inlets of the South Sound; Figure 9D), where the lack of available time for adaptation could impose the most detrimental ecological changes. This is an important distinction to consider when evaluating future habitat suitability.
Intense anthropogenic acidification is rapidly changing urban estuaries such as the Salish Sea, driving increased risk for pelagic calcifiers. Evans et al. (2019) quantitatively characterized future seasonal projections for the Salish Sea, finding that the process of acidification is predicted to non-linearly intensify in the future. In comparison, our study of future 2050 seasonal Ωar projections of habitat suitability in the Puget Sound shows that future suitable conditions are predominantly dependent on the vertical extent of habitat considered. The vertical averaging of 0–100 m renders substantially faster exponential declines with no suitable habitat available (Figure 10B) compared to only surface waters with some extent of suitable conditions (Evans et al., 2019).
Caveats and Strengths of Using Biological Thresholds
The application of thresholds in the biogeochemical model to deduce the attribution of anthropogenic stressors in the estuarine system is a simplified approach for predicting changes in OA exposure related to potential habitat of marine calcifiers. While it does not take complex variability in exposure regime or co-occurring multiple stressors into account, here we have used it to identify spatial and temporal anthropogenic OA hotspots in the ecosystem. Biological thresholds are further characterized by different levels of confidence scores, with the lowest confidence implying greater uncertainty in interpretations of the biological responses. Applying thresholds only over time periods when biological processes occur, however, ensures that temporal exposure below the threshold are correctly interpreted within the context of species life history. Furthermore, comparing the sensitivity of thresholds that were derived either from experimental or synthesis studies can yield different results and, thus, interpretation of different species risks and sensitivities.
The impact of anthropogenic stressors in the Salish Sea currently results in exposures that induce a variety of negative sublethal responses, such as mild dissolution and growth impairments, but those risks vary spatially and temporally. The greatest magnitude change in Ωar during the spring transition is associated with the time of spawning and most intense growth, implying a potential temporal mismatch between the early life stages and less favorable habitats. Furthermore, there are other sublethal thresholds that have been identified for pteropods, such as severe dissolution, and reduced calcification and reproductive efforts (Bednaršek et al., 2019). Given the similarity in the magnitude and duration of these thresholds, the current OA exposure regime, either seasonally or on annual basis, is below multiple thresholds. This means that current exposure can affect multiple pathways of physiological sensitivity and can cumulatively contribute to a greater impact than only predicted based on one pathway. It is difficult to extrapolate exposure to mortality thresholds on the population dynamics in the Salish Sea. Since the intensity of exposure associated with mortality thresholds is currently still very limited spatially, we can only infer that any potential population-level decline would be a result of prolonged impairments on the organismal level, with the trends outside the variability envelope taking significantly longer to be demonstrated.
Comparisons of different thresholds for various marine calcifiers and their life stages confirm similar magnitude of sublethal thresholds for various oysters and mussels, ranging from 1.4 to 1.8 (Gaylord et al., 2011; Barton et al., 2012). With respect to the larval lethal threshold at Ωar = 1.2 (Waldbusser et al., 2015), pteropod mortality threshold is less sensitive, thus providing a more conservative estimate of Ωar impacts. Nevertheless, since none of these studies provide a threshold duration, the risk estimates for these species cannot be assessed in a manner similar to this study, urging future experimental studies to derive all elements (magnitude and duration) needed for risk assessment.
Uncertainty of the Projections
Model projections of OA exposure below biologically relevant thresholds include uncertainty from several sources: model uncertainty (including parameter and structural uncertainty), scenario uncertainty, potential changes in hydrodynamics, and threshold uncertainty (Bednaršek et al., 2019). Scenario uncertainty is likely to be the most important factor for long-term projections (Hawkins and Sutton, 2009) beyond the 2060s. In addition, OA co-occurs with warming and deoxygenation in the Salish Sea (Reum et al., 2014), and these interactions are not captured in these predictions, but the fast warming rates predicted in the Salish Sea (Hamel et al., 2015) may additionally exacerbate already compromised biological responses imposed by OA exposure. The uncertainty of the predicted Ωar,cal, and pH from the Salish Sea model has been described using a variety of model skill metrics (Bianucci et al., 2018). Model skill estimates are based on the differences between predicted and observed conditions. By keeping hydrodynamics the same for all scenarios, we include the caveat that the differences between scenarios isolate the effects of only regional human nutrients and global anthropogenic CO2 while not taking future physical and hydrodynamics changes into account.
The sum of separately evaluated relative effects of anthropogenic CO2 and regional anthropogenic nutrient inputs as a percentage of the combined effects of CO2 and nutrients together does not necessarily equal 100%. This is partly because the effects were evaluated individually, and partly because these processes are not necessarily linear. In other words, the effect of added nutrient loading may differ depending on whether the effect of added CO2 is considered or not. The separate effects of nutrients and CO2 also may occur at different times. The effect of nutrients in some locations and seasons decreases the severity of adverse conditions, especially in the euphotic zone during the growing season, when added nutrients increase photosynthesis. In other locations and seasons, the effect of added nutrients increases the severity of adverse conditions, especially below the euphotic zone.
Validation Between the Observation and Synthesis Studies
Since this is the first study that evaluates the risks related to anthropogenic OA using biogeochemical scenarios, it is difficult to ascribe the significance of the study’s model outputs or compare it to any previous work. Evaluations should always be considered in comparative terms. In an effort to interpret observed increases related to the sublethal and lethal effects in the model, it is clear that we cannot evaluate the absolute numbers and conclude what this means for the organisms or populations, although the magnitude change of 0.16 to 0.12 Ωar unit appears large. The available experimental and field data can, however, be used to reflect and possibly validate the magnitude increases observed in the model outputs.
Comparisons with the food web model outputs and food web modeling conducted in the Salish Sea and the West Coast, respectively (Busch et al., 2013; Busch and McElhany, 2016; Marshall et al., 2017), delineate the most sensitive species, i.e., pteropods and Dungeness crabs. Furthermore, the experimental work by Busch et al. (2014) confirmed pteropod sensitivity to OA through increased shell dissolution and mortality. This finding has been recently confirmed in a field study by Bednaršek et al. (unpublished) that delineates spatial distribution of pteropod shell dissolution in the Salish Sea. The latter work locates the most severe exposure to be in the Hood Canal and Whidbey Island in the late summer, and to a minor extent in the inlets of the South Sound. Such spatial designation of OA hotspots aligns explicitly with the findings of this study despite using a completely different approach, i.e., applying shell dissolution thresholds in the biogeochemical model. Given that the sublethal threshold of mild dissolution is characterized by a high confidence score, the biological interpretation of the induced sublethal effects is more certain. The agreement between the field and biogeochemical approaches of spatial and temporal exposure inducing risk offers some validity to the SSM modeling.
Furthermore, the survival threshold derived from experimental studies on pteropods from the Salish Sea is below Ωar = 0.56 (Busch et al., 2014). Despite a difference between the experimentally derived threshold (Ωar = 0.56) and the one based on expert-based consensus (Ωar = 0.95) used in this study, our model outputs demonstrate that there are areas in the Salish Sea with the exposure to the lower, experimentally derived thresholds. As such, expert-based thresholds are much more sensitive in their value compared to experimental ones, with this approach being more precautionary than the experimentally derived thresholds when used to delineate areas of increased pteropod mortality. However, since the confidence score related to interpretation of the mortality threshold is low (Bednaršek et al., 2019), a more scrutinized and careful interpretation is warranted.
The sensitivity of larval Dungeness crabs relies on the estimates of internal dissolution, the extent of which is associated with increased energetic demand (Hans et al., 2014; Bednaršek et al., 2020). We identified the exposure inducive to increased internal dissolution to be spatially limited to the inlets and bays of the South Sound, where the risks are the greatest. Based on the data from Washington Department of Fish and Wildlife (Bosley, Katelyn; Washington Department of Fish and Wildlife, personal communication), the largest megalopae abundances correspond to stations P8, P28, and P4, where the carbonate chemistry conditions are most favorable, while some of the stations with the lowest recorded data are at the Hood Canal (station P402) and South Sound (P38), characterized by the lowest carbonate chemistry conditions. Importantly, time series from the same area identify Dungeness crab population declines over the last years, illustrating some parallels between the model outputs and field observations. Although the drivers behind the population decline in the South Sound have not been identified yet, we emphasize anthropogenic OA must be taken into account. Field data for Dungeness crab internal dissolution are limited to the Pacific Northwest coast (Bednaršek et al., 2020) and are not specific to the Salish Sea. As such, direct comparison of the results related to the spatial or temporal exposure is not feasible. Nevertheless, the greatest extent of internal dissolution is found at the lowest Ωcal (Bednaršek et al., 2020), which is also observed in the biogeochemical model outputs. Despite the absence of additional sensitivity tools (e.g., thresholds) in the model, our approach still validates the use of the sensitivity equation in the SSM to identify the spatially relevant exposures associated with increased risks for larval Dungeness crab.
In conclusion, these observations, experimental results, and model output largely confirm the validity of the use of thresholds to detect risks of anthropogenic OA exposures inducive of sublethal and lethal responses. As a result, we propose that thresholds be used to detect changes in exposure in comparison with pre-industrial times, which is something that cannot be achieved using the results of the meta-analyses, experimental, or synthesis work that are based on future conditions. In addition, thresholds’ applicability can resolve the changes in the magnitude and duration of exposure attributable to specific anthropogenic stressors. This can ultimately provide new research venues to translate threshold species-specific model outputs to habitat suitability modeling efforts.
Implications for Management
Overall, our results provide a set of scenarios that set the stage to evaluate current biological risks related to anthropogenic OA in the estuarine habitats of the Salish Sea for ecologically and economically important species. We demonstrate that atmospheric CO2 emissions are a major driver behind the modeled changes and responses, the reduction of which can help sustain biological species vital for ecosystem functions and society. In contrast, nutrient-driven eutrophication plays only a marginal role over spatially and temporally limited scales. Our results provide an initial step toward the development of management actions related to OA in the Salish Sea that focus on mitigation strategies to reduce atmospheric CO2 emissions. However, in the absence of regional and locally supported actions for lowering CO2, other resilient strategies that buffer against OA, such as kelp and seaweed farming, may be effective on a local or regional scale.
Data Availability Statement
The the NetCDF model outputs supporting the conclusions of this article will be made available by the authors, without undue reservation, to any qualified researcher.
Author Contributions
NB, GP, and RF conceptualized the research and design of the study. NB wrote the proposal and obtained the funding for this work through the SeaDoc Society, provided biological interpretation, and wrote the first draft of the manuscript. GP and AA conducted the modeling work. GP performed the statistical analyses. RF contributed with the observation-model comparisons. All authors contributed to manuscript revisions, read and approved the submitted version.
Funding
This project (#201702053-02) was supported by the SeaDoc Society through the Wildlife Health Center, School of Veterinary Medicine, University of California, Davis. RF was supported by the Pacific Marine Environmental Laboratory and the NOAA Ocean Acidification Program Contribution number 5095 from the NOAA Pacific Marine Environmental Laboratory. The Salish Sea Model used in this project is supported by the modeling teams at the Pacific Northwest National Laboratory (PNNL) and the Washington State Department of Ecology (DOE), including Tarang Khangaonkar (PNNL), Cristiana Figueroa-Kaminsky (DOE), Teizeen Mohamedali (DOE), Sheelagh McCarthy (DOE), and John Gala (DOE), and funding from the United States Environmental Protection Agency.
Conflict of Interest
The authors declare that the research was conducted in the absence of any commercial or financial relationships that could be construed as a potential conflict of interest.
Acknowledgments
The Salish Sea Model used in this project is supported by the modeling teams at the Pacific Northwest National Laboratory (PNNL) and the Washington State Department of Ecology (DOE), including Tarang Khangaonkar (PNNL), Cristiana Figueroa-Kaminsky (DOE), Teizeen Mohamedali (DOE), Sheelagh McCarthy (DOE), and John Gala (DOE). In memoriam T. Bednaršek.
References
Alin, S., Newton, J. A., Curry, B., Greeley, D. J., and Lebrec, M. (2018). “A decade-long biogeochemical cruise time-series from the Salish Sea and Washington coast: regional connections to large-scale ocean climate drivers of ocean acidification and hypoxia,” in Proceedings of the Presentation, Salish Sea Ecosystem Conference, Washington, May 4, 2018 Washington, DC.
Aydin, K. Y., McFarlane, G. A., King, J. R., Megrey, B. A., and Myers, K. W. (2005). Linking oceanic food webs to coastal production and growth rates of Pacific salmon (Oncorhynchus spp.), using models on three scales. Deep Sea Res. Part II 52, 757–780. doi: 10.1016/j.dsr2.2004.12.017
Barange, M., Merino, G., Blanchard, J. L., Scholtens, J., Harle, J., Allison, E. H., et al. (2014). Impacts of climate change on marine ecosystem production in societies dependent on fisheries. Nat. Clim. Change 4, 211–216. doi: 10.1038/nclimate2119
Barton, A., Hales, B., Waldbusser, G. G., Langdon, C., and Feely, R. A. (2012). The Pacific oyster, Crassostrea gigas, shows negative correlation to naturally elevated carbon dioxide levels: implications for near-term ocean acidification effects. Limnol. Oceanogr. 57, 698–710. doi: 10.4319/lo.2012.57.3.0698
Barton, A., Waldbusser, G. G., Feely, R. A., Weisberg, S. B., Newton, J. A., Hales, B., et al. (2015). Impacts of coastal acidification on the Pacific Northwest shellfish industry and adaptation strategies implemented in response. Oceanography 28, 146–159. doi: 10.5670/oceanog.2015.38
Baumann, H., Talmage, S. C., and Gobler, C. J. (2012). Reduced early life growth and survival in a fish in direct response to increased carbon dioxide. Nat. Clim. Change 2, 38–41. doi: 10.1038/nclimate1291
Bednaršek, N., Feely, R. A., Beck, M. W., Alin, S. R., Siedlecki, S. A., Calosi, P., et al. (2020). Exoskeleton dissolution with mechanoreceptor damage in larval Dungeness crab related to severity of present-day ocean acidification vertical gradients. Sci. Total Environ. 716:136610. doi: 10.1016/j.scitotenv.2020.136610
Bednaršek, N., Feely, R. A., Beck, M. W., Glippa, O., Kanerva, M., and Engström-Öst, J. (2018). El Niño-related thermal stress coupled with upwelling-related ocean acidification negatively impacts cellular to population-level responses in pteropods along the California Current System with implications for increased bioenergetic costs. Front. Mar. Sci. 4:486. doi: 10.3389/fmars.2018.00486
Bednaršek, N., Feely, R. A., Howes, E. L., Hunt, B., Kessouri, F., León, P., et al. (2019). Systematic review and meta-analysis towards synthesis of thresholds of ocean acidification impacts on calcifying pteropods and interactions with warming. Front. Mar. Sci. 6:227. doi: 10.3389/fmars.2019.00227
Bednaršek, N., Feely, R. A., Reum, J. C. P., Peterson, B., Menkel, J., Alin, S. R., et al. (2014). Limacina helicina shell dissolution as an indicator of declining habitat suitability owing to ocean acidification in the California Current Ecosystem. Proc. Biol. Sci. 281:20140123. doi: 10.1098/rspb.2014.0123
Bednaršek, N., Feely, R. A., Tolimieri, N., Hermann, A. J., Siedlecki, S. A., Waldbusser, G. G., et al. (2017a). Exposure history determines pteropod vulnerability to ocean acidification along the US West Coast. Sci. Rep. 7:4526. doi: 10.1038/s41598-017-03934-z
Bednaršek, N., Harvey, C. J., Kaplan, I. C., Feely, R. A., and Možina, J. (2016). Pteropods on the edge: cumulative effects of ocean acidification, warming, and deoxygenation. Prog. Oceanogr. 145, 1–24. doi: 10.1016/j.pocean.2016.04.002
Bednaršek, N., Klinger, T., Harvey, C. J., Weisberg, S., McCabe, R. M., Feely, R. A., et al. (2017b). New ocean, new needs: application of pteropod shell dissolution as a biological indicator for marine resource management. Ecol. Indic. 76, 240–244. doi: 10.1016/j.ecolind.2017.01.025
Beesley, A., Lowe, D. M., Pascoe, C. K., and Widdicombe, S. (2008). Effects of CO2-induced seawater acidification on the health of Mytilus edulis. Clim. Res. 37, 215–225. doi: 10.3354/cr00765
Bianucci, L., Long, W., Khangaonkar, T., Pelletier, G., Ahmed, A., Mohamedali, T., et al. (2018). Sensitivity of the regional ocean acidification and the carbonate system in Salish Sea to ocean and freshwater inputs. Ele. Sci. Anth. 6:22. doi: 10.1525/elementa.151
Busch, D. S., Harvey, C. J., and McElhany, P. (2013). Potential impacts of ocean acidifcation on the Puget Sound food web. ICES J. Mar. Sci. 70, 823–833. doi: 10.1093/icesjms/fst061
Busch, D. S., Maher, M., Thibodeau, P., and McElhany, P. (2014). Shell condition and survival of Puget Sound pteropods are impaired by ocean acidification conditions. PLoS One 9:e105884. doi: 10.1371/journal.pone.0105884
Busch, D. S., and McElhany, P. (2016). Estimates of the direct effect of seawater pH on the survival rate of species groups in the California current ecosystem. PLoS One 11:e0160669. doi: 10.1371/journal.pone.0160669
Cai, W.-J., Hu, X., Huang, W.-J., Murrell, M. C., Lehrter, J. C., Lohrenz, S. E., et al. (2011). Acidification of subsurface coastal waters enhanced by eutrophication. Nat. Geosci. 4, 766–770. doi: 10.1038/ngeo1297
Cerco, C. F., and Cole, T. (1993). Three-dimensional eutrophication model of Chesapeake Bay. J. Environ. Eng. 119, 1006–1025. doi: 10.1061/(ASCE)0733-93721993119:61006
Cerco, C. F., and Cole, T. M. (1994). Three-Dimensional Eutrophication Model of Chesapeake Bay. Vicksburg, MS: U.S. Army Corps of Engineers.
Chan, F., Barth, J. A., Blanchette, C. A., Byrne, R. H., Chavez, F. P., Cheriton, O., et al. (2017). Persistent spatial structuring of coastal ocean acidification in the California current system. Sci. Rep. 7:2526. doi: 10.1038/s41598-41017-02777-y
Chavez, F. P., Pennington, J. T., Michisaki, R. P., Blum, M., Chavez, G. M., Friederich, J., et al. (2017). Climate variability and change: response of a coastal ocean ecosystem. Oceanography 30, 128–145. doi: 10.5670/oceanog.2017.429
Chen, C., Liu, H., and Beardsley, R. C. (2003). An unstructured grid, finite-volume, three-dimensional, primitive equations ocean model: application to coastal ocean and estuaries. J. Atmos. Ocean Technol. 20, 159–186.
Engström-Öst, J., Glippa, O., Feely, R. A., Kanerva, M., Keister, J. E., Alin, S. R., et al. (2019). Eco-physiological responses of copepods and pteropods to ocean warming and acidification. Sci. Rep. 9:4748. doi: 10.1038/s41598-019-41213-1
Evans, W., Pocock, K., Hare, A., Weekes, C., Hales, B., Jackson, J., et al. (2019). Marine CO2 patterns in the Northern Salish Sea. Front. Mar. Sci. 5:536. doi: 10.3389/fmars.2018.00536
Fassbender, A. J., Alin, S. R., Feely, R. A., Sutton, A. J., Newton, J. A., Krembs, C., et al. (2018). Seasonal carbonate chemistry variability in marine surface waters of the Pacific Northwest. Earth Syst. Sci. Data 10, 1367–1401. doi: 10.5194/essd-10-1367-2018
Feely, R. A., Alin, S. R., Carter, B., Bednaršek, N., Hales, B., Chan, F., et al. (2016). Chemical and biological impacts of ocean acidification along the west coast of North America. Estuar. Coast. Shelf Sci. 183, 260–270. doi: 10.1016/j.ecss.2016.08.043
Feely, R. A., Alin, S. R., Newton, J., Sabine, C. L., Warner, M., Devol, A., et al. (2010). The combined effects of ocean acidification, mixing, and respiration on pH and carbonate saturation in an urbanized estuary. Estuar. Coast Shelf Sci. 88, 442–449. doi: 10.1016/j.ecss.2010.05.004
Feely, R. A., Klinger, T., Newton, J., and Chadsey, M. (2012). Scientific Summary of Ocean Acidification in Washington State Marine Waters. NOAA ORR Special Report. Lacey, WA: Washington State Department of Ecology.
Feely, R. A., Okazaki, R. R., Cai, W. J., Bednaršek, N., Alin, S. R., Byrne, R. H., et al. (2018). The combined effects of acidification and hypoxia on pH and aragonite saturation in the coastal waters of the California current ecosystem and the northern Gulf of Mexico. Cont. Shelf Res. 152, 50–60. doi: 10.1016/j.csr.2017.11.002
Feely, R. A., Sabine, C. L., Hernandez-Ayon, J. M., Ianson, D., and Hales, B. (2008). Evidence for upwelling of corrosive “acidified” water onto the Continental Shelf. Science 320, 1490–1492. doi: 10.1126/science.1155676
Gattuso, J. P., Magnan, A., Billé, R., Cheung, W. W. L., Howes, E. L., Joos, F., et al. (2015). Contrasting futures for ocean and society from different anthropogenic CO2 emissions scenarios. Science 349:aac4722. doi: 10.1126/science.aac4722
Gaylord, B., Hill, T. M., Sanford, E., Lenz, E. A., Jacobs, L. A., Sato, K. N., et al. (2011). Functional impacts of ocean acidification in an ecologically critical foundation species. J. Exp. Bio. 214, 2586–2594. doi: 10.1242/jeb.055939
Giltz, S. M., and Taylor, C. M. (2017). Reduced growth and survival in the larval blue crab callinectes sapidus under predicted ocean acidification. J. Shellfish Res. 36, 481–485. doi: 10.2983/035.036.0219
Gruber, N., Hauri, C., Lachkar, Z., Loher, D., Frölicher, T. L., and Plattner, G. K. (2012). Rapid progression of ocean acidification in the California current system. Science 337, 220–223. doi: 10.1126/science.1216773
Hales, B., Suhrbier, A., Waldbusser, G. G., Feely, R. A., and Newton, J. A. (2017). The carbonate chemistry of the “fattening line,” Willapa Bay, 2011–2014. Estuaries Coasts 40, 173–186. doi: 10.1007/s12237-016-0136-7
Hamel, N. J., Joyce, J., Fohn, M., James, A., Toft, J., Lawver, A., et al. (2015). State of the Sound: Report on the Puget Sound Vital Signs. November 2015. Available online at: www.psp.wa.gov/sos (accessed August 20, 2019).
Hans, S., Fehsenfeld, S., Treberg, J. R., and Weihrauch, D. (2014). Acid–base regulation in the Dungeness crab (Metacarcinus magister). Mar. Biol. 161, 1179–1193. doi: 10.1007/s00227-014-2409-7
Hauri, C., Gruber, N., McDonnell, A. M. P., and Vogt, M. (2013). The intensity, duration, and severity of low aragonite saturation state events on the California continental shelf. Geophys. Res. Lett. 40, 3424–3428. doi: 10.1002/grl.50618
Hawkins, E., and Sutton, R. (2009). The potential to narrow uncertainty in regional climate predictions. B. Am. Meteorol. Soc. 90, 1095–1108. doi: 10.1175/2009BAMS2607.1
Jamieson, G. S., and Phillips, A. (1993). Megalopal spatial distribution and stock separation in Dungeness crab (Cancer magister). Can. J. Fish Aquat. Sci. 50, 416–429. doi: 10.1139/f93-047
Kapsenberg, L., Miglioli, A., Bitter, M. C., Tambutté, E., Dumollard, R., and Gattuso, J.-T. (2018). Ocean pH fluctuations affect mussel larvae at key developmental transitions. Proc. R. Soc. B. 285:20182381. doi: 10.1098/rspb.2018.2381
Khangaonkar, T., Sackmann, B., Long, W., Mohamedali, T., and Roberts, M. (2012). Simulation of annual biogeochemical cycles of nutrient balance, phytoplankton bloom(s), and DO in Salish Sea using an unstructured grid model. Ocean Dyn. 62, 1353–1379. doi: 10.1007/s10236-012-0562-4
Khangaonkar, T., Yang, Z., Kim, T., and Roberts, M. (2011). Tidally averaged circulation in Salish Sea sub-basins: comparison of historical data, analytical model, and numerical model. Estuar. Coast Shelf Sci. 93, 305–319. doi: 10.1016/j.ecss.2011.04.016
Kim, T., and Khangaonkar, T. (2012). An offline unstructured biogeochemical model (UBM) for complex estuarine and coastal environments. Environ. Modell. Softw. 31, 47–63. doi: 10.1016/j.envsoft.2011.11.010
Kroeker, K. J., Kordas, R. L., Crim, R., Hendriks, I. E., Ramajo, L., Singh, G. S., et al. (2013). Impacts of ocean acidification on marine organisms: quantifying sensitivities and interaction with warming. Glob. Change Biol. 19, 1884–1896. doi: 10.1111/gcb.12179
Laruelle, G. G., Cai, W.-J., Hu, X., Gruber, N., Mackenzie, F. T., and Regnier, P. (2018). Continental shelves as a variable but increasing global sink for atmospheric carbon dioxide. Nat. Commun. 9:454. doi: 10.1038/s41467-017-02738-z
Lewis, E., and Wallace, D. (1998). Program Developed for CO2 System Calculations. ORNL/CIAC-105. Oak Ridge, TN: Oak Ridge National Laboratory, US Department of Energy.
Lischka, S., Büdenbender, J., Boxhammer, T., and Riebesell, U. (2011). Impact of ocean acidification and elevated temperatures on early juveniles of the polar shelled pteropod Limacina helicina: mortality, shell degradation, and shell growth. Biogeosciences 8, 919–932. doi: 10.5194/bg-8-919-2011
Lischka, S., and Riebesell, U. (2012). Synergistic effects of ocean acidification and warming on overwintering pteropods in the Arctic. Glob. Change Biol. 18, 3517–3528. doi: 10.1111/gcb.12020
Marshall, K. N., Kaplan, I. C., Hodgson, E. E., Hermann, A., Busch, D. S., McElhany, P., et al. (2017). Risks of ocean acidification in the California current food web and fisheries: ecosystem model projections. Glob. Chang. Biol. 23, 1525–1539. doi: 10.1111/gcb.13594
Mastrandrea, M. D., Field, C. B., Stocker, T. F., Edenhofer, O., Ebi, K. L., Frame, D. J., et al. (2010). Guidance Note for Lead Authors of the IPCC Fifth Assessment Report on Consistent Treatment of Uncertainties. Intergovernment Panel Climate Change. Available online at: http://www.ipcc.ch (accessed May, 2018).
McLaskey, A. K., Keister, J. E., McElhany, P., Brady Olson, M., Shallin Busch, D., Maher, M., et al. (2016). Development of Euphausia pacifica (krill) larvae is impaired under pCO2 levels currently observed in the Northeast Pacific. Mar. Ecol. Prog. Ser. 555, 65–78. doi: 10.3354/meps11839
Michaelidis, B., Ouzounis, C., Paleras, A., and Pörtner, H. O. (2005). Effects of long-term moderate hypercapnia on acid–base balance and growth rate in marine mussels Mytilus galloprovincialis. Mar. Ecol. Prog. Ser. 293, 109–118. doi: 10.3354/meps293109
Miller, J. J., Maher, M., Bohaboy, E., Friedman, C. S., and McElhany, P. (2016). Exposure to low pH reduces survival and delays development in early life stages of Dungeness crab (Cancer magister). Mar. Biol. 163:118. doi: 10.1007/s00227-016-2883-1
Mohamedali, T., Roberts, M., Sackmann, B., and Kolosseus, A. (2011). Puget Sound Dissolved Oxygen Model Nutrient Load Summary for 1999-2008. Olympia, WA: Washington Department of Ecology.
O’Neill, B. B., Oppenheimer, M., Warren, R., Hallegatte, S., Kopp, R. E., Pörtner, H. O., et al. (2017). IPCC reasons fro concern regarding climate change risks. Nat. Clim. Change 7, 28–37. doi: 10.1038/nclimate3179
Osborne, E. B., Thunell, R. C., Gruber, N., Feely, R. A., and Benitez-Nelson, C. R. (2020). Decadal variability in twentieth-century ocean acidification in the California current ecosystem. Nat. Geosci. 13, 43–49. doi: 10.1038/s41561-019-0499-z
Osborne, E. B., Thunell, R. C., Marshall, B. J., Holm, J. A., Tappa, E. J., Benitez-Nelson, C., et al. (2016). Calcification of the planktonic foraminifera Globigerina bulloides and carbonate ion concentration: results from the Santa Barbara basin. Paleoceanography 31, 1083–1102. doi: 10.1002/2016pa002933
Pelletier, G., Bianucci, L., Long, W., Khangaonkar, T., Mohamedali, T., Ahmed, A., et al. (2017). Salish Sea Model Ocean Acidification Module and the Response to Regional Anthropogenic Nutrient Sources. Salish Sea Model Sediment Diagenesis Module. Olympia, WA: Washington State Department of Ecology.
Pelletier, G., Roberts, M., Keyzers, M., and Alin, S. R. (2018). Seasonal variation in aragonite saturation in surface waters of Puget sound — a pilot study. Elementa Sci. Anthrop. 6:5. doi: 10.1525/elementa.270
PSEMP Marine Waters Workgroup (2016). Puget Sound Marine Waters: 2015 Overview, eds S. K. Moore, R. Wold, K. Stark, J. Bos, P. Williams, K. Dzinbal, et al. Available online at: www.psp.wa.gov/PSEMP/PSmarinewatersoverview.php (accessed April, 2019).
Reum, J. C., Alin, S. R., Feely, R. A., Newton, J., Warner, M., and McElhany, P. (2014). Seasonal carbonate chemistry covariation with temperature, oxygen, and salinity in a fjord estuary: implications for the design of ocean acidification experiments. PLoS One 9:e89619. doi: 10.1371/journal.pone.0089619
Stow, C. A., Jolliff, J., McGillicuddy, D. J., Doney, S. C., Allen, J. I., Friedrichs, M. A., et al. (2009). Skill assessment for coupled biological/physical models of marine systems. J. Mar. Syst. 76, 4–15. doi: 10.1016/j.jmarsys.2008.03.011
Sunda, W. G., and Cai, W. J. (2012). Eutrophication induced CO2-acidification of subsurface coastal waters: interactive effects of temperature, salinity, and atmospheric pCO2. Environ. Sci. Technol. 46, 10651–10659. doi: 10.1021/es300626f
Sutton, A. J., Feely, R. A., Maenner-Jones, S., Musielewicz, S., Osborne, J., Dietrich, C., et al. (2019). Autonomous seawater pCO2 and pH time series from 40 surface buoys and the emergence of anthropogenic trends. Earth Syst. Sci. Data 11, 421–439. doi: 10.5194/essd-11-421-2019
Takahashi, T., Sutherland, S. C., Wanninkhof, R., Sweeney, C., Feely, R. A., Chipman, D. W., et al. (2009). Climatological mean and decadal change in surface ocean pCO2, and net sea-air CO2 flux over the global oceans. Deep Sea Res. Part II Top. Stud. Oceanogr. 56, 554–577. doi: 10.1016/j.dsr2.2008.12.009
Turi, G., Lachkar, Z., Gruber, N., and Münnich, M. (2016). Climate modulation of recent trends in ocean acidification in the California current system. Environ. Res. Lett. 11:014007. doi: 10.1088/1748-9326/11/1/014007
Waldbusser, G. G., Hales, B., Langdon, C. J., Haley, B. A., Schrader, P., Brunner, E. L., et al. (2015). Saturation-state sensitivity of marine bivalve larvae to ocean acidification. Nat. Clim. Chang. 5, 273–280. doi: 10.1038/nclimate2479
Wallace, R. B., Baumann, H., Grear, J. S., Aller, R. C., and Gobler, C. J. (2014). Coastal ocean acidification: the other eutrophication problem. Estuar. Coast. Shelf Sci. 148, 1–13. doi: 10.1016/j.ecss.2014.05.027
Wang, Y., Hu, M., Wu, F., Storch, D., and Pörtner, H. O. (2018). Elevated pCO2 affects feeding behavior and acute physiological response of the Brown Crab Cancer pagurus. Front. Physiol. 9:1164. doi: 10.3389/fphys.2018.01164
Williams, C. R., Dittman, A. H., McElhany, P., Busch, D. S., Maher, M. T., Bammler, T. K., et al. (2019). Elevated CO2 impairs olfactory-mediated neural and behavioral responses and gene expression in ocean-phase coho salmon (Oncorhynchus kisutch). Glob. Change Biol. 25, 963–977. doi: 10.1111/gcb.14532
Keywords: ocean acidification, threshold, attribution analyses, anthropogenic stressors, nutrient remineralization, Dungeness crab, pteropods, biogeochemical projections
Citation: Bednaršek N, Pelletier G, Ahmed A and Feely RA (2020) Chemical Exposure Due to Anthropogenic Ocean Acidification Increases Risks for Estuarine Calcifiers in the Salish Sea: Biogeochemical Model Scenarios. Front. Mar. Sci. 7:580. doi: 10.3389/fmars.2020.00580
Received: 06 April 2020; Accepted: 23 June 2020;
Published: 10 July 2020.
Edited by:
Sara Rivero-Calle, University of North Carolina Wilmington, United StatesReviewed by:
Kristen Marie Krumhardt, National Center for Atmospheric Research (NCAR), United StatesXiao Liu, NCEP Environmental Modeling Center (EMC), United States
Copyright © 2020 Bednaršek, Pelletier, Ahmed and Feely. This is an open-access article distributed under the terms of the Creative Commons Attribution License (CC BY). The use, distribution or reproduction in other forums is permitted, provided the original author(s) and the copyright owner(s) are credited and that the original publication in this journal is cited, in accordance with accepted academic practice. No use, distribution or reproduction is permitted which does not comply with these terms.
*Correspondence: Nina Bednaršek, bmluYWJAc2Njd3JwLm9yZw==; bmluYS5iZWRuYXJzZWtAZ21haWwuY29t