 Peilong Ju
 Yongjun Tian
 Mingru Chen4,5,6*
 Yang Liu
- 1Laboratory of Fisheries Oceanography, Fisheries College, Ocean University of China, Qingdao, China
- 2Institute for Advanced Ocean Study, Ocean University of China, Qingdao, China
- 3Laboratory for Marine Fisheries Science and Food Production Processes, Pilot National Laboratory for Marine Science and Technology, Qingdao, China
- 4State Key Laboratory of Marine Environmental Science, College of Ocean and Earth Sciences, Xiamen University, Xiamen, China
- 5Xiamen City Key Laboratory of Urban Sea Ecological Conservation and Restoration, Xiamen University, Xiamen, China
- 6China-ASEAN College of Marine Sciences, Xiamen University Malaysia, Sepang, Malaysia
The waters around Taiwan are impacted by the Kuroshio and coastal currents, resulting in a high productivity and a high diversity of marine life. As a consequence, there are a multitude of fisheries around Taiwan, conducted by a fleet that has grown enormously in the last four decades. Here, we investigate the effect of the resulting fishing pressure on 16 commercial fish stocks including demersal and pelagic species in the coastal and offshore waters of Taiwan using the Monte Carlo Catch-Maximum Sustainable Yield (CMSY) and Bayesian Schaefer Model (BSM) methods. Both of these methods required principally catch time series, with the BSM methods also requiring catch-per-unit-of-effort data. The results show that of the 16 assessed stocks, 10 stocks have collapsed, 2 are severely overfished, 2 are overfished, 1 is slightly overfished, and only 1 stock remains in a healthy status; these troubling results are attributed to excessive fishing pressure. However, climate-driven environmental variability may be another factor affecting the fishery resources around Taiwan, as evidenced by chub mackerel Scomber japonicus, the one stock deemed healthy, which is here attributed to favorable environmental condition. Using the fisheries reference points provided here, rebuilding plans could be provided for the other 15 species; however, such plans are not likely to be successful without reducing the size of the Taiwanese fishing fleet.
Introduction
Fisheries are not only an important food source for humans, but also provide livelihood for local communities (Rice and Garcia, 2011; Liao et al., 2019). However, one-third of globally assessed stocks are overfished (FAO, 2018), while in Asia, almost half of the exploited stocks are overexploited or have collapsed (Lam and Pauly, 2019). By this measure, it can be suggested that the unsustainable exploitation of stocks in Asia is more serious.
The waters around Taiwan are very productive and support of high biodiversity (Hobday and Pecl, 2014), notably due to the combined effects of the Kuroshio Current, the South China Sea Warm Current, and the China Coastal Current (Ho et al., 2016; Ju et al., 2019; Liao et al., 2019; Figure 1), and this is reflected in nearly 2,600 species of fish and 500 species of crustaceans being reported from Taiwan’s waters (Ji et al., 2014; see also www.fishbase.org and www.sealifebase.org).
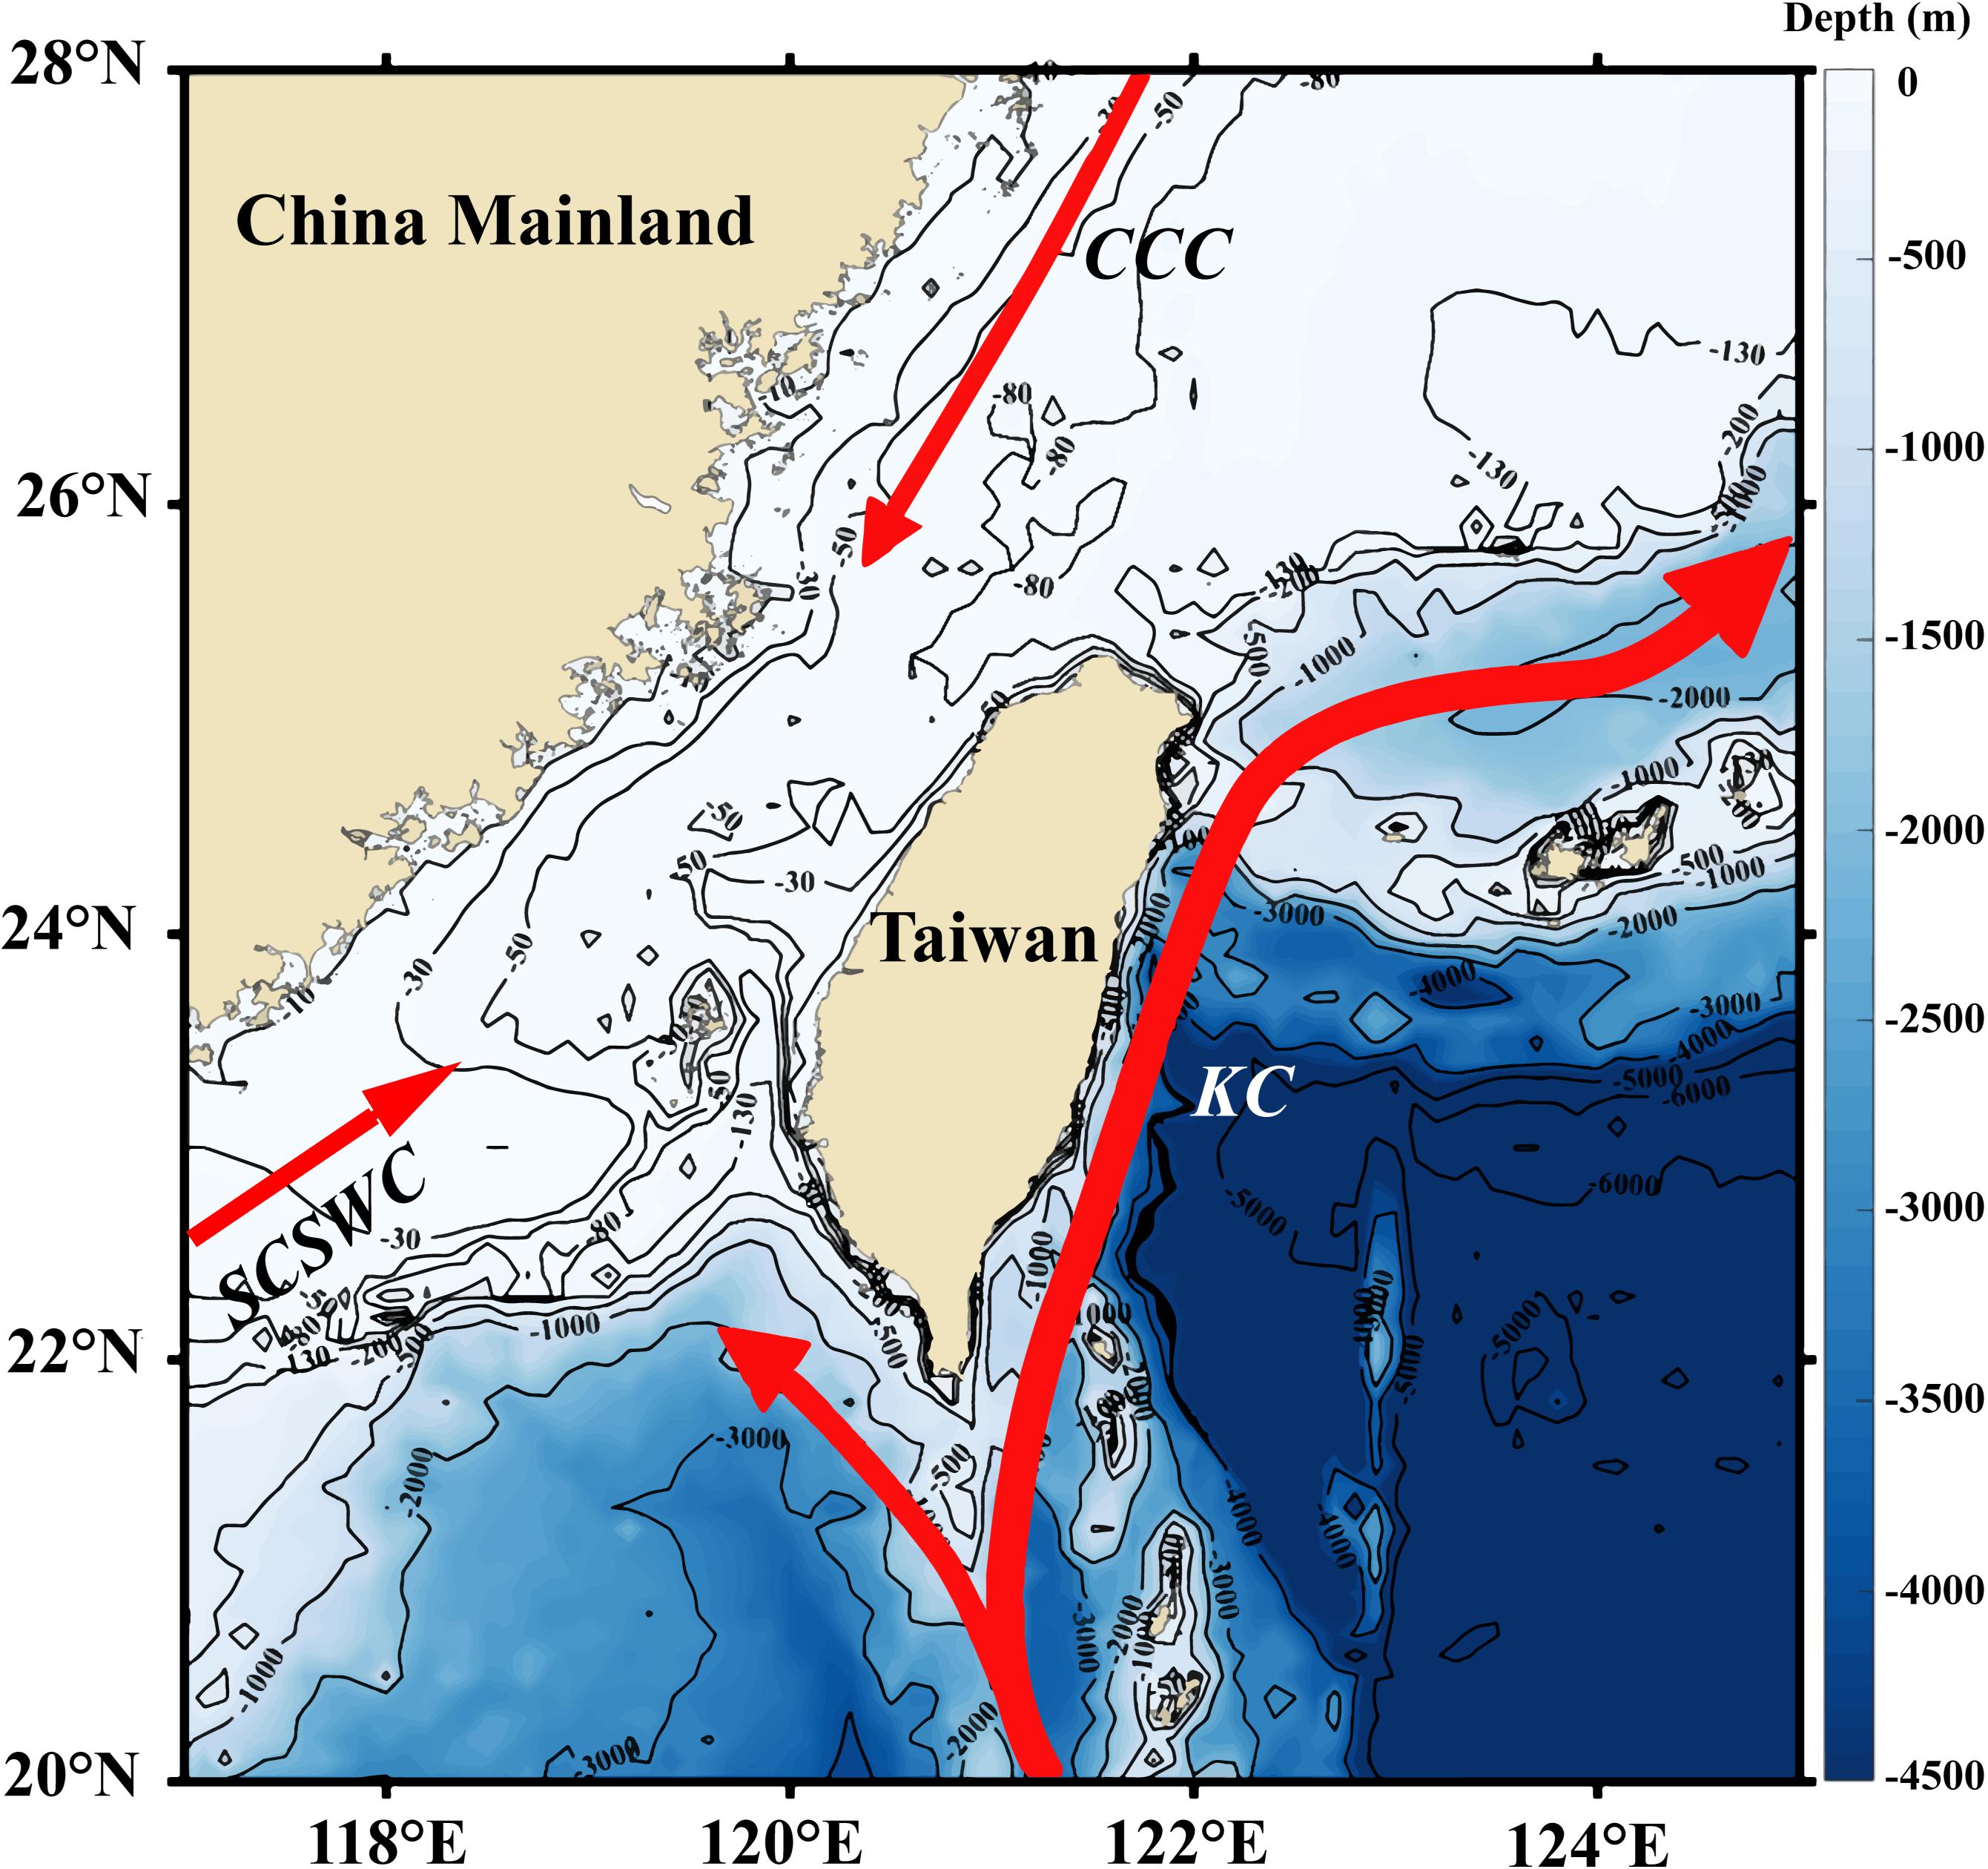
Figure 1. Map of the coastal and offshore waters of Taiwan. CCC, China Coastal Current; SCSWC, South China Sea Warm Current; KC, Kuroshio Current.
Correspondingly, a wide variety of fishing gears are used to exploit this biodiversity, notably purse seines, bottom and pelagic trawls, longlines, gill and set nets, and so on (Fisheries Agency, 1949–2019). However, because of overexploitation (Chen et al., 2018; Liao et al., 2019), fisheries catches, after a long period of increase since the 1950s, peaked in 1980 and then gradually decreased (Figure 2). While the status of coastal and offshore fisheries in Taiwan waters is widely perceived as being highly problematic (Liu, 2013; Liao et al., 2019), only a few of the fish stocks have been assessed (Chen, 2006; Shao, 2011). This contribution assesses 16 of the coastal and offshore exploited fish stocks in the waters around Taiwan, such as to provide reference points for the management of their fisheries.
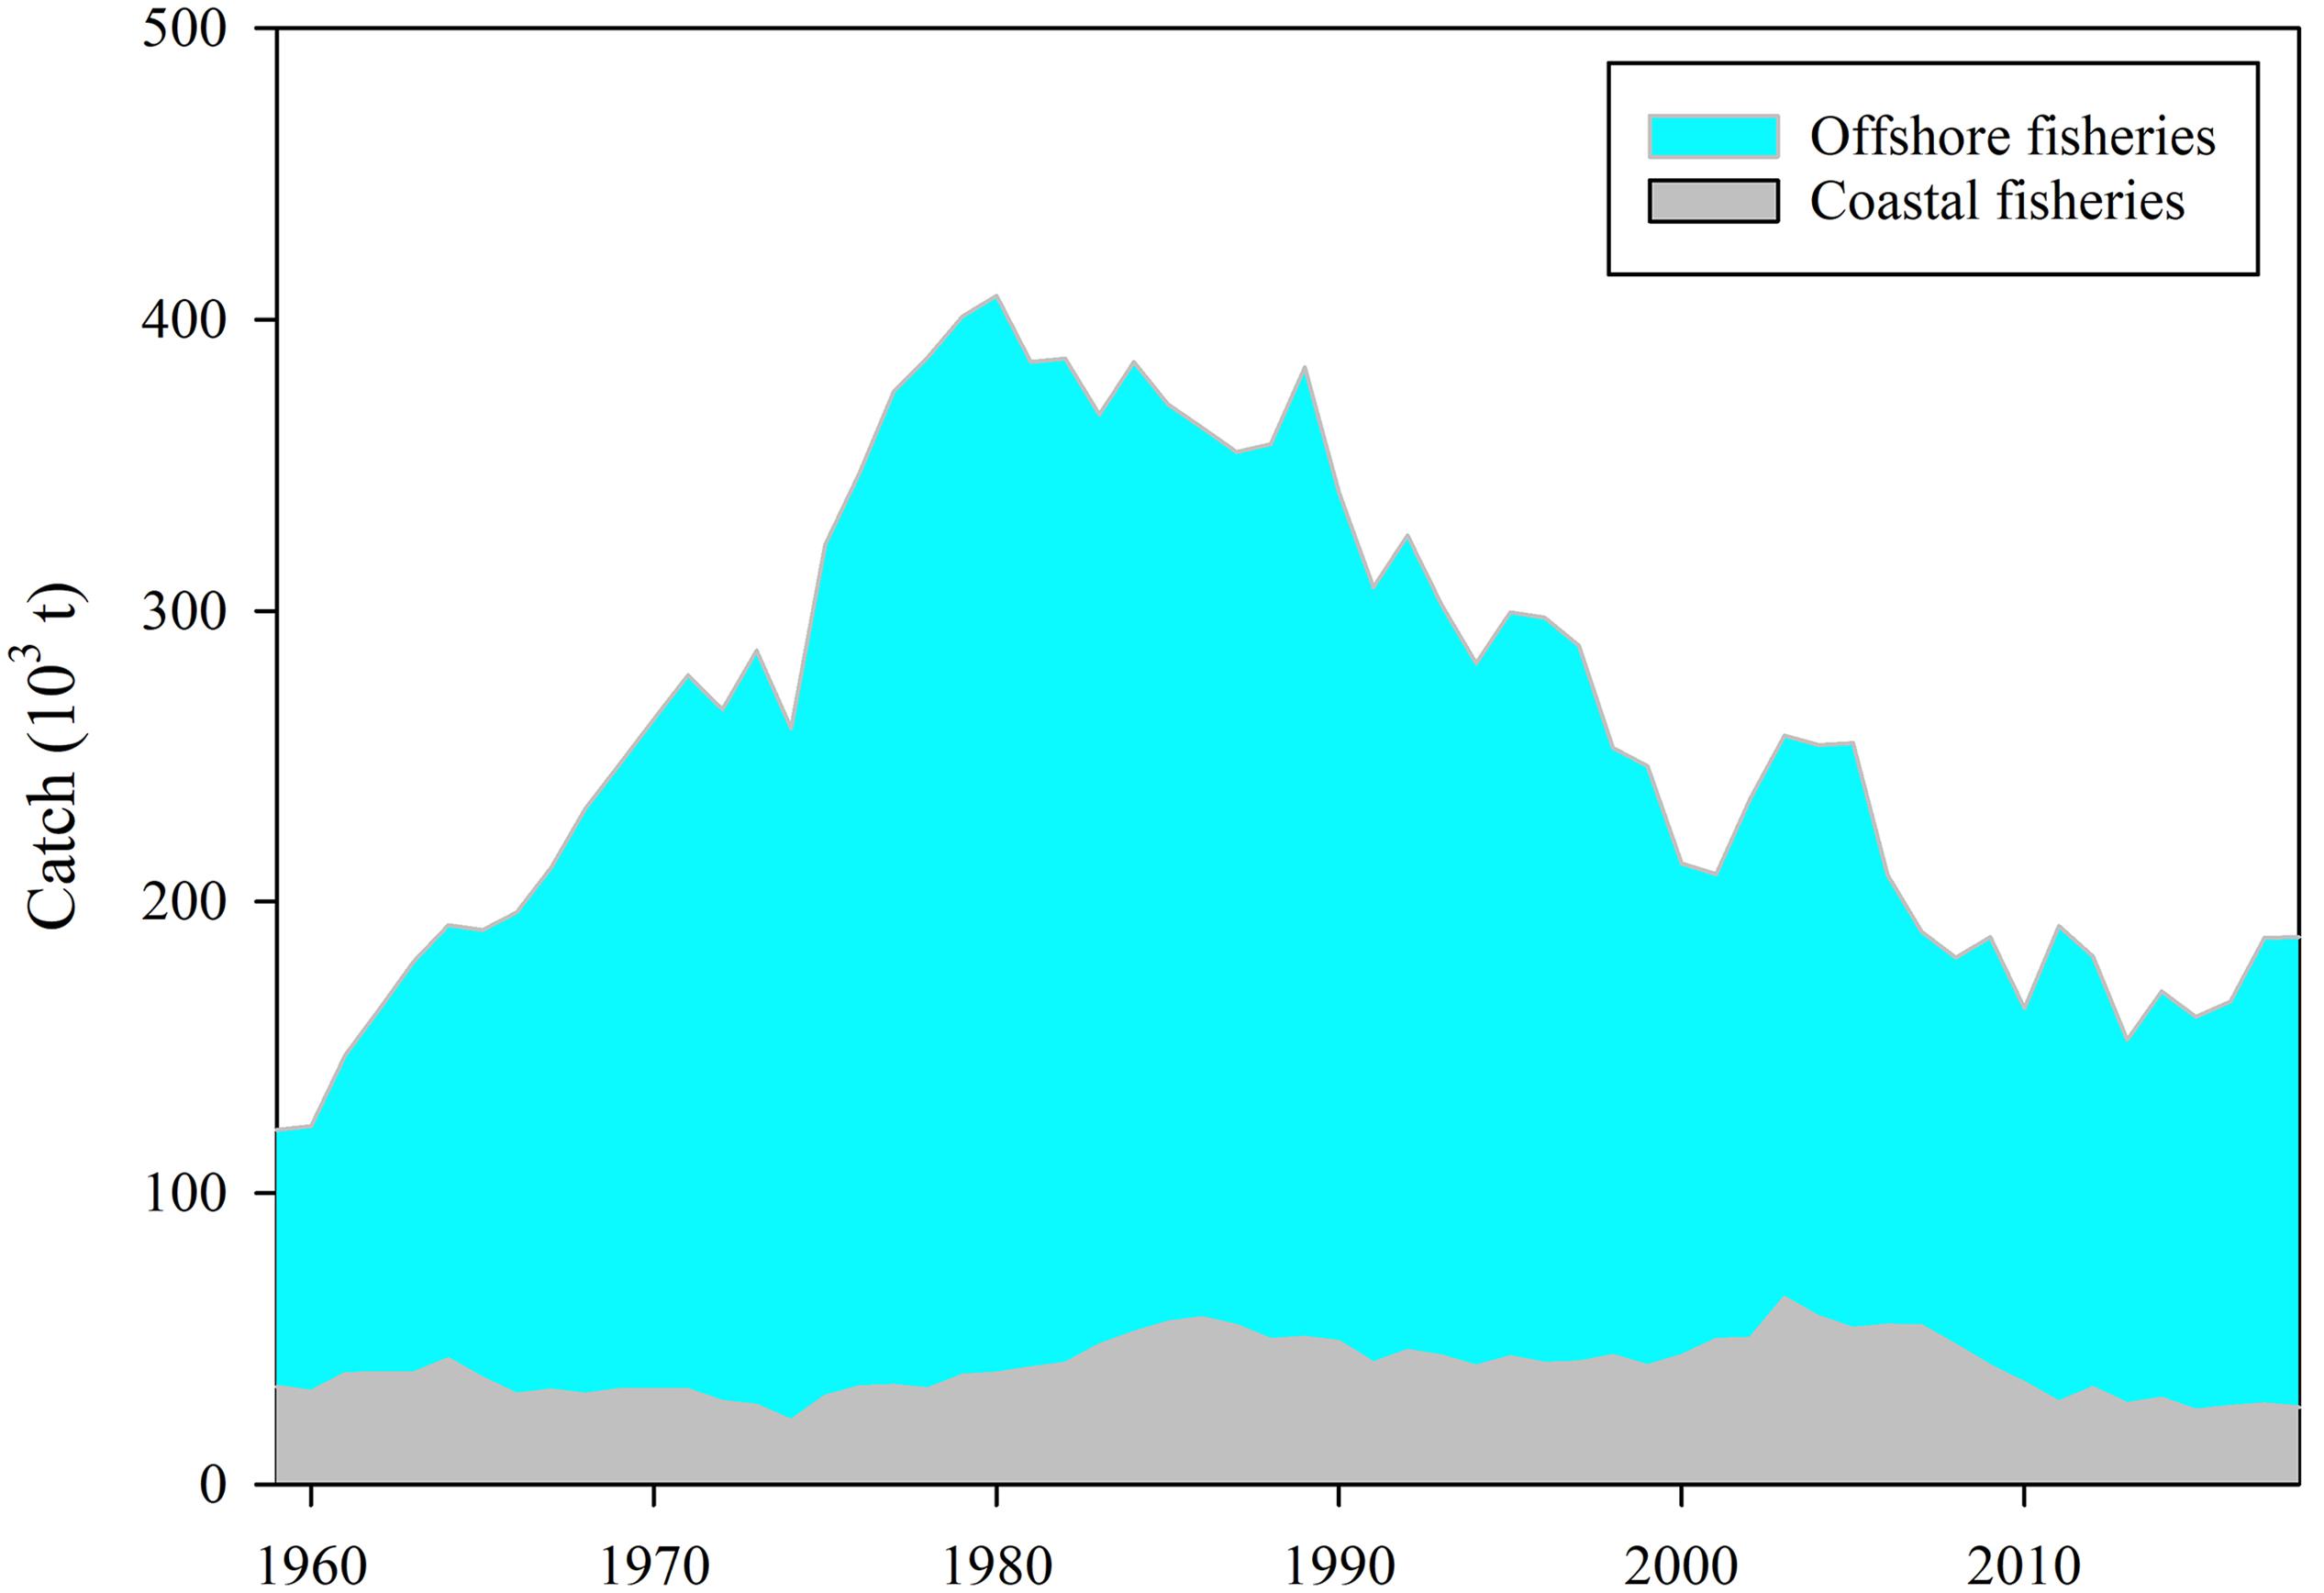
Figure 2. Catches of Taiwan coastal and offshore marine capture fisheries from 1959 to 2018. Data source: Fisheries Agency (1949–2019).
Palomares et al. (2018) listed three reasons for exploited fish stock to remain unassessed in developing countries and regions: lack of expertise, scarcity of data, and absence of stock assessment methods suitable for use in data-sparse situations. These deficiencies have recently been mitigated, at least in part, through the recent development of easy-to-learn computer-intensive stock assessment methods relying primarily on time series of catch data. Among these, the Monte Carlo Catch-Maximum Sustainable Yield (CMSY) method of Froese et al. (2017) figures prominently as a straightforward approach for estimating fisheries reference points from the time series of catch data and ancillary information, or “prior.”
Here, we use the CMSY method, and a related method, a Bayesian state-space implementation of the Schaefer model (BSM; Froese et al., 2017), to estimate biomass (B) and the current status of 16 commercial fish species in the coastal and offshore waters of Taiwan. Also, key fisheries reference points such as intrinsic rate of population increase (r), carrying capacity (k), maximum sustainable yield (MSY), and the terminal ratio B/BMSY are estimated.
Materials and Methods
Fisheries Data
Catch data of the 16 commercial fish species in Taiwan waters (Supplementary Table S1) and the number of fishing vessels were collected from Fisheries Statistical Yearbook Taiwan, Kinmen and Matsu areas (Fisheries Agency, 1949–2019). The catch-per-unit-of-effort (CPUE) data were defined by catch/the number of fishing vessels. The basic fisheries data available for this study are summarized in Table 1. The species therein include top predators, benthopelagic fishes, small pelagic fishes, and demersal fishes (Table 1). The species were selected if they were separately listed as a commercial species in the Fisheries Statistical Yearbook, and their catch time series covered at least 20 years. In addition, management regulations may introduce biases in stock assessments by affecting trends in catch. However, major managements for Taiwan coastal and offshore fisheries (Supplementary Table S2) have little effect on the regulations of these 16 assessed species. Therefore, biases by managements can be ignored for 16 assessed species.
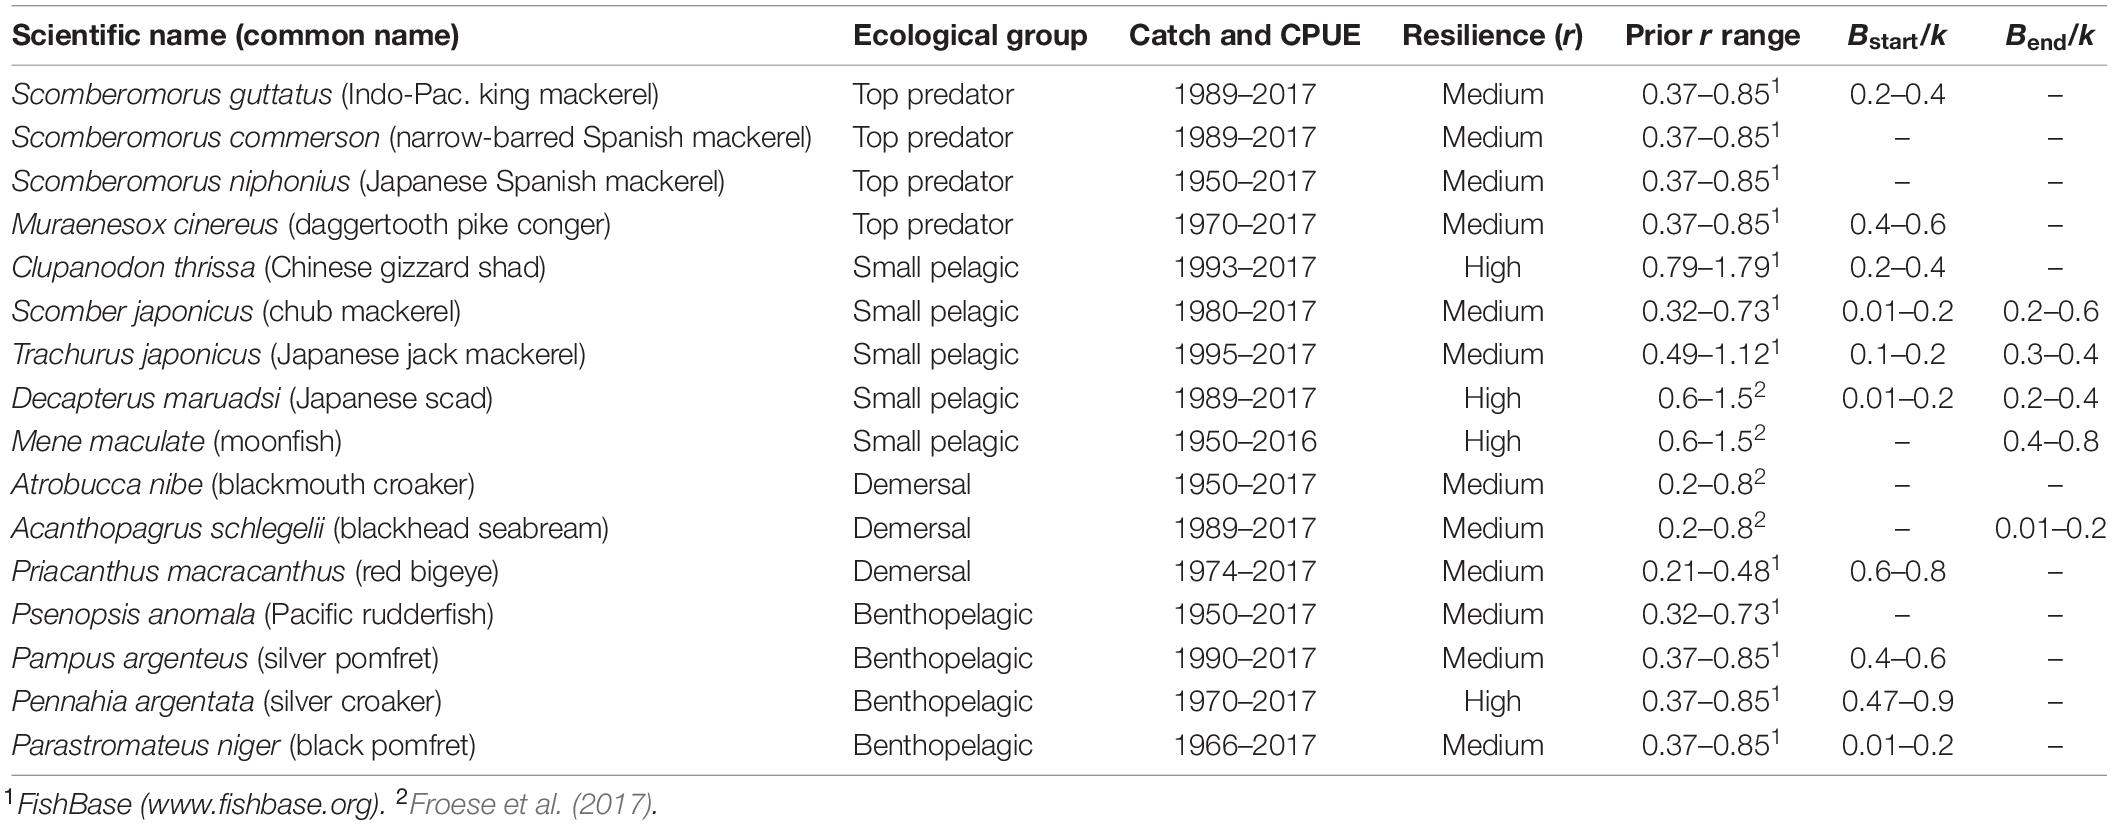
Table 1. Basic data information on key species in the coastal and offshore waters of Taiwan, with “resilience” levels from FishBase.
CMSY and BSM Methods
General Description
The CMSY method was first proposed as a Monte-Carlo method by Martell and Froese (2013), who were inspired by stock reduction analysis (Kimura and Tagart, 1982; Kimura et al., 1984); it was then updated to overcome some shortcomings (Froese et al., 2017). CMSY is used to estimate biomass, exploitation rate (F/FMSY), relative stock size (B/BMSY), and fisheries reference points (MSY, r, k) from time series of catch, resilience, and qualitative stock status information at the beginning and the end of the time series (see Froese et al., 2017, for a complete description). The predictions of the CMSY method can be strengthened by the BSM method when relative abundance data (i.e., CPUE data) are available in addition to catch data. The basic biomass dynamics of the CMSY and BSM methods followed Eq. 1:
where Bt and Bt+1 are the biomass in year t and the subsequent year, respectively; r is the intrinsic rate of population increase; k is the carrying capacity (here taken as the unexploited stock size); and Ct is the catch in year t.
A linear decline of surplus production is incorporated in Eq. 2 when stock size is strongly depleted, that is, its biomass falls less than 0.25 k:
Determining the Boundaries of the r-k Space
To determine prior k ranges for the selected species under assessment, the proxies of resilience and the corresponding r ranges are provided in Table 1, based on Froese et al. (2017) and based on FishBase (Froese and Pauly, 20191), respectively. The prior ranges for k were derived based on three empirical rules in Froese et al. (2017), represented here by Eq. 3 for stocks with low prior biomass at the end of the available catch time series, and Eq. 4 for stocks with high prior biomass at the end of the time series:
where klow and khigh are the lower and upper bounds of the prior range of k, max(C) is the maximum catch in the time series, and rlow and rhigh are the lower and upper bounds of r range to be explored by the Monte-Carlo routine of CMSY.
The prior ranges of r values were obtained from the “resilience” that FishBase estimates for each fish species, and which are available as follows: high = > r = 0.6–1.5; medium = >r = 0.2–0.8; low = >r = 0.05–0.5, and very low = >r = 0.015–0.1 year–1. Note that in general, species that can get large and have a high potential longevity have a low to very resilience, and conversely for small, short-lived species.
Setting Prior Biomass Range
The Bstart/k (prior biomass at the beginning of the time series) and Bend/k (prior biomass at the end of the time series) for the 16 stocks under assessment are given in Table 1. These priors were not set by us, but instead were estimated based on the default rules described in the Supplementary Material of Froese et al. (2017).
Stock Status Definitions
The definitions of stock status used here, as defined by Palomares et al. (2018) based on B/BMSY at the end of the biomass trajectory, are summarized in Table 2.
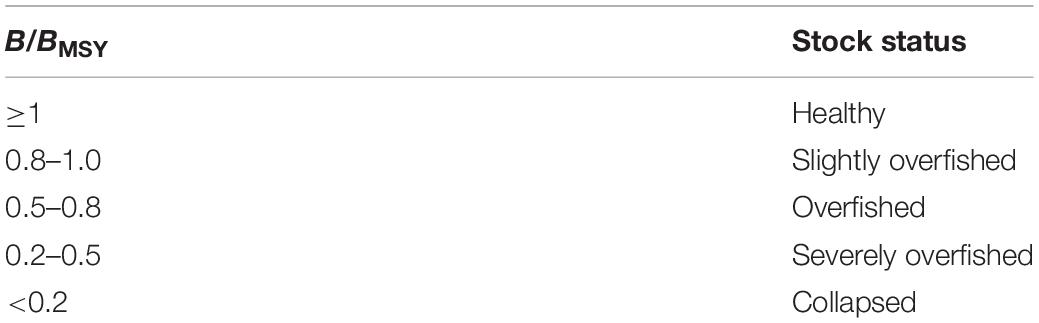
Table 2. Definition of stock status (Palomares et al., 2018) based on B/BMSY in the end of time series.
Results
Table 3 presents the fisheries reference points (r, k, and MSY), relevant biomass (Bend/k and B/BMSY), and stock status of 16 commercial fish stocks.
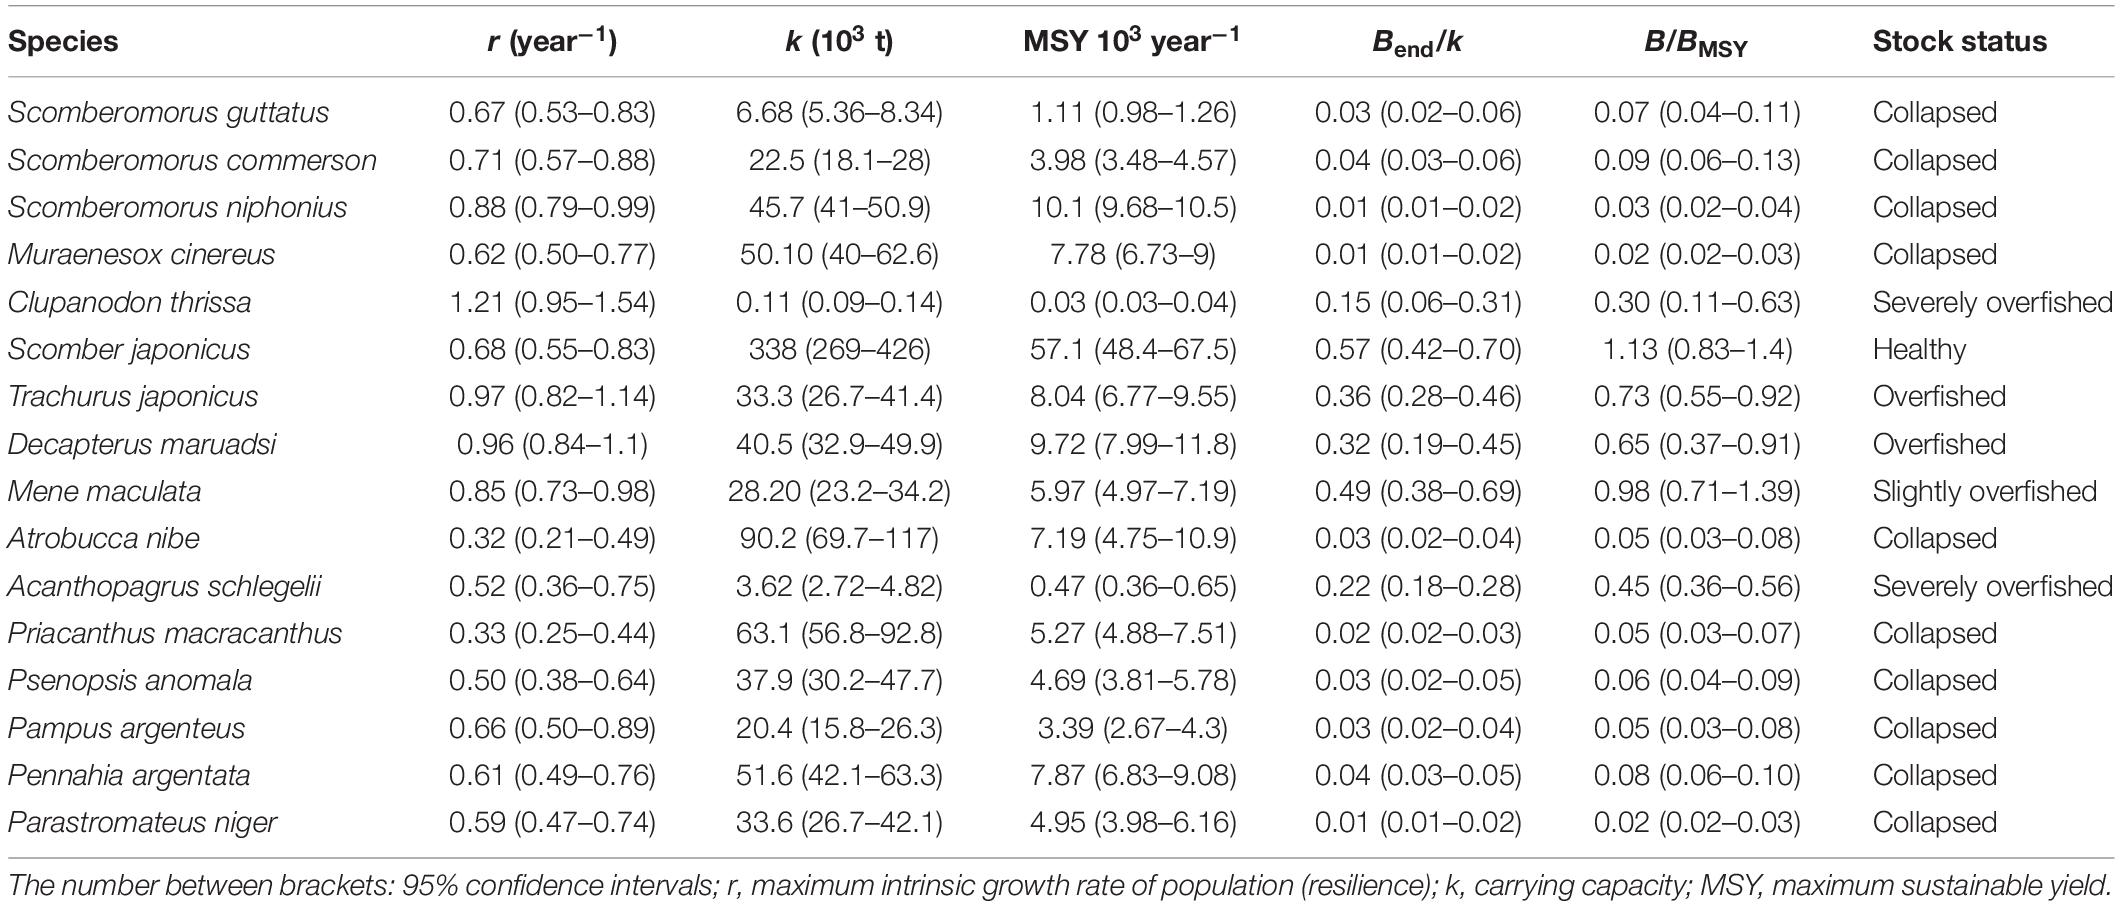
Table 3. Fisheries reference points (r, k, and MSY), relevant biomass (Bend/k and B/BMSY) and stock status of 16 commercially exploited stocks estimated from BSM method.
Figure 3 illustrates two examples, Indo-Pacific king mackerel (Scomberomorus guttatus), which documents a collapsed stock, and chub mackerel (Scomber japonicus), which documents a healthy stock. Figure 3A shows the most probable r-k pair and its 95% confidence interval as identified by the CMSY method (blue cross) and by the BSM method (red cross), which incorporated CPUE data. Figure 3B shows the similar trends of biomass trajectories estimated by CMSY (blue) and BSM (red). These similar values and trends from the two methods indicate that the results are more credible. Finally, Figures 3C,D show the trajectory of relative biomass (B/BMSY) and estimated MSY levels.
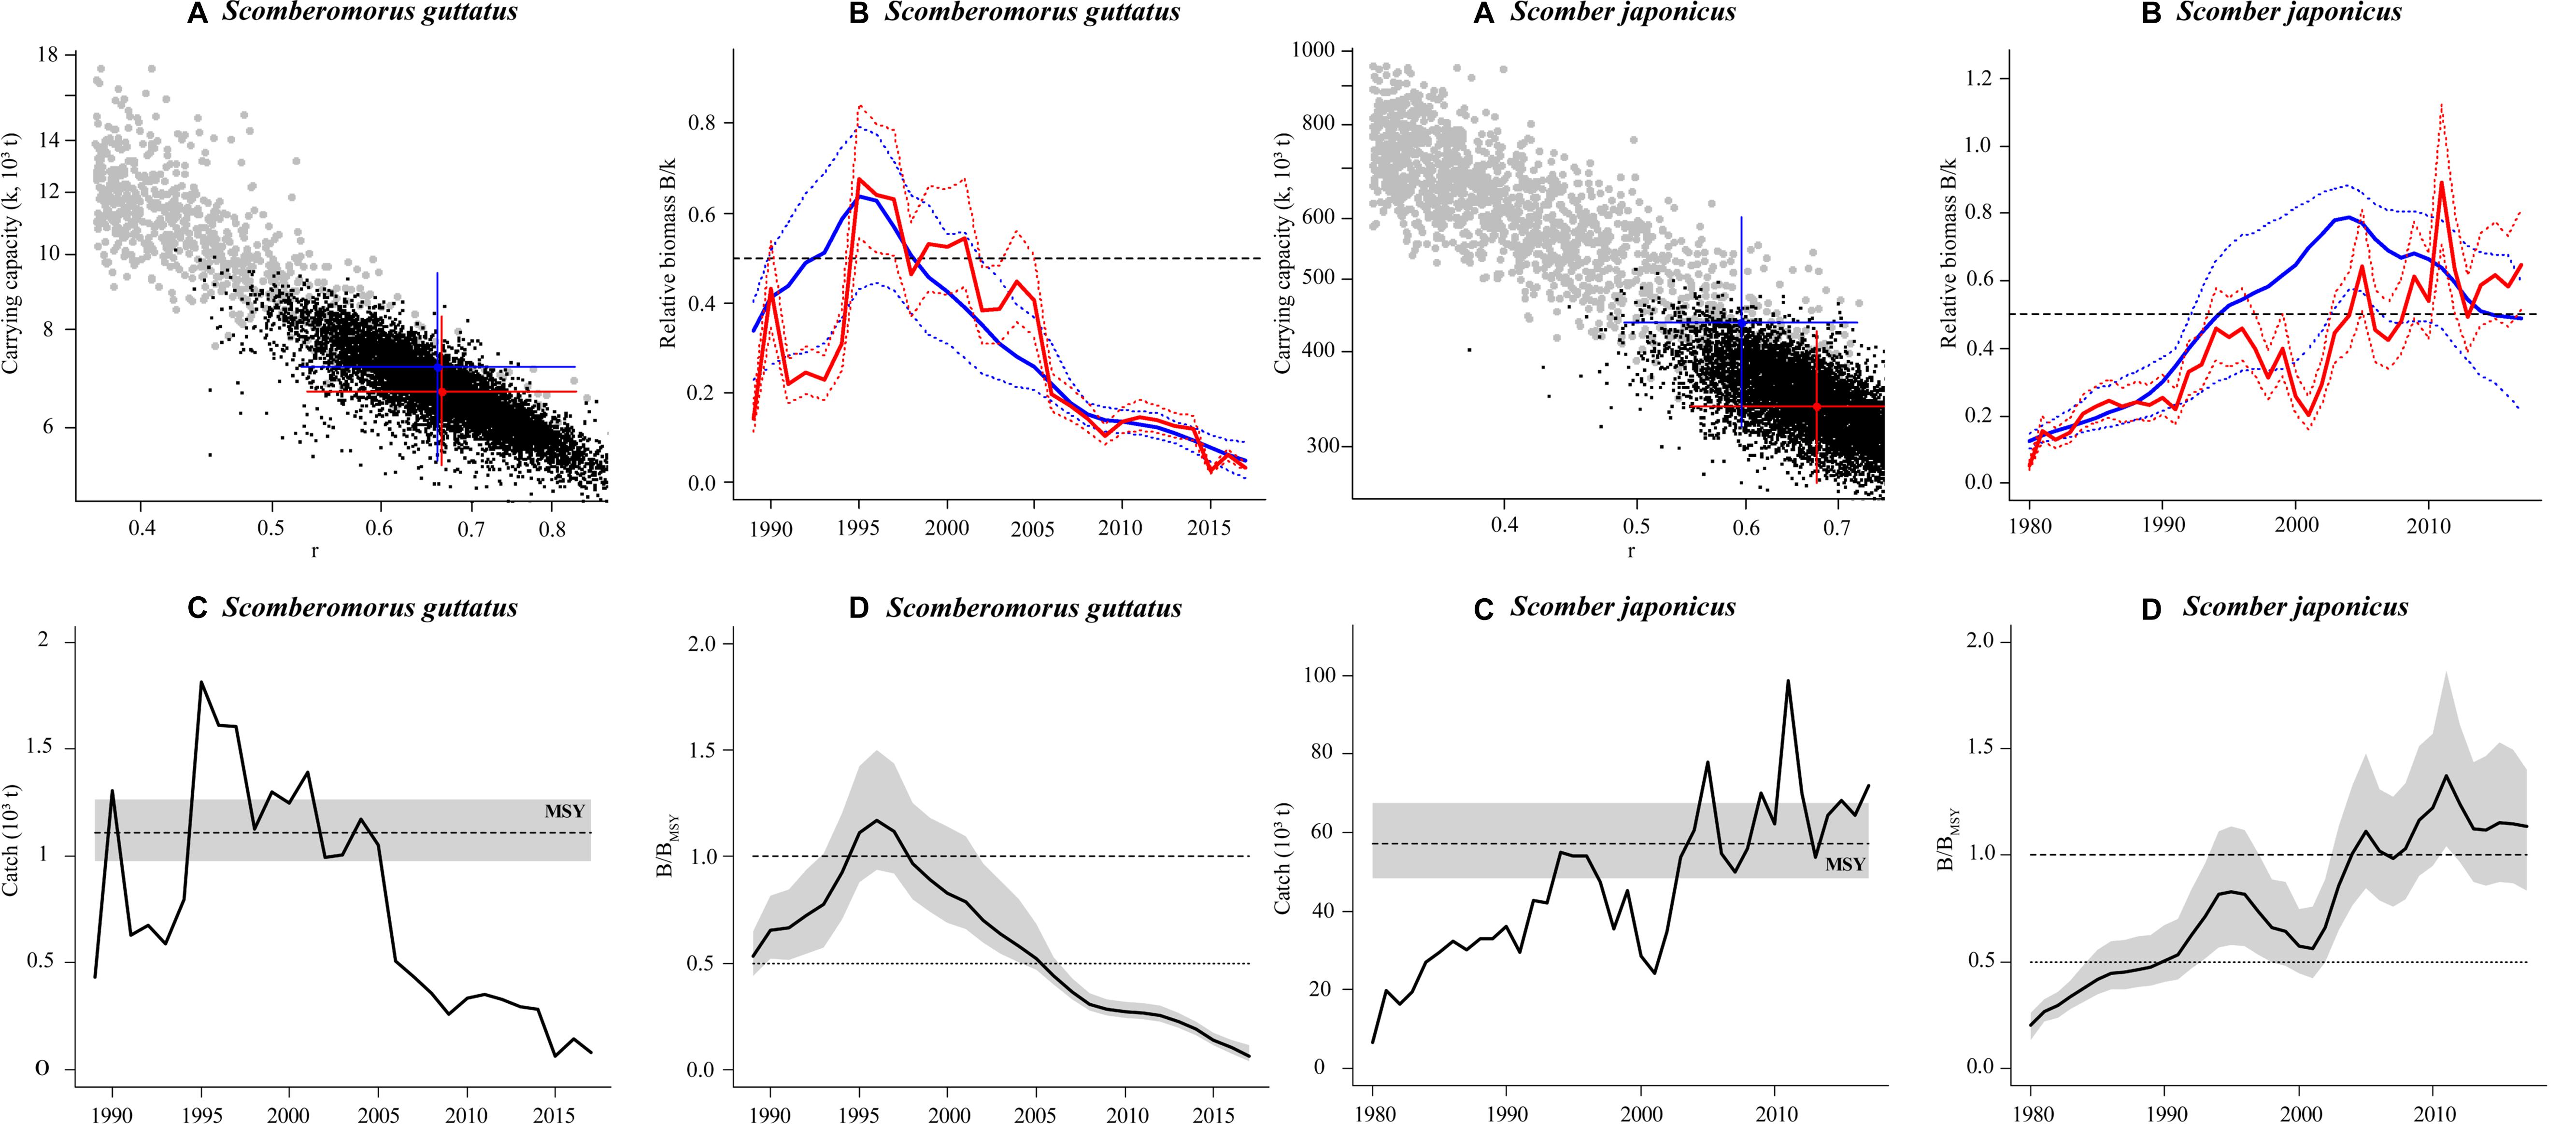
Figure 3. Results of BSM outputs for the collapsed stock Indo-Pacific king mackerel Scomberomorus guttatus (left four panels) and the healthy stock chub mackerel Scomber japonicus (right four panels). Panel (A) shows the viable r-k pairs found by CMSY method (gray dots) and BSM method (black dots), and the blue cross is the most probable r-k pair with its 95% confidence interval (CI) found by CMSY, whereas red cross indicates the most probable r-k pair and its 95% CI found by BSM. Panel (B) shows the biomass trajectories (lines) with the 2.5th and 97.5th percentiles (dotted lines) estimated by CMSY (blue) and BSM (red). Panel (C) shows catch relative to the BSM estimate of MSY, with indication of 95% CI in gray. Panel (D) shows the development of relative total biomass (B/BMSY), with CI (gray area) indicating uncertainty.
Supplementary Figure S1 similar to Figure 3 are presented for the other 15 of our stocks in the Supplementary Material. Jointly, Figure 3 and Supplementary Figure S1 show that, of our 16 stocks, 10 stocks have collapsed, 2 are severely overfished, 2 stocks overfished, 1 is slightly overfished, and only 1 remains healthy (Table 3).
Discussion
CMSY and BSM are now well-established methods for the assessment of data-poor stocks, as they rely mainly only a time series of catch and ancillary qualitative information to quantify the biomass and related information on the stocks under investigation (Froese et al., 2017, 2018). However, for this study, parameters estimated from stock assessment may have some uncertainty due to the inherent limitations in catch (CPUE) data, although these data are from official statistics. The limitations of these input data were qualitatively described below. First, a fraction of catch as discards may be not recorded in official statistics. Second, some pelagic species are straddling stocks distributed across more than one exclusive economic zone, whereas catch data for these species are only collected in Taiwanese Exclusive Economic Zone and may therefore not fully reflect changes in stock size. Finally, catch and fishing effort data may be partly manufactured.
The stocks assessed by the BSM method as “collapsed” include four top predators (S. guttatus, Scomberomorus commerson, Scomberomorus niphonius, Muraenesox cinereus), four benthopelagic species (Psenopsis anomala, Pampus argenteus, Pennahia argentata, Parastromateus niger), and two demersal species (Atrobucca nibe, Priacanthus macracanthus). Their demise can be attributed to the ever-increasing fishing pressure exerted by a fishing fleet which grew, in the past 40 years, 3.14-folds in terms of vessel number and 35.2 times in term of cumulative engine power (Liu, 2013). Meanwhile, coastal and offshore catches have decreased from 408,000 t in 1980 to 198,000 t in 2018 (Fisheries Agency, 1949–2019; Figure 2). Among the other stocks affected were P. anomala (Du et al., 2010), P. argentata (Ju et al., 2016), P. macracanthus (Ju et al., 2016), and P. niger (Tao et al., 2012), occurring in the western Taiwan waters (Taiwan Strait), and which became overfished by the 2000s. These fish species belong to Taiwan’s most important economic species.
Three species of small pelagic fish (Japanese jack mackerel Trachurus japonicus, Japanese scad Decapterus maruadsi, and Chinese gizzard shad Clupanodon thrissa) and blackhead seabream (Acanthopagrus schlegelii) are also overfished and/or severely overfished. Although climate-driven environmental variability can affect the population fluctuations of small pelagic fishes (Yu et al., 2018; Kanamori et al., 2019; Oozeki et al., 2019; Yatsu, 2019), (over-)exploitation also plays the important role in the fluctuations (Saraux et al., 2019) or even leads to population collapses (Essington et al., 2015). Indeed, the biomass of T. japonicus in Kuroshio Current systems has decreased sharply in the recent decades (Oozeki et al., 2019), mainly due to high exploitation.
Moonfish (Mene maculata), a subtropical species abundant in the eastern and southwestern Taiwan waters (Hwang et al., 2002), is “slightly overfished” as assessed in this study (Table 3). The stock status is supported by the study of Hwang et al. (2002), which reported that the stock in Taiwan waters suffered from an exploitation, which lead to a decreasing catch in the 1990s.
Chub mackerel (S. japonicus) is the only stock that our study found to be “healthy” (Table 3). This is confirmed by the report by Ju (2018) that the biomass of chub mackerel is increasing in the southern Taiwan Strait and that this species is recovering from depletion in the Pacific coast of northeastern Japan (Ichinokawa et al., 2015; Li et al., 2018; Oozeki et al., 2019; Yatsu, 2019). However, this positive development appears to be due to favorable environmental conditions (Hiyama et al., 2002; Li et al., 2014; Yasuda et al., 2014; Yu et al., 2018; Kanamori et al., 2019), enabling the stock to resist a threefold increase of fishing effort in the past 40 years (Liu, 2013).
Thus, with 15 of 16 major fish stocks being overexploited or collapsed, it can be inferred that the various management measures for the management of Taiwan’s coastal and offshore fisheries at least in part for these 16 species fisheries and which include imposing total allowable catches, individual quota, area closures, fishing capacity limitations, size, gear, and season limitations (Huang and Chuang, 2010; Chen, 2012; Huang et al., 2016) are still insufficient, as assessed by the catches of coastal and offshore fisheries still decreasing (Fisheries Agency, 1949–2019).
Effective fisheries management is the main driver for recovery of fish stocks (Zimmermann and Werner, 2019; Hilborn et al., 2020). Therefore, we believe that the overall size of Taiwan’s fishing fleet, generated by continuous growth in the last four decades, is the major reason why the technical measures listed above are not bearing fruit as expected.
Data Availability Statement
All datasets generated for this study are included in the article/Supplementary Material.
Ethics Statement
Ethical review and approval was not required for the animal study because Our manuscript was based on official statistics of Taiwan, and no live vertebrates or higher invertebrates were involved, thus we believe an ethical review process was not required for our study.
Author Contributions
PJ, YT, MC, QX and PS collected and analyzed data, provided ideas and drafted this manuscript. YT, SY, YL, and PS edited the manuscript. All authors contributed to the article and approved the submitted version.
Funding
PJ, YT, YL, and PS were partially supported by National Key Research and Development Project (No. 2018YFD0900902) and National Natural Science Foundation of China (Nos. 41930534 and 41861134037). MC and SY were in part funded by the National Key R&D Program of China (No. 2018YFC1406301), the Natural Science Foundation of Fujian Province, China (No. 2018J01066), and Xiamen University Malaysia Research Fund (No. XMUMRF/2020-C5/ICAM/0007).
Conflict of Interest
The authors declare that the research was conducted in the absence of any commercial or financial relationships that could be construed as a potential conflict of interest.
Acknowledgments
The authors thank Dr. Daniel Pauly for editing the manuscript. They also thank Dr. Maria Lourdes Palomares for the constructive comments on these results. We would like to thank Jiamei Xiao for helping collect data.
Supplementary Material
The Supplementary Material for this article can be found online at: https://www.frontiersin.org/articles/10.3389/fmars.2020.00618/full#supplementary-material
Footnotes
References
Chen, C.-S. (2012). Management of the precious coral fishery in Taiwan: progress and perspectives. Mar. Policy 36, 623–629. doi: 10.1016/j.marpol.2011.10.016
Chen, J. L. (2006). A Study on The Planning and Management of Fishery Resource Conservation Areas in Taiwan. Keelung: National Taiwan Ocean University.
Chen, J. L., Lin, Y. S., and Chuang, C. T. (2018). Improving the management of Taiwanese fishery resource conservation zones based on public perceptions and willingness to pay for ecosystem services. J. Coast. Conserv. 22, 385–398. doi: 10.1007/s11852-017-0586-5
Du, J., Lu, Z., Chen, M., Yang, S., and Chen, X. (2010). Changes in ecological parameters and resources of Japanese butterfish, Psenopsis anomala, in the middle and northern Taiwan Strait. J. Oceanogr. Taiwan Strait 29, 234–240.
Essington, T. E., Moriarty, P. E., Froehlich, H. E., Hodgson, E. E., Koehn, L. E., Oken, K. L., et al. (2015). Fishing amplifies forage fish population collapses. Proc. Natl. Acad. Sci. U.S.A. 112, 6648–6652. doi: 10.1073/pnas
FAO (2018). The State off Word Fisheries and Aquaculture 2018-Meeting the Sustainable Development Goals. Rome: Food and Agriculture Organization.
Fisheries Agency 1949–2019 Fisheries Statistical Yearbook 1950–2018, Taiwan, Kinmen and Matsu Area. Taipei: Fisheries Agency. Google Scholar
Froese, R., Demirel, N., Coro, G., Kleisner, K. M., and Winker, H. (2017). Estimating fisheries reference points from catch and resilience. Fish Fish. 18, 506–526. doi: 10.1111/faf.12190
Froese, R., and Pauly, D. (2019). FishBase. World Wide Web Electronic Publication. Available online at: http://www.fishbase.org, version (accessed December, 2019).
Froese, R., Winker, H., Coro, G., Demirel, N., Tsikliras, A. C., Dimarchopoulou, D., et al. (2018). Status and rebuilding of European fisheries. Mar. Policy 93, 159–170. doi: 10.1016/j.marpol.2018.04.018
Hilborn, R., Amoroso, R. O., Anderson, C. M., Baum, J. K., Branch, T. A., Costello, C., et al. (2020). Effective fisheries management instrumental in improving fish stock status. PNAS 117, 2218–2224. doi: 10.1073/pnas.1909726116
Hiyama, Y., Yoda, M., and Ohshimo, S. (2002). Stock size fluctuations in chub mackerel (Scomber japonicus) in the East China Sea and the Japan/East Sea. Fish. Oceanogr. 11, 347–353. doi: 10.1046/j.1365-2419.2002.00217.x
Ho, C. H., Lu, H. J., He, J. S., Lan, K.-W., and Chen, J. L. (2016). Changes in patterns of seasonality shown by migratory fish under global warming: evidence from catch data of Taiwan’s coastal fisheries. Sustainability 8, 273. doi: 10.3390/su8030273
Hobday, A. J., and Pecl, G. T. (2014). Identification of global marine hotspots: sentinels for change and vanguards for adaptation action. Rev. Fish Biol. Fish. 24, 415–425. doi: 10.1007/s11160-013-9326-6
Huang, H.-W., and Chuang, C.-T. (2010). Fishing capacity management in Taiwan: experiences and prospects. Mar. Policy 34, 70–76. doi: 10.1016/j.marpol.2009.04.014
Huang, H.-W., Wang, S.-B., Wang, S.-P., Lu, H.-J., Chen, C.-S., Liao, C.-H., et al. (2016). Status and Challenges for Taiwan Marine Fisheries Resources, the 4th Taiwan and Ocean Conference. Taipei: National Taiwan Ocean University & Taiwan Research Foundation.
Hwang, S. Y., Chen, C. T., and Liu, K. M. (2002). Age and growth of the Moon fish, Mene maculata, before and after heavy exploitation in Southwestern Taiwan waters. J. Fish. Soc. Taiwan 29, 299–311.
Ichinokawa, M., Okamura, H., Watanabe, C., Kawabata, A., and Oozeki, Y. (2015). Effective time closures: quantifying the conservation benefits of input control for the Pacific chub mackerel fishery. Ecol. Appl. 25, 1566–1584. doi: 10.1890/14-1216.1
Ji, W. W., Ruan, W., Fang, H., Wang, Q., and Lu, Y. N. (2014). Review on the development of fisheries in Taiwan. Fish. Inform. Strat. 29, 300–306.
Ju, P., Cheung, W. W. L., Lu, Z., Yang, S., Guo, Z., Chen, M., et al. (2019). Age, growth, and abundance fluctuation of Jordan’s damsel Teixeirichthys Jordani (Actinopterygii: Perciformes: Pomacentridae) in the southern Taiwan Strait. Acta Ichthyol. Piscat. 49, 243–250. doi: 10.3750/AIEP/02571
Ju, P. L. (2018). Study on Fishery Ecosystem in the Southern Taiwan Strait based on Ecopath with Ecosim. Ph.D. thesis, Xiamen University, Xiamen.
Ju, P. L., Yang, L., Lu, Z. B., Yang, S. Y., Du, J. G., Zhong, H. Q., et al. (2016). Age, growth, mortality and population structure of silver croaker Pennahia argentata (Houttuyn, 1782) and red bigeye Priacanthus macracanthus Cuvier, 1829 in the north-central Taiwan Strait. J. Appl. Ichthyol. 32, 652–660. doi: 10.1111/jai.13053
Kanamori, Y., Takasuka, A., Nishijima, S., and Okamura, H. (2019). Climate change shifts the spawning ground northward and extends the spawning period of chub mackerel in the western North Pacific. Mar. Ecol. Prog. Ser. 624, 155–166. doi: 10.3354/meps13037
Kimura, D., Balsiger, J., and Ito, D. (1984). Generalized stock reduction analysis. Can. J. Fish. Aquat. Sci. 41, 1325–1333. doi: 10.1139/f84-162
Kimura, D., and Tagart, J. (1982). Stock reduction analysis, another solution to the catch equations. Can. J. Fish. Aquat. Sci. 39, 1467–1472. doi: 10.1139/f82-198
Lam, V. W., and Pauly, D. (2019). Status of fisheries in 13 Asian large marine ecosystems. Deep Sea Res. II. 163, 57–64. doi: 10.1016/j.dsr2.2018.09.002
Li, G., Chen, X., Lei, L., and Guan, W. (2014). Distribution of hotspots of chub mackerel based on remote-sensing data in coastal waters of China. Int. J. Remote Sens. 35, 1–23. doi: 10.1080/01431161.2014.916057
Li, Y., Pan, L., Guan, W., and Jiao, J. (2018). Simulation study of individual-based on interannual fluctuation of chub mackerel’s (Scomber japonicus) recruitment in the East China Sea. Haiyang Xuebao 40, 87–95.
Liao, C. P., Huang, H. W., and Lu, H. J. (2019). Fishermen’s perceptions of coastal fisheries management regulations: key factors to rebuilding coastal fishery resources in Taiwan. Ocean Coast. Manage. 172, 1–13. doi: 10.1016/j.ocecoaman.2019.01.015
Liu, W. H. (2013). Managing the offshore and coastal fisheries in Taiwan to achieve sustainable development using policy indicators. Mar. Pol. 39, 162–171. doi: 10.1016/j.marpol.2012.11.001
Martell, S., and Froese, R. (2013). A simple method for estimating MSY from catch and resilience. Fish Fish. 14, 504–514. doi: 10.1111/j.1467-2979.2012.00485.x
Oozeki, Y., Carranza, M. Ñ, Takasuka, A., Dejo, P. A., Kuroda, H., Malagas, J. T., et al. (2019). Synchronous multi-species alternations between the northern Humboldt and Kuroshio Current systems. Deep Sea Res. II 159, 11–21. doi: 10.1016/j.dsr2.2018.11.018
Palomares, M. L. D., Froese, R., Derrick, B., Nöel, S.-L., Tsui, G., Woroniak, J., et al. (2018). A Preliminary Global Assessment of the Status of Exploited Marine Fish and Invertebrate Populations. A Report Prepared by the Sea Around Us for OCEANA. Vancouver: The University of British Columbia.
Rice, J. C., and Garcia, S. M. (2011). Fisheries, food security, climate change and biodiversity: characteristics of the sector and perspectives of emerging issues. ICES J. Mar. Sci. 68, 1343–1353. doi: 10.1093/icesjms/fsr041
Saraux, C., Beveren, E. V., Brosset, P., Queiros, Q., Bourdeix, J., Dutto, G., et al. (2019). Small pelagic fish dynamics: a review of mechanisms in the Gulf of Lions. Deep Sea Res. II 159, 52–61. doi: 10.1016/j.dsr2.2018.02.010
Shao, K. T. (2011). Investigation and Planning of Fishery Resources Conservation Zones and Rare Species. Taipei: Fishery Agency.
Tao, Y., Mingru, C., Jianguo, D., Zhenbin, L., and Shengyun, Y. (2012). Age and growth changes and population dynamics of the black pomfret (Parastromateus niger) and the frigate tuna (Auxis thazard thazard), in the Taiwan Strait. Lat. Am. J. Aquat. Res. 40, 649–656. doi: 10.3856/vol40-issue3-fulltext-13
Yasuda, T., Yukami, R., and Ohshimo, S. (2014). Fishing ground hotspots reveal long-term variation in chub mackerel Scomber japonicus habitat in the East China Sea. Mar. Ecol. Prog. Ser. 501, 239–250. doi: 10.3354/meps10679
Yatsu, A. (2019). Review of population dynamics and management of small pelagic fishes around the Japanese Archipelago. Fish. Sci. 85, 611–639. doi: 10.1007/s12562-019-01305-3
Yu, W., Guo, A., Zhang, Y., Chen, X., Qian, W., and Li, Y. (2018). Climate-induced habitat suitability variations of chub mackerel Scomber japonicus in the East China Sea. Fish. Res. 207, 63–73. doi: 10.1016/j.fishres.2018.06.007
Keywords: Chinese coastal fisheries, Taiwan waters, CMSY and BSM, commercial fish, stock assessment
Citation: Ju P, Tian Y, Chen M, Yang S, Liu Y, Xing Q and Sun P (2020) Evaluating Stock Status of 16 Commercial Fish Species in the Coastal and Offshore Waters of Taiwan Using the CMSY and BSM Methods. Front. Mar. Sci. 7:618. doi: 10.3389/fmars.2020.00618
Received: 31 January 2020; Accepted: 06 July 2020;
Published: 30 July 2020.
Edited by:
Cui Liang, Institute of Oceanology, Chinese Academy of Sciences, ChinaReviewed by:
Hui Zhang, Institute of Oceanology, Chinese Academy of Sciences, ChinaFabian Zimmermann, Norwegian Institute of Marine Research (IMR), Norway
Copyright © 2020 Ju, Tian, Chen, Yang, Liu, Xing and Sun. This is an open-access article distributed under the terms of the Creative Commons Attribution License (CC BY). The use, distribution or reproduction in other forums is permitted, provided the original author(s) and the copyright owner(s) are credited and that the original publication in this journal is cited, in accordance with accepted academic practice. No use, distribution or reproduction is permitted which does not comply with these terms.
*Correspondence: Yongjun Tian, eWp0aWFuQG91Yy5lZHUuY24=; Mingru Chen, bXJjaGVuQHhtdS5lZHUuY24=; Peng Sun, c3VucGVuZ0BvdWMuZWR1LmNu