 Jiekai Xu1
 Jiazhen Sun
 John Beardall
 Kunshan Gao
- 1State Key Laboratory of Marine Environmental Science, College of Ocean and Earth Sciences, Xiamen University, Xiamen, China
- 2School of Biological Sciences, Monash University, Clayton, VIC, Australia
- 3Co-Innovation Center of Jiangsu Marine Bio-industry Technology, Jiangsu Ocean University, Lianyungang, China
While seawater acidification induced by elevated CO2 is known to impact coccolithophores, the effects in combination with decreased salinity caused by sea ice melting and/or hydrological events have not been documented. Here we show the combined effects of seawater acidification and reduced salinity on growth, photosynthesis and calcification of Emiliania huxleyi grown at 2 CO2 concentrations (low CO2 LC:400 μatm; high CO2 HC:1000 μatm) and 3 levels of salinity (25, 30, and 35‰). A decrease of salinity from 35 to 25‰ increased growth rate, cell size and photosynthetic performance under both LC and HC. Calcification rates were relatively insensitive to salinity though they were higher in the LC-grown compared to the HC-grown cells at 25‰ salinity, with insignificant differences under 30 and 35‰. Since salinity and OA treatments did not show interactive effects on calcification, changes in calcification:photosynthesis ratios are attributed to the elevated photosynthetic rates at lower salinities, with higher ratios of calcification to photosynthesis in the cells grown under 35‰ compared with those grown at 25‰. In contrast, photosynthetic carbon fixation increased almost linearly with decreasing salinity, regardless of the pCO2 treatments. When subjected to short-term exposure to high light, the low-salinity-grown cells showed the highest photochemical effective quantum yield with the highest repair rate, though the HC treatment enhanced the PSII damage rate. Our results suggest that, irrespective of pCO2, at low salinity Emiliania huxleyi up-regulates its photosynthetic performance which, despite a relatively insensitive calcification response, may help it better adapt to future ocean global environmental changes, including ocean acidification, especially in the coastal areas of high latitudes.
Introduction
Since the Industrial Revolution, atmospheric pCO2 levels have increased by approximately 40%, mainly due to anthropogenic emissions of CO2 (Howes et al., 2015), and the oceans have absorbed about one third of the CO2 attributable to fossil fuel burning (Sabine et al., 2004), leading to increases in the concentration of pCO2, HCO3– and H+, along with a decrease in the concentration of CO32– and the saturation state of calcium carbonate, a process known as Ocean Acidification (OA). The pH of surface waters of the global ocean has already decreased by 0.1 units and will be further decreased by another 0.4 units by the end of this century under a “business-as-usual” scenario (Gattuso et al., 2015).
At the same time, the planet is also subject to global warming, another critical issue which has an important influence on organisms, with unforeseen consequences for marine biogeochemical cycling and ecosystem functioning (Taucher and Oschlies, 2011). It is predicted that the global mean temperature will increase by 2∼5°C by 2100 (Gattuso et al., 2015). With warmer air and increasing ocean temperature, sea ice coverage has been declining, leading to a decrease in salinity, especially in coastal areas at high latitudes (Dickson et al., 2002; Ishii et al., 2006; Massom and Stammerjohn, 2010). For instance, Blindheim et al. (2000) and Albretsen et al. (2011) have reported a sharp decline in salinity in coastal areas of the Norwegian Sea during the last few decades, which in some locations has been more than 0.5‰ in the last 10 years. On the other hand, rainfall or hydrological changes associated with climate change can also alter surface seawater salinity. Changes in salinity in turn influence the solubility of CO2 in water and the equilibria between the different DIC species in the carbonate system, with decreased salinity resulting in small increases in CO2 solubility but with decreases in bicarbonate and carbonate concentrations (Zeebe and Wolf-Gladrow, 2001). As projected climate change processes are thought to amplify the effects of OA in the oceans of high latitude, organisms in the waters at high latitude are thought to be more vulnerable to rapid chemical changes (Chierici and Fransson, 2009; Qi et al., 2017). It is therefore of general interest to explore how marine photosynthetic organisms respond to changes in surface ocean carbonate chemistry and salinity that are potentially altered by both decreased salinity and rising CO2 concentration.
Coccolithophores, one of the most important calcifying primary producer groups, play a key role in the global carbon cycle, contributing about 10% to total organic carbon fixation (Poulton et al., 2007) and 50% to CaCO3 found in pelagic sediments (Broecker and Clark, 2009). The globally most abundant coccolithophore species is Emiliania huxleyi, which forms extensive blooms (Moore et al., 2012). With respect to E. huxleyi’s distinct sensitivity to OA, there have already been a number of studies that have documented its morphological, physiological and molecular responses to OA (Paasche, 2001; Raven and Crawfurd, 2012). Riebesell et al. (2000) reported negative effects of OA on morphology, calcification and growth on E. huxleyi, while Iglesias-Rodriguez et al. (2008) reported higher particulate inorganic and organic carbon (PIC, POC) per cell under elevated pCO2. Nevertheless, both studies showed decreased calcification rates under elevated pCO2 (Riebesell et al., 2008). Hoppe et al. (2011) showed that the PIC production of two E. huxleyi strains was negatively affected by higher pCO2, although marked differences of responses to OA did exist among strains (Langer et al., 2009). Other environmental drivers are known to interact with OA to affect E. huxleyi (Gao et al., 2012; Boyd et al., 2018). For instance, exposure to UV radiation or high levels of photosynthetically active radiation (PAR) exacerbated impacts of OA on calcification (Feng et al., 2008; Gao et al., 2009). On the other hand, a recent study demonstrated that high levels of sunlight counteracted the negative effects of OA on calcification of E. huxleyi when the cells were grown under fluctuating incident solar radiation (Jin et al., 2017). Over 150–1000 generations, lower PIC:POC ratios were still observed in coccolithophorid species under OA (Müller et al., 2010; Lohbeck et al., 2012; Tong et al., 2018). A decreased PIC:POC ratio in another coccolithophorid, Gephyrocapsa oceanica, adapted to OA over 1000 generations persisted when cells were transferred back to the low pCO2 treatment, indicating an adaptive evolution (Tong et al., 2018). In brief, it is generally accepted that OA decreases calcification, and discrepancies exist when OA impacts on E. huxleyi in combination with other factors or under multiple drivers.
Changes in salinity are known to affect the morphology of coccolithophores (Bollmann and Herrle, 2007). While some E. huxleyi strains can survive at a salinity as low as 15‰ (Brand, 1984), its calcification is strongly depressed under such conditions, with malformed coccoliths (Saruwatari et al., 2016). Observations from sediment cores also showed that coccolith morphology was dependent on salinity (Fielding et al., 2009), and salinity can affect the hydrogen isotopic composition of long chain alkenones synthesized by E. huxleyi (Schouten et al., 2006). Reduction of salinity led to a smaller cellular volume in E. huxleyi due to reduced thickness of coccoliths (Green et al., 1998; Saruwatari et al., 2016). On the other hand, decreased salinity may interact with lowered pH to affect E. huxleyi, though it is known as a euryhaline species (Birkenes and Braarud, 1952; Paasche et al., 1996). Nevertheless, to the best of our knowledge, the combined effects of reduced salinity and lowered pH on E. huxleyi have not yet been documented. Given the effects of salinity on the carbonate system we therefore hypothesized that, in addition to the well documented consequences of changes in salinity for osmoregulation and metabolism, salinity and OA, and there consequences for concentrations of components of the carbonate system (CO2, bicarbonate and carbonate), may interact in modulating the photosynthetic physiology, calcification rates and growth of E. huxleyi. Specifically, increased CO2 solubility might improve photosynthesis at low salinity, while the lower bicarbonate concentrations under such conditions would diminish cells’ capacity for calcification. At the same time, decreased pH (ocean acidification) causes higher dissolved CO2, and slightly higher bicarbonate, concentrations and thus might be expected to interact with salinity to influence photosynthetic physiology and growth. In this study, we show that Emiliania huxleyi responds to hyposalinity by increasing photosynthetic performance and growth, even when grown under OA conditions (though both parameters were decreased at high pCO2 at all salinities), despite a lack of effect on calcification and lower calcification to photosynthesis ratios under lower salinity conditions.
Materials and Methods
Cultures and Experimental Setup
Emiliania huxleyi PML B92/11 was originally obtained from coastal waters off Bergen, Norway. This strain calcifies, but after having been maintained in laboratory culture for about 10 years in sterilized seawater enriched with Aquil medium (Sunda et al., 2005), its calcification capacity has decreased (Jin et al., 2017). No Si was added to the seawater but the nitrate level was initially adjusted to 100 μmol/L and the phosphate concentration to 10 μmol/L. Monospecific cultures (without aeration) were maintained at 15°C and illuminated by cool white fluorescent light at an intensity of 200 μmol photons m–2 s–1, under a 12:12 h light and dark cycle.
Before inoculation, the culture medium was equilibrated with filtered (0.22 μm, Whatman) ambient air (from outdoors) of low (400 μatm) or elevated (1000 μatm) CO2 concentrations prior to inoculation. The elevated CO2 was achieved by using a CO2 enriching device (CE100B, Wuhan Ruihua Instrument & Equipment Ltd., China) which gives rise to less than 5% variation of the controlled CO2 level. We set three levels of salinity (25, 30, 35‰): 35‰ is the salinity of our artificial seawater (Harrison and Berges, 2005) and 30‰ is close to the salinity of the strain’s original environment (under the influence of the Norwegian coastal current) (Mork et al., 1981). The lowest level served as an extreme that is within the range of values occurring frequently in coastal and estuarine environments (Brand, 1984; Li et al., 2011). Reduced salinity was obtained by diluting prepared artificial seawater with Milli-Q water before sterilization, nutrient addition and aeration. Prior to inoculation, samples were collected for carbonate chemistry measurements (see the following section) and the seawater with the target pCO2 was divided carefully into three 500 ml polycarbonate bottles before inoculation. There were thus triplicate independent cultures for each treatment where the volume of each was 480 ml.
We used low biomass density batch cultures in sealed polycarbonate bottles (see below), shaken manually every day (LaRoche et al., 2010). Before inoculation, exponential growing cells had been pre-acclimated to the experimental conditions for at least 8 generations (5–6 days depending on growth condition). E. huxleyi was inoculated to about 400 cells ml–1. Experimental cultures were then run for another 6∼8 generations in the mid-exponential phase with gentle shaking twice a day. Cell concentrations never exceeded 60,000 cells ml–1. Within the ranges of cell concentrations and carbonate chemistry parameters, we ensured that the cultures were still in the exponential phase (Zondervan et al., 2002) when experimental measurements were carried out.
Immediately before collecting the samples for measurement of experimental parameters, we took samples again for carbonate chemistry measurements to check that the carbonate system had not been significantly perturbed despite culture growth. Samples for measurements of physiological parameters were all taken about 2.5 h after the onset of the light period on the last day of incubation, when cells had been growing under each treatment for about 14 generations.
Carbonate Chemistry Sampling and Measurements
pH was measured by a pH meter (Orion 2 STAR, Thermo Fisher Scientific) calibrated with standard National Bureau of Standards (NBS) buffers. Samples (60 ml) for total alkalinity (TA) measurements were filtered (∼0.7 μm), poisoned with a saturated HgCl2 solution (0.5‰ final concentration), and stored at 4°C. TA was measured in triplicate (each of 3 replicate cultures) and determined by Gran acidimetric titration with a TA analyzer (AS-Alk1+, Apollo SciTech). Certified reference materials (A. Dickson, LaJolla, CA, United States) from the Scripps Institution of Oceanography were used to assure the accuracy of the TA measurement. TA and pH data were applied to CO2SYS software (Lewis et al., 1998) to calculate other carbonate chemistry parameters (Table 1).
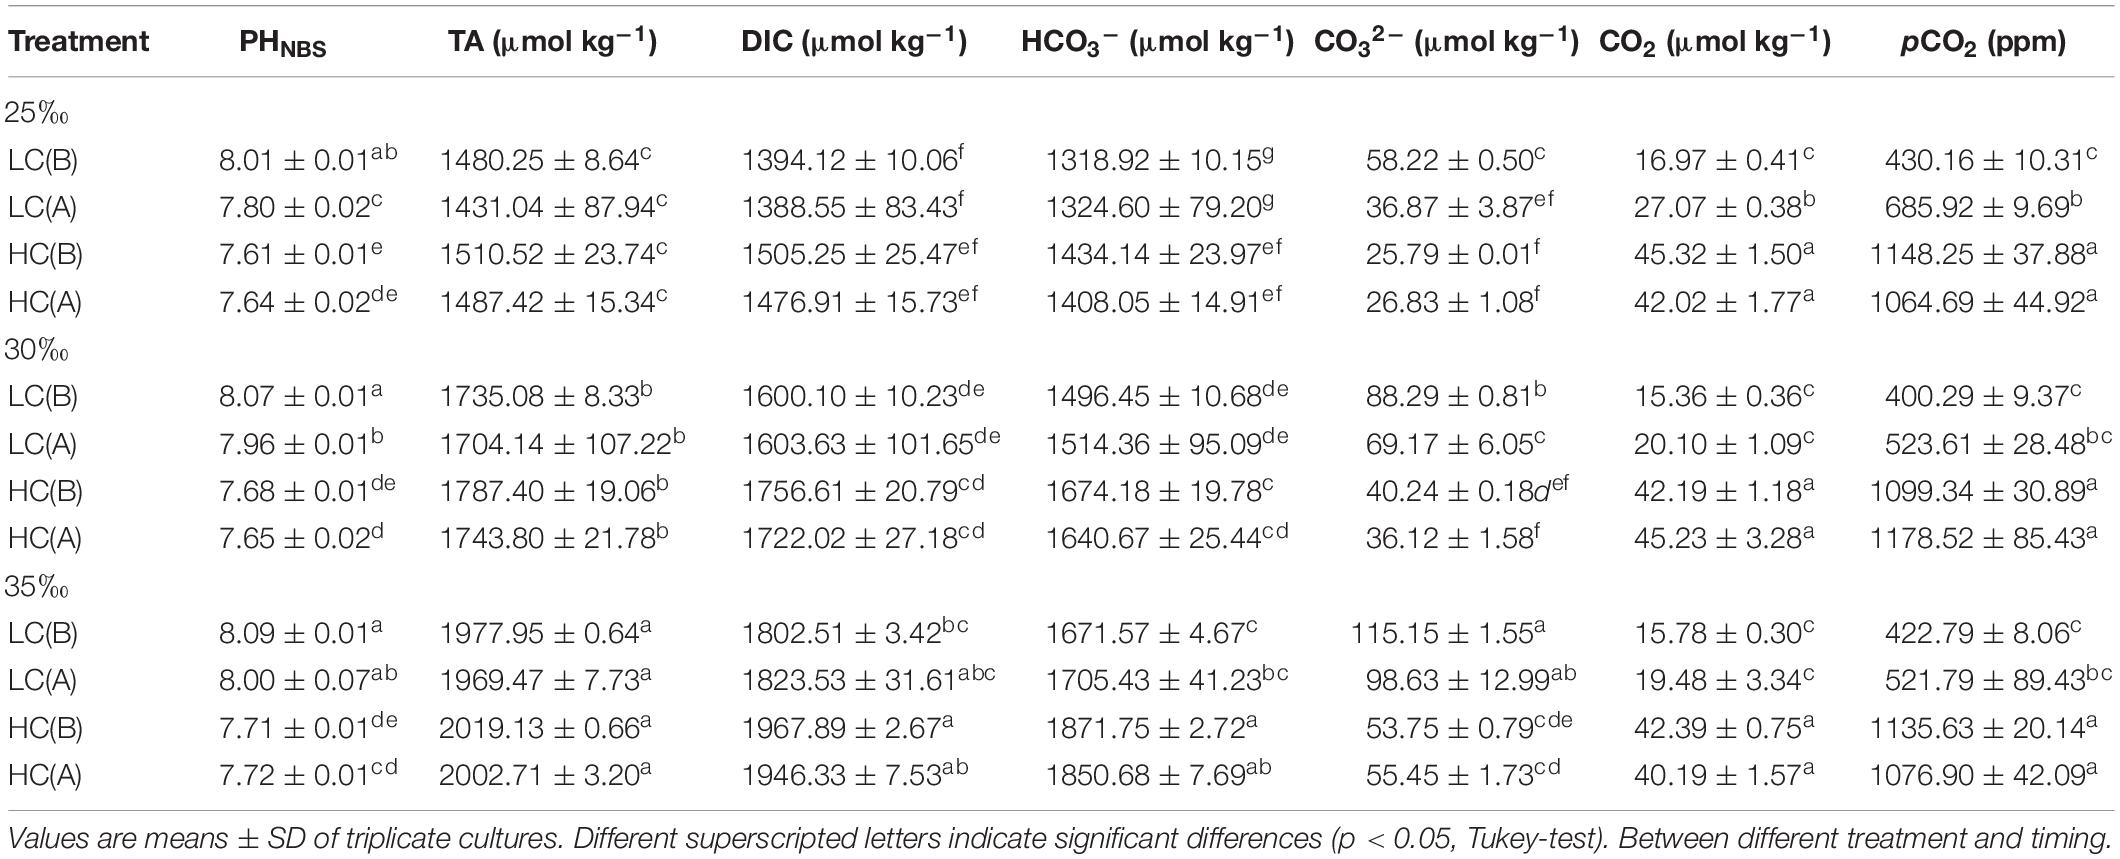
Table 1. Carbonate chemistry parameters in the cultures of E. huxleyi before (B) inoculation (already equilibrated with the ambient or elevated CO2 levels) and after (A) about 8 generations prior to determination of physiological parameters.
Specific Growth Rate and Mean Cell Size Determination
Cell concentration and mean cell size were measured, using 5 ml samples, by a Coulter Particle Count and Size Analyzer (Z2, Beckman Coulter). Specific growth rate was calculated according to the equation: μ = (lnN1 – lnN0)/(t1 – t0), in which N1 and N0 represent cell concentrations at t1 and t0, where t0 represents the beginning and t1 the end day of the cultures. The period of (t1 - t0) fell within the exponential growth phase as described above.
Chlorophyll and Carotenoid Contents
Cells (15 ml) for determination of pigment content were filtered onto GF/F filters (25 mm, Whatman) and then extracted overnight in absolute methanol at 4°C in darkness (Li et al., 2017). After centrifugation (5000 g for 10 min), the absorption values of the sample supernatants were analyzed by a UV–VIS spectrophotometer (DU800, Beckman Coulter). The concentrations of chlorophylls a and c were calculated according to Ritchie (2006):
Carotenoid concentration was determined by the equation given by Strickland and Parsons (1972):
where Ax indicates the absorbance at a wavelength x. The pigment content per cell was calculated by taking the dilution factor and cell concentration into account.
Chlorophyll a Fluorescence
The photochemical parameters were determined using a Multiple Excitation Wavelengths Chlorophyll Fluorescence Analyzer (Multi-color-PAM, Walz). Maximum and effective photochemical quantum yields were determined according to the equations of Genty et al. (1989): maximum photochemical quantum yield (Fv/Fm) = (Fm – F0)/Fm, for dark-adapted (10 min) samples; effective photochemical quantum yield ΦPSII (F′v/F′m) = (F′m – Ft)/F′m for light-adapted samples, where Fm and F′m indicate maximum chlorophyll fluorescence of dark and growth-light-adapted samples, respectively, F0 is the minimum chlorophyll fluorescence of dark-treated cells; and Ft is the steady-state chlorophyll fluorescence of light exposed samples. ΦPSII was measured under an actinic light intensity (∼240 μmol photons m–2 s–1) similar to the culture light level. The saturation pulse was set at 5000 μmol photons m–2 s–1, and lasted for 0.8 s.
Another experiment was carried out on the last day of incubations, investigating the response of cells under each treatment to high light exposure. Samples were placed in 35 ml quartz tubes wrapped with Ultraphan film 395 (UV Opak, Digefra), receiving irradiances above 395 nm (PAR). The transmission details of this cut-off foil and quartz tubes are available elsewhere (Gao et al., 2007). The tubes for fluorescence measurements were placed under a solar simulator (Sol 1200W; Dr. Hönle, Martinsried, Germany). The cells were exposed to PAR of 800 μmol photons m–2 s–1 for 48 min at 15°C (growth temperature) while maintaining the tubes in a circulating water bath (CTP-3000, Eyela) for temperature control. During the exposures, measurements of fluorescence parameters were carried out (see above). Aliquots of 2.5 ml of sample from each tube (total of 18 tubes, that is triplicates of each treatment) were taken every 3–10 min during exposure, and immediately measured (without any dark adaptation) to get the instant maximum fluorescence F′m and the steady state fluorescence Ft of the light adapted cells, and ΦPSII was calculated as described above. The rates of high light-induced damage to PSII (k, min–1) and the corresponding repair rates (r, min–1) were estimated according to Beardall et al. (2014), applying the Kok model that assumes simultaneous operation of the damage and recovery during the photoinhibitory exposures, and calculated as follows:
where Pn and P0 represent effective quantum yield values at time t (minutes) and time zero, respectively.
Determination of Photosynthetic and Calcification Rates
After the exponentially grown cells had been acclimated to 6–8 generations, the cells were collected in the middle of the photoperiod, dispensed into borosilicate bottles (20 ml) and inoculated with 5 μCi (0.185 MBq) of labeled sodium bicarbonate (Amersham). After 2 h of incubation under the same environment as the cultures, samples were immediately filtered under dim light onto Whatman GF/F glass fiber filters (25 mm), rinsed with unlabeled medium, placed in 20 mL scintillation vials, and then dried (60°C, 5 h) before counting in a liquid scintillation counter (Beckman, LS6500) with 5 ml scintillation cocktail (Perkin Elmer). In parallel, another filter with the cells was fumed with HCl overnight to expel non-fixed 14C for measurement of photosynthetic 14C fixation into organic (acid stable) material. Calculation of rates of photosynthesis took into account the different specific activities resulting from the changes in [DIC] with salinity and pCO2 as shown in Table 1. The rate of calcification of E. huxleyi was estimated as the difference between the total (inorganic and organic) and the photosynthetic carbon fixation (Paasche, 1963; Gao et al., 2009). Two samples for calcification (30‰ HC, 35‰ LC) were lost during measurements, so are not reported in the results.
Statistical Analyses
Before performing parametric tests, data were tested for homogeneity of variance (Levene test) and normality (Shapiro-Wilk test). Data were analyzed by Two-way ANOVA in SPSS software, with pCO2 (two levels), salinity (three levels) and the interaction classed as factors in the model. When p < 0.05, a Tukey test was conducted as a post hoc (One-way ANOVA) test to assess significant differences among the three levels of salinity. Since two pCO2 levels were applied, an independent-samples t-test was employed to determine differences between the pCO2 levels. Data are reported as means ± SD. A 95% confidence level was used in all analyses. Where we have discussed the percentage change in parameters we used the formula
where V represents the value of the physiological metric (such as growth rate).
Results
Most parameters, as outlined below, showed statistically significant effects of salinity and pCO2 alone. With the exceptions of growth rate, cell diameter, quantum yield of PSII (Fv/Fm) and calcification all other parameters showed significant interaction between pCO2 (OA) and salinity (Table 2).
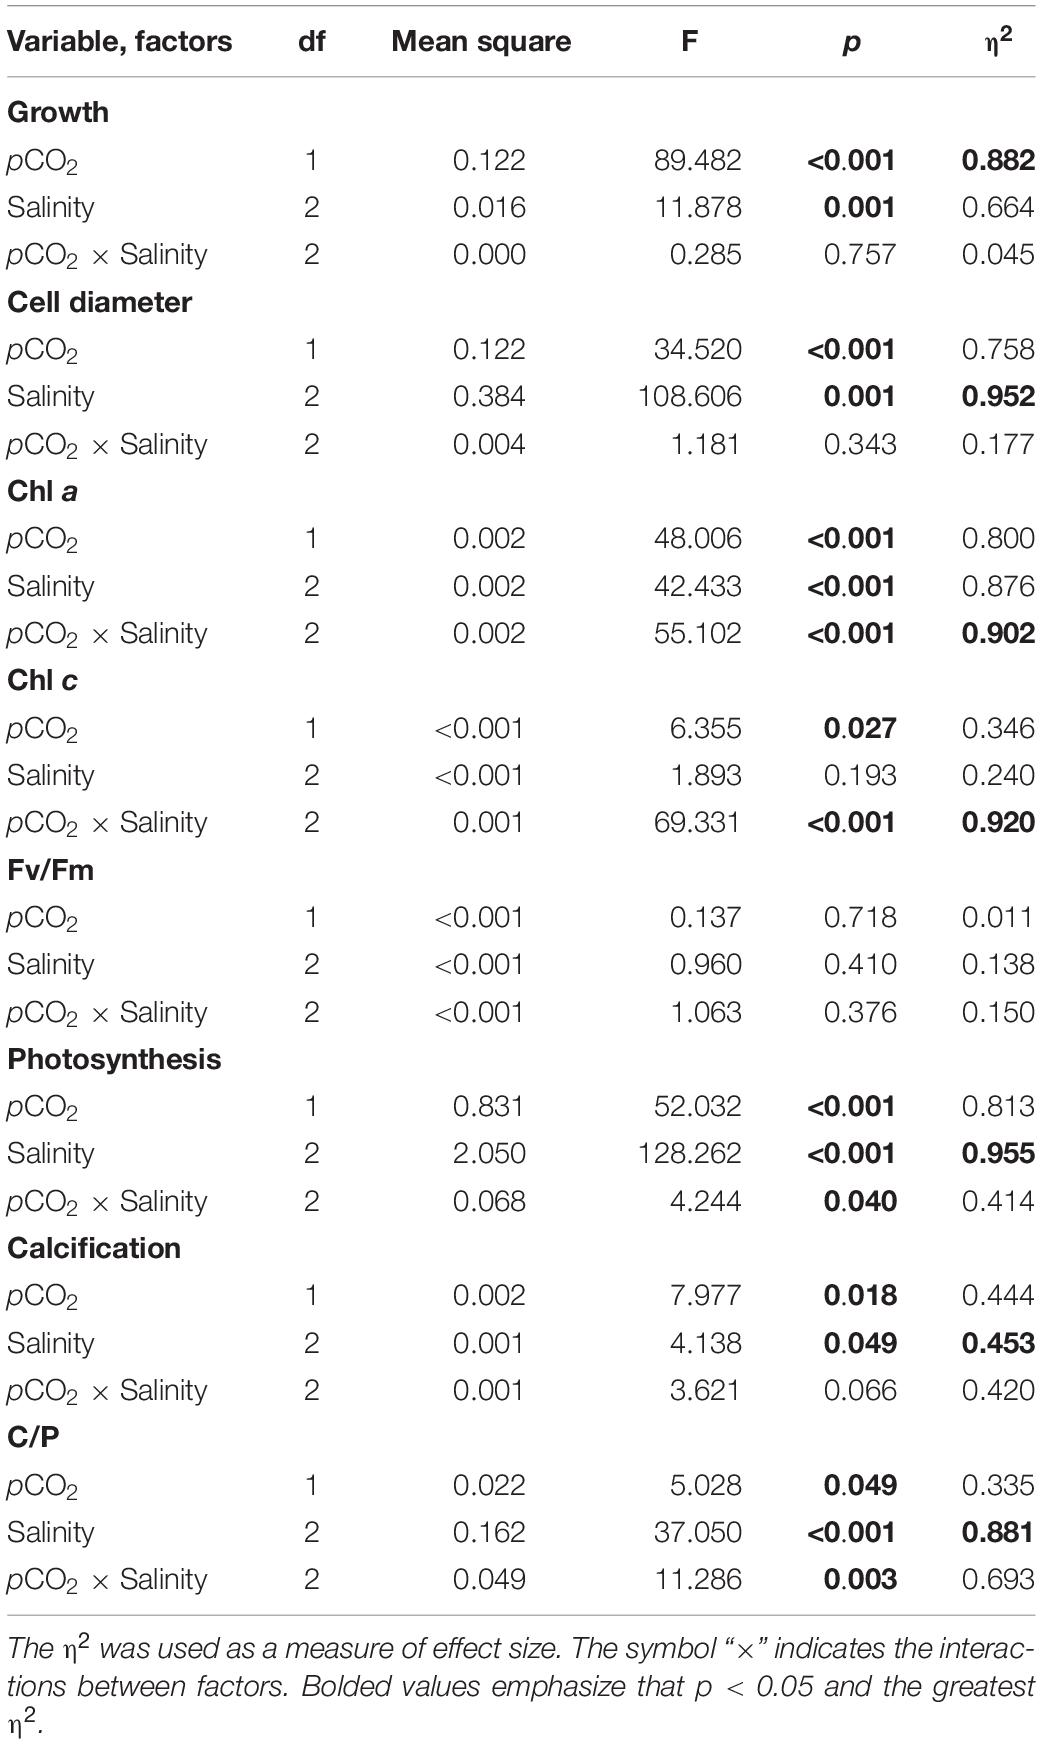
Table 2. Summary of Two-way ANOVA analyses for interactive effects of pCO2 and salinity on growth, photosynthesis, calcification, pigments, and quantum yield in E. huxleyi.
Specific Growth Rate and Cell Size
No interactive effects were found, but individual effects of salinity and pCO2 were observed on specific growth rate, and the contribution of the pCO2 effect was greatest according to the magnitude of η2 (Table 2, Two-way ANOVA, p = 0.757, p = 0.001, p < 0.001, respectively). Under LC, growth rate increased significantly with decreasing salinity (R2 = 0.88, Figure 1). There were significant differences in growth rate between cultures at 25 and 35‰, and significant differences were also found between 30 and 35‰ (Tukey-test, p = 0.009, p = 0.022, respectively), while no significant difference was found in growth rate between cultures at 25 and 30‰ under both LC and HC treatments (Figure 1A, Tukey-test, p = 0.695, p = 0.995). Under LC, compared to 35‰, treatments with salinity levels of 25 or 30‰ enhanced growth rate by 10 and 8%, respectively. Under HC, decreases in salinity had a less marked effect on growth rate though salinities of 25 and 30‰ enhanced growth rate by 9 and 10% (Tukey-test, p = 0.150, p = 0.103, respectively) compared to rates at 35‰. For all salinity treatments, OA treatment decreased the growth rate by 19, 16, and 18% (t-test, p = 0.001–0.02) compared to that of LC-grown cells under 25, 30, and 35‰, respectively.
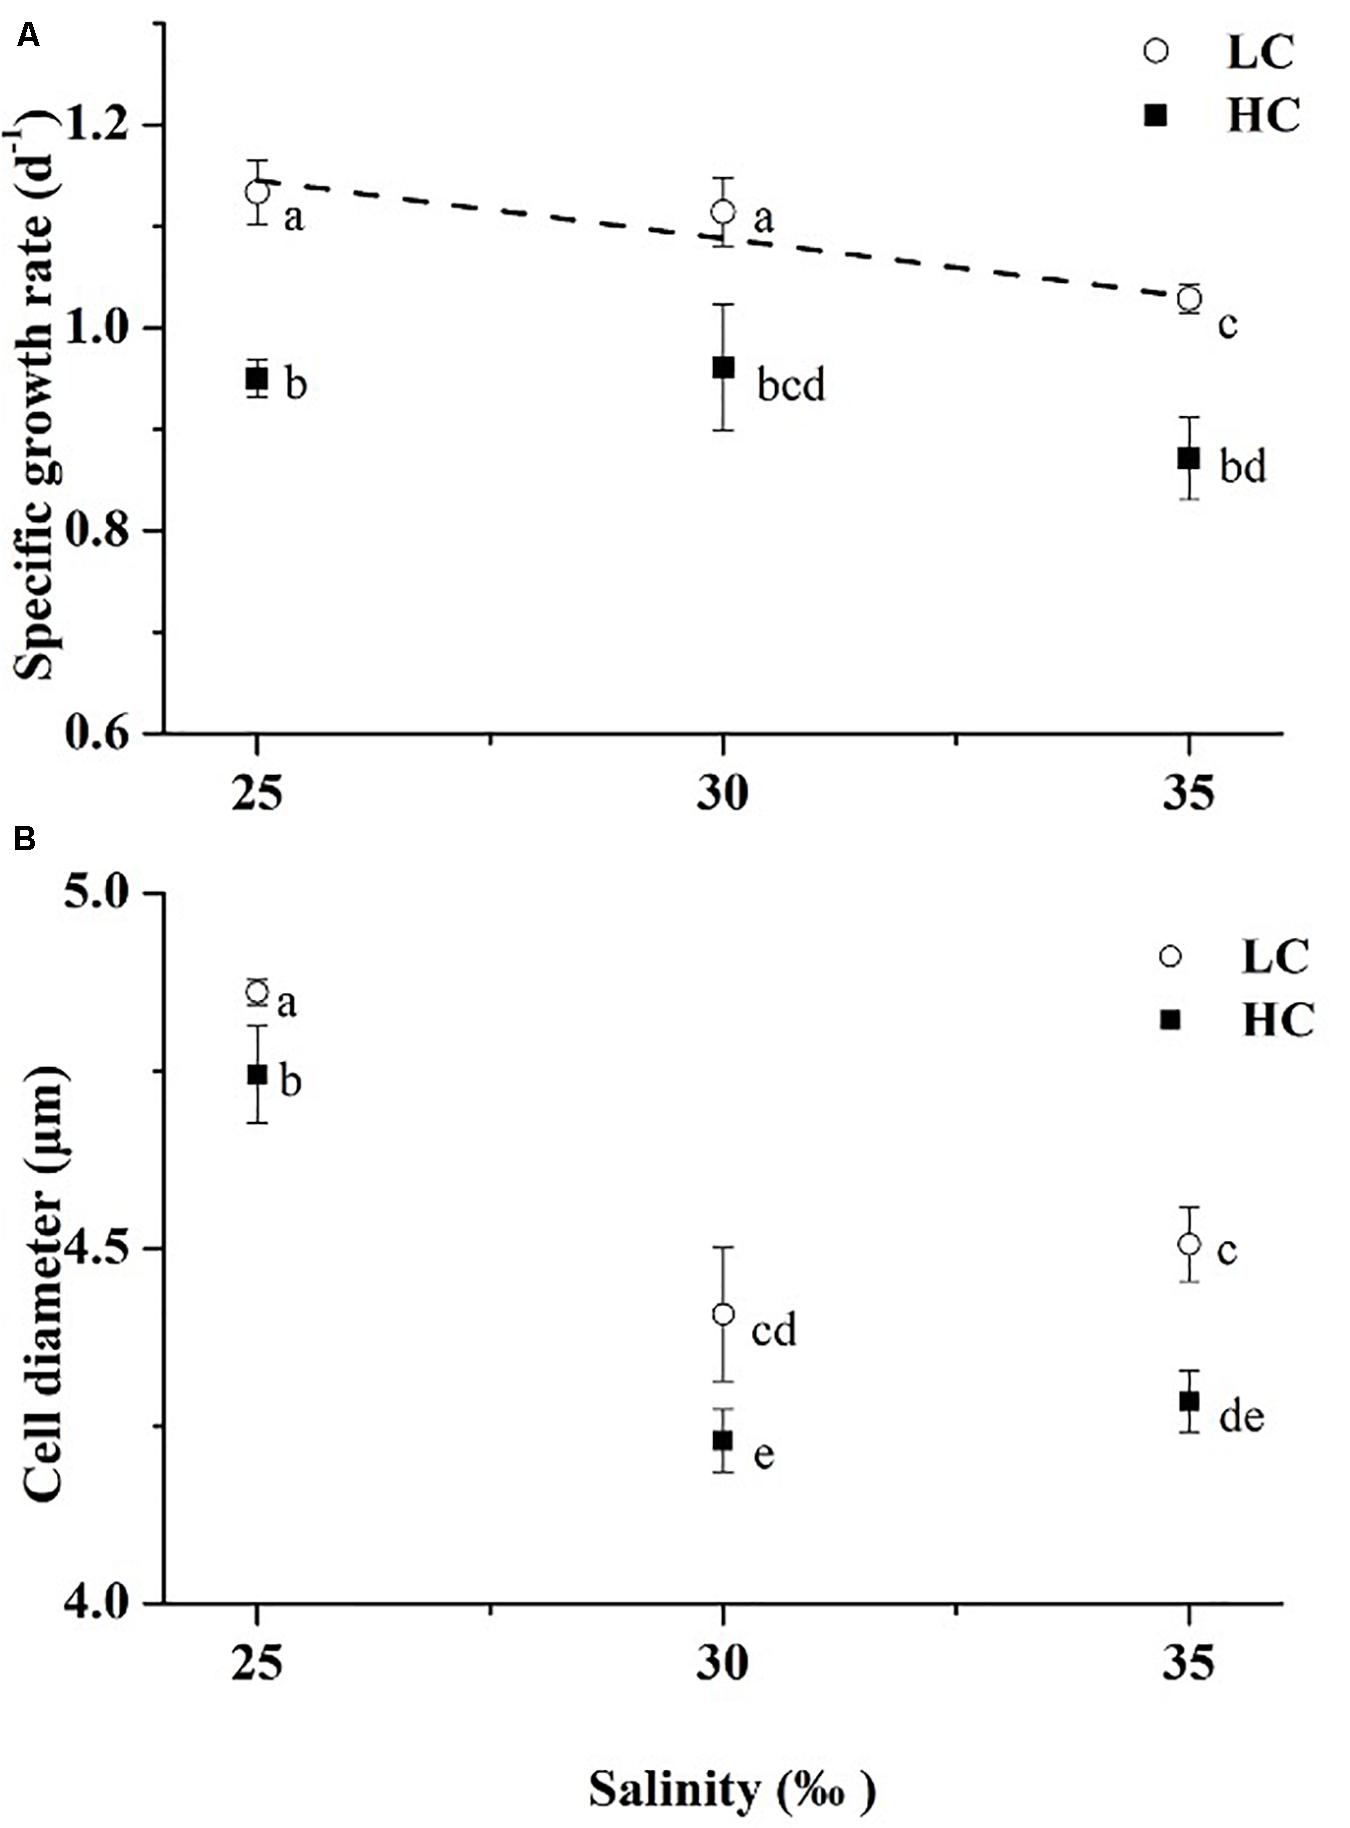
Figure 1. Specific growth rates (A) and cell diameters (B) of Emiliania huxleyi at three salinities (LC, open circles; HC, solid squares). The dashed line is the linear regression result of the growth rates under LC (y = -0.01142x + 1.43055, R2 = 0.88). Lines in this and subsequent figures are only presented in cases where there were significant linear trends of parameters with salinity. Values are means ± SD of triplicate cultures. Symbols with different lowercase letters indicate significant differences (p < 0.05) among different treatments.
Cell size (diameter) ranged from 4.20 to 4.88 μm. Mean cell sizes were largest in the 25‰ treatment and smallest at 30‰ under both LC and HC (Figure 1B). OA decreased cell size by 2, 4, and 5% (t-test, p = 0.000–0.005) compared to that of LC-grown cells under 25, 30, and 35‰, respectively. For cell size, there was no interaction between salinity and pCO2, and the salinity contributed the greatest effect according to the magnitude of η2 (Table 2, Two-way ANOVA, p = 0.343, p = 0.001, respectively).
Pigment Content
Significant interaction effects and individual effects of salinity and pCO2 on chlorophyll a content of cells were observed. The effects that contributed to the variability of chlorophyll a (in order of η2) were: pCO2 × salinity > salinity > pCO2 (Table 2, Two-way ANOVA, p < 0.001). Growth at 25‰ increased chlorophyll a content of the cells by 72% (Tukey-test, p < 0.001) compared to cells grown at 30 and 180% higher (Tukey-test, p < 0.001) than those at 35‰ under HC (Figure 2A). Under LC, there were no significant differences between values in cells at 25 and 35‰ (Tukey-test, p = 0.914), 30 and 35‰ (Tukey-test, p = 0.119) while growth at 30‰ increased the chlorophyll a content of cells by 19% (Tukey-test, p = 0.071) relative to 25‰. In the 25‰ treatment, HC increased the chlorophyll a content of cells by 28% (t-test, p = 0.040) relative to that of LC cells. However, chlorophyll a content was higher in the LC treatment than HC under both 30 and 35‰. LC increased chlorophyll a content by 60% (t-test, p < 0.001) compared to HC under 30‰ and was 132% higher (t-test, p < 0.001) than in the HC treatment under 35‰.
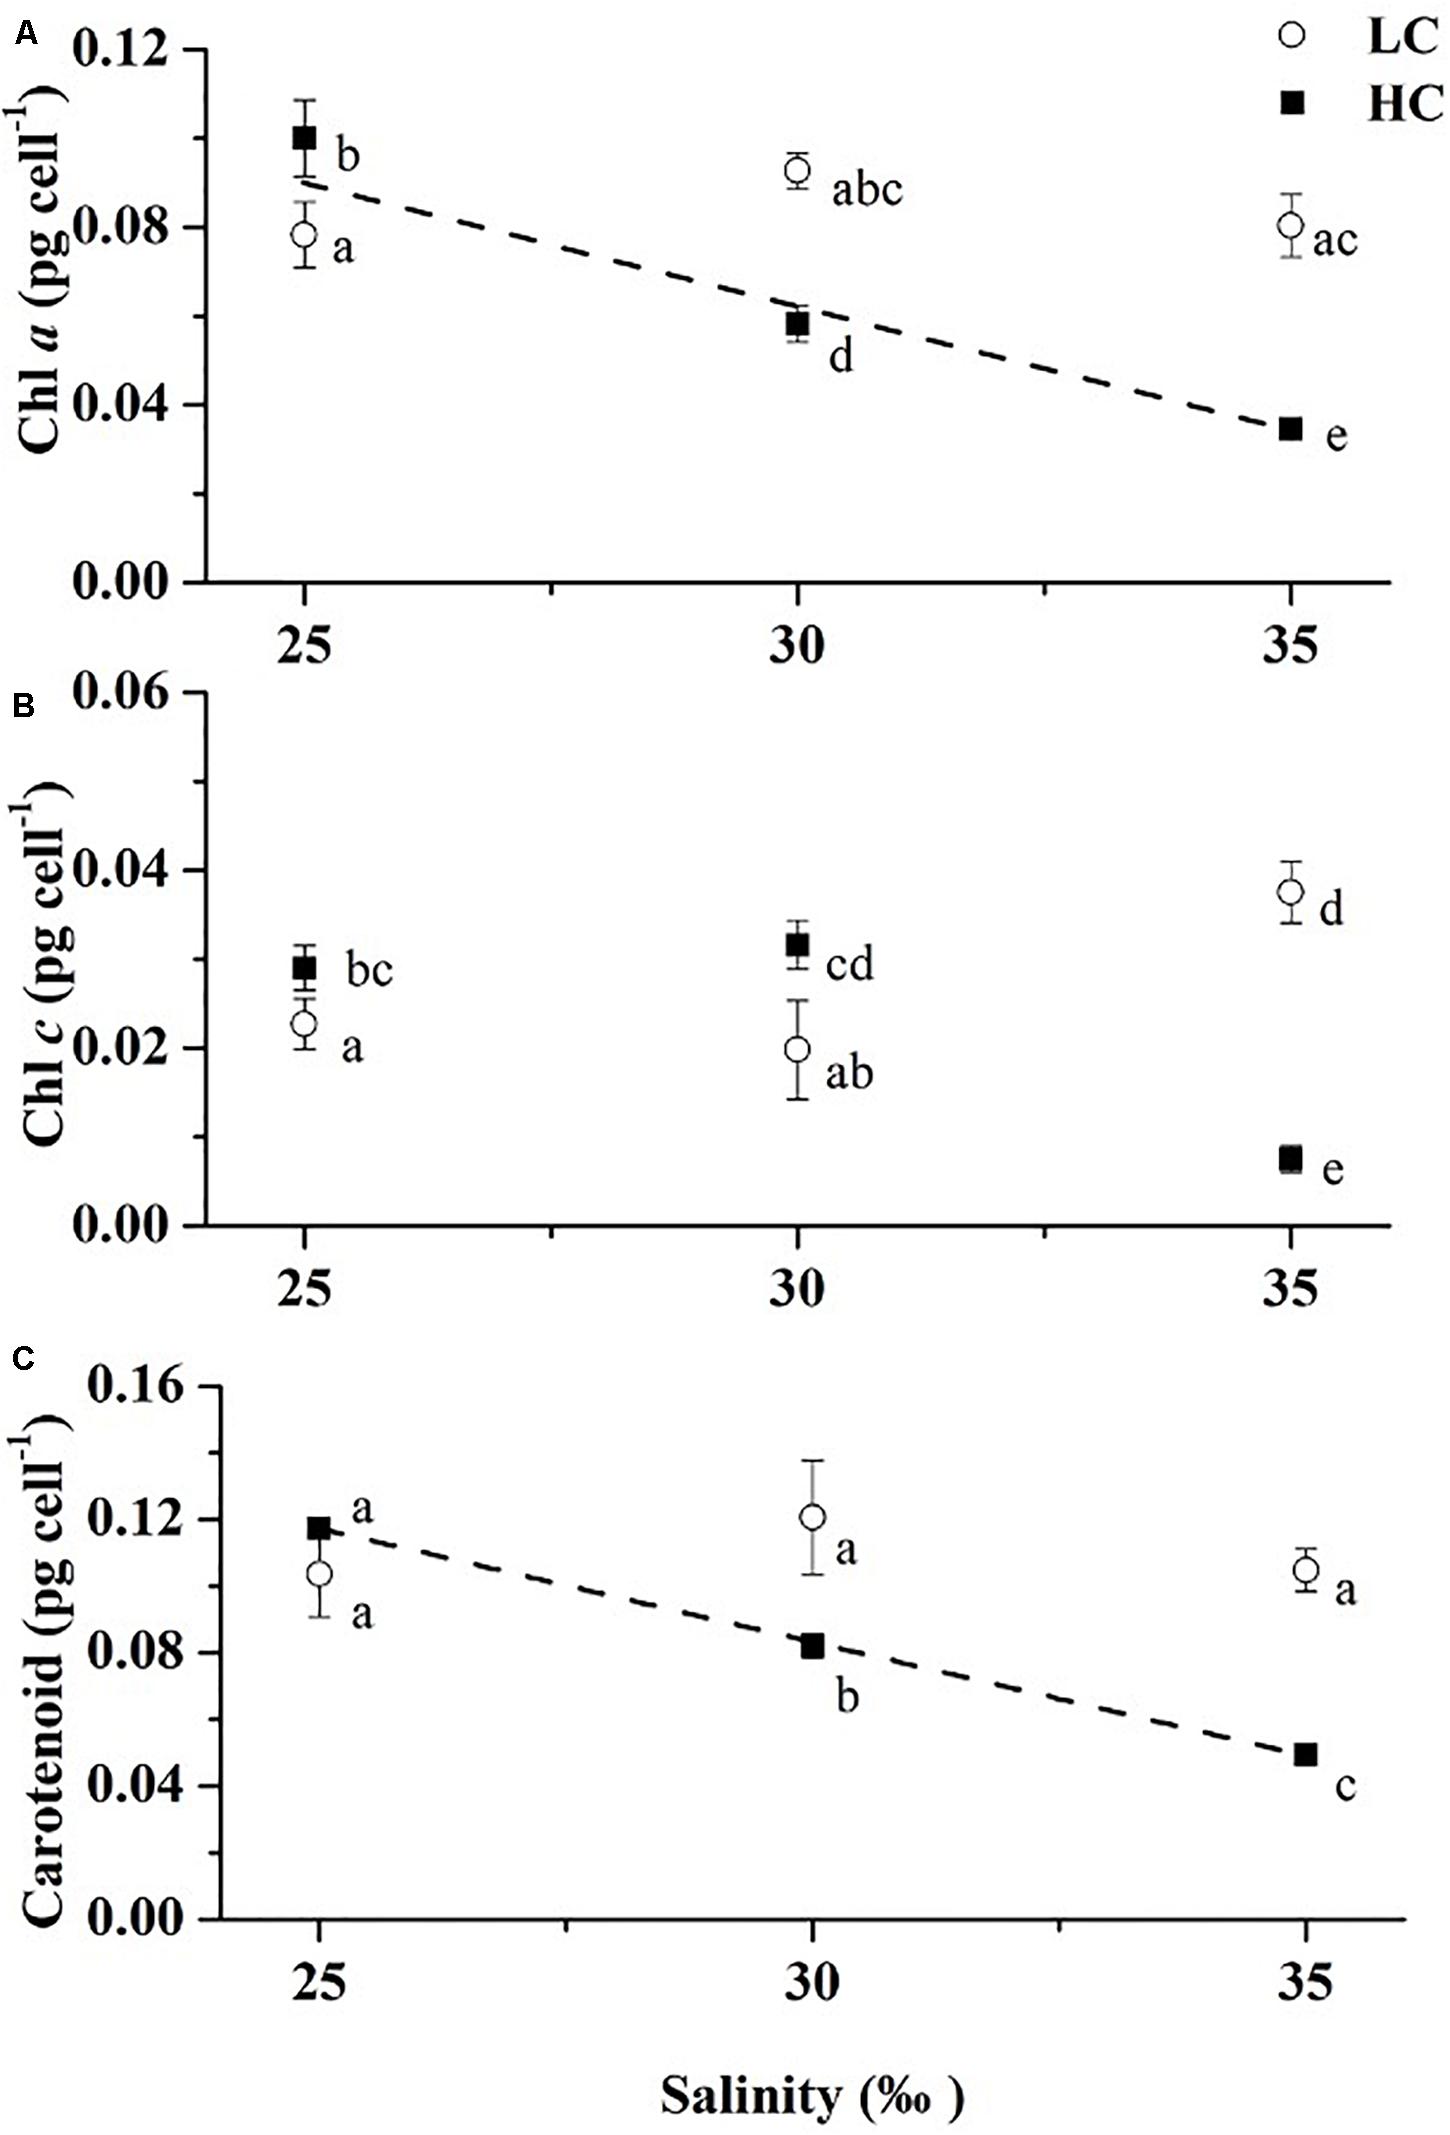
Figure 2. Chl a (A), Chl c (B), and Carotenoids (C) contents of Emiliania huxleyi at three salinities (LC, open circles; HC, solid squares). Two dashed lines are the linear regression results of the chlorophyll a and carotenoids contents under HC, respectively (y = -0.00562x + 0.23105, R2 = 0.94; y = -0.00681x + 0.28755, R2 = 0.99). Values are means ± SD of triplicate cultures. Symbols with different lowercase letters indicate significant differences (p < 0.05) among different treatments.
The trend of carotenoid content of cells was same as for chlorophyll a (Figure 2C) in that the value was higher in the LC treatment than at HC under 30 and 35‰, although there was no significant difference between LC and HC under 25‰ (t-test, p = 0.144). There were also no significant differences among the three salinity treatments under LC (Tukey-test, p = 0.159–0.920). Under HC, the carotenoid content increased at the low salinity, by 43% (Tukey-test, p < 0.001) and by 137% (Tukey-test, p < 0.001) in the 25‰ treatment relative to 30 and 35‰, respectively.
Partial pressure of CO2 (pCO2) and the interaction with salinity significantly impacted chlorophyll c, and the contribution of the interaction effect was predominant according to the magnitude of η2 (Table 2, Two-way ANOVA, p = 0.027, p < 0.001). Though no significant impact of salinity was observed on chlorophyll c, there were significant differences in chlorophyll c content between cells grown at 25 and 35‰, and between 30 and 35‰ under both LC (Tukey-test, p = 0.011, p = 0.005) and HC (Tukey-test, p < 0.001, p < 0.001), while no significant difference was found between cells grown at 25 and 30‰ under both pCO2 levels (Figure 2B, Tukey-test, p = 0.680, p = 0.400). Among the three salinity levels, only in the 35‰ treatment could a higher chlorophyll c content under LC than HC be observed.
Chlorophyll a Fluorescence
The maximal photochemical quantum yields varied little among all treatments, ranging from 0.53 ± 0.01 to 0.55 ± 0.02 (Figure 3A). This suggests, inter alia, that nutrient levels were not depleted during the experimental period, as shown indirectly through the steady and relatively high maximal photochemical quantum yields, a parameter which is often applied to estimate nutrient status in the ocean (Falkowski et al., 2004). Elevated pCO2 scarcely influenced effective photochemical quantum yields under all salinity treatments (Figure 3B). The only exception was that ΦPSII in HC cells decreased by 17% (t-test, p < 0.001) relative to that of LC cells under 25‰. Under LC, 25‰ grown cells showed stimulated values of ΦPSII by 33% (Tukey-test, p = 0.003) and 18% (Tukey-test, p = 0.026) compared to cells in 30 and 35‰, respectively. Under HC, though there was no significant difference among the three salinity treatments (Tukey-test, p = 0.368–0.975), growth at 25‰ slightly increased ΦPSII by 12% relative to the 35‰ treatment (Figure 3B). Two-way ANOVA revealed no significant interaction between pCO2 and salinity on the maximal photochemical quantum yield (Table 2, Two-way ANOVA, p = 0.376).
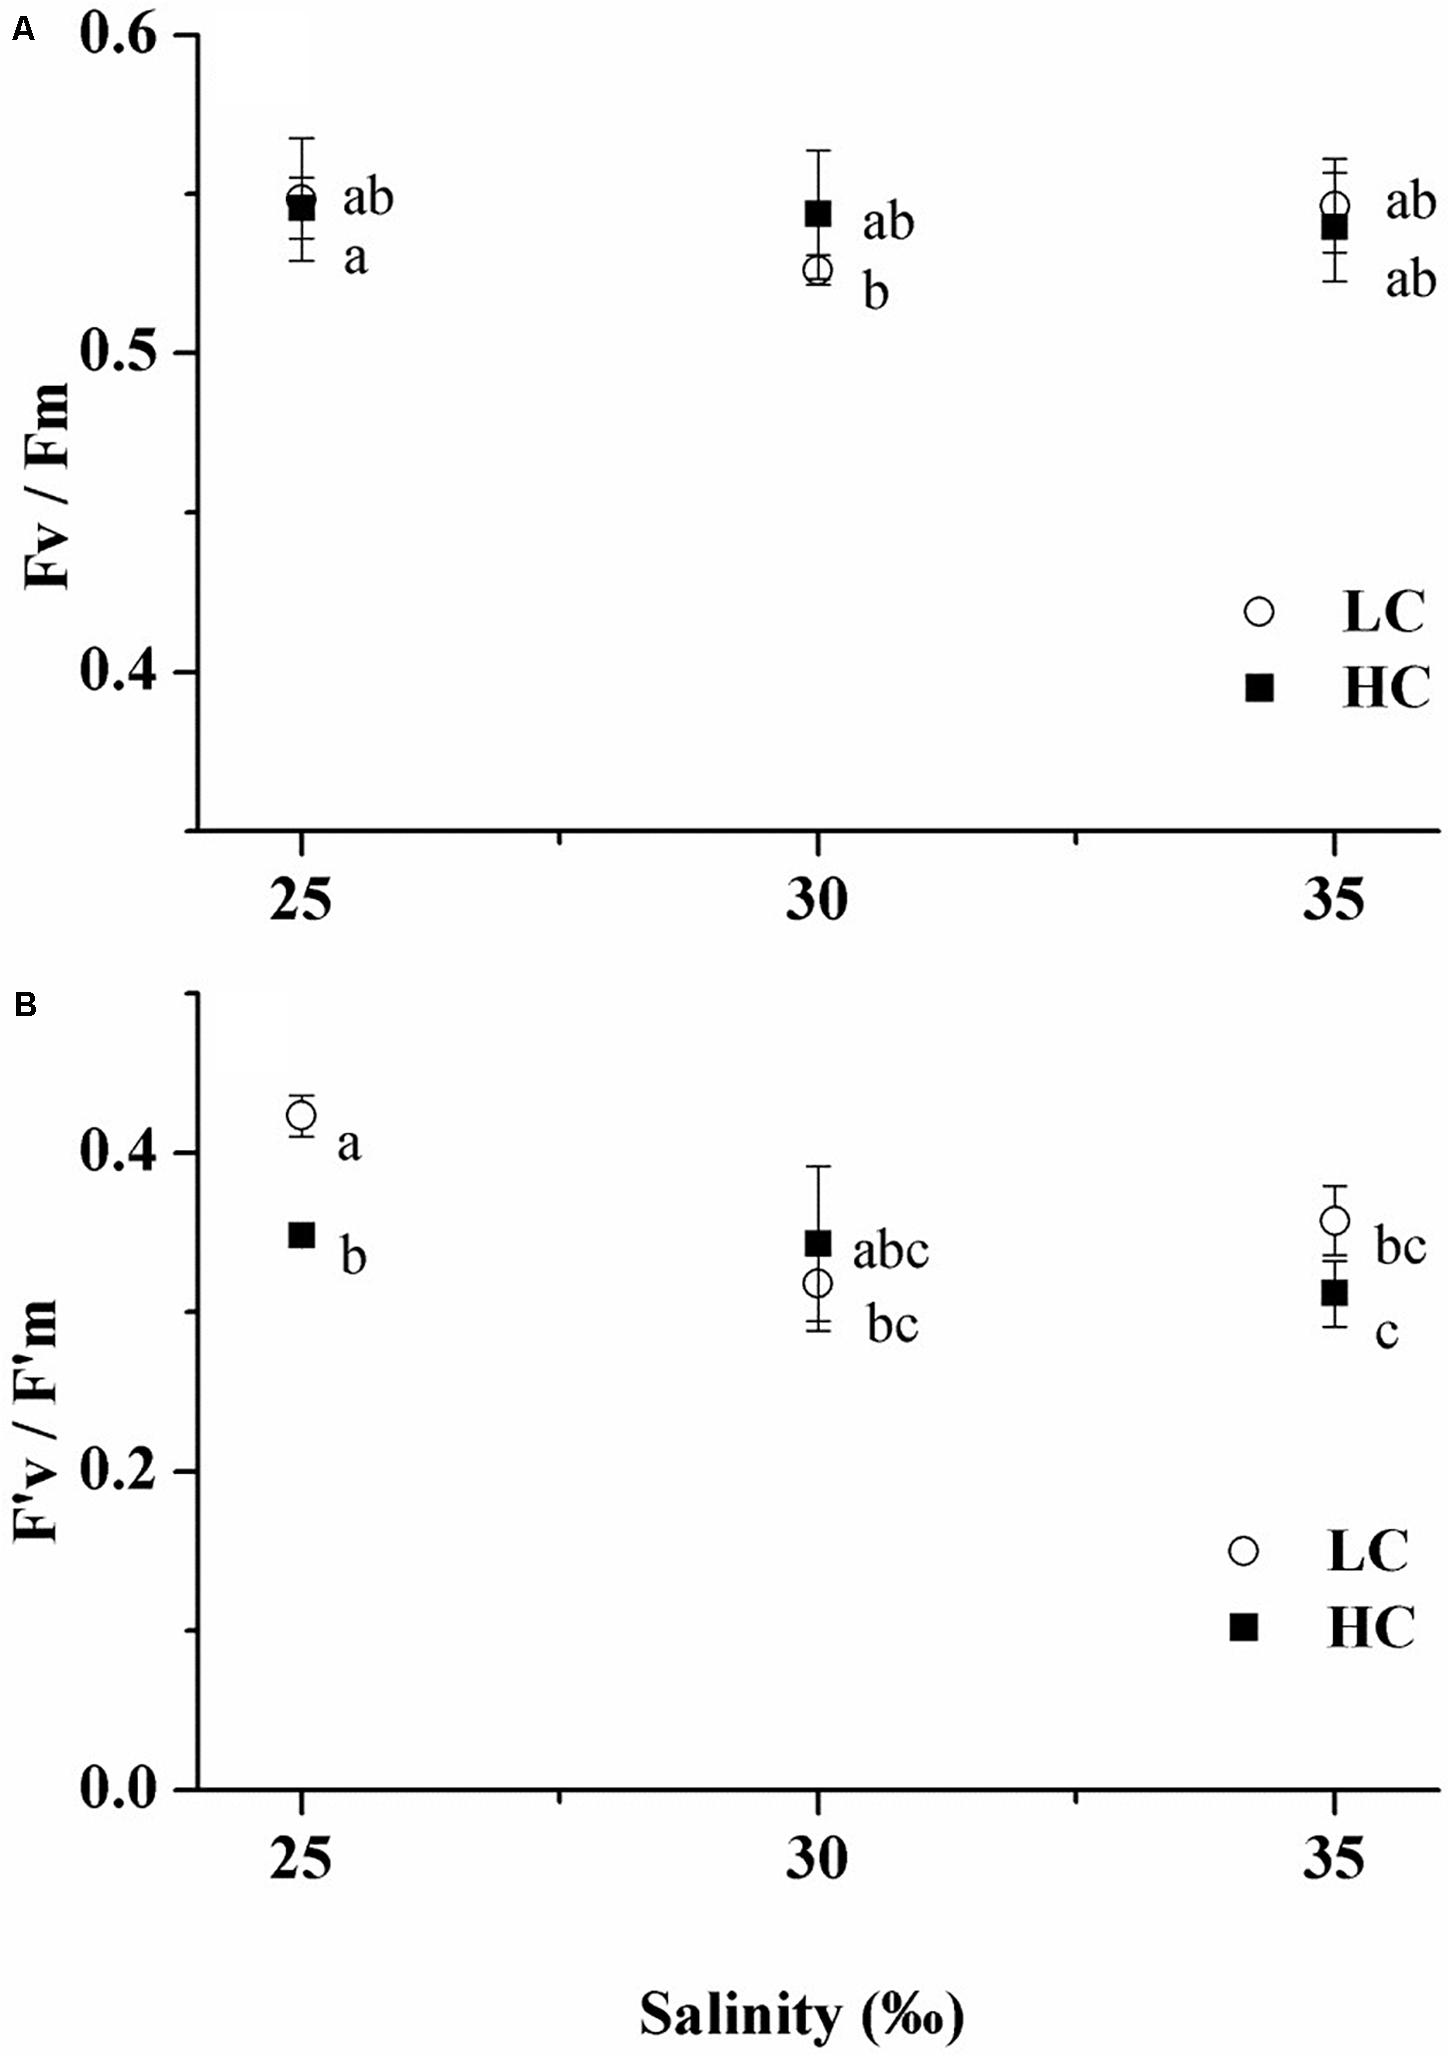
Figure 3. Maximum (A) and effective photochemical quantum yields (B) of Emiliania huxleyi at three salinities (LC, open circles; HC, solid squares). Values are means ± SD of triplicate cultures. Symbols with different lowercase letters indicate significant differences (p < 0.05) among different treatments.
Photosynthesis and Calcification
Photosynthetic carbon fixation increased with decreasing salinity (Figure 4A). Cells grown under 25‰ had a photosynthesis rate 1.8 × higher than in 35‰ under LC (Tukey-test, p < 0.001) and 2.7 × higher (Tukey-test, p = 0.003) than in 30‰ under HC. OA generally decreased photosynthetic carbon fixation with the only exception being that no significant difference was found between LC and HC under 30‰ (t-test, p = 0.086) although the mean value of the former was still 27% higher (Figure 4A). OA decreased photosynthetic carbon fixation by 33, 21, and 48% (t-test, p = 0.003–0.086) compared to that of LC-grown cells under 25, 30, and 35‰, respectively. Two-way ANOVA revealed a significant interaction between pCO2 and salinity, while the salinity effect was predominant (Table 2, Two-way ANOVA, p = 0.040, p < 0.001).
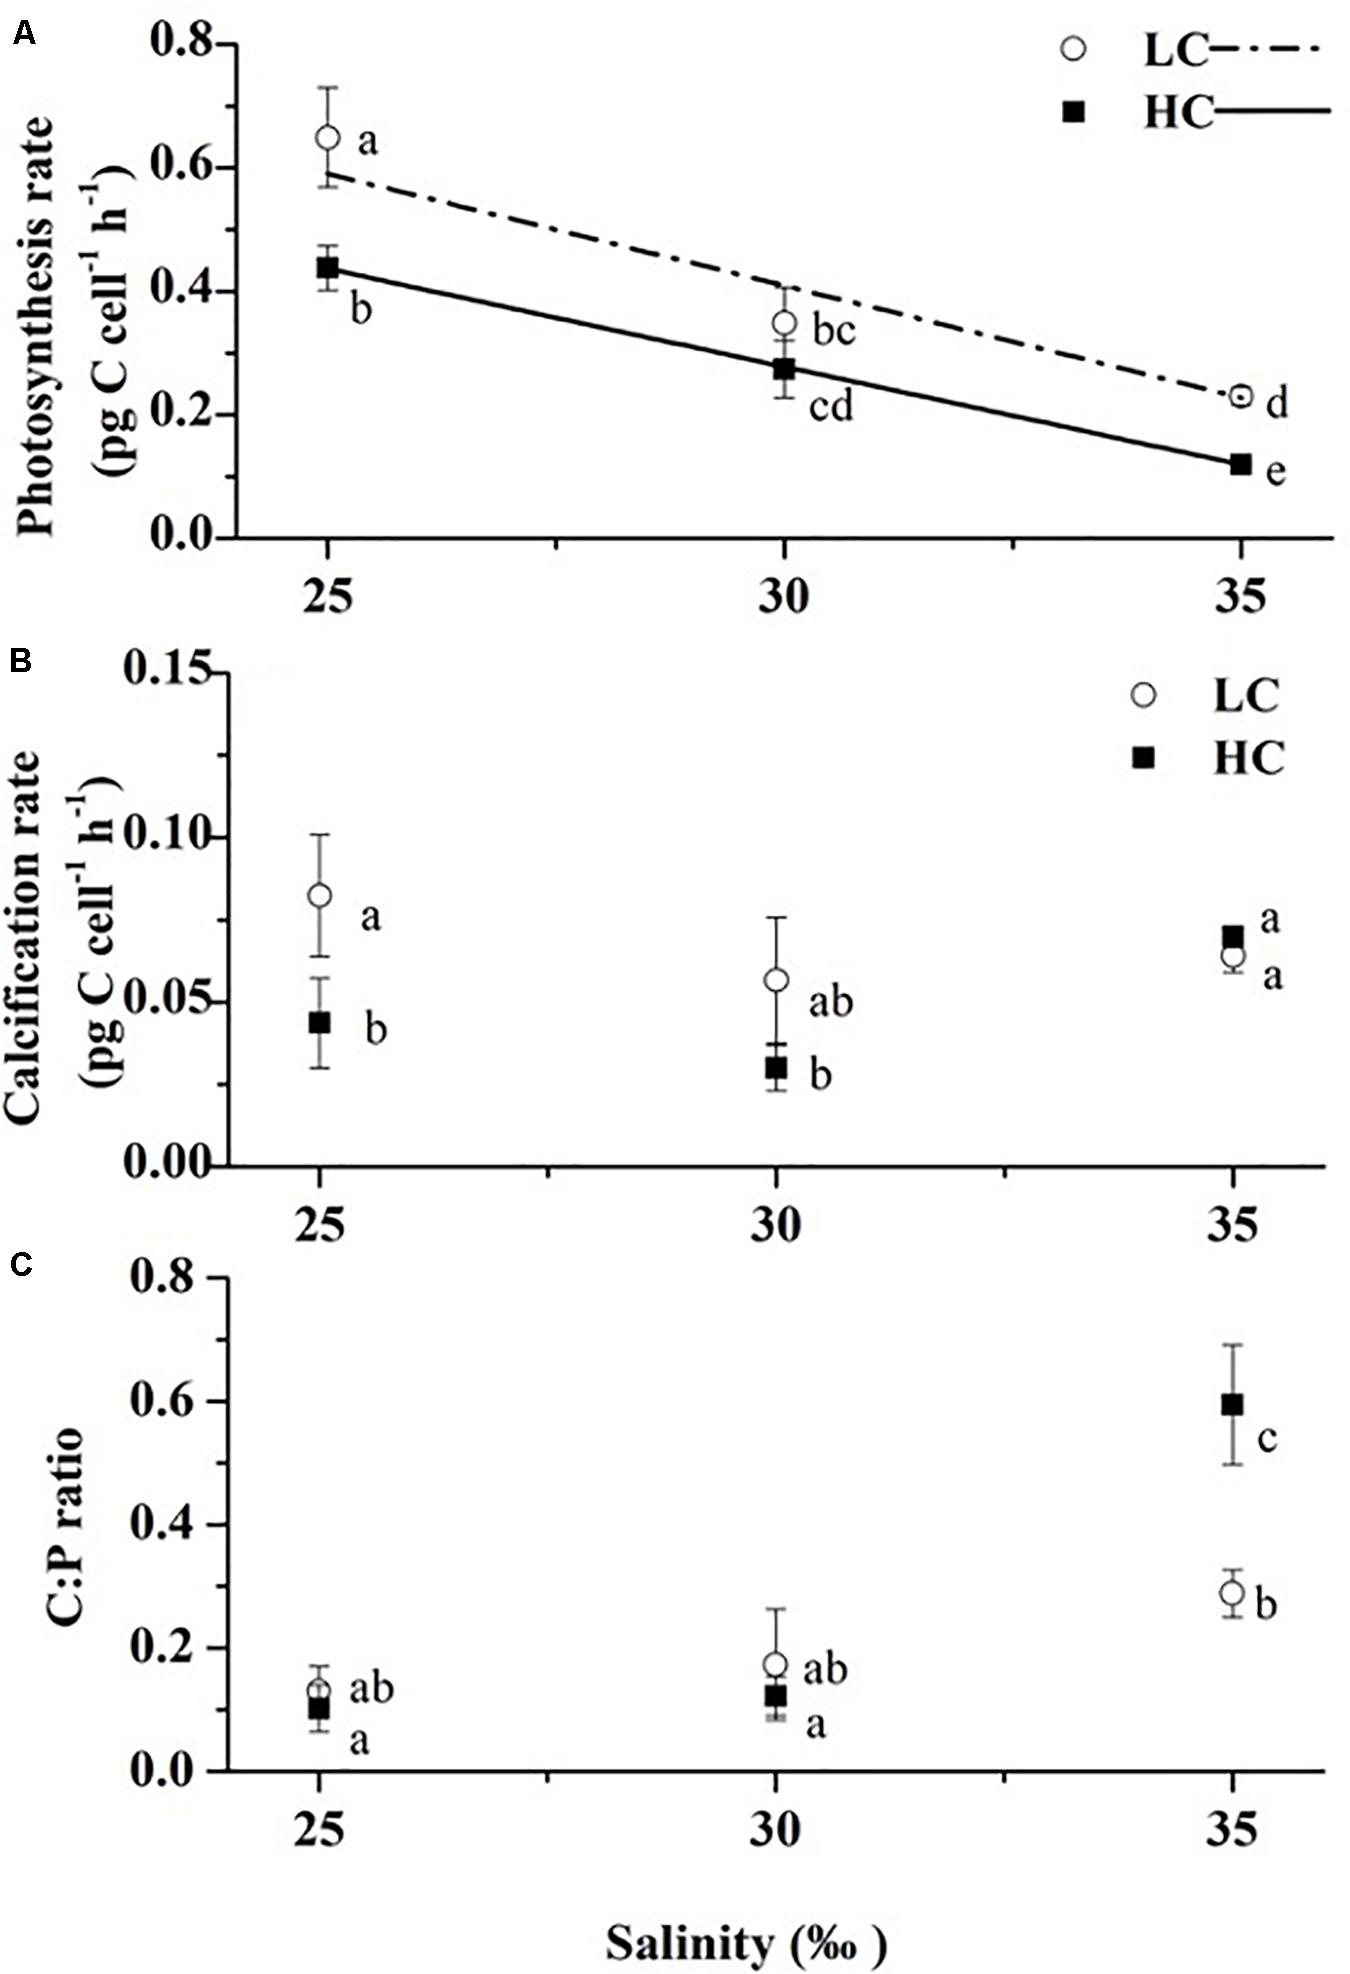
Figure 4. Photosynthetic rates (A), calcification rates (B) at 6 h after the onset of light and calcification to photosynthesis ratio, C: P (C) of three salinities (LC, open circles; HC, solid squares). The dash-dotted line and solid line are the linear regression results of the photosynthetic rates under LC and HC, respectively (y = -0.03624x + 1.49612, R2 = 0.89; y = -0.03173x + 1.22979, R2 = 0.99). Values are means ± SD of triplicate cultures. Symbols with different lowercase letters indicate significant differences (p < 0.05) among different treatments.
The calcification rates ranged from 0.03 ± 0.01 to 0.08 ± 0.02 pg C cell–1 h–1. No significant differences were found among all salinity treatments under LC (Figure 4B, Tukey-test, p = 0.249–0.886). In contrast, under HC, growth at 35‰ stimulated the calcification rates of cells by 60% (Tukey-test, p = 0.042) and by 1.3 × (Tukey-test, p = 0.013) compared to values in cells grown at 25 and 30‰, respectively. An effect of OA was not found under the 35‰ treatment, while it decreased calcification rates by 47% under 25‰ (t-test, p = 0.044) and 30‰, although there were no significant differences between LC and HC under the 30‰ treatment (t-test, p = 0.170). No significant interaction effects of salinity and pCO2 on the calcification rates were found, though individual effects of salinity and pCO2 were significant (Table 2, Two-way ANOVA, p = 0.066, p = 0.049, p = 0.018, respectively). The contribution of the salinity effect was maximal according to the magnitude of η2 (Table 2).
Significant interaction effects and individual effects of salinity and pCO2 were found in the ratio of calcification (C) to photosynthesis (P) (Table 2, Two-way ANOVA, p < 0.05). The effects that contributed to the variability of C:P (in order of η2) were: salinity > salinity x pCO2 > pCO2 (Table 2). Seawater acidification and high salinity acted synergistically to stimulate the C:P ratio, thus resulting in the highest value under the 35‰ HC treatment. Salinity seemed to play a more important role as it has the largest η2 and no significant differences between LC and HC were found, the only exception being under 35‰ where OA increased the ratio by 103% (t-test, p = 0.027). With increasing salinity, the C:P ratio increased regardless of pCO2 levels. Under LC, the C:P value of cells grown under 35‰ was 1.2 × (Tukey-test, p = 0.095) and by 67% higher (Tukey-test, p = 0.218) than at 25 and 30‰, respectively, with the equivalent values being 4.8 × (Tukey-test, p = 0.001) and 3.9 × (Tukey-test, p = 0.001) higher under HC. However, given the minimal effects of salinity on calcification rates, increases in C:P are mostly attributable to lower photosynthetic rates at higher salinities.
Photochemical Responses
When exposed to high light (800 μmol photons m–2 s–1), the effective photochemical quantum yield ΦPSII decreased significantly during the first 0–15 min of exposure in all salinity/pCO2 treatments (Figure 5); after this period, ΦPSII remained more or less constant. Regardless of pCO2 levels, the samples grown under 25‰ had a smaller decrease in ΦPSII than cells grown at the higher salinities.
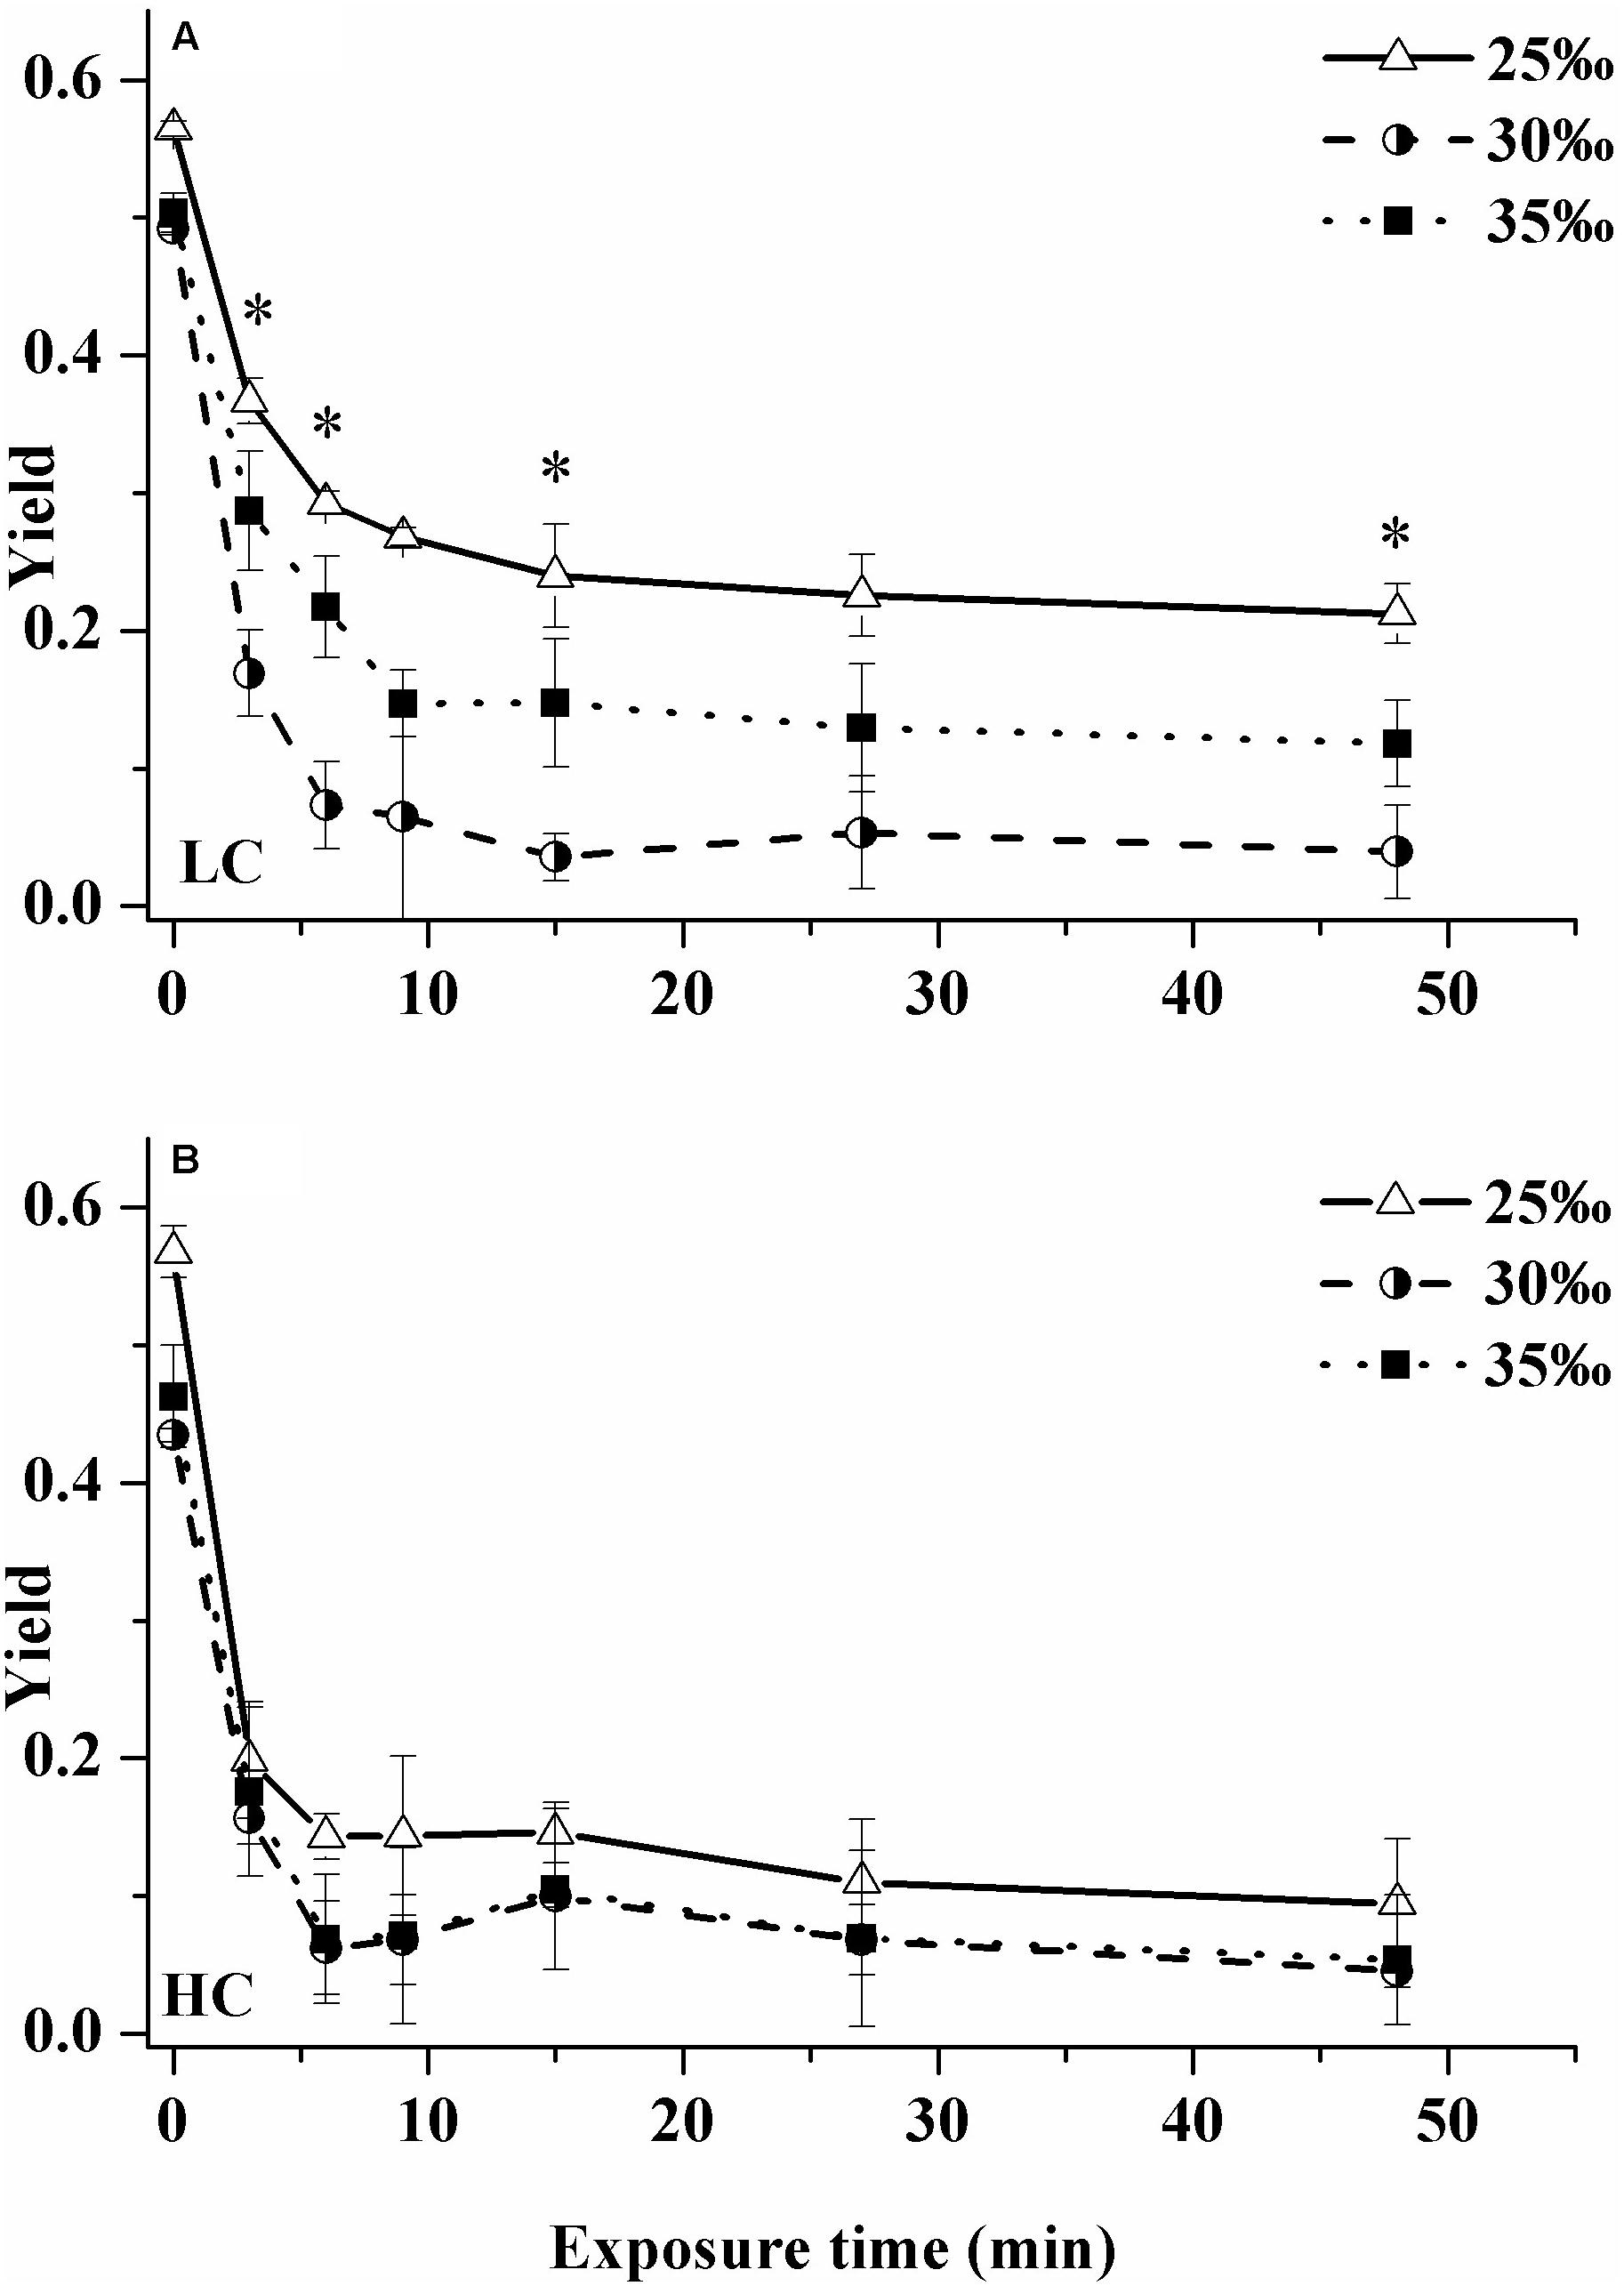
Figure 5. Changes in effective photochemical quantum yield of cells grown under ambient (400 μatm, LC, A) and elevated CO2 (1000 μatm, HC, B) when exposed to solar radiation for 48 min (800 μmol photons m–2 s–1) under three salinity treatments: 25‰ (open triangles), 30‰ (half solid circles) and 35‰ (solid squares). Values are means ± SD of triplicate cultures. Asterisks represent significant differences (p < 0.05) among three salinity treatments.
This trend was especially clear under LC (Figure 5A). During the whole exposure process, the ΦPSII value of the cells under the 25‰ treatment was highest, with the lowest value reached being ca. 0.21 after 48 min exposure, which was 4.4 × (Tukey-test, p = 0.004) and 80% (Tukey-test, p = 0.045) higher than that of cells from 30 and 35‰ treatments, respectively. In contrast, ΦPSII of the 30‰ treatment was always lowest during the whole exposure process.
In the HC-grown cells, ΦPSII declined much faster compared to that in the LC-grown cells except that at some time points, the value of ΦPSII was higher in HC-grown cells under the 30‰ treatment (Figure 5B). No significant differences in ΦPSII among three salinity treatments were found during the whole exposure (Figure 5B). Nonetheless, ΦPSII of the 25‰ treatment was still highest during the whole exposure process, with the lowest value reached being ca. 0.1.
After cells were exposed to short-term acute exposures to elevated levels of visible solar radiation, there was a significant difference in repair rates among the three salinity treatments under LC (Figure 6A). The highest r values were observed under the 25‰ treatment, which were 4.3 × (Tukey-test, p = 0.007) and 72% higher (Tukey-test, p = 0.100) than those of 30 and 35‰ treatments while no significant differences were observed under HC (Tukey-test, p = 0.175–0.981). No significant differences in damage rates, k, were observed under HC among three salinity treatments (Tukey-test, p = 0.135–0.986) (Figure 6B). While under LC, k-values were highest in the 30‰ treatment and reached about 0.4 min–1, a value which was 1.3 × (Tukey-test, p = 0.001) and 91% higher (Tukey-test, p = 0.003) than those of the 25 and 35‰ treatments, respectively.
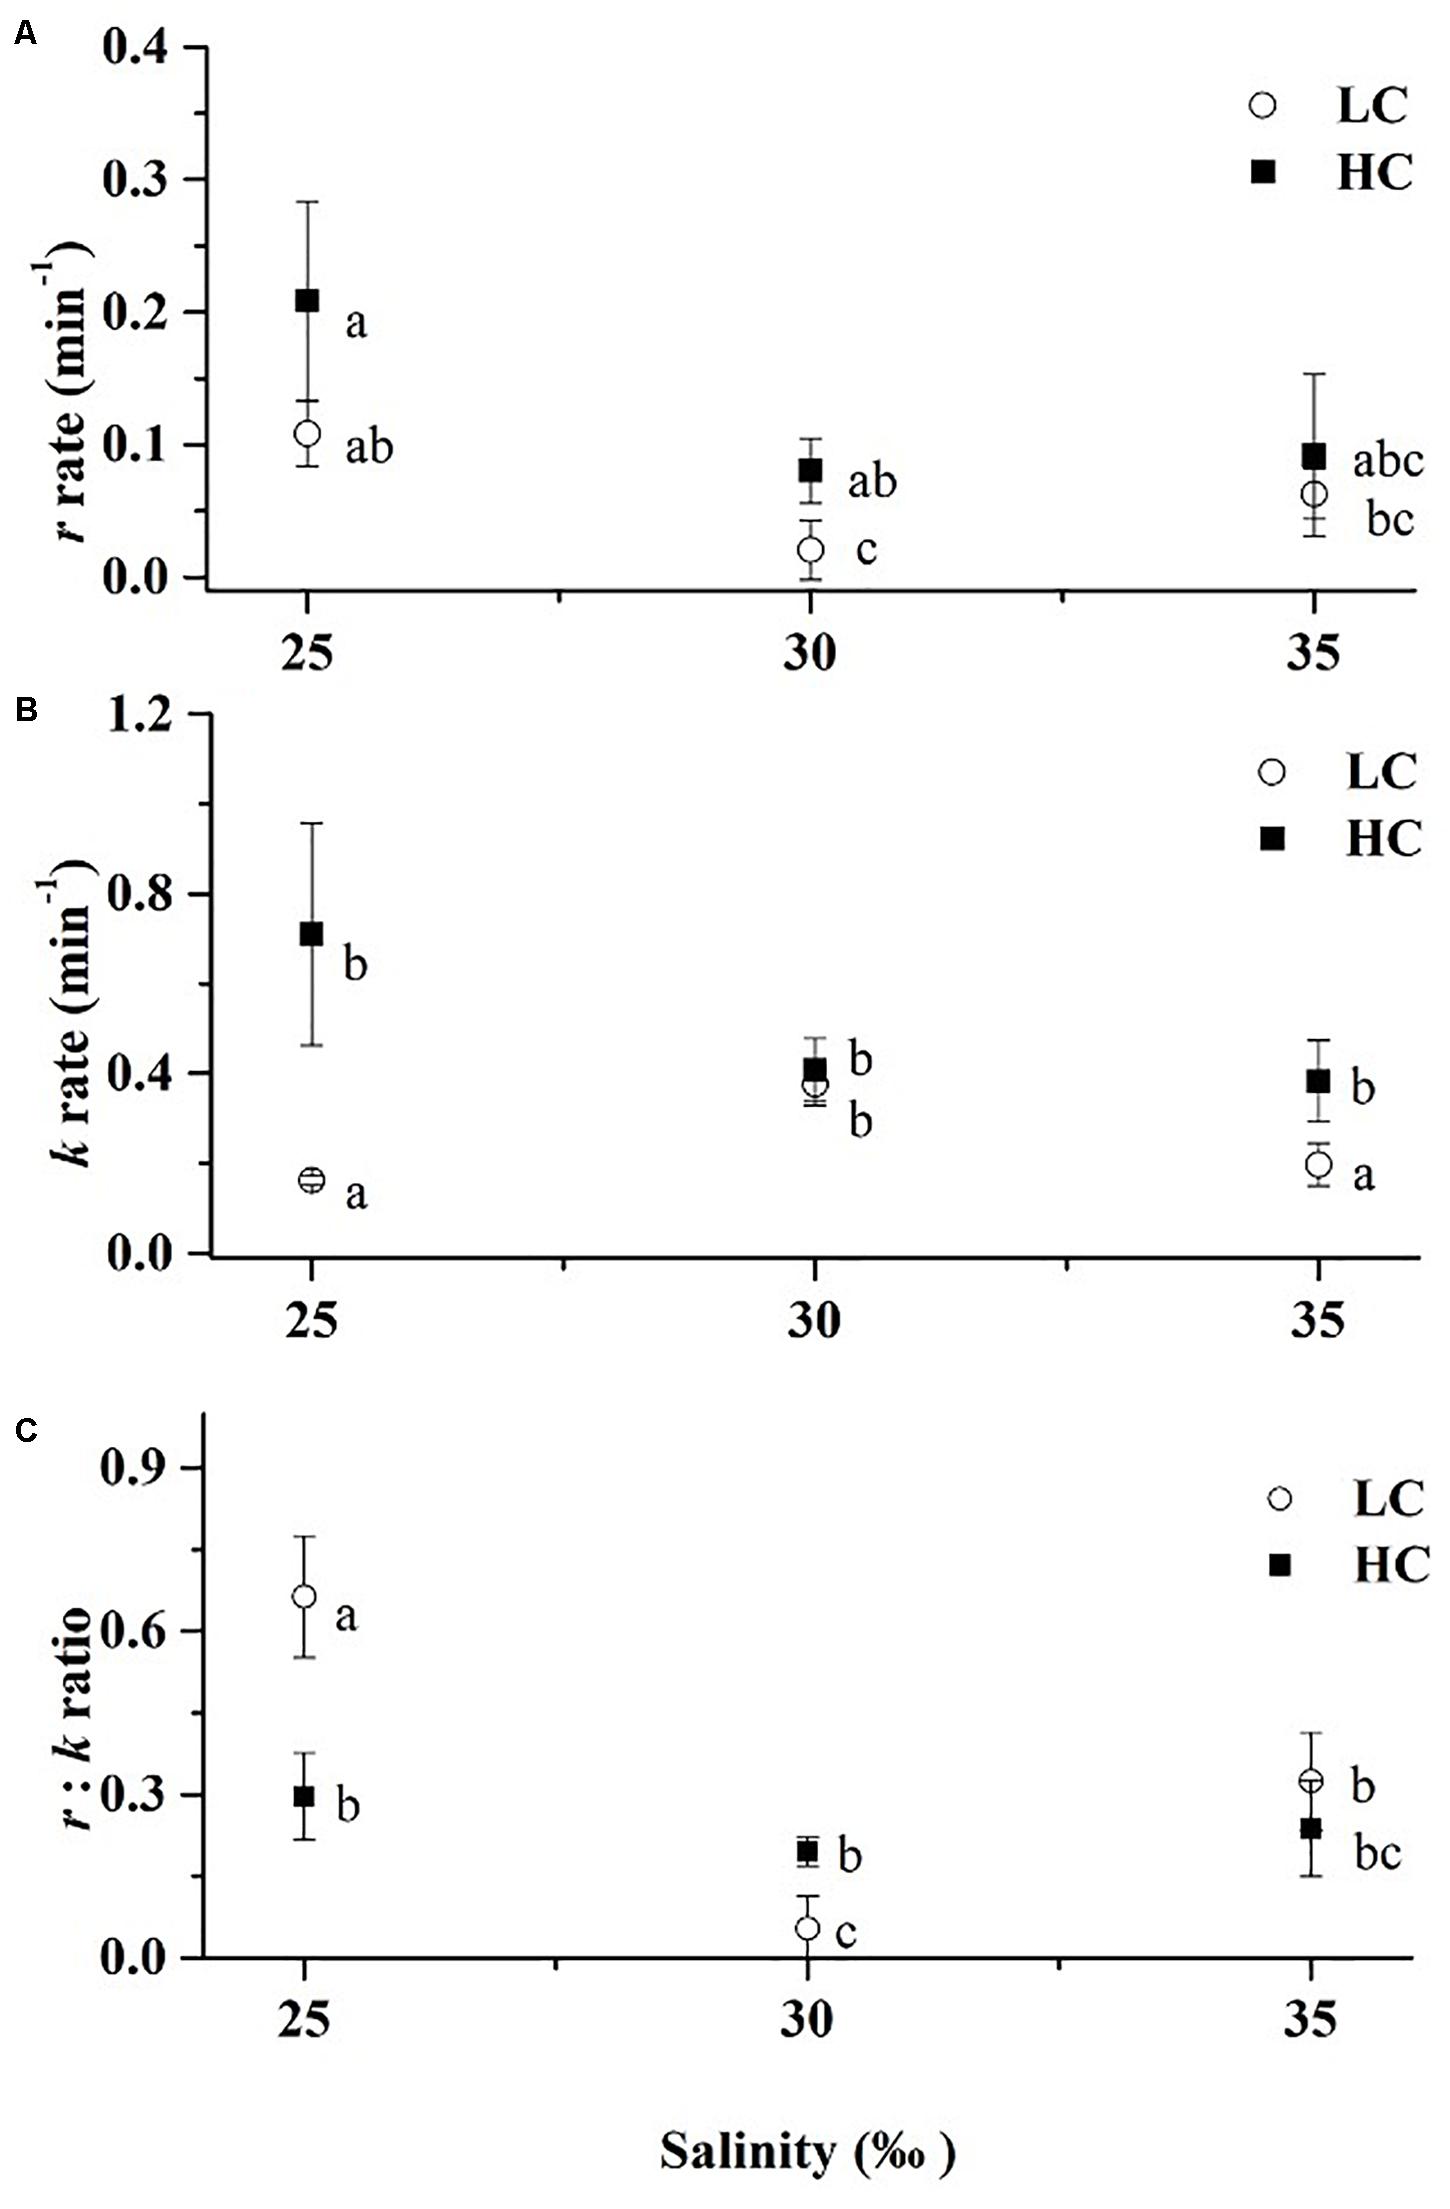
Figure 6. Rate of Repair r (A), damage k (B) and the ratio of repair:damage (C) after exposure to solar radiation for 48 min (800 μmol photons m–2 s–1) under different treatments (LC, open circles; HC, solid squares). Values are means ± SD of triplicate cultures. Symbols with different lowercase letters indicate significant differences (p < 0.05) among different treatment.
From the ratio of r:k, it is clear that under LC, cells grown at 25‰ showed improved ability to cope with high light stress than cells grown under higher salinities (Figure 6C). Changes in r:k across salinity were not marked under HC, attributable largely by the much higher damage rate (k) at 25‰.
Discussion
Although the effects of OA and salinity have been reported extensively as separate factors influencing the performance of coccolithophores, to date the possible interaction between these environmental parameters has not be examined. In the present work, we found that salinity and pCO2 (OA), both individually and interactively, affected pigment content, photosynthesis and the ratio of photosynthesis to calcification, while growth and calcification only significantly responded to salinity or OA treatment alone (without interactions detected) (Table 2). It should be noted that interaction of salinity and pCO2 (OA) did not significantly affect calcification (Table 2).
Although we did not measure nutrient concentrations, but recognize that nutrient limitation can influence responses to OA (Boyd et al., 2018), we have no reason to suspect nutrient deficiency during our experiments. Nutrient deficiency results in a major impairment of photochemical efficiency. Declines in maximum photochemical efficiency Fv/Fm have been observed over a range of algal taxa for N-, P- or Fe-starved cells (e.g., Kolber et al., 1988; Greene et al., 1992, 1994; LaRoche et al., 1993; Berges et al., 1996; McKay et al., 1997). Fv/Fm has been shown to recover following nutrient re-addition following starvation and can be used as a measure of phytoplankton “health” for bioassays on natural populations (LaRoche et al., 1993; Geider and LaRoche, 1994; Boyd et al., 1999). Our data showed stable Fv/Fm values across the treatments and were comparable with values reported by Xu et al. (2016), suggesting that nutrient deprivation was not occurring during our experiments.
Calcification rate of E. huxleyi was little affected by salinity under LC but was reduced under HC at the 2 lower salinities tested here. At the highest salinity, pCO2 had no effect on calcification rate. However, photosynthetic carbon fixation increased almost linearly with decreasing salinity resulting in a marked increase in calcification:photosynthesis (C:P) at higher salinity, especially under HC. Lowered salinity (within the tested range) clearly interacted with pCO2 to synergistically enhance aspects of the physiological performance of E. huxleyi compared to each single driver alone.
Large populations of E. huxleyi are observed every summer in Norwegian coastal waters (Holligan et al., 1993; Wal et al., 1995), which is noteworthy considering that it is an essentially oceanic species with an offshore center of distribution (Winter et al., 1994). Paasche et al. (1996) inferred that E. huxleyi may have developed distinct ecotypes in Scandinavian coastal waters. By coincidence, the strain in our study (PML B92/11) was originally obtained from coastal waters off Bergen, Norway with salinity of ∼30‰, Mork et al., 1981). Here, although we cannot provide genetic data to infer the relationship to the strains discussed by Paasche et al. (1996), we have focused on the physiological performance of our strain under changing levels of salinity (25–35‰) and carbonate chemistry induced with elevated CO2 (1000 μatm), and have shown that a reduction in salinity to 25‰ increased growth rate, effective photochemical efficiency and photosynthetic carbon fixation even under ocean acidification (OA) conditions. Growth under HC caused a decrease in these parameters but, importantly, comparison between parameters under HC show that values at 25‰ were comparable to or even greater than those of cells grown under 35‰, i.e., growth at lower salinity induced changes that ameliorated the negative effects of ocean acidification. For instance, photosynthetic rate under HC and 25‰ was 3.7 × the rate under 35‰ and HC although growth was stimulated by only 9%. Even in comparison to values from cells grown under LC and 35%, parameters in cells grown at 25‰ and HC showed similar values, except for growth rate, which was reduced by 9% and photosynthesis, which showed a 90% stimulation. While either OA or reduced salinity alone alters carbonate chemistry, salinity changes additionally influence ion concentrations, electrochemical gradients and osmolality, which modulate passive and active transport of CO2 and nutrients and ultimately require extra energy. Photosynthetic carbon fixation rates of phytoplankton in situ at an estuary have been shown to increase with increased salinity below 25‰ but declined with salinity above that value, even though the dissolved inorganic carbon concentration increased (Li et al., 2011). In the present work, the result that E. huxleyi photosynthetically performs better under 25‰ than at higher salinity levels regardless of increased CO2, implies that this strain is more sensitive to salinity change than to changes of pCO2. Since increased levels of sunlight counteract the negative effects of OA on calcification in E. huxleyi (Jin et al., 2017), the tolerance to reduced salinity under OA could be attributed to its increased light capturing capability (Figures 2, 3) and enhanced photochemical performance.
E. huxleyi (PML B92/11) cells had a higher growth rate under reduced salinity when grown under ambient pCO2 (LC, Figure 1A). This result is consistent with previous studies (Brand, 1984; Schouten et al., 2006), showing that strains isolated from coastal regions grew more rapidly under 25 than 33‰. Brand (1984) suggested that the last deglaciation was a possible selection time for coastal populations adapted for lower salinity. In the present study, since big differences in seawater carbonate chemistry exist between 25 and 35‰ (Table 1) as seen in the effects of salinity on CO2 solubilities (Weiss, 1974) and DIC speciation, and the balance between photosynthesis (increasing with lower salinity) and calcification (unaffected by salinity), it might be argued that the increased CO2 availability by up to about 39% were partially contributing to the enhanced growth (Figure 1) and changes in periplasmic redox activity related to osmotic pressure could be responsible for the enlarged cellular volume and stimulated growth under both CO2 levels at lower salinity. However, the decrease in growth rates and photosynthetic rates at elevated CO2 suggest that changes in pCO2 are not responsible for the enhancement of these parameters under hyposaline conditions or are overridden by the greater H+ concentration associated with OA, thereby decreasing the effect of salinity on growth under OA conditions.
Emiliania strains that have different calcifying capacities have different transport abilities for CO2 and bicarbonate (Elzenga et al., 2000; Paasche, 2001; Stojkovic et al., 2013). The capacity of the strain used in this work to calcify has declined during long-term laboratory culture compared to that previously reported by another study (Sett et al., 2014), but is comparable with data reported by Jin et al. (2017) and Zhang et al. (2019) for the same strain. It has been suggested that low–calcifying strains are less efficient in utilizing bicarbonate for assimilation (Nimer and Merrett, 1992; Rost et al., 2003), though Stojkovic et al. (2013) showed the opposite with a greater proportion of DIC uptake from bicarbonate in low-calcifying strains and CO2 use only being more predominant in high-calcifying strains where bicarbonate is directed more to calcification.
While bicarbonate is the source of DIC used in calcification, and intracellular CO2 is used for assimilation into organic carbon, the species of DIC taken up by coccolithophores is still contentious. E. huxleyi, in common with most other microalgae, possesses an active CO2 concentrating mechanism (CCM) which is based on active transport of inorganic carbon across the plasmalemma and/or chloroplast envelope (Giordano et al., 2005). This usually involves the active uptake of bicarbonate (Taylor et al., 2011), but the acquisition of bicarbonate alone is subject to debate, given the evidence of Elzenga et al. (2000); Schulz et al. (2007), Bach et al. (2011); Stojkovic et al. (2013) and others that in addition to HCO3–, CO2 may be utilized (directly or indirectly via an external CA) by E. huxleyi as an external source of DIC for photosynthesis. It should, however, be borne in mind that the function of external CA is only to speed up the equilibrium between bicarbonate and CO2 and does not in itself increase CO2 concentrations above equilibrium values.
Although an enhanced growth rate of E. huxleyi (strains NZEH, AC472 and NIES 837) under elevated CO2 concentrations has been reported before (Shi et al., 2009; Fiorini et al., 2011; Fukuda et al., 2014; Jin et al., 2017), in the present study the growth of E. huxleyi was lowered by 16–19% under the HC condition compared to the LC treatment, regardless of the salinity levels, which suggests that increased acidity could have stressed the cells (Figure 1A). Seawater acidification has also been shown to inhibit growth rate of E. huxleyi in other studies (Nimer et al., 1994; Hoppe et al., 2011). Ocean acidification has the dual effect of increasing pCO2 but also increasing H+ concentration, parameters that can have different effects on cellular performance (Hurd et al., 2020). Utilization of HCO3– to provide CO2 in photosynthesis generates OH–, driving the pH up, while calcification consumes OH–, driving the pH down. Since the PIC:POC ratio is seldom 1 (and is much lower than this in our experiments), acid-base regulation would require H+ influx (Taylor et al., 2011; Raven and Crawfurd, 2012). The imbalance between photosynthesis and calcification as well as respiration may lead to the observed anomalous changes in the carbonate system between the beginning and end of the experiment at low salinity (Table 1).
The balance between a CO2 rise and a decrease in pH is the key to reflect beneficial and harmful effects of OA, but such a balance can be perturbed by other environmental drivers (see the review by Gao et al., 2019 and literature therein). In the present work, lowered salinity from 35 to 25‰, which would result in slightly higher CO2 solubility but markedly lower HCO3– and CO32– concentrations, antagonistically acted with OA to influence the growth of E. huxleyi.
The photosynthetic rates, in accordance with the growth rate, increased with decreased salinity under both LC and HC (Figure 4A). Such a relationship in photosynthesis was more obvious than in the specific growth rate (Figures 1, 4). Since the mitochondrial respiration rate of E. huxleyi is enhanced under OA treatment (Jin et al., 2015), the balance between photosynthesis and respiration can reasonably be reflected in the differential responses between growth and photosynthesis. Therefore, reduced salinity with the increased availability of CO2 would have resulted in higher photosynthetic rates, though increased acidity from higher CO2 exacerbated negative impacts as reflected in differences between the growth rates of the HC and LC-grown cells (Figure 1). While differences of [CO2] between 25 and 35‰ media were much smaller (Table 1) compared to that between LC and HC, osmotic regulation with enhanced energy supply due to increased light capture and use efficiency (Figures 2, 3) could facilitate assimilation of biogenic elements. On the other hand, changes in salinity might indirectly alter the efficiency of CCMs (Booth and Beardall, 1991; Goyal et al., 1992; Giordano et al., 2005) due to its effects on inorganic carbon levels in the bulk medium around algae, and altered CCM efficiency may make the discrepancies in intracellular [CO2] far larger than those of the surrounding medium (Rost et al., 2003; Schulz et al., 2007), although activity of the CCMs of E. huxleyi are supposed to be low (Rost and Riebesell, 2004; but see Stojkovic et al., 2013). Though CCMs are not completely down-regulated under high pCO2 conditions, induced by OA or lower salinity, the passive diffusion of CO2 may make a bigger contribution to photosynthesis as the increased CO2 under the experimental OA environment partially compensates for the reduced internal CO2 due to reduced CCM activity. The physiological benefit of such a downregulation of CCM activity is the energetic savings from running the energy-expensive CCM (Raven et al., 2014) at a lower level. Furthermore, a higher photosynthetic rate under reduced salinity (25 and 30‰) might have enhanced osmoregulation, as many organic osmolytes are typically photosynthetic products (Kirst, 1990).
In our study, cells grown under HC conditions had lower photosynthesis rates irrespective of salinity treatments (Figure 4A). The negative effects of low pH (≤ 7.7) could have offset the positive effects of increasing [CO2] (about twice that of LC medium, Table 1) as previous studies show that higher intracellular [H+] would directly result in a decreased pH in the stroma of the chloroplast, which then led to reduced CO2 fixation (Werdan et al., 1975; Coleman and Colman, 1981; Suffrian et al., 2011). In addition, HC treatment might, at least partially, down-regulate the expression of CCMs, energetically costly mechanisms to increase intracellular CO2 at the active site of Rubisco (Raven et al., 2014). Evidence from diatoms (Burkhardt et al., 2001) and the marine cyanobacterium Trichodesmium (Hutchins et al., 2007) suggests that CCMs in these species are close to full downregulation at 1000–1500 p.p.m. CO2. The decrease in activity of CCMs thus may result in lower intracellular [CO2] and reduced photosynthetic rate compared to LC, as reflected in a diatom and macroalgae (Xu and Gao, 2012a; Liu et al., 2017), though energy saving and passive diffusion from a higher bulk seawater pCO2 could partially compensate for the reduced intracellular [CO2].
Calcification rates of E. huxleyi are known to be sensitive to changes in seawater carbonate chemistry. As HCO3– is the main substrate for calcification (Buitenhuis et al., 1999; Paasche, 2001; Roleda et al., 2012), the increasing calcification rates of cells grown under HC with increasing salinity in our study (Figure 4B) could be the result of increased [HCO3–] concentration (Table 1). However, there were no significant differences in calcification rates among three salinity treatments under LC with even a slightly higher value at 25‰ (Figure 4B), which is consistent with Beaufort et al. (2011), who also showed a weak correlation between calcification and salinity in their field work. Under LC, the highest effective photochemical quantum yield values and r:k ratios among the three salinity treatments were observed under 25‰ after an exposure to high light (Figures 5A, 6C), suggesting a relatively thick coccolith layer playing a protective role (Xu and Gao, 2012b), which is in accordance with the measured results (Figure 4B). Nimer and Merrett (1993) proposed that the optimum pH for calcification was 7.8, a value just close to the pH of our medium under 25‰ and LC conditions (Table 1), so that less energy would be required to maintain intracellular acid-base balance. Sikes and Wilbur (1982) demonstrated that, when salinity was reduced from 34.5 to 19.5‰, the percentage of calcified cells increased in the medium. Taylor et al. (2011) identified a plasma membrane H+ channel that played an important role in pH homeostasis in coccolithophores. Both rectifying H+ channels and rectifying Cl– channels worked together to sustain H+ efflux. In our study, the lower concentration of Cl– associated with the reduced salinity in the 25‰ medium implies that Cl– efflux was easier to carry out and assist H+ removal to keep the intracellular pH stable, which could ultimately have promoted calcification.
There has been controversy in the past about how increased pCO2 in seawater affects calcification of E. huxleyi. Calcification rates of E. huxleyi (PML B92/11) at high pCO2 appeared to be dependent on pH (Bach et al., 2011). In the present work, elevated pCO2 along with lowered pH decreased the calcification of E. huxleyi, which is in accordance with previous work (see the review by Gao et al., 2019 and references therein). However, in other studies, increased pCO2 along with decreased pH increased calcification of E. huxleyi (Iglesias-Rodriguez et al., 2008) or had no significant effect on it (Langer et al., 2009). It seems that responses of calcification of E. huxleyi are likely to be strain-specific (Langer et al., 2009). The decreased calcification could be a strategy to reduce cytosol acidification (Feng et al., 2017) as well as a maneuver to save energy expended in acid/base regulation. However, such HC-induced impacts became almost absent in the cells grown under a salinity of 35‰ (Figure 4B). Under LC, it may be easier for the cells to remove H+ (Mackinder et al., 2010), while under HC the concentration of HCO3–, the substrate for calcification, was higher (Table 1). Previous studies have suggested that bicarbonate concentrations may not saturate the requirement of E. huxleyi for calcification as the K1/2 (HCO3–) values have been reported at 3256 μM (Buitenhuis et al., 1999), a value far removed from the current and predicted future high pCO2 ocean. Under this consideration, any induced promotion in bicarbonate concentrations could favor calcification. With increasing salinity, the proportion of HCO3– increases (Weiss, 1974; Table 1), and thus led to a slightly higher calcification rate under 35‰ and HC conditions (Figure 4B), which is consistent with the result reported by Fukuda et al. (2014). This finding helps to enhance our understanding as to why coccolithophores were able to thrive in the early Mesozoic era, a time that was characterized by relatively low sea water pH (as low as pH 7.7) and high DIC concentrations (Ridgwell, 2005).
From the ratio of calcification to photosynthesis (C:P), we could see different strategies cells adopted when they grew under different carbonate chemistry conditions. A quite low value for this parameter (<0.2) under 25 and 30‰, regardless of pCO2 (Figure 4C), indicates that organic carbon production was prioritized over inorganic carbon production at both DIC levels. In contrast, the C:P ratio was far higher (>0.3) under 35‰ (Figure 4C), suggesting that cells could “invest” more inorganic carbon to secrete coccoliths if the DIC supply was increased (Table 1). The results of an additional experiment (for details see Supplementary Materials) clearly provided evidence for such behavior: when the salinity was set at 25‰ with elevated DIC concentration, its C:P ratio significantly increased (Supplementary Figure S1). This result agreed with previous findings with qRT-PCR analysis (Bach et al., 2013), showing that some genes with putative roles in DIC, Ca2+ and H+ transport (AEL1, CAX3, and ATPVc’/c) may play a dual role, supporting calcification under ambient conditions but switching to support photosynthesis when DIC becomes limiting.
Our results suggest that E. huxleyi PML B92/11 has the ability to acclimate to different levels of salinity, pH and pCO2, by up-regulating its photosynthetic performance with insignificant changes in calcification. E. huxleyi is known to grow well even with reduced calcification, or in non-calcifying strains, under OA conditions (Jin et al., 2017). Our findings, along with other reported results, explain its success in coastal waters, an environment characterized by acute changes in, or fluctuation of, pH/pCO2 and salinity. Tyrrell et al. (2008) reported that E. huxleyi could only survive in natural waters with salinity above 11. We found that when salinity was decreased to 15‰, cells of this strain could barely survive, with non-measurable growth (data not shown). Since sensitivity of different strains of E. huxleyi to ocean acidification differs substantially (Langer et al., 2009), the combined effects of OA and salinity could therefore be different in different regions or under different hydrological processes.
Under the future scenario of ocean acidification with decreased salinity, the tolerance of E. huxleyi shown in this study will increase its competitiveness and help it better adapt to future global environmental changes, especially in the coastal areas of high latitude. A potential niche extension of E. huxleyi into higher latitude waters driven by polar ice melt and progressive OA might then influence the distribution of other phytoplankton and have profound consequences for the ocean’s carbon cycle. Thus, further studies that could better mimic the future scenario are needed.
Data Availability Statement
All datasets generated for this study are included in the article/Supplementary Material.
Author Contributions
JX and KG designed the experiments. JX carried out the experiments. All authors contributed to data analysis and manuscript writing.
Funding
This study was supported by the National Natural Science Foundation of China (41720104005 and 41721005).
Conflict of Interest
The authors declare that the research was conducted in the absence of any commercial or financial relationships that could be construed as a potential conflict of interest.
Acknowledgments
We are grateful to Liping Wu and Xiaowen Jiang for their help with the experiments. We also thank Xianglan Zeng and Wenyan Zhao for their technical assistance.
Supplementary Material
The Supplementary Material for this article can be found online at: https://www.frontiersin.org/articles/10.3389/fmars.2020.00704/full#supplementary-material
References
Albretsen, J., Aure, J., Sætre, R., and Danielssen, D. S. (2011). Climatic variability in the Skagerrak and coastal waters of Norway. ICES J. Mar. Sci. 69, 758–763. doi: 10.1093/icesjms/fsr187
Bach, L. T., Mackinder, L. C. M., Schulz, K. G., Wheeler, G., Schroeder, D. C., Brownlee, C., et al. (2013). Dissecting the impact of CO2 and pH on the mechanisms of photosynthesis and calcification in the coccolithophore Emiliania huxleyi. New Phytol. 199, 121–134. doi: 10.1111/nph.12225
Bach, L. T., Riebesell, U., and Schulz, K. G. (2011). Distinguishing between the effects of ocean acidification and ocean carbonation in the coccolithophore Emiliania huxleyi. Limnol. Oceanogr. 56, 2040–2050. doi: 10.4319/lo.2011.56.6.2040
Beardall, J., Stojkovic, S., and Gao, K. S. (2014). Interactive effects of nutrient supply and other environmental factors on the sensitivity of marine primary producers to ultraviolet radiation: implications for the impacts of global change. Aquat. Biol. 22, 5–23. doi: 10.3354/ab00582
Beaufort, L., Probert, I., de Garidel-Thoron, T., Bendif, E. M., Ruiz-Pino, D., Metzl, N., et al. (2011). Sensitivity of coccolithophores to carbonate chemistry and ocean acidification. Nature 476, 80–83. doi: 10.1038/nature10295
Berges, J. A., Charlebois, D. A., Mauzerall, D. C., and Falkowski, P. G. (1996). Differential effects of nitrogen limitation on photosynthetic efficiency of Photosystem I and II in microalgae. Plant Physiol. 110, 689–696. doi: 10.1104/pp.110.2.689
Birkenes, E., and Braarud, T. (1952). Phytoplankton in the Oslo Fjord during a ‘Coccolithus huxleyi-summer’. Avh. Norske Vidensk. Akad. Oslo I Mat. Nat. Kl. 2, 1–23.
Blindheim, J., Borovkov, V., Hansen, B., Malmberg, S. A., Turrell, W. R., and Østerhus, S. (2000). Upper layer cooling and freshening in the Norwegian Sea in relation to atmospheric forcing. Deep Sea Res. Part I Oceanogr. Res. Pap. 47, 655–680. doi: 10.1016/S0967-0637(99)00070-9
Bollmann, J., and Herrle, J. O. (2007). Morphological variation of Emiliania huxleyi and sea surface salinity. Earth Planet. Sci. Lett. 255, 273–288. doi: 10.1016/j.epsl.2006.12.029
Booth, W. A., and Beardall, J. (1991). Effects of salinity on inorganic carbon utilization and carbonic anhydrase activity in the halotolerant alga Dunaliella salina (Chlorophyceae). Phycologia 30, 220–225. doi: 10.2216/i0031-8884-30-2-220.1
Boyd, P. W., Collins, S., Dupont, S., Fabricius, K., Gattuso, J.-P., Havenhand, J., et al. (2018). Experimental strategies to assess the biological ramifications of multiple drivers of global ocean change—A review. Glob. Change Biol. 24, 2239–2261. doi: 10.1111/gcb.14102
Boyd, P. W., LaRoche, J., Gall, M., Frew, R., and McKay, R. M. (1999). Role of iron, light, and silicate in controlling algal biomass in subantarctic waters SE of New Zealand. J. Geophys. Res. 104, 13391–13404. doi: 10.1029/1999JC900009
Brand, L. E. (1984). The salinity tolerance of forty-six marine phytoplankton isolates. Estuar. Coast. Shelf Sci. 18, 543–556. doi: 10.1016/0272-7714(84)90089-1
Broecker, W., and Clark, E. (2009). Ratio of coccolith CaCO3 to foraminifera CaCO3 in late Holocene deep sea sediments. Paleoceanography 24:A3205. doi: 10.1029/2009pa001731
Buitenhuis, E. T., De Baar, H. J. W., and Veldhuis, M. J. W. (1999). Photosynthesis and calcification by Emiliania huxleyi (Prymnesiophyceae) as a function of inorganic carbon species. J. Phycol. 35, 949–959. doi: 10.1046/j.1529-8817.1999.3550949.x
Burkhardt, S., Amoroso, G., Riebesell, U., and Sültemeyer, D. (2001). CO2 and HCO3– uptake in marine diatoms acclimated to different CO2 concentrations. Limnol. Oceanogr. 46, 1378–1391. doi: 10.4319/lo.2001.46.6.1378
Chierici, M., and Fransson, A. (2009). Calcium carbonate saturation in the surface water of the Arctic Ocean: undersaturation in freshwater influenced shelves. Biogeosciences 6, 2421–2431. doi: 10.5194/bg-6-2421-2009
Coleman, J. R., and Colman, B. (1981). Inorganic carbon accumulation and photosynthesis in a blue-green alga as a function of external pH. Plant Physiol. 67, 917–921. doi: 10.1104/pp.67.5.917
Dickson, B., Yashayaev, I., Meincke, J., Turrell, B., Dye, S., and Holfort, J. (2002). Rapid freshening of the deep North Atlantic Ocean over the past four decades. Nature 416, 832–837. doi: 10.1038/416832a
Elzenga, J. T. M., Prins, H. B. A., and Stefels, J. (2000). The role of extracellular carbonic anhydrase activity in inorganic carbon utilization of Phaeocystis globosa (Prymnesiophyceae): a comparison with other marine algae using the isotopic disequilibrium technique. Limnol. Oceanogr. 45, 372–380. doi: 10.4319/lo.2000.45.2.0372
Falkowski, P. G., Koblížek, M., Gorbunnov, M., and Kolber, Z. (2004). “Development and application of variable chlorophyll fluorescence techniques in marine ecosystems,” in Chlorophyll a Fluorescence: A Signature of Photosynthesis, eds G. C. Papageorgiou, and Govindiee (Dordrecht: Springer), 757–778. doi: 10.1007/978-1-4020-3218-9_30
Feng, Y. Y., Roleda, M. Y., Armstrong, E., Boyd, P. W., and Hurd, C. L. (2017). Environmental controls on the growth, photosynthetic and calcification rates of a Southern Hemisphere strain of the coccolithophore Emiliania huxleyi. Limnol. Oceanogr. 62, 519–540. doi: 10.1002/lno.10442
Feng, Y. Y., Warner, M. E., Zhang, Y. H., Sun, J., Fu, F.-X., Rose, J. M., et al. (2008). Interactive effects of increased pCO2, temperature and irradiance on the marine coccolithophore Emiliania huxleyi (Prymnesiophyceae). Eur. J. Phycol. 43, 87–98. doi: 10.1080/09670260701664674
Fielding, S. R., Herrle, J. O., Bollmann, J., Worden, R. H., and Montagnesd, D. J. S. (2009). Assessing the applicability of Emiliania huxleyi coccolith morphology as a sea-surface salinity proxy. Limnol. Oceanogr. 54, 1475–1480. doi: 10.4319/lo.2009.54.5.1475
Fiorini, S., Middelburg, J. J., and Gattuso, J.-P. (2011). Testing the effects of elevated pCO2 on coccolithophores (Prymnesiophyceae): comparison between haploid and diploid life stages. J. Phycol. 47, 1281–1291. doi: 10.1111/j.1529-8817.2011.01080.x
Fukuda, S., Suzuki, Y., and Shiraiwa, Y. (2014). Difference in physiological responses of growth, photosynthesis and calcification of the coccolithophore Emiliania huxleyi to acidification by acid and CO2 enrichment. Photosynth. Res. 121, 299–309. doi: 10.1007/s11120-014-9976-9
Gao, K. S., Beardall, J., Häder, D.-P., Hall-Spencer, J. M., Gao, G., and Hutchins, D. A. (2019). Effects of ocean acidification on marine photosynthetic organisms under the concurrent influences of warming, UV radiation, and deoxygenation. Front. Mar. Sci. 6:322. doi: 10.3389/fmars.2019.00322
Gao, K. S., Guan, W. C., and Helbling, E. W. (2007). Effects of solar ultraviolet radiation on photosynthesis of the marine red tide alga Heterosigma akashiwo (Raphidophyceae). J. Photochem. Photobiol. B Biol. 86, 140–148. doi: 10.1016/j.jphotobiol.2006.05.007
Gao, K. S., Helbling, E. W., Häder, D. P., and Hutchins, D. A. (2012). Responses of marine primary producers to interactions between ocean acidification, solar radiation, and warming. Mar. Ecol. Prog. Ser. 470, 167–189. doi: 10.3354/meps10043
Gao, K. S., Ruan, Z. X., Villafañe, V. E., Gattuso, J.-P., and Helbling, E. W. (2009). Ocean acidification exacerbates the effect of UV radiation on the calcifying phytoplankter Emiliania huxleyi. Limnol. Oceanogr. 54, 1855–1862. doi: 10.4319/lo.2009.54.6.1855
Gattuso, J.-P., Magnan, A., Billé, R., Cheung, W. W. L., Howes, E. L., Joos, F., et al. (2015). Contrasting futures for ocean and society from different anthropogenic CO2 emissions scenarios. Science 349:aac4722. doi: 10.1126/science.aac4722
Geider, R. J., and LaRoche, J. (1994). The role of iron in phytoplankton photosynthesis, and the potential for iron-limitation of primary productivity in the sea. Photosynth. Res. 39, 275–301. doi: 10.1007/BF00014588
Genty, B., Briantais, J.-M., and Baker, N. R. (1989). The relationship between the quantum yield of photosynthetic electron transport and quenching of chlorophyll fluorescence. Biochim. Biophys. Acta 990, 87–92. doi: 10.1016/S0304-4165(89)80016-9
Giordano, M., Beardall, J., and Raven, J. A. (2005). CO2 concentrating mechanisms in Algae: mechanisms, environmental modulation, and evolution. Annu. Rev. Plant Biol. 56, 99–131. doi: 10.1146/annurev.arplant.56.032604.144052
Goyal, A., Shiraiwa, Y., Husic, D., and Tolbert, N. E. (1992). External and internal carbonic anhydrases in Dunaliella species. Mar. Biol. 113, 349–355. doi: 10.1007/BF00349158
Green, J. C., Heimdal, B. R., Paasche, E., and Moate, R. (1998). Changes in calcification and the dimensions of coccoliths of Emiliania huxleyi (Haptophyta) grown at reduced salinities. Phycologia 37, 121–131. doi: 10.2216/i0031-8884-37-2-121.1
Greene, R. M., Geider, R. J., Kolber, Z. S., and Falkowski, P. G. (1992). Iron-induced changes in light harvesting and photochemical energy conversion processes in eukaryotic marine algae. Plant Physiol. 100, 565–575. doi: 10.1104/pp.100.2.565
Greene, R. M., Kolber, Z. S., Swift, D. G., Tindale, N. W., and Falkowski, P. G. (1994). Physiological limitation of phytoplankton photosynthesis in the eastern equatorial Pacific determined from variablility in the quantum yield of fluorescence. Limnol. Oceanogr. 39, 1061–1074. doi: 10.4319/lo.1994.39.5.1061
Harrison, P. J., and Berges, J. A. (2005). “Marine culture media,” in Algal Culturing Techniques, ed. R. A. Andersen (Burlington: Elsevier), 21–34.
Holligan, P. M., Groom, S. B., and Harbour, D. S. (1993). What controls the distribution of the coccolithophore, Emiliania huxleyi, in the North Sea? Fish. Oceanogr. 2, 175–183. doi: 10.1111/j.1365-2419.1993.tb00133.x
Hoppe, C. J. M., Langer, G., and Rost, B. (2011). Emiliania huxleyi shows identical responses to elevated pCO2 in TA and DIC manipulations. J. Exp. Mar. Biol. Ecol. 406, 54–62. doi: 10.1016/j.jembe.2011.06.008
Howes, E., Joos, F., Eakin, M., and Gattuso, J.-P. (2015). AnBernhardt, P.W. updated synthesis of the observed and projected impacts of climate change on the chemical, physical and biological processes in the oceans. Front. Mar. Sci. 2:36. doi: 10.3389/fmars.2015.00036
Hurd, C. L., Beardall, J., Comeau, S., Cornwall, C. E., Havenhand, J. N., Munday, P. L., et al. (2020). Ocean acidification as a multiple driver: how interactions between changing seawater carbonate parameters affect marine life. Mar. Freshw. Res. 71, 263–274. doi: 10.1071/MF19267
Hutchins, D. A., Fu, F.-X., Zhang, Y., Warner, M. E., Feng, Y., Portune, K., et al. (2007). CO2 control of Trichodesmium N2 fixation, photosynthesis, growth rates, and elemental ratios: implications for past, present, and future ocean biogeochemistry. Limnol. Oceanogr. 52, 1293–1304. doi: 10.4319/lo.2007.52.4.1293
Iglesias-Rodriguez, M. D., Halloran, P. R., Rickaby, R. E. M., Hall, I. R., Colmenero-Hidalgo, E., Gittins, J. R., et al. (2008). Phytoplankton calcification in a high-CO2 world. Science 320, 336–340. doi: 10.1126/science.1154122
Ishii, M., Kimoto, M., Sakamoto, K., and Iwasaki, S.-I. (2006). Steric sea level changes estimated from historical ocean subsurface temperature and salinity analyses. J. Oceanogr. 62, 155–170. doi: 10.1007/s10872-006-0041-y
Jin, P., Ding, J. C., Xing, T., Riebesell, U., and Gao, K. S. (2017). High levels of solar radiation offset impacts of ocean acidification on calcifying and non-calcifying strains of Emiliania huxleyi. Mar. Ecol. Prog. Ser. 568, 47–58. doi: 10.3354/meps12042
Jin, P., Wang, T. F., Liu, N. N., Dupont, S., Beardall, J., Boyd, P. W., et al. (2015). Ocean acidification increases the accumulation of toxic phenolic compounds across trophic levels. Nat. Commun. 6:8714. doi: 10.1038/ncomms9714
Kirst, G. (1990). Salinity tolerance of eukaryotic marine algae. Annu. Rev. Plant Biol. 41, 21–53. doi: 10.1146/annurev.pp.41.060190.000321
Kolber, Z. S., Zehr, J., and Falkowski, P. G. (1988). Effects of growth irradience and nitrogen limitation on photosynthetic energy conversion in Photosystem II. Plant Physiol. 88, 923–929. doi: 10.1104/pp.88.3.923
Langer, G., Nehrke, G., Probert, I., Ly, J., and Ziveri, P. (2009). Strain-specific responses of Emiliania huxleyi to changing seawater carbonate chemistry. Biogeosciences 6, 2637–2646. doi: 10.5194/bg-6-2637-2009
LaRoche, J., Geider, R. J., Graziano, L. M., Murray, H., and Lewis, K. (1993). Induction of specific proteins in eukaryotic algae grown under iron-, phosphorus-, or nitrogen-deficient conditions. J. Phycol. 29, 767–777. doi: 10.1111/j.0022-3646.1993.00767.x
LaRoche, J., Rost, B., and Engel, A. (2010). “Bioassays, batch culture and chemostat experimentation,” in Guide for Best Practices in Ocean Acidification Research and Data Reporting, eds U. Riebesell, V. J. Fabry, L. Hansson, and J.-P. Gattuso (Brussels: Publications Office of the European Union), 81–94.
Lewis, E., Wallace, D., and Allison, L. J. (1998). Program Developed for CO2 System Calculations. Oak Ridge, TN: US Department of Energy.
Li, F. T., Beardall, J., Collins, S., and Gao, K. S. (2017). Decreased photosynthesis and growth with reduced respiration in the model diatom Phaeodactylum tricornutum grown under elevated CO2 over 1800 generations. Glob. Change Biol. 23, 127–137. doi: 10.1111/gcb.13501
Li, G., Gao, K. S., Yuan, D. X., Zheng, Y., and Yang, G. Y. (2011). Relationship of photosynthetic carbon fixation with environmental changes in the Jiulong River estuary of the South China Sea, with special reference to the effects of solar UV radiation. Mar. Pollut. Bull. 62, 1852–1858. doi: 10.1016/j.marpolbul.2011.02.050
Liu, N. N., Beardall, J., and Gao, K. S. (2017). Elevated CO2 and associated seawater chemistry do not benefit a model diatom grown with increased availability of light. Aquat. Microb. Ecol. 79, 137–147. doi: 10.3354/ame01820
Lohbeck, K. T., Riebesell, U., and Reusch, T. B. H. (2012). Adaptive evolution of a key phytoplankton species to ocean acidification. Nat. Geosci. 5, 346–351. doi: 10.1038/ngeo1441
Mackinder, L., Wheeler, G., Schroeder, D., Riebesell, U., and Brownlee, C. (2010). Molecular mechanisms underlying calcification in coccolithophores. Geomicrobiol. J. 27, 585–595. doi: 10.1080/01490451003703014
Massom, R. A., and Stammerjohn, S. E. (2010). Antarctic sea ice change and variability – Physical and ecological implications. Polar Sci. 4, 149–186. doi: 10.1016/j.polar.2010.05.001
McKay, R. M. L., Geider, R. J., and LaRoche, J. (1997). Physiological and biochemical response of the photosynthetic apparatus of two marine diatoms to Fe stress. Plant Physiol. 114, 615–622. doi: 10.1104/pp.114.2.615
Moore, T. S., Dowell, M. D., and Franz, B. A. (2012). Detection of coccolithophore blooms in ocean color satellite imagery: a generalized approach for use with multiple sensors. Remote Sens. Environ. 117, 249–263. doi: 10.1016/j.rse.2011.10.001
Mork, M., Swallow, J. C., Currie, R. I., Gill, A. E., and Simpson, J. H. (1981). Circulation phenomena and frontal dynamics of the Norwegian coastal current. Philos. Trans. R. Soc. Lond. Ser. A Math. Phys. Sci. 302, 635–647. doi: 10.1098/rsta.1981.0188
Müller, M. N., Schulz, K. G., and Riebesell, U. (2010). Effects of long-term high CO2 exposure on two species of coccolithophores. Biogeosciences 7, 1109–1116. doi: 10.5194/bg-7-1109-2010
Nimer, N., Brownlee, C., and Merrett, M. (1994). Carbon dioxide availability, intracellular pH and growth rate of the Coccolithophore Emiliania huxleyi. Mar. Ecol. Prog. Ser. 109, 257–262. doi: 10.3354/meps109257
Nimer, N. A., and Merrett, M. J. (1992). Calcification and utilization of inorganic carbon by the coccolithophorid Emiliania huxleyi Lohmann. New Phytol. 121, 173–177. doi: 10.1111/j.1469-8137.1992.tb01102.x
Nimer, N. A., and Merrett, M. J. (1993). Calcification rate in Emiliania huxleyi Lohmann in response to light, nitrate and availability of inorganic carbon. New Phytol. 123, 673–677. doi: 10.1111/j.1469-8137.1993.tb03776.x
Paasche, E. (1963). The Adaptation of the carbon-14 method for the measurement of coccolith production in Coccolithus huxleyi. Physiol. Plant. 16, 186–200. doi: 10.1111/j.1399-3054.1963.tb08302.x
Paasche, E. (2001). A review of the coccolithophorid Emiliania huxleyi (Prymnesiophyceae), with particular reference to growth, coccolith formation, and calcification-photosynthesis interactions. Phycologia 40, 503–529. doi: 10.2216/i0031-8884-40-6-503.1
Paasche, E., Brubak, S., Skattebøl, S., Young, J. R., and Green, J. C. (1996). Growth and calcification in the coccolithophorid Emiliania huxleyi (Haptophyceae) at low salinities. Phycologia 35, 394–403. doi: 10.2216/i0031-8884-35-5-394.1
Poulton, A. J., Adey, T. R., Balch, W. M., and Holligan, P. M. (2007). Relating coccolithophore calcification rates to phytoplankton community dynamics: regional differences and implications for carbon export. Deep Sea Res. Part II Top. Stud. Oceanogr. 54, 538–557. doi: 10.1016/j.dsr2.2006.12.003
Qi, D., Chen, L. Q., Chen, B. S., Gao, Z. Y., Zhong, W. L., Feely, R. A., et al. (2017). Increase in acidifying water in the western Arctic Ocean. Nat. Clim. Change 7, 195–199. doi: 10.1038/nclimate3228
Raven, J. A., Beardall, J., and Giordano, M. (2014). Energy costs of carbon dioxide concentrating mechanisms in aquatic organisms. Photosynth. Res. 121, 111–124. doi: 10.1007/s11120-013-9962-7
Raven, J. A., and Crawfurd, K. (2012). Environmental controls on coccolithophore calcification. Mar. Ecol. Prog. Ser. 470, 137–166. doi: 10.3354/meps09993
Ridgwell, A. (2005). A mid Mesozoic revolution in the regulation of ocean chemistry. Mar. Geol. 217, 339–357. doi: 10.1016/j.margeo.2004.10.036
Riebesell, U., Bellerby, R. G. J., Engel, A., Fabry, V. J., Hutchins, D. A., Reusch, T. B. H., et al. (2008). Comment on “Phytoplankton Calcification in a High-CO2 World”. Science 322, 1466–1466. doi: 10.1126/science.1161096
Riebesell, U., Zondervan, I., Rost, B., Tortell, P. D., Zeebe, R. E., and Morel, F. M. M. (2000). Reduced calcification of marine plankton in response to increased atmospheric CO2. Nature 407, 364–367. doi: 10.1038/35030078
Ritchie, R. J. (2006). Consistent sets of spectrophotometric chlorophyll equations for acetone, methanol and ethanol solvents. Photosynth. Res. 89, 27–41. doi: 10.1007/s11120-006-9065-9
Roleda, M. Y., Boyd, P. W., and Hurd, C. L. (2012). Before ocean acidification: calcifier chemistry lessons. J. Phycol. 48, 840–843. doi: 10.1111/j.1529-8817.2012.01195.x
Rost, B., and Riebesell, U. (2004). “Coccolithophores and the biological pump: responses to environmental changes,” in Coccolithophores: From Molecular Processes to Global Impact, eds H. R. Thierstein and J. R. Young (Berlin: Springer), 99–125. doi: 10.1007/978-3-662-06278-4_5
Rost, B., Riebesell, U., Burkhardt, S., and Sültemeyer, D. (2003). Carbon acquisition of bloom-forming marine phytoplankton. Limnol. Oceanogr. 48, 55–67. doi: 10.4319/lo.2003.48.1.0055
Sabine, C. L., Feely, R. A., Gruber, N., Key, R. M., Lee, K., Bullister, J. L., et al. (2004). The oceanic sink for anthropogenic CO2. Science 305, 367–371. doi: 10.1126/science.1097403
Saruwatari, K., Satoh, M., Harada, N., Suzuki, I., and Shiraiwa, Y. (2016). Change in coccolith size and morphology due to response to temperature and salinity in coccolithophore Emiliania huxleyi (Haptophyta) isolated from the Bering and Chukchi seas. Biogeosciences 13, 2743–2755. doi: 10.5194/bg-13-2743-2016
Schouten, S., Ossebaar, J., Schreiber, K., Kienhuis, M. V. M., Langer, G., Benthien, A., et al. (2006). The effect of temperature, salinity and growth rate on the stable hydrogen isotopic composition of long chain alkenones produced by Emiliania huxleyi and Gephyrocapsa oceanica. Biogeosciences 3, 113–119. doi: 10.5194/bg-3-113-2006
Schulz, K. G., Rost, B., Burkhardt, S., Riebesell, U., Thoms, S., and Wolf-Gladrow, D. A. (2007). The effect of iron availability on the regulation of inorganic carbon acquisition in the coccolithophore Emiliania huxleyi and the significance of cellular compartmentation for stable carbon isotope fractionation. Geochim. Cosmochim. Acta 71, 5301–5312. doi: 10.1016/j.gca.2007.09.012
Sett, S., Bach, L. T., Schulz, K. G., Koch-Klavsen, S., Lebrato, M., and Riebesell, U. (2014). Temperature modulates coccolithophorid sensitivity of growth, photosynthesis and calcification to increasing seawater pCO2. PLoS One 9:e88308. doi: 10.1371/journal.pone.0088308
Shi, D., Xu, Y., and Morel, F. M. M. (2009). Effects of the pH/pCO2 control method on medium chemistry and phytoplankton growth. Biogeosciences 6, 1199–1207. doi: 10.5194/bg-6-1199-2009
Sikes, C. S., and Wilbur, K. M. (1982). Functions of coccolith formation. Limnol. Oceanogr. 27, 18–26. doi: 10.4319/lo.1982.27.1.0018
Stojkovic, S., Beardall, J., and Matear, R. (2013). CO2-concentrating mechanisms in three southern hemisphere strains of Emiliania huxleyi. J. Phycol. 49, 670–679. doi: 10.1111/jpy.12074
Strickland, J. D., and Parsons, T. R. (1972). A Practical Handbook of Seawater Analysis. Ottawa: Fisheries Research Board of Canada.
Suffrian, K., Schulz, K. G., Gutowska, M. A., Riebesell, U., and Bleich, M. (2011). Cellular pH measurements in Emiliania huxleyi reveal pronounced membrane proton permeability. New Phytol. 190, 595–608. doi: 10.1111/j.1469-8137.2010.03633.x
Sunda, W. G., Price, N. M., and Morel, F. M. (2005). “Trace metal ion buffers and their use in culture studies,” in Algal Culturing Techniques, ed. R. A. Andersen (New York, NY: Elsevier), 35–63. doi: 10.1016/b978-012088426-1/50005-6
Taucher, J., and Oschlies, A. (2011). Can we predict the direction of marine primary production change under global warming? Geophys. Res. Lett. 38:L02603. doi: 10.1029/2010gl045934
Taylor, A. R., Chrachri, A., Wheeler, G., Goddard, H., and Brownlee, C. (2011). A voltage-gated H+ channel underlying pH homeostasis in calcifying coccolithophores. PLoS Biol. 9:e1001085. doi: 10.1371/journal.pbio.1001085
Tong, S. Y., Gao, K. S., and Hutchins, D. A. (2018). Adaptive evolution in the coccolithophore Gephyrocapsa oceanica following 1,000 generations of selection under elevated CO2. Glob. Change Biol. 24, 3055–3064. doi: 10.1111/gcb.14065
Tyrrell, T., Schneider, B., Charalampopoulou, A., and Riebesell, U. (2008). Coccolithophores and calcite saturation state in the Baltic and Black Seas. Biogeosciences 5, 485–494. doi: 10.5194/bg-5-485-2008
Wal, P. V. D., Kempers, R. S., and Veldhuis, M. J. W. (1995). Production and downward flux of organic matter and calcite in a North Sea bloom of the coccolithophore Emiliania huxleyi. Mar. Ecol. Prog. Ser. 126, 247–265. doi: 10.3354/meps126247
Weiss, R. F. (1974). Carbon dioxide in water and seawater: the solubility of a non-ideal gas. Mar. Chem. 2, 203–215. doi: 10.1016/0304-4203(74)90015-2
Werdan, K., Heldt, H. W., and Milovancev, M. (1975). The role of pH in the regulation of carbon fixation in the chloroplast stroma. Studies on CO2 fixation in the light and dark. Biochim. Biophys. Acta 396, 276–292. doi: 10.1016/0005-2728(75)90041-9
Winter, A., Jordan, R. W., and Roth, P. H. (1994). “Biogeography of coccolithophores in ocean waters,” in Coccolithophores, eds A. Winter, and W. G. Siesser (Cambridge: Cambridge University Press), 161–177.
Xu, J. T., Bach, L. T., Schulz, K. G., Zhao, W., Gao, K., and Riebesell, U. (2016). The role of coccoliths in protecting Emiliania huxleyi against stressful light and UV radiation. Biogeosciences 13, 4637–4643. doi: 10.5194/bg-13-4637-2016
Xu, J. T., and Gao, K. (2012a). Future CO2-induced ocean acidification mediates the physiological performance of a green tide alga. Plant Physiol. 160, 1762–1769. doi: 10.1104/pp.112.206961
Xu, K., and Gao, K. S. (2012b). Reduced calcification decreases photoprotective capability in the Coccolithophorid Emiliania huxleyi. Plant Cell Physiol. 53, 1267–1274. doi: 10.1093/pcp/pcs066
Zeebe, R. E., and Wolf-Gladrow, D. A. (2001). “CO2 in seawater: equilibrium, kinetics, isotopes,” in Oceanography Series, Vol. 65 (Amsterdam: Elsevier), 346.
Zhang, Y., Fu, F., Hutchins, D. A., and Gao, K. (2019). Combined effects of CO2 level, light intensity, and nutrient availability on the coccolithophore Emiliania huxleyi. Hydrobiologia 842, 127–141. doi: 10.1007/s10750-019-04031-0
Keywords: calcification, coccolithophore, CO2, Emiliania huxleyi, ocean acidification, photosynthesis, salinity
Citation: Xu J, Sun J, Beardall J and Gao K (2020) Lower Salinity Leads to Improved Physiological Performance in the Coccolithophorid Emiliania huxleyi, Which Partly Ameliorates the Effects of Ocean Acidification. Front. Mar. Sci. 7:704. doi: 10.3389/fmars.2020.00704
Received: 15 March 2020; Accepted: 03 August 2020;
Published: 27 August 2020.
Edited by:
Koji Mikami, Hokkaido University, JapanReviewed by:
Lorenzo Gallus, University of Genoa, ItalyMichael Yu Roleda, Norwegian Institute of Bioeconomy Research (NIBIO), Norway
Copyright © 2020 Xu, Sun, Beardall and Gao. This is an open-access article distributed under the terms of the Creative Commons Attribution License (CC BY). The use, distribution or reproduction in other forums is permitted, provided the original author(s) and the copyright owner(s) are credited and that the original publication in this journal is cited, in accordance with accepted academic practice. No use, distribution or reproduction is permitted which does not comply with these terms.
*Correspondence: Kunshan Gao, a3NnYW9AeG11LmVkdS5jbg==