 Riaz Bibi1Hee Yoon Kang1
 Dongyoung Kim1Jaebin Jang1
 Goutam Kumar Kundu1,2Young Kyun Kim1
 Chang-Keun Kang1*
- 1School of Earth Sciences and Environmental Engineering, Gwangju Institute of Science and Technology, Gwangju, South Korea
- 2Department of Fisheries, University of Dhaka, Dhaka, Bangladesh
In estuaries, the sources of organic matter, its composition, and its functional role in the coastal ecosystem food web are all influenced by dominant estuarine processes. We investigated seasonal variations in the quantity and composition of dissolved inorganic nutrients, suspended particulate matter (SPM), and phytoplankton across a low-turbidity estuarine–coastal continuum in Gwangyang Bay, South Korea. The narrow estuarine channel has a sharp salinity gradient (from 0 to around 30) and low SPM concentrations (<20 mg L–1). The channel carries river discharge, with a large quantity of nutrients (NO3 and SiO2), into the bay. The especially low SPM concentrations in the estuary (range: 2.0–29.1 mg L–1), and generous nutrient source, create an exceptionally low-turbidity condition in the water column and high primary productivity with no conspicuous spatial or seasonal trends. Gradually increasing δ13C values, low POC:Chla (<200), and low molar C:N (4–8) in the SPM, together with higher Chla concentrations at low SPM locations along the longitudinal transect, suggest that local production of phytoplankton has a strong influence on the distributional patterns of particulate organic matter. Short water-residence times, within the bay system, impede the accumulation of diverse-origin organic matter. The community composition of phytoplankton, distinguished by their size group, also plays a role in characterizing SPM quantity and composition. The results indicate that autochthonous pelagic production governs biogeochemical features in the low-turbidity estuarine embayment, contrasting with a prevalence of allochthonous organic matter, and its active processing, in highly turbid and/or longer residence-time systems.
Introduction
Estuarine processes play a pivotal role in structuring the seasonal and spatial patterns of biogeochemical cycles in the coastal zone where riverine and marine waters interact (Bianchi, 2013; Cloern et al., 2017). The mixing, processing, transportation, and thereby distribution of inorganic nutrients and riverine- and marine-origin organic matter vary along the salinity gradient in and out of estuaries, and differ among estuaries depending on river discharge, turbidity, water retention time, and seasonality (Bouillon et al., 2007; Lancelot and Muylaert, 2011). As a consequence, the sources and composition of organic matter, and their functional role in the coastal ecosystem food web, fed by riverine and estuarine water, are also subject to those estuarine processes (Polis et al., 1997).
Comparison between estuaries, based on suspended particulate matter (SPM) concentrations (i.e., turbidity) and water-residence times, have drawn interesting conclusions about organic matter pools in estuarine and coastal systems (Middelburg and Herman, 2007; Bouillon et al., 2011). Indeed, in low-turbidity estuaries with short residence time, and little degradation and transformation, the composition and distribution of organic matter are governed by conservative mixing of the primary sources of organic matter (Raymond and Bauer, 2001; Middelburg and Herman, 2007). In contrast, organic matter goes through more active processing in high-turbidity estuaries with longer residence times (Wang et al., 2004; Wu et al., 2007). In these estuaries, extensive mixing with, and dilution by, estuarine particles mask the contribution of the various organic matter sources and produces uniform characteristics along the salinity gradient. In other cases, an abrupt change in organic matter characteristics has been observed along the salinity gradient in crossing habitat boundaries (Bouillon et al., 2008). SPM concentrations also influence light penetration, affecting primary production and the resultant particulate matter distribution along the estuarine–marine continuum (Cloern et al., 2017). These estuarine processes govern the delivery of nutrients to coastal waters, ultimately regulating the level of productivity in the sea (Edmond et al., 1981; Cloern and Jassby, 2012).
Along with the concentrations of particulate organic carbon (POC) and nitrogen (PN), and chlorophyll a (Chla), the isotopic, elemental, and biochemical composition of the particulate organic matter (POM) are useful as potential proxies indicative of the dynamics of estuarine and coastal systems (Kristensen et al., 2008; Bouillon et al., 2011; Liénart et al., 2017). δ13C and δ15N values in POM have been widely used to identify its sources, and delineate their mixing and transformation in estuarine and coastal systems (Middelburg and Herman, 2007). However, potentially overlapping δ13C values between various sources may lead to ambiguity about their contributions to POM pools (Bouillon et al., 2011). To overcome such ambiguity, other proxies can characterize POM composition. The POC:PN molar ratio (hereafter C:N ratio) differentiates phytoplankton (with values of 6–10) from terrestrial and non-living detritus (values > 12) (Pocklington, 1976) and POC:Chla ratio by weight (C:Chla ratio) is used to differentiate living phytoplankton (<100, Zeitzschel, 1970) or phytoplankton-dominated POM (<200, Cifuentes et al., 1988) from other materials (>200, Savoye et al., 2003).
Gwangyang Bay is a temperate embayment and exposed to continuous freshwater discharge from the Seomjin River, which is the sole large river system, without lower-reach dams, on the southern coast of South Korea. River discharge is characterized by strong temporal variability with a massive peak in the East Asian summer monsoon rainy season (Kim et al., 2014; Lee et al., 2017) and very low SPM concentrations that shape the bay as a low-turbidity system (Kwon et al., 2002). Accordingly, much of the organic matter in the deep-bay channel results from the seasonal production of phytoplankton (Lee and Kang, 2010; Lee et al., 2017). In the upper estuarine channel, water-residence times are very short (4.4–12.2 days during spring and neap tides) (Shaha et al., 2012), and thus planktonic organisms may be advected from the estuarine channel to the deep bay (Shaha et al., 2010). Dilution of dissolved inorganic nutrients by freshwater–seawater mixing and their rapid assimilation by phytoplankton lowers nutrient concentrations in the estuarine channel, leading to spatial and seasonal variations (Kwon et al., 2001, 2004; Jang et al., 2005; Lee and Kang, 2010). Furthermore, because autochthonous POM is of nutritional importance to the bay’s food-web base (Kang et al., 2003; Chen et al., 2018; Kim et al., 2020), the spatial and temporal dynamics of biogenic elements and phytoplankton may be crucial to the bay ecosystem. However, considering the entire bay, the dynamics of POM, and associated biogenic elements and phytoplankton, are still poorly understood.
There has been little research into POM behavior within the estuarine channel of the bay (Kwon et al., 2002). The present study was conducted, over 2 years, along the longitudinal axis of the estuary and its deep-bay continuum. The spatial variabilities of biogenic elements, phytoplankton biomass (Chla) and primary productivity, and SPM and POM were investigated seasonally in association with the phytoplankton community. Elemental and isotopic C and N in the POM were analyzed along the salinity gradient. The objectives were (1) to determine the spatial and seasonal variabilities of quantity and composition of POM along the estuarine–coastal continuum, and (2) to characterize the factors controlling POM in a temperate coastal embayment with low SPM and short residence times. We hypothesized that phytoplankton would be a dominant contributor to POM pools in the estuary and deep-bay channel, and POM composition would vary with season and over space, depending on the contribution of river-borne biogenic elements. Furthermore, POM composition would mirror phytoplankton community structures, under the various environmental conditions governed by riverine discharge (Lee et al., 2017; Kim D. et al., 2019).
Materials and Methods
Study Site
Gwangyang Bay is a semi-enclosed bay, located on the southern coast of the Korean peninsula in the temperate East Asian monsoon climate zone (Figure 1). Including waters from the Seomjin River, through the Yeosu Channel (between Yeosu peninsula and Namhae Island), to the open sea (northern East China Sea), Gwangyang Bay covers approximately 145 km2. The major distinctive features of this temperate bay are: (1) high discharge from the Seomjin River and consequent low SPM concentrations, and (2) short residence times, as described above (Kwon et al., 2002; Shaha et al., 2012). Water depth is generally shallow, 2.4–8.0 m in the northern upper channel, from the lower reaches of the Seomjin River, but deepens to 10–30 m in the deep-bay channel. River discharge is highly seasonal varying from 30–95 m3 s–1 during the dry winter period to 300–400 m3 s–1 during the summer monsoon (Kim et al., 2014). The tidal cycle of the bay is semidiurnal, with maximum tidal amplitudes of 3.40 m and 1.10 m on spring and neap tides, respectively (Kwon et al., 2001). Given the expected variations in oligohaline, mesohaline, and polyhaline conditions along the main channel of the riverine–estuarine–marine continuum, nine stations were chosen along a longitudinal transect (Figure 1). Stations 1–3 were located in the lower reach of the Seomjin River and the narrow estuarine channel, stations 4–5 were in the estuarine–coastal transition or mixing zone, and stations 6–9 were located in the deep-bay channel. On each sampling occasion, the entire field survey was carried out at or near midday high tide to avoid confounding effects of variations in the tidal stage.
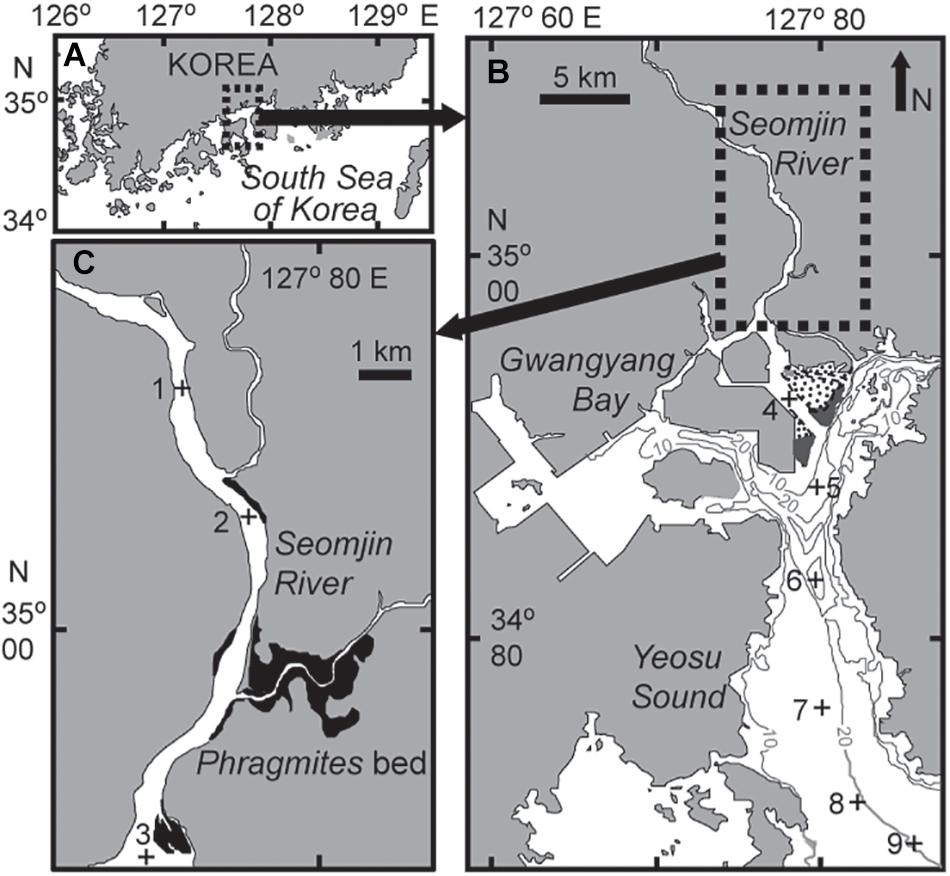
Figure 1. Map showing the location of Gwangyang Bay on the southern coast of the Korean peninsula (A), the sampling stations in the bay (B), and in the estuarine channel (C). Gray lines represent water depth, dotted areas are intertidal beds – dark gray area Zostera bed (B) and dark area Phragmites bed (C).
Field Survey and Sample Treatment
Water samples were collected seasonally in February (winter), May (spring), August (summer), and November (fall) during 2015 and 2016. On each sampling occasion, on site measurements for water temperature and salinity were carried out using a CTD meter (Sea-Bird Electronics, Inc., Bellevue, WA, United States). Water samples were collected at each site using a 20-L van Dorn water sampler from 1 m below the water surface and prefiltered, onboard, through a 180-μm Nitex screen, to remove zooplankton and any large particles. Water sample processing continued immediately (within 1 h of collection) after transport to the wet laboratory, located on the bay coast. For nutrient analysis, the prefiltered seawater samples were filtered again under a gentle vacuum (150–200 mmHg) in the laboratory through precombusted (450°C, 2 h) Whatman GF/F filters (diameter, 47 mm; pore size, 0.7 μm). The filtered seawater samples were immediately transferred into acid-washed polyethylene bottles and frozen at −20°C for later analysis. For Chla (also photosynthetic pigment) determination, 1 L of each water sample was also filtered through precombusted Waterman GF/F filters. Samples for SPM and POM analyses were obtained by filtering 1 L of water through precombusted and preweighed Whatman GF/F filters. In addition, about 10 L of seawater, for measurements of stable C and N isotopes in the POM, and an additional 500 mL, for POC and PN, were filtered using Whatman GF/F filters (diameter, 25 mm; pore size 0.7 μm). After filtration, all the filters were folded, wrapped in aluminum foil, and then deep frozen (at −20°C) until analysis. In the shallow estuarine channel, water column was well-mixed during the spring tide and vertically stratified specifically during the neap tide of the summer monsoon period. However, since the water-column stratification did not generate a distinct vertical homogeneity of SPM (and POM) concentrations, we present here data obtained at the subsurface (1-m depth) layer with water temperature and salinity at the same depth.
Additional water samples for measurement of carbon uptake rate were collected at depths corresponding to 100, 50, 30, 15, and 1% of surface irradiance, as determined by deploying a Secchi disk (Poole and Atkins, 1929). Monthly precipitation and river discharge data were collected from the Water Resources Management Information System of the Ministry of Environment, South Korea1.
Water Chemistry and SPM Analyses
In the laboratory, concentrations of dissolved inorganic nitrogen (NH4+, NO2–, and NO3–), phosphate (PO43–), and silicate (SiO2) were determined in duplicate using standard spectrophotometric methods (Parsons et al., 1984) on a QuAAtro nutrient auto-analyzer (Seal Analytical Ltd., Southampton, United Kingdom). To quantify SPM, the frozen filters were thawed and dried at 60°C for 72 h in a drying oven and weighed after recovering to room temperature in a desiccator. SPM concentration was determined by subtracting the weight of the filter before filtration from its dry weight after filtration of a known volume of water. The filters were then ignited at 450°C for 4 h, and POM concentrations were estimated from the ignited weight loss.
The filter samples for POC and PN quantification and isotope measurement were acidified by fuming for 24 h in a desiccator saturated with hydrogen chloride (HCl) to remove the inorganic carbon (Nieuwenhuize et al., 1994). After drying, filters containing particle samples were wrapped with tin plate. POC and PN concentrations, which give the C:N ratio, were determined using an elemental analyzer (vario Micro cube, Hanau, Germany).
Photosynthetic Pigment Analysis
The filters containing photosynthetic pigments were extracted with 95% methanol (5 mL) for 12 h in the dark at −20°C and sonicated for 5 min to disrupt cells. The extracted solution was centrifuged to remove the suspended particulates. An aliquot of 1 mL of supernatant was filtered through a 0.45 mm PTFE syringe filter and mixed with 300 μL of water; 100 μL of this solution was analyzed using reverse-phase high-performance liquid chromatography (LC-20AD, Shimadzu Co., Kyoto, Japan) equipped with a Waters Symmetry C8 (4.6 × 150 mm, particle size: 3.5 mm, 100 Å pore size) column (Waters, Milford, MA, United States) to measure the photosynthetic phytoplankton pigments, slightly modifying the method of Zapata et al. (2000). Quantification of the standard pigments (Chla, Chlb, peridinin, 19-butanoyloxyfucoxanthin, fucoxanthin, prasinoxanthin, violaxanthin, neoxanthin, 19-hexanoyloxyfucoxanthin, diadinoxanthin, alloxanthin, zeaxanthin, lutein, and β-apo-carotenal) was obtained using a spectrophotometer with known specific extinction coefficients after Jeffrey (1997). Sample peaks were identified based on a comparison of their retention times with those of pure standards. Canthaxanthin was used as the internal standard for peak identification.
Chemotaxonomic Analysis of Phytoplankton
Based on pigment composition and concentrations, the CHEMTAX software (Mackey et al., 1996; Wright and van den Eden, 2000) was used to determine phytoplankton community composition from the ratio of each biomarker pigment to Chla, which represents the total phytoplankton biomass (Mackey et al., 1996). Twelve diagnostic biomarker pigments (Chla, fucoxanthin, 19′-hexanoyloxyfucoxanthin, 19′-butanoyloxyfucoxanthin, neoxanthin, peridinin, chlorophyll b, prasinoxanthin, lutein, violaxanthin, alloxanthin, and zeaxanthin) were used for this analysis. Class-specific pigment ratios, determined from various species collected around the Korean peninsula (Lee et al., 2011), were used as the input pigment ratios in the CHEMTAX program.
Primary Productivity Measurement
Water samples for primary productivity measurement were prefiltered through a 180-μm Nytex screen and dispensed into two sets of 0.5 L acid-washed transparent polycarbonate Nalgene bottles. Light intensity was measured onboard using a photosynthetically available radiation sensor (Li-1400, LI-COR Inc., Lincoln, NE, United States) to determine the daily and experimental irradiance. For measurement of the carbon uptake rate, NaH13CO3 (98 at%, Sigma-Aldrich, St Louis, OH, United States) solution was spiked to each sample used for incubation, to a final concentration of 0.2 mM corresponding to about 10% of the ambient concentration. The bottles were covered with layers of screens calibrated to mimic irradiance levels equivalent to those at five or six optical depths. The water samples were then incubated on deck under natural light for 3–4 h in two acrylic incubators, starting at 08:00–09:00 and ending at local noon. Incubation temperature was controlled by irrigation with surface seawater for the samples from the upper two or three depths and by a cooling system for the samples from the lower three depths. At the end of the incubation, the water samples were filtered through precombusted (at 450°C for 2 h) 25 mm Whatman GF/D and GF/F filters under a gentle vacuum, and the filters were stored at −20°C until isotopic analysis. In the laboratory, the samples for POC and 13C isotope measurements were processed by fuming with HCl as described above for POC and PN determination, and dried at 60°C in a drying oven. The dried filters were analyzed with an instrument system as described in the next section. The carbon uptake rate was calculated following Hama et al. (1983). Daily primary productivity (mg C m–3 d–1) was calculated by multiplying the measured hourly carbon uptake rate with photoperiod conversion factors (Kanda et al., 1985; Fan and Glibert, 2005). Integrated primary productivity (mg C m–2 d–1) was calculated using the trapezoidal rule for the entire euphotic zone (Kwak et al., 2014).
Stable Isotope Analysis
The carbon and nitrogen stable isotope ratios of SPM were analyzed using a continuous-flow isotope ratio mass spectrometer (CF-IRMS; IsoPrime 100, Cheadle, United Kingdom) connected to an elemental analyzer (vario Micro cube). All the samples, wrapped in tin capsules, were placed in the elemental analyzer and oxidized by combustion at high temperature (1,030°C). CO2 and N2 gases were then introduced into the CF-IRMS with the carrier being helium gas. Isotopic values were expressed in delta (δ) notation as parts per thousand (‰) differences from the conventional standards (Vienna Pee Dee Belemnite and air N2 for carbon and nitrogen, respectively) according to the equation:
where X is 13C or 15N and R is the 13C/12C or 15N/14N ratio. Instrument calibration was performed, after analyzing every 5–10 samples, by routine measurements of international standards of sucrose (ANU C12H22O11; NIST, Gaithersburg, MD, United States) for carbon and of ammonium sulfate ([NH4]2SO4; NIST) for nitrogen. The analytical precisions, for 20 replicates of internal peptone and urea standards, were approximately ≤0.1‰ and ≤0.15‰ for δ13C and δ15N, respectively.
Statistical Analyses
Because physical and biogeochemical variables have different measurement units, all data were log(x + 1) transformed to reduce differences in scale and improve the variance and homogeneity of the variables. All data were tested for normality. Because some of the variables, both raw and transformed, were not normally distributed (Shapiro–Wilkes test, P < 0.05), as assumed for parametric statistics, we employed non-parametric multivariate analysis using permutation analysis of variance (PERMANOVA) based on Euclidean distances at a significance level of P < 0.05. Temporal (four seasons: winter, spring, summer, and fall) and spatial (nine sites: oligohaline zone, S1; mesohaline zone, S2–S3; and polyhaline zone or the deep-bay area, S4–S9) distribution patterns were computed for phytoplankton primary productivity and for the physical and biogeochemical variables: water temperature; salinity; dissolved inorganic nutrient (NH4+, NO2–, NO3–, PO43–, and SiO2) concentrations; quantities of SPM, POM, POC, and PN; and SPM composition (C:N, POC: Chla, δ13C, and δ15N). If significant differences were detected, a two-way analysis of variance (ANOVA) was used for individual variables which were approximately normally distributed (SPM, PN, C:N, δ15NPOM, and primary productivity) to test significant variation along the sampled transect (salinity gradient) or across seasons, followed by a post hoc Tukey multiple comparison test at a significance level of P < 0.05.
For non-normal variables, including water temperature, salinity, dissolved inorganic nutrients (NH4+, NO2–, NO3–, PO43–, N:P, and SiO2), Chla, POC, POC:Chla, POM, and δ13CPOM, a non-parametric Kruskal–Wallis test was used. When the difference was significant in at least one of the sites or seasons, a post hoc Dunn’s rank sum test was run. Significant p-values, after Dunn’s test, showed which season or site was significantly different. The N:P ratio had three extreme outliers in winter 2015, which were removed from the scatter plots. PERMANOVA was performed using PRIMER 6 and PERMANOVA+ (PRIMER-E Ltd., Plymouth, United Kingdom). Other statistical routines were conducted using IBM SPSS Statistics 21.0 (IBM Corp., Armonk, NY, United States).
A principal component analysis (PCA) was used to assess overall spatiotemporal variability and correlation among physicochemical variables. The results of the PCA were visualized through ordination diagrams based on PC1 and PC2. Response curves for generalized additive models (GAMs) were generated to characterize the potential non-linear effects between phytoplankton groups and environmental factors (Hastie, 2017). Physicochemical variables that accounted for the majority of the variations, with the highest weight (significant level, P < 0.05), in the phytoplankton groups were identified and selected as key factors (see details in “Results”). R version 3.6.2 was used for PCA and GAMs.
Results
Hydrological Features
Precipitation in the Seomjin River catchment and its freshwater discharge had considerable seasonal variation during the 2-year study period. Maximum precipitation and freshwater discharge occurred during summer 2016 peaking at 583 mm and 7491 m3 s–1, respectively (Figure 2A). The seasonal variation in water temperature was typical of the temperate zone, with a significant difference (Kruskal–Wallis test, df = 3, P < 0.001; Dunn’s pairwise test, P < 0.001) between summer (average 25.9°C) and winter (7.9°C), but no remarkable spatial variations (df = 8, P = 1.000, Figure 2B). Salinity ranged from 0 to 33.2 and increased linearly along the longitudinal transect until it reached a plateau at >30 from stations 4 to 9 (Kruskal–Wallis test, df = 8, P < 0.001), differentiating (Dunn’s pairwise test, P < 0.001) the oligohaline zone (0 to 5 at S1–S2) from the mesohaline (S3) and polyhaline zones (S4–S9 of the deep bay) (Figure 2C). This longitudinal salinity trend was consistent in each season.
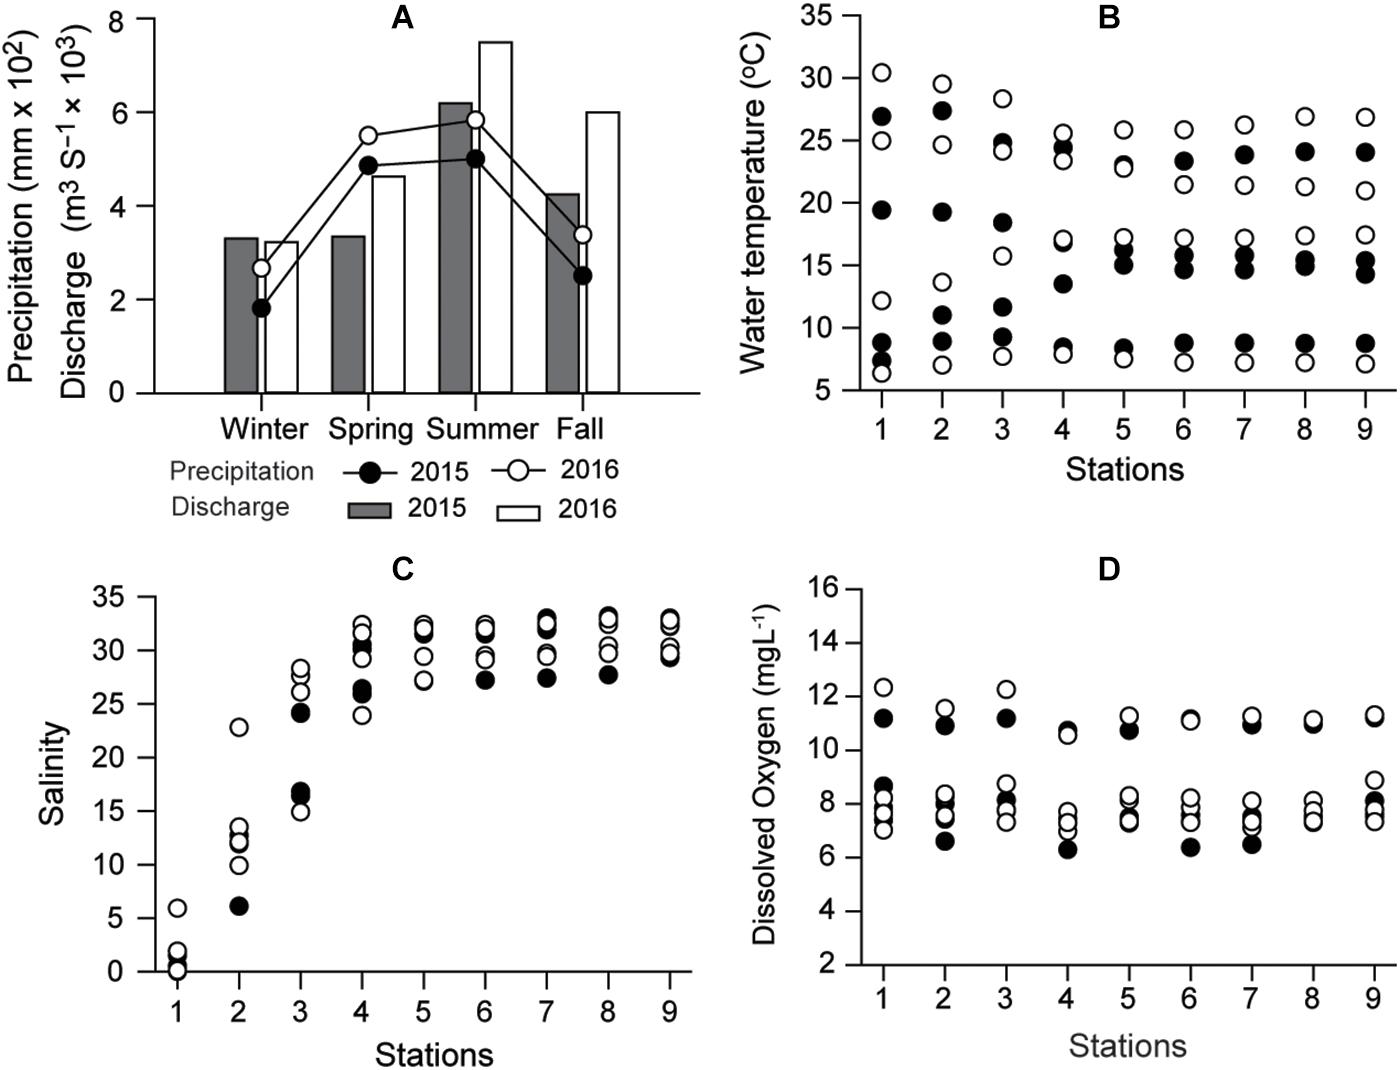
Figure 2. Seasonal variations in annual precipitation around Gwangyang Bay and freshwater discharge from the Seomjin River (A), water temperature (B), and distribution of salinity along the longitudinal transect (C), and Dissolved Oxygen (D) in 2015 and 2016. Circles and columns represent precipitation and discharge rate, respectively. Filled and empty symbols represent 2015 and 2016, respectively.
Consistent with seasonal (temperature, riverine discharge) and spatial (salinity) variabilities, a PERMANOVA test revealed significant seasonal (pseudo-F = 9.553, df = 3, P < 0.001) and longitudinal shifts (pseudo-F = 6.376, df = 8, P < 0.001) in the distributions of biogeochemical variables (Supplementary Tables 1, 2). No interaction effect of site × season was detected (pseudo-F = 0.277, df = 24, P = 1.000) (Table 1). The seasonal and spatial patterns of individual variables are presented below.

Table 1. PERMANOVA results for physical and biogeochemical variables.
Dissolved Inorganic Nutrient Distributions
The nutrients had differing spatial and temporal concentration patterns (Figure 3 and Supplementary Table 1). There was no clear correlation of NH4+ and NO2– concentrations with salinity (Figures 3A,B). NH4+ concentrations had significant spatial variation (Kruskal–Wallis test, P = 0.000, df = 8), being higher at the stations between the mixing and deep-bay zone than at the deep-bay offshore stations (Dunn’s pairwise test, P < 0.001). NO2– concentrations exhibited a clear seasonal trend (Kruskal–Wallis test, df = 3, P < 0.001), but no spatial trend (df = 8, P = 0.736); in both years they were highest in the fall (Dunn’s pairwise test, P < 0.001) at the polyhaline stations (S7–S9). NO3– was the dominant nitrogenous nutrient and its concentrations showed a remarkable spatial variation (Kruskal–Wallis test, df = 8, P < 0.001), characterized by a declining trend (r = −0.71) with increasing salinity (Figure 3C), as well as a significant seasonal variation (Kruskal–Wallis test, df = 3, P = 0.027), reflecting the seasonality of riverine discharge.
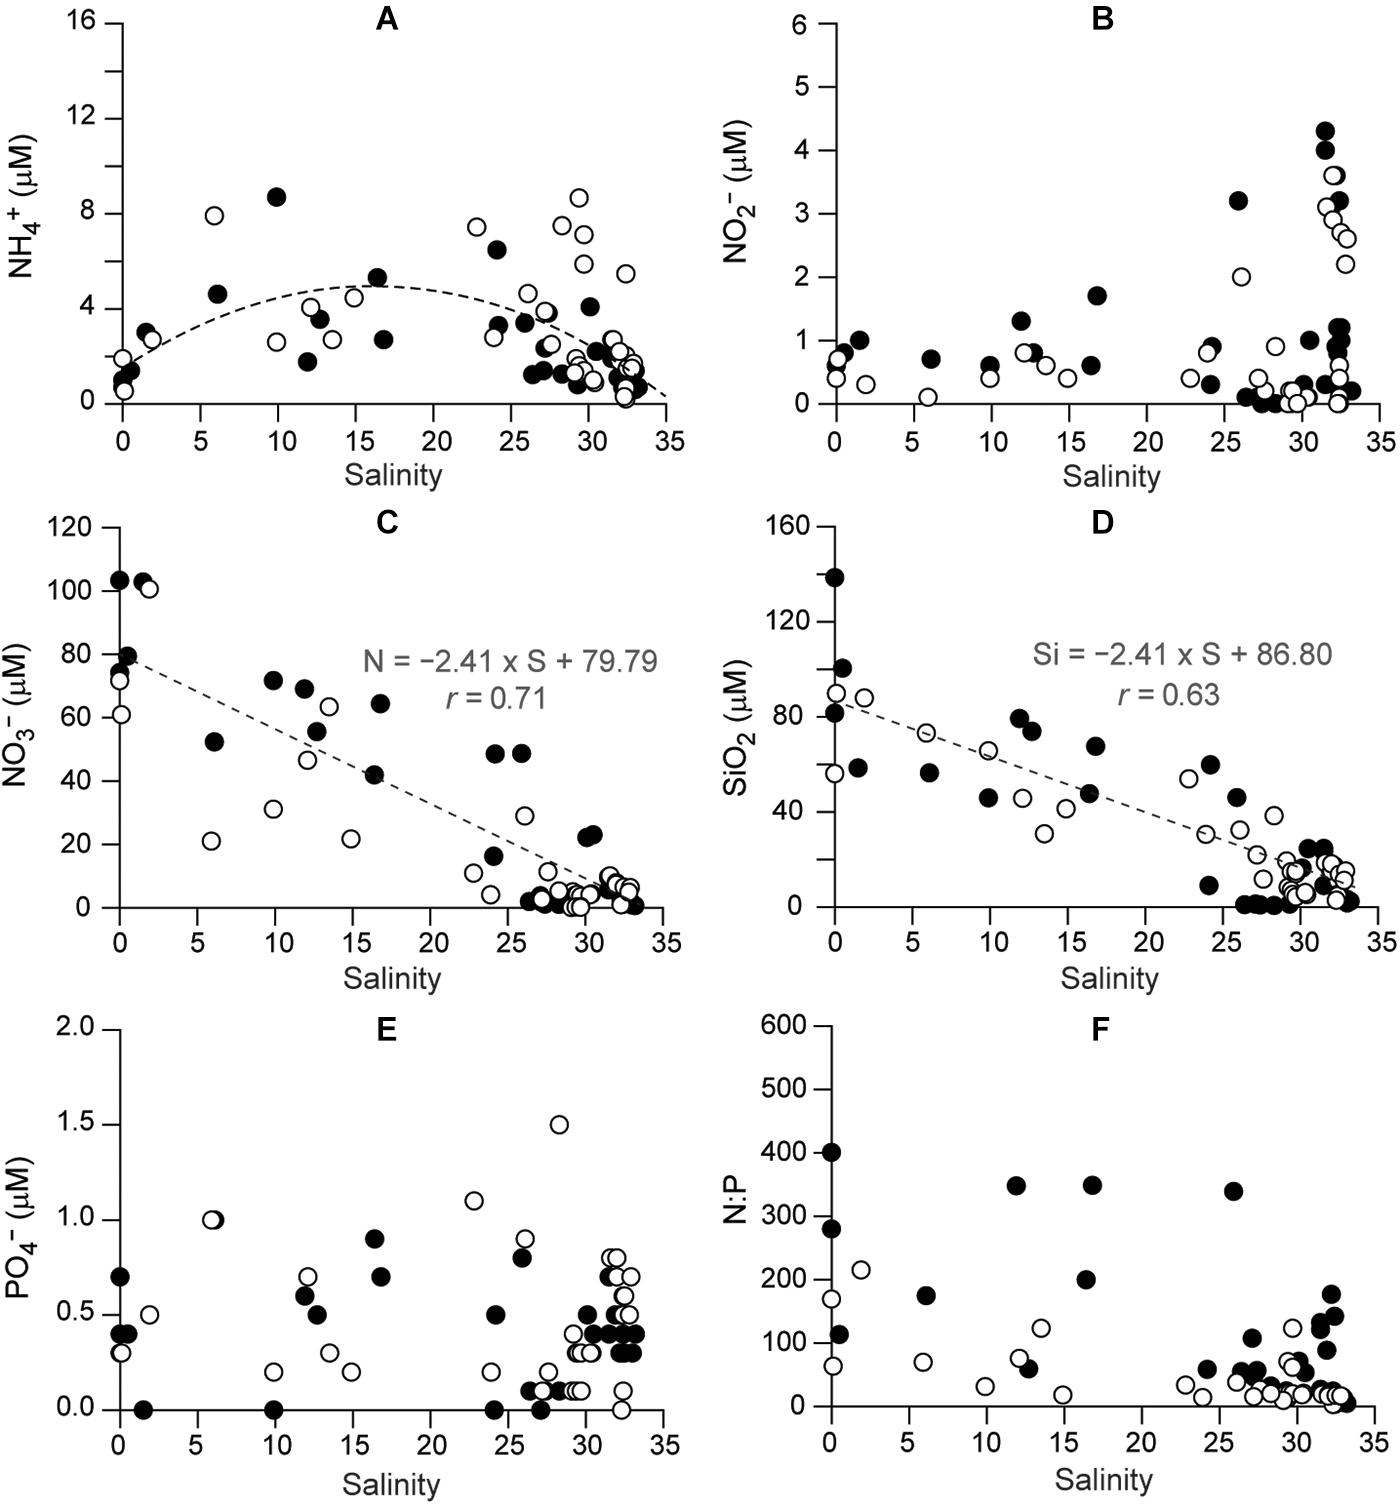
Figure 3. Spatial distributions of concentrations of dissolved inorganic nutrients as a function of salinity in Gwangyang Bay: (A) NH, (B) NO, (C) NO, (D) SiO2, (E) PO, and (F) N:P. Filled and empty circles represent 2015 and 2016, respectively.
A significant negative correlation between SiO2 concentrations and salinity (r = −0.63, Kruskal–Wallis test, df = 8, P < 0.001) was also identified (Figure 3D). The minimum SiO2 concentrations (<5 μM) at the polyhaline stations in winter and spring 2015, following a seasonal variation (Kruskal–Wallis test, df = 3, P = 0.003). PO43– concentrations (Figure 3E) displayed no spatial variation (Kruskal–Wallis test, P = 0.451) but a significant seasonal variation (df = 3, P = 0.001), being highest at mesohaline stations in spring 2015 and summer 2016, and minimal in winter (Dunn’s pairwise test, P < 0.001). The dissolved inorganic nitrogen to phosphate (N:P) ratio (Figure 3F) showed significant spatial variation (Kruskal–Wallis test, df = 8, P < 0.001), decreasing from the oligohaline to the polyhaline stations, as well as a seasonal trend (df = 3, P = 0.005).
Quantity and Composition of Suspended Particulate Matter
Suspended particulate matter and POM concentrations in the riverine–estuarine–coastal continuum of the bay displayed similar spatiotemporal patterns and ranged from 2.0 to 29.1 mg L–1 and 1.1 to 8.5 mg L–1, respectively (Figures 4A,B and Supplementary Table 2). SPM concentrations had significant seasonal and spatial variations (ANOVA, F3,36 = 4.131, P = 0.013; F8,36 = 10.868, P < 0.001, respectively), increasing from the estuarine (salinity < 5) to the offshore stations according to the season (Tukey post hoc test, P < 0.001). POM concentrations had no significant seasonal fluctuation (Kruskal–Wallis test, df = 3, P = 0.052) but did have significant spatial (df = 8, P = 0.036) variation, increasing from the oligohaline (S1) to polyhaline stations (S9) (Dunn’s pairwise test, P < 0.001).
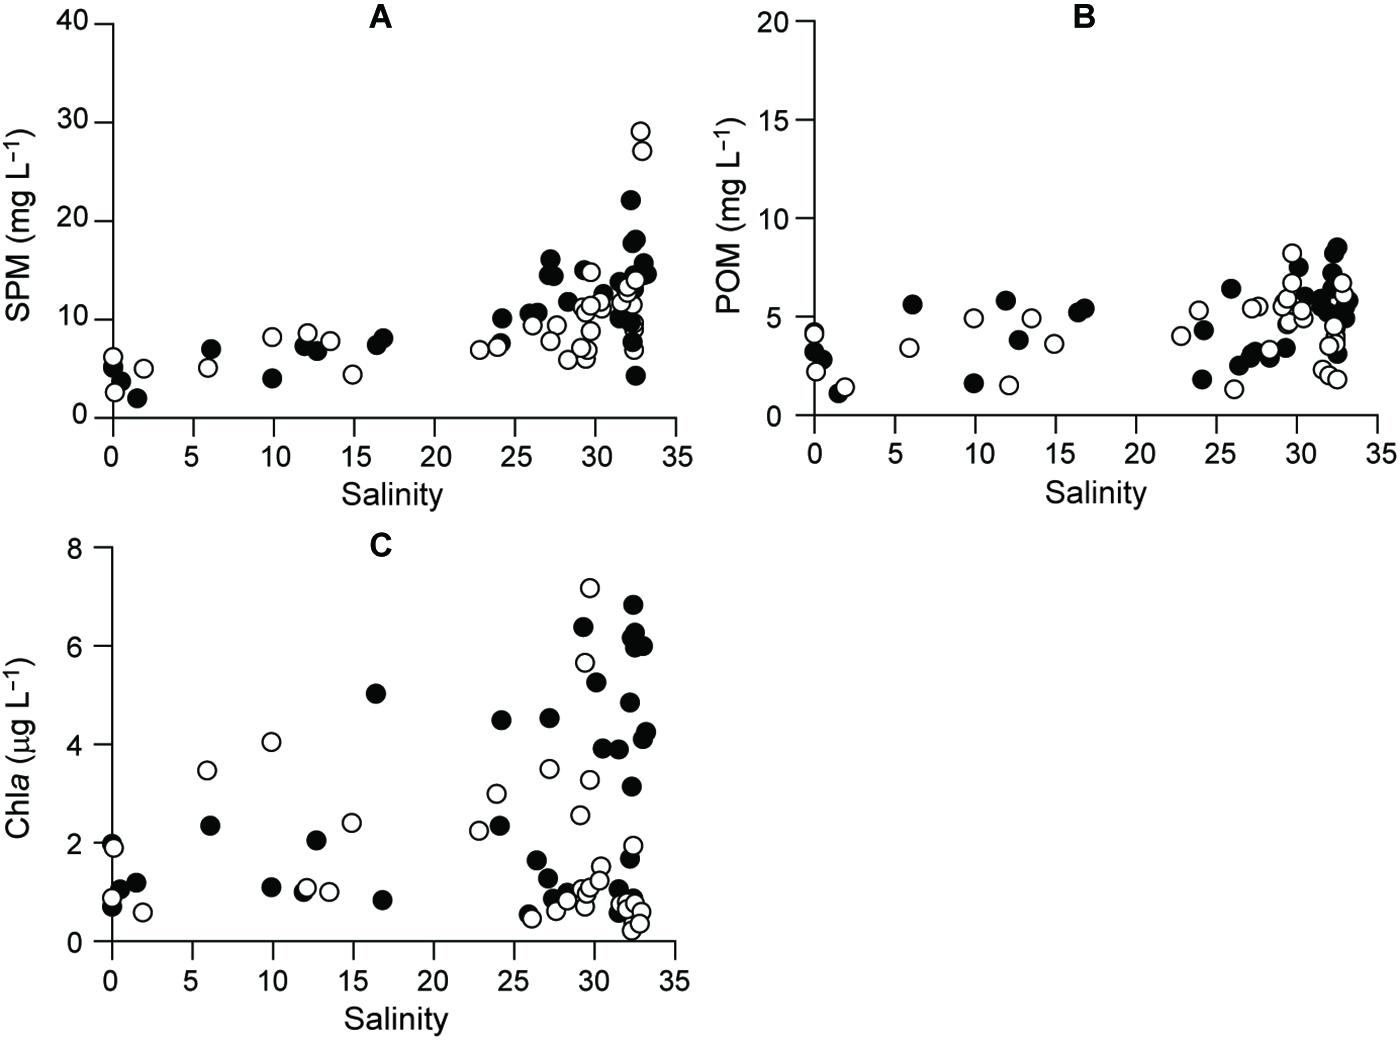
Figure 4. Distributional patterns, as a function of salinity, for (A) SPM, (B) POM, and (C) Chla. Filled and empty circles represent 2015 and 2016, respectively.
Phytoplankton biomass (Chla) varied from 0.2 to 7.2 μg L–1 across the salinity gradient (Figure 4C and Supplementary Table 1). Chla concentrations had significant seasonal fluctuation (Kruskal–Wallis test, df = 3, P < 0.001), with a pronounced spring maximum at the polyhaline stations (salinity > 30) and a fall minimum (<1 μg L–1) at almost all the stations (Dunn’s pairwise test, P < 0.001).
Particulate organic carbon varied from 103.1 to 399.3 μg L–1 and PN from 15.6 to 115.0 μg L–1 (Figures 5A,B and Supplementary Table 1). Both were somewhat higher in 2016 than in 2015 with a strongly coupled relationship (r = 0.82). The molar C:N ratio ranged from 3 to 8.6 with no significant seasonal (ANOVA, P = 0.072) or spatial (P = 0.622) variability (Figure 5C and Supplementary Table 2). The POC:Chla ratio ranged from 18.9 to 879.7 and displayed significant seasonal variation (Kruskal–Wallis test, df = 3, P < 0.001), with higher values in polyhaline stations in summer and fall 2016 than in other seasons (Dunn’s pairwise test, P < 0.001) and decreasing toward estuarine stations (Figure 5D). Low POC:Chla ratios (<200) occurred throughout the bay in 2015 and in spring 2016.
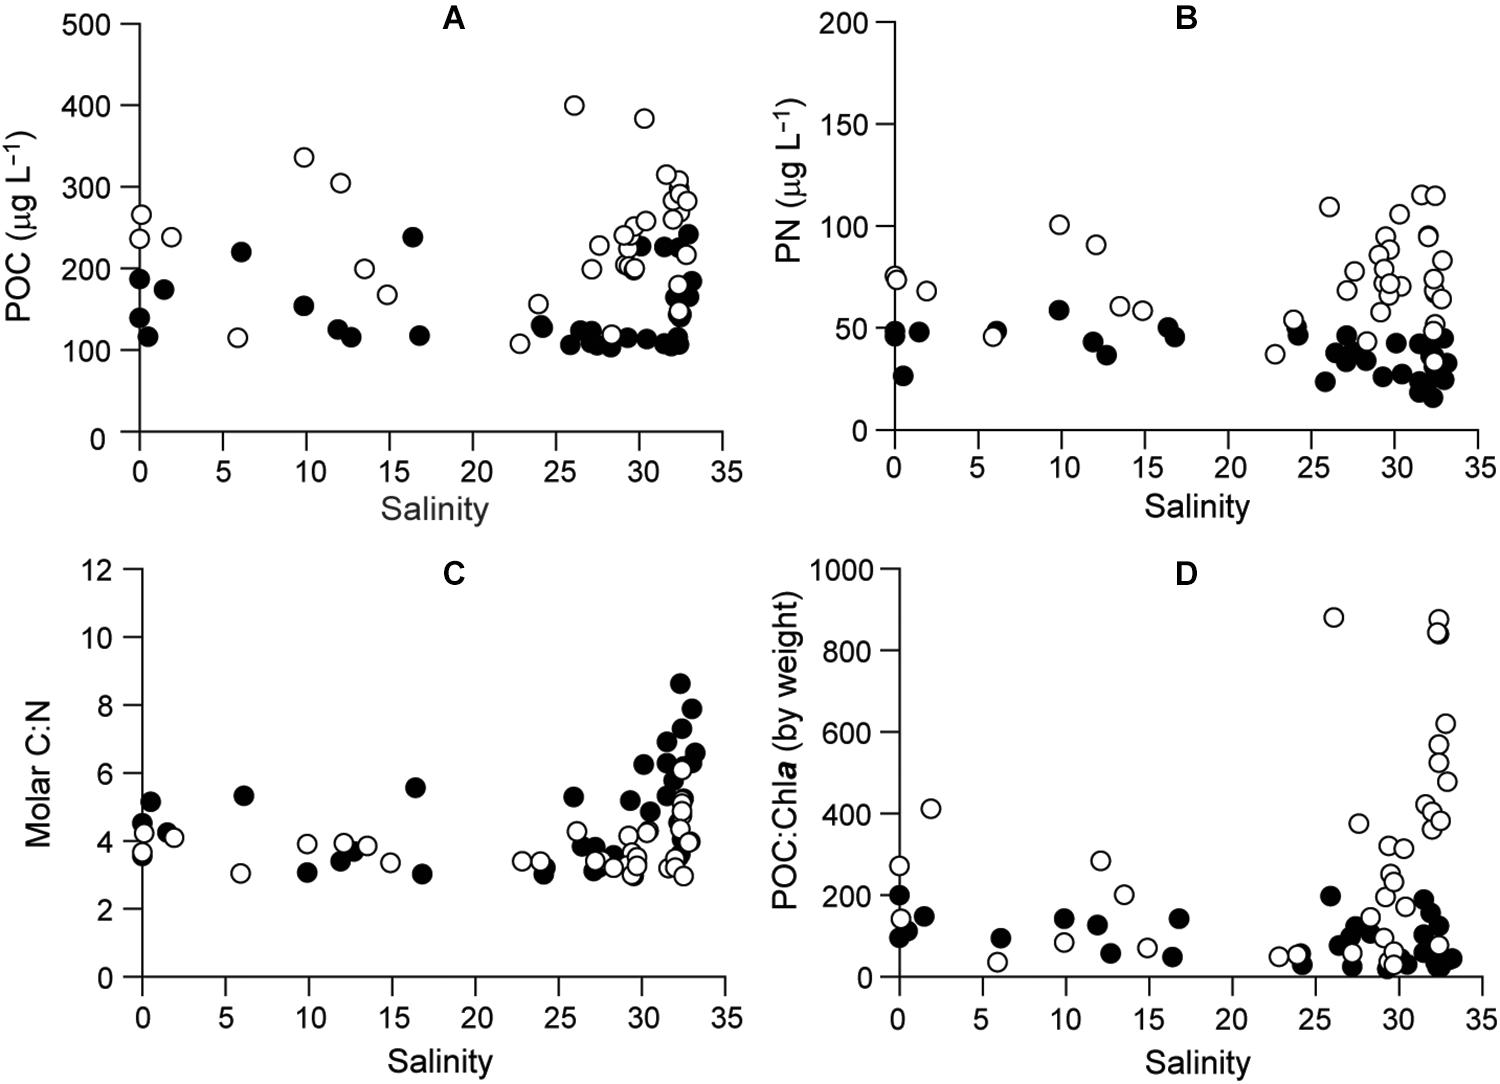
Figure 5. Profiles of (A) POC, (B) PON, (C) elemental C:N of POM, and (D) POC:Chla. Filled and empty circles represent 2015 and 2016, respectively.
Primary Productivity
Daily primary productivity (PP) varied from 43.5 to 1854.8 mg C m–2 d–1 (Figure 6). Despite significant spatial variation (ANOVA, F3,36 = 11.199, P < 0.001), no conspicuous spatial or seasonal trend was observed in daily PP. Low productivity was observed in the fall of both years (Tukey HSD, P < 0.001), with a similar pattern to Chla along the salinity gradient. It appears that phytoplankton biomass was washed out to the deep bay by high river flows in fall 2015–2016 and spring 2016.
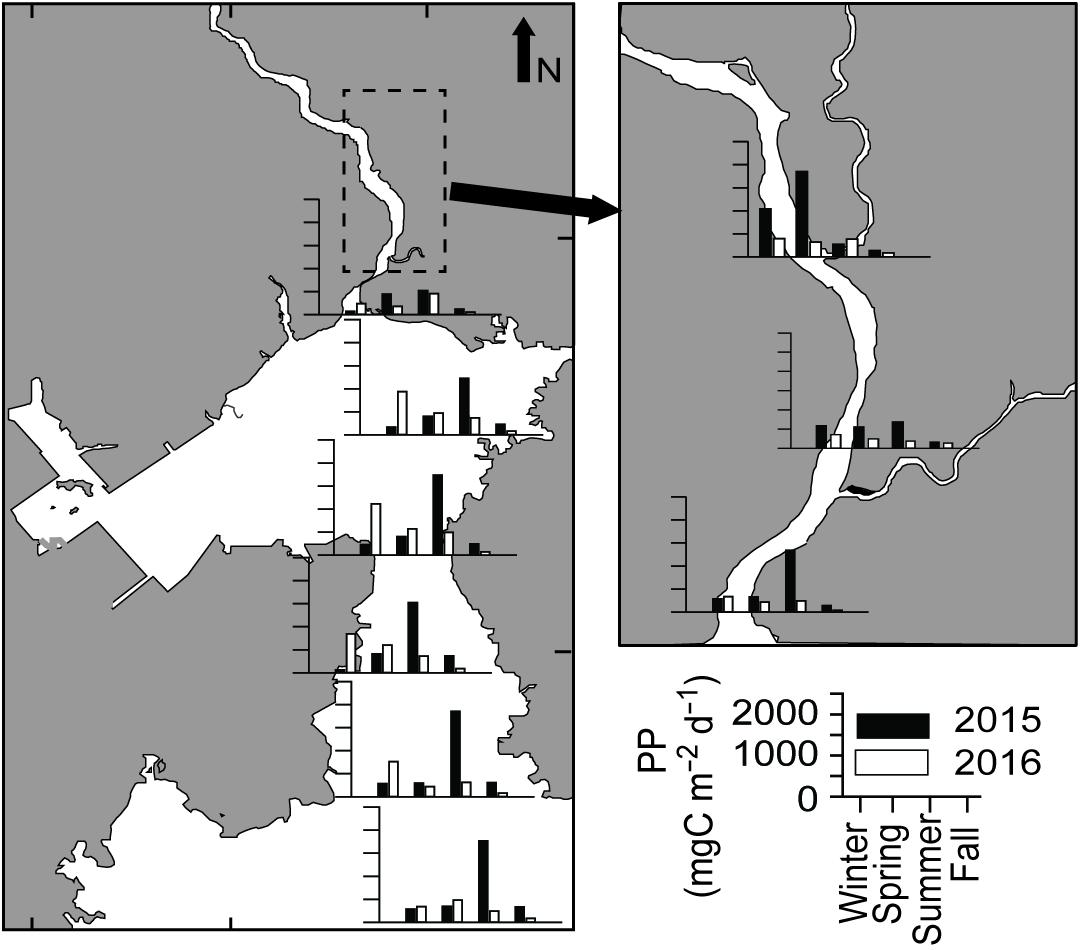
Figure 6. Primary productivity (mg C m–2 d–1) along the longitudinal transect of Gwangyang Bay.
δ13C and δ15N of POM
δ13CPOM values exhibited a broad range from −28.4 to −18.0‰, gradually increasing (r = 0.72) along the salinity gradient (Figure 7A and Supplementary Table 2). The lowest δ13CPOM values (−28.4 and −27.6‰) were observed during summer 2016 and 2015, respectively, at the river-mouth station (S1) and the highest values (around −20.0, −18.0‰) were found at the polyhaline deep-bay stations (Kruskal–Wallis test, df = 8, P = 0.000). δ15NPOM values varied between 3.2 and 9.4‰ (Figure 7B), with no significant spatial or seasonal variations (ANOVA, F8,36 = 1.728, P = 0.125; F3,36 = 2.606, P = 0.067, respectively) in either year.
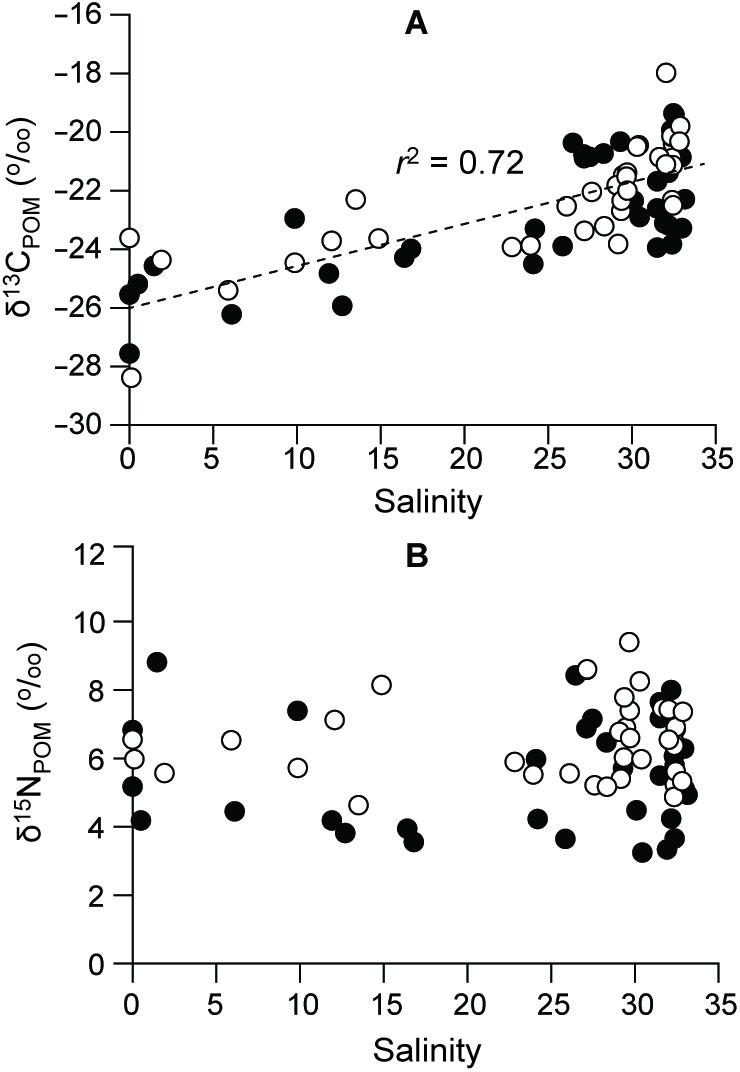
Figure 7. Levels of (A) δ13C and (B) δ15N in POM along the salinity gradient. Filled and empty circles represent 2015 and 2016, respectively.
Chemotaxonomic Composition of Phytoplankton
Based on the initial pigment ratios and the output marker pigment:Chla ratios (Supplementary Tables 3, 4), CHEMTAX results revealed that diatoms were the dominant contributor to total Chla, followed by chlorophytes in winter 2016, and cryptophytes and prasinophytes in winter 2015 (Figure 8). The contribution of cryptophytes to total Chla tended to decrease gradually from the river mouth to the deep-bay channel. Cryptophytes made similar contributions to diatoms in the fall of both years. Cyanobacteria contributed mainly in the summer of both years and dinoflagellates were prevalent at the deep-bay channel in summer 2015. Prymnesiophytes were minor contributors in all seasons and at all stations except winter 2015 when they bloomed at station S6. Pelagophytes contributed more during 2016 than 2015 at all the studied stations.
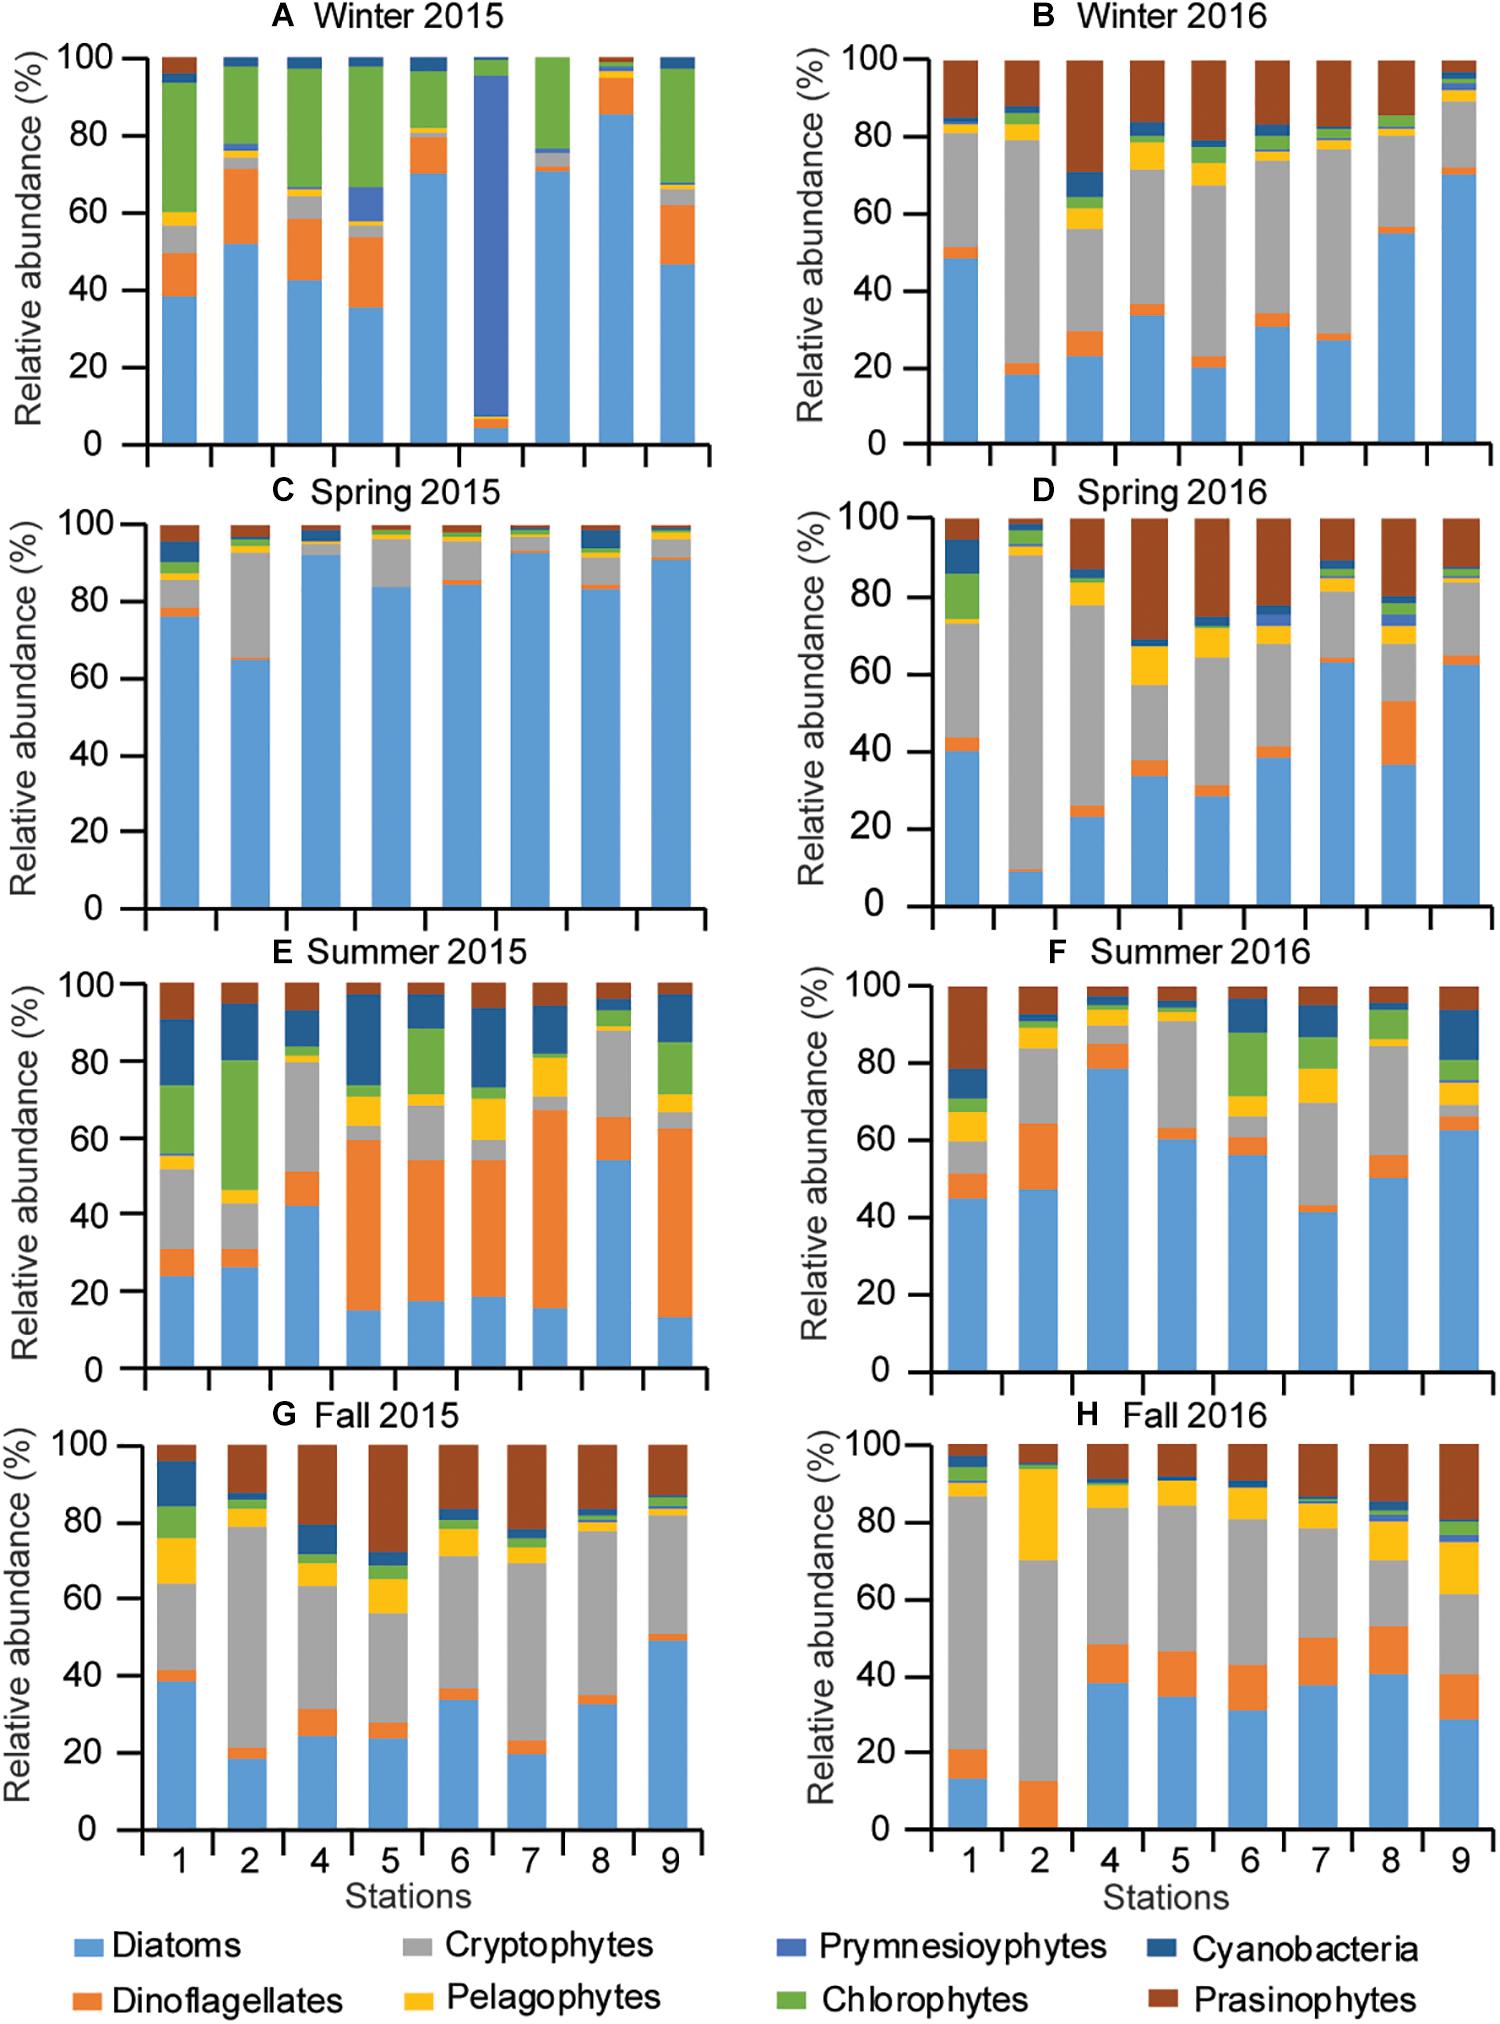
Figure 8. Seasonal pattern of phytoplankton community composition (A–H) along the riverine–estuarine–coastal marine continuum (S1 toward S9) during 2015 and 2016.
Association Between Phytoplankton and Biogeochemical Variables
Correlation analysis revealed complex relationships among physicochemical variables (Supplementary Table 5). SPM concentration (r = 0.65, P < 0.01) and δ13CPOM (r = 0.72, P < 0.01) both had significant positive correlations with salinity. In contrast, NO3– and SiO2 concentrations (r = −0.71 and −0.63, P < 0.01 for both) and N:P (r = −0.51, P < 0.01) were negatively correlated with salinity. No significant correlations (P > 0.05) between other biogeochemical variables (NH4+, NO2–, PO43–, POC, PN, C:N, POC:Chla, PP, and δ15NPOM) and salinity were found. While POC had a significant correlation with PN (r = 0.82, P < 0.01) and POC:Chla (r = 0.53, P < 0.01), PN had a negative correlation with C:N (r = −0.57, P < 0.01) but was positive with POC:Chla (r = 0.53, P < 0.01). In contrast, POC:Chla had negative correlations with Chla (r = −0.91, P < 0.01) and PP (r = −0.46, P < 0.01).
Principal component analysis characterized the interrelation among physicochemical variables (Figure 9 and Supplementary Table 6). We extracted three principal components (PCs) that explained 76.4% of the total variance. The first component (PC1) accounted for 45.8% of the total variance and discriminated between salinity and dissolved inorganic nutrients (NO3– and SiO2). The second component (PC2) explained 21.9% of the variance and was mainly related positively to PP (also Chla) and negatively to POC:Chla. Because the third component (PC3) explained only 8.7% of the variance, it was not interpreted. PCA biplots showed that the multivariate space is distinguishable along the PC1 axis (i.e., the salinity gradient) but the seasons, and the stations, have an overlapping pattern in relation to PC2.
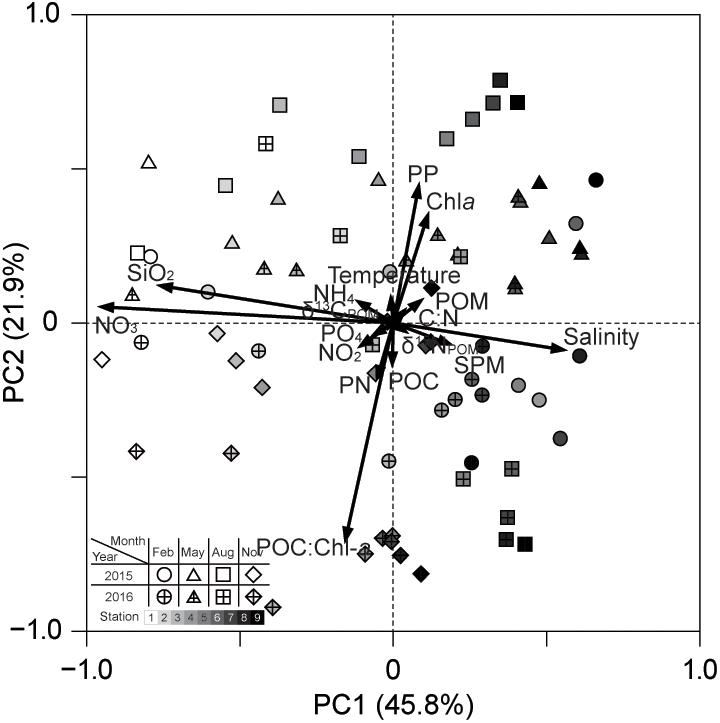
Figure 9. PC1 and PC2 plots from PCA of the physicochemical factors: SPM, suspended particulate matter; POM, particulate organic matter; POC, particulate organic carbon; PN, particulate nitrogen; PP, primary productivity.
The generalized additive models (GAMs) analysis indicated that phytoplankton community composition relates to salinity, water temperature, and SPM composition (C:N, POC:Chla, δ13C, and δ15N) (Figure 10 and Supplementary Table 7 and Supplementary Figure 1). Microphytoplankton (diatoms and dinoflagellates) showed a significant positive relationship with SPM and NO3– concentrations. Nanophytoplankton (cryptophytes, pelagophytes, and prymnesiophytes) had significant positive relationships with SiO2, POC:Chla, SPM, and C:N. Increased numbers of picophytoplankton (chlorophytes and cyanobacteria) were found at highly variable levels of salinity, PO43–, PP, and Chla. It should be noted that the environmental variables showing relationships with the phytoplankton groups were themselves related to either PC1 or PC2 in the aforementioned PCA.
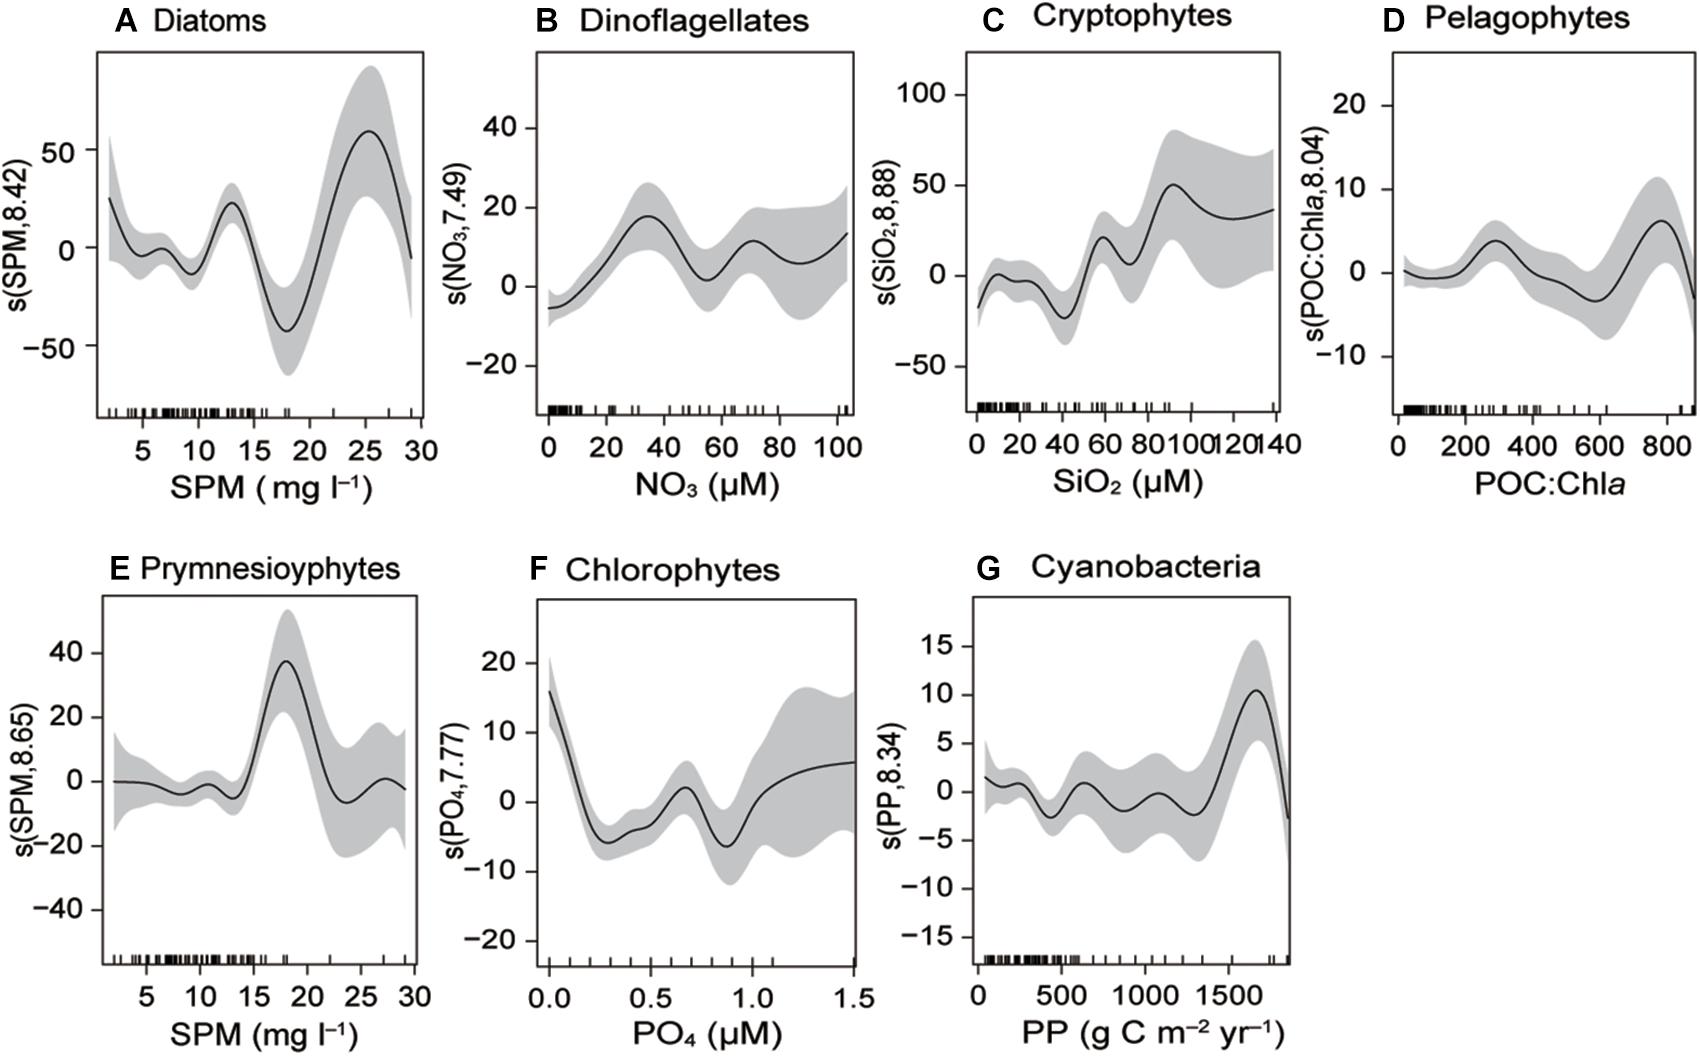
Figure 10. Generalized additive models (GAMs) fitted to the biogeochemical factors and phytoplankton community composition (A–G). Significant relationships (P < 0.01) are indicated as solid lines, with shaded areas representing the 95% confidence intervals.
Discussion
Like other estuarine embayment systems, the landscape of Gwangyang Bay has patchy and heterogeneous habitats [e.g., a common reed (Phragmites australis) bed in the estuarine littoral wetland, the intertidal muddy sand flat in the lower estuary is covered by benthic microalgae, eelgrass (Zostera marina) bed is on the fringe of the intertidal flat] and faces both, the river and the open sea (Figure 1; Kim et al., 2020). These ecologically diverse habitats connect directly and indirectly to the main channel of the bay. Although it has been assumed that organic matter originating from diverse wetland habitats is available to the main water channel (e.g., Kang et al., 2003), our measurements of the quantity and compositional proxies of POM, along the longitudinal transect, highlighted a significant contribution by autochthonous phytoplankton production to the bay’s POM pool. Low SPM concentrations in the estuary generates an exceptionally low-turbidity water column, in combination with short water-residence times (1.6–3.4 days, unpublished data), rapid water exchange between the bay and offshore restricts the accumulation of diverse-origin organic matter within the bay system. Furthermore, seasonal and spatial variations of the different phytoplankton size groups (pico-, nano-, and microphytoplankton) influences SPM quantity and composition.
Dominance of Phytoplankton-Derived POM
River discharge serves as an important source of nutrients and sediments to estuaries (Howarth, 1988; Wetsteyn and Kromkamp, 1994). Spatio-temporal variabilities of different processes that govern phytoplankton production and accumulation in estuaries are also driven by freshwater residence time of river discharge (Peierls et al., 2012). River dominated estuaries such as the Rhine, the Douro, and the Pearl River estuaries, with short water-residence time (<1 week) and low SPM concentrations (Middelburg and Herman, 2007; Guo et al., 2015), have high in situ phytoplankton production as compared to tidal estuaries such as the Scheldt and the Gironde estuaries that have long water-residence time (Jouanneau and Latouche, 1981; Heip et al., 1995; Frankignoulle et al., 1998) and are characterized by high SPM concentrations with negligible autochthonous production (Herman and Heip, 1999; Uncles et al., 2002). In contrast to highly turbid estuarine systems, with macrotides and long water-residence times (on the order of weeks to months) (Uncles et al., 2002; Middelburg and Herman, 2007; Liénart et al., 2017), the Gwangyang Bay system is characterized by mesotides and short water-residence times (a few days, unpublished data). Low SPM concentrations, even during high river discharge in summer, combined with the limited relationship between POC and SPM, and the positive correlation between salinity and SPM, suggest that river-borne and terrestrial organic matter (and carbon) are of relatively low importance in the system. Instead, high Chla and SPM concentrations in the polyhaline (salinity > 25) zone (Figure 4) and consistently low POC:Chla (<200, by weight) and molar C:N (3–8) ratios along the longitudinal transect (Figure 5), suggest that POM (and POC) concentrations in the system are the effect of biological processes (primary production, microbial respiration) in combination with physical processes (water-residence time and turbidity) within the system (Guo et al., 2015).
Proxies, such as POC:Chla ratio, C:N ratio, and δ13CPOM, have been widely used to differentiate the origins of estuarine POM, which is typically a mixture of autochthonous and allochthonous sources (see “Introduction”). Consistent with the previous findings in low-SPM estuaries (Middelburg and Herman, 2007; Savoye et al., 2012; Guo et al., 2015), δ13CPOM values in Gwangyang Bay had a wide range, increasing with increasing salinity. Compared with high end-member values in marine POM, low δ13CPOM values in association with high C:N (>10) and POC:Chla (>200) ratios at the upper estuarine station can be considered as end-member values of riverine POM indicating terrestrial and/or marsh vegetation (Kim et al., 2006; Middelburg and Herman, 2007; Liénart et al., 2017). Those authors used both end-member values to estimate the contribution of each source to the coastal POM pool. In the present study, we observed that δ13CPOM values fell within the usual ranges of riverine POM (annual mean: −25.7 ± 1.2‰), dominant marsh vegetation (−27.5 ± 0.6‰, P. australis), tidal-flat microphytobenthos (−14.8 ± 0.8‰), and eelgrass (−8.6 ± 1.0‰, Z. marina) (Kang et al., 2020; Kim et al., 2020). The longitudinal variation in the δ13CPOM values thus indicates mixed sources with varying proportions of local producers and river-borne POM. However, given a range of δ13CPOM values from −28.4 to −18.0‰, eelgrass contribution (δ13C value of −8.6 ± 1.0‰, Z. marina) to the POM pool may be negligible. Furthermore, molar C:N ratios of 40.6–125.5 for P. australis (Sun et al., 2016) and 13.0–14.6 for Z. marina leaves or 15.8–19.5 for rhizomes (Kim et al., 2012) are relatively high compared with those observed in the bay POM, suggesting a minor contribution to the POM pool of higher plant detritus.
The values of POM proxies (3–6 in C:N ratio and <200 in POC:Chla) in the oligohaline zone indicate that living algal sources dominate POM in the estuary. The observed δ13C values in riverine and estuarine-channel POM may be indicative of a considerable contribution of riverine algae to the estuarine POM pool. Previous studies, in the lowest reach of the Seomjin River, reported freshwater δ13CPOM values (−26.5 ± 1.4‰) very close to our estuarine δ13CPOM values and very low SPM concentrations (mean: 1.9–4.3 mg L–1) with restricted load delivery (28 ± 40 g C s–1 POC flux in the Seomjin River compared with 1122 ± 1007 g C s–1 in the adjacent Geum River with a diked estuary) (Yang and Choi, 2003; Kang et al., 2019). Based on the C:N (7.4–17.1) and POC:Chla (195 ± 156) ratios, and the positive correlations of both POM proxies with water discharge, those authors described an increased proportion of allochthonous (terrestrial) POC to the river-water POC pool and hydrological influence over POM concentrations in the Seomjin River. This body of evidence argues against an important contribution by riverine algae in the estuarine POM pool. Furthermore, short water-residence times support the low accumulation of terrestrial or marsh-derived SPM in the estuarine channel found in this study.
Another plausible algal source may be the presence of highly abundant microphytobenthos on the tidal flat (Kang et al., 2006). However, our HPLC pigment analysis indicated that the dominance of diatoms does not necessarily account for the overall Chla concentrations, except in spring 2015 (Figure 8). In addition, microscopic observations showed that centric diatoms, rather than pennate diatoms, constitute the major component of phytoplankton assemblages, indicating against a dominant role for resuspended microphytobenthos in the phytoplankton assemblage of Gwangyang Bay (Baek et al., 2015; Kang et al., 2020). Indeed, while an episodic increase (360–880) in POC:Chla ratios in the deep-bay stations during periods of high precipitation and river discharge (summer and fall 2016) were attributable to the increased importance of non-living detritus, low C:N ratio (3–6) and δ13CPOM values (−22.5 to −19.8‰) of POM during that period were close to typical values of marine POM in the bay (Kang et al., 2003, 2020; Kim et al., 2020), emphasizing the importance of marine phytoplankton-derived organic matter even in detrital POM.
As discussed earlier, several lines of evidence indicate that the increasing trend in δ13CPOM values along the salinity gradient in Gwangyang Bay should be explained by the δ13C values of phytoplankton rather than by various mixtures of local producer and river-borne terrestrial POM (Kim et al., 2020). The spatial variability in the δ13CPOM values may impede the identification of POM origins (Cloern et al., 2002; Guo et al., 2015). Based on a difference between the dissolved inorganic carbon (DIC) concentrations in freshwater and seawater, conservative DIC mixing between freshwater and seawater determines the DIC concentration and δ13CDIC values along the estuarine channel (Chanton and Lewis, 1999; Guo et al., 2015). Consequently, the δ13C values of phytoplankton reflect δ13CDIC values through isotopic fractionation processes during photosynthesis. Given the same degree of isotopic discrimination between DIC and POC originating from photosynthetic activity (Barth et al., 1998), the spatial variation of δ13CPOM values would be indicative of δ13CDIC values along the estuarine–coastal continuum (Raymond and Bauer, 2001; Hoffman and Bronk, 2006; Bianchi and Bauer, 2011). As a result, the observed spatial trend in δ13CPOM values, in combination with measured compositional POM proxies (such as Chla, POC:Chla, and C:N ratios), may reflect the particular contribution of living phytoplankton to the POM pool, along the estuarine–coastal continuum, of the studied system, as previously reported (Kim et al., 2020). In contrast, the spatially consistent δ15NPOM values (Figure 7 and Supplementary Table 2) provide clear evidence for a widespread contribution from phytoplankton production drawing on one dominant source of dissolved inorganic nitrogen (river input), rather than mixes of various organic matter sources whose δ15N values can range from 5.4 ± 0.4‰ to 8.4 ± 0.8‰ (Kang et al., 2020).
Low Turbidity and Factors Controlling Primary Productivity
Tidal and wind–wave resuspension of sediment plays a pivotal role in determining the temporal variability of water-column turbidity in an estuarine channel (May et al., 2003). Alternation of water-column stratification between well-mixed and highly stratified, over the spring–neap cycle, is a well-known phenomenon in the Seomjin River estuary (Shaha et al., 2010). The low SPM concentration in the river discharge suggests that the effect of stratification on turbidity is negligible. Indeed, a previous 25-h continuous monitoring study in this estuary showed no correlation between SPM concentration and the tidal cycle (Park et al., 2012). Water-column-depth variability, due to tidal shallowing and deepening, would be expected to influence wind–wave resuspension, especially in winter when the wind speed peaks. However, because the mountain range north of the bay protects it from strong prevailing northerly winds, this scenario may be rejected. As indicated by raised levels of phyto-detritus in the deep-bay channel, the greater fetch of summer-prevailing southerly winds through the narrow channel between the Yeosu peninsula and Namhae Island creates variability in spatial turbidity (May et al., 2003). The observed concentrations of SPM (4.3–18.1) and its biogeochemical proxies, such as low C:N (4.2–6.2), indicate that tide- or wind-driven resuspension of sediment makes a minimal contribution to seasonal and spatial variability of SPM.
Nutrient and light availability is an obvious factor controlling phytoplankton production and biomass (Cloern et al., 2014). Higher turbidity and longer residence-time estuaries have low mean annual phytoplankton productivity because light limitations reduce primary production (May et al., 2003; Gazeau et al., 2005; Murrell et al., 2007) as compared to estuaries with low turbidity and short residence time. The temporal variability in river flow appears to be a critical factor controlling seasonal and interannual variability of phytoplankton production in Gwangyang Bay. Our PCA results confirmed that the mesohaline zone stations differed from the polyhaline zone stations in terms of seasonal patterns of river inputs (PC1) and phytoplankton productivity (PC2). In the oligohaline zone, low SPM and high nutrient input created favorable conditions for phytoplankton growth during winter and spring 2015 leading to high phytoplankton productivity. On the other hand, in polyhaline zone high nutrient availability, as a result of high river discharge and low residence times during summer, resulted in peak phytoplankton production. This may explain the high PP and Chla concentrations under very low nutrient concentrations at the high saline bay-mouth area. Higher daily irradiance and temperature may also contribute to higher primary production during summer (Montani et al., 2003; Min et al., 2012). High summer PP has also been reported in other temperate coastal bay systems (Kim Y. et al., 2019). Reduced precipitation during winter and fall coincided with overall decreased PP and only small phytoplankton blooms. Variability in phytoplankton productivity and biomass (Chla) was also reflected in marked differences in nutrient utilization and changes in community composition within the phytoplankton size classes.
Despite large freshwater discharge from the Seomjin River, SPM concentrations in Gwangyang Bay had a longitudinally reverse gradient, across all seasons, falling from 2.0 mg L–1 at the river mouth to 29.1 mg L–1 at the deep-bay stations. In the high-river-flow season (spring of both years as well as summer 2015), well-defined Chla maxima occurred in the high salinity zone (salinity > 25; Figure 4C), suggesting an increased contribution of phytoplankton to raised SPM levels in the deep-bay channel (Baek et al., 2015; Lee et al., 2017). The positive correlation (r = 0.60) observed between SPM and Chla concentrations during spring 2015–2016 further confirms that phytoplankton production increases SPM concentrations along the salinity gradient (Kang et al., 2003). Low SPM and high contributions of phytoplankton production to POM is a characteristic of Gwangyang Bay and contrasts with higher turbidity estuaries (Savoye et al., 2012). Even though SPM concentrations were low, rapid downstream flushing of the nutrients exported from the Seomjin River, with short river discharge residence times, was demonstrated by Chla concentrations being lower in the upper reaches of the estuary and biological activity being greater in the high salinity zone (Kwon et al., 2002; Baek et al., 2015). It confirms that light availability is not a limiting factor for phytoplankton production in the Gwangyang Bay in contrast with other temperate estuaries like Delaware estuary (Pennock and Sharp, 1986) and San Francisco Bay (Cloern, 1987) where primary productivity is regulated by turbidity.
Great spatial variations of NO3– and SiO2 concentrations along a salinity gradient, and high N:P and Si:P ratios (∼100 compared to Redfield ratio of ∼16) at the oligohaline zone suggest a eutrophic condition in the estuarine channel due to large anthropogenic nitrogen and silicate inputs by river discharge (Kwon et al., 2001; Park et al., 2012). Rapid decreases in NO3– and SiO2 concentrations as well as high PP at the oligo- and euryhaline zone of the estuarine channel suggest active biological removal, diffusion and dilution by mixing with polyhaline deep-bay water. High dissolved oxygen concentrations with no hypoxic event in the entire bay area may support this explanation (Figure 2D). In contrast, higher NH4+ concentrations between the mixing and deep-bay zone than in the river-mouth and the offshore stations suggest unknown sources of ammonia. The NH4+ production processes from sewage treatment plants, fertilizer utilization, seagrass bed loss, and benthic fluxes are considered potential mechanisms elevating NH4+ in Gwangyang Bay (unpublished data), indicating another anthropogenic source of nutrients that might drive eutrophication and NH4+ availability for algal growth in the polyhaline bay area. Another interesting result is that there is a lack of spatial trend in PO43– concentrations. In terms of nutrient limitation, it has been broadly observed that phytoplankton growth is limited by phosphorus in estuarine systems with prevalent riverine nitrogen inputs (Harrison et al., 1990; Lee et al., 2017).
Possible Effect of Size Groups of Phytoplankton
Zooplankton grazing pressure (Chen et al., 2018; the authors’ unpublished data for grazing rate), the availability of nutrients, and other environmental conditions (Baek et al., 2015) can affect phytoplankton biomass. The size composition (i.e., micro-, nano-, and picophytoplankton) of phytoplankton assemblages may alter their relative contributions to POM quantity and composition. Smaller-sized phytoplankton have higher POC:Chla values because of their high surface to volume ratio and more efficient cellular growth under low light intensities (Chang et al., 2003; Veldhuis and Kraay, 2004; Putland and Iverson, 2007). Smaller cells also have a lower C:N ratio than larger cells (He et al., 2012). Therefore, the spatiotemporal variations in the distribution of POM composition (Chla, PP, POC:Chla, and C:N, δ13CPOM, δ13NPOM) can, in this study, be attributed to variation in phytoplankton communities along the estuarine–marine continuum (Figure 10 and Supplementary Figure 1 and Supplementary Table 7). Previous studies proved that small-sized phytoplankton significantly contribute to the overall biochemical composition of POM in association with seasonal variations in the phytoplankton assemblages in Gwangyang Bay (Lee et al., 2017; Kim D. et al., 2019). In contrast, some others have asserted that the contribution of microphytoplankton to total Chla, in Gwangyang Bay, is consistently dominant across the seasons (Jang et al., 2005; Baek et al., 2015). Our GAMs results showed no significant correlation between microphytoplankton and water temperature, suggesting that nutrient concentrations, rather than temperature, were a crucial factor determining microphytoplankton growth during this study. The degree of dominance of microphytoplankton varied with time and across space.
During the cold winter in 2015, phytoplankton communities were dominated by microphytoplankton, mainly diatoms, the POC:Chla ratio was low (<200), and δ15NPOM values were raised because DIN was relatively depleted. In contrast, pico- and nanophytoplankton proportions increased during winter 2016 under relatively low SiO2 concentrations and, therefore, resulted in high POC:Chla (>200) and low C:N ratios in conjunction with low Chla, especially at the oligohaline and mesohaline stations. Similarly, spring 2015 phytoplankton blooms dominated by microphytoplankton were characterized by low δ15NPOM, low POC:Chla, and relatively high C:N ratios. In contrast, the dominance of pico- and nanophytoplankton during spring 2016 mirrored decreased PP and reduced C:N values. Such a change in POM composition appears to be attributable to an increased contribution of smaller-sized phytoplankton to POM (Crawford et al., 2015).
The shift in species composition partially or fully contributed to δ13CPOM variation. δ13CPOM minimum in spring at the upper river-mouth station (S1) coincided with relatively increased contribution of cyanobacteria in the station (Falkowski, 1991). The δ13CPOM minimum was succeeded by an enrichment of δ13CPOM during spring 2015 as phytoplankton community was dominated by diatoms (Fry and Wainwright, 1991). On the other hand, small sized phytoplankton are δ13C depleted and display values ranged between −25.4 and −22.5‰ (Rau et al., 1990). The low stable isotopes values of δ13CPOM thus mirror the dominance of small sized phytoplankton group during spring 2016.
In summer 2015, microphytoplankton contributed to high Chla and PP at the mesohaline and polyhaline stations, resulting in very low (<40) POC:Chla, while δ13CPOM values coincided within the range of δ13C values of diatoms and dinoflagellates (Fry and Wainwright, 1991; Waite et al., 2005; Harmelin-Vivien et al., 2008). In contrast, in summer 2016, high water temperatures and reduced nutrients favored nano- and picophytoplankton resulting in very low Chla and high POC:Chla ratios in the polyhaline deep-bay stations (Chang et al., 2003; Putland and Iverson, 2007).
As indicated by GAMs analysis, seasonal and spatial variation of δ13NPOM is likely to be caused by changes in the major phytoplankton groups (Chen et al., 2018). Indeed, individual phytoplankton species were related to levels of SPM, POM, total Chla, and phytoplankton productivity, confirming that a shift in phytoplankton community composition may partially or fully explain spatiotemporal variation in POM composition (Supplementary Figure 1 and Supplementary Table 7).
Conclusion
This study explored spatial and temporal variability in POM composition, and its major controlling factors, along the riverine–estuarine continuum of Gwangyang Bay. Local production of phytoplankton is reflected in the distributional patterns of POM and is also indicated by the biogeochemical proxies (i.e., gradually increasing δ13C values, low POC:Chla, and low molar C:N) of SPM along the longitudinal transect. The POM pool mostly consists of freshly produced phytoplankton in the oligohaline zone along with phytodetritus in the polyhaline zone. High availability of phytoplankton-derived organic matter throughout the bay is highly consistent with the recent isotopic finding that it serves as an exclusive trophic contributor to the macrobenthic and pelagic communities (Kang et al., 2020; Kim et al., 2020). The GAMs model confirmed that shifts in the size distribution of the phytoplankton community account, to some degree, for the seasonal and spatial pattern of POM composition. This study highlighted the importance to the POM pool of autochthonous pelagic production in a low-turbidity temperate estuarine embayment. This paper is the first to identify the potential impacts of phytoplankton community composition on the temporal and site-specific characteristics of POM. It provides a baseline for further research, in varying environmental conditions, into low-turbidity estuaries and coastal embayment systems.
Data Availability Statement
The raw data supporting the conclusions of this article will be made available by the authors, without undue reservation.
Author Contributions
C-KK and RB designed the experiments and identified overarching research goals. RB, HK, and C-KK wrote the manuscript. RB, DK, JJ, GKK, and YK conducted field observations and performed the experiments. RB and HK analyzed the data and performed statistics. All authors contributed to the article and approved the submitted version.
Funding
This research was supported by the “Long-term change of structure and function in marine ecosystems of South Korea” funded by the Ministry of Oceans and Fisheries, South Korea.
Conflict of Interest
The authors declare that the research was conducted in the absence of any commercial or financial relationships that could be construed as a potential conflict of interest.
Acknowledgments
We thank Drs. Jeong Bae Kim and Jong-Bin Kim (National Institute of Fisheries Science, South Korea) for allowing access to an automated nutrient analyzer and fishing boat to cast a beam trawl.
Supplementary Material
The Supplementary Material for this article can be found online at: https://www.frontiersin.org/articles/10.3389/fmars.2020.580260/full#supplementary-material
Footnotes
References
Baek, S. H., Kim, D., Son, M., Yun, S. M., and Kim, Y. O. (2015). Seasonal distribution of phytoplankton assemblages and nutrient-enriched bioassays as indicators of nutrient limitation of phytoplankton growth in Gwangyang Bay, Korea. Estuar. Coast. Shelf Sci. 163, 265–278. doi: 10.1016/j.ecss.2014.12.035
Barth, J. A. C., Veizer, J., and Mayer, B. (1998). Origin of particulate organic carbon in the upper St. Lawrence: isotopic constraints. Earth Planet. Sci. Lett. 162, 111–121. doi: 10.1016/S0012-821X(98)00160-5
Bianchi, T. S. (2013). “Estuarine chemistry,” in Estuarine Ecology, eds J. W. Day, B. C. Crump, W. M. Kemp, and A. Yanez-Arancibia (Hoboken, NJ: John Wiley & Sons, Inc), 39–83. doi: 10.1002/9781118412787.ch3
Bianchi, T. S., and Bauer, J. E. (2011). “Particulate organic carbon cycling and transformation,” in Treatise on Estuarine and Coastal Science, eds E. Wolanski and D. S. McLusky (Waltham: Academic Press), 69–117. doi: 10.1016/b978-0-12-374711-2.00503-9
Bouillon, S., Connolly, R., and Lee, S. Y. (2008). Carbon exchange and cycling in mangrove ecosystems: a synthesis of recent insights based on stable isotope studies. J. Sea Res. 59, 44–58. doi: 10.1016/j.seares.2007.05.001
Bouillon, S., Dehairs, F., Schiettecatte, L. S., and Borges, A. V. (2007). Biogeochemistry of the Tana estuary and delta (northern Kenya). Limnol. Oceanogr. 52, 46–59. doi: 10.4319/lo.2007.52.1.0046
Bouillon, S., Gillikin, D. P., and Connolly, R. M. (2011). “Use of stable isotopes to understand food webs and ecosystem functioning in estuaries,” in Treatise on Estuarine and Coastal Science, eds E. Wolanski and D. S. McLusky (Waltham: Academic Press), 143–173. doi: 10.1016/b978-0-12-374711-2.00711-7
Chang, J., Shiah, F. K., Gong, G. C., and Chiang, K. P. (2003). Cross–shelf variation in carbon-to-chlorophyll a ratios in the East China Sea, summer 1998. Deep Sea Res. II Top. Stud. Oceanogr. 50, 1237–1247. doi: 10.1016/s0967-0645(03)00020-1
Chanton, J. P., and Lewis, F. G. (1999). Plankton and dissolved inorganic carbon isotopic composition in a river-dominated estuary: Apalachicola Bay, Florida. Estuaries 22, 575–583. doi: 10.2307/1353045
Chen, M., Kim, D., Liu, H., and Kang, C. K. (2018). Variability in copepod trophic levels and feeding selectivity based on stable isotope analysis in Gwangyang Bay of the southern coast of the Korean peninsula. Biogeosciences 15, 2055–2073. doi: 10.5194/bg-15-2055-2018
Cifuentes, L. A., Sharp, J. H., and Fogel, M. L. (1988). Stable carbon and nitrogen isotope biogeochemistry in the Delaware estuary. Limnol. Oceanogr. 33, 1102–1115. doi: 10.4319/lo.1988.33.5.1102
Cloern, J. E. (1987). Turbidity as a control on phytoplankton biomass and productivity in estuaries. Cont. Shelf Res. 7, 1367–1381. doi: 10.1016/0278-4343(87)90042-2
Cloern, J. E., Canuel, E. A., and Harris, D. (2002). Stable carbon and nitrogen isotope composition of aquatic and terrestrial plants of the San Francisco Bay estuarine system. Limnol. Oceanogr. 47, 713–729. doi: 10.4319/lo.2002.47.3.0713
Cloern, J. E., Foster, S. Q., and Kleckner, A. E. (2014). Phytoplankton primary production in the world’s estuarine-coastal ecosystems. Biogeosciences 11, 2477–2501. doi: 10.5194/bg-11-2477-2014
Cloern, J. E., and Jassby, A. D. (2012). Drivers of change in estuarine-coastal ecosystems: discoveries from four decades of study in San Francisco Bay. Rev. Geophys. 50, 1–33. doi: 10.1029/2012rg000397
Cloern, J. E., Jassby, A. D., Schraga, T. S., Nejad, E., and Martin, C. (2017). Ecosystem variability along the estuarine salinity gradient: examples from long-term study of San Francisco Bay. Limnol. Oceanogr. 62, 272–291. doi: 10.1002/lno.10537
Crawford, D. W., Wyatt, S. N., Wrohan, I. A., Cefarelli, A. O., Giesbrecht, K. E., Kelly, B., et al. (2015). Low particulate carbon to nitrogen ratios in marine surface waters of the Arctic. Glob. Biogeochem. Cycles 29, 2021–2033. doi: 10.1002/2015gb005200
Edmond, J. M., Boyle, E. A., Grant, B., and Sttallard, R. F. (1981). The chemical mass balance in the Amazon plume I: the nutrients. Deep Sea Res. Part A Oceanogr. Res. Pap. 28, 1339–1374. doi: 10.1016/0198-0149(81)90038-8
Falkowski, P. G. (1991). Species variability in the fractionation of 13C and 12C by marine phytoplankton. J. Plankton Res. 13, 21–28. doi: 10.1093/oxfordjournals.plankt.a042367
Fan, C., and Glibert, P. M. (2005). Effects of light on nitrogen and carbon uptake during a Prorocentrum minimum bloom. Harmful Algae 4, 629–641. doi: 10.1016/j.hal.2004.08.012
Frankignoulle, M., Abril, G., Borges, A., Bourge, I., Canon, C., Delille, B., et al. (1998). Carbon dioxide emission from European estuaries. Science 282, 434–436. doi: 10.1126/science.282.5388.434
Fry, B., and Wainwright, S. C. (1991). Diatoms sources of 13C-rich carbon in marine food webs. Mar. Ecol. Progr. Ser. 76, 149–157. doi: 10.3354/meps076149
Gazeau, F., Gattuso, J. P., Middelburg, J., Brion, N., Schiettecatte, L. S., Frankignoulle, M., et al. (2005). Planktonic and whole system metabolism in a nutrient-rich estuary (the Scheldt estuary). Estuar. Coast. 28, 868–883. doi: 10.1007/bf02696016
Guo, W., Ye, F., Xu, S., and Jia, G. (2015). Seasonal variation in sources and processing of particulate organic carbon in the Pearl River estuary, South China. Estuar. Coast. Shelf Sci. 167, 540–548. doi: 10.1016/j.ecss.2015.11.004
Hama, T., Miyazaki, T., Ogawa, Y., Iwakuma, M., Takahashi, M., Otsuki, A., et al. (1983). Measurement of photosynthetic production of a marine phytoplankton population using a stable isotop 13C isotope. Mar. Biol. 73, 31–36. doi: 10.1007/bf00396282
Harmelin-Vivien, M., Loizeau, V., Mellon, C., Beker, B., Arlhac, D., Bodiguel, X., et al. (2008). Comparison of C and N stable isotope ratios between surface particulate organic matter and microphytoplankton in the Gulf of Lions (NW Mediterranean). Cont. Shelf Res. 28, 1911–1919. doi: 10.1016/j.csr.2008.03.002
Harrison, P. J., Hu, M. H., Yang, Y. P., and Lu, X. (1990). Phosphate limitation in estuarine and coastal waters of China. J. Exp. Mar. Biol. Ecol. 140, 79–81. doi: 10.1016/0022-0981(90)90083-o
Hastie, T. J. (2017). “Generalized additive models,” in Statistical Models in S, ed. T. J. Hastie (Boca Raton, FL: CRC Press), 249–307.
He, J., Zhang, F., Lin, L., Ma, Y., and Chen, J. (2012). Bacterioplankton and picophytoplankton abundance, biomass, and distribution in the Western Canada Basin during summer 2008. Deep Sea Res. II 81–84, 36–45. doi: 10.1016/j.dsr2.2012.08.018
Heip, C. H. R., Goosen, N. K., Herman, P. M. J., Kromkamp, J., Middelburg, J. J., and Soetaert, K. (1995). Production and consumption of biological particles in temperate tidal estuaries. Oceanogr. Mar. Biol. Ann. Rev. 33, 1–150.
Herman, P. M. J., and Heip, C. H. R. (1999). Biochemistry of the maximum turbidity zone of estuaries (MATURE): some conclusions. J. Mar. Syst. 22, 89–104. doi: 10.1016/S0924-7963(99)00034-2
Hoffman, J. C., and Bronk, D. A. (2006). Interannual variation in stable carbon and nitrogen isotope biogeochemistry of the Mattaponi River, Virginia. Limnol. Oceanogr. 51, 2319–2332. doi: 10.4319/lo.2006.51.5.2319
Howarth, R. W. (1988). Nutrient limitation of net primary production in marine ecosystems. Annu. Rev. Ecol. Syst. 19, 89–110. doi: 10.1146/annurev.es.19.110188.000513
Jang, P. K., Lee, W. J., Jang, M. C., Lee, J. D., Lee, W. J., Chang, M., et al. (2005). Spatial and temporal distribution of inorganic nutrients and factors controlling their distributions in Gwangyang Bay. Ocean Polar Res. 27, 359–379. doi: 10.4217/opr.2005.27.4.359
Jeffrey, S. W. (1997). “Application of pigment methods to oceanography,” in Phytoplankton Pigments in Oceanography: Guidelines to Modern Methods, eds S. W. Jeffery, R. F. C. Mantoura, and S. W. Wright (Paris: UNESCO Publishing), 127–166.
Jouanneau, J. M., and Latouche, C. (1981). “The Gironde estuary,” in Contributions to Sedimentology, No. 10, eds H. Fuchtbauer, A. P. Lisitzyn, J. D. Millerman, and E. Seibold (Stuttgart: Schweizerbart’sche Verlagsbuchhandlung), 1–115. doi: 10.1046/j.1365-3091.1999.00196.x
Kanda, J., Saino, T., and Hattori, A. (1985). Nitrogen uptake by natural populations of phytoplankton 15 and primary production in the Pacific Ocean: regional variability of uptake capacity. Limnol. Oceanogr. 30, 987–999. doi: 10.4319/lo.1985.30.5.0987
Kang, C. K., Kim, J. B., Lee, K. S., Kim, J. B., Lee, P. Y., and Hong, J. S. (2003). Trophic importance of benthic microalgae to macrozoobenthos in coastal bay systems in Korea: dual stable C and N isotope analyses. Mar. Ecol. Progr. Ser. 259, 79–92. doi: 10.3354/meps259079
Kang, C. K., Lee, Y. W., Choy, E. J., Shin, J. K., Seo, I. S., and Hong, J. S. (2006). Microphytobenthos seasonality determines growth and reproduction in intertidal bivalves. Mar. Ecol. Progr. Ser. 315, 113–127. doi: 10.3354/meps315113
Kang, H. Y., Kim, C., Kim, D., Lee, Y.-J., Park, H. J., Kundu, G. K., et al. (2020). Identifying patterns in the multitrophic community and food-web structure of a low-turbidity temperate estuarine bay. Sci. Rep. (accepted).
Kang, S., Kim, J. H., Kim, D., Song, H., Ryu, J. S., Ock, G., et al. (2019). Temporal variation in riverine organic carbon concentrations and fluxes in two contrasting estuary systems: Geum and Seomjin, South Korea. Environ. Int. Part A 133:105126. doi: 10.1016/j.envint.2019.105126
Kim, B. J., Ro, Y. J., Jung, K. Y., and Park, K. S. (2014). Numerical modeling of circulation characteristics in the Kwangyang Bay estuarine system. J. Korean Soc. Coast. Ocean Eng. 26, 253–266. doi: 10.9765/kscoe.2014.26.4.253
Kim, C., Kang, H. Y., Lee, Y. J., Yun, S. G., and Kang, C. K. (2020). Isotopic variation of macroinvertebrates and their sources of organic matter along an estuarine gradient. Estuar. Coast. 43, 496–511. doi: 10.1007/s12237-019-00543-z
Kim, J. B., Park, J. I., Lee, W. C., and Lee, K. S. (2012). Seasonal changes in the carbon and nitrogen contents of Zostera marina populations in the intertidal and subtidal zones of the Seomjin Estuary Korea. Kor. J. Fish. Aquat. Sci. 45, 65–75. doi: 10.5657/kfas.2012.0065
Kim, J. H., Schouten, S., Buscail, R., Ludwig, W., Bonnin, J., Sinninghe Damste, J. S., et al. (2006). Origin and distribution of terrestrial organic matter in the NW Mediterranean (Gulf of Lion): exploring the newly developed BIT index. Geochem. Geophys. Geosyst. 7:Q11017. doi: 10.1029/2006gc001306
Kim, Y., Lee, J. H., Kang, J. J., Lee, J. H., Lee, H. W., Kang, C. K., et al. (2019). River discharge effects on the contribution of small-sized phytoplankton to the total biochemical composition of POM in the Gwangyang Bay, Korea. Estuar. Coast. Shelf Sci. 226:106293. doi: 10.1016/j.ecss.2019.106293
Kim, D., Lee, Y. J., Kang, H. Y., Kwon, K. Y., Lee, W. C., and Kwak, J. Y. (2019). Seasonal variations in primary productivity and biomass of phytoplankton in Geoje-Hansan Bay on the Southern Coast of Korea. Ocean Sci. J. 54, 213–227. doi: 10.1007/s12601-019-0005-y
Kristensen, E., Bouillon, S., Dittmar, T., and Marchand, C. (2008). Organic carbon dynamics in mangrove ecosystems: a review. Aquat. Bot. 89, 201–219. doi: 10.1016/j.aquabot.2007.12.005
Kwak, J. H., Lee, S. H., Hwang, J., Suh, Y. S., Park, H., Chang, K. I., et al. (2014). Summer primary productivity and phytoplankton community composition driven by different hydrographic structures in the East/Japan Sea and the Western Subarctic Pacific. J. Geophys. Res. Oceans 119, 4505–4519. doi: 10.1002/2014jc009874
Kwon, K. Y., Moon, C. H., Kang, C. K., and Kim, Y. N. (2002). Distribution of particulate organic matters along the salinity gradients in the Seomjin River estuary. Korean J. Fish. Aquat. Sci. 35, 86–96. doi: 10.5657/kfas.2002.35.1.086
Kwon, K. Y., Moon, C. H., Lee, J. S., Yang, S. R., Park, M. O., and Lee, P. Y. (2004). Estuarine behavior and flux of nutrients in the Seomjin River estuary. Sea J. Korean Soc. Oceanogr. 9, 153–163. doi: 10.5322/JESI.2014.23.6.1049
Kwon, K. Y., Moon, C. H., and Yang, H. S. (2001). Behavior of nutrient along the salinity gradients in the Seomjin River Estuary. J. Korean Fish. Soc. 34, 199–206.
Lancelot, C., and Muylaert, K. (2011). “Trends in estuarine phytoplankton ecology,” in Treatise on Estuarine and Coastal Science, Functioning of Ecosystems at the Land-ocean Interface, eds E. Wolanski and D. S. Mclusky (Waltham: Academic Press), 5–15. doi: 10.1016/b978-0-12-374711-2.00703-8
Lee, J. H., Lee, D., Kang, J. J., Joo, H. T., Lee, J. H., Lee, H. W., et al. (2017). The effects of different environmental factors on the biochemical composition of particulate organic matter in Gwangyang Bay, South Korea. Biogeosciences 14, 1903–1917. doi: 10.5194/bg-2016-347
Lee, Y. S., and Kang, C. K. (2010). Causes of COD increases in Gwangyang Bay, South Korea. J. Environ. Monit. 12, 1537–1546. doi: 10.1039/c001733g
Lee, Y. W., Park, M. O., Kim, Y. S., Kim, S. S., and Kang, C. K. (2011). Application of photosynthetic pigment analysis using a HPLC and CHEMTAX program to studies of phytoplankton community composition. J. Korean Soc. Oceanogr. 16, 117–124. doi: 10.7850/jkso.2011.16.3.117
Liénart, C., Savoye, N., Bozec, Y., Breton, E., Conan, P., David, V., et al. (2017). Dynamics of particulate organic matter composition in coastal systems: a spatio-temporal study at multi-systems scale. Prog. Oceanogr. 156, 221–239. doi: 10.1016/j.pocean.2017.03.001
Mackey, M. D., Mackey, D. J., Higgins, H. W., and Wright, S. W. (1996). CHEMTAX – a program for estimating class abundances from chemical marker: application to HPLC measurements of phytoplankton. Mar. Ecol. Progr. Ser. 144, 265–283. doi: 10.3354/meps144265
May, C. L., Koseff, J. R., Lucas, L. V., Cloern, J. E., and Schoellhamer, D. H. (2003). Effects of spatial and temporal variability of turbidity on phytoplankton blooms. Mar. Ecol. Progr. Ser. 254, 111–128. doi: 10.3354/meps254111
Middelburg, J. J., and Herman, P. M. J. (2007). Organic matter processing in tidal estuaries. Mar. Chem. 106, 127–147. doi: 10.1016/j.marchem.2006.02.007
Min, J. O., Ha, S. Y., Chung, M. H., Choi, B. H., Lee, Y. J., Youn, W. D., et al. (2012). Seasonal variation of primary productivity and pigment of phytoplankton community structure in the Seomjin Estuary. Korean J. Limnol. 45, 139–149. doi: 10.3390/su12041675
Montani, S., Magni, P., and Abe, N. (2003). Seasonal and interannual patterns of intertidal microphytobenthos in combination with laboratory and areal production estimates. Mar. Ecol. Progr. Ser. 249, 79–91. doi: 10.3354/meps249079
Murrell, M. C., Hagy, J. D. III, Lores, E. M., and Greene, R. M. (2007). Phytoplankton production and nutrient distributions in a subtropical estuary: importance of freshwater flow. Estuar. Coast. 30, 390–402. doi: 10.1007/bf02819386
Nieuwenhuize, J., Maas, Y. E. M., and Middelburg, J. J. (1994). Rapid analysis of organic carbon and nitrogen in particulate materials. Mar. Chem. 45, 217–224. doi: 10.1016/0304-4203(94)90005-1
Park, M. O., Kim, S. S., Kim, S. G., Kwon, J., Lee, S. M., and Lee, Y. W. (2012). Factors controlling temporal-spatial variations of marine environment in the Seomjin River Estuary through 25-hour continuous monitoring. J. Korean Soc. Mar. Environ. Eng. 15, 314–322. doi: 10.7846/jkosmee.2012.15.4.314
Parsons, T. R., Maita, Y., and Lalli, C. M. (1984). A Manual of Biological and Chemical Methods for Seawater Analysis. Oxford: Pergamon Press.
Peierls, B. L., Hall, N. S., and Paerl, H. W. (2012). Non-monotonic responses of phytoplankton biomass accumulation to hydrologic variability: a comparison of two coastal plain North Carolina estuaries. Estuar. Coast. 35, 1–17. doi: 10.1007/s12237-012-9547-2
Pennock, J. R., and Sharp, J. H. (1986). Phytoplankton production in the Delaware Estuary: temporal and spatial variability. Mar Ecol. Progr. Ser. 34, 143–155. doi: 10.3354/meps034143
Pocklington, R. (1976). Terrigenous organic matter in surface sediments from the Gulf of St-Lawrence. J. Fish. Res. Board. Can. 33, 93–97. doi: 10.1139/f76-011
Polis, G. A., Anderson, W. B., and Holt, R. D. (1997). Toward an integration of landscape and food web ecology the dynamics of spatially subsidized food webs. Annu. Rev. Ecol. Syst. 28, 289–316. doi: 10.1146/annurev.ecolsys.28.1.289
Poole, H. H., and Atkins, W. R. G. (1929). Photo-electric measurements of submarine illumination throughout the year. J. Mar. Biol. Assoc. 16, 297–324. doi: 10.1017/s0025315400029829
Putland, J. N., and Iverson, R. L. (2007). Phytoplankton biomass in a subtropical estuary: distribution, size composition, and carbon:chlorophyll ratios. Estuar. Coast. 30, 878–885. doi: 10.1007/bf02841341
Rau, G. H., Teyssie, J. L., Rassoulzadegan, F., and Fowler, S. (1990). 13C/12C and 15N/14N variations among size-fractionated marine particles: implications for their origin and trophic relationships. Mar. Ecol. Progr. Ser. 59, 33–38. doi: 10.3354/meps059033
Raymond, P. A., and Bauer, J. E. (2001). Use of 14C and 13C natural abundances as a tool for evaluating freshwater, estuarine and coastal POC and DOC sources and cycling: a review and synthesis. Org. Geochem. 32, 469–485. doi: 10.1016/s0146-6380(00)00190-x
Savoye, N., Aminot, A., Treguer, P., Fontugne, M., Naulet, N., and Kérouel, R. (2003). Dynamics of particulate organic matter (15N and (13C during spring phytoplankton blooms in a macrotidal ecosystem (Bay of Seine, France). Mar. Ecol. Progr. Ser. 255, 27–41. doi: 10.3354/meps255027
Savoye, N., David, V., Morisseau, F., Etcheber, H., Abril, G., Billy, I., et al. (2012). Origin and composition of particulate organic matter in a macrotidal turbid estuary: the Gironde Estuary, France. Estuar. Coast. Shelf Sci. 108, 16–28. doi: 10.1016/j.ecss.2011.12.005
Shaha, D. C., Cho, Y. K., Kim, T. W., and Valle-Levinson, A. (2012). Spatio-temporal variation of flushing time in the Sumjin River estuary. Terr. Atmos. Ocean. Sci. 23, 119–130. doi: 10.3319/tao.2011.08.22.01(hy)
Shaha, D. C., Cho, Y. K., Seo, G. H., Kim, C. S., and Jung, K. T. (2010). Using flushing rate to investigate spring-neap and spatial variations of gravitational circulation and tidal exchanges in an estuary. Hydrol. Earth Syst. Sci. 14, 1465–1476. doi: 10.5194/hess-14-1465-2010
Sun, Z., Mou, X., and Sun, W. (2016). Potential effects of tidal flat variations on decomposition and nutrient dynamics of Phragmites australis, Suaeda salsa and Suaeda glauca litter in newly created marshes of the Yellow River Estuary, China. Ecol. Eng. 93, 175–186. doi: 10.1016/j.ecoleng.2016.05.024
Uncles, R. J., Stephens, J. A., and Smith, R. E. (2002). The dependence of estuarine turbidity on tidal intrusion length, tidal range and residence time. Cont. Shelf Res. 22, 1835–1856. doi: 10.1016/s0278-4343(02)00041-9
Veldhuis, M. J. W., and Kraay, G. Y. (2004). Phytoplankton in the subtropical Atlantic Ocean: towards a better assessment of biomass and composition. Deep Sea Res. I. 51, 507–530. doi: 10.1016/j.dsr.2003.12.002
Waite, A. M., Gustafsson, Ö, Lindahl, O., and Tiselius, P. (2005). Linking ecosystem dynamics and biogeochemistry: sinking fractionation of organic carbon in a Swedish fjord. Limnol. Oceanogr. 50, 658–671. doi: 10.4319/lo.2005.50.2.0658
Wang, X. C., Chen, R. F., and Gardner, G. B. (2004). Sources and transport of dissolved and particulate organic carbon in the Mississippi River estuary and adjacent coastal waters of the northern Gulf of Mexico. Mar. Chem. 89, 241–256. doi: 10.1016/j.marchem.2004.02.014
Wetsteyn, L. P. M. J., and Kromkamp, J. C. (1994). Turbidity, nutrients and phytoplankton primary production in the Oosterschelde (The Netherlands) before, during and after a large-scale coastal engineering project (1980–1990). Hydrobiologia 282, 61–78. doi: 10.1007/bf00024622
Wright, S. W., and van den Eden, R. L. (2000). Phytoplankton community structure and stocks in the East Antarctic marginal ice zone (BROKE survey, January–March 1996) determined by CHEMTAX analysis of HPLC pigment signatures. Deep Sea Res. II 47, 2363–2400. doi: 10.1016/s0967-0645(00)00029-1
Wu, Y., Zhang, J., Liu, S. M., Zhang, Z. F., Yao, Q. Z., Hong, G. H., et al. (2007). Sources and distribution of carbon within the Yangtze River system. Estuar. Coast. Shelf. Sci. 71, 13–25. doi: 10.1016/j.ecss.2006.08.016
Yang, H. K., and Choi, H. C. (2003). Estimation of water quality environmental in Youngsan and Seumjin River basins. J. Kor. Geogr. Soc. 38, 16–31.
Zapata, M., Rodríguez, F., and Garrido, J. L. (2000). Separation of chlorophylls and carotenoids from marine phytoplankton: a new HPLC method using a reversed phase C8 column and pyridine containing mobile phases. Mar. Ecol. Progr. Ser. 195, 29–45. doi: 10.3354/meps195029
Keywords: estuarine bay, low turbidity, short residence time, C pool, biogeochemical processes
Citation: Bibi R, Kang HY, Kim D, Jang J, Kundu GK, Kim YK and Kang C-K (2020) Dominance of Autochthonous Phytoplankton-Derived Particulate Organic Matter in a Low-Turbidity Temperate Estuarine Embayment, Gwangyang Bay, Korea. Front. Mar. Sci. 7:580260. doi: 10.3389/fmars.2020.580260
Received: 05 July 2020; Accepted: 09 September 2020;
Published: 05 October 2020.
Edited by:
Sanjeev Kumar, Physical Research Laboratory, IndiaReviewed by:
Rajdeep Roy, Indian Space Research Organisation, IndiaRaghab Ray, University of Tokyo, Japan
Copyright © 2020 Bibi, Kang, Kim, Jang, Kundu, Kim and Kang. This is an open-access article distributed under the terms of the Creative Commons Attribution License (CC BY). The use, distribution or reproduction in other forums is permitted, provided the original author(s) and the copyright owner(s) are credited and that the original publication in this journal is cited, in accordance with accepted academic practice. No use, distribution or reproduction is permitted which does not comply with these terms.
*Correspondence: Chang-Keun Kang, Y2trYW5nQGdpc3QuYWMua3I=