 Kaisa Kraft1*
 Jukka Seppälä1
 Heidi Hällfors1
 Sanna Suikkanen1
 Pasi Ylöstalo1
 Sílvia Anglès1†
 Sami Kielosto1Harri Kuosa1
 Lauri Laakso2,3Martti Honkanen2
 Sirpa Lehtinen1Johanna Oja1
 Timo Tamminen1
- 1Finnish Environment Institute, Marine Research Centre, Helsinki, Finland
- 2Finnish Meteorological Institute, Helsinki, Finland
- 3Atmospheric Chemistry Research Group, Chemical Resource Beneficiation, North-West University, Potchefstroom, South Africa
Cyanobacteria are an important part of phytoplankton communities, however, they are also known for forming massive blooms with potentially deleterious effects on recreational use, human and animal health, and ecosystem functioning. Emerging high-frequency imaging flow cytometry applications, such as Imaging FlowCytobot (IFCB), are crucial in furthering our understanding of the factors driving bloom dynamics, since these applications provide community composition information at frequencies impossible to attain using conventional monitoring methods. However, the proof of applicability of automated imaging applications for studying dynamics of filamentous cyanobacteria is still scarce. In this study we present the first results of IFCB applied to a Baltic Sea cyanobacterial bloom community using a continuous flow-through setup. Our main aim was to demonstrate the pros and cons of the IFCB in identifying filamentous cyanobacterial taxa and in estimating their biomass. Selected environmental parameters (water temperature, wind speed and salinity) were included, in order to demonstrate the dynamics of the system the cyanobacteria occur in and the possibilities for analyzing high-frequency phytoplankton observations against changes in the environment. In order to compare the IFCB results with conventional monitoring methods, filamentous cyanobacteria were enumerated from water samples using light microscopical analysis. Two common bloom forming filamentous cyanobacteria in the Baltic Sea, Aphanizomenon flosaquae and Dolichospermum spp. dominated the bloom, followed by an increase in Oscillatoriales abundance. The IFCB results compared well with the results of the light microscopical analysis, especially in the case of Dolichospermum. Aphanizomenon biomass varied slightly between the methods and the Oscillatoriales results deviated the most. Bloom formation was initiated as water temperature increased to over 15°C and terminated as the wind speed increased, dispersing the bloom. Community shifts were closely related to movements of the water mass. We demonstrate how using a high-frequency imaging flow cytometry application can help understand the development of cyanobacteria summer blooms.
Introduction
Cyanobacteria are among the oldest organisms in the world, and were involved in the process of the Earth evolving into a planet with an oxygen-rich atmosphere. They are an important component of phytoplankton communities, producing oxygen and recycling nutrients. In contrast to eukaryotic phytoplankton, many cyanobacterial species are able to utilize atmospheric nitrogen (N2) giving them an advantage in nitrogen-depleted conditions. Nitrogen-fixing (diazotrophic) cyanobacteria are an important contributor to the new nitrogen input in many marine systems (e.g., Capone et al., 1997; Larsson et al., 2001; Gallon et al., 2002; Mulholland et al., 2006; Westberry and Siegel, 2006; Klawonn et al., 2016).
Besides being an important part of marine and freshwater ecosystems, cyanobacteria also form extensive, potentially toxic blooms harmful to, for example, aquaculture, water supply systems, recreational use of aquatic systems and human health (Anderson et al., 2019; Burford et al., 2020). Harmful cyanobacterial blooms influence the whole ecosystem via production of toxins that are released to the water or transferred to higher trophic levels by grazing zooplankton (Ibelings and Chorus, 2007; Ibelings and Havens, 2008; Sopanen et al., 2009). Cyanotoxins may affect the growth and condition of fish larvae and accumulate in benthic filter feeders (Ibelings and Chorus, 2007; Karjalainen et al., 2007; Ibelings and Havens, 2008). Massive blooms also cause anoxic bottom conditions through sedimentation of a high amount of decaying organic matter as the bloom declines (Vahtera et al., 2007).
Harmful cyanobacterial blooms occur primarily in freshwater ecosystems and in brackish conditions in estuarine and coastal waters and may intensify and expand due to shifts in the environment driven by climate change and eutrophication (O’Neil et al., 2012; Wells et al., 2020 and references therein). As reviewed by Huisman et al. (2018), several papers have emerged in recent years that link the frequency, intensity and duration of cyanobacterial blooms to global warming, rising CO2 levels and eutrophication of, especially, coastal areas.
Cyanobacterial blooms are of concern in the Baltic Sea, being basin-wide and recurrent phenomena (Kahru and Elmgren, 2014). The mechanisms behind the bloom dynamics in the Baltic Sea have been studied widely (Kahru et al., 1994; Kanoshina et al., 2003; Kangro et al., 2007; Kahru et al., 2020). In general, it appears that the low summertime dissolved inorganic nitrogen concentration and low inorganic N:P ratio typically occurring in the Baltic Proper and in the Gulf of Finland favor nitrogen-fixing cyanobacteria dominance in these areas. Bloom development is initiated mainly by phosphorus availability of the surface water and a calm, warm weather period that enables the warming and shallowing of the surface layer above a seasonal thermocline (Sellner, 1997; Kahru et al., 2000; Kanoshina et al., 2003; Lips and Lips, 2008), with July weather conditions being the main trigger (Kahru et al., 2020). However, the species composition of blooms varies, and the exact composition is still difficult to predict and verify.
In the Baltic Proper and in the Gulf of Finland, phytoplankton community succession can be characterized by a spring bloom, dominated by diatoms and dinoflagellates, followed by a low-biomass summer minimum and later on, as the surface water warms, a summer cyanobacterial bloom, clearly following a seasonal pattern. The summer cyanobacterial blooms are usually dominated by filamentous N-fixing Nodularia spumigena and Aphanizomenon flosaquae and are accompanied by Dolichospermum spp. [formerly included in the genus Anabaena; the planktic species were separated from the benthic Anabaena into their own genus, Dolichospermum, by Wacklin et al. (2009)], typically occurring in lower quantities (Niemistö et al., 1989; Kanoshina et al., 2003; Stal et al., 2003; Olofsson et al., 2020; Figure 1). Another common filamentous cyanobacterial group in the northern Baltic Sea during the summer is the non-diazotrophic order Oscillatoriales (together with some filamentous Synechococcales), increasing in numbers in late July–August (Toming and Jaanus, 2007).
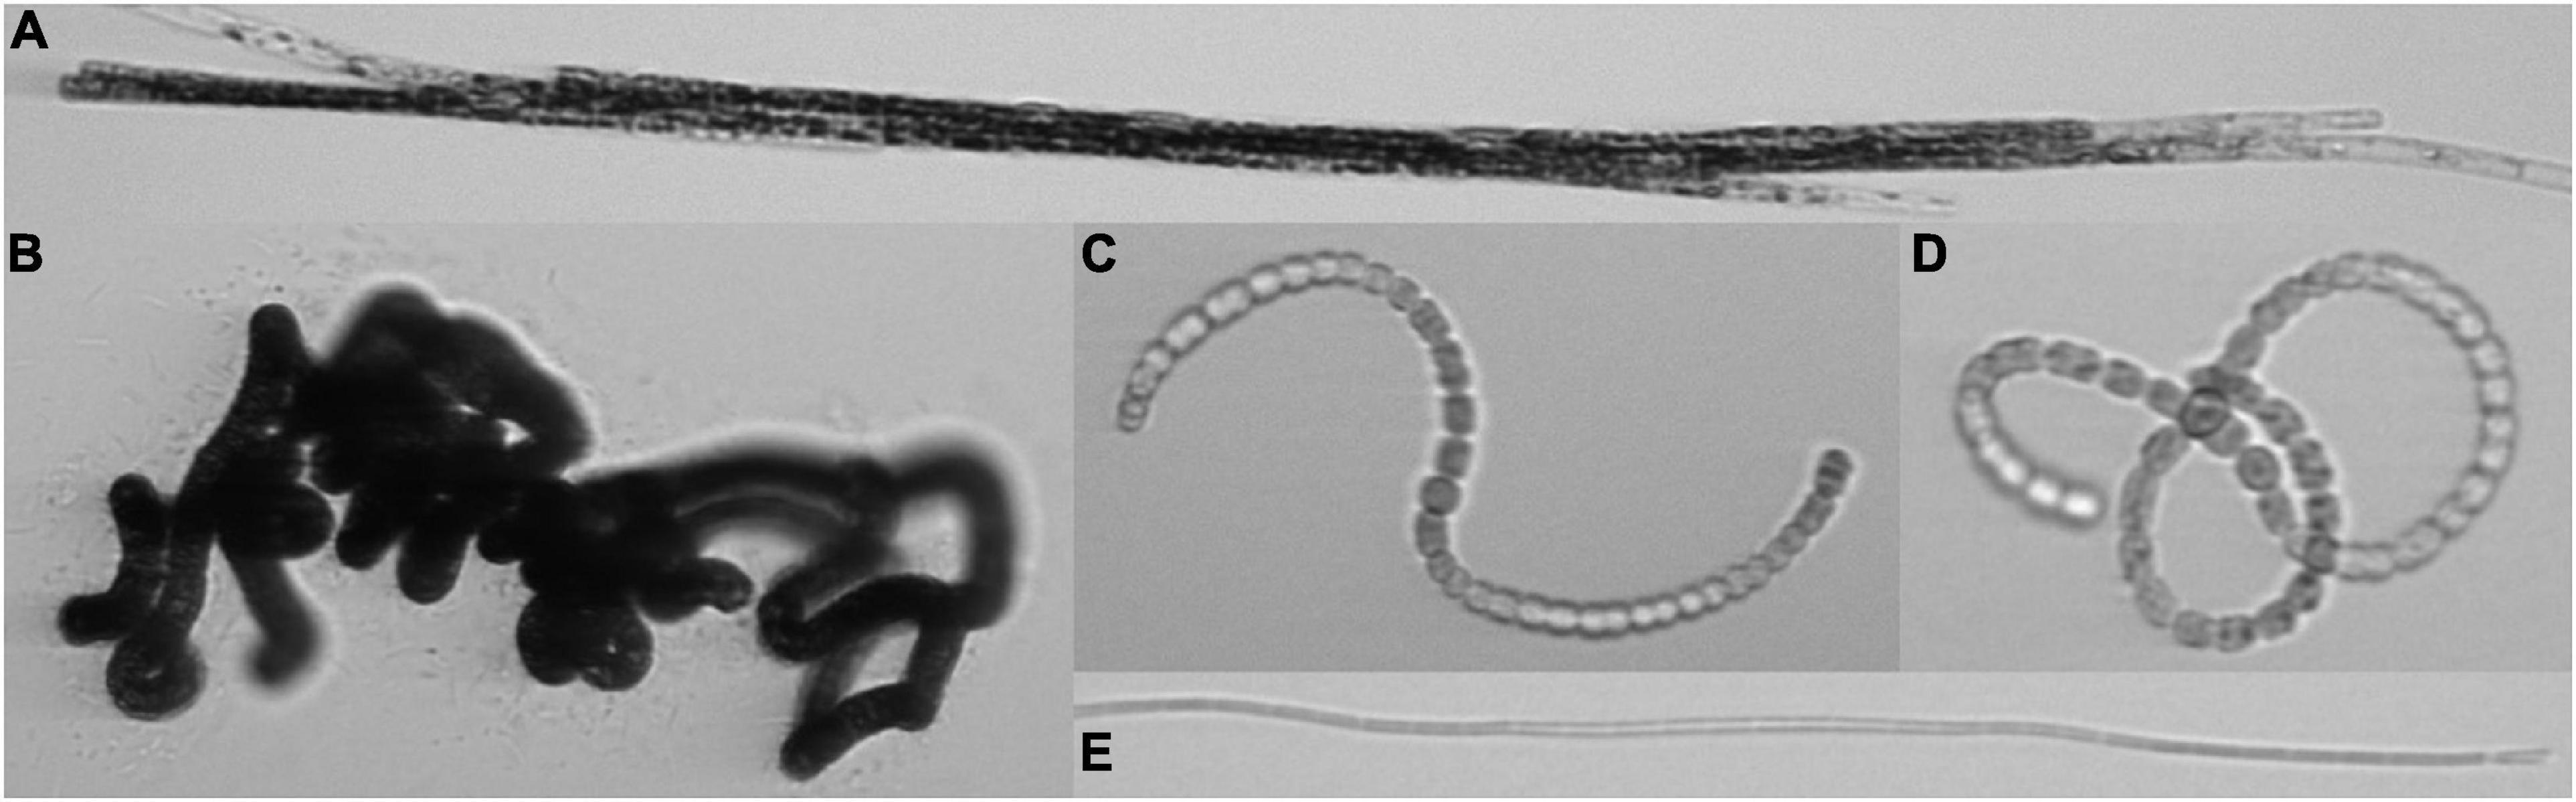
Figure 1. Common filamentous cyanobacteria from the Baltic Sea captured with an Imaging FlowCytobot. Aphanizomenon flosaquae (A) (filament width ca. 5 μm), Nodularia spumigena (B) (filament width ca. 8–10 μm), Dolichospermum spp. (C) (representing the group “straight,” i.e., not forming closed loops), (D) (representing the group “coiled,” i.e., forming closed loops) (filament width ca. 5–7 μm), Oscillatoriales (E) (filament width ca. 1.5–2 μm).
The processes behind cyanobacterial blooms are still not fully understood and new types of sampling strategies and methodologies are needed to further our understanding of these phenomena. Omic tools such as genomics, transcriptomics, proteomics and metabolomics have been suggested to be applicable, and even groundbreaking, in future harmful algal bloom (HAB) studies (Hennon and Dyhrman, 2020; Wells et al., 2020). Remote sensing data such as satellite images provide information on surface accumulations of some HAB species, this is the case for example in the Baltic Sea (see e.g., Kahru et al., 1994; Kahru and Elmgren, 2014). In some cases, special optical properties can be linked to certain taxa/phytoplankton groups (Westberry and Siegel, 2006) providing insights from large spatial areas, but remote sensing often cannot resolve species composition and can only be applied for phytoplankton that form surface accumulations or have specific optical properties that can be identified. Different bio-optical methods such as measurement of phycocyanin fluorescence have proved to be able to detect cyanobacterial blooms and have been successfully applied for investigating spatial distribution of the blooms. Phycocyanin fluorescence has also been found to be a better proxy than chlorophyll a in describing cyanobacterial abundance, but its limitation is that it cannot resolve the bloom forming taxa (Seppälä et al., 2007).
New autonomous technologies that provide high-frequency species-level observations create novel possibilities and should be implemented in HAB studies for a better understanding of the processes behind bloom development and succession, along with traditional microscopical analysis of samples for validation and comparison. Conventional phytoplankton monitoring is based on light microscopical analysis for species identification and biomass determination, typically with a low frequency of sampling. Microscopy-based, long-term monitoring data provide valuable information on the changes in the phytoplankton community through time (Suikkanen et al., 2007, 2013; Hällfors et al., 2013). However, analyzing a single sample can require a full working day of a highly skilled specialist. Optical methods, such as flow cytometry, in turn provide large amounts of high-frequency data, but at a lower taxonomic resolution (Lombard et al., 2019).
Recently introduced imaging flow cytometry applications have been proposed as a rapid near real-time alternative for the analysis of phytoplankton community composition, providing more detailed information on the species composition than traditional flow cytometers, but reducing the workload compared to microscopy (Dashkova et al., 2017). Though imaging methods often provide lower resolution species composition data than traditional microscopy, they provide enhanced resolution over time with identification, in some cases, even at species level. While various flow cytometers and imaging systems for plankton are available (Lombard et al., 2019), the Imaging FlowCytobot (IFCB, McLane Research Laboratories, Inc., United States) is among the most promising for phytoplankton research, since it combines high-quality imaging, cytometry, automatic sampling and some tools for the subsequent image data analysis treatment (Olson and Sosik, 2007; Sosik and Olson, 2007).
Most of the studies utilizing IFCBs have been from marine systems around the coasts of the United States and from scientific cruises in the North Atlantic and the Arctic Ocean. It has been utilized in ecological studies on the whole phytoplankton community composition (Laney and Sosik, 2014; Anglès et al., 2015, 2019; Wilson et al., 2019; Bolaños et al., 2020; Fischer et al., 2020) but it has also been used for the early detection of specific HAB species, such as Karenia brevis and Dinophysis sp. (Campbell et al., 2010, 2013; Harred and Campbell, 2014). IFCB has proven its versatility by being applicable for detailed studies on life cycles and growth rate estimates, identifying parasitic infections and the ecological influence of these on the host species (Brosnahan et al., 2014, 2015, 2017, 2020; Peacock et al., 2014) as well as detecting rare species and analyzing species morphology against phylogeny (Henrichs et al., 2011, 2013).
Since research so far has focused on marine systems, there is scarce evidence of the applicability of the image recognition algorithms in identifying filamentous cyanobacteria images taken with an IFCB, nor is there evidence of the reliability of the biovolume estimates for them derived from the image processing procedure. Different approaches have been developed to image filamentous cyanobacteria and to analyze their abundances using automated or semi-automated methods with varying success and applicability. Most image analysis methods for filamentous cyanobacteria have been developed for light and epifluorescence microscopy images, not for images taken with imaging flow cytometry (Congestri et al., 2000; Ernst et al., 2006; Almesjö and Rolff, 2007; Zeder et al., 2010; Gandola et al., 2016; Baek et al., 2020). For analysis of images taken with imaging flow cytometer, the majority of methods have been developed with the whole phytoplankton community in mind and there is not much evidence of their applicability on filamentous cyanobacteria. Only some studies addressing filamentous cyanobacteria abundances utilizing imaging flow cytometer data are available (Graham et al., 2018; Hrycik et al., 2019). Hence several methods have been proposed and been shown to be functional, but there are not so many studies truly utilizing the existing methods due to the fact that investigation of filamentous bloom-forming cyanobacteria using image analysis presents some interesting challenges. The filaments include, in addition to fairly easily processed “stick”-like straight filaments, “string of pearls”-like filaments with clearly constricted cells, as well as more or less tightly coiled filaments of both constricted and non-constricted cells. Also, straight filaments may further form bundles of filaments, and the coiled filaments may form complicated tangles. This makes it difficult to estimate the biomass of a single genera and requires expert knowledge or advanced machine learning algorithms.
Although the dynamics of the different filamentous cyanobacterial species have been studied during the last decades (see e.g., Stal et al., 2003), it still remains as one of the key unknowns of the Baltic Sea summer blooms. The species-specific responses to environmental pressures and shifts cannot be resolved in field studies by using low-frequency sampling combined with traditional microscopical analysis, nor with bulk optical methods which do not provide species-level information on the community. This study presents in situ observations collected during the summer of 2018 at the Utö Atmospheric and Marine Research Station in the Archipelago Sea, the Baltic Sea. The aim of this paper is to demonstrate the pros and cons of the IFCB in identifying filamentous cyanobacterial taxa and in estimating their biomass, as well as to evaluate its use in future research and noting what still needs to be done concerning method development. We also demonstrate how the taxon-specific high-frequency data, combined with environmental data, provide new possibilities to study the insights of the Baltic Sea cyanobacterial bloom dynamics.
Materials and Methods
Study Area
The data used in this study were recorded at the Utö Atmospheric and Marine Research Station situated in the southern part of the Archipelago Sea (59°46.84′ N, 21°22.13′ E, Figure 2). Located in the immediate vicinity of the Northern Baltic Proper, the station facilitates the study of pelagic processes in the open sea, while providing the required facilities for maintaining an extensive power-consuming measurement apparatus. For a more detailed description of the study site and a list of supporting observations, see Laakso et al. (2018). The measurements are a part of the Joint European Research Infrastructure network for Coastal Observatories (JERICO-RI) (Puillat et al., 2016).
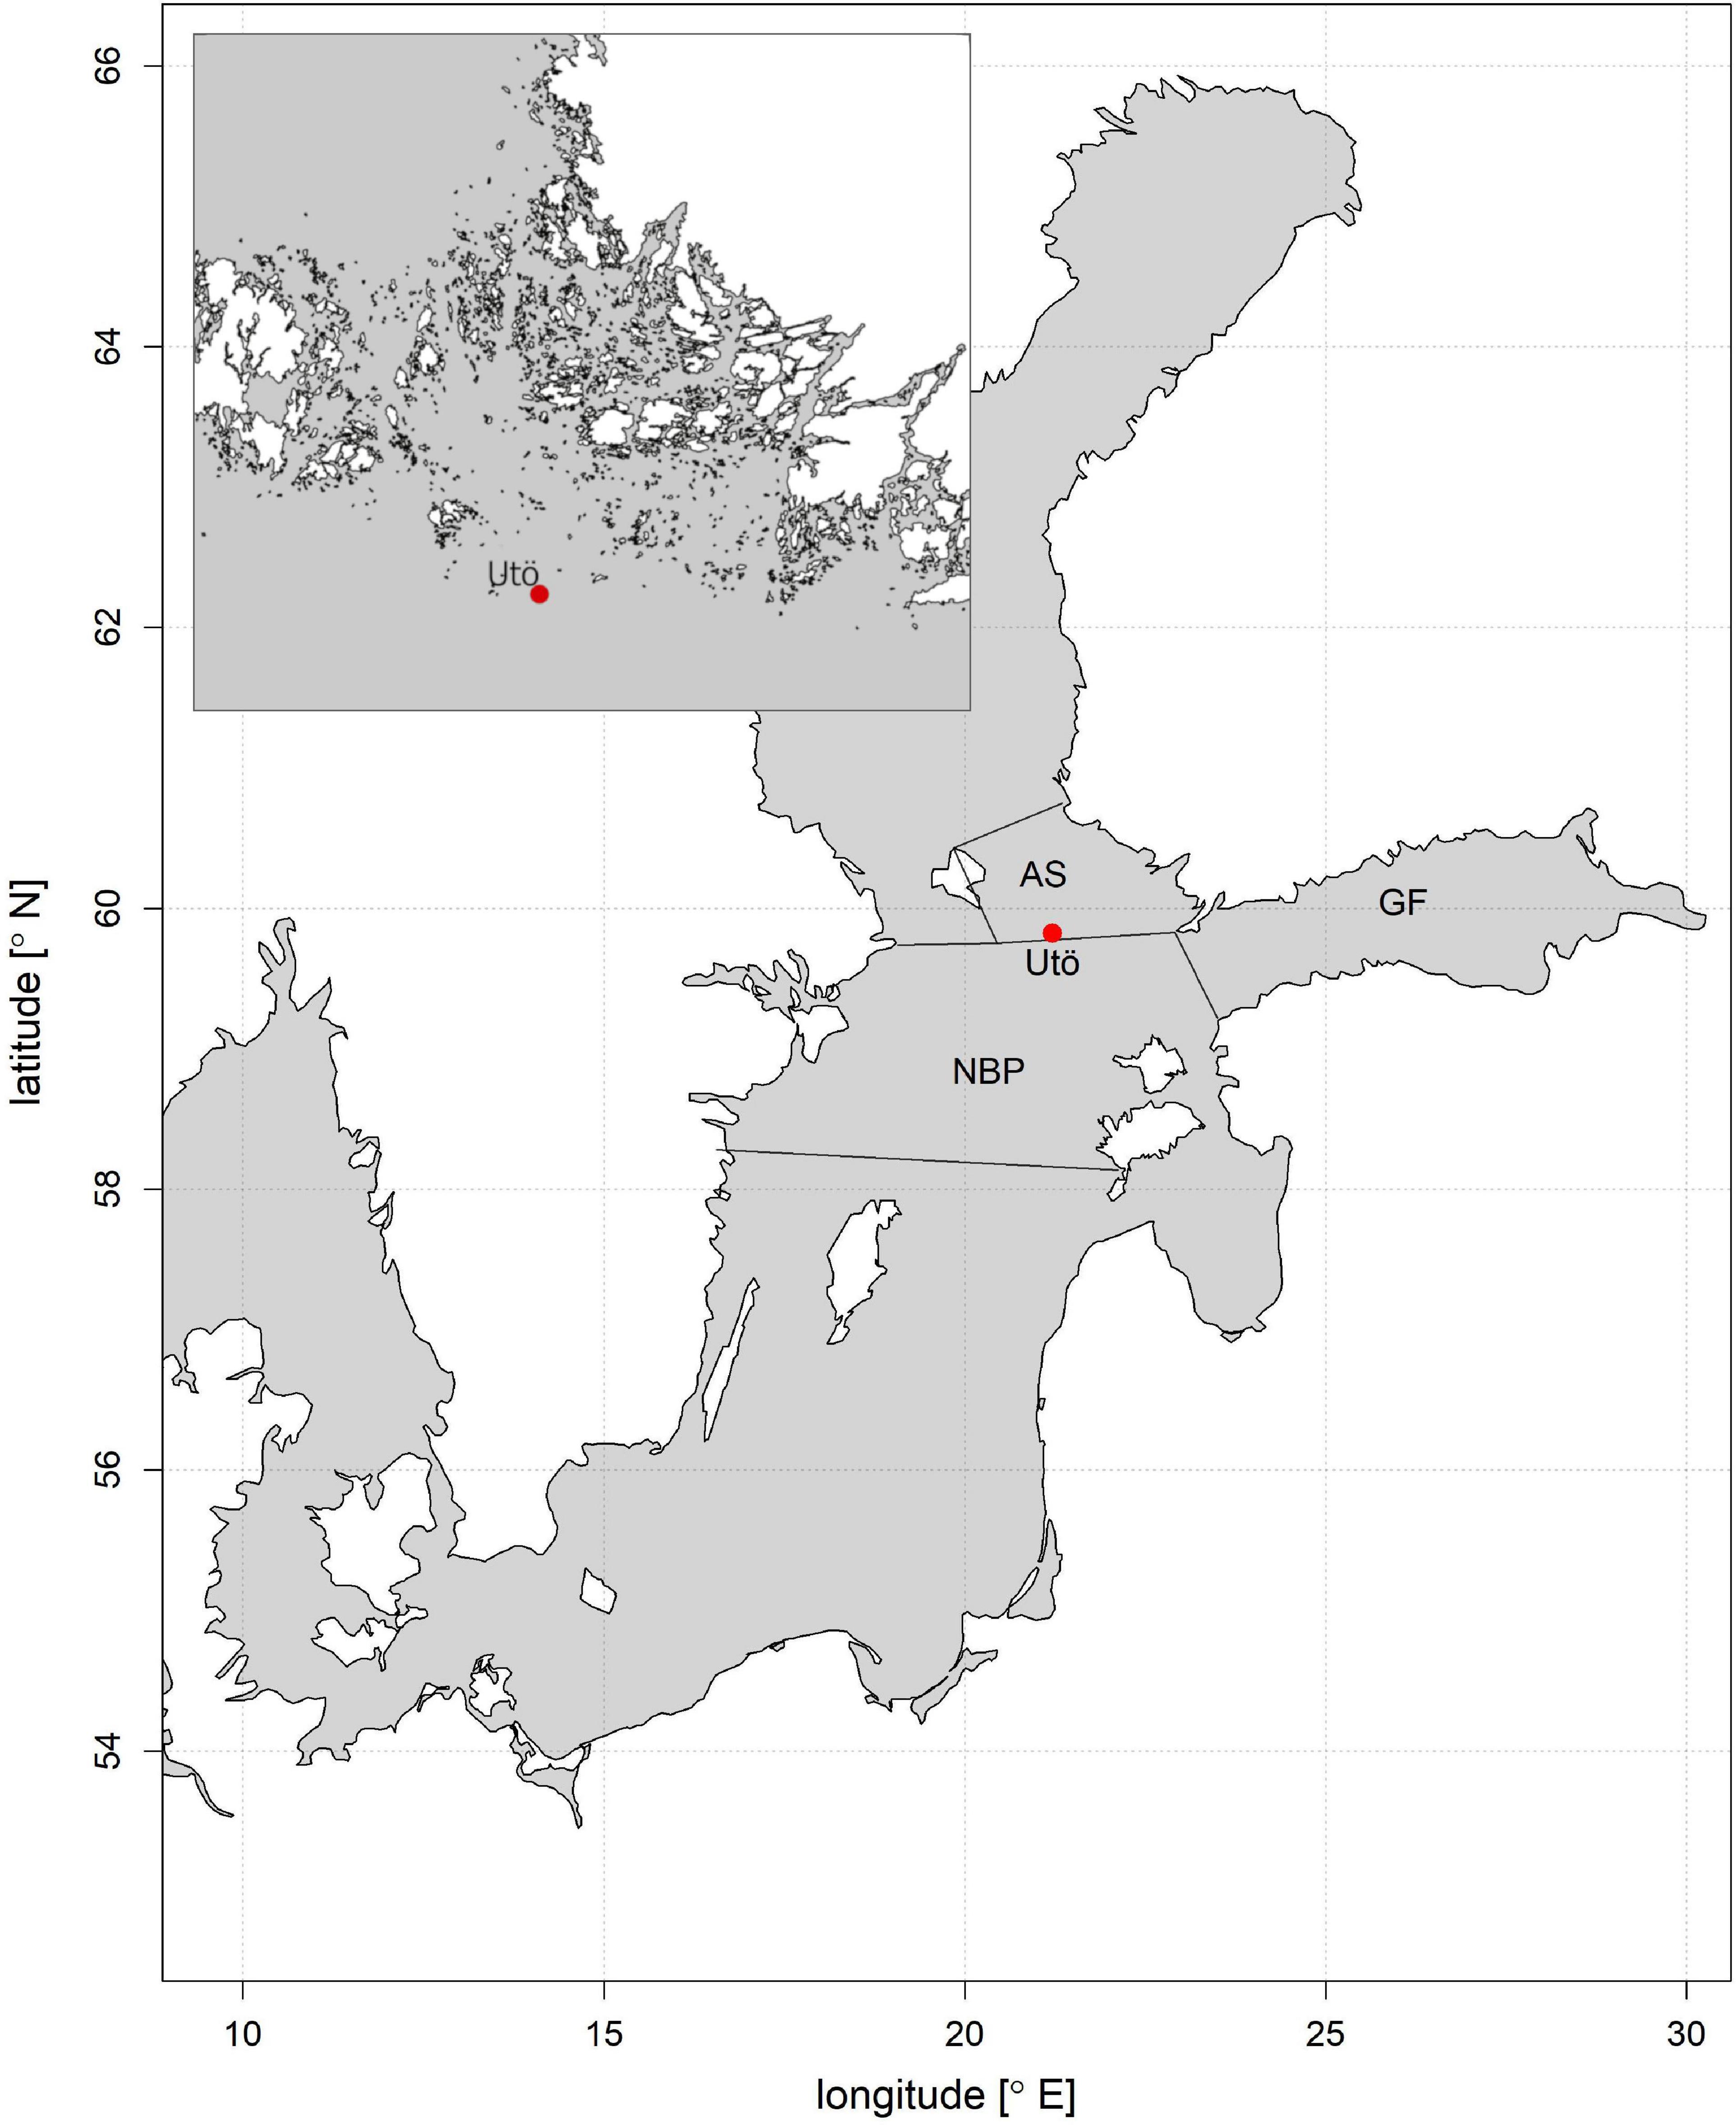
Figure 2. The location of the study site in the Baltic Sea and the nearby sea areas (AS; Archipelago Sea, NBP; Northern Baltic Proper, GF; Gulf of Finland). A more detailed map of the sampling area in the upper left corner.
Water for the flow-through measurements is pumped continuously from 250 m offshore using an underwater pump (Grundfos SP3A-9N) located at the sea bottom at 23 m depth. The floating water sampling inlet of the pump is located at the depth of ∼5 m, representing the mixed surface layer above the seasonal thermocline. Water is pumped at a rate of 50–60 L min–1 through a 50-mm black PE tube, lying at the sea bottom, giving a residence time of approximately 5–6 min. Inside the station building, water is distributed through several flow-through channels, including the intake of the IFCB. Another sensor in the flow-through system, utilized in this study, is a thermosalinograph (SBE45 MICRO TSG, SeaBird, United States). A wide range of meteorological and atmospheric variables, including air temperature and wind are measured approximately 1 km from the sampling site, at the Finnish Meteorological Utö weather station (Laakso et al., 2018, Appendix A).
Sampling
The data, consisting of continuous image data collected with the IFCB, as well as reference water samples for light microscopy analysis, were collected in July–August 2018. The IFCB combines cytometry and imaging technology to capture images of planktonic cells. The IFCB processed a 5-mL sample every ∼20 min, with the exception of minor gaps caused by power loss or maintenance of the station’s flow-through system. In the present study, the size of the imaged particles ranged from ∼5 μm nanoplankton to cyanobacteria with a filament length of ∼300 μm. The instrument was operated with chlorophyll a trigger to capture images of chlorophyll-containing cells and to prevent detritus and other non-living material to be imaged. A 150 μm mesh was used at the instrument inlet to prevent the instrument from clogging.
To facilitate a comparison of results provided by the IFCB with those provided by the standardized microscopy methods used in conventional phytoplankton monitoring in the Baltic Sea (HELCOM, 2017), additional samples for light microscopical analysis were taken at intervals during the study period from both near the pump inlet and from the station flow-through system. The comparison samples were also taken to analyze whether the pumping of water into the measurement cabin or the 150 μm mesh at the instrument inlet, would affect the results. Samples (250 mL) were taken with a 5-L Limnos water sampler from as close as possible to the pump inlet at ∼5 m depth (pump inlet samples) and by filling the sample bottle (250 mL) straight from the flow-through line in the measurement cabin (flow-through samples). The samples were fixed with acid Lugol’s solution and kept in the dark and refrigerated until light microscopical analysis.
Microscopical Phytoplankton Analysis
Cyanobacterial abundance in the reference samples collected for light microscopy was estimated with the Utermöhl technique (Utermöhl, 1958). Subsamples of 25-mL or 50-mL were settled for 16 h or 24 h in Utermöhl chambers and enumerated using an inverted light microscope (Leitz DMIRB). A magnification of 125x was used for Aphanizomenon flosaquae, Dolichospermum spp. and Nodularia spumigena, henceforth referred to as Aphanizomenon, Dolichospermum and Nodularia, respectively, and a magnification of 250× for Oscillatoriales. Since we wanted to compare the IFCB results with results attained using the combined HELCOM monitoring methods applied by the countries surrounding the Baltic Sea, the counting was done utilizing the predefined size classes used in Baltic Sea phytoplankton monitoring (HELCOM, 2017; Olenina et al., 2006). A suitable size class was chosen for each filament by visually estimating the filament widths with the help of an ocular micrometer. We counted 100, 200, or 300 counting units (100 μm long filament sections; HELCOM, 2017; Olenina et al., 2006), in order to decrease the statistical error of the count by counting more units in a very dense sample. If there were less than 100 counting units in the sample, all were counted. In the case of Aphanizomenon, Dolichospermum and Nodularia, filament lengths were measured using the ocular micrometer. The lengths of 100 filaments in each sample were measured, or all filaments present, if less than 100 occurred. The biovolumes and size classes were determined according to Olenina et al. (2006) and further converted to biomass (μg L–1) assuming a plasma density of 1 g cm–3 (CEN, 2015). The majority of filaments of Aphanizomenon, Dolichospermum and Oscillatoriales fell in the size classes 5 × 100 μm, 5–7 × 100 μm, 1.5 × 100 μm, and thus had biovolumes of 1,963 μm3, 1,884 μm3 and 177 μm3 per 100 μm filament, respectively.
Image Data Analysis
The image data collected with the IFCB were classified using a machine learning algorithm, trained using a manually labeled (i.e., identified) set of images according to the method described by Sosik and Olson (2007), with the exception that we utilized the Random Forest algorithm (Breiman, 2001) instead of the Support Vector Machine. In brief, the method utilizes a set of features (characteristics or properties) extracted from the images and image training (manually labeled images are used as examples of the morphological representation of different species/groups of species from the Baltic Sea) for classifying the image data with a suite of decision trees. More detailed descriptions of the MATLAB-based tools, the list of features and the publicly available codes can be found at https://github.com/hsosik/ifcb-analysis. Altogether 40 categories were selected for the final classifier, representing the most abundant and recognizable phytoplankton groups, like the four categories of filamentous cyanobacteria, several dinoflagellate, diatom and different types of flagellate groups as well as some coccoid cyanobacteria and green algae of varying taxonomic level. Having more variety in the classifier improved the classification accuracy (overall accuracy being 89.23%) for the more certain categories. The results of filamentous cyanobacteria (four out of the 40 categories, the rest of the 40 categories consist of taxa other than filamentous cyanobacteria) are relevant for the current study: Aphanizomenon (Figure 1A), Dolichospermum “straight” (Figure 1C), and “coiled” (Figure 1D), as well as Oscillatoriales (Figure 1E); Nodularia (Figure 1B) could not be included, since there were not enough images to create a functioning training set. To obtain a good classifier performance, categories consisted of a minimum of 100 images in the training set. The maximum amount of training images used for a category was 3000.
Category-specific thresholds were assigned to each category included in the study. The volume of the actual sample observed was also taken into account as the trigger is always followed by a short “dead time,” making the volume observed smaller than the initial volume (Olson and Sosik, 2007). Pixel-based biovolumes were produced for each image during the process of feature extraction according to the distance map method of Moberg and Sosik (2012). A conversion factor was determined using standard beads (diameter 6 μm; AlignFlow Plus, Molecular Probes, Inc.) for converting pixel-based biovolumes to micrometer-based biovolumes. The micrometer-based biovolumes were further converted to biomass (μg L–1) assuming a plasma density of 1 g cm–3 (CEN, 2015).
The four categories of filamentous cyanobacteria used in this study all comprised over 2500 images in their training sets. The biovolumes obtained by the feature extraction from the images of coiled Dolichospermum filaments (Figure 1D) were manifold compared to the actual biovolume of such a filament, since the image processing method detected these images as large, roundish, filled objects, instead of loops of filament coils. Therefore, the results of Dolichospermum, when appearing in a coiled form, needed a further conversion. Basically, a linear model was applied to the biovolumes retrieved by the feature extraction and more realistic biovolumes of the same filaments calculated using average cell biovolume and cell counts to obtain a conversion factor (described in more detail in “Method Comparison”). Consequently the coiled filaments were classified separately. The results of the categories Dolichospermum “straight” and Dolichospermum “coiled” were merged into one after the conversion of the latter.
Sensitivity, precision and F1-score were calculated for the categories to describe the classification performance, since category-specific accuracy is not a good metric to describe the performance for category-imbalanced data. Sensitivity describes the proportion of the successful identifications [True positives/(True positives + False negatives)] and can be considered as a metric for how well species are identified. Precision describes what proportion of the positive identifications were correct [True Positives/(True Positives + False Positives)] and can be considered as a metric for how well other species are rejected. The F1-score summarizes both the sensitivity and precision and expresses the balance between the two [2 ∗ ((precision ∗ sensitivity)/(precision + sensitivity))]. The calculated metrics clearly exceeded 95% in all of the filamentous cyanobacteria categories included in the classifier (Table 1).

Table 1. Category-specific total number of images in the training set and classification performance described by sensitivity, precision and F1-score.
Method Comparison
To assess the reliability and comparability of the IFCB observations, a comparison between IFCB data and light microscopical data was performed. The total biomass of each taxon in each coincident IFCB sample (with timestamp closest to the collected microscopy samples) was compared to the total biomass of the corresponding microscopy sample of the taxon. The comparison was done to verify the comparability of the IFCB results with traditional phytoplankton monitoring methods to assess the total biomass of a taxon in a sample (HELCOM, 2017).
To verify the reliability of the biovolume assessment of the image analysis an average biovolume, obtained by the feature extraction, of a 100 μm long filament for each taxa was compared to the corresponding biovolume used in the light microscopy. In the light microscopy analysis the majority of filaments of Aphanizomenon, Dolichospermum and Oscillatoriales fell in the size classes 5 × 100 μm, 5–7 × 100 μm, 1.5 × 100 μm, and thus acquired biovolumes of 1,963 μm3, 1,884 μm3 and 177 μm3 per 100 μm filament, respectively (HELCOM, 2017; Olenina et al., 2006). The average biovolume of 100 μm long filaments for each taxon were calculated from the IFCB images.
Few steps were required to obtain the average biovolumes from the IFCB images. First, filament widths (i.e., their diameter) were manually measured with a MATLAB image viewer tool (with Dolichospermum categories, cells were also counted). Second, to obtain the length of the filament, the area (given in the feature extraction process) was divided by the width. Third, the biovolumes calculated in the feature extraction process for selected images were converted to match 100 μm long filaments. The average biovolume was calculated from a total of five different samples across the bloom peak period including 100 (or all, if less than 100 filaments were found in the sample) randomly selected images in each category in each of the five samples. Filament lengths were calculated in order to compare the lengths of Dolichospermum and Aphanizomenon between the two methods and to determine whether the pumping of the water to the station building housing the IFCB, or alternatively, the 150 μm mesh at the instrument intake, influenced the results.
In addition to the average biovolume of a 100 μm filament, an average was also calculated for a single cell in the case of the category Dolichospermum “straight” by dividing the biovolume drawn in the feature extraction by the number of cells counted manually from the images. For the category Dolichospermum “coiled,” a more realistic biovolume was calculated based on the manual cell count of the filament, because the biovolume extracted during the image processing method overestimated the biovolumes of the category. The biovolume used for the calculation of the more realistic biovolumes was the average cell biovolume determined from Dolichospermum “straight” as mentioned, with the same procedure as the measurements of the other categories. These more realistic biovolumes were compared to the biovolumes determined by the feature extraction process by fitting a regression line of a linear model using an intercept of zero. The slope factor of the linear model was used for converting the unrealistic biovolumes of the category Dolichospermum “coiled” to realistic results, after which the results of the two categories of Dolichospermum could be merged.
Statistical Analysis
Using a One Sample T-Test, the average IFCB measured biovolumes for the 100 μm filament counting units were compared to the most common biovolumes of 100 μm filament counting units calculated based on the light microscopy analysis. A linear model was fitted for the Dolichospermum “coiled” biovolumes obtained by the feature extraction and the more realistic biovolumes calculated (described above in “Method Comparison”) using a regression line with intercept of zero. Orthogonal regressions were drawn for IFCB versus light microscopy total biomasses. As there is no reason to expect either observation to be wholly accurate, and for both to hold the possibility of error, the orthogonal regression was chosen. The biomass comparison data were log(x + 1) transformed because the original data consisted mostly of observations of low biomass and only few observations of high biomass. Pearson’s Correlation Coefficient tests were performed to determine if there was a statistical relationship between the IFCB and light microscopy biomass results. IFCB and light microscopy measurements of Aphanizomenon and Dolichospermum filament lengths within a sample were compared by using a Mann-Whitney U Test for two independent groups. The filament lengths were also compared between the samples within a method by using a Dunn’s Multiple Comparison Test. All statistical tests were performed with R 3.6.1 (R Core Team, 2019). The package pracma was used for the Orthogonal regression (Borchers, 2019); the other tests used can be found in the basic R.
Results
Comparison of IFCB Data and Data From Conventional Microscopy
The widths of the filaments, as measured from the IFCB images, varied within each category (mean and ± SD respectively; Aphanizomenon 5 μm, ± 0.6 μm; Dolichospermum 5 μm, ± 0.5 μm; Oscillatoriales 2 μm, ± 0.3 μm). In microscopic analyses, it was decided separately for each counted filament, which predefined width-category it represents (HELCOM, 2017). For Aphanizomenon, size classes to choose from were 4, 5, or 6 μm wide filaments, for Dolichospermum 4, 5, 5–7, 6–7, or 7–9 μm wide filaments and for Oscillatoriales 1, 1.5, 2, 2.5, or 3 μm wide filaments (Olenina et al., 2006 and its Annually updated appendix version 2018). Consequently, the resulting mean biovolumes for 100 μm filaments may differ between these two techniques.
The mean biovolumes of 100 μm filaments, based on manual measurements from IFCB images, were in a similar size range to the ones used in the light microscopical analyses when taking into consideration the available size classes mentioned above. Although the size range was similar, the One Sample T-Test showed differences between the microscopy and IFCB measurements for Aphanizomenon and Oscillatoriales (Table 2). For Dolichospermum, there was no statistically significant difference between the measurements (Table 2). Aphanizomenon had a slightly lower average measured biovolume, the measured biovolume falling right between the two size classes used for light microscopical analyses (filament widths of 4 and 5 μm). The average measured biovolume calculated from IFCB images of Oscillatoriales differed from the one used in the microscopy somewhat more than for the other two categories (Table 2), however, still being right between two size classes used in the light microscopy (filament widths of 1.5 and 2 μm). A plausible reason for the greater difference in Oscillatoriales is that the margin of error increases with smaller sized images, since the precision of measurement is lower.
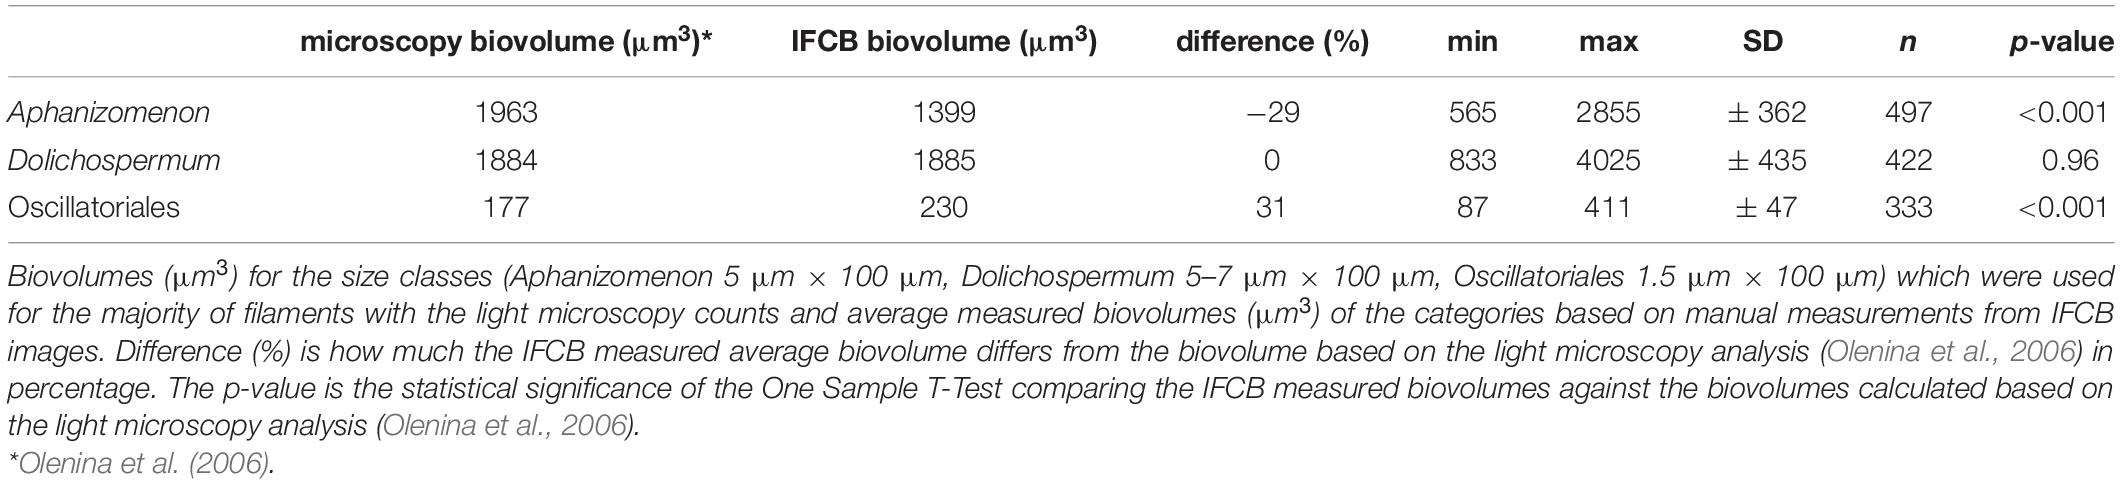
Table 2. Comparison of biovolumes between IFCB and microscopy.
A conversion factor of 1/7.056 was obtained from the linear model fitted to the biovolumes obtained from the images’ feature extraction and the calculated biovolumes based on manual measurements and cell calculations. The resulting more realistic biovolumes of Dolichospermum “coiled” represented approximately 14% of the biovolumes initially obtained by the feature extraction. The linear model had an r2 of 0.83 and p < 0.001 (Figure 3).
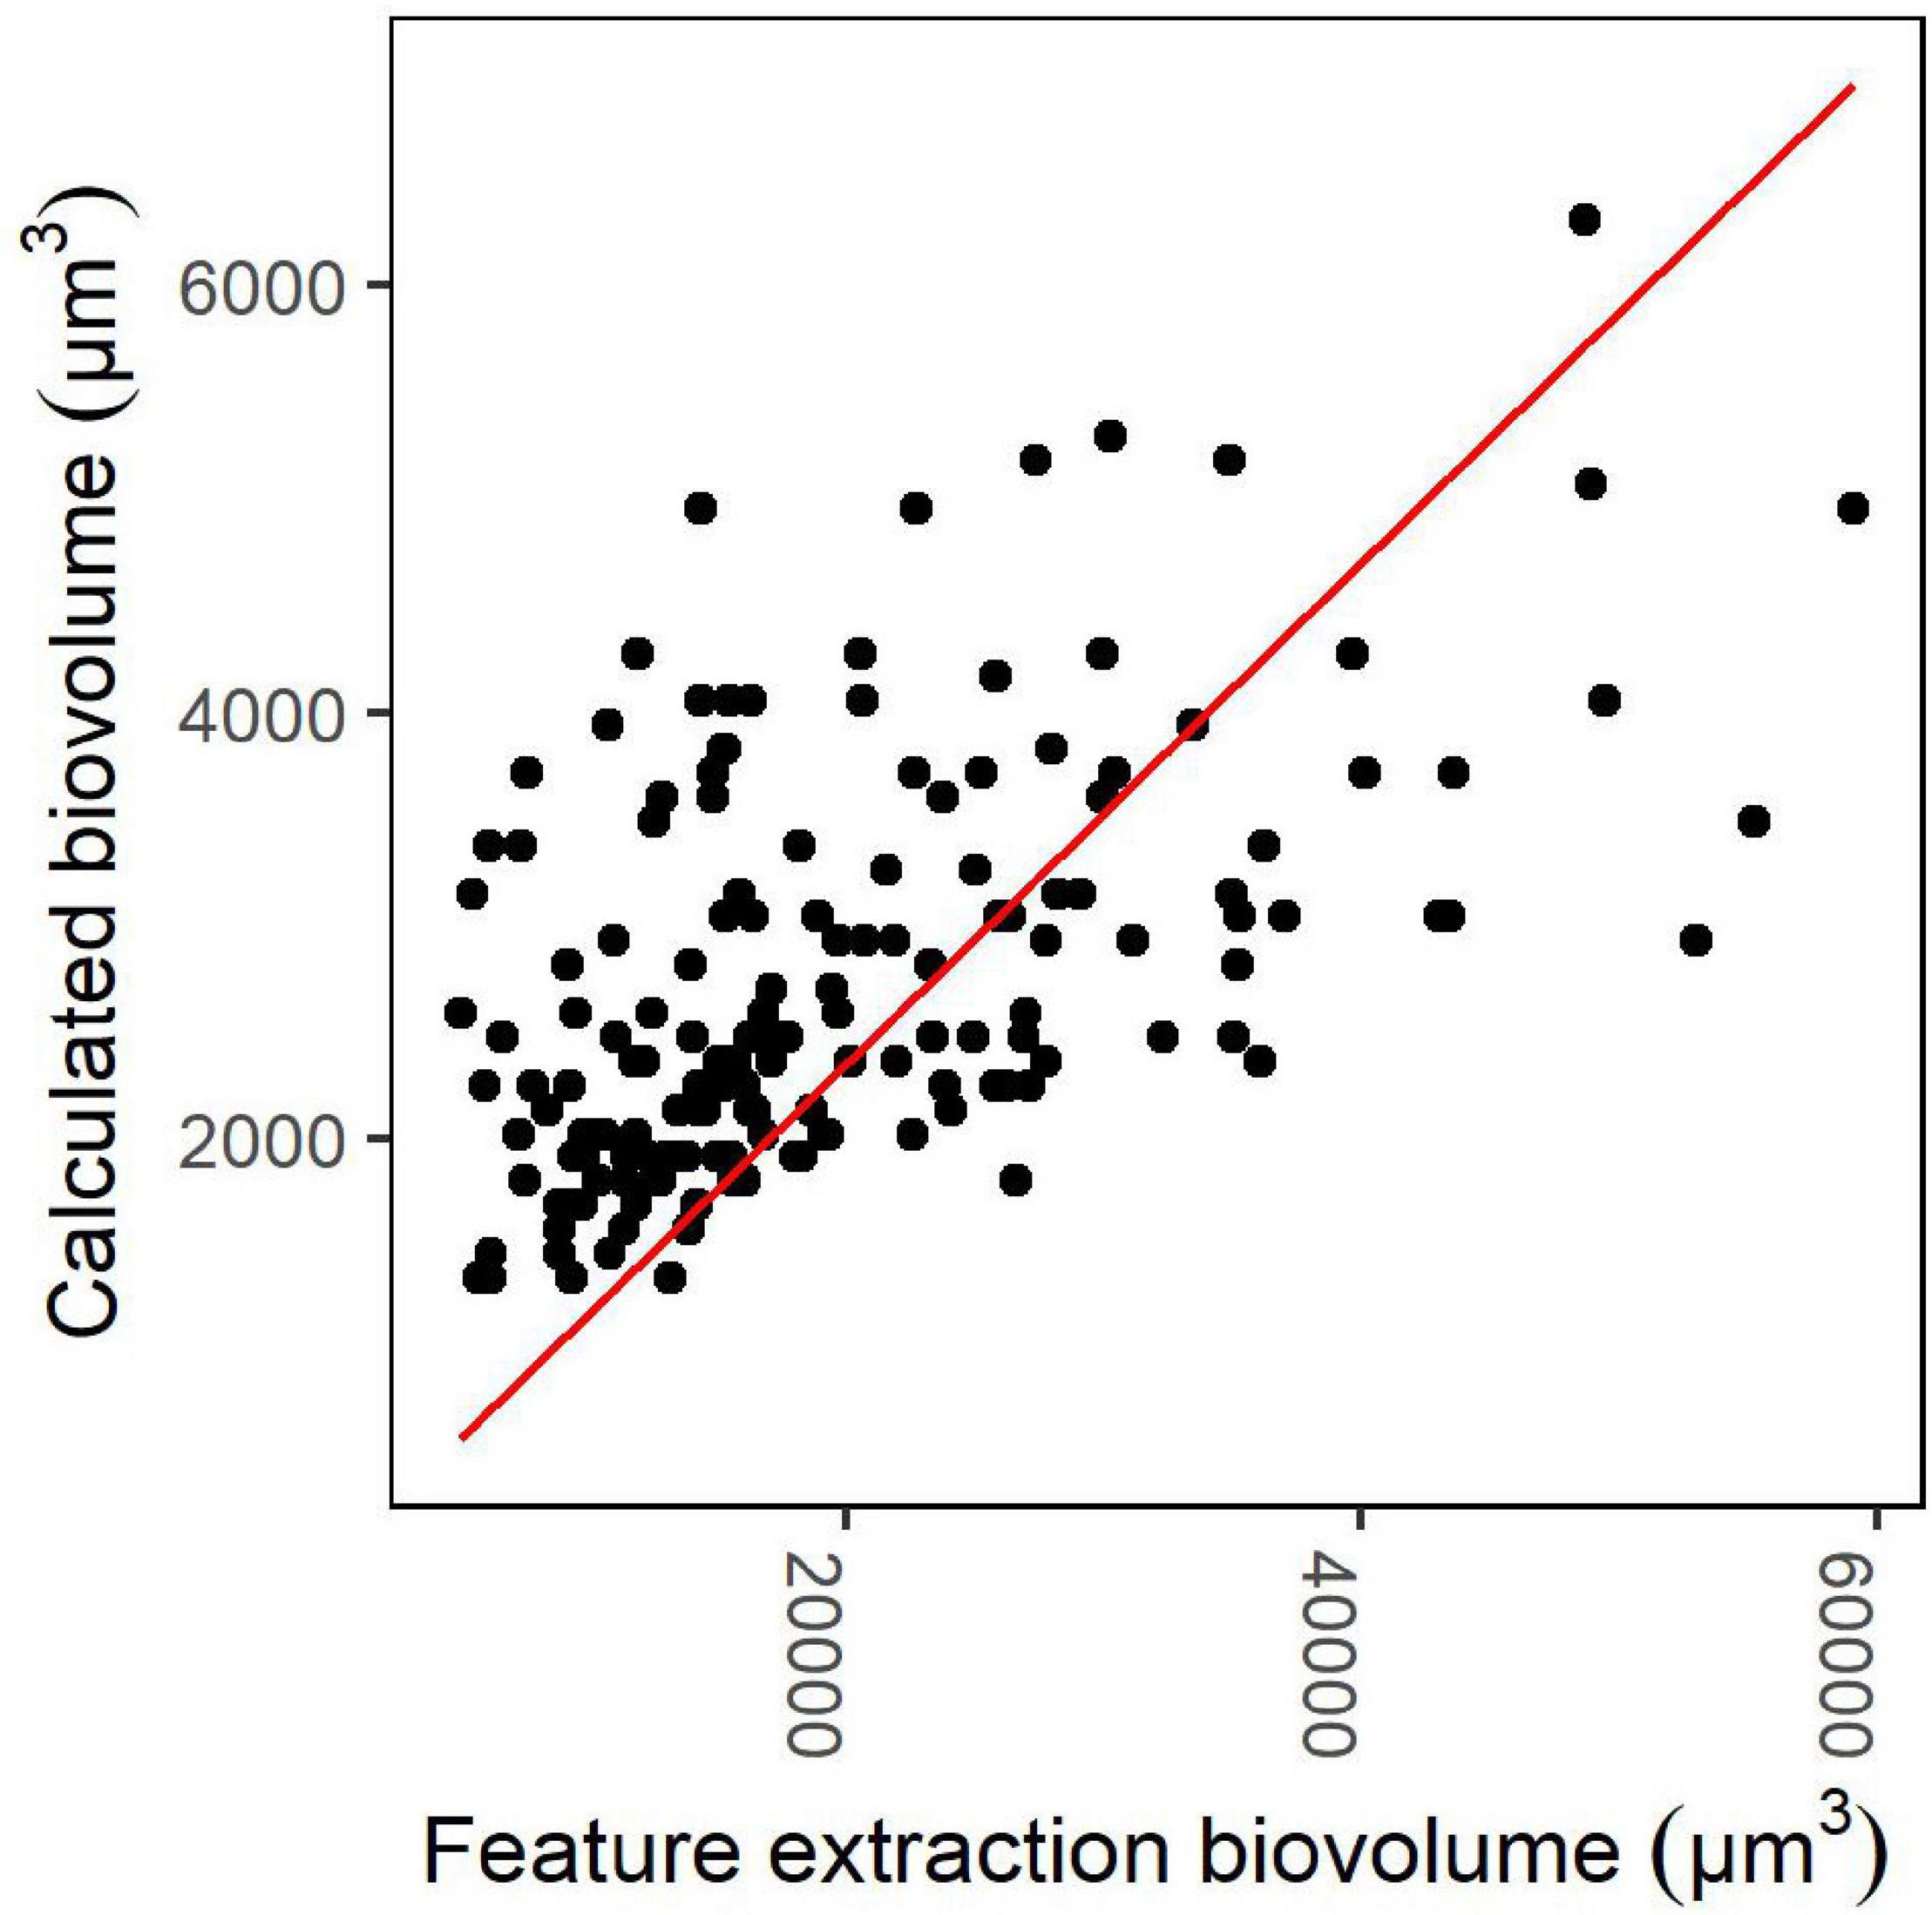
Figure 3. Linear model for the conversion factor of the biovolumes of the category Dolichospermum “coiled” with regression line with intercept of zero. The calculated biovolume represents the biovolumes that were calculated for the images using the manual measurements and cell counts. The feature extraction biovolume means the corresponding biovolumes obtained by the feature extraction process.
The total IFCB biomasses correlated significantly with the total light microscopy biomasses for all three cyanobacteria investigated (Table 3). The regression line of Aphanizomenon follows the 1:1 reference line closely, except at high biomass values where the line is oriented toward the y-axis since the high microscopy biomasses are slightly higher than the high IFCB biomasses (Figure 4). In the case of Dolichospermum the regression line follows the 1:1 reference line almost identically, with a slight biomass overestimation by the IFCB results (Figure 4). Both Aphanizomenon and Dolichospermum have an outlier, possibly explaining the deviation from the 1:1 line. For Oscillatoriales, the regression line departs from the 1:1 line clearly and the biomass is consistently higher for microscopy results than for IFCB results except for the lowest biomasses (Figure 4). The intercept of Aphanizomenon is slightly closer to the origin than that of Dolichospermum, but the slope is clearly higher. The r2 is almost identical for the two (Table 3). Oscillatoriales departs from the other two significantly in all the parameters, although it too has a statistically significant correlation between the IFCB and microscopy biomasses (Table 3).
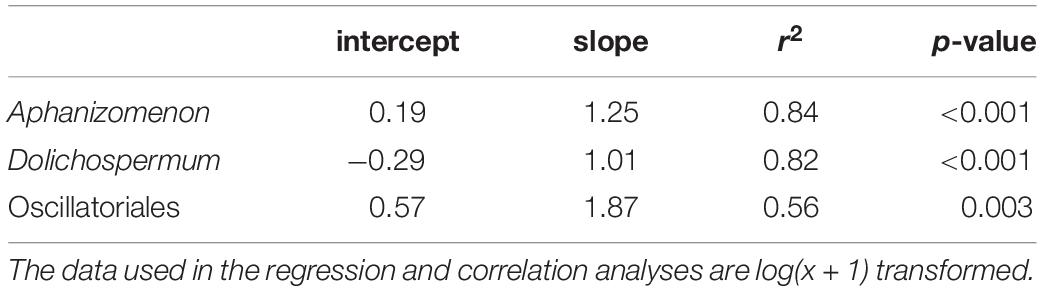
Table 3. The intercept and slope of the orthogonal regression and the r2 and p-value of the Pearson’s Correlation Coefficient from the comparison of biomasses acquired utilizing the IFCB and light microscopy.
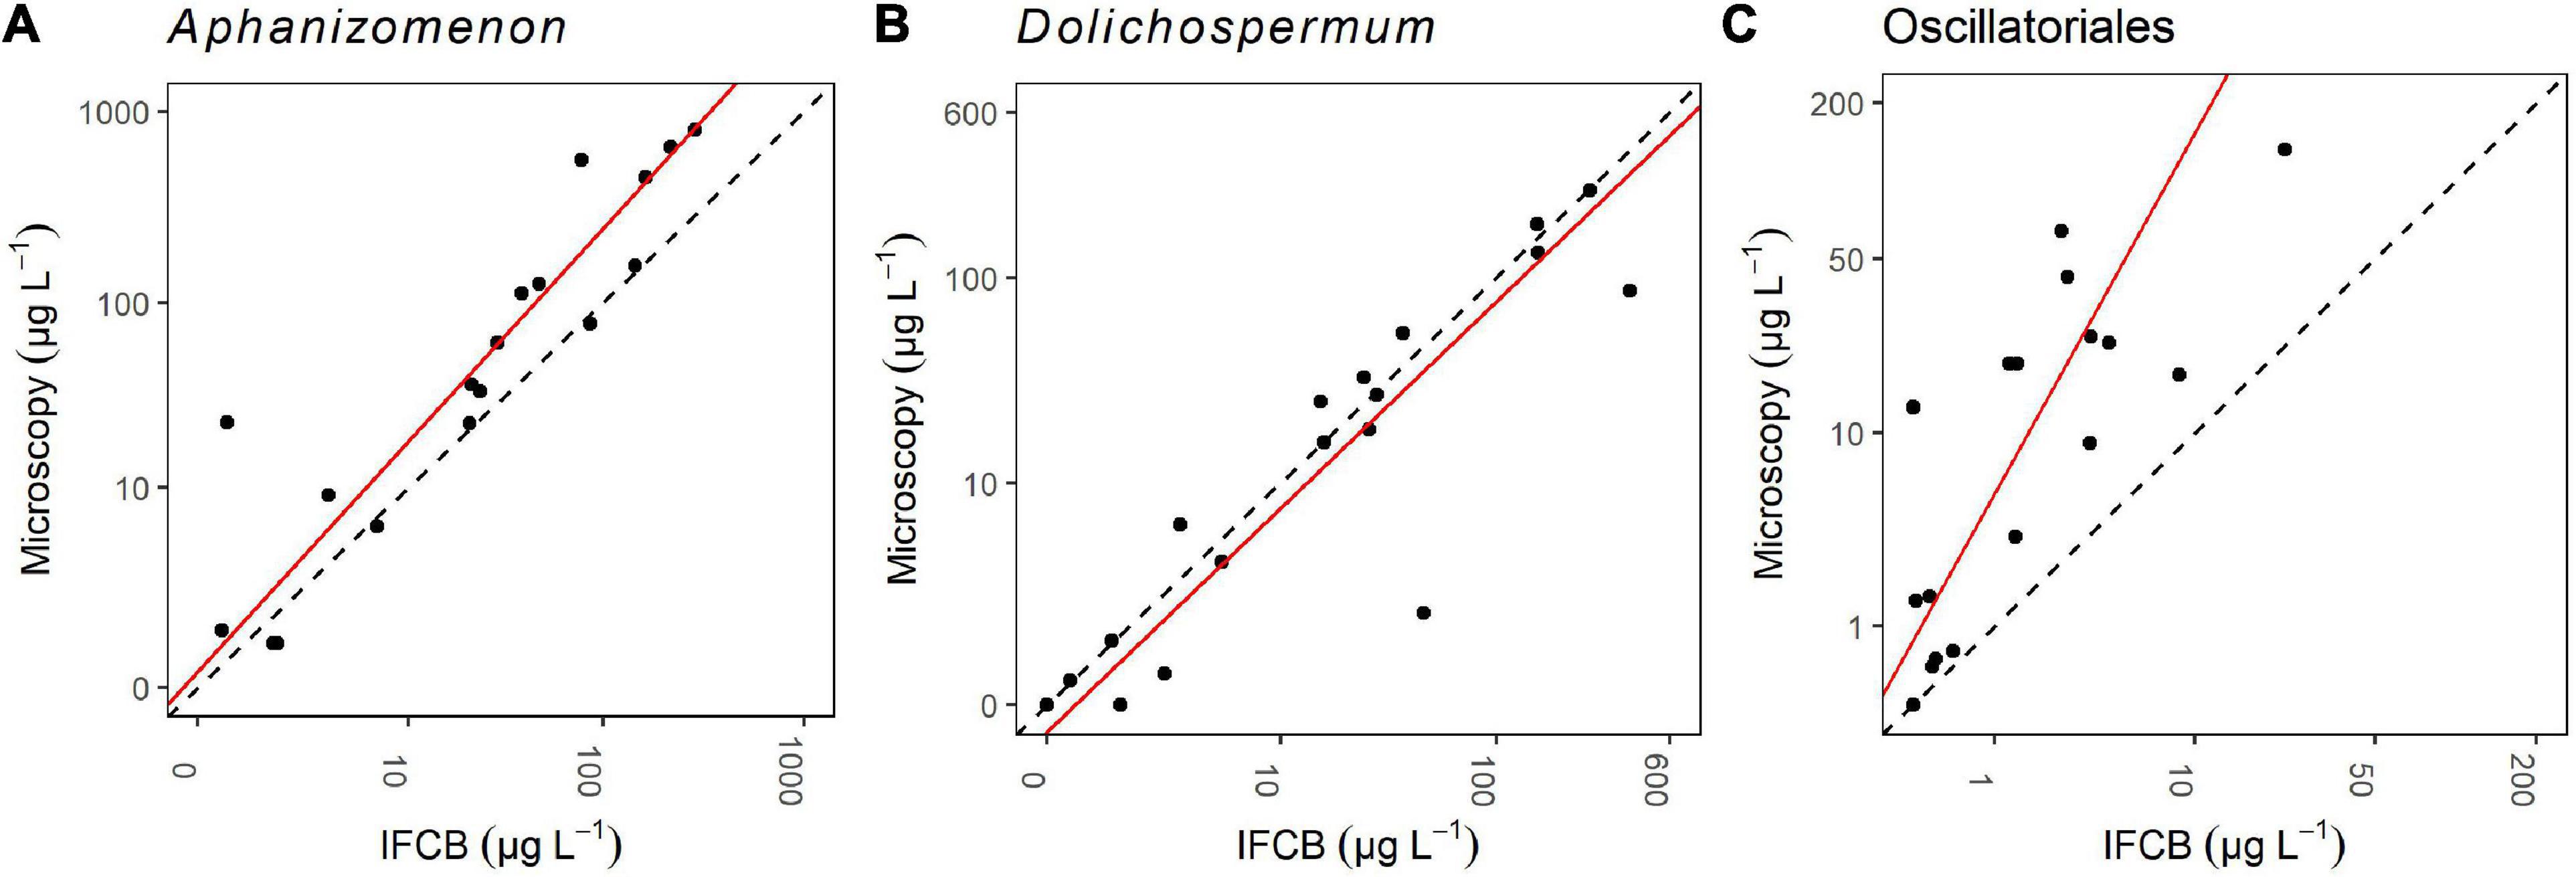
Figure 4. Orthogonal regressions for comparison of light microscopy and IFCB biomass (μg L–1) results for Aphanizomenon (A), Dolichospermum (B) and Oscillatoriales (C). The data are log(x + 1) transformed. The regression line is the red line and the 1:1 reference line is the black dashed line.
The filament length comparison between sampling days was performed to examine if there was any difference indicating taxon-specific variability, and the comparison between the two methods and the sampling points of light microscopy samples was performed to identify any potential method-specific variability. The filament lengths differed statistically (p ≤ 0.002) and were longer for both Aphanizomenon and Dolichospermum in all of the microscopy samples compared to the IFCB samples (Figure 5). It should be noted that the Dolichospermum measurements from the randomly selected IFCB images included only filaments from the category Dolichospermum “straight” as the filament lengths could not be calculated with the same procedure for the “coiled” ones. Therefore, the absence of the longest coiled filaments in the images is a likely explanation for the lower average of Dolichospermum length in the IFCB measurements.
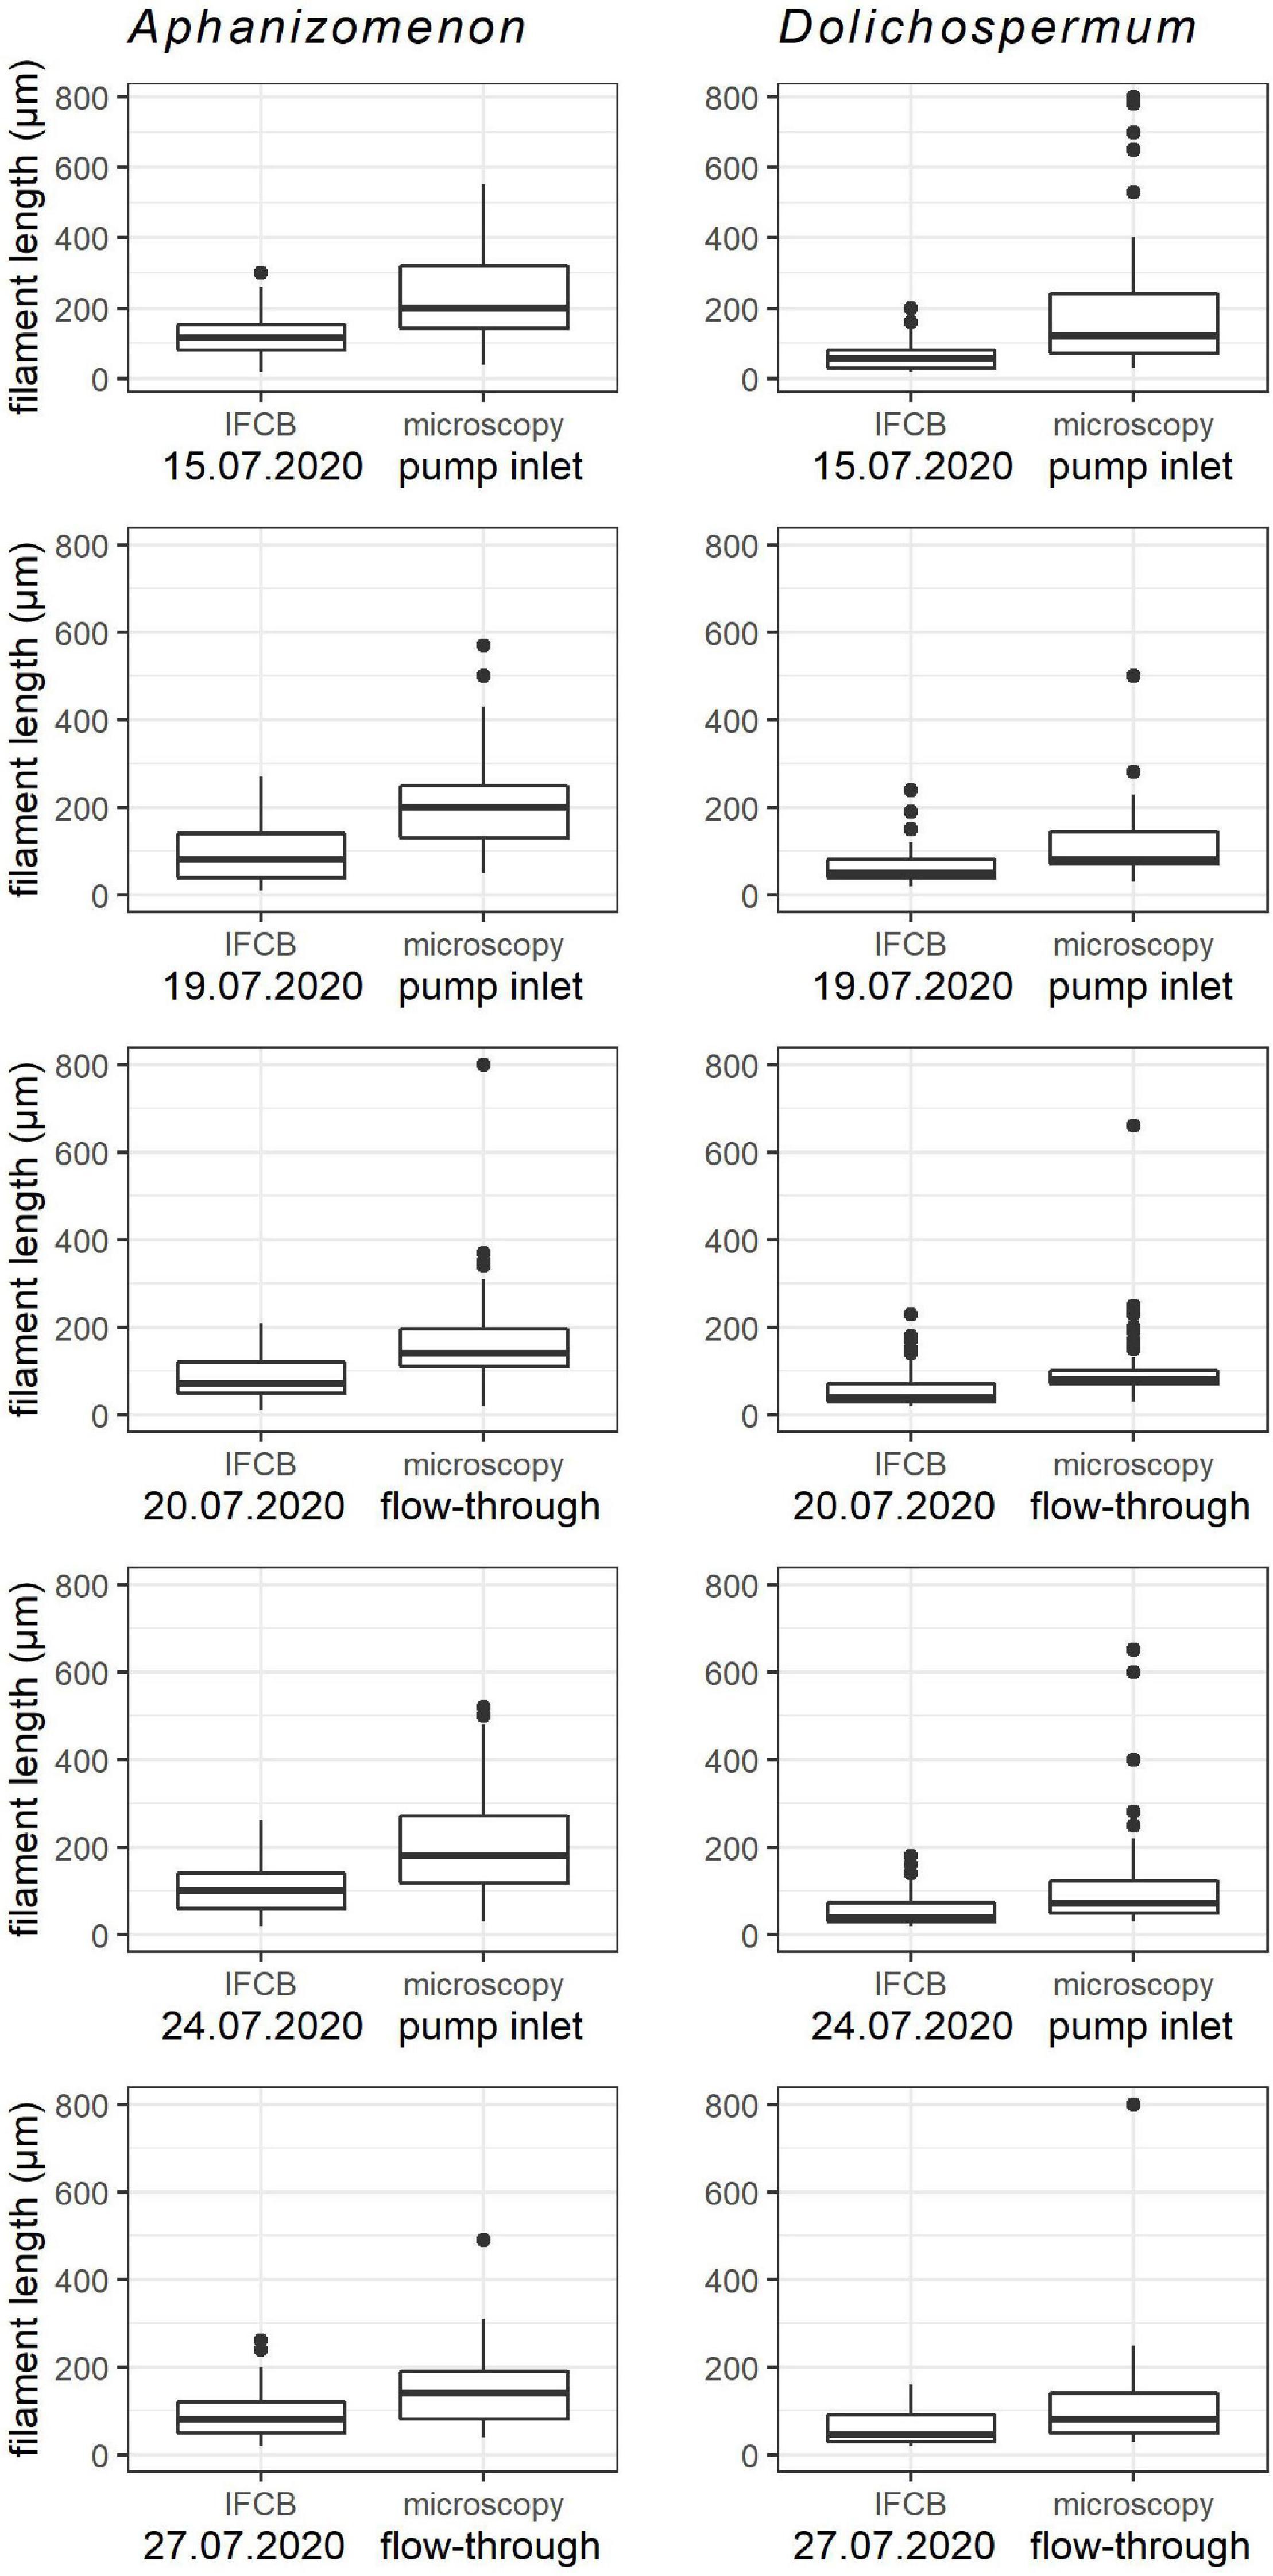
Figure 5. The lengths of the measured filaments from IFCB and microscopy samples. Left hand panels Aphanizomenon, right hand panels Dolichospermum. The “pump inlet” and “flow-through” indicates the sampling point of the microscopy samples.
Within a method there was some variability between the days for both taxa. In the microscopy samples taken from the flow-through system of the station building (July 20 and 27), the mean length of Aphanizomenon was consistently lower than in the samples taken from the pump inlet (July 15, 19 and 24) (Figure 5), indicating that the pumping of the water to the station building affects the Aphanizomenon filaments by breaking them into shorter pieces. The same trend was not observed for Dolichospermum, but the variability was more random, indicating that the filament type endures the pumping conditions better. With Dolichospermum there was only slight variation between the days within method (Figure 5).
High-Frequency Observations of the Cyanobacterial Bloom Period
The cyanobacterial bloom was preceded by a relatively calm period of 1 week, with winds below 6 m s–1 and with steadily rising surface water temperatures (Figure 6). The bloom was initiated approximately at the same time as the water temperature increased to above 15°C on July 15, and 2 days later, when the water temperature reached 16°C, the bloom peak period started (Figure 6). During the whole bloom period, water temperature mostly remained unusually high for the region. Aphanizomenon and Dolichospermum dominated the investigated cyanobacterial bloom.
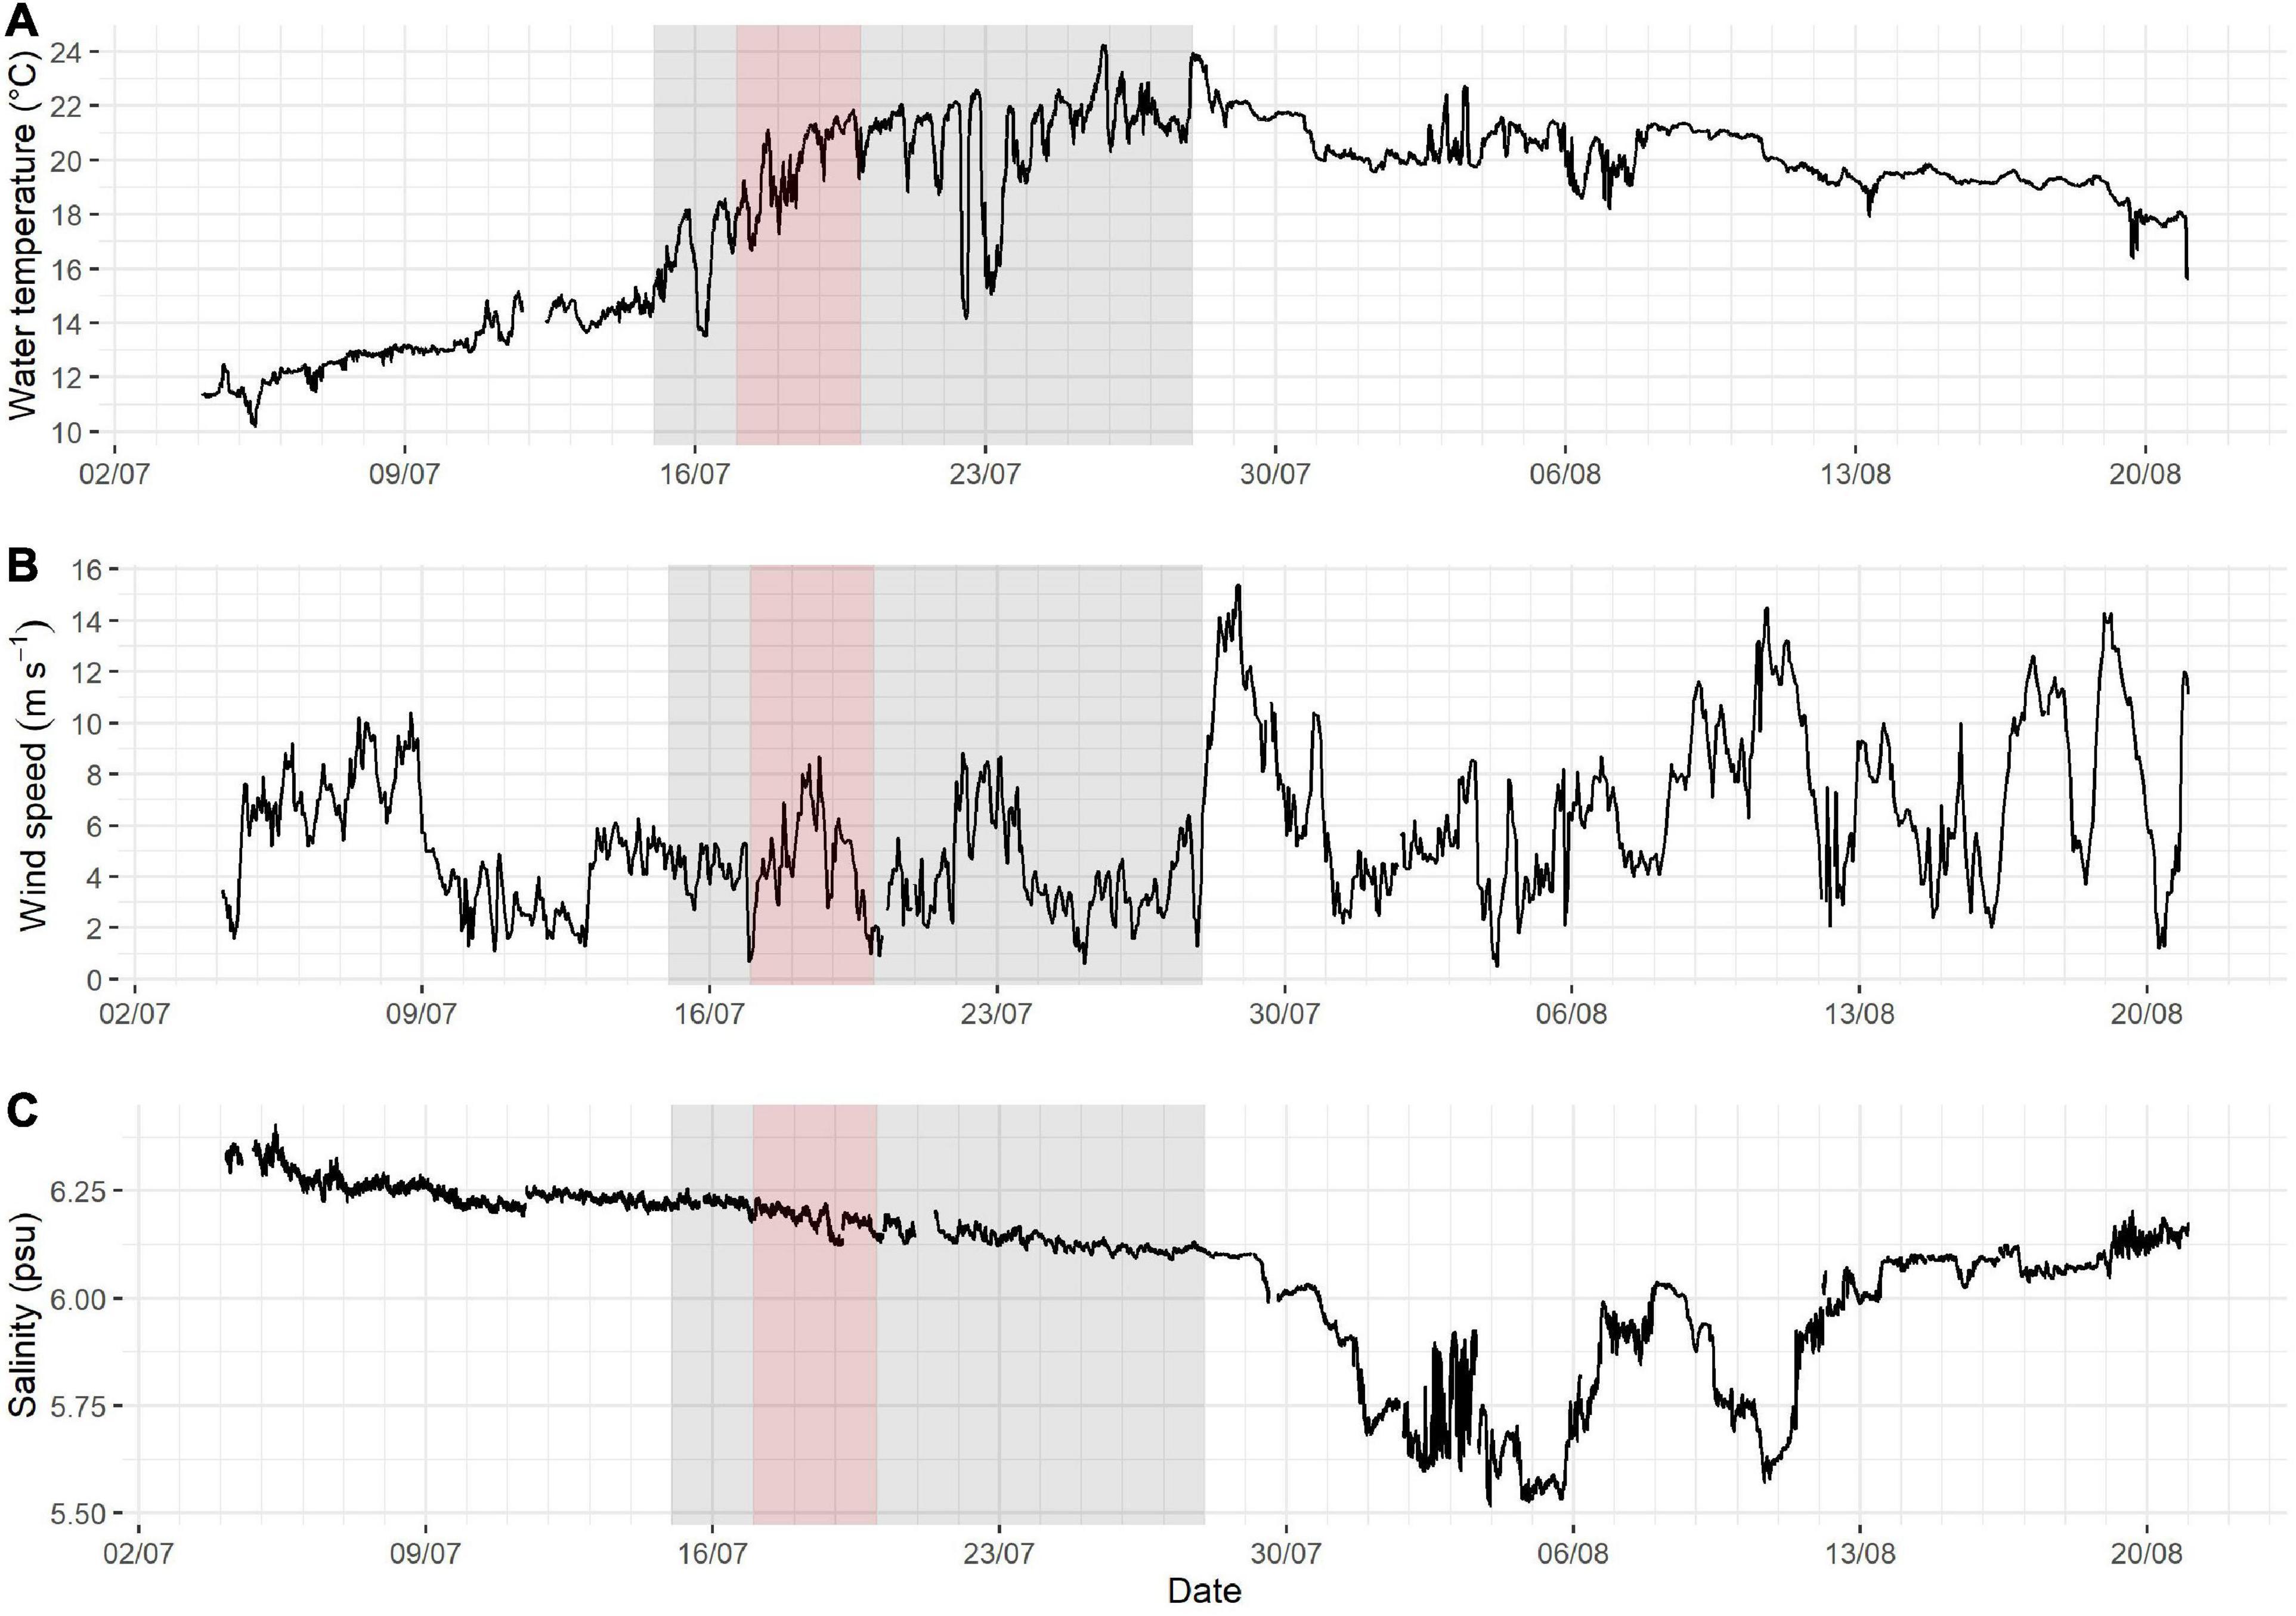
Figure 6. Prevailing environmental conditions, i.e., water temperature (A), wind speed (B) and salinity (C), in Utö during summer 2018. The Aphanizomenon and Dolichospermum bloom period (defined here as the days of biomass > approximately 100 μg L–1, see Figure 7) highlighted in gray and the bloom peak period (the days with the highest peaks) highlighted in red.
The biomasses of Aphanizomenon and Dolichospermum started to increase in mid-July and peaked very quickly, reaching maximum biomasses of 703 μg L–1 and 1087 μg L–1, respectively, between July 17 and 19 (Figure 7). Another smaller peak, with maximum biomasses of 396 μg L–1 and 429 μg L–1, soon followed. The overall bloom succession of both Aphanizomenon and Dolichospermum followed much of the same pattern, although Dolichospermum reached higher biomasses and displayed a wider biomass variation. Oscillatoriales increased at the same time as the main peak of Aphanizomenon and Dolichospermum subsided, reaching a biomass of 43 μg L–1 on July 21. The Oscillatoriales peak appeared at the same time as the second, smaller, Aphanizomenon and Dolichospermum peak period. However, Oscillatoriales shifted in a contrary direction, increasing as the other two decreased and decreasing as the other two increased within the next few days (Figure 7).
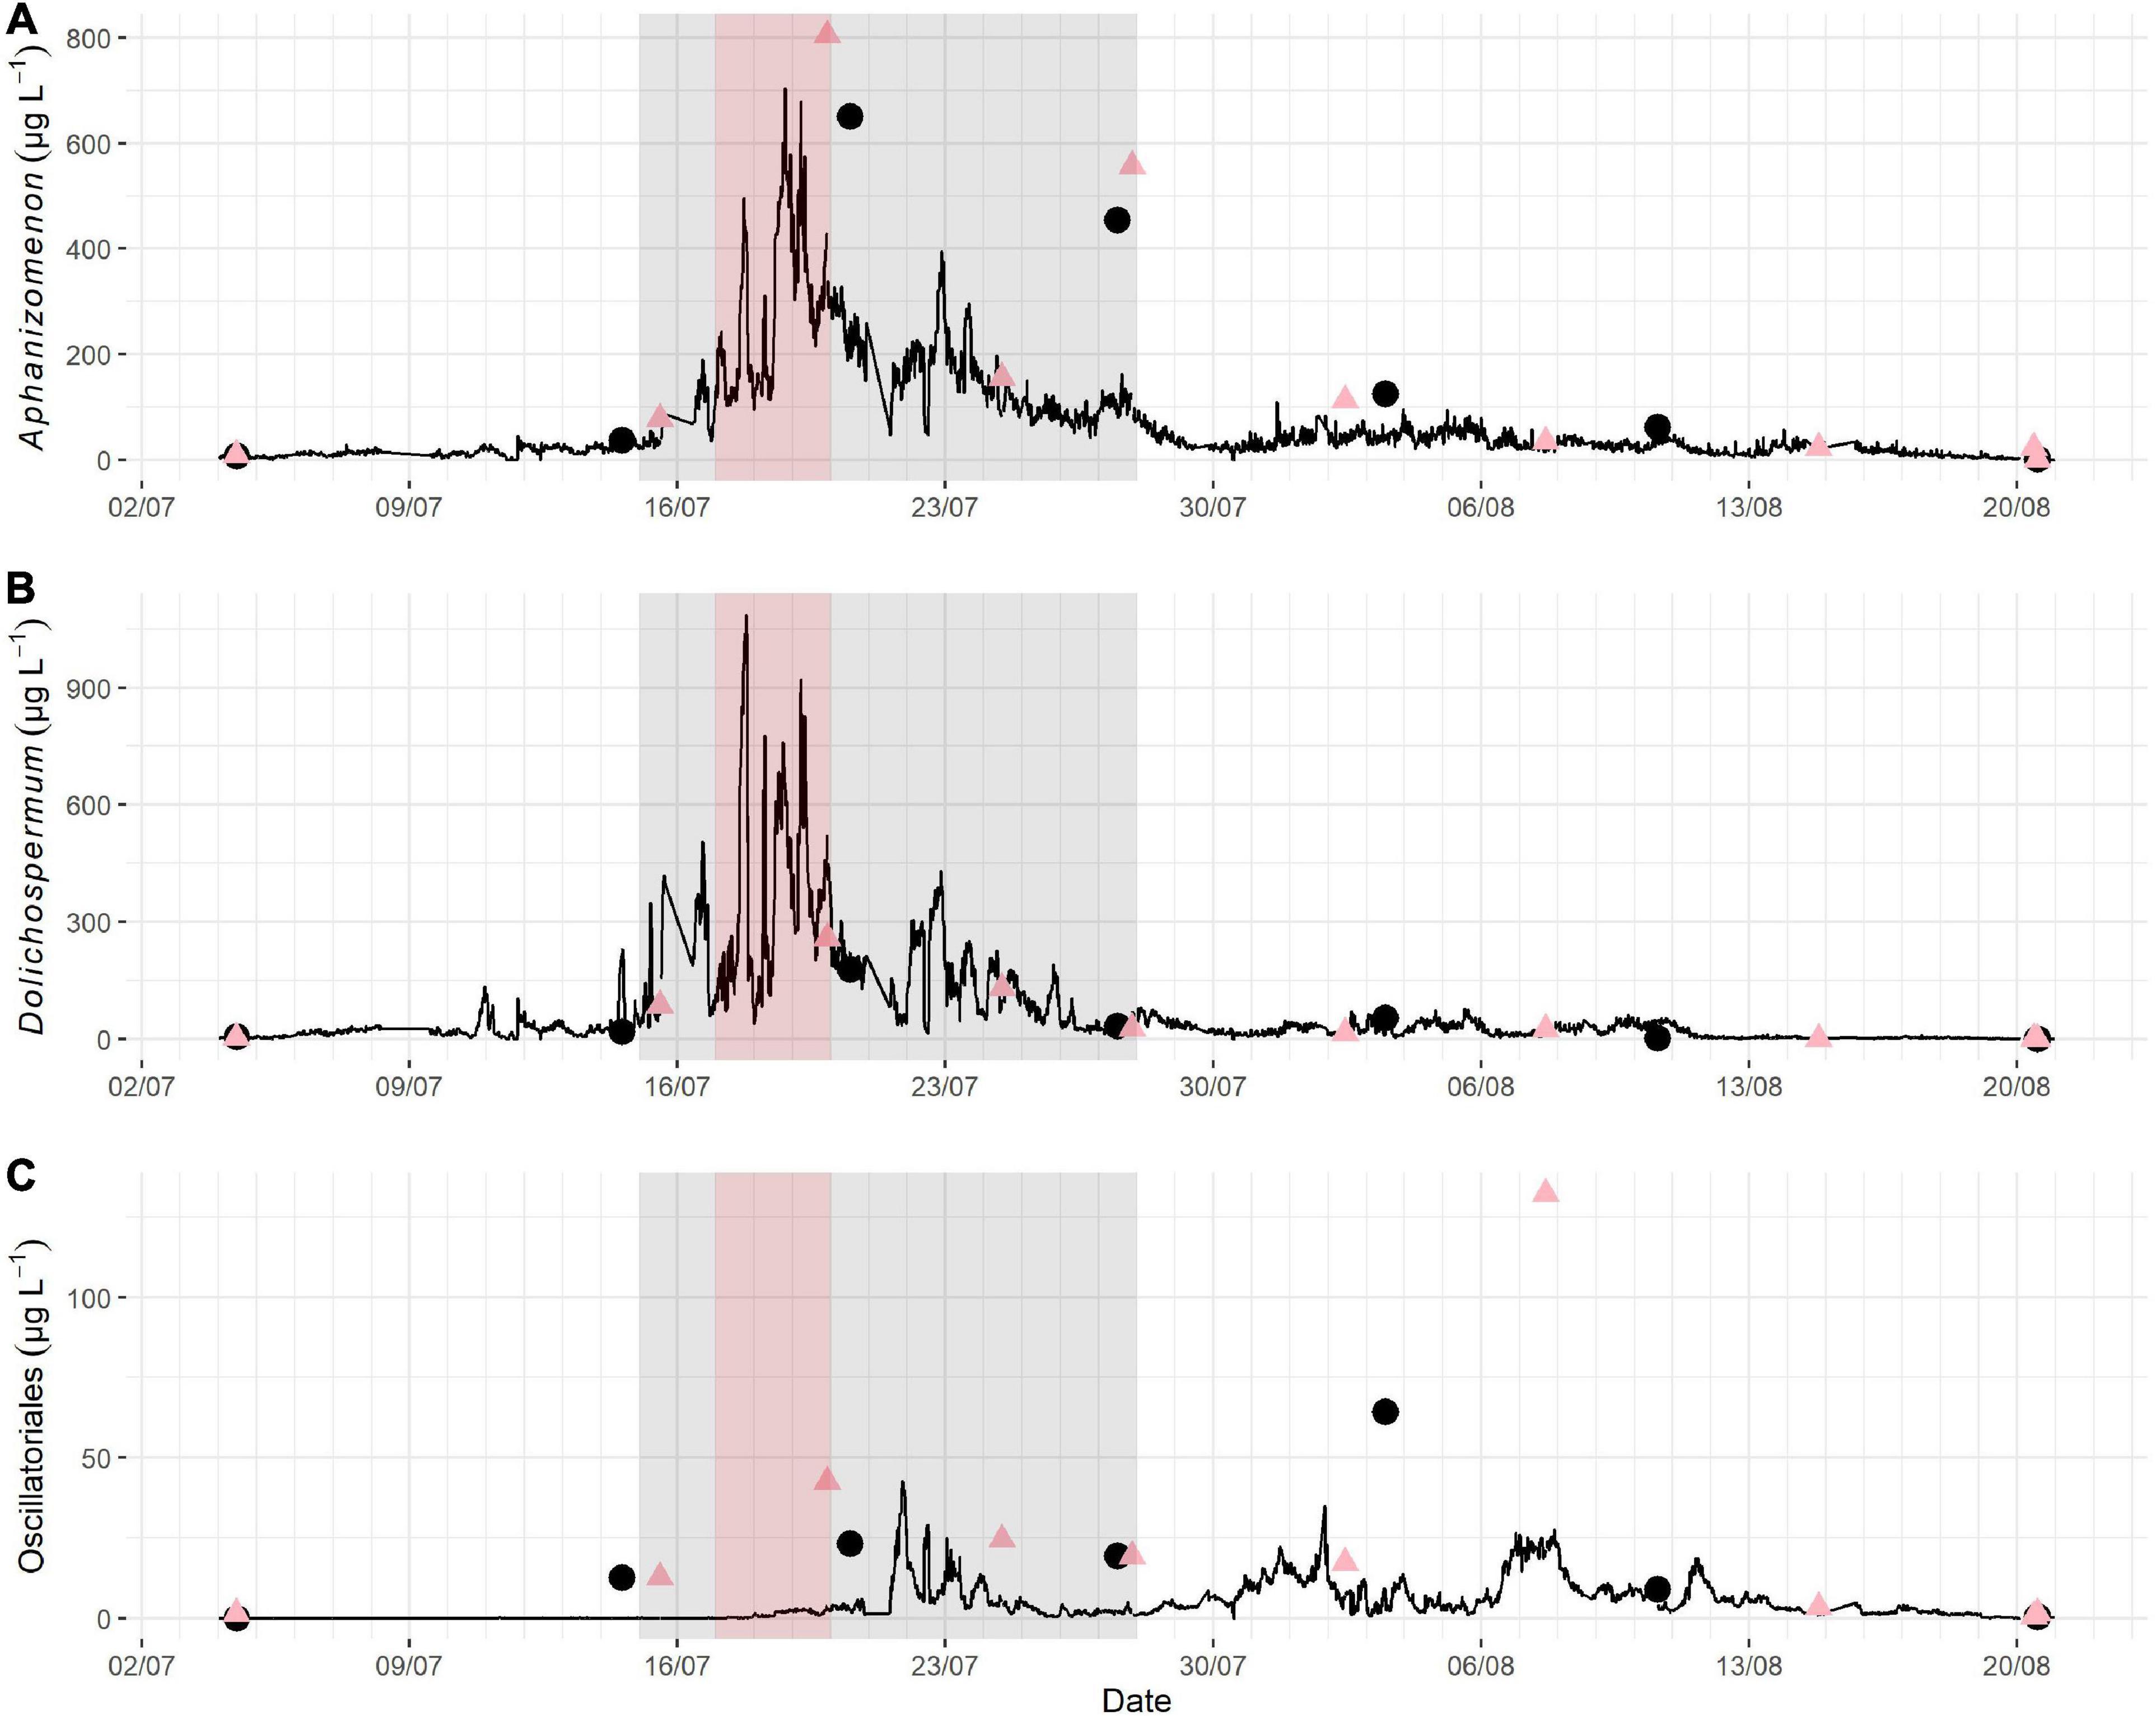
Figure 7. Biomass succession of Aphanizomenon (A), Dolichospermum (B) and Oscillatoriales (C) during the summer cyanobacterial bloom in Utö in 2018. The Aphanizomenon and Dolichospermum bloom period (defined here as the days of biomass > approximately 100 μg L–1) is highlighted in gray and the bloom peak period (the days with the highest peaks) highlighted in red. The black dots indicate light microscopy counts from samples taken from the flow-through system, and the red triangles indicate counts from samples taken at the pump inlet. Note the different scales on Y-axis between the subplots.
During the bloom period wind speed remained relatively low. Strong winds, up to 15 m s–1, on July 28 mixed the water column and terminated what remained of the bloom (Figures 6, 7). Salinity varied very little, decreasing fairly steadily from around 6.25 to around 6.1 psu. A noticeable drop in salinity occurred at the end of July after the bloom period (Figure 6) indicating a large shift in the water mass at the study site.
The biomass of Aphanizomenon followed the changes in water temperature during the bloom peak period as well as during the second smaller peak. Similarly, the biomass of Dolichospermum followed the same trend as water temperature, especially during the smaller peak when the variation in water temperature was wider. The biomass trends followed the water temperature also after the bloom period, but their concurrence was not as clear as the biomasses of Dolichospermum and Aphanizomenon were much lower.
Also, changes in the biomass of Oscillatoriales tightly followed water temperature, although changing in a contrary direction to the other studied cyanobacteria. After the bloom period, the changes in Oscillatoriales biomass continued to follow the same pattern as water temperature but the variation did not necessarily co-occur peak by peak as during the second Aphanizomenon and Dolichospermum peak, but rather on a larger scale. There were also some parallel fluctuations of Oscillatoriales and wind speed in August, as with water temperature, but the trend was not as clear.
Discussion
Annual summer blooms of filamentous cyanobacteria often develop to massive, potentially toxic surface accumulations in the Baltic Sea, restricting the use of marine areas and affecting the biogeochemical cycles (Larsson et al., 2001; Kahru and Elmgren, 2014). Predicting these blooms is difficult and there remain open questions on the regulating factors of the species composition, timing and magnitude of the blooms. The species composition is especially interesting because different bloom-forming filamentous cyanobacteria species of the Baltic Sea hold different characteristics regarding toxicity (Sivonen et al., 1989; Halinen et al., 2007). The sampling frequency of the IFCB has more potential, than the conventional, light microscopy based, phytoplankton monitoring, in resolving how different taxa respond to various types of environmental forcing.
IFCB is a powerful tool for following the patterns of marine phytoplankton communities, as shown in various studies already (e.g., Laney and Sosik, 2014; Anglès et al., 2019; Fischer et al., 2020) but proof for its applicability for filamentous cyanobacteria is still scarce. Our study demonstrates that IFCB can help in resolving taxon-specific community dynamics during cyanobacterial blooms on a time scale impossible to attain using conventional monitoring methods, and that it can potentially shed light on some unresolved questions concerning the driving environmental forces.
The information from IFCB images can be transformed to biomass and carbon estimates to be used for addressing ecological questions (Moberg and Sosik, 2012), but it is not always straightforward. With filamentous or other types of colonial phytoplankton, the image count does not account for the species’ abundance because the sizes of the filaments or colonies can vary considerably. Rather, the dynamics must be assessed by using biovolume-based metrics as a unit.
Biovolumes of especially some colonies or filaments are easily overestimated by the automated techniques due to the image processing method, in which the shape is interpreted as a solid object and any empty space occurring between the filaments or cells, is not recognized for what it is. Since the filament length is often difficult to estimate for coiled filaments, assessing their biovolumes is not always an easy task even with traditional light microscopy, let alone from the images using an image recognition algorithm. In this study we show that biovolume estimates obtained through a feature extraction from the IFCB images are comparable with the biovolumes used in the traditional light microscopical analysis (Table 2; Olenina et al., 2006, and its Annually updated appendix), which is used in the routine phytoplankton monitoring of the joint Baltic Sea monitoring program of HELCOM (Baltic Marine Environment Protection Commission – Helsinki Commission; HELCOM, 2017).
Biomass Estimation of Filamentous Cyanobacteria Using IFCB
Several methods have been proposed for using image analysis to help enumerate filamentous cyanobacteria (see e.g., Almesjö and Rolff, 2007; Gandola et al., 2016). These methods, developed mostly for microscopy images, show that discrimination between taxa is feasible and can be automated. However, images obtained by various imaging instruments are with different resolution, characteristics and quality. Hence, methods created for microscopy images are not directly applicable for other imaging instruments such as imaging-in-flow systems, although they do provide valuable background information for future development of the image analysis of these systems as well.
There are some studies available where the total abundances of filamentous cyanobacteria acquired with imaging-in-flow instruments have been compared to the ones acquired with traditional light microscopy (Graham et al., 2018; Hrycik et al., 2019). Only Hrycik et al. (2019) compared biovolumes acquired through image analysis with the ones acquired through light microscopy, however, they dealt with total filamentous cyanobacteria biovolumes and did not discriminate between taxa. Graham et al. (2018) dealt with taxon specific results, however, the units were in number of cells and did not provide information on the biovolumes. In both studies they ended up sorting the images manually because the automated sorting method of FlowCAM was not found to be reliable enough.
Both Graham et al. (2018) and Hrycik et al. (2019) had promising results when comparing FlowCAM abundance estimates to microscopy results with a high comparability of the two methods. Our study provides the first attempt to determine the biovolumes and abundances of Baltic Sea filamentous cyanobacteria using IFCB. The data consists of millions of filamentous cyanobacteria images collected and analyzed in a fully automated way. Our results verify that the cyanobacteria abundances can be reliably and operationally followed in high-resolution.
Determination of the biovolume of filamentous species using images largely depends on the correct measurement of the filament width and length as well as sorting out the number of possibly stacked filaments. In microscopic analysis, further complications arise as, instead of measuring the width, typically a nominal width is selected from a look-up table for each filament counted, and this needs to be determined by eye. In the case of Dolichospermum, the measured average IFCB biovolume was almost exactly the same as the biovolume used for the majority of Dolichospermum counting units in the microscopical analysis. However, in the case of Aphanizomenon there was a statistically significant difference between the average biovolume determined by the IFCB and the biovolume used in microscopy. Oscillatoriales biovolumes differed percentually the most (Table 2).
The difference between the average IFCB biovolume of Aphanizomenon and the biovolume for a 5 μm wide filament according to the microscopy results was statistically significant. However, when considering the size classes available for Aphanizomenon spp. for microscopical analysis in Olenina et al. (2006), the average IFCB biovolume of Aphanizomenon falls between the size classes of the 4 and 5 μm wide filaments (biovolumes 1256 μm3 and 1963 μm3, respectively) and therefore they would be impossible to match exactly in practice. With Oscillatoriales the difference was percentually slightly larger, but similarly to Aphanizomenon the average biovolume measured for a 100 μm long filament from the IFCB images falls approximately between the size classes of 1.5 μm and 2 μm wide filaments (biovolumes 177 μm3 and 314 μm3, respectively), with the 1.5 μm size class being the one used for most of the Oscillatoriales counted in the light microscopical analysis. Therefore, it can be determined that they compare to the combined HELCOM phytoplankton monitoring method used around the Baltic Sea with sufficient accuracy.
To further support the observed good comparability of the methods, there was also a strong correlation of the filamentous cyanobacterial biomasses of the IFCB and the light microscopical analyses. In addition to the statistically significant correlation, the regression analysis also supports the conclusions, especially in the case of Aphanizomenon and Dolichospermum; Oscillatoriales had a slightly weaker correspondence (Figure 4).
Among the categories, Dolichospermum biomass had the strongest correlation between the two methods. This was regardless of the fact that the biovolumes of coiled Dolichospermum filaments (Figure 1D) needed a further conversion as the image recognition algorithm interpreted them as large, roundish objects. The estimation of a conversion factor through a linear model is a promising approach for transforming the results to more realistic ones (Figure 3), nevertheless the image processing methods should preferably be developed toward finding a yet better, automatic solution for the issue rather than using a conversion factor based on manual measurements.
For Aphanizomenon and especially for Oscillatoriales, the biomass estimate was higher with microscopy when the total biomass of the sample was higher. Graham et al. (2018) attained similar results when comparing the abundance estimates of FlowCAM and microscopy. They used cell density and not biomass, but similarly they had a stronger relationship between the two methods for Dolichospermum sp. (Anabaena sp. in their study) than for Aphanizomenon, for which cell counts were higher with microscopy. The factors behind such differences may be complex, but one issue that affects both instruments is the difficulty for automated instruments to enumerate Aphanizomenon appearing in long filaments and big bundles. This is due to the fact that, first, they may be filtered away, second, the images of too long filaments will be cut and therefore those filaments will be enumerated only partially, and third, the 3-dimensional structure of bundles is impossible to estimate precisely which is of course a challenge also in traditional light microscopy. However, as stated in this study, also Dolichospermum filaments are not supposed to be the easiest to enumerate when appearing in a coiled form, and yet stronger relationships between the methods have been found by our study as well as by Graham et al. (2018). Perhaps the size of the larger clumps of filaments of Dolichospermum is not as big as the Aphanizomenon bundles.
In the case of Oscillatoriales, the difference between the biovolumes calculated based on the light microscopy analyses and those retrieved from the IFCB images by feature extraction could be at least partly explained by a weaker measurement resolution of the IFCB because the thinner filaments with less pixels in the images can lead to a higher possibility of error. There was a statistically significant correlation between the IFCB and light microscopically attained biomasses of Oscillatoriales, but still the biomasses were consistently higher with light microscopy (Figure 4). The same phenomenon, i.e., light microscopy counts providing a higher biomass, can also be observed in the time series (Figure 7). From the time series we can also see that the microscopy and IFCB observations do not differ whether the microscopy sample was taken from the pump inlet or from the flow-through system, indicating that the issue is related to the method rather than to the sampling point.
There were some differences within Aphanizomenon biomass observations between methods. In the sample of the evening of July 19 and in the sample of July 20 at midday there is a great difference between the IFCB and microscopical analysis (Figure 7). The same occurs in the two samples of July 27 at midday and in the evening. It is unclear what causes the difference between the IFCB and the microscopy counts. It cannot be explained by the biomass being too high for the IFCB to detect, as there are IFCB results of the same magnitude. The seemingly obvious explanation could be related to the occurrence of excessively long filaments or big bundles of filaments, since in both cases the 150 μm mesh would prevent these from being sampled and analyzed by the IFCB. However, this theory is not supported by the average filament length data (Figure 5) as the differences in length are a magnitude smaller than the differences in biomass.
There was a statistically significant difference between the methods in the mean length of both Aphanizomenon and Dolichospermum filaments indicating that the mesh has at least some effect on the size range of detection with IFCB. In the case of Dolichospermum it is at least partially explained by the fact that the coiled filaments could not be included in the measurements from the IFCB images, since the filament lengths could not be determined because of the unrealistic interpretation of the filament areas. There was also a difference in the filament lengths of the microscopy samples taken from the pump inlet and from the station building indicating that the Aphanizomenon filaments might slightly suffer from the pumping system, but the same trend was not noted for Dolichospermum. The difference in length was so small though that it should not account for much variation in the biomass (Figure 5). For Dolichospermum there was no noticeable difference in the biomass results between IFCB and microscopy (Figure 7).
The Baltic Sea cyanobacterial blooms have been found to be spatially heterogeneous and patchy (Almesjö, 2007; Seppälä et al., 2007). Besides the horizontal patchiness, cyanobacteria are not evenly distributed in the water column and vertical migration has been detected for both Aphanizomenon and Dolichospermum (Olli and Seppälä, 2001; Hajdu et al., 2007), making it harder to limit the affecting factors in the biomass estimates. Both Graham et al. (2018) and Hrycik et al. (2019) did the comparisons between FlowCAM and light microscopical analysis from the same sample and therefore our results hold a larger error margin, since we compared two different samples even if we did try to optimize the origin of the sample water.
Cyanobacterial Bloom Dynamics Detected by IFCB
The downside of traditional phytoplankton monitoring data is their low temporal resolution, mainly due to the time-consuming sample analysis procedure, the microscopical analysis of one phytoplankton sample taking up to a full working day. Although conventional light microscopical analysis yields a higher taxonomical resolution of the phytoplankton community as compared to novel image analysis methods, the low temporal frequency of conventional monitoring data together with the high variability and patchiness of the blooms leaves some stochasticity to the conclusions drawn from regular monitoring data. Changes in the biomass may vary considerably even throughout the day (Figure 7) and when the sampling happens to occur determines to some extent how the situation is described at that moment and consequently represents the conditions also in a longer time scale.
Aphanizomenon is a regular bloom former in the northern parts of the Baltic Sea but Dolichospermum is usually present in lower quantities, although there has been evidence of increasing abundance of Dolichospermum in past decades (Stal et al., 2003; Brutemark et al., 2015). There were exceptionally large blooms of cyanobacteria (Aphanizomenon and Dolichospermum) in the Baltic Sea in summer 2018 covering extensive areas of e.g., the Gulf of Finland and causing significant harm to recreational use. The species composition was unusual, since Nodularia usually occurs in higher densities than Dolichospermum, also in the Northern Baltic Proper, although being more abundant in the more saline southern basins of the Baltic Sea (Olofsson et al., 2020).
Based on our IFCB and microscopy observations during the bloom of 2018 by the Utö island in the southern part of the Archipelago Sea (Figure 2), Aphanizomenon was present in high biomass as is typical, but exceptionally also Dolichospermum had biomass peaks of the same magnitude and higher (Figure 7). Nodularia was almost absent, only a few filaments occurred in a few microscopy samples. There were also occasional Nodularia filaments in the IFCB images, but due to its sporadic occurrence the species could not be included in the automated sample analysis.
Nodularia is larger in size and may form large, tightly coiled, buoyant filament bundles that may be too large to pass through the mesh at the IFCB inlet. However, if Nodularia had occurred in high numbers, there should also have been filament bundles less than 150 μm in diameter and therefore its presence had been detectable with the IFCB. Vertical distribution does not explain the absence of Nodularia: similarly to Aphanizomenon and Dolichospermum, also Nodularia should have been detected at 5 m depth, even if it is not its preferred depth (Olli and Seppälä, 2001; Hajdu et al., 2007). The microscopy counts confirm the absence of Nodularia since the samples were taken from the same depth and from as close as possible to the pump inlet with the same method as traditional monitoring samples without any filtering procedures. Finnish phytoplankton monitoring samples support the low abundance of the species during the summer 2018 blooms (Lehtinen, unpublished data).
During the biomass peak period water temperatures remained unusually high, hence the conditions were favorable for cyanobacteria. Cyanobacterial blooms in the Baltic Sea are known to be favored by calm, warm weather (Kanoshina et al., 2003). Nodularia was almost entirely absent while Aphanizomenon and Dolichospermum dominated the entire bloom, even though bloom formation of especially Nodularia is usually related to increased water temperature and irradiation as well as stratification (Lehtimäki et al., 1997). The 2018 cyanobacteria bloom was initiated by a calm, warm weather period when the water temperature rose above 16°C, which has been found to be a type of critical temperature for higher abundances and growth (Wasmund, 1997; Kanoshina et al., 2003). The highest peak of Aphanizomenon and Dolichospermum appeared when water temperature increased and remained close to and even above 20°C. The dispersal of the bloom occurred on July 28 when the wind speed rose to 15 m s–1 (Figures 6, 7) indicating a high importance of physical forcing to the bloom succession.
The biomass of Oscillatoriales was undoubtedly markedly smaller than that of Aphanizomenon and Dolichospermum throughout the study period, but what was interesting is that Oscillatoriales seemed to be more abundant only when the other two cyanobacterial genera were less abundant. This might indicate that the cyanobacterial community composition was closely related to shifts in the water masses. Also later there was some affiliation of Oscillatoriales with changes in salinity which further indicates shifts in the water mass. Oscillatoriales is also known to correlate with lower salinity conditions (Andersson et al., 2015).
There is a great spatial variation in the occurrence of both Aphanizomenon and Nodularia which increases with high biomass values (Almesjö, 2007). It is difficult to estimate the abundance of cyanobacteria at even a single location since the vertical, spatial and temporal variation of the species is high (Olli and Seppälä, 2001; Hajdu et al., 2007; Figure 7). Vertical migration of Aphanizomenon may also affect the interpretation of the influence of environmental factors on the cyanobacterial population at a single depth (Olli and Seppälä, 2001). The surface accumulation of Aphanizomenon has been associated with daytime (Olli and Seppälä, 2001) but in the present study the peaks of both Aphanizomenon and Dolichospermum rather occurred more frequently at night time (Figure 7). Further analysis including diurnal oscillation is needed to draw firm conclusions about the timing of the peaks and the environmental factors affecting them.
Conclusion
Summer blooms of filamentous cyanobacteria are an annual nuisance in the Baltic Sea. Novel methods offer possibilities to resolve some remaining open questions on the regulating factors of the species composition, timing and magnitude of these blooms. IFCB has been demonstrated to be a promising tool in following the patterns of different species within the phytoplankton community. However, prior to our study no reports exist on how well IFCB is suited to study filamentous cyanobacteria.
In this study we have shown that IFCB and light microscopical methods used in phytoplankton monitoring are comparable in estimating abundances of filamentous cyanobacteria, and that IFCB could be a valuable tool for monitoring and research of the recurring Baltic Sea cyanobacterial HABs. The random forest algorithm was accurate in differentiating various filamentous taxa, while more advanced convoluted neural network methods may be needed when expanding the study to address the whole phytoplankton community (Eerola et al. submitted manuscript).
The results acquired with IFCB and light microscopy were comparable, yet some differences were detected and the reasons for these discrepancies are not yet fully clear. The comparison of the two methods is challenging because of the inherent uncertainty of both of the methods in giving a wholly accurate, ground truth type biomass estimation. One certain contributing factor is the large spatial variation in the occurrence of filamentous cyanobacteria, which is also one of the reasons why a temporally high sampling resolution is important. For an as precise as possible comparison, optimally the measurements would be made with both methods from the exact same sample, but with a continuous flow-through set up like in Utö it is not possible. However, regardless of the discrepancies, IFCB provides reliable information on the shifts in the phytoplankton community.
Traditional light microscopical analysis is largely dependent on the expertise and experience of the person performing the analysis and on which accuracy and effort the counting is done (Dromph et al., 2013). For an all-encompassing method comparison, the light microscopical counting and measuring would ideally be done more thoroughly than is possible when counting samples using conventional monitoring methodology, e.g., by measuring each filament with the help of a microscope camera and its measuring software, but it is very time consuming with multiple samples; furthermore our specific aim was to compare the results from IFCB with those attained using conventional phytoplankton monitoring methods. With image recognition algorithms we can acquire detailed information on the size of each filament, however, the algorithms must be developed to be more precise regarding the size of the detected object to obtain even more accurate biovolume estimates.
The cyanobacteria community composition and taxon abundances during a bloom vary greatly within a short time period. The shifts between biomass peaks are rapid and to further our understanding of the driving factors of the community these shifts need to be studied in detail against environmental parameters. Our study indicates that water temperature was an important component affecting the development of the bloom and the changes during the bloom closely followed the changes in water masses. A holistic analysis of the prevailing environmental conditions against shifts in the phytoplankton community during a bloom will help to understand taxon-specific differences and the important regulating abiotic factors. The next step will be analyzing the fine details of cyanobacterial community shifts found in this study by combining IFCB results with other cyanobacteria observations (optical sensors at various platforms, satellite data) and a wide range of complementary physical and chemical observations.
Data Availability Statement
The raw data supporting the conclusions of this article will be made available by the authors, without undue reservation.
Author Contributions
TT and JS had the original vision of acquiring the IFCB and the setup in Utö. HH, SS, PY, SA, HK, SL, and JO contributed to the early stages of the implementation of the instrument to the Baltic Sea, in the process of identifying phytoplankton from the images and in the start of creating training sets. KK, JS, PY, SK, and TT were involved in the field work in Utö. LL and MH provided the environmental data. KK did the microscoping and all of the IFCB data processing related work. KK processed the data and wrote the manuscript with the help of JS, HH, and SS. All of the authors contributed to the writing of the manuscript by comments and editing.
Funding
The study was funded by Tiina and Antti Herlin Foundation and Academy of Finland project FASTVISION (grant no. 321980). Part of this work was supported by the JERICO-NEXT and JERICO-S3 projects which have received funding from the European Union Horizon 2020 Research and Innovation Program under grant agreement nos. 654410 and 871153, respectively. This study utilized research infrastructure facilities provided by FINMARI (Finnish Marine Research Infrastructure network).
Conflict of Interest
The authors declare that the research was conducted in the absence of any commercial or financial relationships that could be construed as a potential conflict of interest.
Acknowledgments
We thank Ismo and Brita Willström for help with sensor maintenance at Utö and for assisting in the collection of the phytoplankton samples. We also thank the reviewers for providing comments that improved the manuscript.
References
Almesjö, L. (2007). Filamentous Cyanobacteria in the Baltic Sea - Spatiotemporal Patterns and Nitrogen Fixation. Ph.D. thesis, Stockholm University, Stockholm.
Almesjö, L., and Rolff, C. (2007). Automated measurements of filamentous cyanobacteria by digital image analysis. Limnol. Oceanogr. Methods 5, 217–224. doi: 10.4319/lom.2007.5.217
Anderson, C. R., Berdalet, E., Kudela, R. M., Cusack, C. K., Silke, J., O’Rourke, E., et al. (2019). Scaling up from regional case studies to a global harmful algal bloom observing system. Front. Mar. Sci. 6:250. doi: 10.3389/fmars.2019.00250
Andersson, A., Höglander, H., Karlsson, C., and Huseby, S. (2015). Key role of phosphorus and nitrogen in regulating cyanobacterial community composition in the northern Baltic Sea. Estuar. Coast. Shelf Sci. 164, 161–171. doi: 10.1016/j.ecss.2015.07.013
Anglès, S., Jordi, A., and Campbell, L. (2015). Responses of the coastal phytoplankton community to tropical cyclones revealed by high-frequency imaging flow cytometry. Limnol. Oceanogr. 60, 1562–1576. doi: 10.1002/lno.10117
Anglès, S., Jordi, A., Henrichs, D. W., and Campbell, L. (2019). Influence of coastal upwelling and river discharge on the phytoplankton community composition in the northwestern Gulf of Mexico. Progr. Oceanogr. 173, 26–36. doi: 10.1016/j.pocean.2019.02.001
Baek, S. S., Pyo, J., Pachepsky, Y., Park, Y., Ligaray, M., Ahn, C. Y., et al. (2020). Identification and enumeration of cyanobacteria species using a deep neural network. Ecol. Indic. 115:106395. doi: 10.1016/j.ecolind.2020.106395
Bolaños, L. M., Karp-Boss, L., Choi, C. J., Worden, A. Z., Graff, J. R., Haëntjens, N., et al. (2020). Small phytoplankton dominate western North Atlantic biomass. ISME J. 14, 1663–1674. doi: 10.1038/s41396-020-0636-0
Borchers, H. W. (2019). pracma: Practical Numerical Math Functions. R package version 2.2.9. Available online at: https://CRAN.R-project.org/package=pracma (accessed August 10, 2020).
Brosnahan, M. L., Farzan, S., Keafer, B. A., Sosik, H. M., Olson, R. J., and Anderson, D. M. (2014). Complexities of bloom dynamics in the toxic dinoflagellate Alexandrium fundyense revealed through DNA measurements by imaging flow cytometry coupled with species-specific rRNA probes. Deep Sea Res. II 103, 185–198. doi: 10.1016/j.dsr2.2013.05.034
Brosnahan, M. L., Fischer, A. D., Lopez, C. B., Moore, S. K., and Anderson, D. M. (2020). Cyst-forming dinoflagellates in a warming climate. Harmful Algae 91:101728. doi: 10.1016/j.hal.2019.101728
Brosnahan, M. L., Ralston, D. K., Fischer, A. D., Solow, A. R., and Anderson, D. M. (2017). Bloom termination of the toxic dinoflagellate Alexandrium catenella: vertical migration behavior, sediment infiltration, and benthic cyst yield. Limnol. Oceanogr. 62, 2829–2849. doi: 10.1002/lno.10664
Brosnahan, M. L., Velo-Suárez, L., Ralston, D. K., Fox, S. E., Sehein, T. R., Shalapyonok, A., et al. (2015). Rapid growth and concerted sexual transitions by a bloom of the harmful dinoflagellate Alexandrium fundyense (Dinophyceae). Limnol. Oceanogr. 60, 2059–2078. doi: 10.1002/lno.10155
Brutemark, A., Vandelannoote, A., Engström-Öst, J., and Suikkanen, S. (2015). A less saline Baltic Sea promotes cyanobacterial growth, hampers intracellular microcystin production, and leads to strain-specific differences in allelopathy. PLoS One 10:e0128904. doi: 10.1371/journal.pone.0128904
Burford, M. A., Carey, C. C., Hamilton, D. P., Huisman, J., Paerl, H. W., Wood, S. A., et al. (2020). Perspective: advancing the research agenda for improving understanding of cyanobacteria in a future of global change. Harmful Algae 91:101601. doi: 10.1016/j.hal.2019.04.004
Campbell, L., Henrichs, D. W., Olson, R. J., and Sosik, H. M. (2013). Continuous automated imaging-in-flow cytometry for detection and early warning of Karenia brevis blooms in the Gulf of Mexico. Environ. Sci. Pollut. Res. 20, 6896–6902. doi: 10.1007/s11356-012-1437-4
Campbell, L., Olson, R. J., Sosik, H. M., Abraham, A., Henrichs, D. W., Hyatt, C. J., et al. (2010). First harmful Dinophysis (Dinophyceae, Dinophysiales) bloom in the US revealed by automated imaging flow cytometry. J. Phycol. 46, 66–75. doi: 10.1111/j.1529-8817.2009.00791.x
Capone, D. G., Zehr, J. P., Paerl, H. W., Bergman, B., and Carpenter, E. J. (1997). Trichodesmium, a globally significant marine cyanobacterium. Science 276, 1221–1229. doi: 10.1126/science.276.5316.1221
CEN (2015). DIN EN 16695 Water quality – Guidance on the Estimation of Phytoplankton Biovolume: English version EN 16695, 2015. Available online at: https://standards.iteh.ai/catalog/standards/cen/bcc87031-164e-45b9-933a-7db83d4658f4/en-16695-2015 (accessed July 9, 2020).
Congestri, R., Federici, R., and Albertano, P. (2000). Evaluating biomass of Baltic filamentous cyanobacteria by image analysis. Aquat. Microb. Ecol. 22, 283–290. doi: 10.3354/ame022283
Dashkova, V., Malashenkov, D., Poulton, N., Vorobjev, I., and Barteneva, N. S. (2017). Imaging flow cytometry for phytoplankton analysis. Methods 112, 188–200. doi: 10.1016/j.ymeth.2016.05.007
Dromph, K. M., Agusti, S., Basset, A., Franco, J., Henriksen, P., Icely, J., et al. (2013). Sources of uncertainty in assessment of marine phytoplankton communities. Hydrobiologia 704, 253–264. doi: 10.1007/s10750-012-1353-0
Ernst, B., Neser, S., O’Brien, E., Hoeger, S. J., and Dietrich, D. R. (2006). Determination of the filamentous cyanobacteria Planktothrix rubescens in environmental water samples using an image processing system. Harmful Algae 5, 281–289. doi: 10.1016/j.hal.2005.08.003
Fischer, A. D., Hayashi, K., McGaraghan, A., and Kudela, R. M. (2020). Return of the “age of dinoflagellates” in Monterey Bay: Drivers of dinoflagellate dominance examined using automated imaging flow cytometry and long-term time series analysis. Limnol. Oceanogr. 65, 2125–2141. doi: 10.1002/lno.11443
Gallon, J. R., Evans, A. M., Jones, D. A., Albertano, P., Congestri, R., Bergman, B., et al. (2002). Maximum rates of N2 fixation and primary production are out of phase in a developing cyanobacterial bloom in the Baltic Sea. Limnol. Oceanogr. 47, 1514–1521. doi: 10.4319/lo.2002.47.5.1514
Gandola, E., Antonioli, M., Traficante, A., Franceschini, S., Scardi, M., and Congestri, R. (2016). ACQUA: automated cyanobacterial quantification algorithm for toxic filamentous genera using spline curves, pattern recognition and machine learning. J. Microbiol. Methods 124, 48–56. doi: 10.1016/j.mimet.2016.03.007
Graham, M. D., Cook, J., Graydon, J., Kinniburgh, D., Nelson, H., Pilieci, S., et al. (2018). High-resolution imaging particle analysis of freshwater cyanobacterial blooms. Limnol. Oceanogr. Methods 16, 669–679. doi: 10.1002/lom3.10274
Hajdu, S., Höglander, H., and Larsson, U. (2007). Phytoplankton vertical distributions and composition in Baltic Sea cyanobacterial blooms. Harmful Algae 6, 189–205. doi: 10.1016/j.hal.2006.07.006
Halinen, K., Jokela, J., Fewer, D. P., Wahlsten, M., and Sivonen, K. (2007). Direct evidence for production of microcystins by Anabaena strains from the Baltic Sea. Appl. Environ. Microbiol. 73, 6543–6550. doi: 10.1128/AEM.01377-07
Hällfors, H., Backer, H., Leppänen, J.-M., Hällfors, S., Hällfors, G., and Kuosa, H. (2013). The northern Baltic Sea phytoplankton communities in 1903–1911 and 1993–2005: a comparison of historical and modern species data. Hydrobiologia 707, 109–133. doi: 10.1007/s10750-012-1414-4
Harred, L. B., and Campbell, L. (2014). Predicting harmful algal blooms: a case study with Dinophysis ovum in the Gulf of Mexico. J. Plankton Res. 36, 1434–1445. doi: 10.1093/plankt/fbu070
HELCOM (2017). “Monitoring of phytoplankton species composition, abundance and biomass.” In Manual for Marine Monitoring in the COMBINE Programme of HELCOM. Available online at: https://helcom.fi/media/publications/Manual-for-Marine-Monitoring-in-the-COMBINE-Programme-of-HELCOM.pdf (accessed August 10, 2020).
Hennon, G. M., and Dyhrman, S. T. (2020). Progress and promise of omics for predicting the impacts of climate change on harmful algal blooms. Harmful Algae 91:101587. doi: 10.1016/j.hal.2019.03.005
Henrichs, D. W., Scott, P. S., Steidinger, K. A., Errera, R. M., Abraham, A., and Campbell, L. (2013). Morphology and Phylogeny of Prorocentrum texanum sp. nov. (Dinophyceae): a new toxic dinoflagellate from the gulf of mexico coastal waters exhibiting two distinct morphologies. J. Phycol. 49, 143–155. doi: 10.1111/jpy.12030
Henrichs, D. W., Sosik, H. M., Olson, R. J., and Campbell, L. (2011). Phylogenetic analysis of Brachidinium capitatum (Dinophyceae) from the Gulf of Mexico indicates membership in the Kareniaceae. J. Phycol. 47, 366–374. doi: 10.1111/j.1529-8817.2011.00960.x
Hrycik, A. R., Shambaugh, A., and Stockwell, J. D. (2019). Comparison of FlowCAM and microscope biovolume measurements for a diverse freshwater phytoplankton community. J. Plankton Res. 41, 849–864. doi: 10.1093/plankt/fbz056
Huisman, J., Codd, G. A., Paerl, H. W., Ibelings, B. W., Verspagen, J. M., and Visser, P. M. (2018). Cyanobacterial blooms. Nat. Rev. Microbiol. 16, 471–483. doi: 10.1038/s41579-018-0040-1
Ibelings, B. W., and Chorus, I. (2007). Accumulation of cyanobacterial toxins in freshwater “seafood” and its consequences for public health: a review. Environ. Pollut. 150, 177–192. doi: 10.1016/j.envpol.2007.04.012
Ibelings, B. W., and Havens, K. E. (2008). “Cyanobacterial toxins: a qualitative meta–analysis of concentrations, dosage and effects in freshwater, estuarine and marine biota,” in Cyanobacterial Harmful Algal Blooms: State of the Science and Research Needs, Advances in Experimental Medicine and Biology, Vol. 619, ed. H. K. Hudnell (New York, NY: Springer), 675–732. doi: 10.1007/978-0-387-75865-7_32
Kahru, M., and Elmgren, R. (2014). Multidecadal time series of satellite-detected accumulations of cyanobacteria in the Baltic Sea. Biogeosciences 11, 3619–3633. doi: 10.5194/bg-11-3619-2014
Kahru, M., Elmgren, R., Kaiser, J., Wasmund, N., and Savchuk, O. (2020). Cyanobacterial blooms in the Baltic Sea: Correlations with environmental factors. Harmful Algae 92:101739. doi: 10.1016/j.hal.2019.101739
Kahru, M., Horstmann, U., and Rud, O. (1994). Satellite detection of increased cyanobacteria blooms in the Baltic Sea: natural fluctuation or ecosystem change? Ambio 23, 469–472.
Kahru, M., Leppänen, J. M., Rud, O., and Savchuk, O. P. (2000). Cyanobacteria blooms in the Gulf of Finland triggered by saltwater inflow into the Baltic Sea. Mar. Ecol. Prog. Ser. 207, 13–18. doi: 10.3354/meps207013
Kangro, K., Olli, K., Tamminen, T., and Lignell, R. (2007). Species-specific responses of a cyanobacteria-dominated phytoplankton community to artificial nutrient limitation in the Baltic Sea. Mar. Ecol. Prog. Ser. 336, 15–27. doi: 10.3354/meps336015
Kanoshina, I., Lips, U., and Leppänen, J. M. (2003). The influence of weather conditions (temperature and wind) on cyanobacterial bloom development in the Gulf of Finland (Baltic Sea). Harmful Algae 2, 29–41. doi: 10.1016/S1568-9883(02)00085-9
Karjalainen, M., Engström-Öst, J., Korpinen, S., Peltonen, H., Pääkkönen, J. P., Rönkkönen, S., et al. (2007). Ecosystem consequences of cyanobacteria in the northern Baltic Sea. Ambio 36, 195–202.
Klawonn, I., Nahar, N., Walve, J., Andersson, B., Olofsson, M., Svedén, J. B., et al. (2016). Cell-specific nitrogen-and carbon-fixation of cyanobacteria in a temperate marine system (Baltic Sea). Environ. Microbiol. 18, 4596–4609. doi: 10.1111/1462-2920.13557
Laakso, L., Mikkonen, S., Drebs, A., Karjalainen, A., Pirinen, P., and Alenius, P. (2018). 100 years of atmospheric and marine observations at the Finnish Utö Island in the Baltic Sea. Ocean Sci. 14, 617–632. doi: 10.5194/os-14-617-2018
Laney, S. R., and Sosik, H. M. (2014). Phytoplankton assemblage structure in and around a massive under-ice bloom in the Chukchi Sea. Deep Sea Res. II 105, 30–41. doi: 10.1016/j.dsr2.2014.03.012
Larsson, U., Hajdu, S., Walve, J., and Elmgren, R. (2001). Baltic Sea nitrogen fixation estimated from the summer increase in upper mixed layer total nitrogen. Limnol. Oceanogr. 46, 811–820. doi: 10.4319/lo.2001.46.4.0811
Lehtimäki, J., Moisander, P., Sivonen, K., and Kononen, K. (1997). Growth, nitrogen fixation, and nodularin production by two Baltic Sea cyanobacteria. Appl. Environ. Microbiol. 63, 1647–1656.
Lips, I., and Lips, U. (2008). Abiotic factors influencing cyanobacterial bloom development in the Gulf of Finland (Baltic Sea). Hydrobiologia 614, 133–140. doi: 10.1007/s10750-008-9449-2
Lombard, F., Boss, E., Waite, A. M., Uitz, J., Stemmann, L., Sosik, H. M., et al. (2019). Globally consistent quantitative observations of planktonic ecosystems. Front. Mar. Sci. 6:196. doi: 10.3389/fmars.2019.00196
Moberg, E. A., and Sosik, H. M. (2012). Distance maps to estimate cell volume from two-dimensional plankton images. Limnol. Oceanogr. Methods 10, 278–288. doi: 10.4319/lom.2012.10.278
Mulholland, M. R., Bernhardt, P. W., Heil, C. A., Bronk, D. A., and O’Neil, J. M. (2006). Nitrogen fixation and release of fixed nitrogen by Trichodesmium spp. in the Gulf of Mexico. Limnol. Oceanogr. 51, 1762–1776. doi: 10.4319/lo.2006.51.4.1762
Niemistö, L., Rinne, I., Melvasalo, T., and Niemi, Å. (1989). Blue-green algae and their nitrogen fixation in the Baltic Sea in 1980, 1982 and 1984. Meri 17, 3–59.
Olenina, I., Hajdu, S., Edler, L., Andersson, A., Wasmund, N., Busch, S., et al. (2006). Biovolumes and size-classes of phytoplankton in the Baltic Sea. HELCOM. Balt. Sea Environ. Proc. 106, 1–144. Annually updated appendix available online at: http://ices.dk/data/Documents/ENV/PEG_BVOL.zip
Olli, K., and Seppälä, J. (2001). Vertical niche separation of phytoplankton: large-scale mesocosm experiments. Mar. Ecol. Prog. Ser. 217, 219–233. doi: 10.3354/meps217219
Olofsson, M., Suikkanen, S., Kobos, J., Wasmund, N., and Karlson, B. (2020). Basin-specific changes in filamentous cyanobacteria community composition across four decades in the Baltic Sea. Harmful Algae 91:101685. doi: 10.1016/j.hal.2019.101685
Olson, R. J., and Sosik, H. M. (2007). A submersible imaging-in-flow instrument to analyze nano-and microplankton: Imaging FlowCytobot. Limnol. Oceanogr. Methods 5, 195–203. doi: 10.4319/lom.2007.5.195
O’Neil, J. M., Davis, T. W., Burford, M. A., and Gobler, C. J. (2012). The rise of harmful cyanobacteria blooms: the potential roles of eutrophication and climate change. Harmful Algae 14, 313–334. doi: 10.1016/j.hal.2011.10.027
Peacock, E. E., Olson, R. J., and Sosik, H. M. (2014). Parasitic infection of the diatom Guinardia delicatula, a recurrent and ecologically important phenomenon on the New England Shelf. Mar. Ecol. Prog. Ser. 503, 1–10. doi: 10.3354/meps10784
Puillat, I., Farcy, P., Durand, D., Karlson, B., Petihakis, G., Seppälä, J., et al. (2016). Progress in marine science supported by European joint coastal observation systems: The JERICO-RI research infrastructure. J. Mar. Syst. 162, 1–3. doi: 10.1016/j.jmarsys.2016.06.004
R Core Team. (2019). R: A Language and Environment for Statistical Computing. Vienna: R Foundation for Statistical Computing.
Sellner, K. G. (1997). Physiology, ecology, and toxic properties of marine cyanobacteria blooms. Limnol. Oceanogr. 42, 1089–1104. doi: 10.4319/lo.1997.42.5_part_2.1089
Seppälä, J., Ylöstalo, P., Kaitala, S., Hällfors, S., Raateoja, M., and Maunula, P. (2007). Ship-of-opportunity based phycocyanin fluorescence monitoring of the filamentous cyanobacteria bloom dynamics in the Baltic Sea. Estuar. Coast. Shelf. Sci. 73, 489–500. doi: 10.1016/j.ecss.2007.02.015
Sivonen, K., Kononen, K., Carmichael, W. W., Dahlem, A. M., Rinehart, K. L., Kiviranta, J., et al. (1989). Occurrence of the hepatotoxic cyanobacterium Nodularia spumigena in the Baltic Sea and structure of the toxin. Appl. Environ. Microbiol. 55, 1990–1995.
Sopanen, S., Uronen, P., Kuuppo, P., Svensen, C., Rühl, A., Tamminen, T., et al. (2009). Transfer of nodularin to the copepod Eurytemora affinis through the microbial food web. Aquat. Microb. Ecol. 55, 115–130. doi: 10.3354/ame01289
Sosik, H. M., and Olson, R. J. (2007). Automated taxonomic classification of phytoplankton sampled with imaging-in-flow cytometry. Limnol. Oceanogr. Methods 5, 204–216. doi: 10.4319/lom.2007.5.204
Stal, L. J., Albertano, P., Bergman, B., von Bröckel, K., Gallon, J. R., Hayes, P. K., et al. (2003). BASIC: Baltic Sea cyanobacteria. An investigation of the structure and dynamics of water blooms of cyanobacteria in the Baltic Sea—responses to a changing environment. Cont. Shelf Res. 23, 1695–1714. doi: 10.1016/j.csr.2003.06.001
Suikkanen, S., Laamanen, M., and Huttunen, M. (2007). Long-term changes in summer phytoplankton communities of the open northern Baltic Sea. Estuar. Coast. Shelf. Sci. 71, 580–592. doi: 10.1016/j.ecss.2006.09.004
Suikkanen, S., Pulina, S., Engström-Öst, J., Lehtiniemi, M., Lehtinen, S., and Brutemark, A. (2013). Climate change and eutrophication induced shifts in northern summer plankton communities. PLoS One 8:e66475. doi: 10.1371/journal.pone.0066475
Toming, K., and Jaanus, A. (2007). Selecting potential summer phytoplankton eutrophication indicator species for the northern Baltic Sea. Proc. Estonian Acad. Sci. Biol. Ecol. 56, 297–311.
Utermöhl, H. (1958). Methods of collecting plankton for various purposes are discussed. SIL Commun. 9, 1–38. doi: 10.1080/05384680.1958.11904091
Vahtera, E., Conley, D. J., Gustafsson, B. G., Kuosa, H., Pitkänen, H., Savchuk, O. P., et al. (2007). Internal ecosystem feedbacks enhance nitrogen-fixing cyanobacteria blooms and complicate management in the Baltic Sea. Ambio 36, 186–194. doi: 10.2307/4315813
Wacklin, P., Hoffmann, L., and Komárek, J. (2009). Nomenclatural validation of the genetically revised cyanobacterial genus Dolichospermum (Ralfs ex Bornet et Flahault) comb. nova. Fottea 9, 59–64.
Wasmund, N. (1997). Occurrence of cyanobacterial blooms in the Baltic Sea in relation to environmental conditions. Int. Revue Ges. Hydrobiol. Hydrogr. 82, 169–184. doi: 10.1002/iroh.19970820205
Wells, M. L., Karlson, B., Wulff, A., Kudela, R., Trick, C., Asnaghi, V., et al. (2020). Future HAB science: directions and challenges in a changing climate. Harmful Algae 91:101632. doi: 10.1016/j.hal.2019.101632
Westberry, T. K., and Siegel, D. A. (2006). Spatial and temporal distribution of Trichodesmium blooms in the world’s oceans. Glob. Biogeochem. Cycles 20:GB4016. doi: 10.1029/2005GB002673
Wilson, S. T., Hawco, N. J., Armbrust, E. V., Barone, B., Björkman, K. M., Boysen, A. K., et al. (2019). Kîlauea lava fuels phytoplankton bloom in the North Pacific Ocean. Science 365, 1040–1044. doi: 10.1126/science.aax4767
Keywords: IFCB, Imaging FlowCytobot, high-frequency observations, cyanobacteria, cyanophyte, bloom dynamics, Baltic Sea, imaging-in-flow cytometry
Citation: Kraft K, Seppälä J, Hällfors H, Suikkanen S, Ylöstalo P, Anglès S, Kielosto S, Kuosa H, Laakso L, Honkanen M, Lehtinen S, Oja J and Tamminen T (2021) First Application of IFCB High-Frequency Imaging-in-Flow Cytometry to Investigate Bloom-Forming Filamentous Cyanobacteria in the Baltic Sea. Front. Mar. Sci. 8:594144. doi: 10.3389/fmars.2021.594144
Received: 12 August 2020; Accepted: 04 March 2021;
Published: 25 March 2021.
Edited by:
Hervé Claustre, Centre National de la Recherche Scientifique (CNRS), FranceReviewed by:
Gerald J. Gregori, UMR 7294 Institut Méditerranéen d’océanographie (MIO), FranceRoberta Congestri, University of Rome Tor Vergata, Italy
Copyright © 2021 Kraft, Seppälä, Hällfors, Suikkanen, Ylöstalo, Anglès, Kielosto, Kuosa, Laakso, Honkanen, Lehtinen, Oja and Tamminen. This is an open-access article distributed under the terms of the Creative Commons Attribution License (CC BY). The use, distribution or reproduction in other forums is permitted, provided the original author(s) and the copyright owner(s) are credited and that the original publication in this journal is cited, in accordance with accepted academic practice. No use, distribution or reproduction is permitted which does not comply with these terms.
*Correspondence: Kaisa Kraft, a2Fpc2Eua3JhZnRAc3lrZS5maQ==
†Present address: Sílvia Anglès, Advanced Science Research Center at the Graduate Center, City University of New York, New York, NY, United States