 Catherine Jordan1,2*
 Caroline Cusack2
 Michelle C. Tomlinson3
 Andrew Meredith4
 Ryan McGeady2,5
 Rafael Salas2
 Clynton Gregory1
 Peter L. Croot1
- 1Earth and Ocean Sciences, School of Natural Sciences and Ryan Institute, National University of Ireland Galway, Galway, Ireland
- 2Marine Institute, Galway, Ireland
- 3National Centers for Coastal Ocean Science (NCCOS, NOAA), Silver Spring, MD, United States
- 4Consolidated Safety Services Inc., Fairfax, VA, United States
- 5Zoology, School of Natural Sciences and Ryan Institute, National University of Ireland Galway, Galway, Ireland
During the months of May, June, July and August 2019 the Red Band Difference algorithm was tested over Irish waters to assess its suitability for the Irish harmful algal bloom alert system. Over the 4 weeks of June an extensive localised surface phytoplankton bloom formed in the Celtic Sea, south of Ireland. Satellite imagery from the Sentinel-3a’s Ocean and Land Colour Instrument, processed using the Red Band Difference algorithm detected the bloom in surface shelf waters and helped monitor its movement. Daily satellite images indicated that the bloom appeared at the sea surface on the 2nd June 2019 and peaked in size and surface abundance in offshore shelf waters within 4 weeks, remnants remained at the surface into July. A particle tracking approach was used to replicate oceanic circulation patterns in the vicinity of the observed algal bloom and estimate its trajectory. The initial horizontal distribution of particles in the tracking model were based on a satellite imagery polygon of the bloom when it first appeared in surface waters. Good agreement was observed between satellite imagery of the bloom and the particle tracking model. In situ sampling efforts from a research cruise and the national inshore phytoplankton monitoring programme confirmed that Karenia mikimotoi was the causative organism of the bloom. This pilot study shows great potential to use the Red Band Difference algorithm in the existing Irish harmful algal bloom alert system. In addition, satellite ocean colour data combined with particle tracking model estimates can be a useful tool to monitor high biomass harmful algal bloom forming species, such as Karenia mikimotoi, in surface coastal waters around Ireland and elsewhere.
Introduction
Aquaculture is extremely important for providing food, nutrition and employment around the world. According to the FAO (2020), aquaculture production reached a record high in 2018. There has been a 527% increase in global aquaculture production from 1990 to 2018. Due to wild fish stocks declining and the population increasing globally, the role of aquaculture in society is more important than ever (FAO, 2020). Aquaculture is a highly valuable industry to the Irish economy. Production in Ireland had a net gain from under €100 million in 2009 to €180 million in 2018 with aquaculture outputs between 30,000 and 50,000 tonnes mainly from salmon and bivalve farming (Dennis and Jackson, 2019). The success of aquaculture is influenced by a range of conditions, both environmental and biological such as temperature, salinity, oxygen and food availability to name a few (Mydlarz et al., 2006). Harmful Algae Blooms (HABs) are a concern for both finfish and bivalve aquaculture (Callaway et al., 2012). In most cases, the proliferation of microscopic algae is beneficial to the overall ecosystem, e.g., as a source of food for wild fisheries and aquaculture (Tweddle et al., 2018). However, a small minority of algal bloom forming species have negative impacts on their surrounding environment. HABs, caused by either small or large biomass blooms, and depending on the species, can result in serious economic losses to marine sectors such as tourism, aquaculture and fisheries with additional, often unquantifiable, impacts on ocean health (Anderson et al., 2015).
In order to mitigate against and prepare for the impacts of HABs, it is essential to detect, monitor, track and forecast their development and movement in real time (Stumpf and Tomlinson, 2005). Collecting samples in the field alone has limitations as the samples or measurements are collected at discrete points and times, and while this method generally offers high quality data from a specific point in time, temporal and spatial limitations are a challenge. Combining different observational methods can greatly help managers detect and monitor HAB hazards. For example, satellite remote sensing techniques are powerful tools to detect and monitor the movement of surface phytoplankton blooms due to the vast area covered in one single swath measurement (Stumpf and Tomlinson, 2005. Emerging remote sensing techniques for Europe should positively impact the aquaculture industry. Ocean colour sensors and the algorithms designed to detect phytoplankton blooms or HABs have been continually improving since the launch of the first ocean colour sensor, the Coastal Zone Colour Scanner in 1978 and the most recent launch of ESA Sentinel 3B OLCI in 2018 (Groom et al., 2019). Satellite technology has proven very useful in mapping the geographical extent of blooms and movement (Miller et al., 2006; Stumpf et al., 2009). To determine the concentration of chlorophyll-a (Chl-a) or other optically active constituents such as coloured dissolved organic matter (CDOM) or suspended particulate matter (SPM), different types of algorithms have been developed by measuring the water leaving radiance, or reflectance (Groom et al., 2019). The use of satellite technology focussed on Chl-a and sea surface temperature (SST) combined with field sampling can support early warning systems for certain HAB types.
Standard ocean colour algorithms that estimate chlorophyll concentration or HABs from satellite sensors use the blue and green spectral bands of the visible spectrum to monitor the colour of the ocean. These algorithms are very useful, especially in open ocean water, which are classified as Case 1 waters. The algorithms are not as accurate in the more complex Case 2 waters, situated close to the coast and inland. The two water types were originally introduced by Morel and Prieur (1977). These descriptions have since been refined (Gordon and Morel, 1983; Morel, 1988; IOCCG, 2000; Mobley et al., 2004). Mobley et al. (2004) describe case 1 waters whose inherent optical properties (IOPs) are dominated by phytoplankton. Case 2 waters generally contain higher concentrations of CDOM, SPM, and inorganic particles in addition to phytoplankton. In Case 2 waters, as the band selection used for the standard algorithms is highly influenced by non-living suspensions, CDOM and sediment and can be misinterpreted as chlorophyll concentration.
Standard algorithms that use the blue green ratio are very important and valid methods of retrieving chlorophyll concentrations. Due to the problems with CDOM and sediment interference it is also useful to have an algorithm measuring chlorophyll fluorescence using the red bands. Chlorophyll fluorescence can be defined by red light re-emitted by chlorophyll molecules when excited by light (Zeng and Li, 2015). Chlorophyll fluorescence in the red band of the visible spectrum has proven successful to monitor HABs in coastal areas of the United States. A good example is the Gulf of Mexico where ocean colour is used to detect Karenia brevis blooms (Amin et al., 2009). As described by Amin et al. (2009) the Red Band Difference (RBD) relative fluorescence algorithm is less sensitive to CDOM, SPM, and atmospheric corrections and useful in coastal waters. Vandersea et al. (2020) describe how the RBD algorithm is also suitable for Karenia mikimotoi blooms and demonstrates how it was applied to monitor a 2013 bloom in Kachemak Bay, Alaska alongside field sampling and lab techniques. The RBD algorithm is also used off the east coast of the United States and can detect several HAB dinoflagellates of interest in Chesapeake Bay, the largest estuary in the United States and a location with very turbid waters. Scattering by sediments may interfere with algorithms in environments like this (Wolny et al., 2020). The benefits of using the RBD algorithm in a turbid environment is that the algorithm is less sensitive to interference by non-algal pigments as it was designed to detect Chl-a fluorescence in the HAB blooming species K. brevis without interference from sediment, the algorithm is designed to return positive values in waters where blooms occur and negative values in high scattering waters (Amin et al., 2009). This is currently used as a HAB monitoring tool for coastal managers who support aquaculture in Chesapeake Bay for a range of dinoflagellate blooms (Wolny et al., 2020). There are currently no studies using this RBD algorithm in Irish waters.
While K. brevis blooms were never recorded in Irish waters, K. mikimotoi blooms frequently occur in Irish waters (Ottway et al., 1979; Silke et al., 2005) and have been recorded historically and in recent years, reviewed recently by Li et al. (2019). Gentien (1998) describes K. mikimotoi as a common “red tide” or large bloom forming dinoflagellates in shelf waters of the northeast Atlantic. Previously referred to as Gyrodinium aureolum, Gymnodinium cf. aureolum, Gymnodinium nagasakiense, and Gymnodinium mikimotoi in the literature K. mikimotoi blooms are commonly associated with marine fauna kills (Brand et al., 2012; Li et al., 2019). Karenia are thought to overwinter in low numbers as motile cells and when favourable biogeochemical and physical conditions arrive in early to late summer Karenia will grow and bloom (Gentien, 1998). Globally, K. mikimotoi has adapted to a wide range of temperatures ranging between 4 and 30°C but the European isolate has a narrower range of 6–20°C. The salinity ranges K. mikimotoi can survive in are also quite extensive ranging from 9 to 35 ppt, therefore suited to a range of environments (Li et al., 2019). Li et al., 2019 also describe that K. mikimotoi is known to grow well in low light environments, however, it is not photo inhibited by high light intensities, therefore capable of adapting to conditions at both the surface and at the bottom. One important feature of K. mikimotoi behaviour in the environment is that, like many dinoflagellates that are capable of vertically migrating over a diurnal cycle, beginning from depth before sunrise and reaching the surface before midday. This is known as diurnal vertical migration (DVM) (Olsson and Graneli, 1991; Koizumi et al., 1996; Park et al., 2001; Shikata et al., 2014, 2015, 2016). This phenomenon is likely why the RBD approach is so applicable to satellite detection of blooms of K. mikimotoi as the cells will be in the upper part of the water column at midday, close to the over pass time of the satellite, with a significant number of cells in the upper 2 m of the water column corresponding to the observable signal depth for red light in seawater (Doerffer, 1993).
The true toxicity of K. mikimotoi is unknown but the dinoflagellate is known to produce toxins including haemolysin (Neely and Campbell, 2006) and gymnocin A and gymnocin B (Satake et al., 2002, 2005). Karenia mikimotoi is not known to create shellfish related biotoxins, but mass mortalities of shellfish have been associated with blooms of this species. Causes of mortalities include inhibiting larval settling rates, immune functions, gut tissue damage and larval spat mortalities. The blooms may not only impact the survival rate of shellfish but also affect the developmental processes, therefore blooms can greatly impact wild and farmed shellfish (Li et al., 2019). The effects of these blooms are not limited to shellfish but also wild and farmed fish and a range of invertebrates. Karenia mikimotoi senescent blooms are known to deplete the water of oxygen levels when bacterial respiration associated with the breakdown of the bloom begins, and when macro-organisms start to decay, and biochemical oxygen demand rises. Diaz and Rosenberg (2008) observed mass mortalities of benthic organisms when the water became anoxic after a Karenia bloom. Karenia mikimotoi also secrete mucus (with high concentrations of extracellular polysaccharide) that can increase the likelihood of mortalities, for example, when fish gills become clogged (Gentien et al., 2007). Li et al. (2019) describe how even at low algal densities gill damage and mortality in both wild and cultured salmon, rainbow trout and turbot were reported, even in waters with high dissolved oxygen levels. Mortalities of a range of invertebrates, are also linked to blooms of this unarmoured dinoflagellate in European waters and evident in the literature since 1966 (Jones et al., 1982). The earliest published Irish report of a Karenia spp. bloom related to marine life mortalities off the south coast of Ireland was made by Ottway et al. (1979). Two Irish examples of exceptional Karenia spp. blooms include the months of May, June, and July of 2005 (Silke et al., 2005) and more recently, a K. mikimotoi bloom in the summer (May to September) of 2012 (O’Boyle et al., 2016). In July 2012, Karenia spp. were at high concentrations, greater than one million cells per litre, in the surface waters at the Malin shelf off northwest Ireland suggesting a potential offshore origin for these blooms (Bresnan et al., 2013).
Ireland has a weekly HAB bulletin, published to assist aquaculture business managers, helping them make practical decisions to mitigate against potential HAB impacts. The bulletin contains several data products based on historical and recent biotoxin and phytoplankton profiles, satellite and oceanographic in situ and modelled forecasting data. Products used by local scientists help to develop HAB alerts for the days ahead. In this paper, we show the potential of introducing a new bio-optical chlorophyll fluorescence algorithm to the Irish HAB monitoring system, which is currently being used successfully in the United States, to detect K. brevis and several other HAB species and asses the suitability of the RBD algorithm to detect and monitor HABs around the Irish coast.
During the months of May, June, July and August 2019 the RBD algorithm was tested in Irish waters for the first time. During this time a phytoplankton bloom appeared in the Celtic Sea, south of Ireland.
The objectives of this pilot study were:
1. To test the RBD algorithm in Irish waters and assess its suitability for use in the Irish HAB monitoring system.
2. To determine the phytoplankton taxa responsible for the bloom by analysing the drift trajectory of the bloom by using local water circulation patterns in a particle tracking model and analysing in situ phytoplankton data from the national inshore monitoring programme and an offshore phytoplankton survey.
Materials and Methods
Study Area
Figure 1 presents the study area where the phytoplankton bloom was identified via satellite imagery, including in situ sampling locations described in section “In situ Data.” The samples were from three inshore stations: Cork Harbour, Oysterhaven and Kinsale, and from eight offshore stations from the research cruise CV19018; 138, 139, 140, 141, 142, 143, 144, and 148 as described in section “In situ Data.” Also illustrated in Figure 1 is the polygon that was created based on manual interpretation of satellite imagery from when the bloom first appeared at the surface. This polygon was used for the horizontal distribution of particles deployed in the Lagrangian Particle Tracking model as described in section “Lagrangian Particle Tracking.” The study area was in the Celtic Sea, an area of the NE Atlantic Ocean bordered by Ireland in the north, The United Kingdom in the east and the Bay of Biscay (47°N) in the south. The Celtic Sea is relatively shallow with depths ranging between 100 and 200 m and decreasing in depth near the coast as illustrated in Figure 1. Tidal circulation across the Celtic Sea is weak, water movement is primarily due to wind action (Raine, 2014). In the Celtic Sea, the water tends to stabilise in April when the seasonal thermocline becomes established. Throughout the summer months, there is a deepening of the thermocline due to continued heating of the surface layer until the Autumn when the cooling phase begins, and the water column becomes well mixed again. Within the Celtic Sea there are exceptions to this in areas of tidally mixed fronts, these are found at the boundaries between thermally stratified and tidally mixed areas such as the entrance to the Irish Sea, where the Celtic Sea Front is located and at the Ushant front, located between the southwest United Kingdom and northwest France (Raine, 2014).
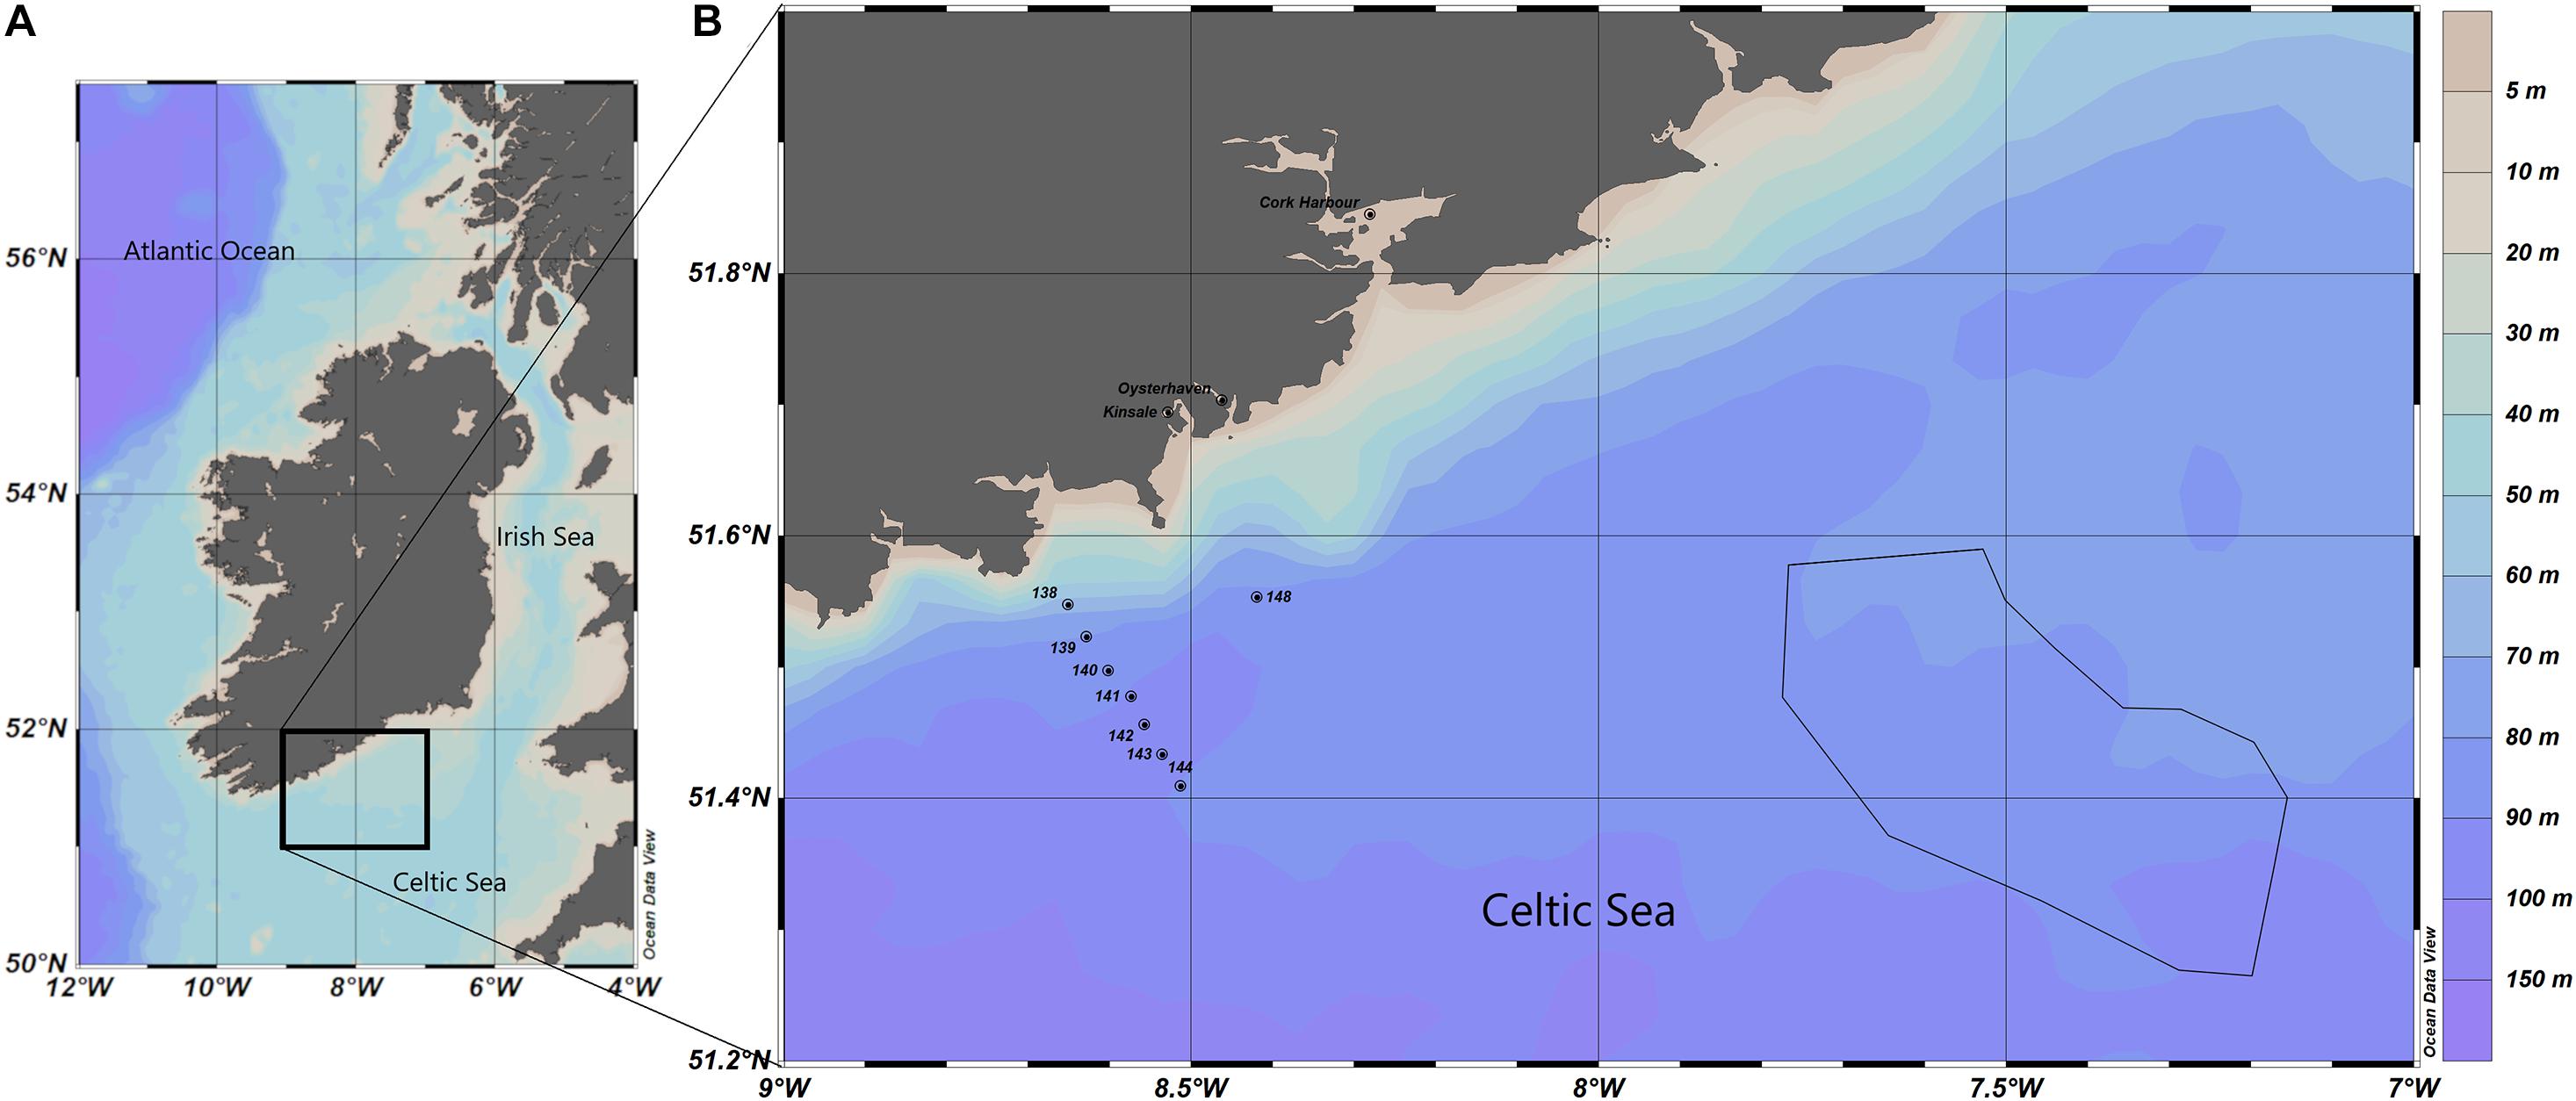
Figure 1. (A) Map of study area in the Celtic Sea. (B) In situ sample locations are noted as points and the polygon location for the particle tracking model is outlined by the black line. Bathymetry is represented in metres.
Satellite Imagery
The Red Band Difference satellite imagery was generated from the study area with geographic latitude and longitude limits of 47°N to 58°N, 2°W to 12°W. The region of interest covers all coastal waters around the island of Ireland. Satellite data from the Ocean and Land Colour Instrument (OLCI) sensor on Sentinel 3A were obtained from The European Organisation of Meteorological Satellites (EUMETSAT). The multispectral OLCI sensor has 21 spectral bands from 0.4 to 1.0 μm and has a spatial resolution of 300 m. The bands are optimised to measure ocean colour over open ocean and coastal zones. The whole field-of-view is shifted across track by 12.6° away from the sun to minimise the impact of sun glint. Once the OLCI L1B data were downloaded from EUMETSAT, the data were processed to L2 using the NOAA, National Centres for Coastal Ocean Science (NCCOS) satellite automated processing system which utilises NASA’s l2gen software included in the Sea-viewing Wide Field-of-view Sensor (SeaWiFS) Data Analysis System (SeaDAS) package (version 7.5.3). The l2gen processing produced a surface reflectance product (Rrhos) that is corrected for top-of-atmosphere solar irradiance, Rayleigh radiance and molecular absorption (Wynne et al., 2018).
The RBD algorithm used to highlight areas of high fluorescence, indicative of high algal biomass, uses only pixels within the valid Rrhos range (0–1) described by Amin et al., 2009 and modified for OLCI Rrhos bands as follows:
Due to the increase in reflectance caused by Chl-a fluorescence at 681 nm, the RBD is positive in areas of Chl-a fluorescence. The RBD data products were mapped to Universal Transverse Mercator (WGS 84) projection at 300 m horizontal resolution using a nearest neighbour interpolation. A land mask was applied, and the product saved to a GeoTiFF (an image file with georeferencing information embedded in the file as metadata) and stored in a database at NCCOS. Weekly mean composites of the daily images were created using a custom ArcGIS python toolbox, RS_Tools, that was developed specifically for working with products from the NOAA-NCCOS satellite processing system.
Satellite imagery was produced for the weekly HAB bulletin using an algorithm developed by Ifremer, known as the OC5 product. The level 4 Chl-a product is extracted from the IFREMER FTP site1. Matlab (MathWorks) is used to convert the level 4 Netcdf files to ∗.grd files. Matlab is then used to calculate chlorophyll anomalies from the 60-day median value calculated using data between current date minus 74 and current date minus 14. This anomaly data is rendered as .png files (Leadbetter et al., 2018).
Lagrangian Particle Tracking
To examine the effect of local water circulation patterns on the drift trajectory of the Karenia bloom, a particle tracking simulation was conducted using outputs from a 3D hydrodynamic numerical ocean model. The northeast Atlantic Regional Ocean Modelling System (ROMS) model encompasses a large area of the northwestern European continental shelf including Irish territorial waters (NE_Atlantic model; Dabrowski et al., 2016). This model has a horizontal resolution of 1.1 to 1.6 km in Irish coastal waters with 40 terrain-following vertical layers (Dabrowski et al., 2016). The ROMS model output data was coupled with an offline 3D Lagrangian particle tracking mass-preserving scheme called ICHTHYOP; an individual-based model (Ichthyop v3; Lett et al., 2008). This was used to simulate particle transport from the Karenia bloom location (i.e., the potential HAB surface transport pathways). Particle tracking simulations were conducted using hourly ROMS ocean current speed and direction outputs using a Runge–Kutta 4th order numerical scheme and a 5-min time step. The initial horizontal distribution of the particles, representing K. mikimotoi cells, was based on a polygon created from satellite observations of the bloom when it was first identified at the water surface as (Figure 1). In total, 50,000 particles were released with a random vertical distribution between 0 and 20 m depth in the Celtic Sea. The 50,000 particles were selected as this is the limit of detection for K. brevis (cells per litre) in the Gulf of Mexico, by legacy satellites (Tester et al., 1998). Particles were neutrally buoyant, so any movement of particles between depths was due to vertical currents. The model simulation did not include growth or grazing of the phytoplankton. In the simulation the particles were transported for a fixed duration of 27 days from 2 to 29 June 2019. Maps were generated to show the density distribution of particles on different dates to show bloom progression and to compare with satellite imagery.
In situ Data
Availability of biological data in the region where the bloom occurred according to satellite imagery was investigated to establish the predominant phytoplankton in the area at the time. Figure 1 shows the locations where phytoplankton samples were collected at the time of the bloom.
The Irish Marine Institute runs the national biotoxin and phytoplankton monitoring programme and releases a weekly HAB bulletin2. Phytoplankton abundance and composition results (freely available at http://webapps.marine.ie/HABs/Locations/Inshore) from southern stations close to where the bloom occurred were downloaded for this study. When the results of the particle tracking model confirmed the direction the bloom travelled, Cork Harbour, Oysterhaven, and Kinsale inshore stations were selected. Local officers from the Sea-Fisheries Protection Authority and other assigned personnel collect water and shellfish samples, at weekly intervals, from designated shellfish production areas. Samples are sent to the Marine Institute where the analyses are carried out. The programme carries an ISO 17025 quality accreditation. A 25 mL Lugol’s iodine fixed seawater sample is used to determine the abundances of biotoxin producing or problematic phytoplankton using the Utermöhl test method, a recognised standard method, described in detail in UNESCO, 2010, references therein. The limit of detection is 40 cells/L–1.
Coincidentally a phytoplankton field survey aboard the RV Celtic Voyager was being conducted in the Celtic Sea when the bloom was still visible via satellite imagery in July 2019. Water samples were collected at the periphery of the bloom at stations 135–144 and 148 (see Figure 1) on 10 July. A phytoplankton net vertically deployed to a maximum depth of 50 m at each station determined the predominant phytoplankton in the water column. A SeaBird 9/11 plus CTD integrated with a carousel water sampler for real-time auto-fire operations was lowered to approximately 5 m above sea floor level. Niskin water bottles were fired on the up cast at discrete depths where peaks of relative fluorescence and temperature gradients were evident on the depth profile. A fine scale sampler (FSS) was used to study the vertical thin layer distributions of dinoflagellates and to examine the correlation to the thin layer water properties. The FSS was lowered to the depth of the desired thin layer and all 15 bottles were fired simultaneously. Water samples were fixed in Lugol’s iodine and stored in sterile 50 mL Sarstedt© water sampling bottles. Phytoplankton species were identified with an inverted microscope, Olympus CKX4. Aliquots and cells counted following the Utermöhl method (UNESCO, 2010).
Results
Red Band Difference satellite imagery show a phytoplankton bloom (Figure 2), appearing in surface waters in the Celtic Sea, off southern Ireland on 2 June 2019. Weekly composites of satellite images show the bloom steadily increase in size (spatially) and magnitude (elevated surface pigment), the warmer colours on the images represent higher fluorescence which indicate higher bloom concentration in the weeks that followed (Figure 2). The images also show the extent of the bloom geographically. The surface bloom peaked in magnitude on the 27 June 2019 (Figure 2) (Daily file for 27th June 2019 in Supplementary Material). Following this, the bloom began to disperse and dissipate in early July 2019, however, remnants remained visible in the satellite imagery until late July (Figure 2).
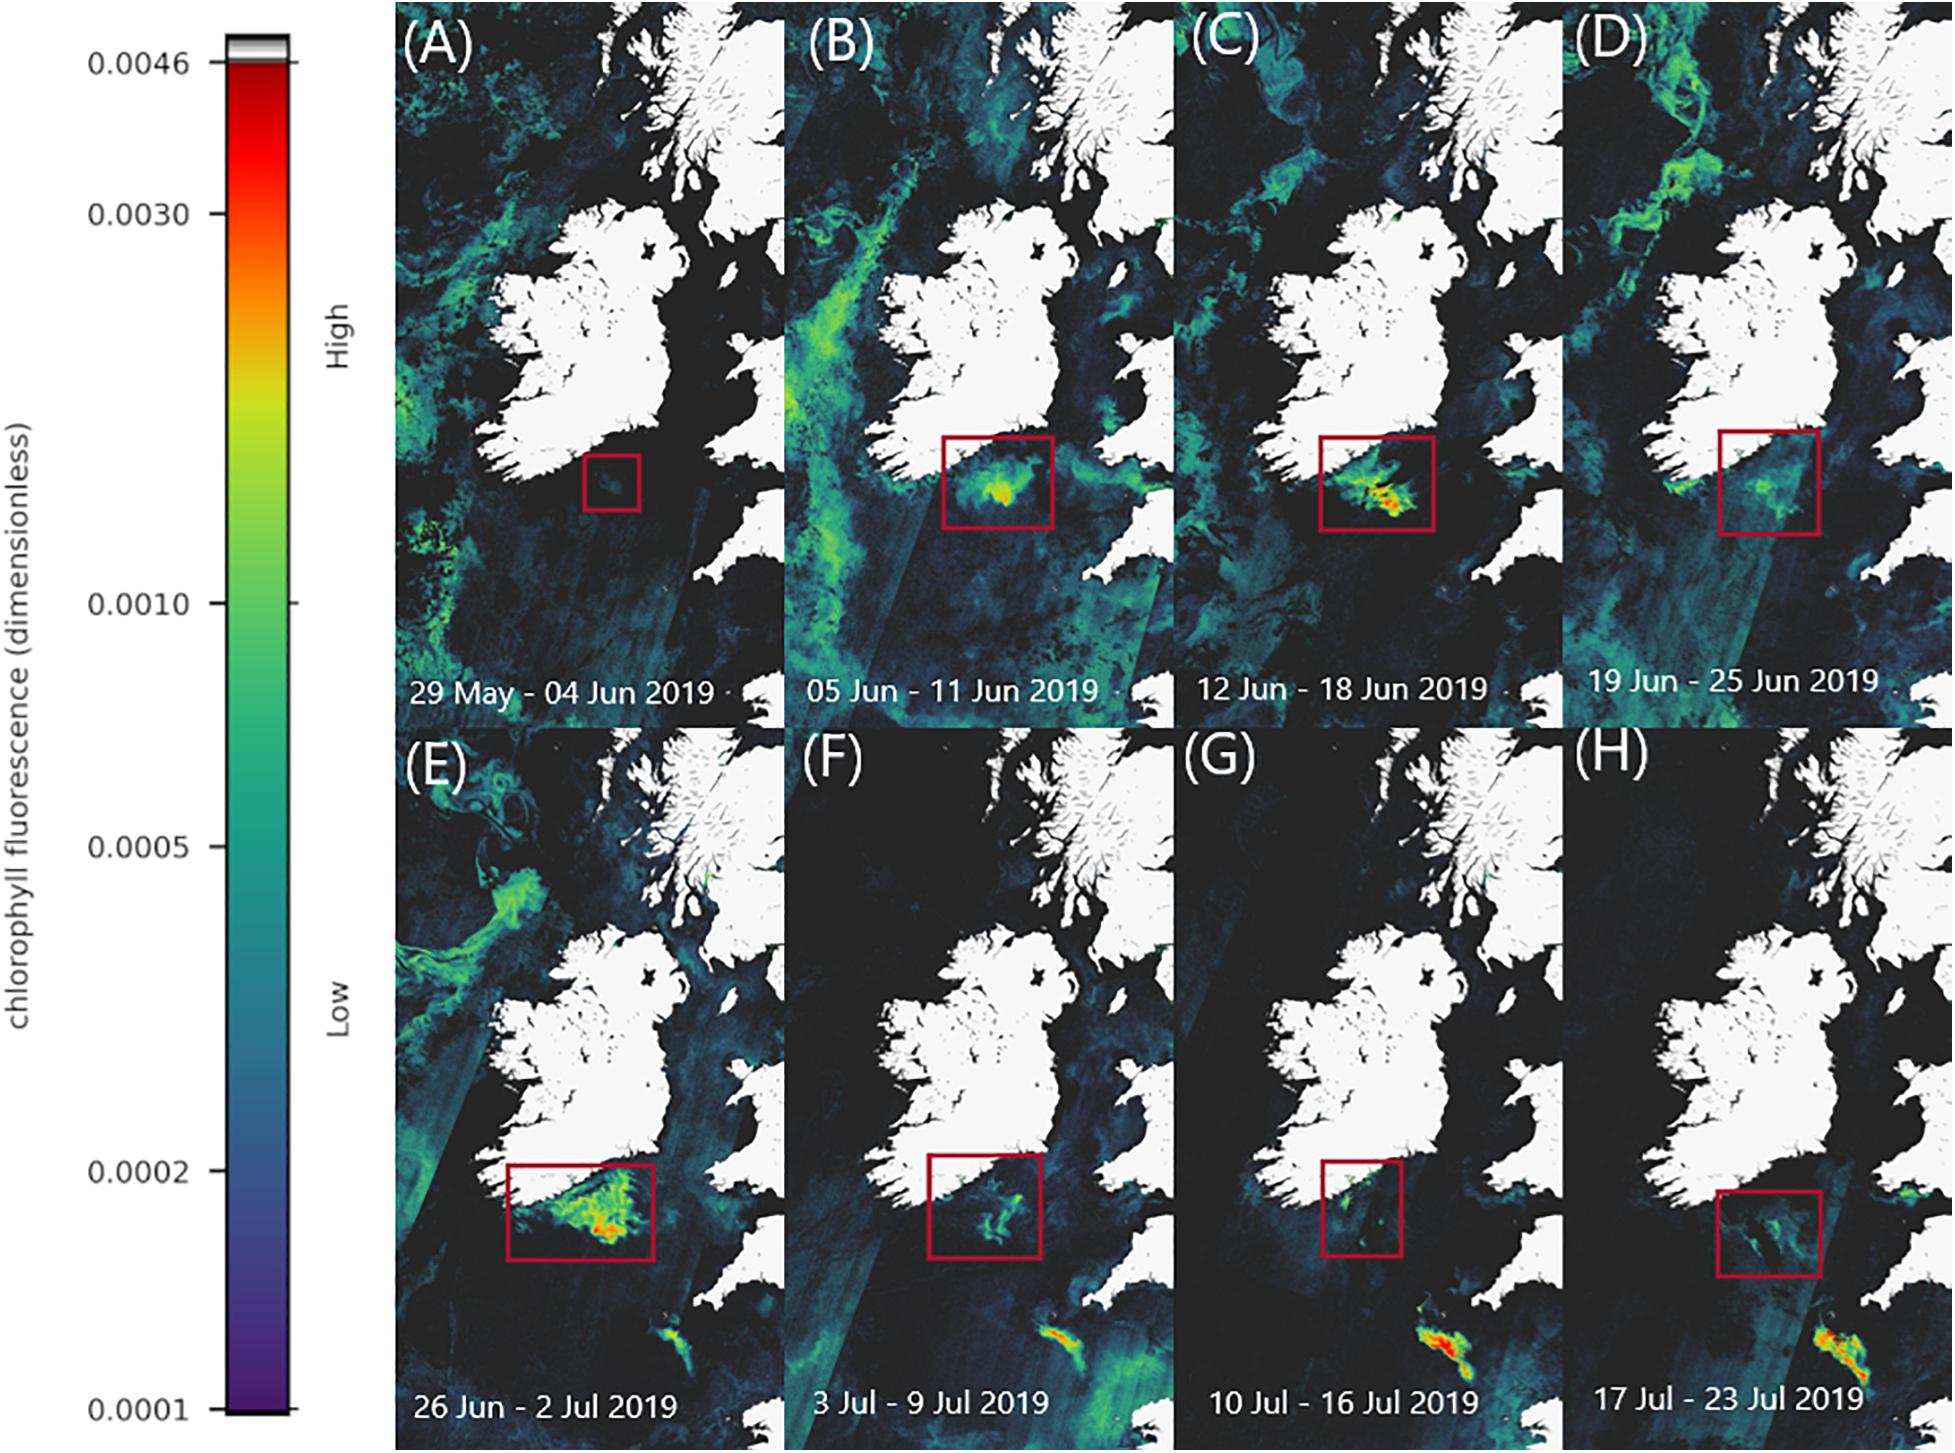
Figure 2. Sentinel-3a OLCI images with RBD algorithm displaying the phytoplankton bloom progression between 29th May 2019 and 23rd July 2019 (A–H). Colours indicate relative fluorescence, with warmer colours representing higher fluorescence indicative of higher bloom concentration.
Figure 3 displays satellite imagery from the weekly HAB bulletin, weeks 24–28 (4th June, 2019–8th July 2019) (see text footnote 2). Focussing on the study area in the Celtic Sea it is clear the increase in chlorophyll concentration at the surface was detected using both algorithms. In both Figures 2, 3B there is a noticeable rise in chlorophyll concentration in the location the bloom was detected using the RBD algorithm. There is an increase from 1 mg/m3 to 3 mg/m3 between weeks 24 and 25 in Figure 3. Chlorophyll concentration peaks in concentration between dates 23 June 2019 between and 30 June 2019 (D) and (E) using both algorithms. Comparing both Figures 2, 3 it is evident the increase in chlorophyll concentration was detected in the Celtic Sea using both algorithms, but Figure 2 displays a clearer series of images displaying the bloom’s progression and movement.
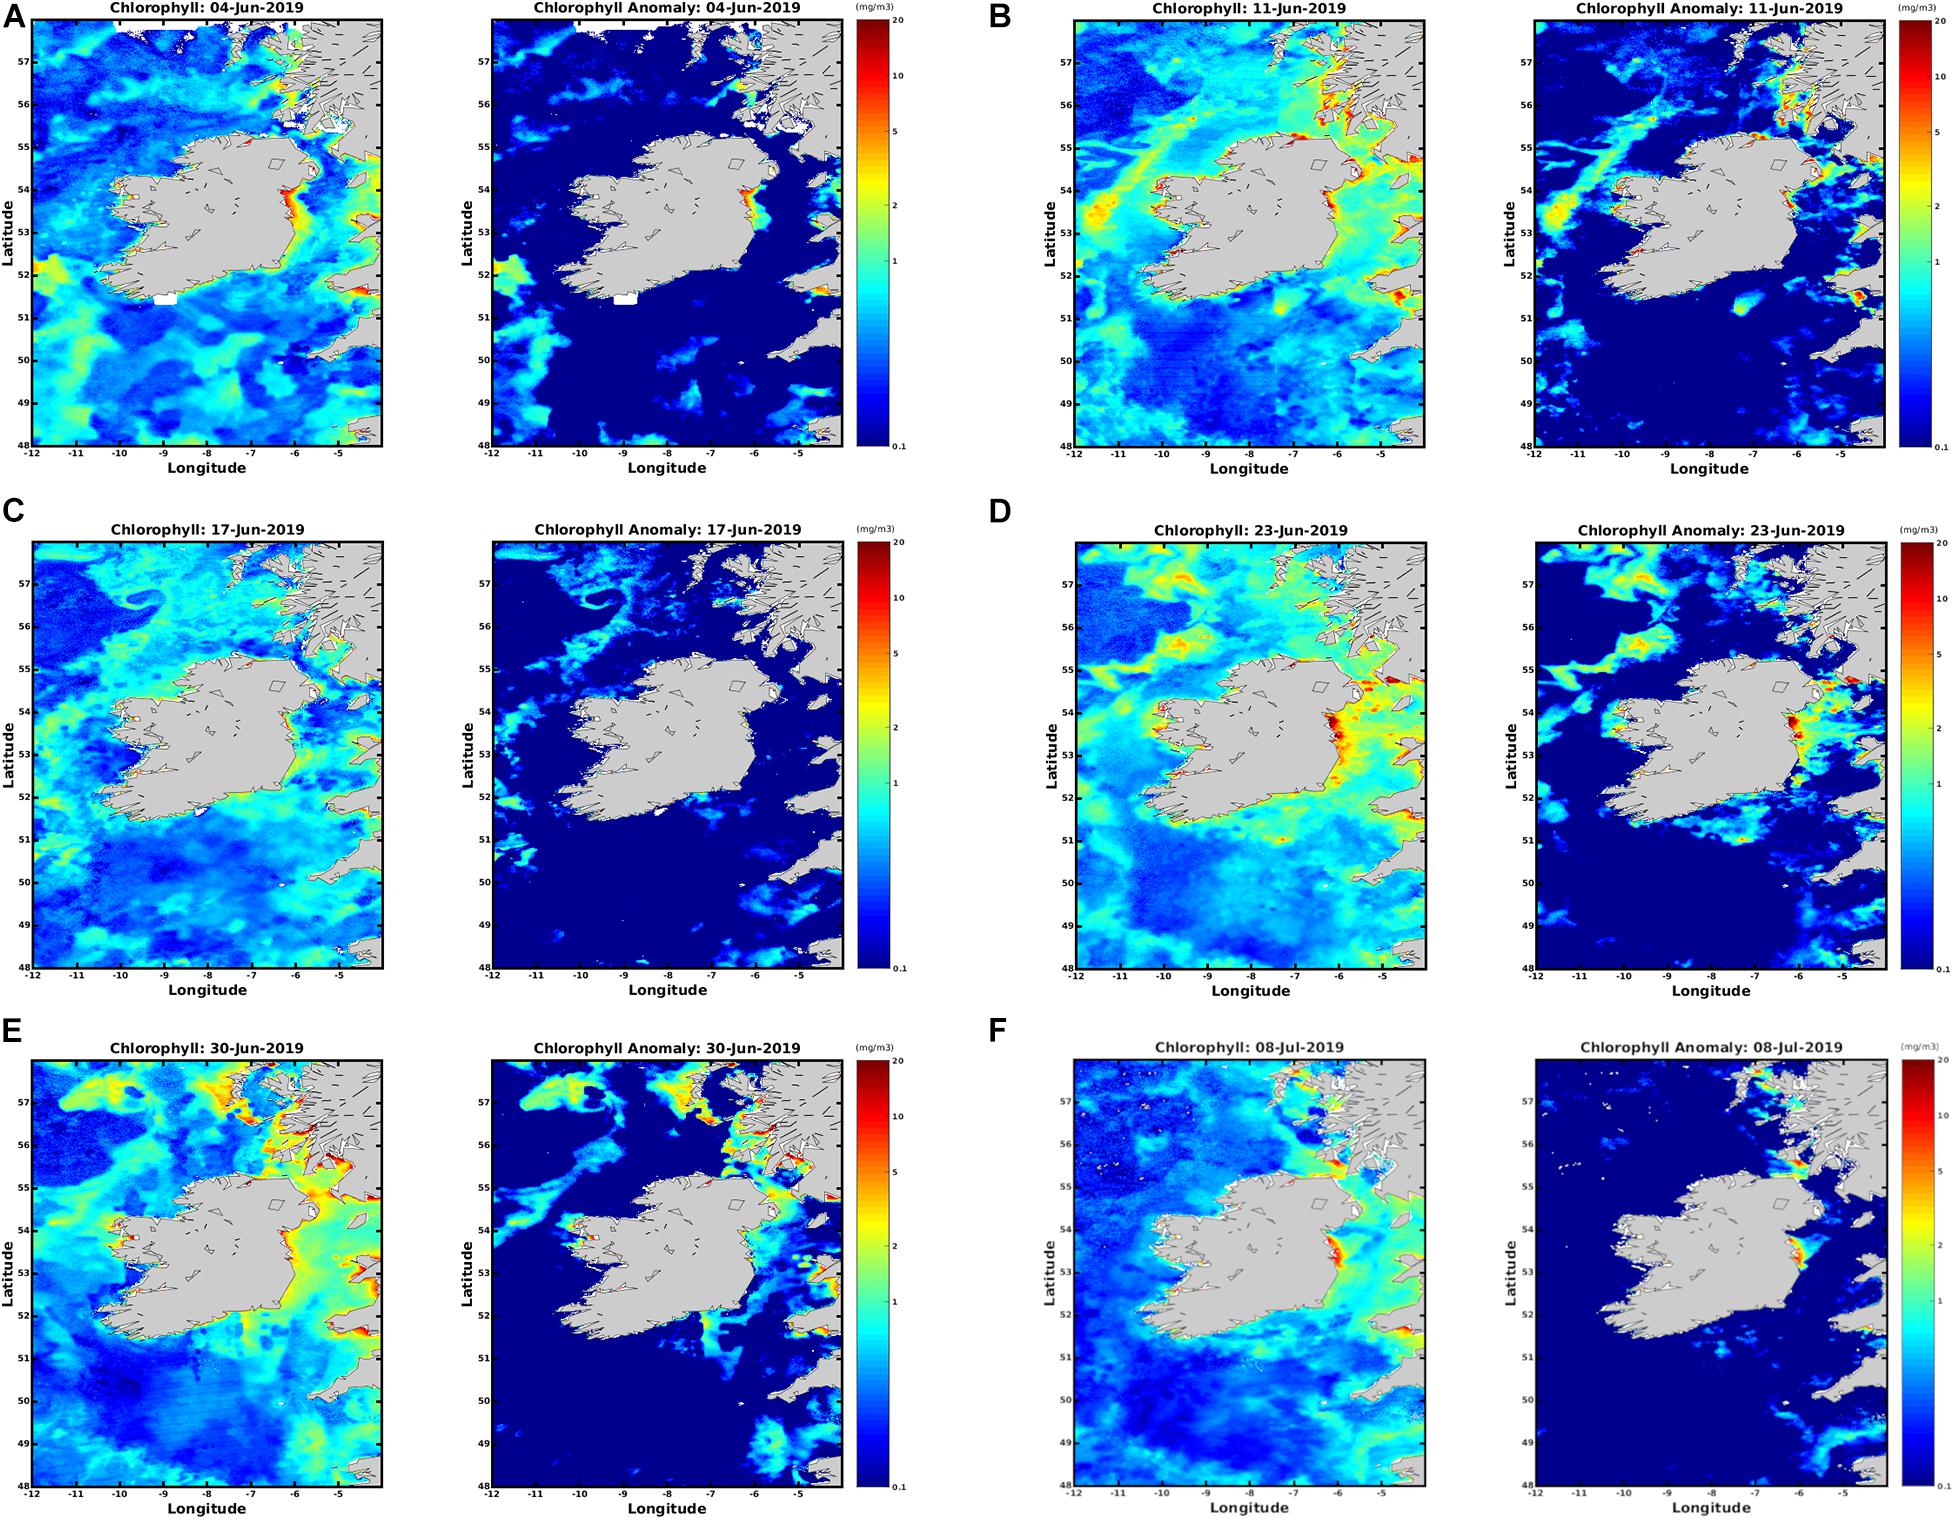
Figure 3. OC5 IFREMER Level 4 Chlorophyll a data from the HAB bulletin weeks 24–28 (A–F) 4th June 2019 to 8th July 2019.
The exact reason for the stripe artefacts in the RBD satellite imagery are not resolved at present, typically this is due to detector striping where radiometric miscalibration in the detector array elements can result in along track striping. However, it can also arise from solar glint or the “smile effect.”
Trajectories from the particle tracking simulation produced a similar pattern to that of the surface bloom in the RBD satellite images at the end of June 2019. Virtual particles that represent the bloom increase in spatial extent over the 4-week period, eventually a significant percentage of particles move toward the south coast of Ireland toward the last week of June in agreement with the Sentinel-3a OLCI RBD satellite imagery (Figure 4). Data from an inshore sampling station, in Cork Harbour confirm Karenia spp. as the predominant taxa recorded from late June to late July. The cell counts for Karenia spp. in Cork Harbour were 2,471,168 cells/L on the 30 June, 117,234 cells/L on 14 July and 257,634 cells/L on 28 July. Between June and July, Karenia spp. cell counts at three inshore coastal stations (Cork Harbour, Oysterhaven, Kinsale; see Figure 1 for locations) positioned along the south coast of Ireland, showed a dramatic cell increase after being undetected at Cork Harbour and Kinsale coastal stations prior to the bloom detection in offshore waters. Karenia spp. had been detected in very low numbers in Oysterhaven in April 2019 (8,800 cells/L) and wasn’t recorded again until the 2 June (120 cells/L). Highest cell densities of Karenia spp. occurred on different days at each coastal station (Cork Harbour, Oysterhaven and Kinsale) and in a westward direction. Cork Harbour displayed the highest Karenia spp. cell count on the 30 June (2,471,168 cells/L), Oysterhaven on the 14 July (255,432 cells/L), and Kinsale on 28 July (398,736 cells/L) (Figure 5).
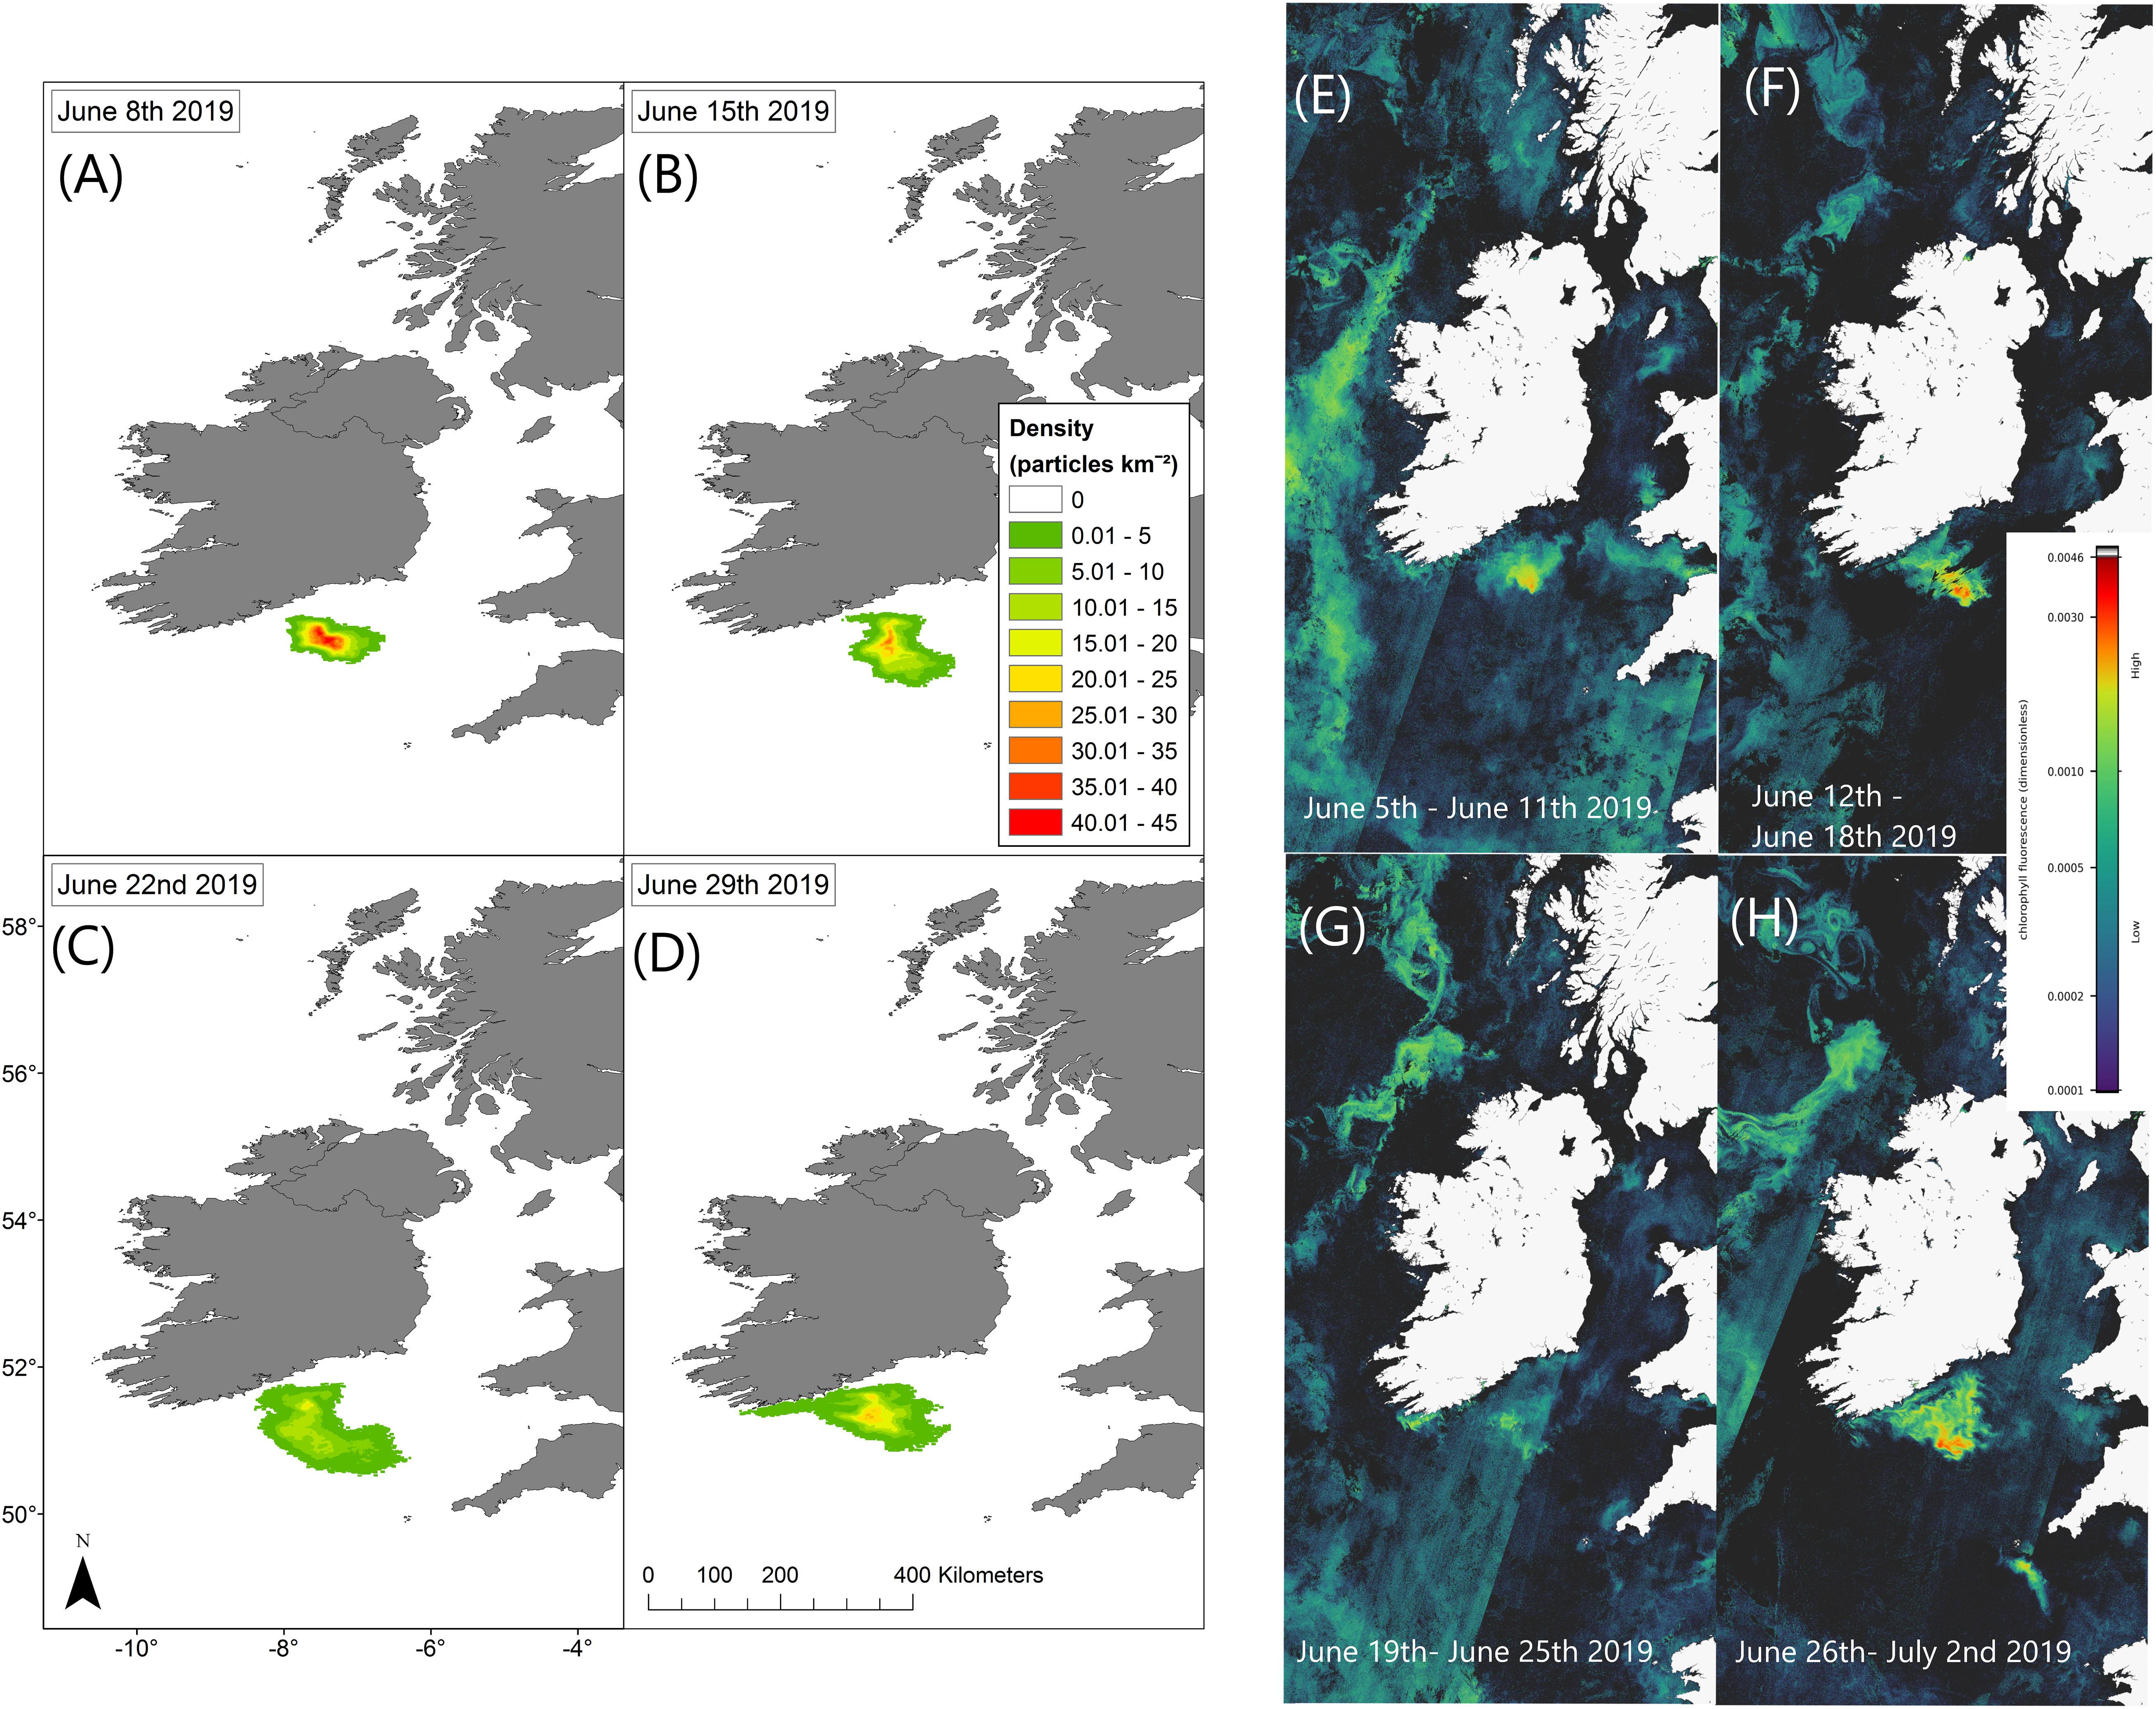
Figure 4. Particle tracking model simulation results display current driven bloom dispersal on the left (A–D). Maps show the density distribution of particles on 08/06/2019, 15/06/2019, 22/06/2019, and 29/06/2019 compared with Sentinel-3a OLCI images with RBD weekly composites on the right (E–H).
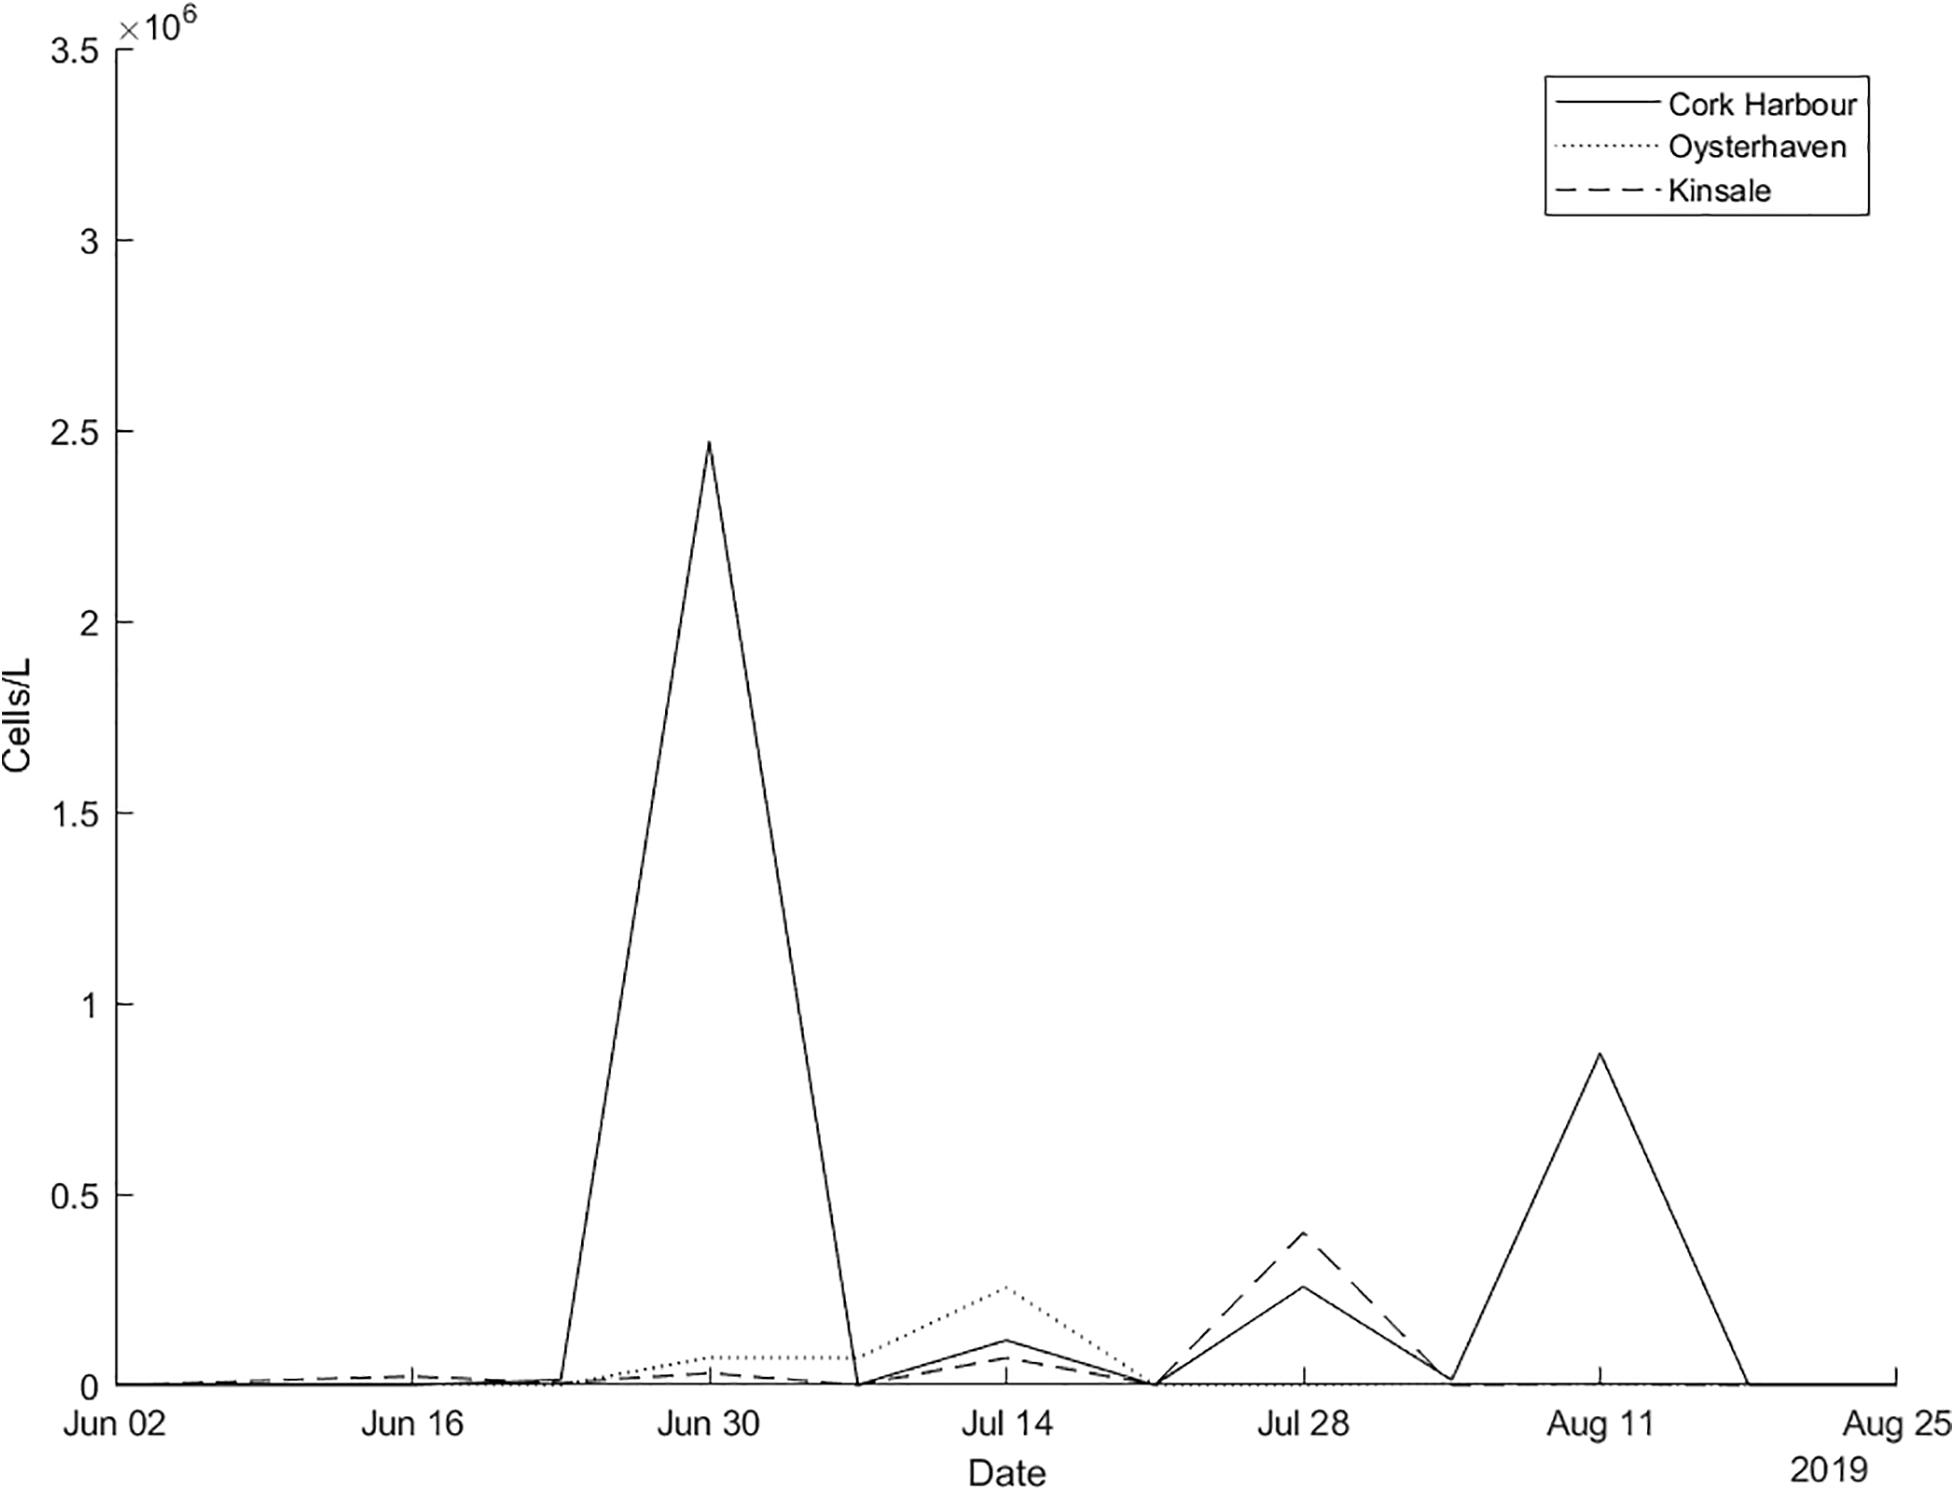
Figure 5. In situ Karenia spp. cells/L counts for inshore stations in Cork Harbour, Oysterhaven, and Kinsale from the national monitoring programme June–August 2019.
In 2019, the first inshore phytoplankton record of Karenia spp. (13,840 cells/L) in Cork Harbour was detected on 23 June. On 30 June the sharp rise in cell densities (2,471,168 cells/L) was detected, 3 days after the bloom peaked offshore. Around the same time (30 June) to the west in Oysterhaven, 80,000 cells/L were recorded in water samples. These numbers increased to 260,000 cells/L by mid-July. Further west in Kinsale cell numbers rose from approximately 71,000 cells/L on 14 July to 398,736 by the 28 July. Many other phytoplankton taxa were identified during the above dates but Karenia spp. was consistently the highest cells/L recorded in each instance (Full cell counts for the three southern stations can be viewed in Supplementary Material).
In July, phytoplankton cell counts from the research cruise CV19018, that coincided with the time of the offshore bloom confirmed the predominant taxa observed was K. mikimotoi. The satellite imagery showed that stations ST134-144 were on the outer edge of the bloom and that station at ST148 was located in a high-density area of the bloom (Figure 6), the values in this graphic represent values closest to the surface. K. mikimotoi values of 1,710,000 cells/L at station 148 were recorded at deeper depths but may not have been visible to satellite at that time due to the time the samples were taken and the behaviour of the phytoplankton.
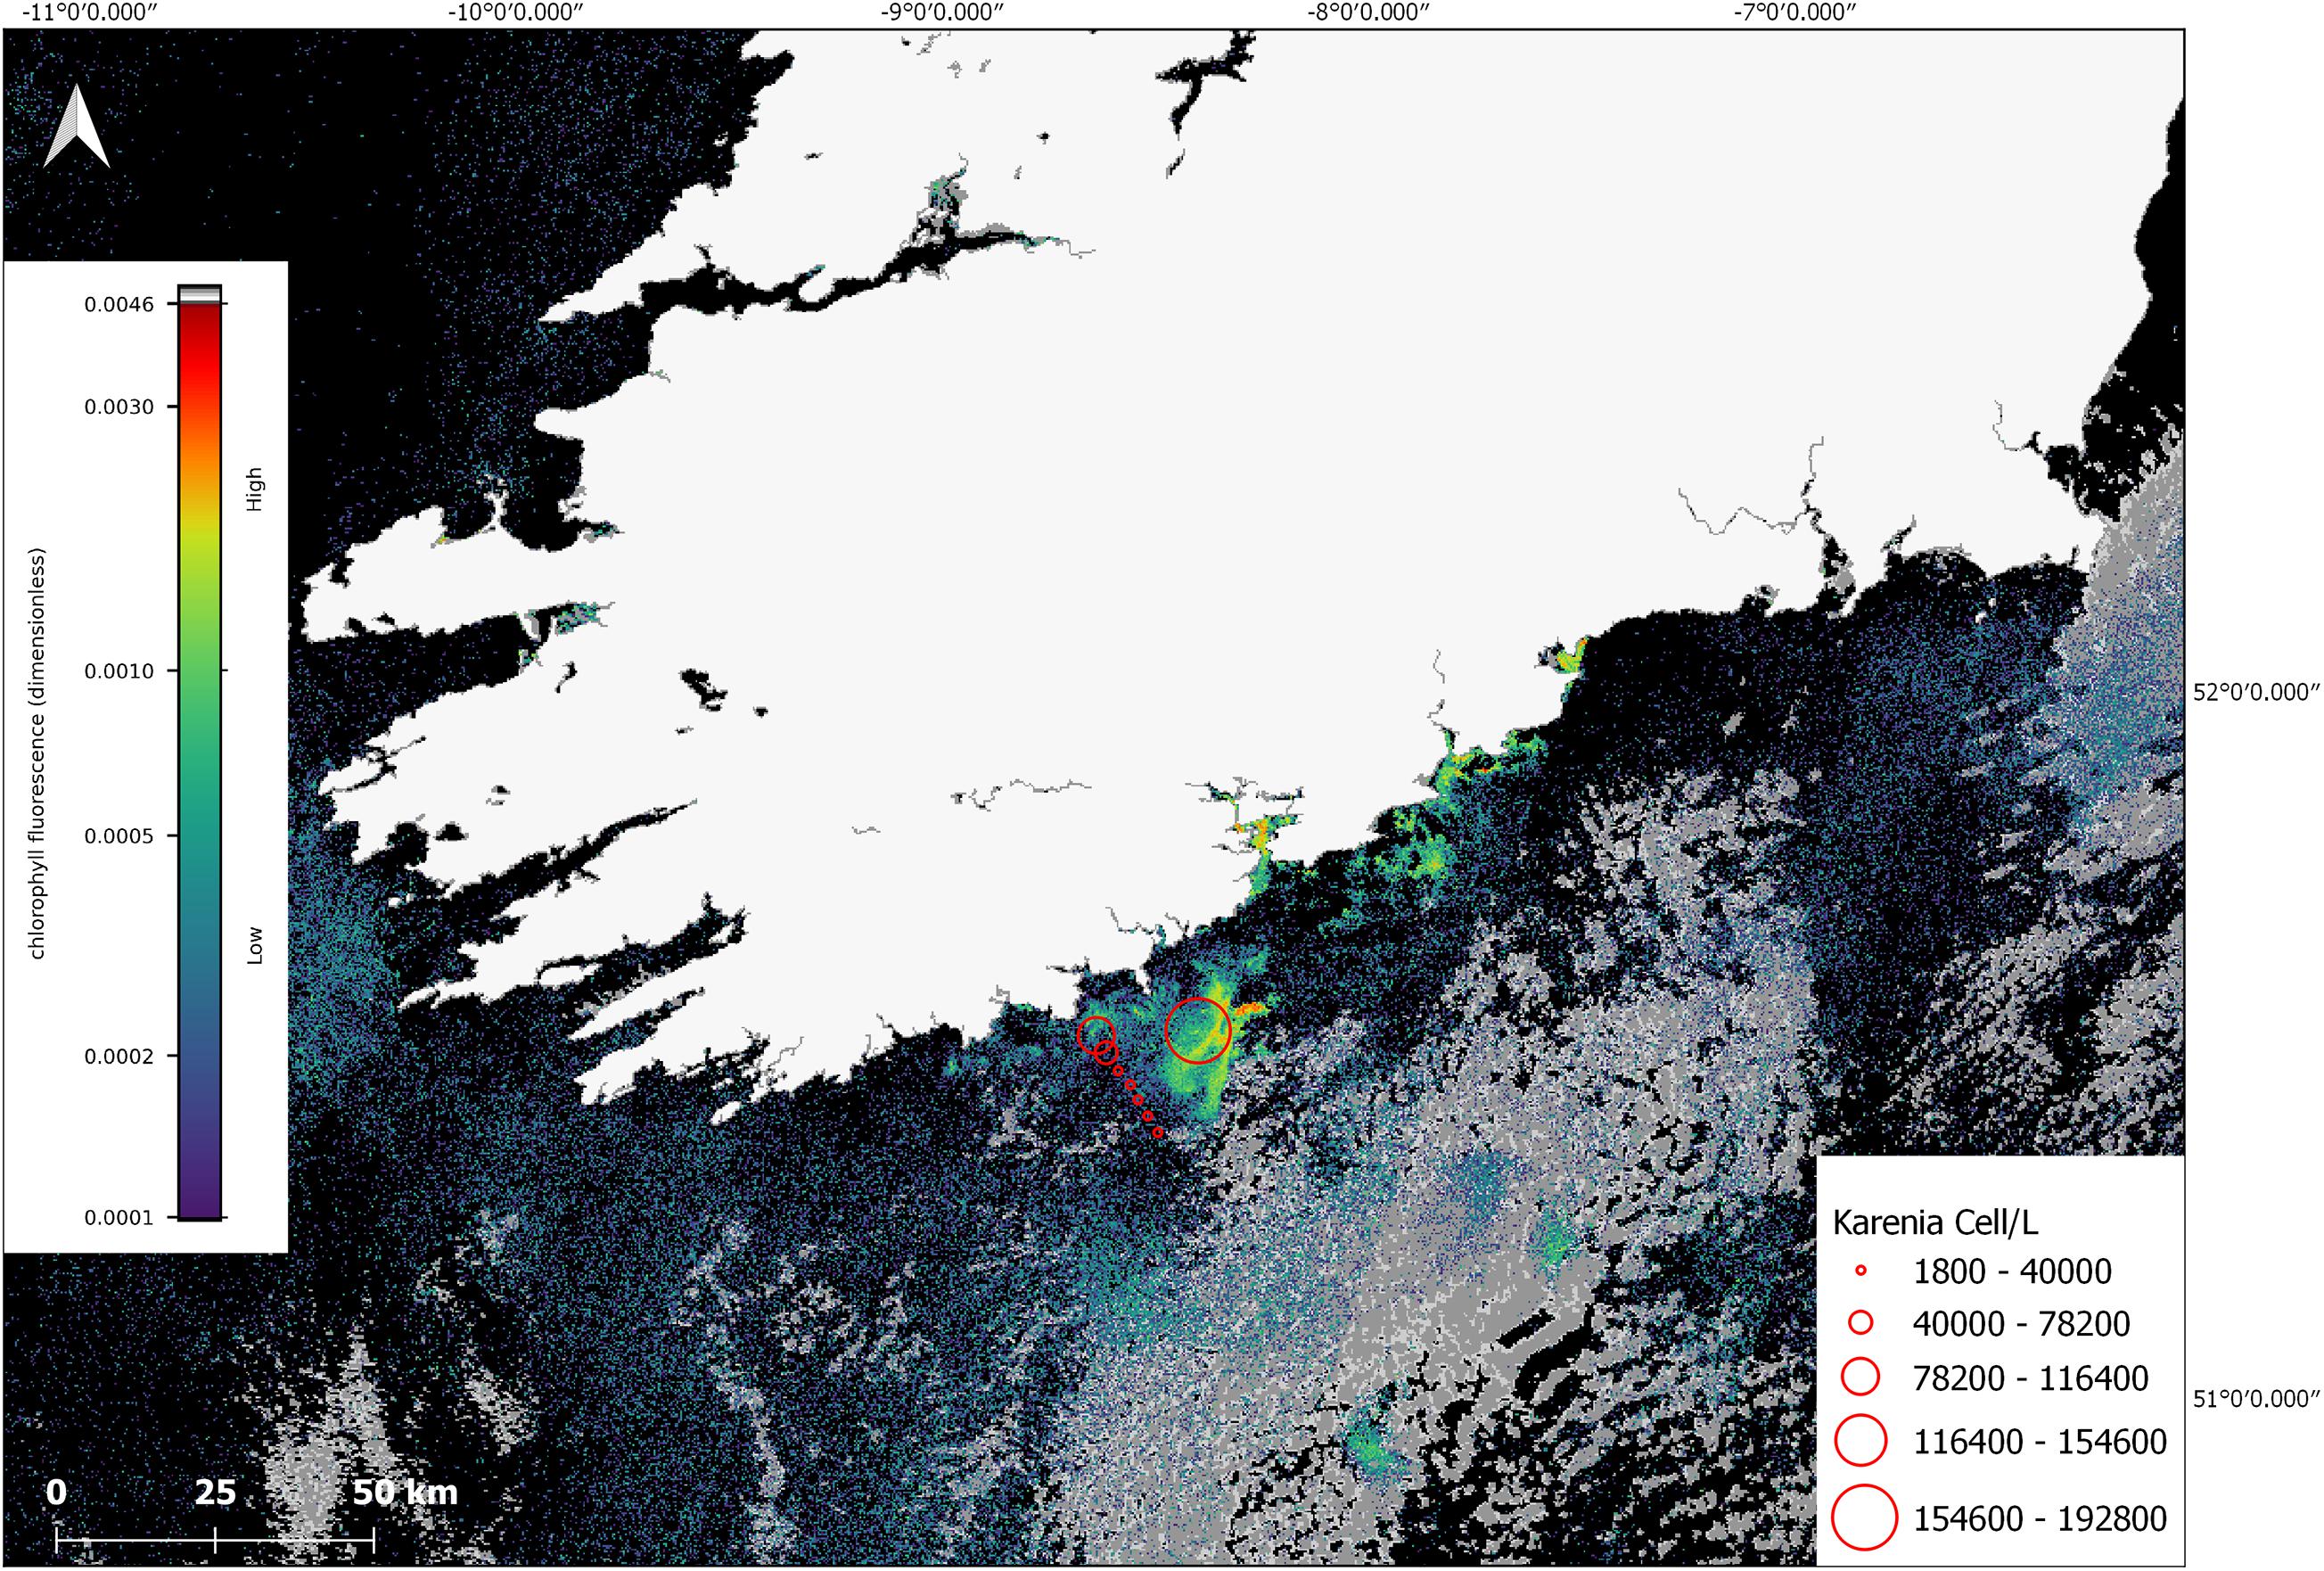
Figure 6. Sentinel-3a OLCI image with RBD algorithm from 10 July 2019. The red circles indicate cell concentrations determined using light microscopy for in situ samples collected on CV19018 on the same date. The grey colour in the image represents cloud cover.
Water samples collected with the CTD at stations 135–148 had an array of phytoplankton taxa identified (e.g., Dinophysis acuminata, Prorocentrum, Ceratium lineatum, Ceratium fusus, Ceratium furca, Ceratium tripos, Ceratium macroceros, Protoperidinium, Gyrodinium, Ceratium inflatum, Dinophysis acuta, Noctiluca) with Karenia mikimotoi present and the most abundant taxa recorded at stations sampled. The FSS bottles were deployed at 17–19 m at station 148 at 16:48 after a thin layer was identified on the CTD cast. K. mikimotoi was again the predominant taxa observed throughout the 5 bottles with cell counts of 3,146,000 cells/L, 4,258,000 cells/L, 3,842,000 cells/L, 3,276,000 cells/L and 2,474,000 recorded (Full cell counts for CV19018 can be viewed in Supplementary Material).
In situ K. mikimotoi cell counts from stations 138–148 closest to the surface were used to clarify whether there were any potential associations between the satellite derived RBD value, and in situ cell counts. While sampling was conducted over the course of the day from 09:03 to 16:34, it was difficult to determine the exact surface counts at the time of the satellite data acquisition given the DVM behaviour of Karenia spp. A linear regression was calculated, (Cells/L) = 1.97 × 10⁸ (RBD) – 1.49 × 10⁴, with an R2 value of 0.93 (n = 8) was determined (linear regression and data for this conclusion in Supplementary Material). This suggests to us that an RBD value greater than approximately 0.0005 makes a useful early threshold for bloom formation as it is roughly equivalent to 1 × 10⁶ cells/L. However, given that there are several unknowns with regard to fluorescence characteristics and the DVM nature of K. mikimotoi, the timing of satellite measurement, in situ sample timing, and the low sample size the high correlation value could have been fortuitous as the samples acquired for this study were opportunistic therefore there are spatial and temporal mismatches involved.
Future work to clarify this would require more dedicated in situ sampling at the time of satellite-measurement acquisition and an estimate of the Karenia spp. position within the water column at that time. The findings of such studies will help determine a threshold for a warning system.
Discussion
The RBD algorithm was tested in Irish waters for the first time during the months of May, June, July, and August 2019 to assess its suitability for adding to the established HAB monitoring system. A phytoplankton bloom occurred off the south coast at this time and was visible using the RBD satellite images. The results we have presented here show the RBD algorithm was proficient in assessing the timing of the initiation, movement, geographical extent, locations of the peak abundances and duration of the bloom. Although this study demonstrates the RBD’s use in detecting Karenia spp. blooms, the algorithm would be useful for monitoring HAB events in general as the detection of bloom presence with the RBD algorithm indicates some Chl-a fluorescence, as the radiance returned at 681 nm is greater than that returned from 665 nm, even though 681 nm also includes strong Chl-a absorption (Wolny et al., 2020) and already used for Chesapeake Bay for monitoring a range of dinoflagellates.
Unfortunately, there was not enough offshore data to do a rigorous validation, but, we were able to confirm the predominant phytoplankton in an area when the bloom appeared on satellite imagery using data from an offshore survey that coincided with the bloom in July. Having confirmed the drift trajectory of the bloom based on local water circulation patterns using the particle tracking model we were confident in using the inshore data from the southern stations Cork Harbour, Oysterhaven, and Kinsale and confirmed that Karenia spp. was the predominate taxa identified.
Although the authors are not trying to replace the current standard chlorophyll algorithm, it is hoped the preliminary use of RBD algorithm will become an extra monitoring tool within the HAB alert system. This paper presents the results from a pilot study and future studies will help improve methodologies with the implementation of more validation methods such as the use of hyperspectral radiometry from the national research vessel.
The acquisition of new technical skills will further help support a sustainable aquaculture industry in Ireland. The use of satellite technology for observing the movement of phytoplankton blooms are well documented throughout the world (Stumpf et al., 2003, 2009; Stumpf and Tomlinson, 2005; Miller et al., 2006; Davidson et al., 2016; Groom et al., 2019). Of course, there are going to be limitations to using earth observation data, some of which include: clouds, difficulty differentiating between phytoplankton species and, depth limitations (Ruddick et al., 1999). As discussed, blue-green ratio chlorophyll algorithms can overestimate chlorophyll in waters close to the coast due to contamination of CDOM and sediment in the measurements. Satellite measurements of chlorophyll fluorescence are considered proficient to detect blooms in areas like this (Gower and King, 2012; Gower et al., 2013). Introducing new methods of monitoring is useful to improve current mitigation efforts, given the diversity and complexity of HAB events and the different behaviours of phytoplankton functional types (Moisan et al., 2017). Understanding the history and behaviours of the most problematic species that are responsible for HAB events can help detect what type of bloom is forming offshore before it is possible to collect samples. This can be done by using algorithms with trained datasets (Martinez-Vicente et al., 2020) and also it is vital to understand the typical behaviour of the species. It is established that blooms of Karenia spp. originate in regions of the continental shelf that have weak tidal currents and are stratified in the summer (Brand et al., 2012). For example, in the Celtic Sea close to the Nymphe bank, where tidal streams are weak, the spring bloom develops earliest (Pingree et al., 1976; Raine, 2014). In this area, high densities of K. mikimotoi have been observed as early as May (Pemberton et al., 2004). The Nymphe Bank is located at 51°30′0″ N 7°30′0″W, an area where the centre of the bloom first appeared on satellite imagery, see Figure 1; 51°23′24″ N 7°23′18″W. Large blooms of Karenia spp. have been recorded around Ireland in regions with similar slack circulation, areas such as the southern Malin shelf and the Irish shelf to the west of the Aran Islands (Gowen et al., 1998; Silke et al., 2005). Subsequent growth and transport in coastal currents can spread their impact over large areas of the coastal zone (Davidson et al., 2009). Due to the proximity to land, the development of these blooms are difficult to detect without satellite technology.
Many harmful algae display diurnal vertical migration behaviour (Park et al., 2001; Kononen et al., 2003). The algae are known to swim toward the surface at dawn and to deeper depths at dusk (Olsson and Graneli, 1991; Koizumi et al., 1996; Park et al., 2001). Karenia mikimotoi are known to vertically migrate within an estimated daily depth range of 15–20 m (Koizumi et al., 1996; Li et al., 2019) they migrate before sunrise and reach the surface before midday (Li et al., 2019). When the cells assemble at the surface during upward migration, this has been shown to promote the formation of the red tide (Honjo, 2004). Previous observations have suggested that K. mikimotoi are frequently found in thin layers near the pycnocline (Brand et al., 2012) developing at or directly below the thermocline (Holligan et al., 1984) particularly at frontal regions between well-mixed and stratified waters (Pingree et al., 1977). Results from the FSS at station 148 on CV19018 show Karenia spp. between 17 and 19 m in a thin layer in extremely high densities. These samples were taken at 16:34, due to the DVM behaviour of the species, they were travelling to deeper depths before dusk and higher concentrations could have been identified at the surface if the samples were taken around midday. Knowing Karenia spp. exhibit these behaviours of surfacing around midday, it is a good reason to choose a fluorescence algorithm to monitor coastal waters. Fluorescence penetration depth is shallow because oceanic waters attenuate fluorescence and the signal only returns information of Chl-a in the subsurface waters of approximately 2 m (Xing et al., 2007).
Additionally, in order to predict movement of the bloom, it is important we understand the water circulation patterns. The RBD images show the bloom was detected by satellite on the 2 June, 14 days before Karenia spp. was identified in the inshore samples. Historically, K. mikimotoi blooms are known to occur in shelf and coastal waters off the south, southwest, west and northwest of Ireland. Water circulation around these coastal areas is heavily influenced by the Irish Coastal Current that flows in a clockwise direction around the Irish Atlantic coastline (Raine, 2014). This coastal current is an important transport pathway in the northern Celtic Sea. In summer, the westward transport of planktonic organisms is heavily influenced by the Irish Coastal Current with faster flows, in a density driven current, found at depths of ∼25 m (Farrell et al., 2012). In this study, relatively calm weather was reported in June with weak wind speeds and low significant wave heights (average 1.2 m) recorded at the M5 data buoy in the Celtic Sea, conditions suitable for the development of the K. mikimotoi bloom observed in offshore surface waters. The numerical hydrodynamic model used in this study was tightly coupled to meteorological data and the particle tracking model shows the advection of the K. mikimotoi bloom into inshore regions when the bloom was fully developed. Wind driven advection is important in this region. For example, in 1998, weak wind driven upwelling in the region uplifted a subsurface K. mikimotoi bloom into surface waters off the SW coast, wind also played an important part in the transport of the bloom eastwards across the Celtic Sea where it was advected into coastal areas; this bloom was recorded using satellite ocean colour and thermal infra-red sea surface temperature images alongside in situ measurements (Raine et al., 2001). The results from the particle tracking model confirm the bloom followed the pattern of the clockwise coastal current when Karenia spp. counts peaked in the three southern inshore stations at different times. Cork Harbour first, Oysterhaven and then Kinsale.
The method explained in this study shows high-biomass blooms, like Karenia spp. can be detected and monitored with the RBD algorithm like in the Gulf of Mexico and Alaska (Amin et al., 2009; Vandersea et al., 2020) and now this study confirms it is a useful product to use in Irish waters. Wolny et al. (2020) describes how the RBD method is used to monitor the most common marine and estuarine HABs in Chesapeake Bay indicating the potential for other HAB blooms of interest in Ireland. Further discrimination of genus or species level is difficult with just satellite technology, but combined with particle tracking and routine monitoring programmes, can further develop a more robust warning system. Aquaculture business owners can limit damage to their stock by avoiding moving, harvesting and/or planting new seed while warning systems are in place.
Quantitative application of the RBD approach examined here, requires more data to better constrain the relationship between RBD values and cell numbers of Karenia mikimotoi as the observed reflectance/fluorescence is influenced by a suite of external variables which may change with time (e.g., irradiance, photosynthetic efficiency, cell size, etc.). One such key parameter is the chlorophyll per cell of Karenia mikimotoi, with laboratory studies indicating it decreases with increasing irradiance and covers a wide range of values in the literature; 2–27 pg Chl cell–1 (Stæhr and Cullen, 2003; Chang and Gall, 2013; Wang et al., 2019; Zhao et al., 2019). Values of 2–6 pg Chl cell–1 (Stæhr and Cullen, 2003; Zhao et al., 2019) have been found under high light conditions similar to what was observed in the Celtic Sea at the time of our study, using the Cell numbers of ∼3,000,000 cells/L from the centre of the bloom at that time would indicate a value of 6–18 μg Chl/L potentially associated with Karenia mikimotoi.
There was limited availability of offshore data to do a full validation for this study. If this algorithm was to be used as an operational satellite product, future work will investigate combinations of inshore and offshore sampling and combining hyperspectral radiometry data.
Conclusion
• We analysed remotely sensed data for the period of May–August 2019 testing the RBD algorithm in Irish waters for the first time.
• The phytoplankton bloom we identified using the satellite technology was localised and was reflected in the inshore phytoplankton samples from around Ireland.
• Both the satellite imagery and the particle tracking simulation results confirm the movement and the direction the bloom travelled.
• Karenia spp. was present in high numbers only at southern stations at the time of the bloom and was not identified anywhere else along the Irish coastline.
• A sudden increase of Karenia spp. in Cork Harbour, Oysterhaven and Kinsale occurred shortly after the bloom developed in offshore waters.
• The appearance of Karenia spp. at the southern coastal stations followed an east to west pattern in line with what the expected transport of the Irish coastal current.
• We established that the predominant phytoplankton observed in offshore samples was K. mikimotoi.
• We describe the potential for Ireland to use the Red Band Difference algorithm as an extra monitoring tool within the established HAB alert system to provide an early warning method of HABs and in particular, Karenia spp. blooms.
Data Availability Statement
The original contributions presented in the study are included in the article/Supplementary Material, further inquiries can be directed to the corresponding author/s.
Author Contributions
CJ wrote the first draft of the manuscript under the guidance of PC and CC. AM, MT, and CJ participated in the analysis and presentation of ocean colour satellite data. RM carried out the particle tracking model simulation. RS and CG participated in the collection and analysis of the field in situ data. All authors contributed to the manuscript revisions.
Funding
This project (Grant-aid Agreement No. CF/17/03/01) is carried out with the support of the Marine Institute and funded under the Marine Research Programme by the Irish Government. Further funding was provided by the Marine Institute Networking and Research Communication Awards, Networking and Travel Grant, and Ryan Institute Travel Awards for CJ visit to NCCOS, NOAA in October 2019. This work was partially supported by the INTERREG Atlantic Area Work Programme project PRIMROSE Project Number: EAPA_182/2016.
Conflict of Interest
AM was employed by Consolidated Safety Services Inc.
The remaining authors declare that the research was conducted in the absence of any commercial or financial relationships that could be construed as a potential conflict of interest.
Acknowledgments
We thank Richard Stumpf and his team at NCCOS, NOAA for their guidance that helped create this study. We thank the phytoplankton team at the Marine Institute for analysing the inshore samples made available for this study. We also thank Dr. Robin Raine (Chief Scientist), researchers and crew of CV19018 for the offshore phytoplankton data used in this study, Kieran Lyons from the Marine Institute for providing the data for the particle tracking model, and the reviewers for their comments and suggestions which have helped improve this manuscript.
Supplementary Material
The Supplementary Material for this article can be found online at: https://www.frontiersin.org/articles/10.3389/fmars.2021.638889/full#supplementary-material
Supplementary Image 1 | 27 June 2019 RBD daily image.
Supplementary Table 1 | Cork Harbour, Oysterhaven, Kinsale phytoplankton counts June - August 2019.
Supplementary Table 2 | Cork Harbour, Oysterhaven, Kinsale Karenia cell counts June - August 2019.
Supplementary Table 3 | CV19018 phytoplankton cell counts 10 July 2019.
Supplementary Data Sheet 1 | Linear regression of RBD and in situ Karenia mikimotoi cell counts.
Footnotes
- ^ ftp://ftp.ifremer.fr/ifremer/cersat/products/gridded/ocean-color/atlantic/EUR-L4-CHL-ATL-v01/
- ^ https://www.marine.ie/Home/site-area/data-services/interactive-maps/weekly-hab-bulletin
References
Amin, R., Zhou, J., Gilerson, A., Gross, B., Moshary, F., and Ahmed, S. (2009). Novel optical techniques for detecting and classifying toxic dinoflagellate Karenia brevis blooms using satellite imagery. Opt. Express 17, 9126–9144. doi: 10.1364/oe.17.009126
Anderson, C. R., Moore, S. K., Tomlinson, M. C., Silke, J., and Cusack, C. K. (2015). “Living with harmful algal blooms in a changing world: strategies for modeling and mitigating their effects in coastal marine ecosystems,” in Coastal and Marine Hazards, Risks, and Disasters, eds J. T. Ellis and D. J. Sherman (Amsterdam: Elsevier), 495–561. doi: 10.1016/b978-0-12-396483-0.00017-0
Brand, L. E., Campbell, L., and Bresnan, E. (2012). Karenia: the biology and ecology of a toxic genus. Harmful Algae 14, 156–178. doi: 10.1016/j.hal.2011.10.020
Bresnan, E., Davidson, K., Edwards, M., Fernand, L., Gowen, R., Hall, A., et al. (2013). Impacts of climate change on harmful algal blooms. MCCIP Sci. Rev. 2013, 236–243. doi: 10.14465/2013.arc24.236-243
Callaway, R., Shinn, A. P., Grenfell, S. E., Bron, J. E., Burnell, G., and Cook, E. J. (2012). Review of climate change impacts on marine aquaculture in the UK and Ireland. Aquatic Conserv. Mar. Freshw. Ecosyst. 22, 389–421.
Chang, F. H., and Gall, M. (2013). Pigment compositions and toxic effects of three harmful Karenia species, Karenia concordia, Karenia brevisulcata and Karenia mikimotoi (Gymnodiniales, Dinophyceae), on rotifers and brine shrimps. Harmful Algae 27, 113–120. doi: 10.1016/j.hal.2013.05.005
Dabrowski, T., Lyons, K., Cusack, C., Casal, G., Berry, A., and Nolan, G. D. (2016). Ocean modelling for aquaculture and fisheries in Irish waters. Ocean Sci. 12, 101–116. doi: 10.5194/os-12-101-2016
Davidson, J., Mateus, M., Reguera, B., Silke, J., and Sourisseau, M. (2016). Applied simulations and integrated modelling for the understanding of toxic and harmful algal blooms (ASIMUTH). Harmful Algae 53, 1–166. doi: 10.1007/978-0-387-75865-7_1
Davidson, K., Miller, P., Wilding, T. A., Shutler, J., Bresnan, E., Kennington, K., et al. (2009). A large and prolonged bloom of Karenia mikimotoi in Scottish waters in 2006. Harmful Algae 8, 349–361. doi: 10.1016/j.hal.2008.07.007
Diaz, R. J., and Rosenberg, R. (2008). Spreading dead zones and consequences for marine ecosystems. Science 321, 926–929. doi: 10.1126/science.1156401
Doerffer, R. (1993). Estimation of primary production by observation of solar-stimulated fluorescence ICES mar. Sci. Symp. 197, 104–113.
Farrell, H., Gentien, P., Fernand, L., Lunven, M., Reguera, B., González-Gil, S., et al. (2012). Scales characterising a high density thin layer of Dinophysis acuta Ehrenberg and its transport within a coastal jet. Harmful Algae 15, 36–46. doi: 10.1016/j.hal.2011.11.003
Gentien, P. (1998). “Bloom dynamics and ecophysiology of the Gymnodinium mikimotoi species complex,” in Physiological Ecology of Harmful Algal Blooms, eds D. Anderson, A. D. Cembella, and G. M. Hallegraeff (Berlin: Springer).
Gentien, P., Lunven, M., Lazure, P., Youenou, A., and Crassous, M. P. (2007). Motility and autotoxicity in Karenia mikimotoi (Dinophyceae). Philos. Trans. R. Soc. B Biol. Sci. 362, 1937–1946. doi: 10.1098/rstb.2007.2079
Gordon, H. R., and Morel, A. Y. (1983). Remote Assessment of Ocean Color for Interpretation of Satellite Visible Imagery: a Review. Berlin: Springer-Verlag.
Gowen, R. J., Raine, R., Dickey-Collas, M., and White, M. (1998). Plankton distributions in relation to physical oceanographic features on the southern Malin Shelf, August 1996. ICES J. Mar. Sci. 55, 1095–1111. doi: 10.1006/jmsc.1998.0418
Gower, J., and King, S. (2012). Use of satellite images of Chlorophyll fluorescence to monitor the spring bloom in coastal waters. Int. J. Remote Sens. 33, 7469–7481. doi: 10.1080/01431161.2012.685979
Gower, J., King, S., Statham, S., Fox, R., and Young, E. (2013). The malaspina dragon: a newlydiscovered pattern of the early spring bloom in the strait of georgia, British Columbia, Canada. Prog. Oceanogr. 115, 181–188. doi: 10.1016/j.pocean.2013.05.024
Groom, S. B., Sathyendranath, S., Ban, Y., Bernard, S., Brewin, B., and Brotas, V. (2019). Satellite ocean colour: current status and future perspective. Front. Mar. Sci. 6:485.
Holligan, P., Williams, P., Purdie, D., and Harris, R. (1984). Photosynthesis, respiration and nitrogen supply of plankton populations in stratified, frontal and tidally mixed shelf waters. Mar. Ecol. Prog. Ser. 17, 201–213. doi: 10.3354/meps017201
Honjo, T. (2004). “Karenia (formerly Gymnodinium) mikimotoi,” in Red Tides. New Zealand: Terra Scientific Publishing Company, ed. T. Okaichi (Dordrecht: Kluwer Academic Publishers), 345–357.
IOCCG (2000). “Remote sensing of ocean colour in coastal, and other optically-complex, waters,” in Reports of the International Ocean-Colour Coordinating Group, No. 3, ed. S. Sathyendranath (Dartmouth: IOCCG).
Jones, K. J., Ayres, P., Bullock, A. M., Roberts, R. J., and Tett, P. (1982). A red tide of Gyrodinium aureolum in sea lochs of the firth of Clyde and associated mortality of pond-reared salmon. J. Mar. Biol. Assoc. U.K. 62, 771–782. doi: 10.1017/s0025315400044040
Koizumi, Y., Uchida, T., and Honjo, T. (1996). Diurnal vertical migration of Gymnodinium mikimotoi during a red tide in Hoketsu Bay, Japan. J. Plank. Res. 18, 289–294. doi: 10.1093/plankt/18.2.289
Kononen, K., Huttunen, M., Hällfors, S., Gentien, P., Lunven, M., Huttula, T., et al. (2003). Development of a deep chlorophyll maximum of Heterocapsa triquetra Ehrenb. at the entrance to the Gulf of Finland. Limnol. Oceanogr. 48, 594–607. doi: 10.4319/lo.2003.48.2.0594
Leadbetter, A., Silke, J., and Cusack, C. (2018). Creating a Weekly Harmful Algal Bloom Bulletin. Version 1. Ireland: Marine Institute.
Lett, C., Verley, P., Mullon, C., Parada, C., Brochier, T., Penven, P., et al. (2008). A lagrangian tool for modelling ichthyoplankton dynamics. Environ. Modell. Softw. 23, 1210–1214. doi: 10.1016/j.envsoft.2008.02.005
Li, X., Yan, T., Yu, R., and Zhou, M. (2019). A review of karenia mikimotoi: bloom events, physiology, toxicity and toxic mechanism. Harmful Algae 90:101702. doi: 10.1016/j.hal.2019.101702
Martinez-Vicente, V., Kurekin, A., Sá, C., Brotas, V., Amorim, A., Veloso, V., et al. (2020). Sensitivity of a satellite algorithm for harmful algal bloom discrimination to the use of laboratory bio-optical data for training. Front. Mar. Sci. 7:582960.
Miller, P., Shutler, J., Moore, G., and Groom, S. (2006). SeaWiFS discrimination of harmful algal bloom evolution. Int. J. Remote Sens. 27, 2287–2301. doi: 10.1080/01431160500396816
Mobley, C. D., Stramski, D., Bissett, W. P., and Boss, E. (2004). Optical modeling of ocean waters: is the Case 1 - Case 2 classification still useful? Oceanography 17, 60–67. doi: 10.5670/oceanog.2004.48
Moisan, T. A., Rufty, K. M., Moisan, J. R., and Linkswiler, M. A. (2017). Satellite observations of phytoplankton functional type spatial distributions, phenology, diversity, and ecotones. Front. Mar. Sci. 4, 1–24.
Morel, A. (1988). Optical modeling of the upper ocean in relation to its biogenous matter content (case I waters). J. Geophys. Res. 93:10749. doi: 10.1029/jc093ic09p10749
Morel, A., and Prieur, L. (1977). Analysis of variations in ocean color1. Limnol. Oceanogr. 22, 709–722. doi: 10.4319/lo.1977.22.4.0709
Mydlarz, L. D., Jones, L. E., and Harvell, C. D. (2006). Innate immunity, environmental drivers and disease ecology of marine and freshwater Invertebrates. Annu. Rev. Ecol. Evol. Syst. 37, 251–288. doi: 10.1146/annurev.ecolsys.37.091305.110103
Neely, T., and Campbell, L. (2006). A modified assay to determine hemolytic toxin variability among Karenia clones isolated from the Gulf of Mexico. Harmful Algae 5, 592–598. doi: 10.1016/j.hal.2005.11.006
O’Boyle, S., McDermott, G., Silke, J., and Cusack, C. (2016). Potential impact of an exceptional bloom of Karenia mikimotoi on dissolved oxygen levels in waters off western Ireland. Harmful Algae 53, 77–85. doi: 10.1016/j.hal.2015.11.014
Olsson, P., and Graneli, E. (1991). Observations on diurnal vertical migration and phased cell division for three coexisting marine dinoflagellates. J. Plankton Res. 13, 1313–1324. doi: 10.1093/plankt/13.6.1313
Ottway, B., Parker, M., McGrath, D., and Crowley, M. (1979). Observations on a bloom of Gyrodinium aureolum Hulbert on the south coast of Ireland 1976, associated with mortalities of littoral and sub-littoral organisms. Ir. Fish. Invest Ser. B 18, 3–9.
Park, J. G., Jeong, M. K., Lee, J. A., Cho, K.-J., and Kwon, O.-S. (2001). Diurnal vertical migration of a harmful dinoflagellate, Cochlodinium polykrikoides (Dinophyceae), during a red tide in coastal waters of Namhae Island, Korea. Phycologia 40, 292–297. doi: 10.2216/i0031-8884-40-3-292.1
Pemberton, K., Rees, A. P., Miller, P. I., Raine, R., and Joint, I. (2004). The influence of water body characteristics on phytoplankton diversity and production in the Celtic Sea. Cont. Shelf Res. 24, 2011–2028. doi: 10.1016/j.csr.2004.07.003
Pingree, R. D., Holligan, P. M., and Head, R. N. (1977). Survival of dinoflagellate blooms in the western English channel. Nature 265, 266–269. doi: 10.1038/265266a0
Pingree, R. D., Holligan, P. M., Mardell, G. T., and Head, R. N. (1976). The influence of physical stability on spring, summer and autumn phytoplankton blooms in the Celtic sea. J. Mar. Biol. Assoc. U. K. 56, 845–873. doi: 10.1017/s0025315400020919
Raine, R. (2014). A review of the biophysical interactions relevant to the promotion of HABs in stratified systems: the case study of Ireland. Deep Sea Res. II Top. Stud. Oceanogr. 101, 21–31. doi: 10.1016/j.dsr2.2013.06.021
Raine, R., O’Boyle, S., O’Higgins, T., White, M., Patching, J., Cahill, B., et al. (2001). A satellite and field portrait of a Karenia mikimotoi bloom off the south coast of Ireland, August 1998. Hydrobiologia 465, 187–193. doi: 10.1007/978-94-010-0434-3_19
Ruddick, K., Park, Y., Cauwer, V., Debruyn, W., and Sterckx, S. (1999). Overview of Ocean Colour: theoretical background, sensors and applicability for the detection and monitoring of harmful algae blooms (capabilities and limitations) Kevin. UNESCO Monographs on Oceanographic Methodology Series, Manual on Harmful Marine Microalgae Overview, 1–50.
Satake, M., Shoji, M., Oshima, Y., Naoki, H., Fujita, T., and Yasumoto, T. (2002). Gymnocin-A, a cytotoxic polyether from the notorious red tide dinoflagellate, Gymnodinium mikimotoi. Tetrahedron Lett. 43, 5829–5832. doi: 10.1016/s0040-4039(02)01171-1
Satake, M., Tanaka, Y., Ishikura, Y., Oshima, Y., Naoki, H., and Yasumoto, T. (2005). Gymnocin-B with the largest contiguous polyether rings from the red tide dinoflagellate, Karenia (formerly Gymnodinium) mikimotoi. Tetrahedron Lett. 46, 3537–3540. doi: 10.1016/j.tetlet.2005.03.115
Shikata, T., Matsunaga, S., Nishide, H., Sakamoto, S., Onistuka, G., and Yamaguchi, M. (2015). Diurnal vertical migration rhythms and their photoresponse in four phytoflagellates causing harmful algal blooms. Limnol. Oceanogr. 60, 1251–1264. doi: 10.1002/lno.10095
Shikata, T., Onitsuka, G., Abe, K., Kitatsuji, S., Yufu, K., Yoshikawa, Y., et al. (2016). Relationships between light environment and subsurface accumulation during the daytime in the red-tide dinoflagellate Karenia mikimotoi. Mar. Biol. 164:18.
Shikata, T., Sakamoto, S., Onitsuka, G., Aoki, K., and Yamaguichi, M. (2014). Effects of salinity on diel vertical migration behavior in two red-tide algae, Chattonella antiqua and Karenia mikimotoi. Plankton Benthos Res. 9, 42–50. doi: 10.3800/pbr.9.42
Silke, J., O’Beirn, F., and Cronin, M. (2005). Karenia mikimotoi: an Exceptional Dinoflagellate Bloom in Western Irish Waters, Summer 2005. Ireland: Marine Institute.
Stæhr, P. A., and Cullen, J. J. (2003). Detection of Karenia mikimotoi by spectral absorption signatures. J. Plankton Res. 25, 1237–1249. doi: 10.1093/plankt/fbg083
Stumpf, R. P., and Tomlinson, M. C. (2005). “Remote sensing of harmful algal blooms,” in Remote Sensing of Coastal Aquatic Environments, eds R. L. Miller, C. E. del Castillo, and B. A. McKee (Dordrecht: Springer), 347.
Stumpf, R. P., Culver, M. E., Tester, P. A., Tomlinson, M. C., Kirkpatrick, G. J., and Pederson, B. A. (2003). Monitoring Karenia brevis blooms in the Gulf of Mexico using satellite ocean color imagery and other data. Harmful Algae 2, 147–160. doi: 10.1016/s1568-9883(02)00083-5
Stumpf, R. P., Tomlinson, M. C., Calkins, J. A., Kirkpatrick, B., Fisher, K., Nierenberg, K., et al. (2009). Skill assessment for an operational algal bloom forecast system. J. Mar. Syst. 76, 151–161. doi: 10.1016/j.jmarsys.2008.05.016
Tester, P. A., Stumpf, R. P., and Steidinger, K. A. (1998). ““Ocean color imagery: what is the minimum detection level for Gymnodinium breve blooms?,”,” in Harmful Algae, Proceedings of the VII International Conference on Harmful Algae, eds B. Reguera, J. Blanco, and M. Fernandez (Paris: Xunta de Galicia and Intergovernmental Oceanographic Commission of UNESCO), 149–151.
Tweddle, J. F., Gubbins, M., and Scott, B. E. (2018). Should phytoplankton be a key consideration for marine management? Mar. Policy 97, 1–9. doi: 10.1016/j.marpol.2018.08.026
UNESCO (2010). Microscopic and Molecular Methods for Quantitative Phytoplankton Analysis. Paris: UNESCO.
Vandersea, M., Tester, P., Holderied, K., Hondolero, D., Kibler, S., and Powell, K. (2020). An extraordinary Karenia mikimotoi “beer tide” in Kachemak Bay Alaska. Harmful Algae 92:101706. doi: 10.1016/j.hal.2019.101706
Wang, X., Feng, X., Zhuang, Y., Lu, J., Wang, Y., Gonçalves, R. J., et al. (2019). Effects of ocean acidification and solar ultraviolet radiation on physiology and toxicity of dinoflagellate Karenia mikimotoi. Harmful Algae 81, 1–9. doi: 10.1016/j.hal.2018.11.013
Wolny, J. L., Tomlinson, M. C., Schollaert, Uz, S., Egerton, T. A., McKay, J. R., et al. (2020). Current and future remote sensing of harmful algal blooms in the chesapeake bay to support the shellfish industry. Front. Mar. Sci. 7:337.
Wynne, T. T., Meredith, A., Briggs, T., Litaker, W., and Stumpf, R. P. (2018). Harmful Algal Bloom Forecasting Branch Ocean Color Satellite Imagery Processing Guidelines. Silver Spring, MD: NOAA.
Xing, X. G., Zhao, D. Z., Liu, Y. G., Yang, J. H., Xiu, P., and Wang, L. (2007). An overview of remote sensing of chlorophyll fluorescence. Ocean Sci. J. 42, 49–59.
Zeng, L., and Li, D. (2015). Development of in situ sensors for chlorophyll concentration measurement. J. Sensors 2015, 1–16. doi: 10.1155/2015/903509
Keywords: harmful algal bloom, Red Band Difference, OLCI, remote sensing, aquaculture, ocean colour, particle tracking, monitoring programme
Citation: Jordan C, Cusack C, Tomlinson MC, Meredith A, McGeady R, Salas R, Gregory C and Croot PL (2021) Using the Red Band Difference Algorithm to Detect and Monitor a Karenia spp. Bloom Off the South Coast of Ireland, June 2019. Front. Mar. Sci. 8:638889. doi: 10.3389/fmars.2021.638889
Received: 07 December 2020; Accepted: 01 April 2021;
Published: 30 April 2021.
Edited by:
Keith Davidson, Scottish Association for Marine Science, United KingdomReviewed by:
Peter I. Miller, Plymouth Marine Laboratory, United KingdomMarcos Mateus, University of Lisbon, Portugal
Copyright © 2021 Jordan, Cusack, Tomlinson, Meredith, McGeady, Salas, Gregory and Croot. This is an open-access article distributed under the terms of the Creative Commons Attribution License (CC BY). The use, distribution or reproduction in other forums is permitted, provided the original author(s) and the copyright owner(s) are credited and that the original publication in this journal is cited, in accordance with accepted academic practice. No use, distribution or reproduction is permitted which does not comply with these terms.
*Correspondence: Catherine Jordan, Q2F0aGVyaW5lLkpvcmRhbkBtYXJpbmUuaWU=