 Pablo Lorente1,2*
 Jue Lin-Ye1,3
 Manuel García-León1,3
 Emma Reyes4
 Maria Fernandes5
 Marcos Garcia Sotillo1
 Manuel Espino3Maria Isabel Ruiz1
 Vicente Gracia3Susana Perez1Roland Aznar1,2Andres Alonso-Martirena5
 Enrique Álvarez-Fanjul1
- 1Área de Medio Físico, Puertos del Estado, Madrid, Spain
- 2Nologin Consulting SL, Zaragoza, Spain
- 3Laboratori d’Enginyeria Marítima, Universitat Politècnica de Catalunya, BarcelonaTech, Barcelona, Spain
- 4SOCIB – Balearic Islands Coastal Ocean Observing and Forecasting System, Palma, Spain
- 5Qualitas Remos, Madrid, Spain
Storm Gloria (January 19–24, 2020) hit the NW Mediterranean Sea with heavy rainfall, strong easterly winds, and very high waves, causing structural damages and 13 fatalities. The low-lying Ebro Delta (ED) region was severely inundated, ruining rice fields and seaside promenades. A variety of Copernicus Marine Environment Monitoring Service (CMEMS) modeling and observational products were jointly used to examine the fingerprint of Gloria and the response of the upper oceanic layer. According to the results, Gloria can be interpreted as a high-impact once-in-a-decade metocean event where various historical records were beaten. The 99th percentile of several parameters (wind speed, significant wave height, wave period, and surface current velocity), derived from long-term observational time series, was persistently exceeded. The atmospheric surge, albeit not negligible, exerted a secondary role in ED. The ability of a high-frequency radar deployed in this region (HFR-ED) to characterize the striking features of the storm was quantified from both waves and circulation aspects. Consistent radar current observations were subsequently compared against the 5-day-ahead forecast of CMEMS Iberia-Biscay-Ireland (IBI) regional ocean model to determine, from an Eulerian perspective, the strengths and shortcomings in its predictive capabilities. Time-averaged maps of surface circulation, superimposed with fields of Instantaneous Rate of Separation (IROS), were derived to resolve flow features and identify areas of elevated particles dispersion, respectively. The mean and P99 values of IROS almost doubled the historical statistics in the vicinity of the northern Ebro hemidelta. Although IBI predicted moderately well basic features of the storm-induced circulation, results suggests that coastal transport processes, likely modulated by wave-current interactions, were not fully captured. Furthermore, current estimations from other two radar systems, overlooking immediate choke points like the Ibiza Channel and the Strait of Gibraltar, evidenced Gloria’s remote-effect in the anomalous circulation patterns observed, that altered the usual water exchanges between adjacent sub-basins. Finally, three-dimensional outcomes from IBI were used to elucidate the impact of this moving storm at different depth levels. Data analyses illustrated that Gloria caused a large increase in kinetic energy and a significant deepening of the mixed layer depth.
Introduction
Any portion of the worldwide coastline can suffer the threat of a plethora of metocean hazards, ranging from storm surges, flash-floods and tsunamis, to landfalling hurricanes and tropical typhoons. Natural disasters might impose significant and long-lasting pressures on coastal ecosystems, resulting frequently in a chronic degradation of marine protected areas (Adger et al., 2005; Spalding et al., 2014). Equally, their destructive effects in human infrastructures may disrupt essential services, damage economical assets and even cause casualties, especially in densely populated urban coastal areas (Tintoré et al., 2019; Wolff et al., 2020).
Therefore, the accurate monitoring, understanding and prediction of natural weather-related hazards are not only crucial to prompt a wealth of anticipatory adaptation strategies, but also of great economic value for the maritime sector (Melet et al., 2020). Such preventive approaches can aid to mitigate devastating effects and, eventually, strengthen the community resilience at multiple scales (Klein et al., 2003; Linnenluecke et al., 2012; Summers et al., 2018). Moreover, there is an emerging question about the triggering role of both anthropogenic pressures and global warming on the frequency, duration, spatial extent, and intensity of present and future extreme sea states (Konisky et al., 2015; Sánchez-Arcilla et al., 2016; Grases et al., 2020).
Despite of the increasing complexity and steady upgrade of regional ocean forecast models in terms of accuracy to reproduce large-scale physical processes, local phenomena are still poorly replicated at coastal scales. This is especially true for extreme events (Rockel, 2015; Lorente et al., 2019a). Over the last decades, High-Frequency radar (HFR) has emerged as a useful tool to unveil hydrodynamic aspects still uncovered by current state-of-the-art regional ocean models. HFRs provide, in near real time, reliable wave information and fine-resolution maps of the surface circulation over broad coastal areas (Rubio et al., 2017; Roarty et al., 2019). HFRs present a wide range of practical applications, among others: analysis of transport processes (for search and rescue operations, oil spill emergencies, etc.) or the effective monitoring of extreme events, such as storm surges, tsunamis, typhoons, and hurricanes (Suzuki, 2015; Saramul, 2017; Miles et al., 2017; Toguchi et al., 2018; Dao et al., 2019; Lipa et al., 2019; Serra et al., 2020). Given the consolidation of this remote sensing technology, the synergistic integration of HFRs and hydrodynamic models has demonstrated to be a valid strategy to comprehensively characterize the complex coastal circulation (O’Donncha et al., 2015; Lorente et al., 2019a). HFR observations supplement numerical simulations by resolving fine-scale processes in intricate nearshore areas. In turn, models can reciprocally offer a seamless predictive picture of the three-dimensional sea state.
The storm-induced ocean transport, monitored by a HFR and simulated by a forecast model, can be compared by adopting two main approaches. Some methods rely on Lagrangian time-dependent information, while others require only an Eulerian snapshot of the velocity field. The former, which encompass Lyapunov exponents and Lagrangian Coherent Structures, provide a robust framework to compare transport properties between different ocean current datasets, allowing the resolution of coherent flow patterns (Haller, 2015; García-Sánchez et al., 2021). However, Lagrangian techniques are often time consuming and computationally more expensive as they require trajectory integrations (Nolan et al., 2020). The latter, albeit useful to quantify particle dispersion (Futch, 2009 and 2019; Haza et al., 2010; Poje et al., 2010), cannot distinguish between coherent and transient features. Eulerian methods include the computation of various kinematic diagnostics such as the vorticity, the horizontal divergence (DIV), the strain, or the Instantaneous Rate of Separation (IROS) (Futch, 2019; Schaeffer et al., 2017; Kim, 2010; Archer, 2016). In this context, there seems to be consensus about the convenience of combining both approaches, when possible, to adequately explore transport processes at (sub) mesoscale ranges. A halfway approach, denominated Eulerian Coherent Structures, has been recently developed to connect Eulerian quantities to short-term Lagrangian transport (Nolan et al., 2020; Serra et al., 2020).
Storm Gloria hit the Western Mediterranean Sea (WMS; Figure 1A) from January 19–24, 2020. Eastern parts of Spain were ravaged with heavy rainfall, strong easterly winds, and high waves that beat historical records (Amores et al., 2020), causing widespread flooding, severe structural damages and 13 fatalities. The low-lying Ebro river Delta, a large wetland with a rich ecology, was dramatically affected by this unprecedented episode (Figures 1B,C). Despite the significant cloud cover, Sentinel-2 L1C Satellite imagery could adequately portray the adverse impact of Gloria at local scale. Daily snapshots of the Normalized Difference Water Index (NDWI), an adimensional parameter proposed by McFeeters (1996), revealed an abrupt change on specific water bodies from January 18 (Figure 1B) to January 23 (Figure 1C), during Gloria’s passage. Although both images do not discriminate between storm surge (i.e., salty water) and rain-induced (i.e., fresh water) flooding, it has been largely acknowledged that marine water fluxes rushed as far as 3 km inland. Hectares of rice fields were thus inundated with seawater, damaging soil fertility, and seaside promenades (Grases et al., 2020). The storm also resulted in degraded habitats and detriment of the adequate life cycle of local fauna (Mascort et al., 2020).
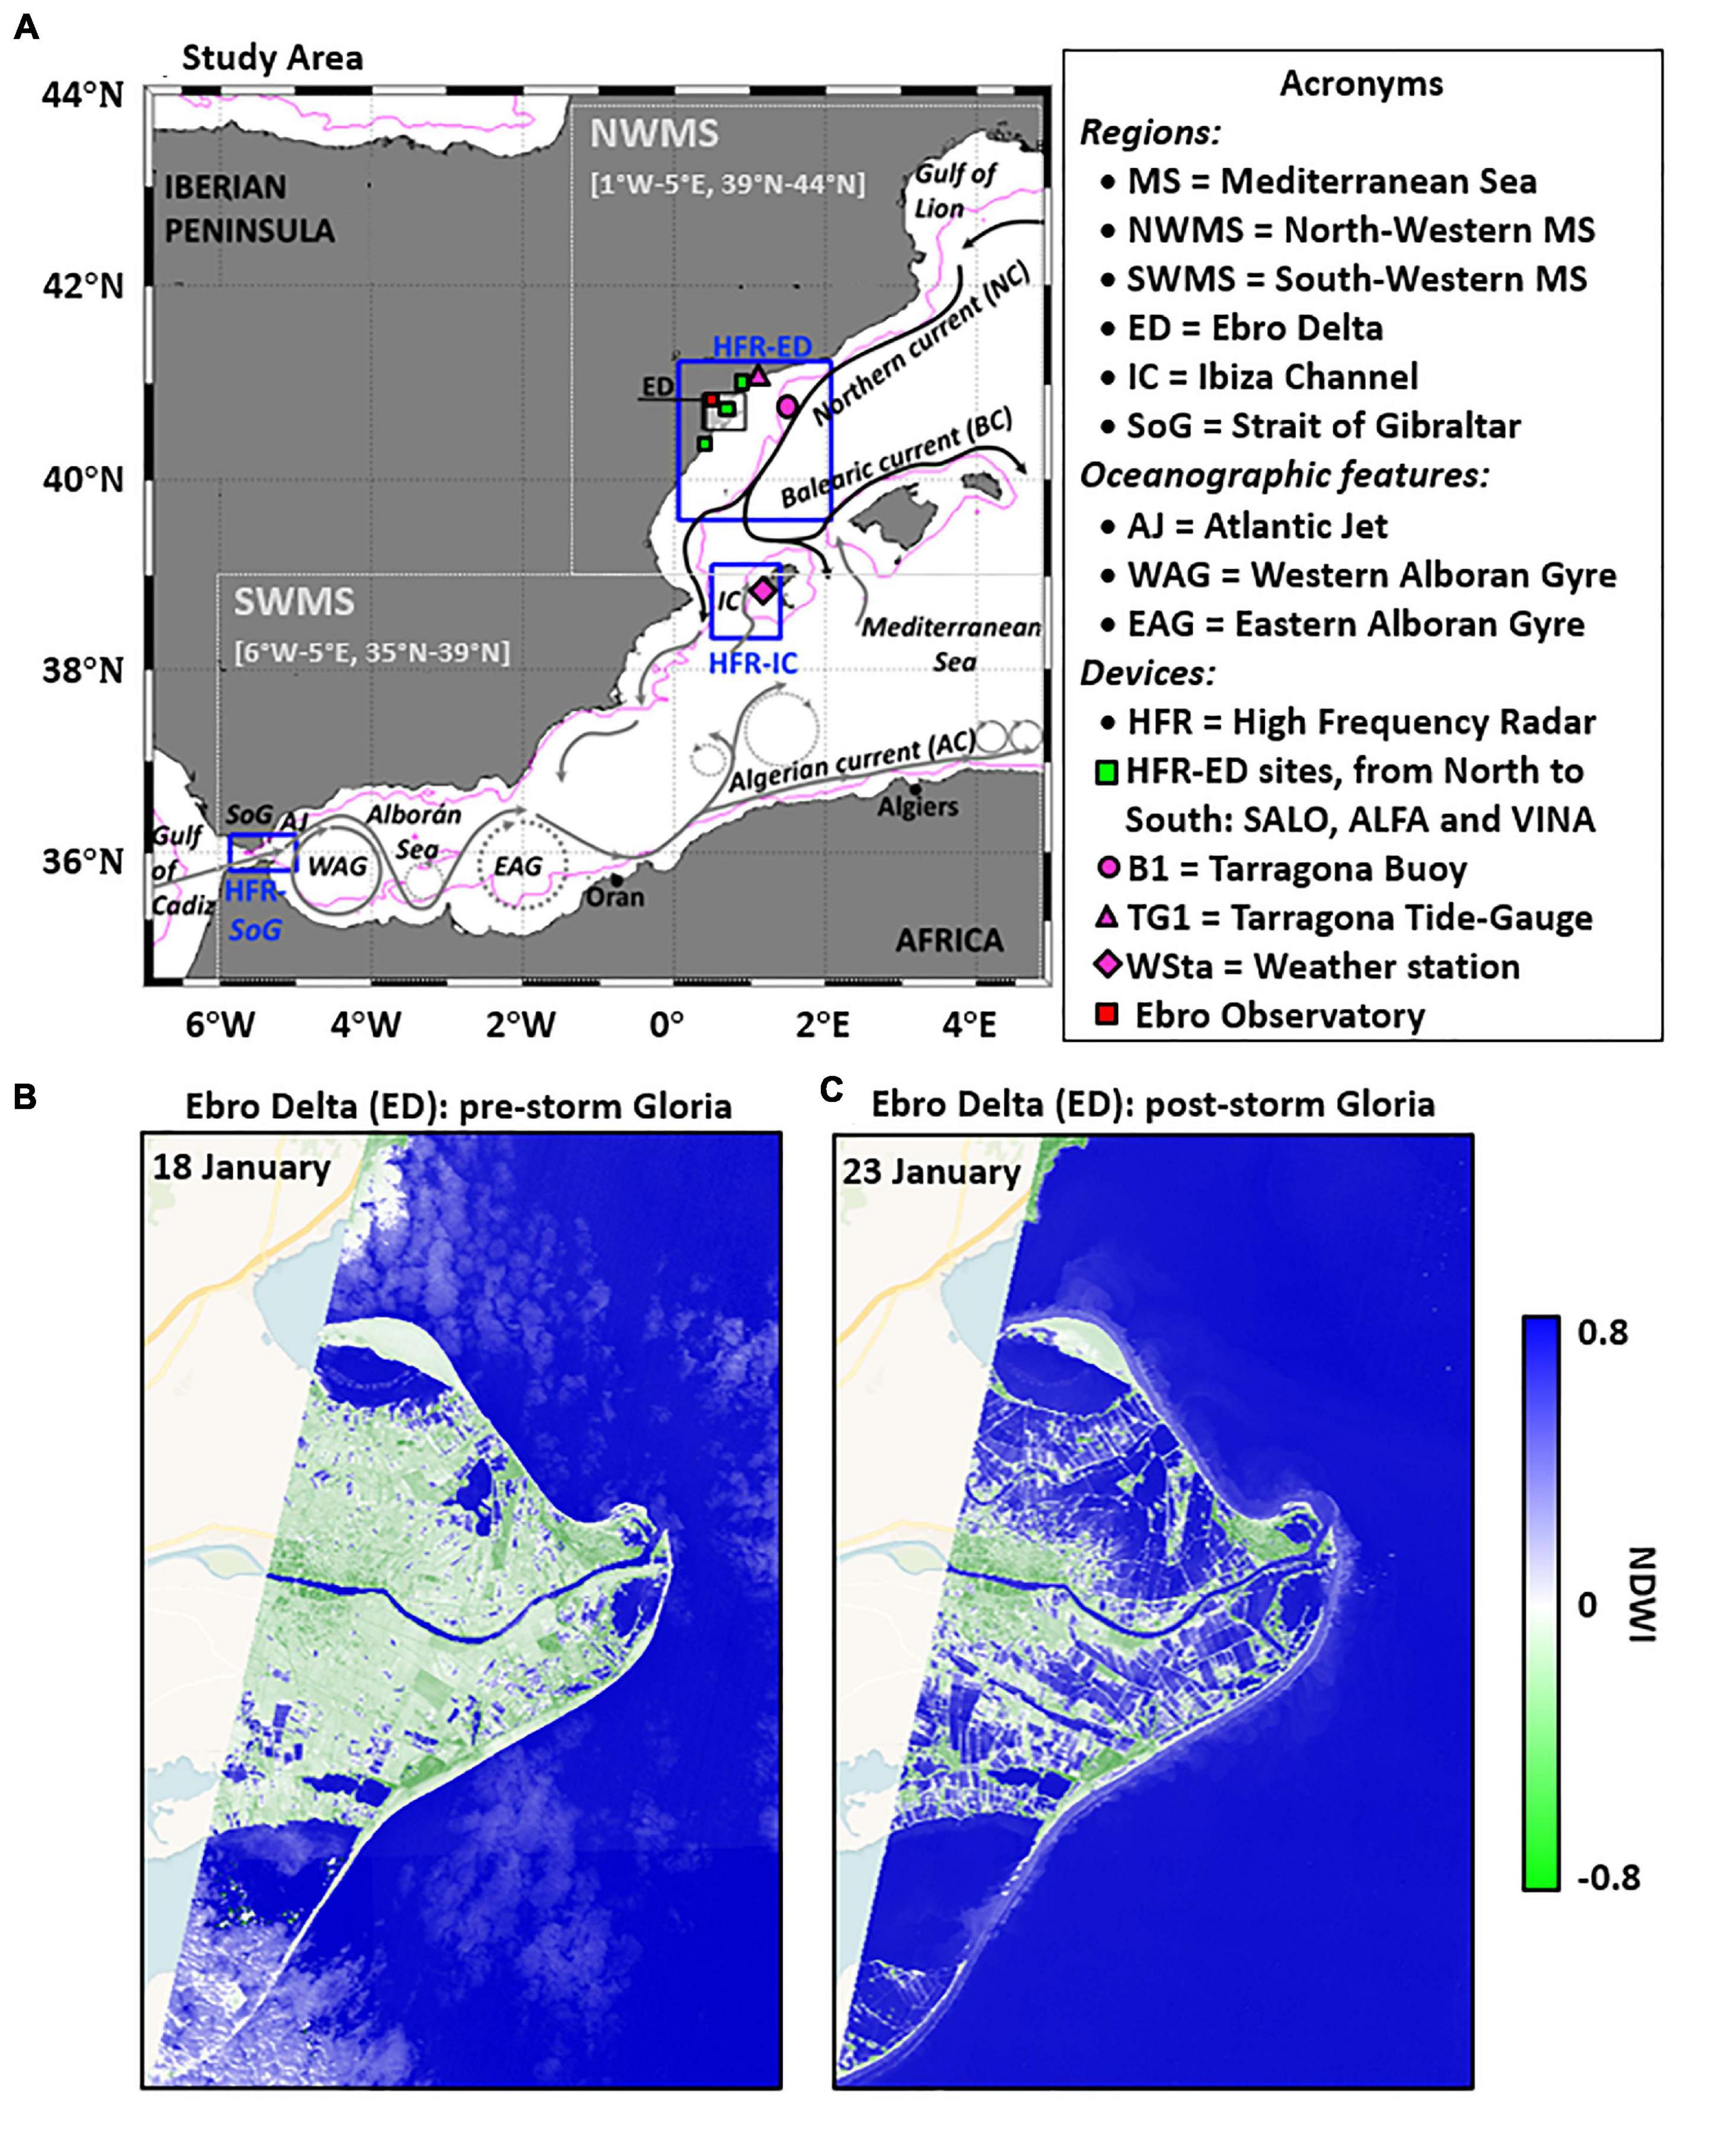
Figure 1. (A) Map showing the main features of the surface circulation in the Western Mediterranean Sea (WMS). Acronyms definition provided on the right side. Blue boxes denote the footprint of three High-Frequency radar (HFR) systems; black box indicates Ebro Delta (ED) area. Bathymetric contour shows depth at 400 m. Dashed gray boxes denote the Northern and Southern WMS sub-basins. Green squares denote HFR-ED sites. Pink triangle, dot, and diamond represent Tarragona tide-gauge (TG1), Tarragona deep buoy (B1), and Ibiza Weather Station (WSta), respectively; (B,C) Daily maps of the Normalized Difference Water Index (NDWI) in the Ebro Delta for January 18 (B) and 23 (C) 2020, as derived from Sentinel-2 L1C mission (freely available at https://www.sentinel-hub.com/explore/eobrowser/).
Thus, gaining insight into the underlying physical processes behind storm Gloria is imperative to facilitate a high-stakes management of this vulnerable deltaic system. To this aim, a variety of Copernicus Marine Environment Monitoring Service (CMEMS) modeling and observational products were used in an holistic approach, integrating outcomes from Iberia-Biscay-Ireland (IBI) ocean forecast system (Sotillo et al., 2015) with in situ observations and remote-sensed estimations of the sea state collected by three HFRs. Motivated by the significance of the record-breaking Gloria event, this work pursues several interrelated goals:
(i) Examine the fingerprint of storm Gloria as an extreme metocean event over the WMS. Since hydrodynamic variables are interconnected, the isolated analysis of a single extreme in one specific location would have been insufficient to comprehensively characterize the large-scale impact of Gloria. To this aim, the prevailing atmospheric conditions that led to this exceptional storm were briefly analyzed at synoptic scale. Besides, the 99th percentile of several parameters (wind speed, significant wave height, wave period, surface current velocity and total sea level) was derived from long-term observational time series to evaluate this episode from a wider panoramic perspective, providing meaningful insights on the behavior of extremes with respect to the mean values.
(ii) To quantify the ability of the HFR to accurately characterize the striking features of this episodic storm in the periphery of the Ebro Delta (ED), in contraposition to earlier investigations focused on the long-term skill assessment during “standard” metocean conditions (Lorente et al., 2015). The analysis was conducted separately from both waves and circulation aspects, despite the growing consideration given to wave-current interactions (Zeng et al., 2019).
(iii) To conduct a retrospective comparison of Gloria’s main features against those observed during a severe event occurred in January (19–24) 2017, hereinafter referred to as Jan2017. It was intended not only to put the impact of Gloria in a broader historical context, but also to disentangle the primary factors that triggered an episode of such magnitude.
(iv) To identify, from an Eulerian perspective, the strengths and shortcomings in IBI model performance during storm Gloria. To this end, HFR-derived currents were compared against the 5-day-ahead forecast of IBI. Time-averaged maps of surface circulation, superimposed with fields of IROS, were derived to resolve flow features and identify areas of elevated particles dispersion, respectively. IROS is suitable kinematic diagnostic for quick assessing short-term particles transport, with direct implications in the connectivity between offshore and coastal waters though the cross-shelf exchange of passive tracers (Archer et al., 2015).
(v) To elucidate the remote impact of Gloria on the large-scale dynamics between interconnected sub-basins within the WMS. Surface current maps from two additional HFR networks, deployed in immediate choke points like the Ibiza Channel and the Strait of Gibraltar (Figure 1A), were evaluated for this purpose. Likewise, the spatio-temporal variability of the surface circulation was interpreted according to existing forcing mechanisms.
(vi) To analyze the three-dimensional response of the upper ocean to the storm-induced wind forcing. Variations in the mixed layer depth and meridional circulation, derived from IBI numerical simulations, were examined to get a seamless predictive picture of the ocean state at different depth levels, complementing thereby the goal described in (i). Since the 3D forecasting capabilities of IBI have been extensively assessed (Mason et al., 2019; Sotillo et al., 2021a), a comparative analysis against previously reported extreme events might aid to better quantify the relative magnitude of Gloria.
Note that this manuscript, albeit mainly focused on HFR technology, is part of a multidisciplinary series of works focused on diverse aspects of storm Gloria. The paper is organized as follows: section “Study Area” describes succinctly the study areas. Section “Materials And Methods” outlines the observational dataset, the hydrodynamic model set-up, and the methodology used. Section “Results” provides the results of this investigation. Finally, a detailed discussion and the main conclusions are presented in section “Discussion and Main Conclusions.”
Study Area
Western Mediterranean Sea
The Mediterranean Sea is a semi-enclosed basin connected to the Atlantic Ocean by the Strait of Gibraltar (SoG in Figure 1A). The overall picture of the Mediterranean circulation, which exhibits a strong seasonal and inter-annual variability, is composed of multiscale interacting structures. The large-scale thermohaline circulation is interconnected with recurrent sub-basin gyres and energetic mesoscale eddies, which are in turn bounded by current meanders and bifurcating jets (Millot and Taupier-Letage, 2005). The rugged configuration of narrow shelf areas, with steep continental breaks, entails the intrusion and direct impact of the large-scale flow on the coastal dynamics. The WMS, approximately comprising 35–44°N and 6°W–5°E (Figure 1A), is characterized by a predominantly cyclonic surface circulation. The circulation in the southern WMS is dominated by the two-layer baroclinic exchange throughout the SoG. In the upper layer, the fresher surface Atlantic Jet (AJ) flows eastwards into the Alboran Sea. At lower levels, saltier Mediterranean water outflows into the Atlantic Ocean. The AJ intensity and direction are modulated at different temporal scales by fluctuations of the sea level pressure (SLP) and local zonal winds over the WMS and the SoG, respectively. Both meteorological forcings drive: (i) the intensification of the surface inflow under prevailing westerlies, with north-eastward current pulses often exceeding 200 cm s–1 in the narrowest section of the strait (Lorente et al., 2019a); (ii) the weakening of the AJ intensity, its veering to the south and its occasional interruption under intense and persistent easterlies. The AJ feeds the permanent Western Anticyclonic Gyre and the weaker and semi-permanent Eastern anticyclonic Gyre (Figure 1A). Further to the east, the circulation is dominated by the energetic Algerian Current, flowing eastwards along the African coast, between Oran and Algiers (Arnone et al., 1990). The northern WMS is governed by the Northern Current, which flows southwestward along the eastern Iberian coast from the Gulf of Lions. In the Ibiza Channel (IC), the Northern Current splits into two branches: one flows southward along the Iberian continental shelf slope and the other flows northeastward, forming the Balearic Current. The circulation in the IC is governed by the meridional exchange between the saltier and colder Northern Current waters and the fresher and warmer Atlantic waters, being its variability mainly driven by local winds (Lana et al., 2016). Thus, the IC acts as a key circulation choke point connecting the northern and southern WMS sub-basins under strong topographic constraints.
In particular, the Mediterranean Sea basin has been the subject of abundant studies due to its vulnerability to sea-level rise and other related multi-hazards threads, among others: extreme storm surges (Lin-Ye et al., 2020), coastal erosion, inundation (Wolff et al., 2018), or rogue waves (Cavaleri et al., 2012). A renewed interest in Mediterranean hurricanes (the so-called “Medicanes”) has also raised due to the severe coastal impact of these intense mesoscale vortices, with a cloud-free eye around the center, that closely resemble tropical cyclones (Milglietta and Rotunno, 2019; Kassis and Varlas, 2021). In this regard, increasing threats to coastal and underwater cultural heritage have been recently reported (Reimann et al., 2018). Additional environmental affairs in the Mediterranean Sea include the proliferation of harmful algal bloom episodes due to an excessive enrichment of surface waters inshore (Ferrante et al., 2013), ocean acidification due to carbon dioxide uptake (Hilmi et al., 2014; Lacoue-Labarthe et al., 2016) and extreme marine heat waves (Darmaraki et al., 2019; Garrabou et al., 2019).
Ebro Delta
The ED, one the largest (320 km2) and most biodiverse aquatic ecosystems in the WMS, is located in the NE coast of Spain (Figure 1A), approximately at 40.5°N–40.8°N, 0.6°E–0.9°E. Since the 1960s, the delta has experienced a progressive reduction on the sediment budget due to many reservoirs that regulate the river basin. Besides, the ED shoreline undergoes high erosion rates because of a wealth of marine processes, such as the wave action over exposed wetlands (Palanques and Guillen, 1998). The predominant circulation in the Ebro continental margin is characterized by the presence of the along-shore Northern Current flowing southwestwards, but can be modified by frontal instabilities, meanders and eddies (Grifoll et al., 2015). The mean current speeds are relatively low (10–20 cm s–1) in this microtidal environment, increasing during October–May due to the intensification of both the local wind and the mesoscale activity (Lorente et al., 2016a). The ocean dynamic in the inner-middle shelf is modulated by: (i) the local topography (sharp bathymetric gradients in the north, widening of the shelf and the abrupt change in the continental slope direction in the south); (ii) the seasonal variability of Ebro river freshwater discharge, which induces a steady density front between light coastal waters and dense warmer open sea waters (Salat et al., 2002). Furthermore, ED is a wave dominated coast where the mean wave period is usually low (Sánchez-Arcilla et al., 2008). Strong northwesterly winds typically induce waves that propagate offshore, although waves from the east and the south are also significant.
Materials and Methods
High Frequency Radar
Fundamentals and Networks Employed
The HFR land-based remote sensing technology is based on measurements of the radiowave-backscattered signal from ocean surface gravity waves in the 3–30 MHz range of the electromagnetic spectrum (Crombie, 1955). SeaSonde “direction-finding” HFR systems (Barrick et al., 1977), manufactured by CODAR Ocean Sensors, measure the return signal continuously over all angles, exploiting the directional properties of a collocated three-element receive antenna system to infer the direction of the incoming signals. While fine-resolution maps of the surface circulation are obtained from the Doppler shift of the predominant first-order peaks in the sea-echo Doppler spectrum, wave parameters are deduced from the weaker and noiser second-order peaks. When wave heights exceed the predefined saturation limit of the HFR, the first and second-order peaks merge and interpretation of the spectra becomes impossible (Lipa and Nyden, 2005).
Radial current vectors (moving toward or away from two or several sites), falling within a search radius predefined by the manufacturer, are geometrically combined to determine hourly total current vectors on a regular grid. To this aim, an unweighted least squares fitting (LSF) algorithm is applied (Barrick and Lipa, 1986). Additionally, half-hour wave estimations are extracted along several annular rings (circular concentric range arcs) centered in each of the HFR sites. To this end, CODAR proprietary software performs a LSF technique between the second-order radar spectrum and a Pierson-Moskowitz with cardioid directional function model. Supplementary information about HFR theory and applications can be found in Paduan and Washburn (2013).
The technical characteristics of the three operational SeaSonde HFR systems employed in this work, which monitor strategic coastal areas of the WMS: ED, IC, and SoG (Figure 1A), are shown in Table 1.
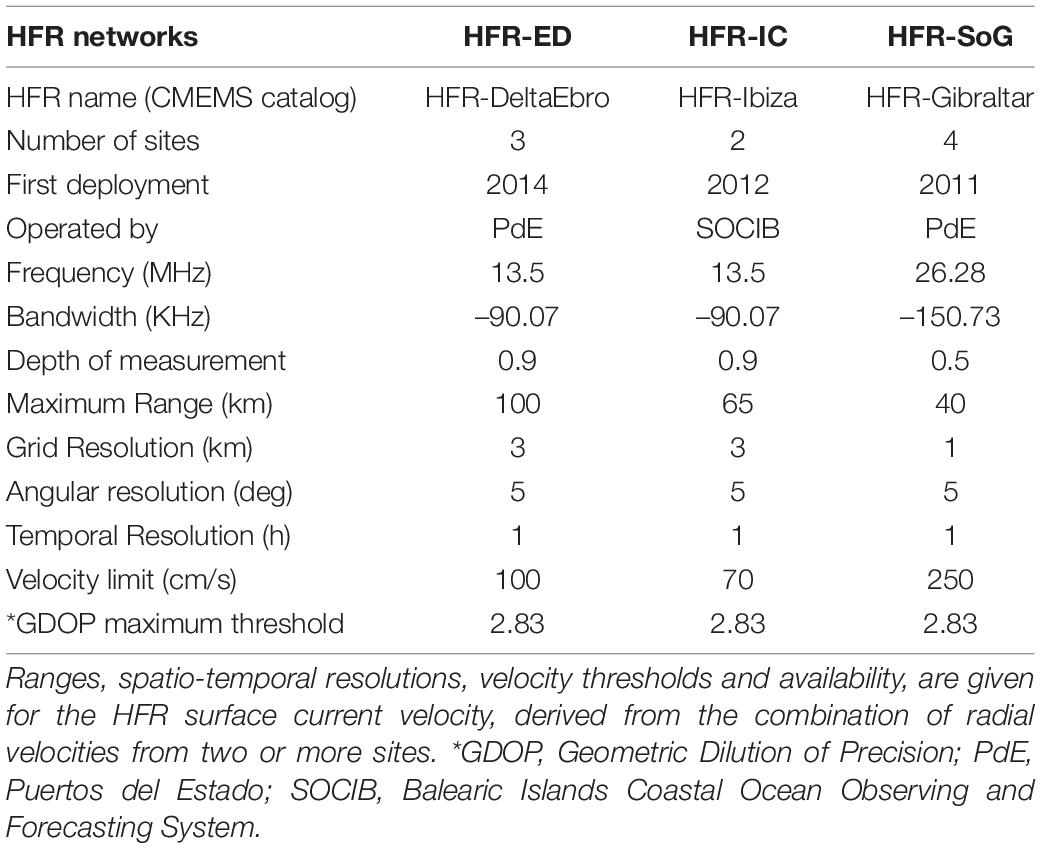
Table 1. Technical specifications of the SeaSonde HFR systems used in this work.
HFR Current Data Treatment
Hourly HFR surface current observations were collected in near real-time by the respective operators (Tab1e 1), and then quality controlled, flagged and format-standardized by the European HFR node (Mantovani et al., 2020). The dataset is routinely delivered through the CMEMS In Situ Thematic Assembly Center (CMEMS-In Situ TAC).
The spatially averaged data availability was above 70% during January 2020, with higher (lower) availability in the center (borders) of each HFR domain. The three HFR systems were closer to fulfill the required 80–80% recommended level of data provision in January 2020 (Roarty et al., 2012), with a 63% (HFR-ED), 73% (HFR-SoG), and 78.48% (HFR-IC; Tintoré et al., 2020) of the areal footprint (referred to its maximum extent) available the 80% of the time. These figures reveal that the three HFR systems operated within acceptable ranges, despite the lower percentages of HFR-ED due to the 4-day outage of VINA southern site during Gloria’s passage. Although the spatial coverage of HFR-ED was reduced by approximately 40% during VINA outage, the surface circulation was properly monitored by the two remaining sites ALFA and SALO (Figure 1 and Table 1).
Furthermore, the specific geometry of the HFR domain handicapped the accuracy of the total current vectors resolved at each grid point. Such a source of uncertainty is quantified by the Geometrical Dilution of Precision (GDOP), a dimensionless parameter that typically increases with distance to HFR sites (Chapman and Graber, 1997). A cutoff filter was imposed for the GDOP of each system (Table 1), to remove those estimations affected by higher uncertainties.
HFR Wave Data Treatment
In this work, only wave estimations from ALFA site (which belongs to the HFR-ED system) were analyzed. Significant wave height (SWH), centroid wave period (Tc), and mean wave direction (Wd) were retrieved from nine individual range arcs, assuming homogeneity over the whole of each circular arc. Time series were obtained directly by two different versions of CODAR wave processing tool: SeaSonde Radial Suite Software Release 7 (R7) and Release 8 (R8). A number of improvements were incorporated in R8, namely: (i) the wave inversion model now uses directional antenna patterns measured with a signal source when available, rather than the default “ideal” sinusoid shaped patterns; (ii) the bearings over which the antenna pattern is applied to sea echo can now also be tailored on a per range cell basis to accommodate situations where coastlines significantly curve over the footprint of the wave measurement range; (iii) transitions to offshore wind and wave fields are handled better with a new offshore wind detection method; (iv) lastly, a new wave filtering software module was added to screen outliers using time-based and range-based filters, some commonly used on buoys, and some HFR-specific filtered parameters.
Half-hour wave data from ALFA site were collected from nine range arcs for the same 3.5-day period of January (19–22) 2017 and 2020. This common time frame of 3.5 days was adopted to capture the entire wave field evolution: pre-storm conditions, peak and relaxation phase. The three first arcs, closest to ALFA site, were not considered since very shallow water (30 m depth or less) impacts on radar sea-echo by decreasing the saturation limit on wave height as ocean depth decreases (Lipa et al., 2008). An additional dataset was generated by averaging contributions from each arc (4–9) for every time step (Arcs 4–9). HFR data were subsampled at a 60-min interval and quality controlled to provide consistency for the analysis. The spike test, stuck value check, or rate of change on time, among others, were performed to filter inconsistent values.
In situ Data
The spatial coverage of HFR-ED includes the Tarragona Seawatch buoy (40.68°N, 1.47°E, 688 m depth), hereafter referred to as B1 (Figure 1A). This instrument, deployed since August 2004, is equipped with an acoustic point-wise current meter which provides hourly averaged current velocity vectors at a nominal depth of three meters, with an instrumental error below 0.5 cm s–1. A wind speed and direction sensor, manufactured by R. M. Young Company, measures mean hourly wind data (computed from 5 min recording) at a height of 3 m. Likewise, hourly averaged quality-controlled measurements of SWH, Wd, mean wave period (Tm), and wave period at spectral peak (or peak period, Tp) were provided by a directional Waverider sensor.
Hourly averaged observations of the sea surface height were provided by Tarragona tide gauge (41.08°N, 1.21°E), denoted as TG1 in Figure 1A. This radar-type station, manufactured by Miros and deployed since 2011, has a 1-min data sampling.
A Vaisala WXT520 automatic weather station (WSta in Figure 1A), installed at Puig des Galfí (Ibiza), provided a number of meteorological parameters in near real-time, encompassing hourly atmospheric SLP, wind speed, and direction.
CMEMS IBI Circulation Forecast System
The CMEMS IBI v4 operational suite, which consists of a NEMO model application (Madec, 2008), runs freely on a daily basis over a regional grid with a horizontal resolution of 3 km and 50 unevenly distributed vertical levels. A five-day ahead forecast is produced for a number of hydrodynamic variables, among others: temperature (TMP), salinity (SAL), mixed layer depth (MLD), zonal (U) and meridional (V) velocity currents, and sea surface height (SSH). Note that MLD is based on the criterion proposed by Kara et al. (2000) and defined as the ocean depth at which the density has increased by 0.01 kg m–3 relative to the near-surface value at 10 m depth.
While hourly-averaged estimates are provided for the sea surface, daily averaged values are computed through the three-dimensional water column in the entire IBI regional domain. Hourly 3D physical forecast data, covering exclusively the continental shelf, are additionally delivered to foster the dynamical downscaling for tailored downstream services at coastal scales. The system is driven every 3 h by high resolution (1/8°) atmospheric forcing provided by the European Center for Medium-Range Weather Forecast (ECMWF). Lateral open boundary conditions, imposed from daily outputs from the parent system (CMEMS GLOBAL), are complemented with 11 tidal harmonics built from FES2004 (Lyard et al., 2006) and TPXO7.1 (Egbert and Erofeeva, 2002) tidal model solutions. The climatological freshwater discharges are prescribed through 33 points corresponding to the main rivers present in the IBI area. Further technical specifications of IBI can be found in Sotillo et al. (2015).
The accuracy of IBI ocean forecast system is routinely evaluated by means of the NARVAL (North Atlantic Regional VALidation) web-based toolbox (Lorente et al., 2019b). Multi-parameter comparisons against observational sources, encompassing both in situ (buoys, tide-gauges, drifters, gliders, and argo profilers) and remote-sensing (satellite and HFR) platforms, are regularly conducted to achieve a comprehensive 3D skill assessment. A variety of skill metrics are computed and later delivered in the QUality Information Document (QUID; Sotillo et al., 2021a) to inform end-users about IBI predictive capabilities. The performance of IBI in the WMS has been previously evaluated not only at the sea surface (Lorente et al., 2016a, b) but also in the 3D water column (Mason et al., 2019). Furthermore, MLD estimations provided by IBI have been successfully used to characterize coastal upwelling and other upper-ocean properties (Bessa et al., 2018).
Methods
Since not all extreme weather episodes necessarily have extremely adverse coastal impacts, there is not a unique protocol for their identification. An event is categorized as extreme when a single or several interconnected variables persistently exceed specific thresholds, which can be determined according to percentile-based values, fixed absolute values or return periods (Radović and Iglesias, 2018). We used the percentile method, which defines extreme events as the occurrence of values higher than the reference percentile 99% (P99) threshold for a certain number of hours. P99 and P99.9 values were computed on the whole time series of diverse hydrodynamic variables to comprehensively characterize the large-scale impact of Gloria (Table 2).
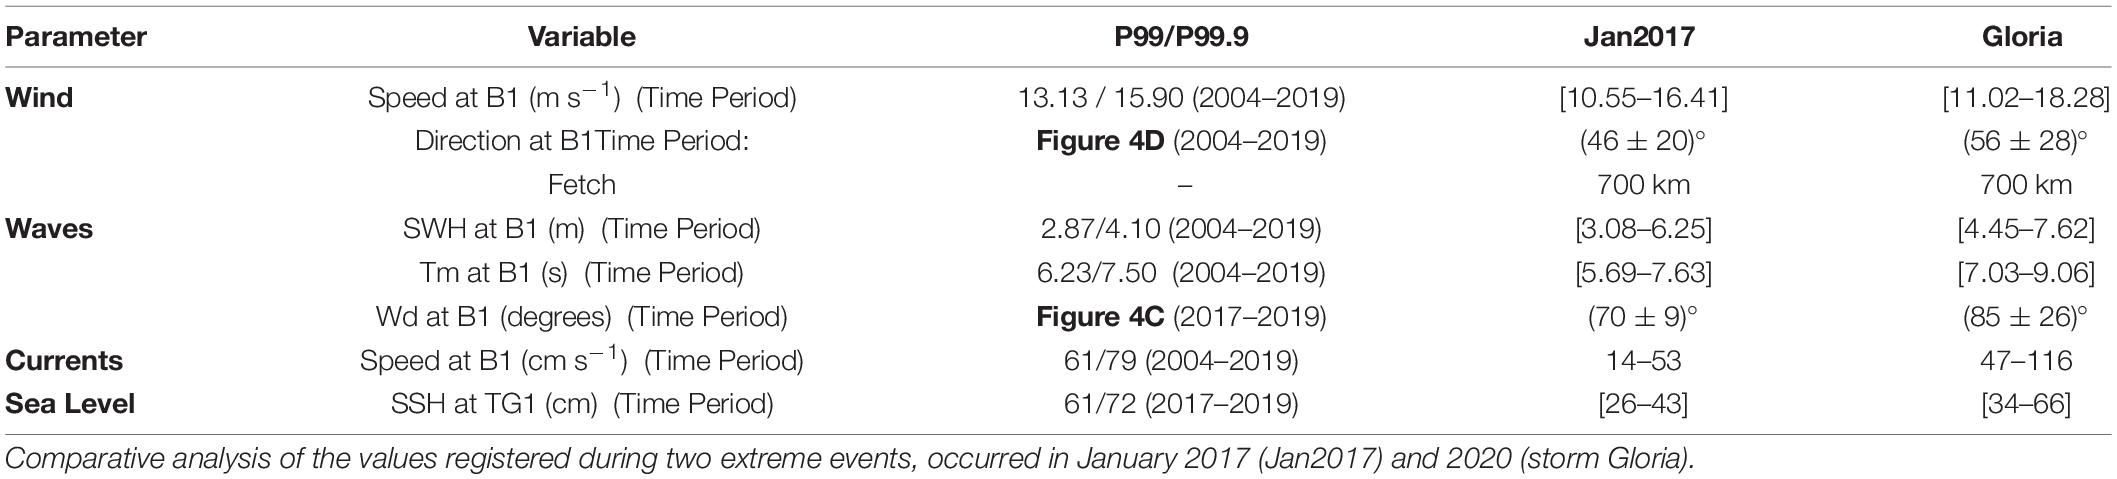
Table 2. Percentiles 99 and 99.9 of the main metocean variables measured at B1 buoy and TG1 tide-gauge (depicted in Figure 1A), computed for different time periods depending upon data availability.
In situ data time series were processed as follows: spikes or spurious values were discarded and occasional gaps were linearly interpolated to ensure the continuity of the records. Multi-parameter comparisons were conducted between HFR estimation, IBI outcomes and in situ observations to elucidate the skill of the former. The agreement between any two data sets was evaluated by computing the normalized root mean squared error (RMSEN) and a skill score (SS). The correlation coefficient was not calculated since it might be both oversensitive to extreme values and insensitive to proportional differences between model predictions and observations (Legates and McCabe, 1999). The dimensionless SS, previously proposed by Wilmott (1981) and widely used since then to assess the accuracy of hydrodynamic models against HFR estimations (O’Donncha et al., 2015, Vaz et al., 2018), can be defined as:
where the overbar denotes the mean of the dataset. While the highest value (SS = 1) means perfect agreement between IBI outcomes and HFR observations, a complete disagreement yields a skill score of zero. In this work, the SS was also calculated for different physical parameters, not only for surface currents.
High-frequency radar current estimations were bilinearly interpolated on the finer resolution IBI mesh to compare both datasets in a common regular domain. IBI model predictive capabilities 5 days ahead (IBI-FC05) were evaluated for U (zonal) and V (meridional) current speeds by means of maps of SS. Equally, SS was spatially averaged over the continental shelf and open waters to infer any potential difference in the model skill between both delimited areas.
The predominant circulation during storm Gloria was examined from an Eulerian perspective by means of time-averaged maps of surface currents and horizontal DIV. Localized areas of contraction and expansion of the flow can be inferred since positive (negative) DIV at the sea surface are typically associated with negative (positive) values at deeper levels and hence upward (downward) movement of waters. DIV is defined as follows:
Although the Lagrangian Coherent Structures approach has been successfully adopted for IBI outcomes (García-Sánchez et al., 2021), this technique can only be applied to HFR current data if the spatio-temporal coverage is complete. Given the occasional gappy nature of HFR estimations, the implementation of gap-filling methods such as self-organizing maps (SOMs) or open-boundary modal analysis (OMA) is a mandatory pre-requisite to compute trajectories of virtual particles in the flow (Hernández-Carrasco et al., 2018). By contrast, IROS is suitable kinematic diagnostic for quick assessing short-term particles transport from HFR-derived surface currents. It can be defined as the sum of DIV and total strain:
Instantaneous Rate of Separation determines how an infinitesimally small particle will be moved by an instantaneous velocity field. This Eulerian metric, which is equal to the finite-time Lyapunov exponent (FTLE) at time t = 0 (Futch, 2009 and 2019), has been successfully used in previous studies with HFR data (Schaeffer et al., 2017; Archer et al., 2015; Archer, 2016). While the FTLE unveils a variety of features that dominate over longer time periods, IROS indicates how the particles react in the selected moment, estimating particle separation from a snapshot without integrating the flow over time. Since IROS does not require gap-filling techniques or time integration, it can be considered a rapid, simple, easily interpretable diagnostic to examine transport characteristics in the vicinity of ED. High values of IROS indicate potential regions of elevated particle dispersion, which has relevant implications for cross-shelf exchange of passive tracers between offshore and coastal waters.
Results
Local Wave Field in the Periphery of ED
Storm Gloria impacted the WMS from January 19 to 24, 2020. A surface low developed over the entire western basin (Figure 2A) as a consequence of the so-called Rex Block, a large-scale blocking pattern characterized by two adjacent (northern) high and (southern) low pressure systems in upper atmospheric levels (Rex, 1950). This persistent dipole was visible for the whole investigation period, whereas it followed a clockwise rotation. During the first stage of the developing surface cyclone (January 19–20), an intense pressure gradient gave rise to very strong northeasterly winds (above 20 m s–1) that affected broad areas of the eastern coast of Spain (Figure 2B). Afterward (the January 21, not shown), the atmospheric pattern evolved towards a north-south oriented dipole, triggering a change to predominant easterlies blowing over the entire WMS. The Rex Block steadily weakened: while the northern high-pressure system fully dissipated by January 24, the weakened low remained for a few days at lower latitudes. Further details about the atmospheric conditions can be found in De Alfonso et al. (2021).
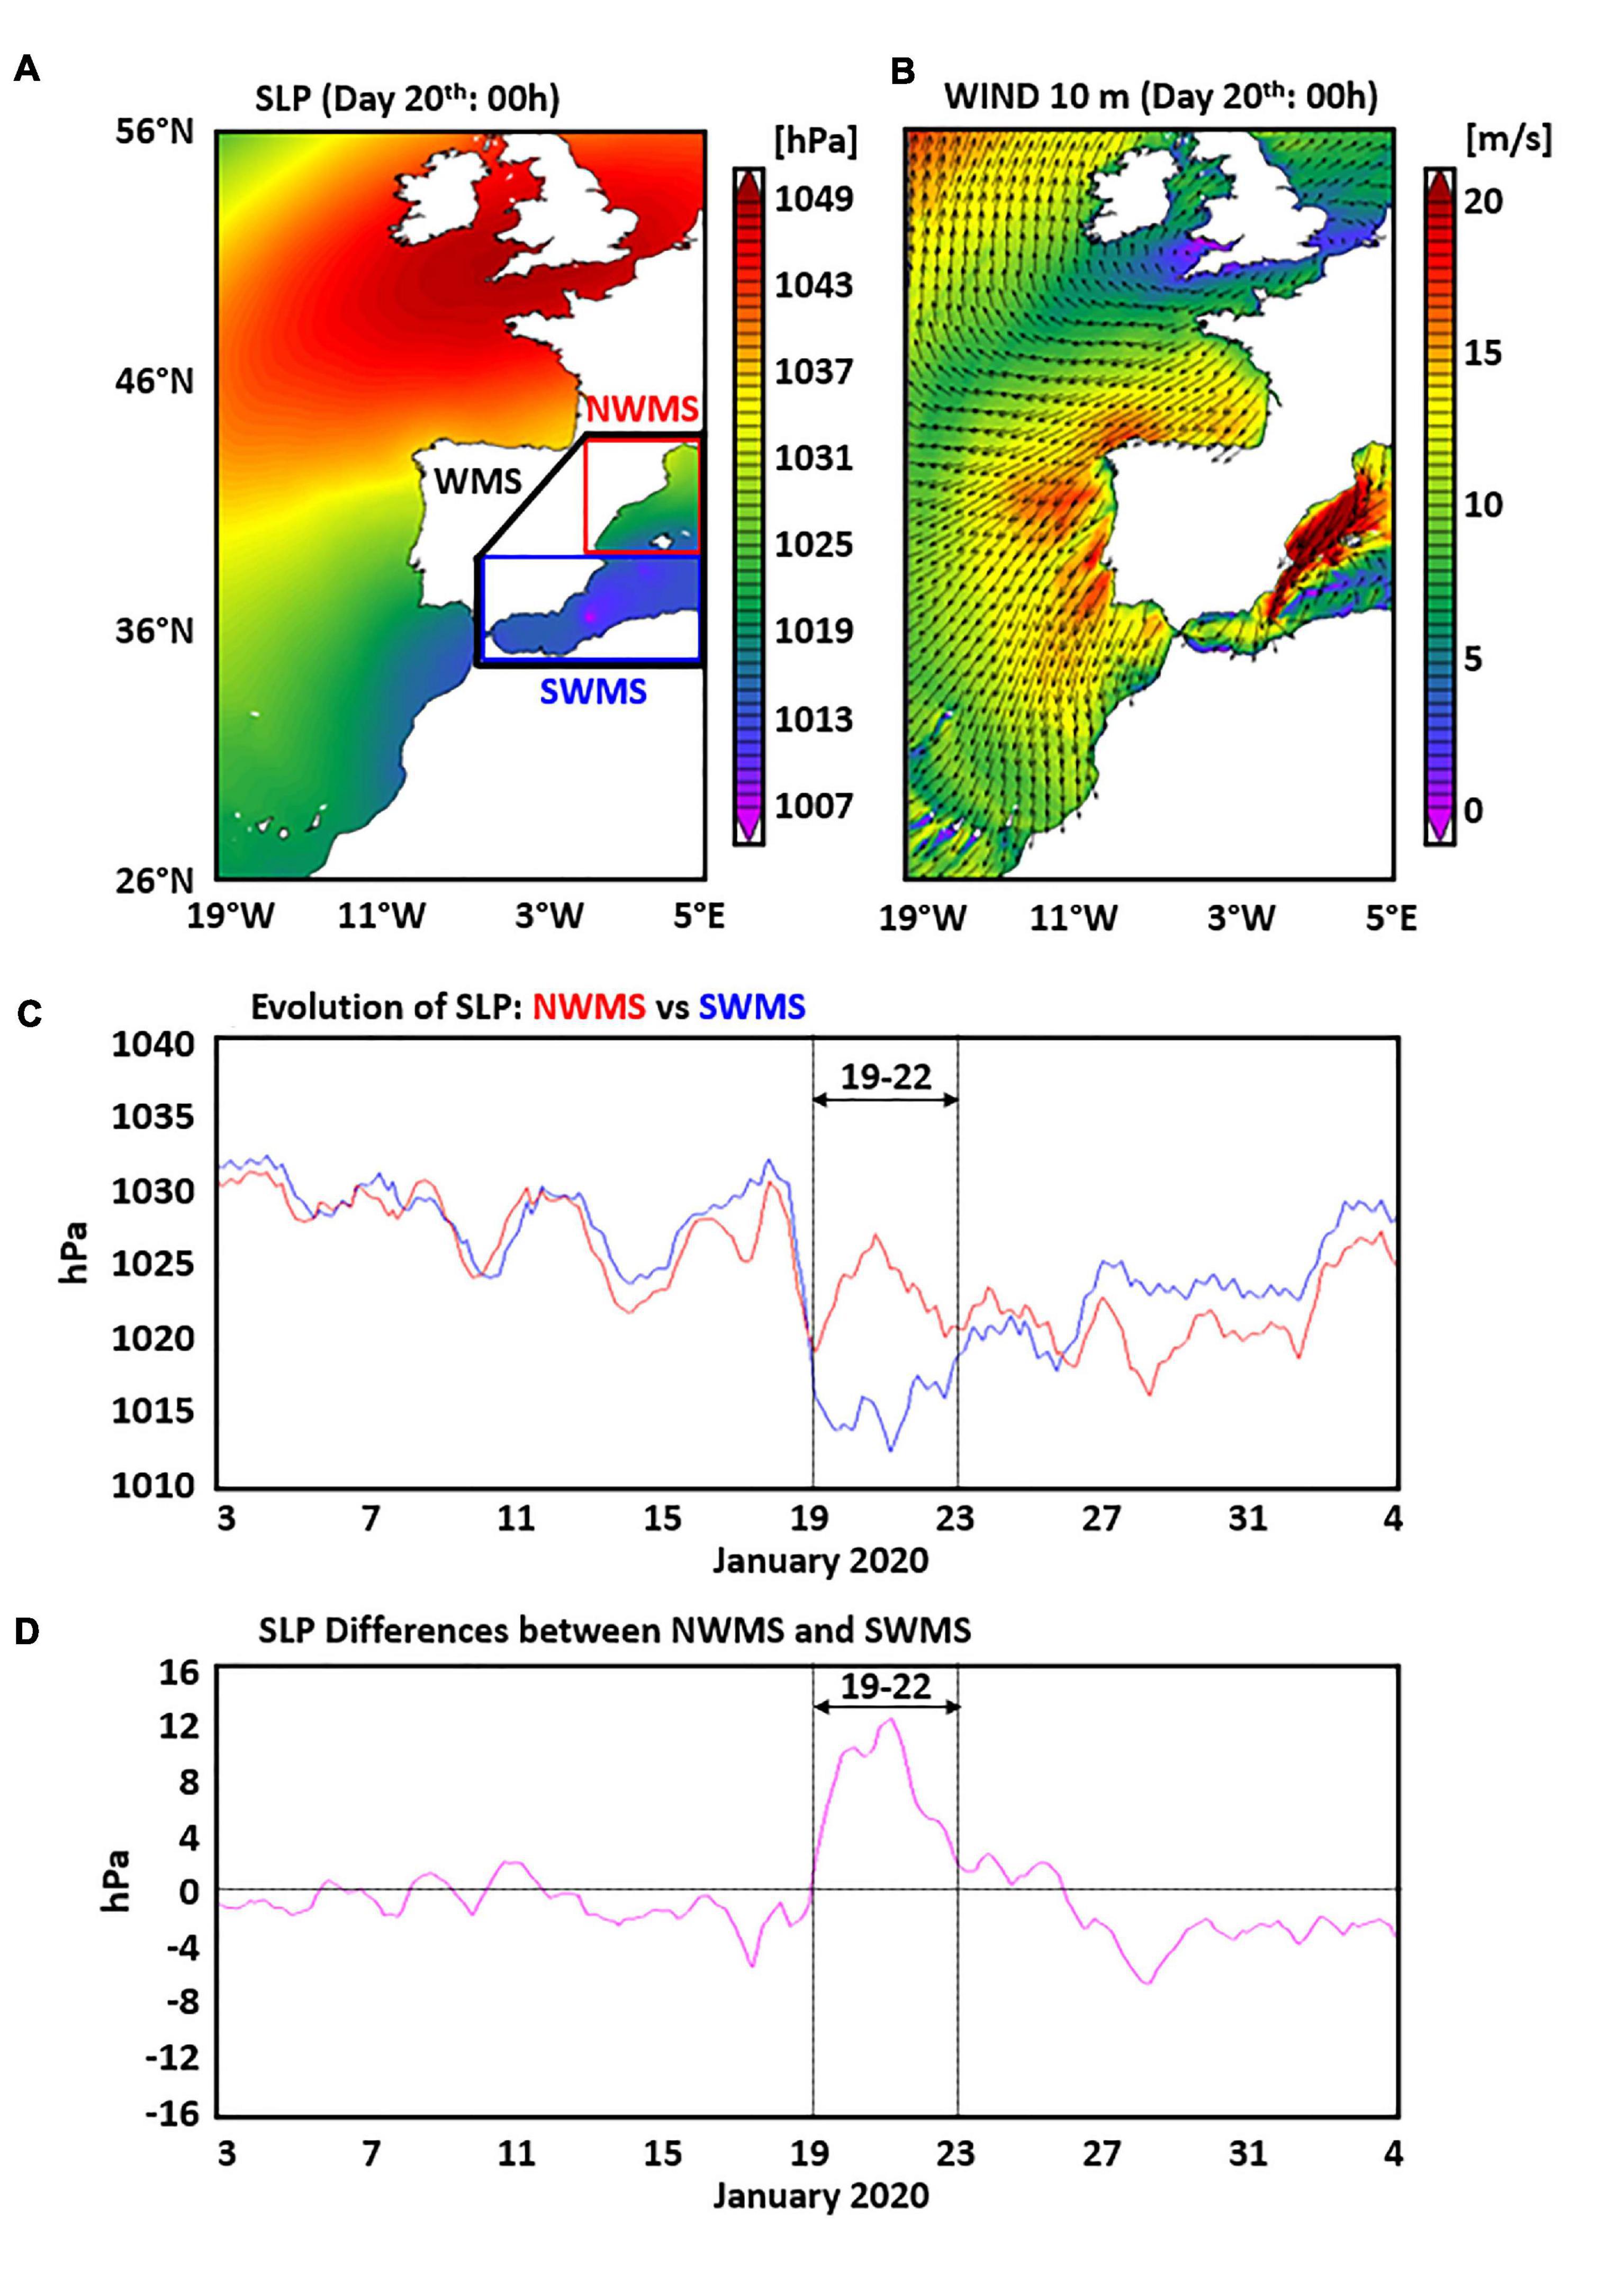
Figure 2. Hourly synoptic patterns (00h CET) of Sea Level Pressure (SLP) (A) and wind at 10 m (B) in the IBI (Iberia-Biscay-Ireland) regional domain during January 20 2020, as provided by the European Center for Medium-Range Weather Forecasts (ECMWF) at 1/8° horizontal resolution; (C) Blue (red) line represents the 3-hourly time series of SLP, spatially-averaged over the northwestern (sourthwestern) Mediterranean sea subbasin, denoted as NWMS (SWMS) in panel (A) and comprised between 1°W-5°E and 39°N-44°N (6°W-5°E and 35°N-39°N); (D) Time series of SLP differences between the NWMS and SWMS sub-basins.
Rather than the relatively deep system of low pressures over the WMS, the primary source of Gloria was the anomalously powerful anticyclone that governed central Europe, with SLP exceeding 1,050 hPa (Figure 2A). As the high system extended southeastwards over the Gulf of Lion, the pressure gradient between the northern and southern WMS sub-basins became stronger. Thus, the temporal evolution of the SLP (spatially averaged over each sub-basin, denoted in Figure 1A), rather constant during the first fortnight of January, was interrupted by an abrupt change the January 19 (Figures 2C,D). The SLP quickly decreased about 17 (10) hPa over the southern (northern) WMS. Whereas the SLP field kept on decreasing over the southern WMS in response to the low system migration to lower latitudes, SLP values suddenly started to increase over the northern WMS. During the night of January 20–21, both minimum and maximum SLP values were almost simultaneously reached in the southern and northern WMS sub-basins, respectively, with a net difference fairly above 12 hPa during the storm peak (Figure 2D). This dipole-like SLP structure weakened during the January 22 and mostly vanished by the January 23, with SLP differences remaining generally below 4 hPa (absolute value) afterwards, similar to pre-storm conditions.
With regards to the inclement metocean conditions forced by Gloria in the vicinity of ED, data collection at B1 buoy revealed that extreme northeasterly winds, above the P99.9 (15.9 m s–1, Table 2), were predominant during January 19 and part of the January 20 (Figure 3A). Although the wind speed sensor suffered a breakdown soon after the storm peak (day 20, 13 h), it seems reasonable to acknowledge that the P99.9 threshold was steadily exceeded over a long period of time (almost 24 h), hence inducing an exceptionally severe sea state (Figure 3B). The SWH recorded at B1 (blue line in Figure 3B) gradually increased from 3 m until reaching a peak of 7.62 m. After a moderate decay to 4.45 m (probably associated with the change in the predominant wind direction, shown in Figure 3A), a secondary maximum (6.56 m) was observed for the January 21 (11 h), once the wind started blowing again from the first sector (Figure 3A).
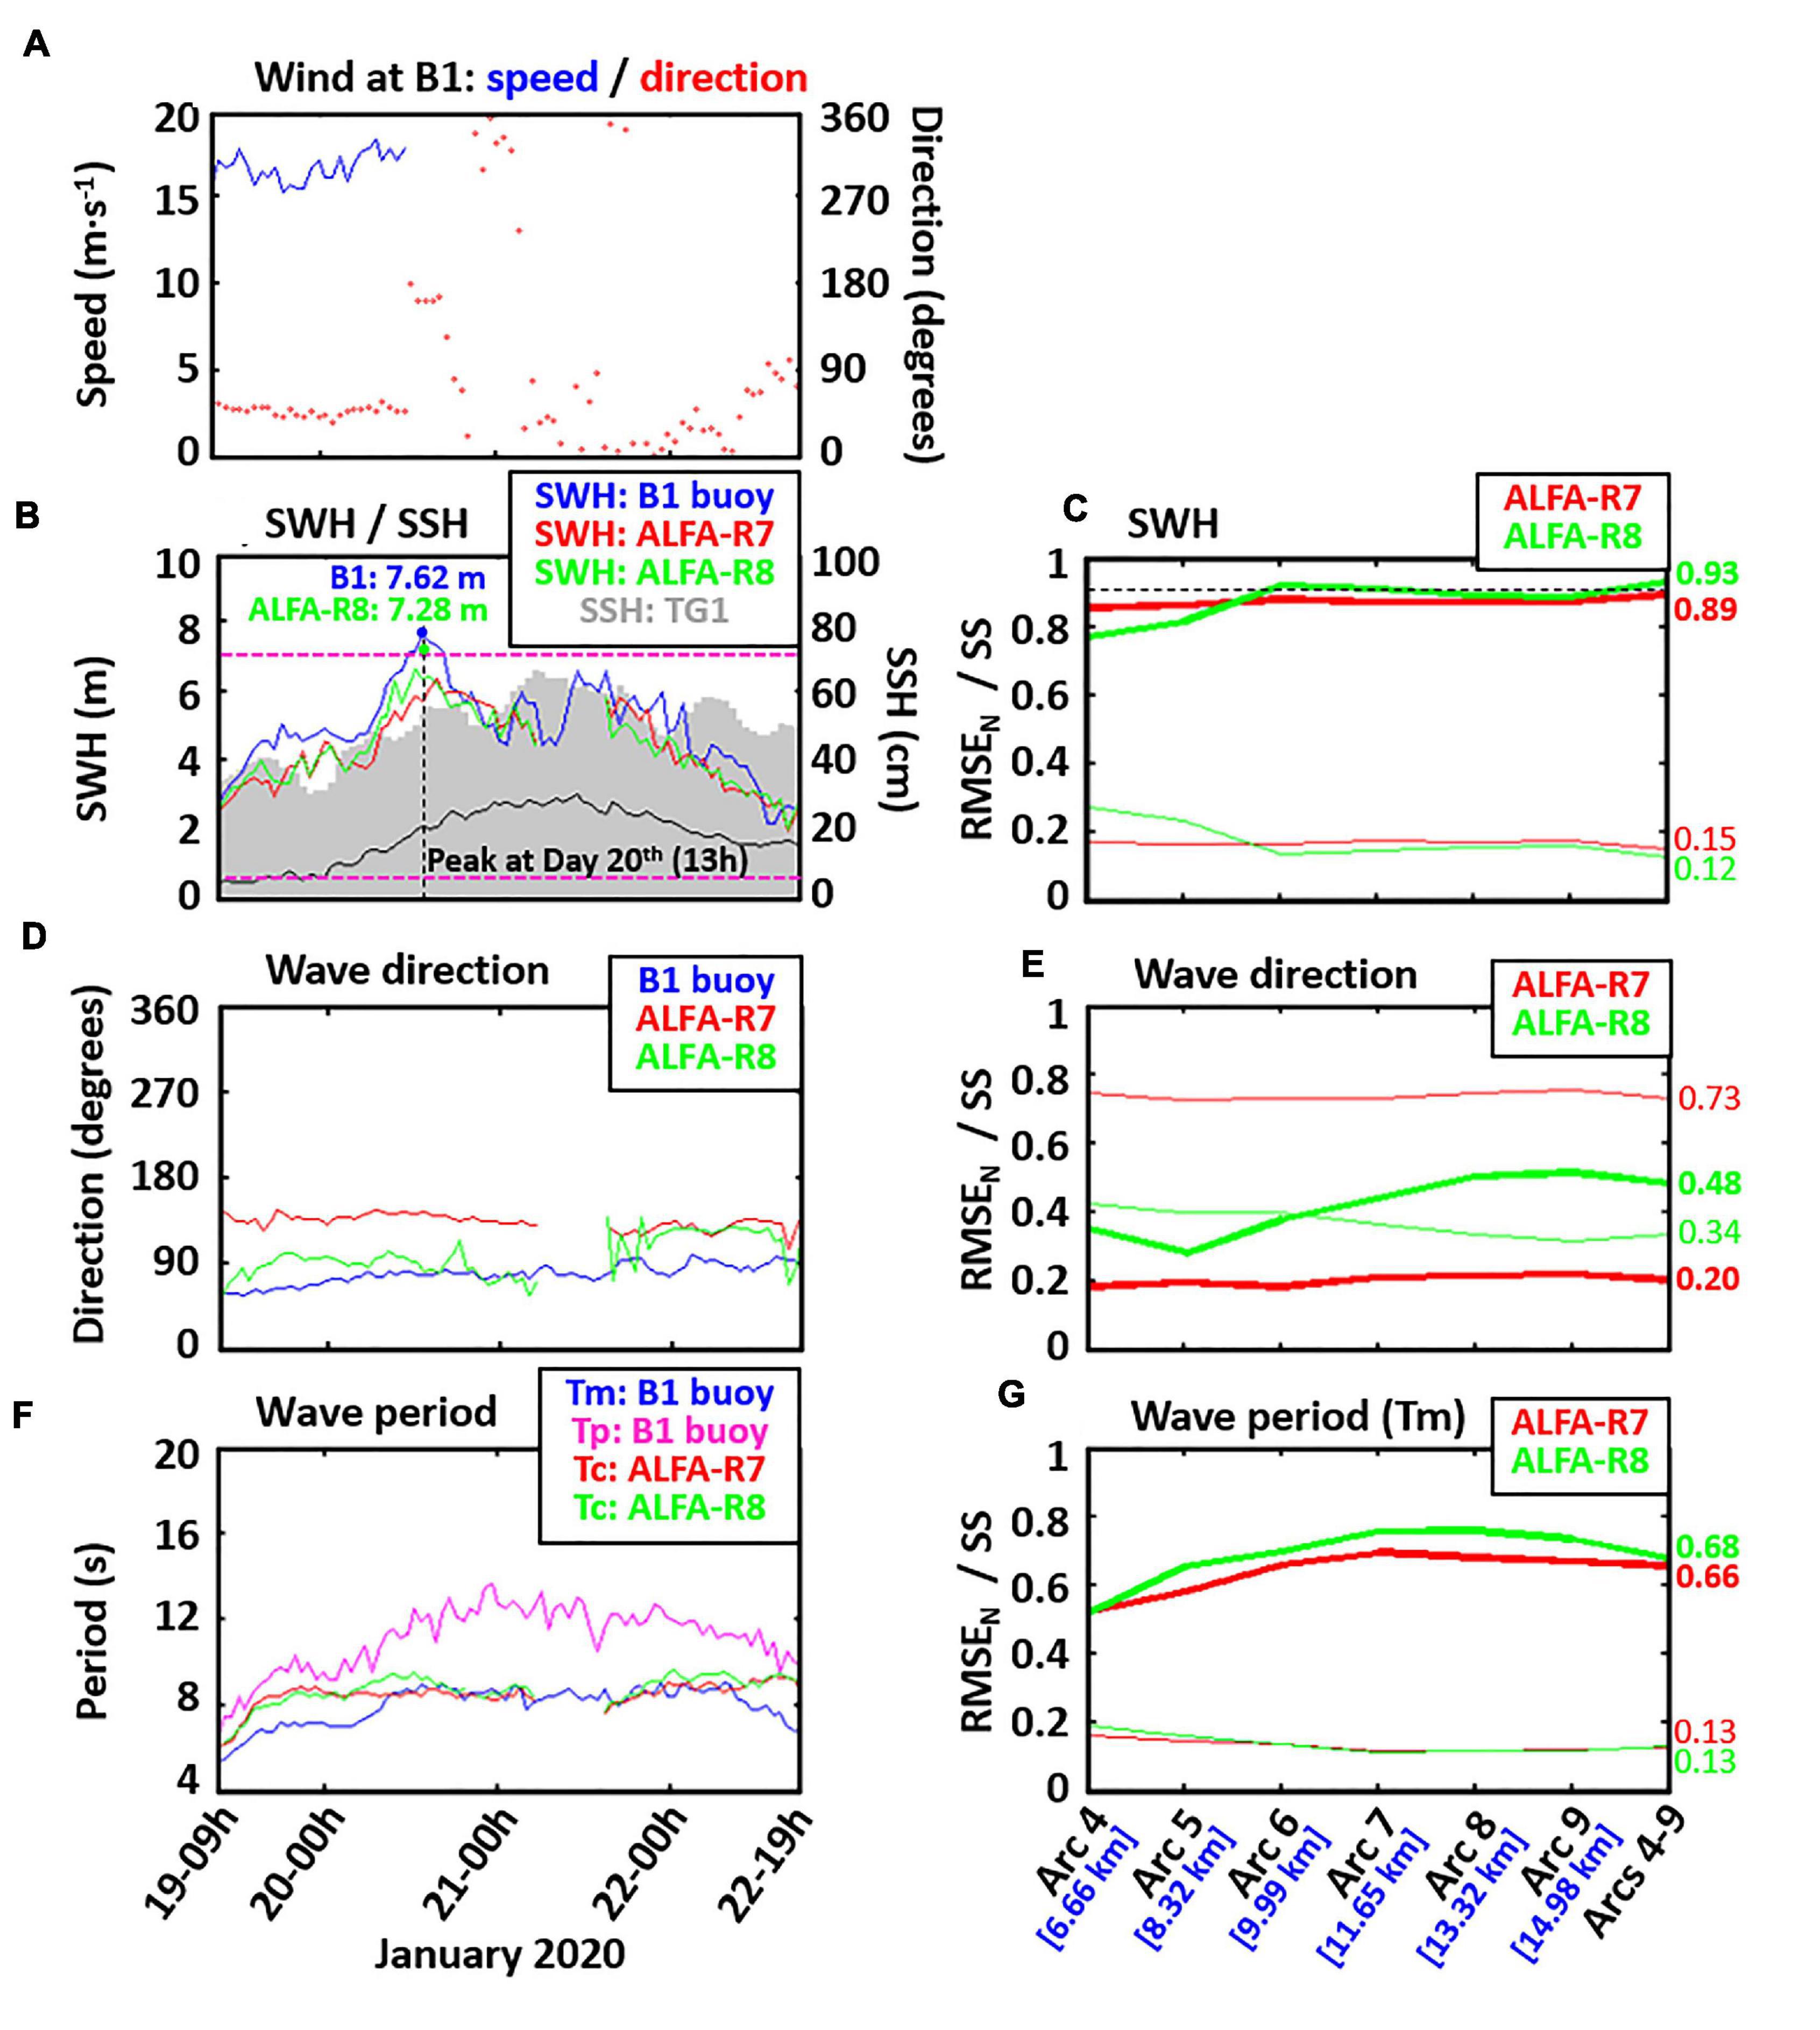
Figure 3. (A) Wind speed (blue line) and direction (red dots) measured at B1 buoy during the storm Gloria (3.5-day period); there was an outage in wind speed data collection after the storm peak; (B–G) Comparison of HFR-derived wave parameters (provided by ALFA site: Arcs 4–9) against hourly in situ observations from B1 buoy. Gray columns and the black line represent the hourly sea surface height (SSH) and meteorological tide recorded at TG1 tide-gauge, respectively. On the right, skill scores (SS, bold lines) and RMSEN (thin lines), obtained for each parameter at each selected HFR range arc. Arcs 4–9 represents an average of wave estimations from all those range arcs. Red and green lines indicate the skill metrics derived from HFR wave estimations obtained by using R7 and R8 CODAR software packages, respectively. Pink dashed lines in panel (B) represent the lower and upper thresholds for the significant wave height (SWH) data collection, according to the frequency (13.5 MHz) at which the HFR-ED operates.
The visual resemblance between in situ data and HFR-derived estimations of SWH (from ALFA site) is remarkably high, especially when using R8 SeaSonde software package (green line in Figure 3B) instead of the previous version R7 (red line). Thanks to the upgraded version, the peak was slightly better captured in terms of intensity (7.28 m) and timing. The SSH at TG1 tide-gauge showed a periodic zigzag increment as a result of the combined contributions of the atmospheric surge and the tidal oscillations (gray shaded bars in Figure 3B). The peak of SSH (0.66 m) was reached later, during the morning of January 21. Whereas the P99 (0.61 m) was briefly overpassed, the P99.9 (0.72 m) was never matched (Table 2). The comparison of HFR performance for different range arcs using two software versions (R7 and R8) revealed the noticeable agreement with in situ data, with SS and RMSEN emerging in the ranges [0.79–0.93] and [0.12–0.29], respectively (Figure 3C). Slightly higher SS and lower RMSEN were generally obtained using the combined dataset “Arcs 4-9” with R8 version (Figure 3C).
In terms of Wd, the concordance between B1 buoy and ALFA radar site for the 3.5-day period analyzed was disparate (Figure 3D). Whereas R7 estimations exhibited a systematic bias of 60°–80°, R8 measurements exhibited a clear improvement of more than 50% in both the SS and the RMSEN, particularly before ALFA site brief outage (Figure 3E). Notwithstanding, the skill of HFR-derived Wd measurements was moderate, in comparison with SWH figures.
SeaSonde HFR systems measure a wave period (Tc) that represents the centroid of the model being fitted to the second-order Doppler spectrum (Lipa and Nyden, 2005). Thus, HFR centroid periods derived from R7 and R8 software versions dropped always between Tp and Tm collected at B1 buoy (Figure 3F). This fact is relevant to properly interpret the skill metrics obtained from comparison, which was conducted against Tm. A considerable similarity between ALFA site and B1 mean period was found for the 48-h interval between the January 20 (12 h) and the January 22 (12 h), precisely during the mature stage of the storm: Tm was rather constant (about 8 s), surpassing the P99.9 threshold established at 7.5 s (Table 2). Higher discrepancies can be observed for both the beginning and dissipating phases. HFR precision was also quantified for different range arcs using two software versions. A moderate accordance with B1 data was evidenced, with SS and RMSEN lying in the ranges [0.52–0.75] and [0.13–0.19], respectively. Once more, slightly better metrics were obtained for R8 estimations (Figure 3G). It can be also concluded that for each wave parameter, results improved for distant range arcs (6 and higher).
With the aim of offering a broader historical context, a comparative analysis between storm Gloria and the Jan2017 severe episode was conducted by using P99 thresholds as reference (Table 2). The Jan2017 (19th–24th) event was characterized by a synoptic situation where a surface depression from North Africa migrated towards the southern part of the Balearic Islands (García-León, 2018). The joint action of this reinforced low and the dominant high-pressure system over central Europe led to strong easterly winds that afterward shifted to northeasterlies (Figure 4A). The wind speed at B1 buoy ranged from 9 to 16.41 m s–1, which means that P99 (13.13 m s–1) and P99.9 (15.90 m s–1) were, respectively, persistently and occasionally overpassed (Table 2).
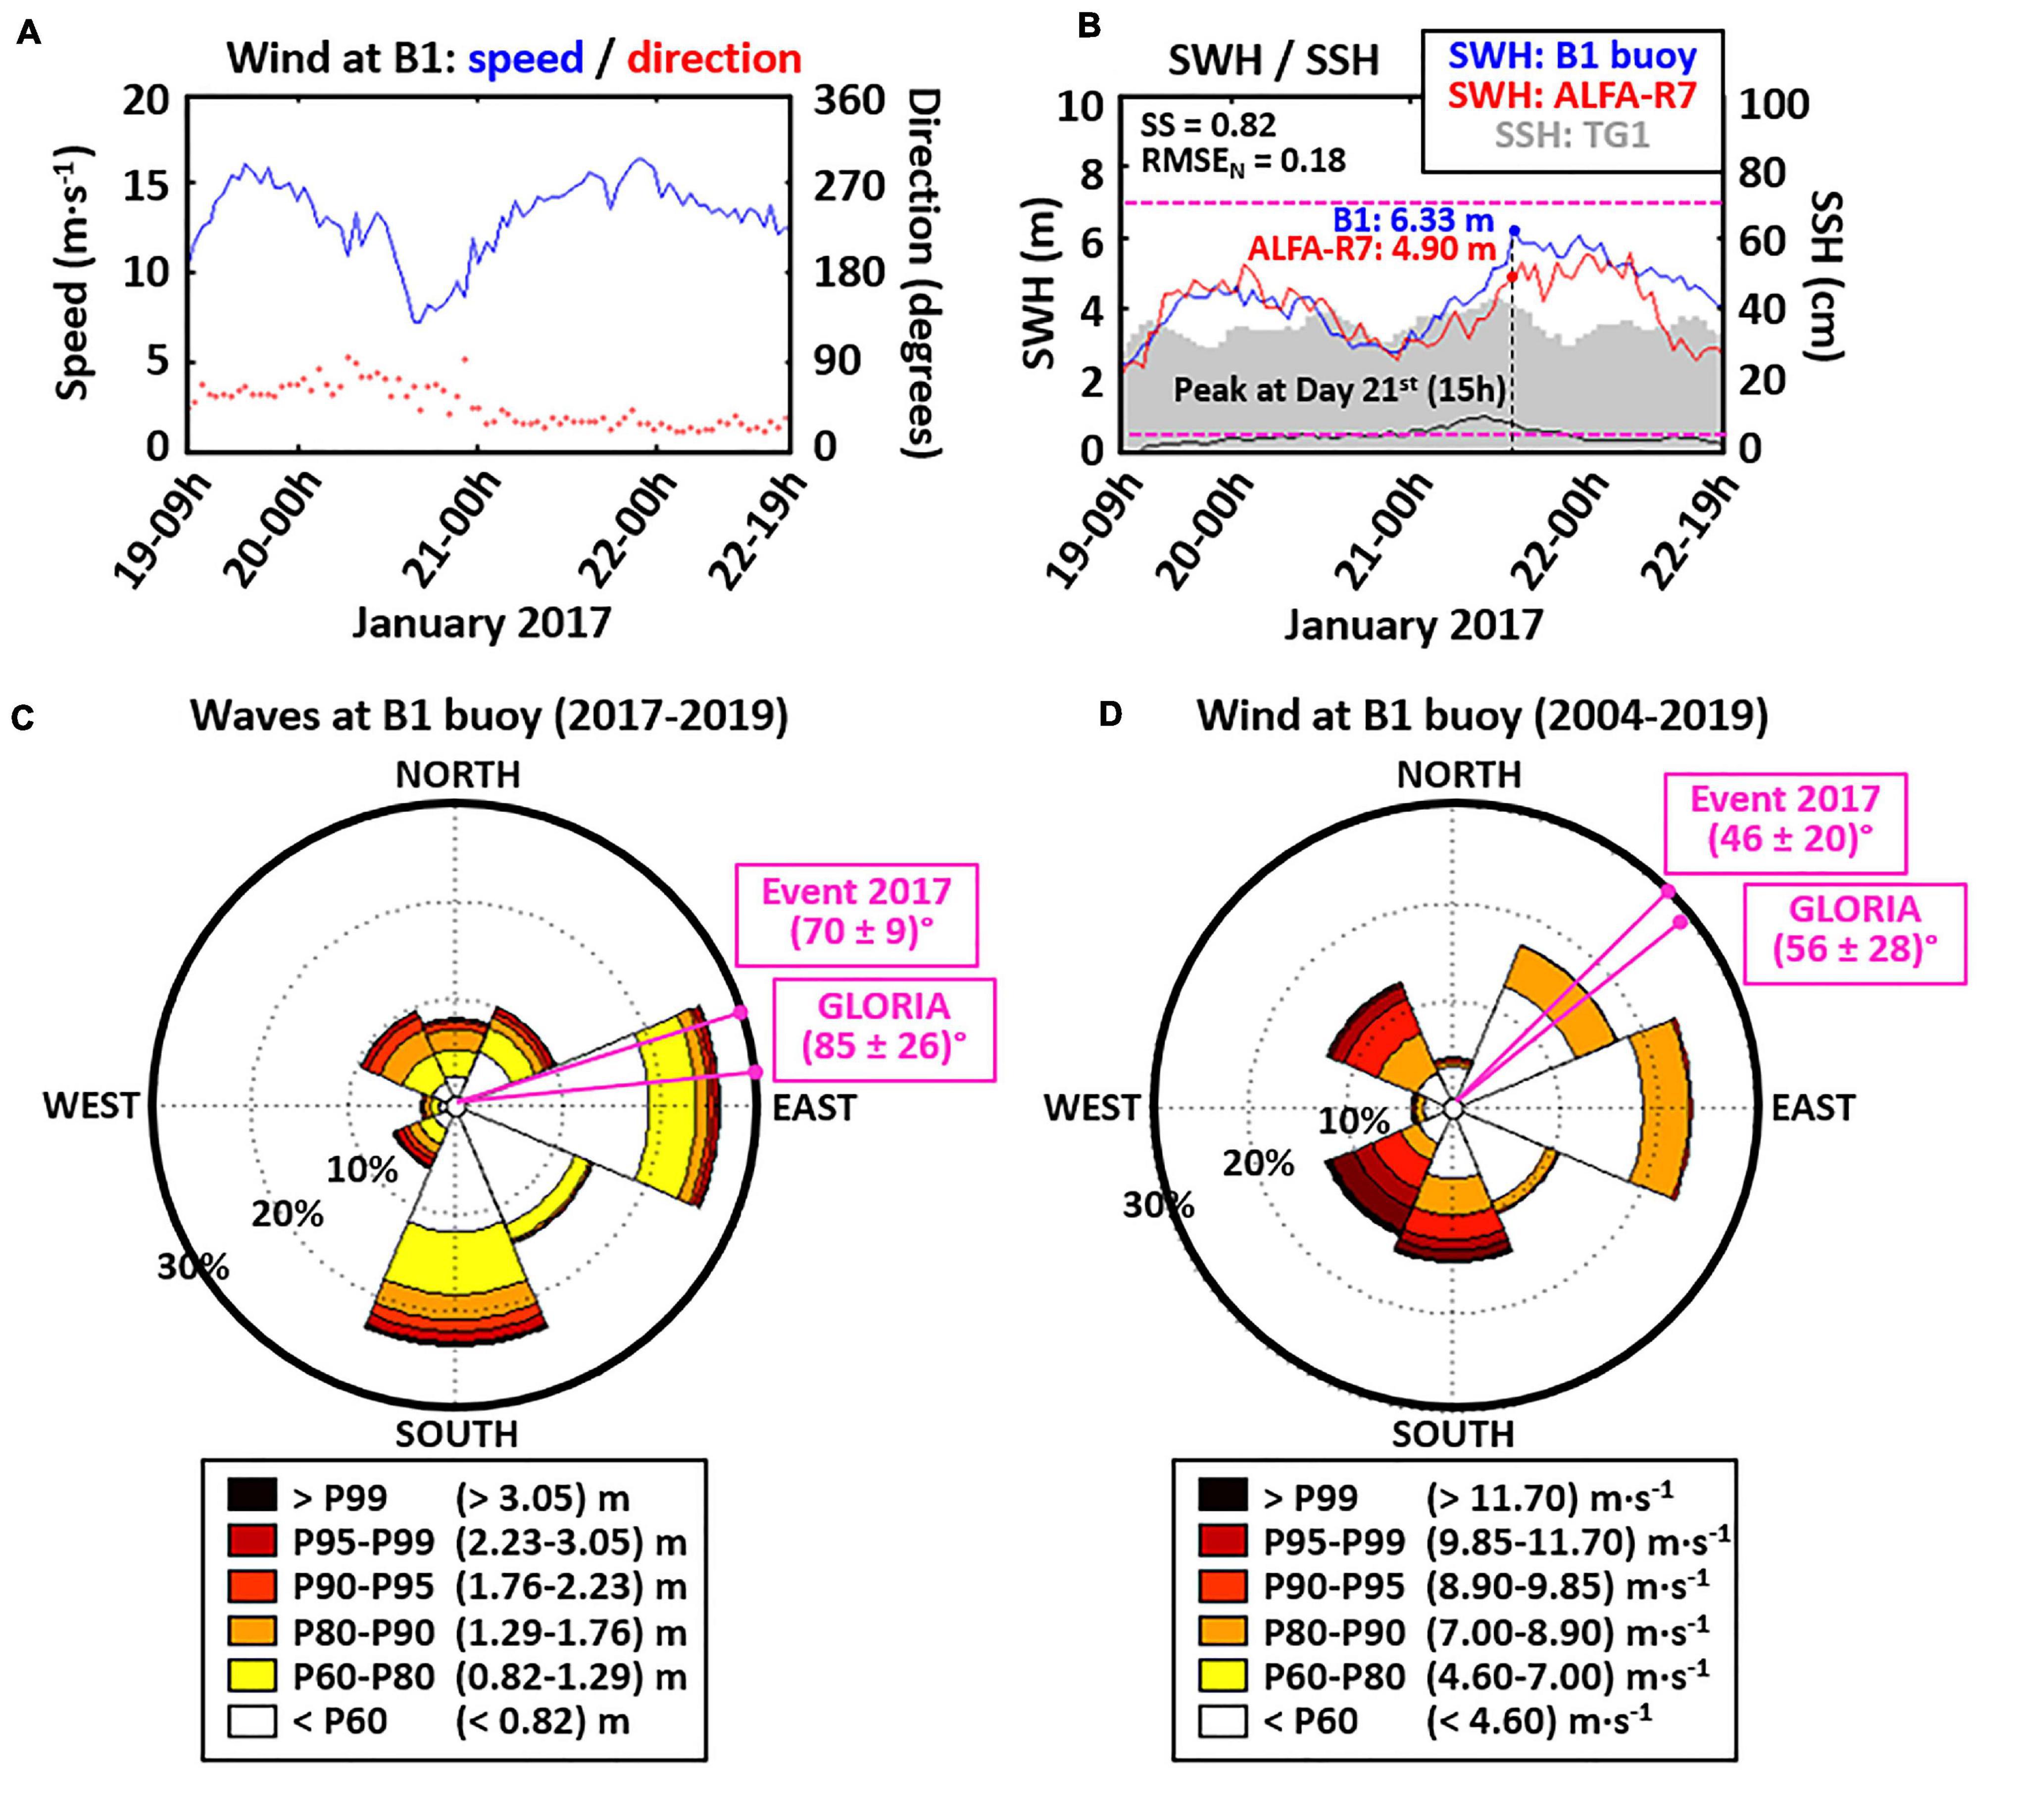
Figure 4. (A) Wind speed (blue line) and direction (red dots) measured at B1 buoy during the severe event Jan2017 (3.5-day period); (B) Comparison of HFR-derived significant wave height (SWH) (provided by ALFA site: Arcs 4–9, R7 software) against hourly in situ observations from B1 buoy. Arcs 4–9 represents an average of wave estimations from all those range arcs. Gray columns and the black line represent the hourly sea surface height (SSH) and the meteorological tide recorded at TG1 tide-gauge, respectively. Pink dashed lines represent the lower and upper thresholds for SWH data collection; (C) Wave rose at B1 buoy for the 3-year period (2017–2019): SWH depicted by percentile intervals, incoming wave directions grouped each 45 degrees. The mean wave direction for each extreme event is denoted by a pink arrow; (D) Wind rose at B1 buoy for the 15-year historical period (2004–2019): wind speed depicted by percentile intervals, incoming wind direction grouped each 45 degrees. The mean wind direction for each extreme event is denoted by a pink arrow.
With regards to the in situ SWH observations, a secondary peak (4.88 m) was firstly reached during late January 19 (Figure 4B). After a moderate decay to 2.75 m (concomitant with a decrease in wind speed), the maximum (6.25 m) was eventually observed on January 21 (15 h). HFR-derived SWH estimations, obtained from ALFA site with R7 software (red line in Figure 4B), are in good consonance with B1 data, as reflected by a relevant SS (0.82) and a moderate RMSEN (0.18). Notwithstanding, there is a clear HFR underestimation of the wave height during January 21–22, particularly of the peak (4.90 m). Observations of Tm at B1 buoy (not shown), which lied between 5.69 and 7.63 s, were lower than those registered during Gloria (Table 2).
Furthermore, the storm surge peak was around 23 cm and the tidal range was about 20 cm, entailing a net maximum increment of SSH to 43 cm (gray shaded bars in Figure 4B). Note that both storms occurred on the same dates of January 2017 and 2020, so presumably they shared similar astronomical tides and mean sea levels. In this context, SSH values remained clearly below the P99 (0.61 m) during the Jan2017 event, although the wind speed occasionally exceeded the P99.9 (15.90 m s–1) and the SWH fairly overpassed the P99.9 threshold (4.10 m), as exposed in Table 2. The Tp parameter (not shown) was also quite stable (above 11 s) and similar for both episodes, as expected from storms with similar origin (Ligurian basin) and long fetch distance (700 km).
From a directional perspective, the prevailing incoming wave direction during Jan2017 was NE-E (70 ± 9)°, which is the most common origin for the waves recorded at B1 buoy (Figure 4C). Northeasterly winds (46 ± 20)° were predominant during the Jan2017 event, similarly to the wind regime during storm Gloria (56 ± 28)°, as denoted in the historical (2004–2019) wind rose presented in Figure 4D. Note that, although the prevailing winds direction is from the E-NE, those coming from the NW and S-SW are the strongest.
Sea Surface Current Field
Circulation in the ED
As a preliminary step, the skill of HFR data was assessed against independent in situ observations. Hourly time series of current speed and direction collected by B1 buoy during January 2020 were compared with HFR-ED estimations at the closest grid point (Figures 5A,B). Current speed exhibited a good agreement, with a SS of 0.74 (0.79) for the entire month (January 19–24 period). Both devices concurrently captured the timing of the current speed peak (January 21 at 00 h), although the HFR underestimated the exceptional value measured by B1 (116 cm s–1). This peak fairly beat both the P99.9 and the 15-year historical record, previously established at 79 and 98 cm s–1, respectively (Table 2). Note that the maximum current speed registered during the severe event Jan2017 was 53 cm s–1 (approximately half the Gloria’s top speed), which highlights the strength of Gloria. Equally, an acceptable monthly SS of 0.52 was obtained for the direction, increasing up to 0.66 for the Gloria 6-day episode. The prevalent propagation direction was to the southwest during the mature stage of Gloria (January 19–21), veering afterward to a more predominant southwards flow (January 22–24).
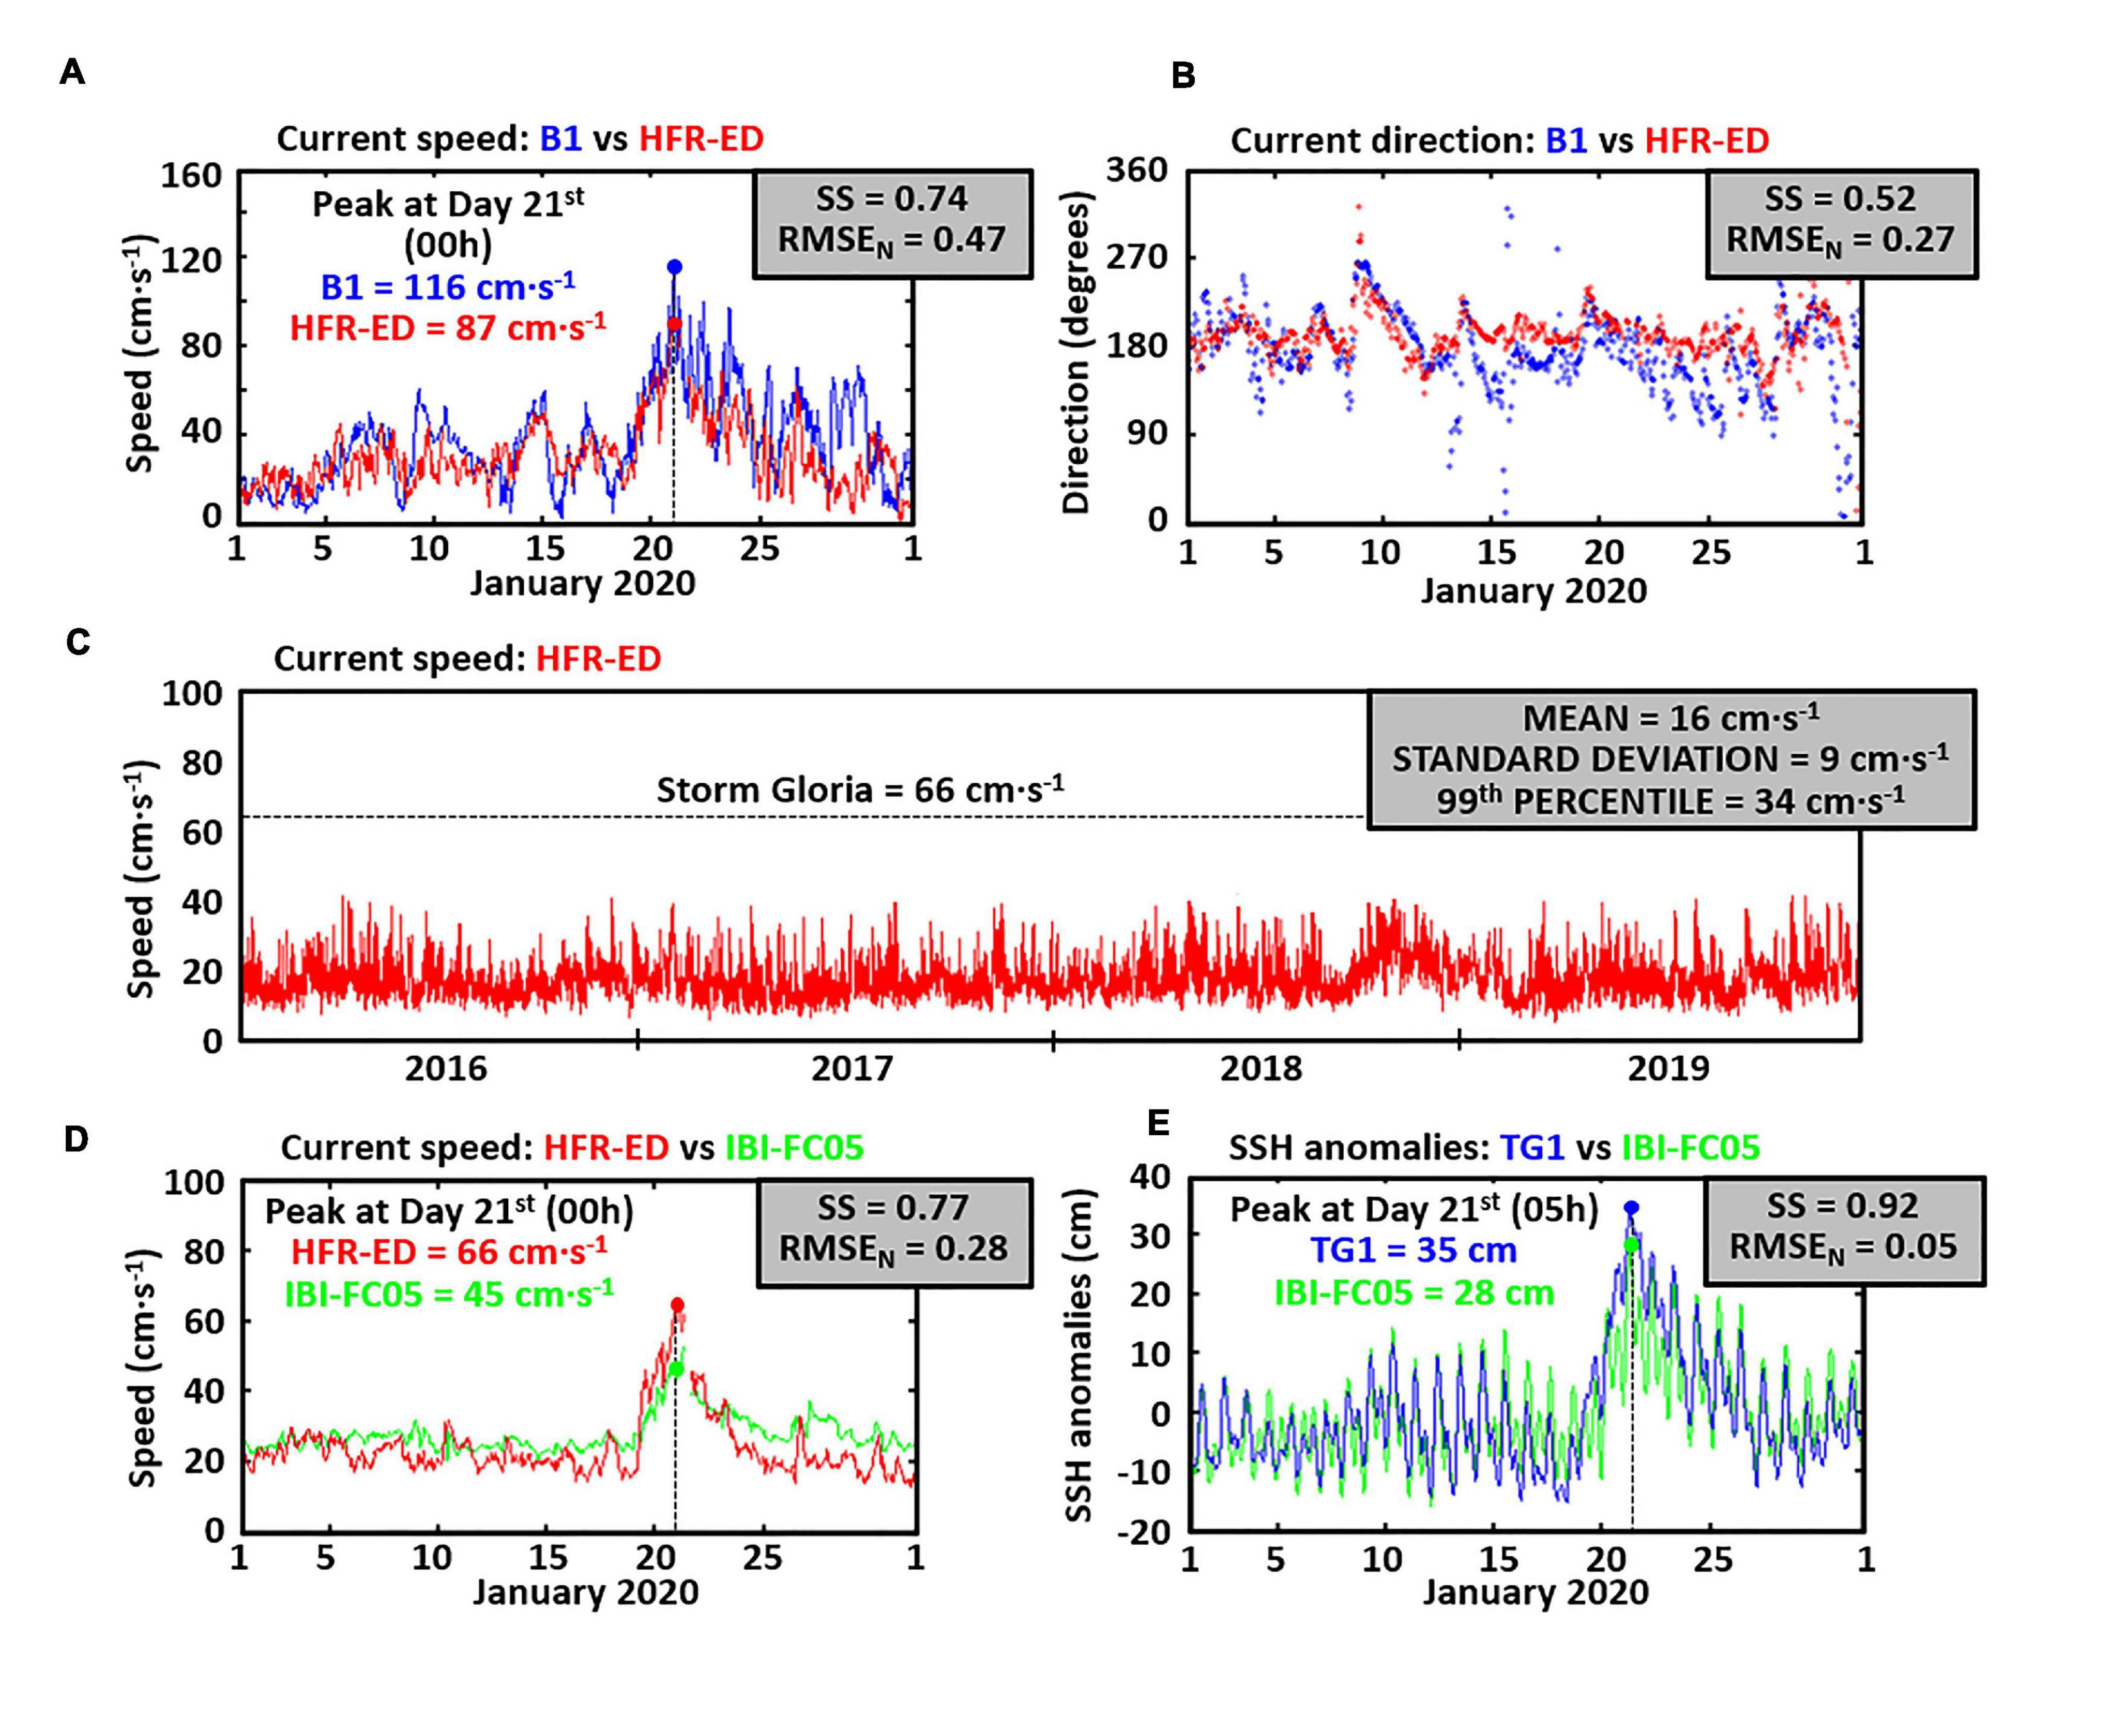
Figure 5. Comparison of hourly surface current speed (A) and direction (B) provided by B1 buoy (red) and HFR-ED (blue) at the closest grid point, for January 2020; (C) 4-year timeseries of hourly surface current speed provided by HFR-ED, spatially averaged over the HFR coverage; (D) Comparison of hourly current speed provided by HFR-ED (blue) and IBI-FC05 model (green), spatially averaged over the HFR coverage, for January 2020; (E) Comparison of hourly anomalies of sea surface height (SSH) provided by TG1 tide-gauge (blue) and IBI-FC05 model (green) at the closest grid point, for January 2020.
The long-term monitoring of the current speed from HFR-ED, spatially averaged over the radar footprint, revealed a rather moderate circulation during the period 2016–2019, before storm Gloria took place (Figure 5C). The current speed remained below 40 cm s–1 most of the time, with mean and P99 values around (16 ± 9) and 34 cm s–1, respectively. Time series of hourly current speed from HFR-ED and IBI-FC05, spatially averaged over the common domain, were computed for January 2020 (Figure 5D). The resemblance between remote-sensed estimations and the model outcomes was considerable, as reflected by the high SS (0.74). The current speed remained rather constant (fluctuating around 25 cm s–1) during the first 18 days, increasing abruptly during the January 19–20. A speed peak of 66 cm s–1 was registered in the January 21 (00 h), followed by a gradual 4-day decay and a restoration back to the usual range of values in late January. While IBI-FC05 appeared to slightly overestimate the averaged flow speed before Gloria took place, the model underpredicted the steep acceleration of the surface stream during the storm. Although IBI-FC05 qualitatively replicated the surface flow variability, it also exhibited a delay of a few hours in its predictive skill.
A similar performance was observed for the SSH (Figure 5E). The hourly anomalies (obtained after subtracting the monthly mean) modeled and observed at TG1 tide-gauge look rather alike, as evidenced by a SS of 0.92. Again, IBI-FC05 underestimated the sea level rise associated with the storm surge and the peak detected at day 21st (05 h), five hours later than the observed maximum current speed at B1 location. Such a 5-h lapse was motivated by the enhanced wind-induced water transport to the SW-W that piled up toward coastal areas.
The 6-day averaged circulation maps revealed the moderate resemblance between HFR-ED data and IBI modeled currents in terms of the main along-shore flow to the southwest (Figures 6A,B). Whereas HFR-ED exhibited a fairly homogeneous and intensified stream, IBI presented: (i) an uniform but weaker southwestward flow over the continental shelf, particularly in the periphery of Ebro river mouth; (ii) a more intricate circulation pattern in the easternmost sector of the common footprint, characterized by the presence of one elongated anti-clockwise eddy in the along-shore direction; and (iii) a clear overprediction of the SW slope jet.
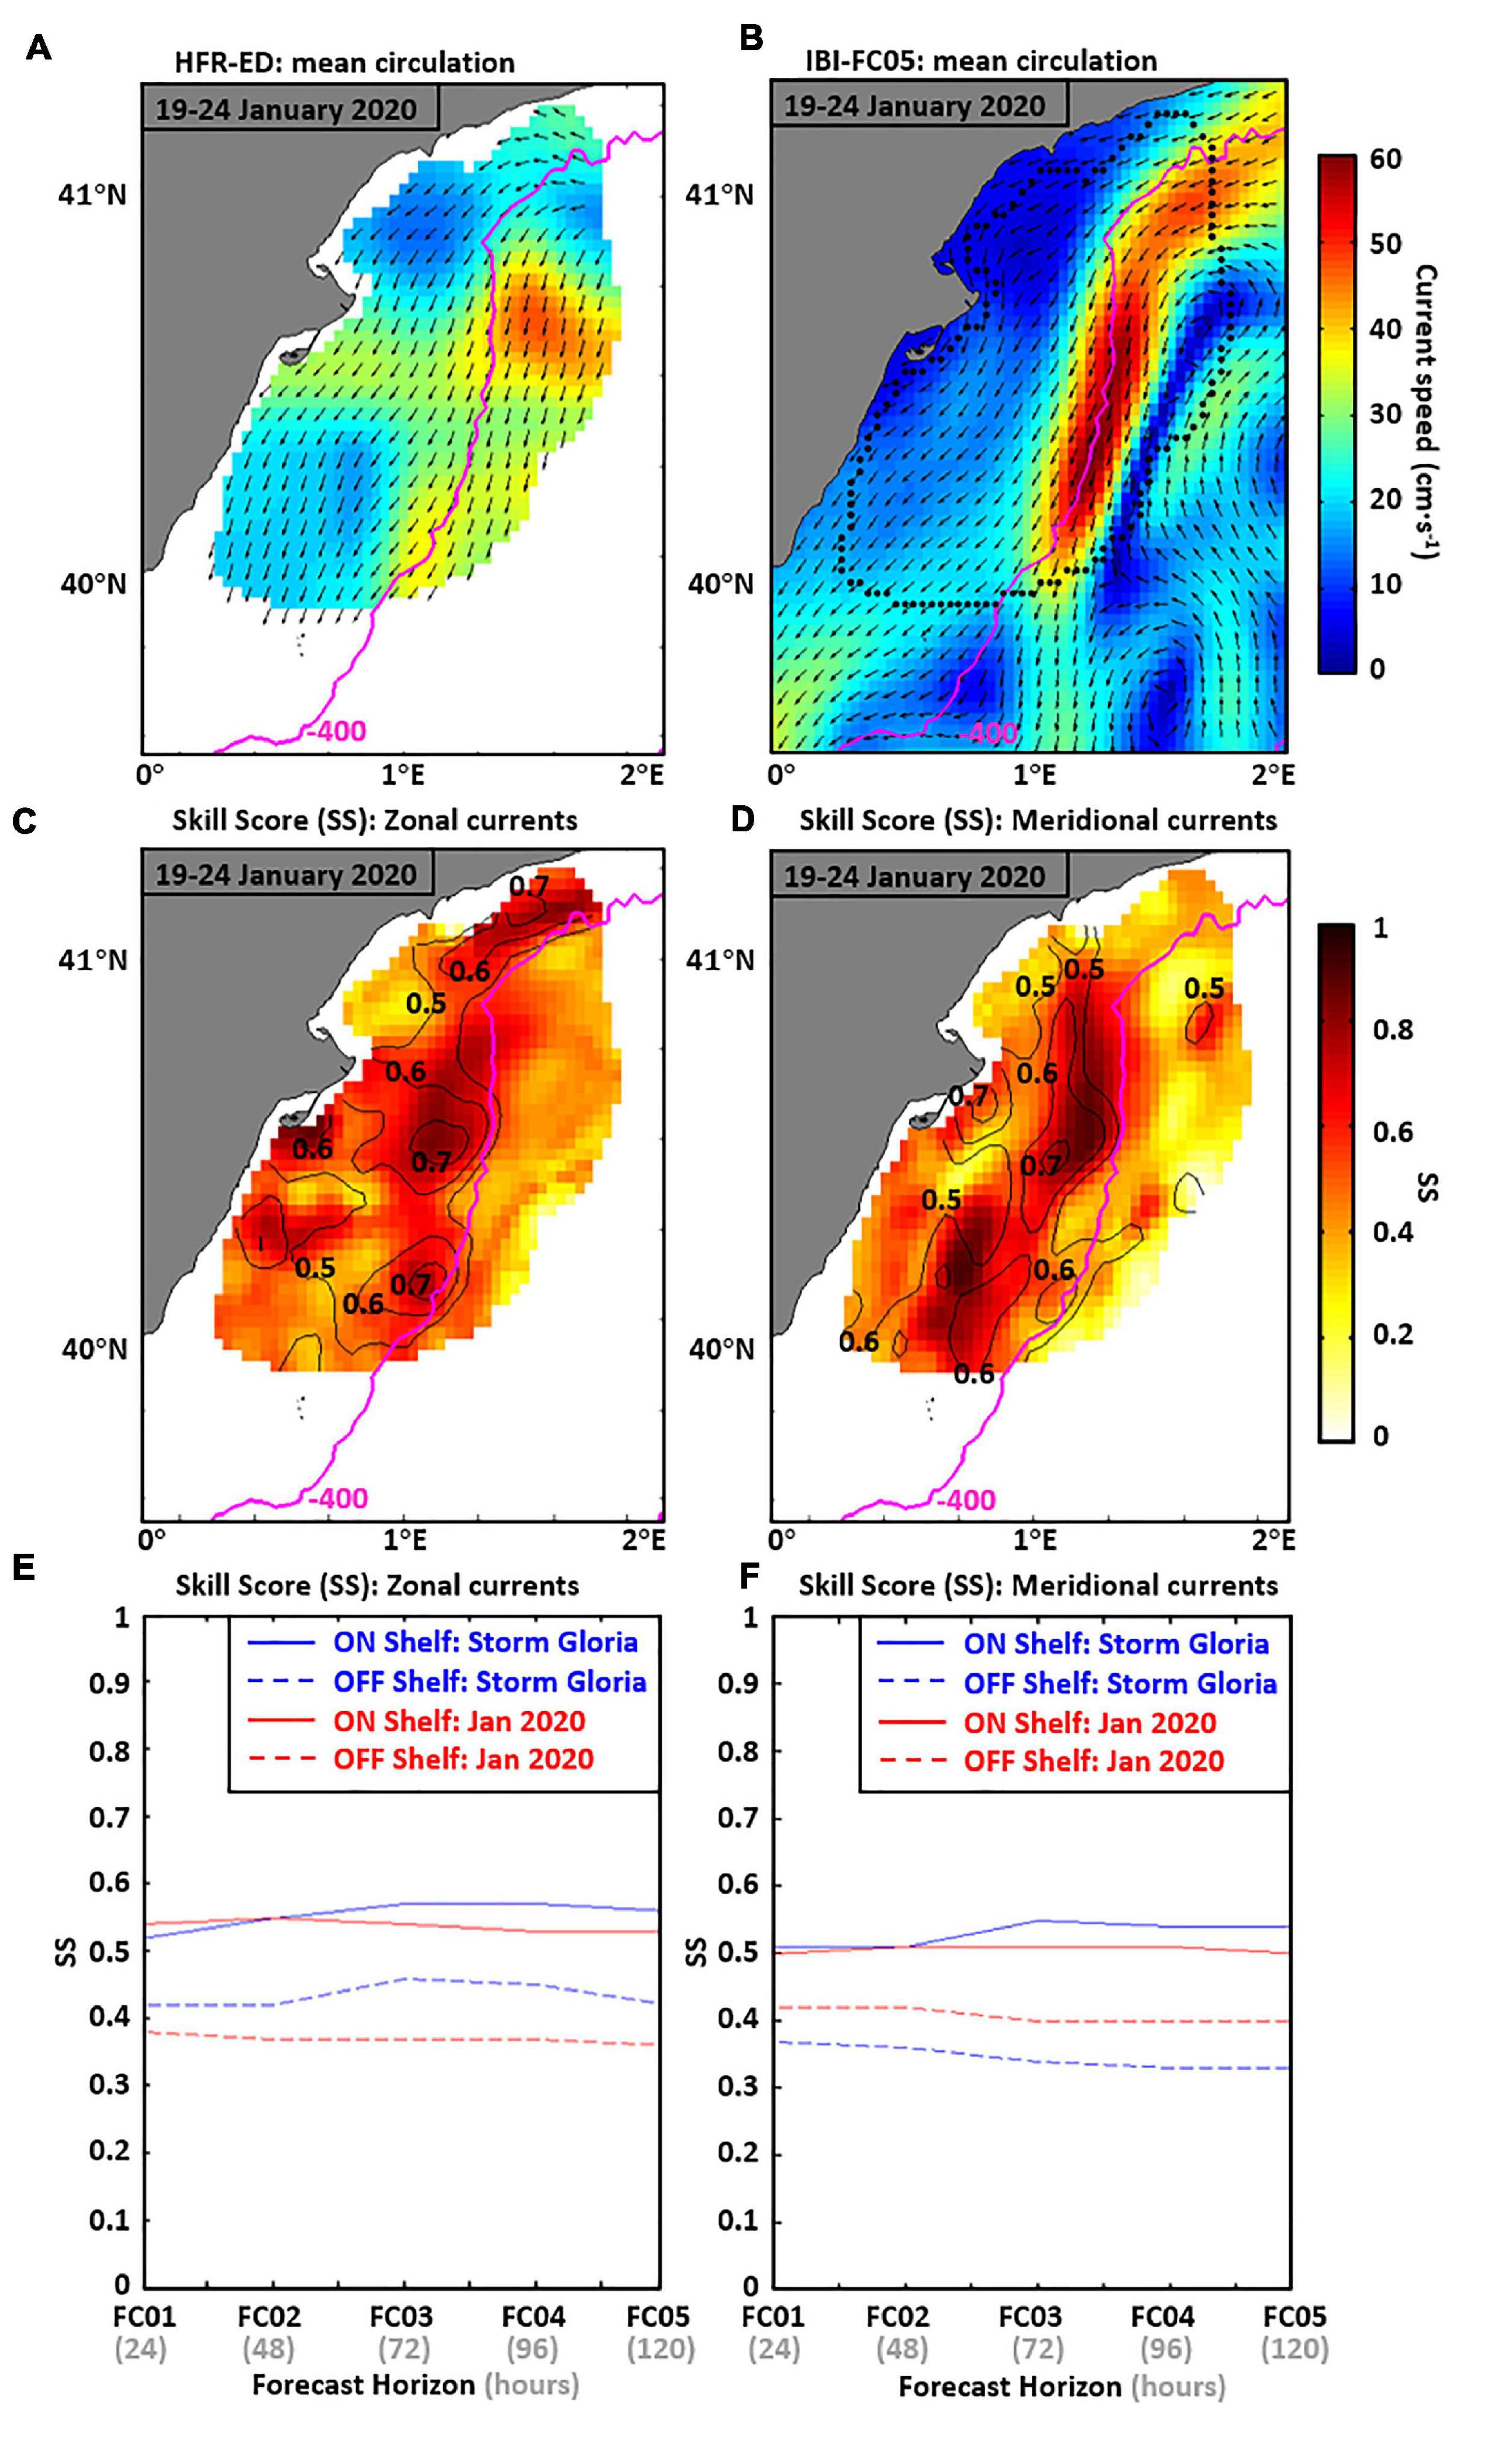
Figure 6. Six-day averaged maps of the surface currents as derived from hourly HFR estimations (A) and IBI outcomes five days ahead (B) during storm Gloria. Current vectors are normalized. The magenta bathymetric contour shows depths at 400 m, splitting off-shelf regions from on-shelf areas. Maps of the spatial distribution of the Skill Score (SS) for the zonal (U) (C) and meridional (V) (D) current velocity: colors (isolines) denote the values obtained during storm Gloria (the entire month of January). SS, spatially averaged over the common domain, for each forecast horizon: zonal (E) and meridional (F) currents. Blue (red) lines indicate the SS for the Gloria event (the entire month of January 2020), spatially averaged over the shelf (solid lines) and over off-shore waters (dashed lines).
Both zonal and meridional currents were better modeled at the center of the HFR footprint area, as reflected in the form of a strip of high SS values (above 0.7), which extended latitudinally following the shelf break orientation (Figures 6C,D). The lowest SS values were observed in the easternmost sector of the common domain, due to: (i) the presence of the aforementioned eddy in the modeled current field and (ii) higher uncertainties in HFR estimations due to higher values of GDOP parameter, previously described in section “HFR Current Data Treatment.” While high SS values were detected over the southern hemidelta (ranging from 0.6 to 0.8), lower SS (below 0.4) were observed for both current components in the northern hemidelta, close to the Ebro river mouth.
The SS was computed for different forecast horizons and spatially-averaged over both the continental shelf and open-waters (Figures 6E,F). IBI showed a rather constant skill regardless of the horizon used, with marginal variations for longer horizons. Model performance was better on the shelf (solid blue lines) than off shelf (dashed blue lines), with SS emerging in the ranges [0.50–0.56] and [0.34–0.46], respectively. Monthly SS (red lines) were also calculated following the same approach. While slight differences were encountered in open waters, results also revealed a similar level of accuracy over the shelf (above 0.5), independently of the time layout used. Note that in open waters (dashed lines), IBI model reproduced more accurately the zonal component than the meridional one during the extreme event.
The time-averaged pattern of IROS, derived from hourly HFR-ED and IBI current estimations under Gloria conditions, shared some common features such as the prominent peak evidenced over the northeastern sector. Whereas the HFR-derived peak of IROS was broader and more intense (Figure 7A), IBI predicted five days beforehand an elongated belt of high IROS, which was distributed following the shelf break orientation (Figure 7B). Equally, IBI predicted a secondary maximum in the form of a narrow strip over the southern zone, in agreement with HFR-ED outputs. Notwithstanding, two principal discrepancies arose in the easternmost border of the common domain and also in the periphery of ED. The former consisted of a peak of IROS related to the cyclonic eddy observed in IBI surface circulation. The latter encompassed the core of high IROS confined north of ED mouth, observed in HFR-ED map but absent from the modeled field.
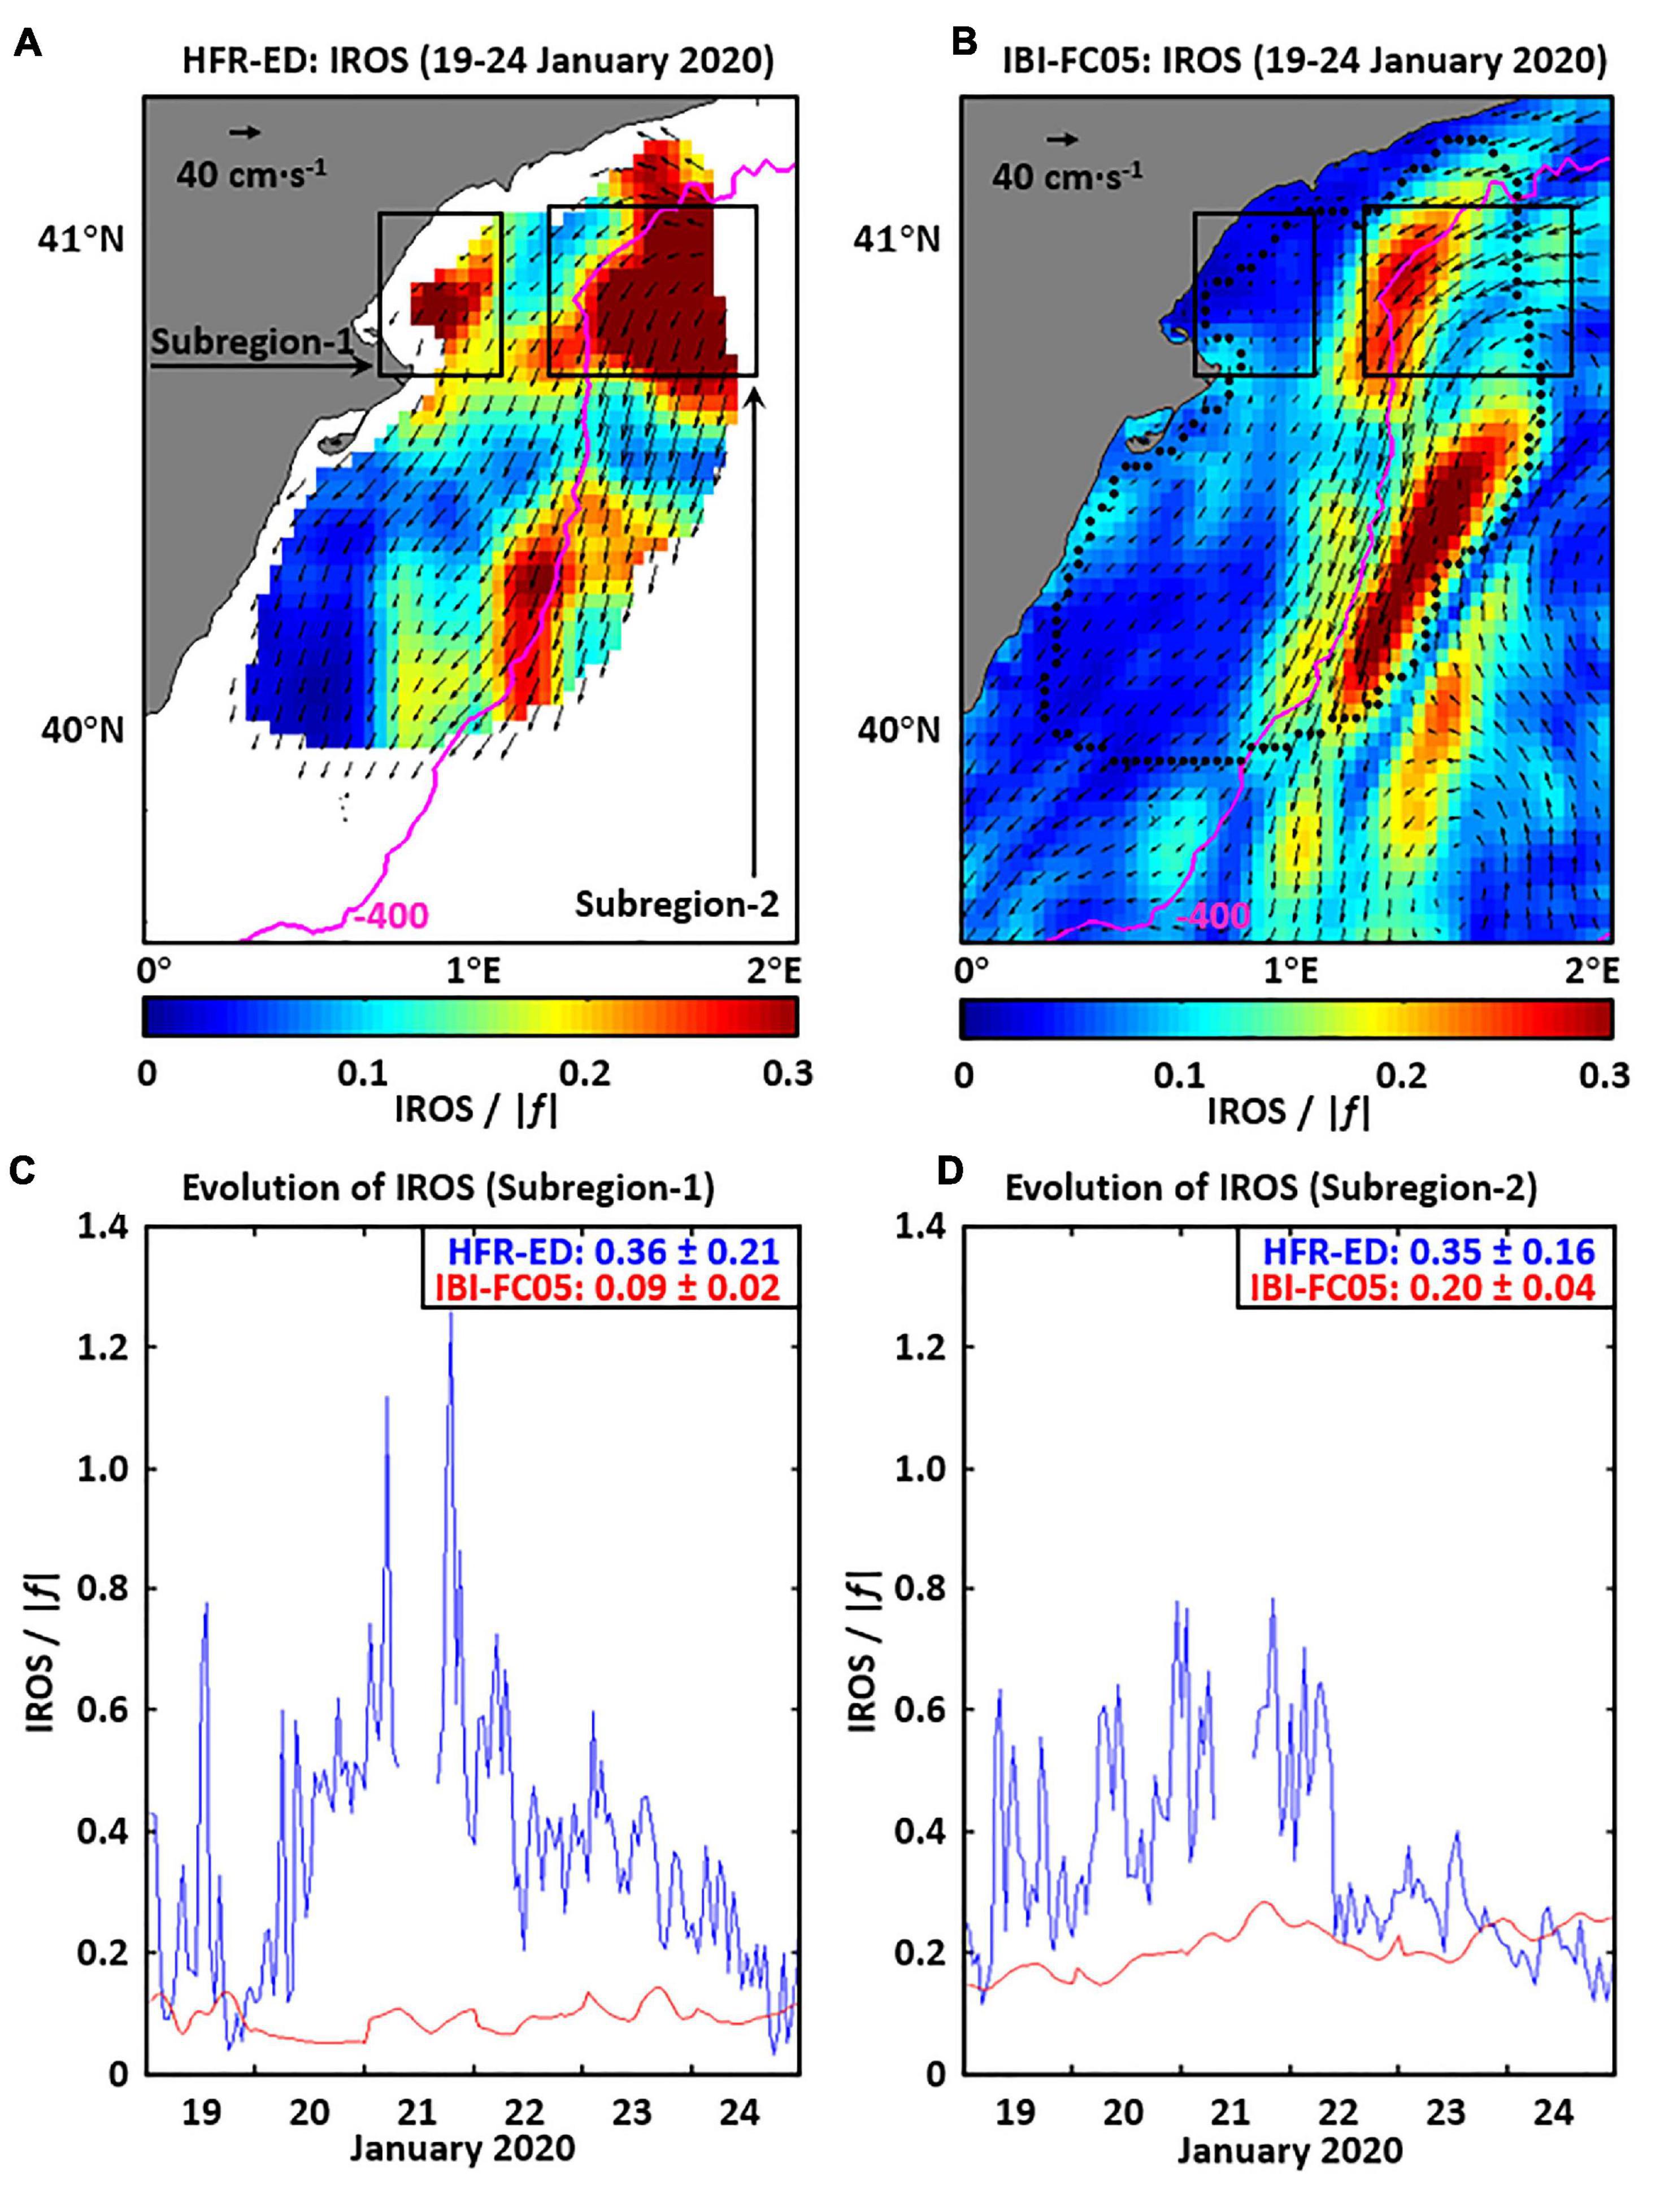
Figure 7. Time-averaged maps of Instantaneous Rate of Separation (IROS) for the 6-day period (January 19–24, 2020) as derived from HFR hourly current estimations (A) and IBI model outcomes five days ahead (B). (C,D) Temporal evolution of IROS diagnostic, spatially averaged over two different subregions within the common domain (denoted with black boxes in panel (A): in the northern periphery of ED mouth (C) and in north-easternmost sector (D). IROS derived from HFR and IBI estimations are represented by blue and red lines, respectively.
In order to gain further insight into the hourly evolution of IROS during Gloria’s passage, two subregions were arbitrarily selected within the northern area, which was not compromised by the temporal interruption of VINA southern site (Figure 7A). The first one is close to the northern hemidelta (subregion-1) and the second is over NE sector of the common domain (subregion-2). In subregion-1, HFR-ED time series displayed substantially higher values of IROS than IBI-FC05, with two peaks above 1.1 during January 21 (Figures 7C,D). The large differences observed close to the ED mouth suggest that some coastal processes are poorly resolved by IBI regional model, but inherently included in the remote-sensed observations.
The sequence of daily maps of IROS (Figure 8) corroborated that: (i) IBI generally underestimated the surface current speed over the shelf, especially in the periphery of ED; (ii) IBI moderately predicted the increase-decrease cycle of IROS values over subregion-2 in terms of intensity and location, but it clearly failed to capture the peak detected over subregion-1. Although the HFR spatial coverage was substantially reduced for January 20–21 due to VINA temporal outage, results suggest that there was a strong, widespread particle dispersion to the SW over the northern sector (Figures 8A–D). The long-lived dispersion could be observed even on the January 23, during the dissipating stage of Gloria (Figures 8E,F). By that day, IBI appeared to predict, to some degree, a delayed dispersive transport near the ED mouth (Figure 8F) likely due to the heavy precipitation (Figure 9A) registered at the Ebro Observatory (located in Figure 1A) and the associated intense runoff. This finding confirms the importance of implementing realistic runoff forcing in ocean models to properly simulate the river plume signal, as recently indicated by Ruiz-Parrado et al. (2020). Since the IBI operational chain includes a climatological runoff forcing (instead of real-time in situ observations), the first-order role of Ebro river plume in the dispersive transport of water masses is insufficiently represented and hence the mean flow influence on particle separation is underestimated.
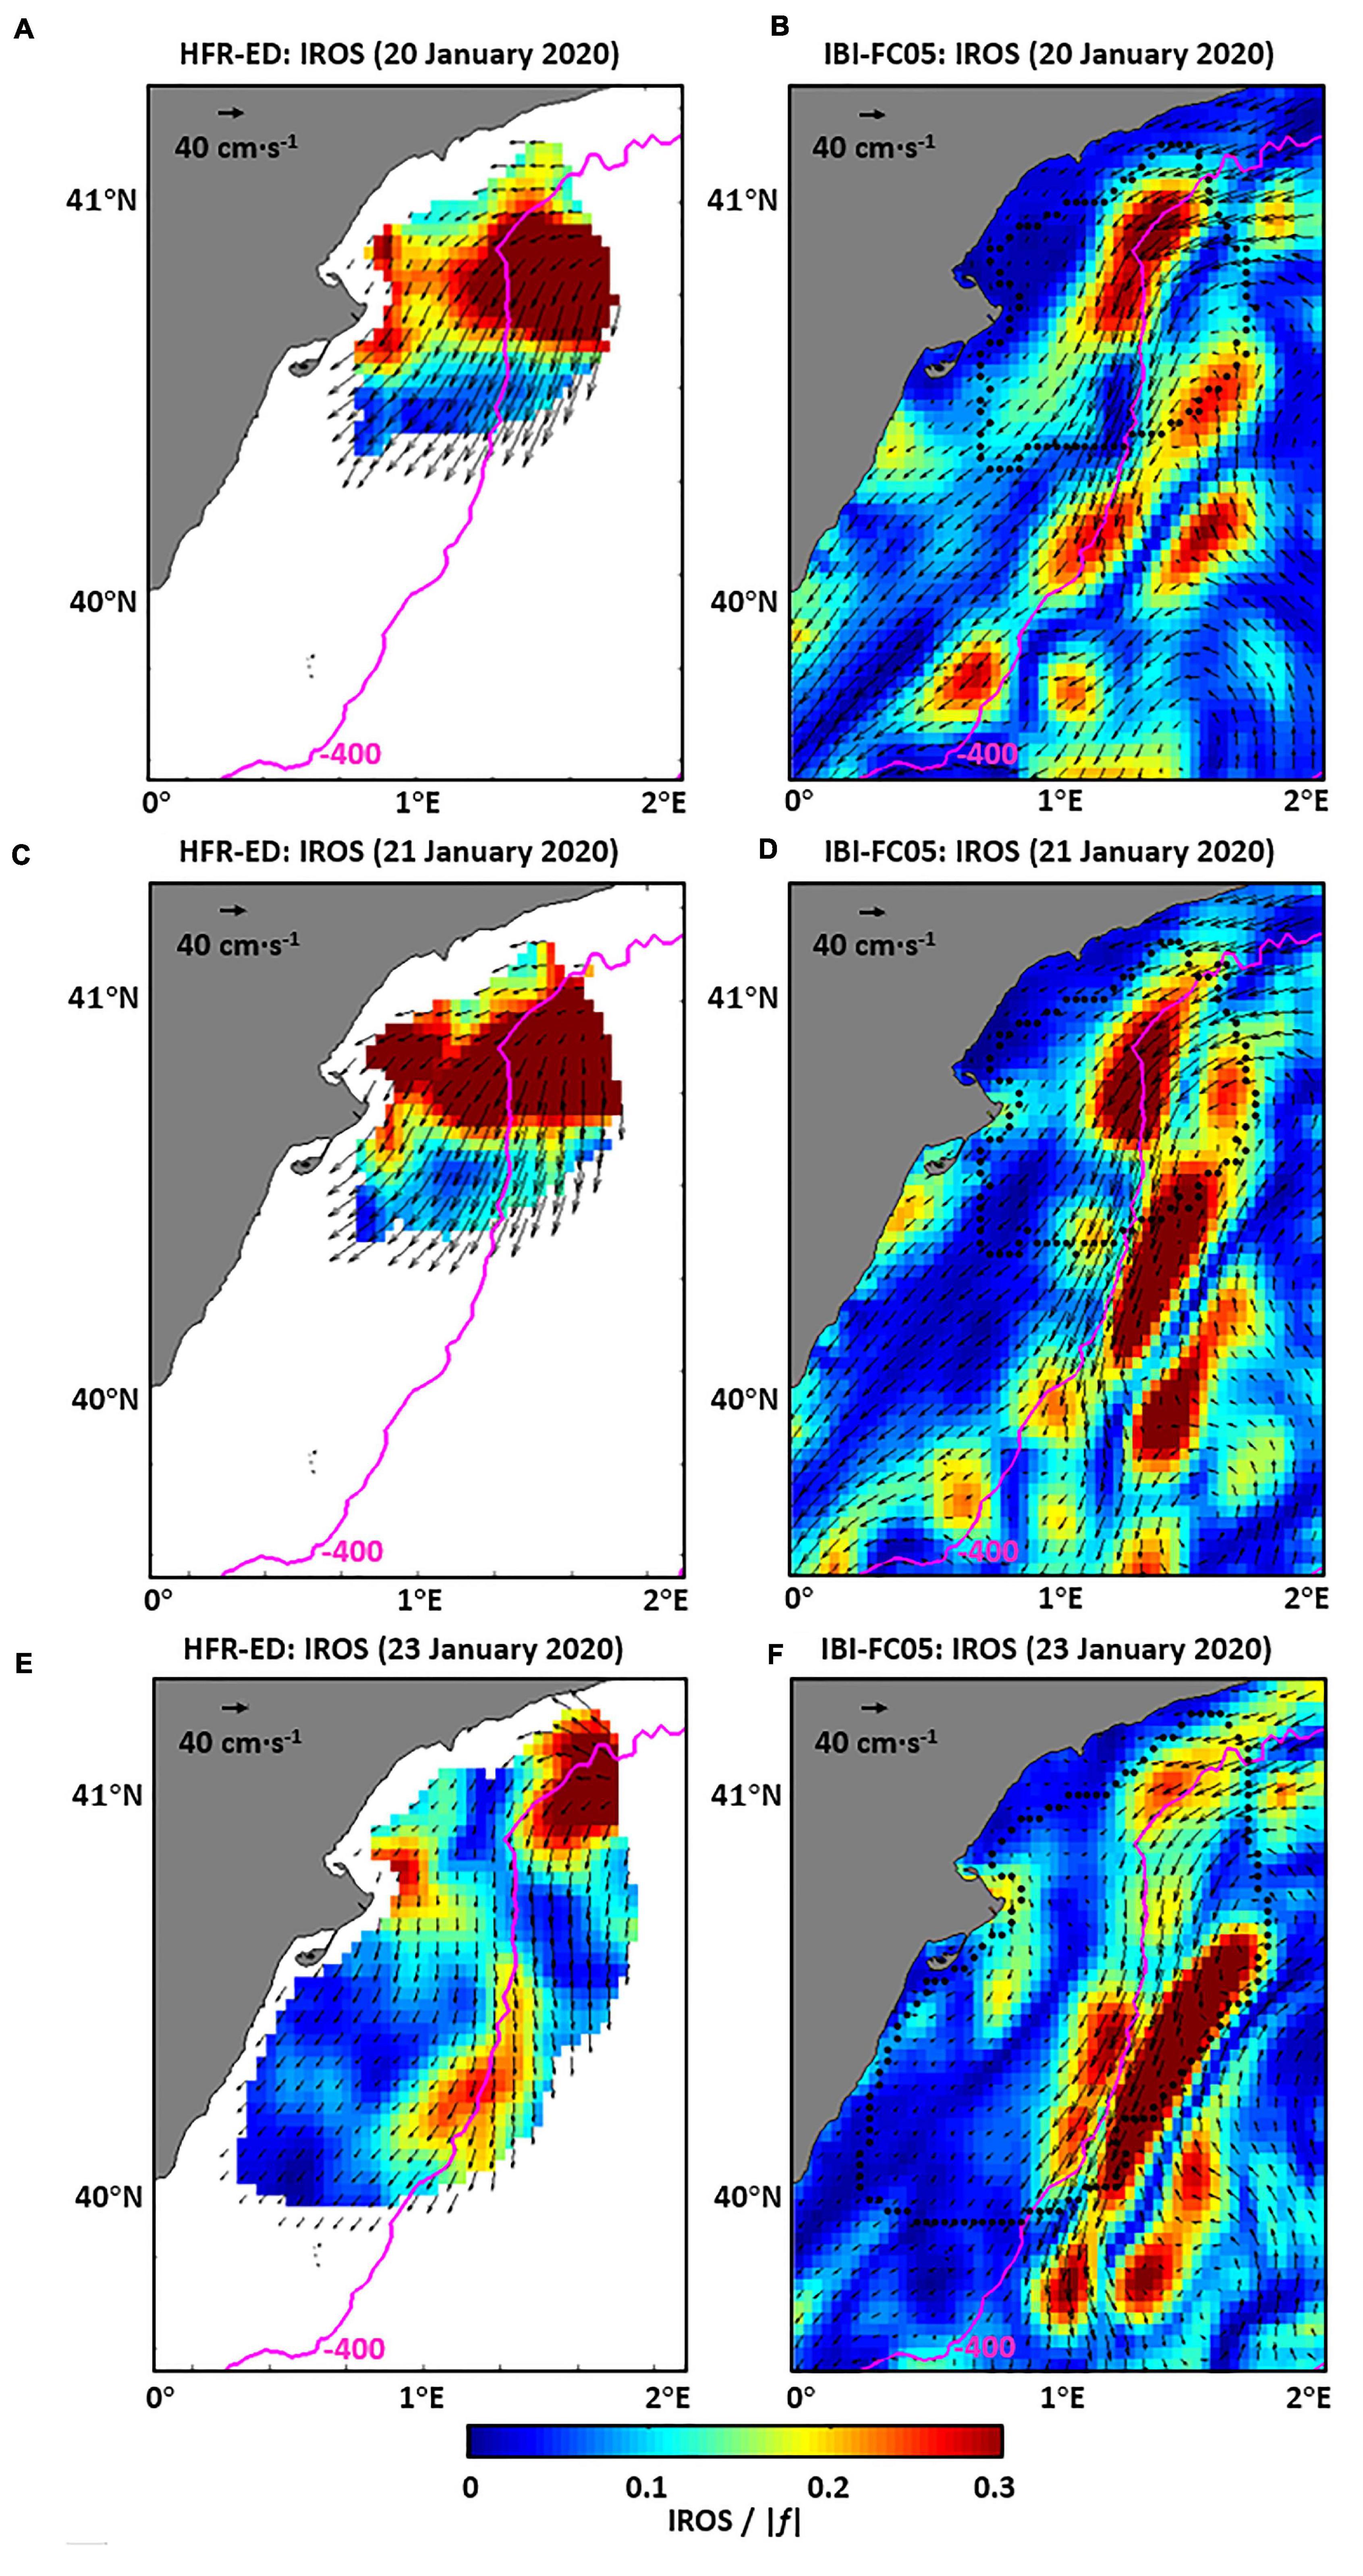
Figure 8. Daily averaged maps of Instantaneous Rate of Separation (IROS) as derived from HFR hourly current estimations (left) and IBI model outcomes five days ahead (right) for the mature stage of storm Gloria (January 20 and 21, 2020) and the dissipating phase (January 23, 2020).
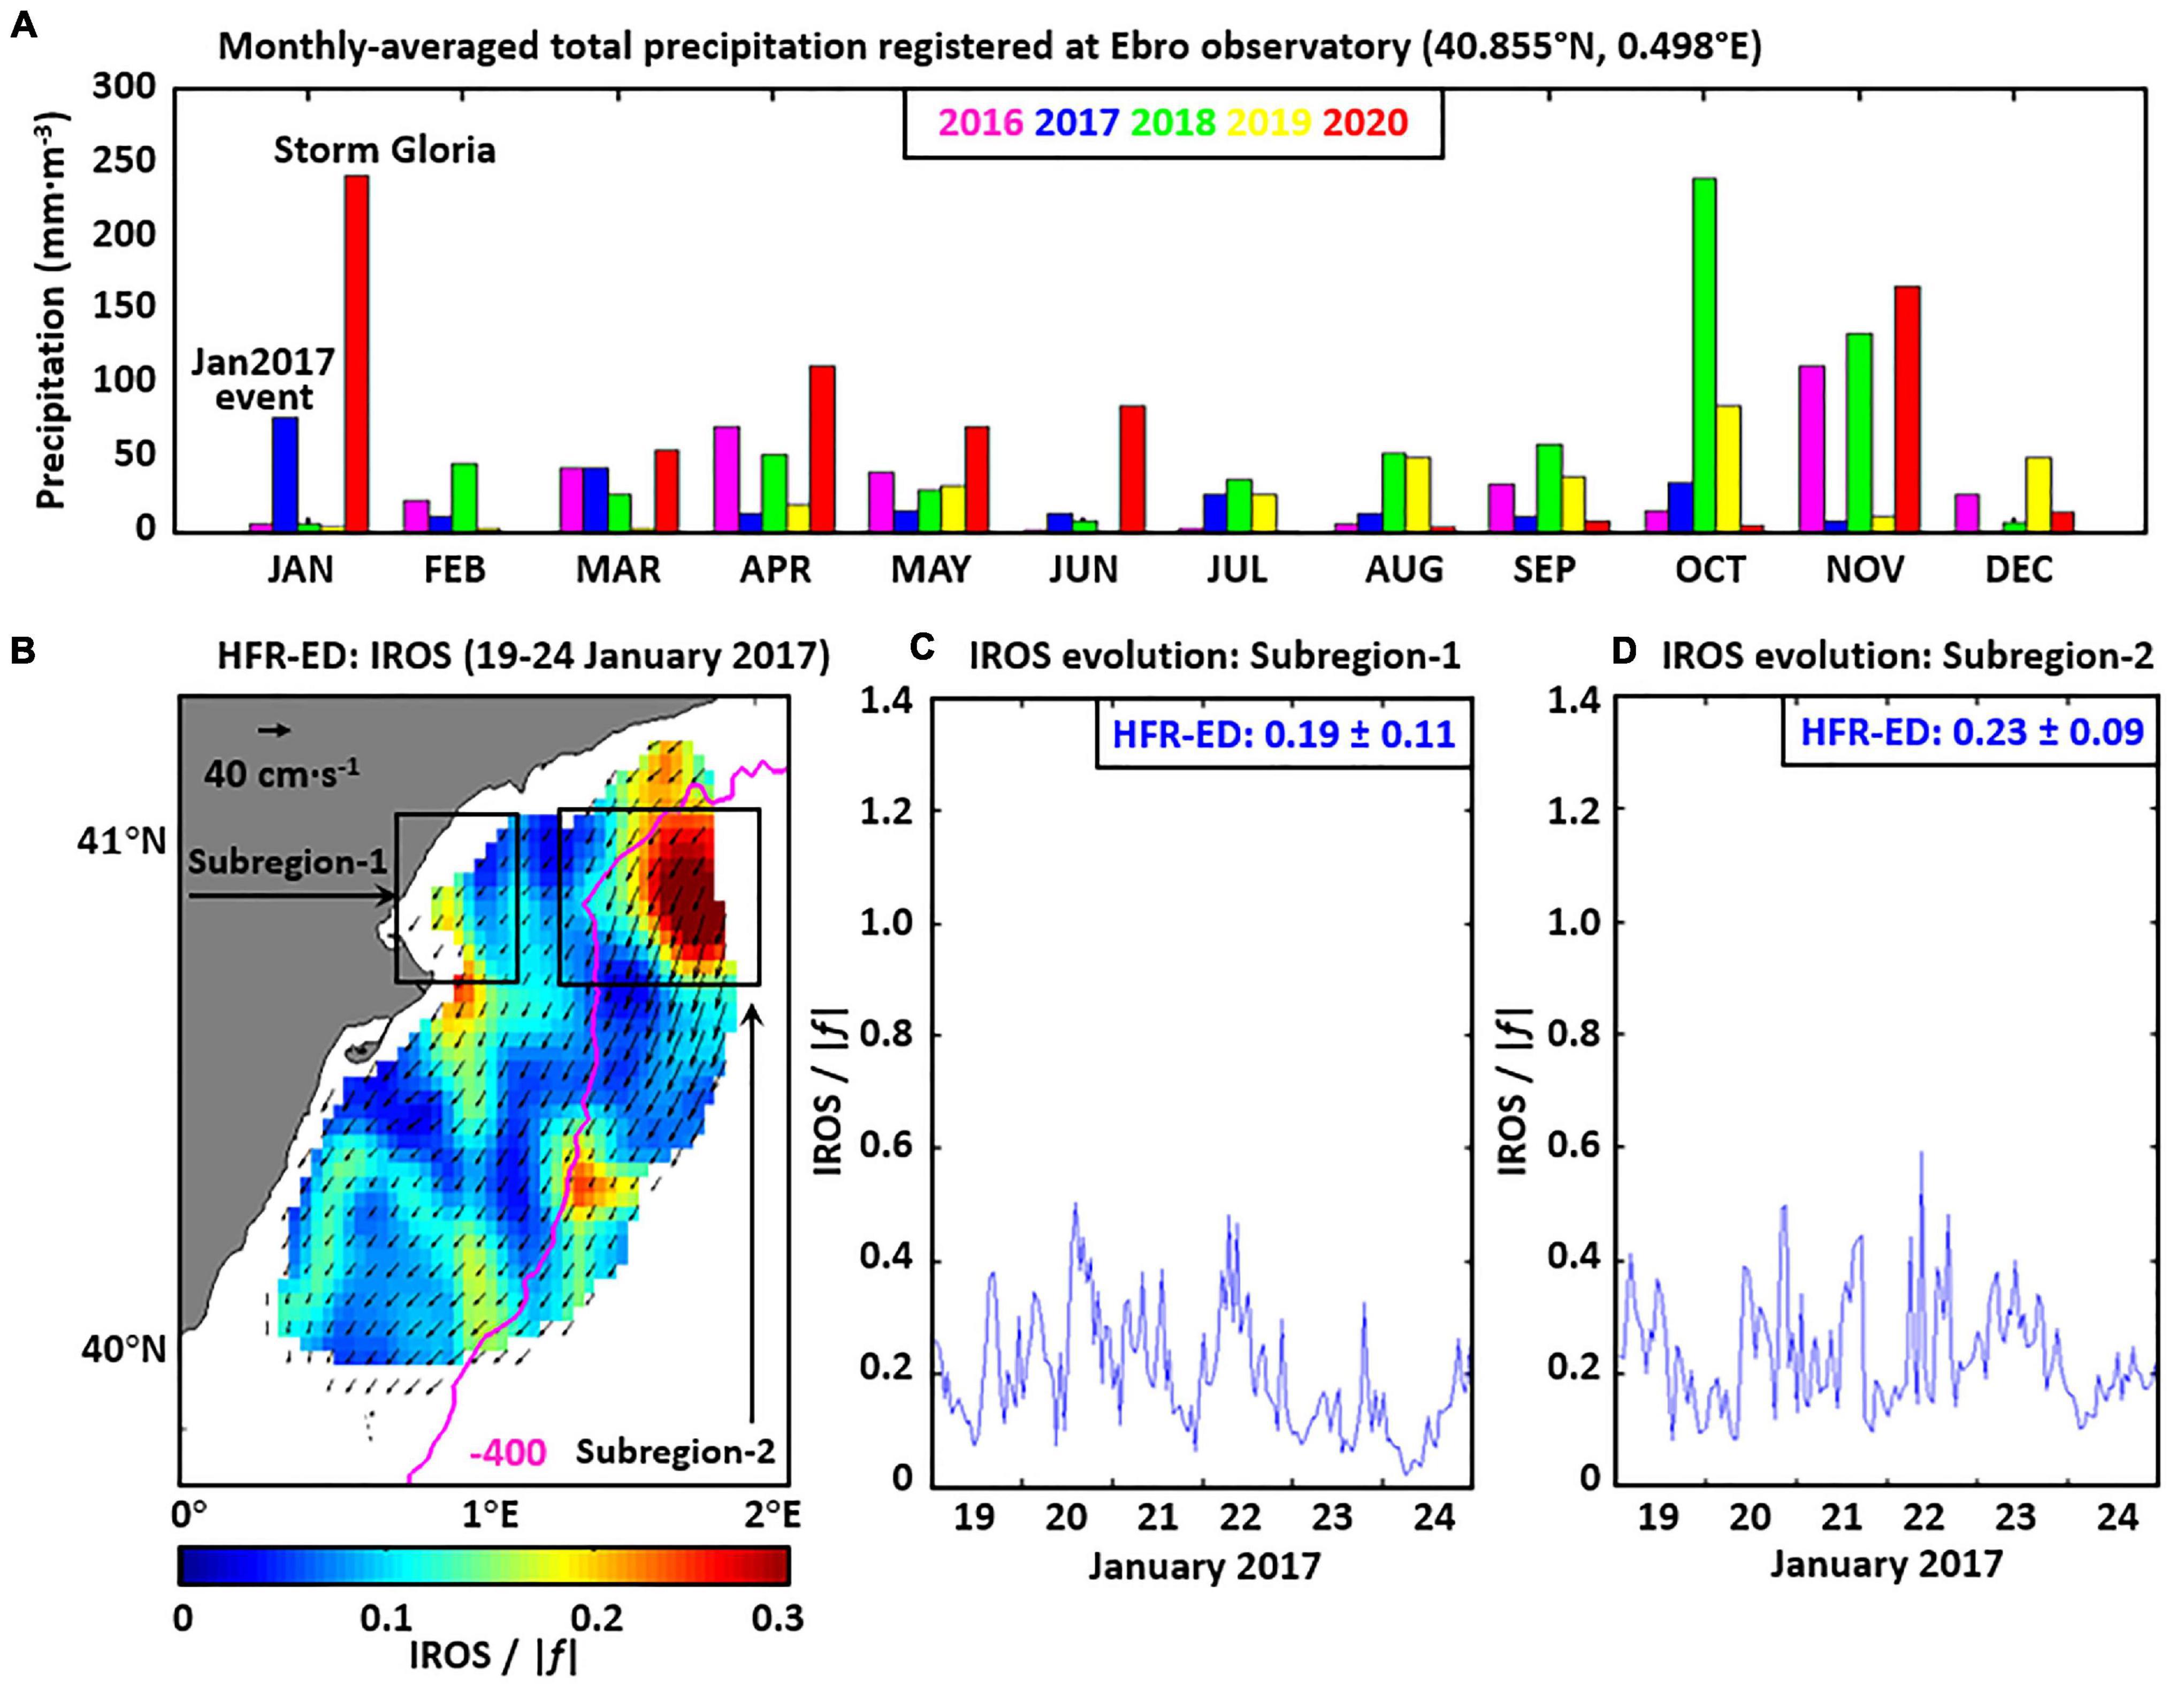
Figure 9. (A) Monthly averaged precipitation registered at the Ebro observatory for the period 2016–2020; (B) Time-averaged map of circulation and Instantaneous Rate of Separation (IROS) for the 6-day period (January 19–24, 2017) as derived from HFR-ED hourly surface currents. (C,D) Temporal evolution of IROS diagnostic, spatially averaged over two different subregions (denoted by black boxes in panel (B): in the northern periphery of ED mouth (C) and in north-easternmost sector (D).
The mean patterns of surface circulation and IROS for the Jan2017 event (Figure 9B) share some similarities with those observed during Gloria (Figure 7A) in terms of uniform southwestward flow and the relevant peak of IROS in the NE sector, respectively. By contrast, the additional maximum of IROS observed in the vicinity of ED during Gloria’s passage is rather weakened during the Jan2017 episode, with mean values generally below 0.2. This could be partially attributed to the weaker current speeds registered in ED (Figure 5C) along with the lower rate of total precipitation (Figure 9A) and the related moderate riverine discharge. Equally, the temporal evolution of hourly IROS, spatially averaged over each subregion, exhibited moderate fluctuations and maximum values below 0.6 in both subregions (Figures 9C,D). These findings seem to complement those previously exposed concerning the differential factors between both extreme events, highlighting the ED periphery as an area of enhanced dispersive nature during storm Gloria.
In order to provide a historical perspective, a comparison between hourly IROS values (spatially averaged over subregion-1) for both the past 4 years (2016–2019) and for the 6-day storm timeline was performed (Figure 10). A truncated cliff-like histogram, strongly shifted to lower values, was obtained for the long-term time series, with only the 8% of IROS values lying above 0.4 (Figure 10A). On the contrary, a more uniform distribution was derived from HFR-ED estimations during Gloria, with a higher percentage (45%) of IROS values above 0.4 (Figure 10B). Albeit also positively skewed, the mean and P99 values almost doubled the historical statistics, underlying the exceptional impact of Gloria in the northern hemidelta.
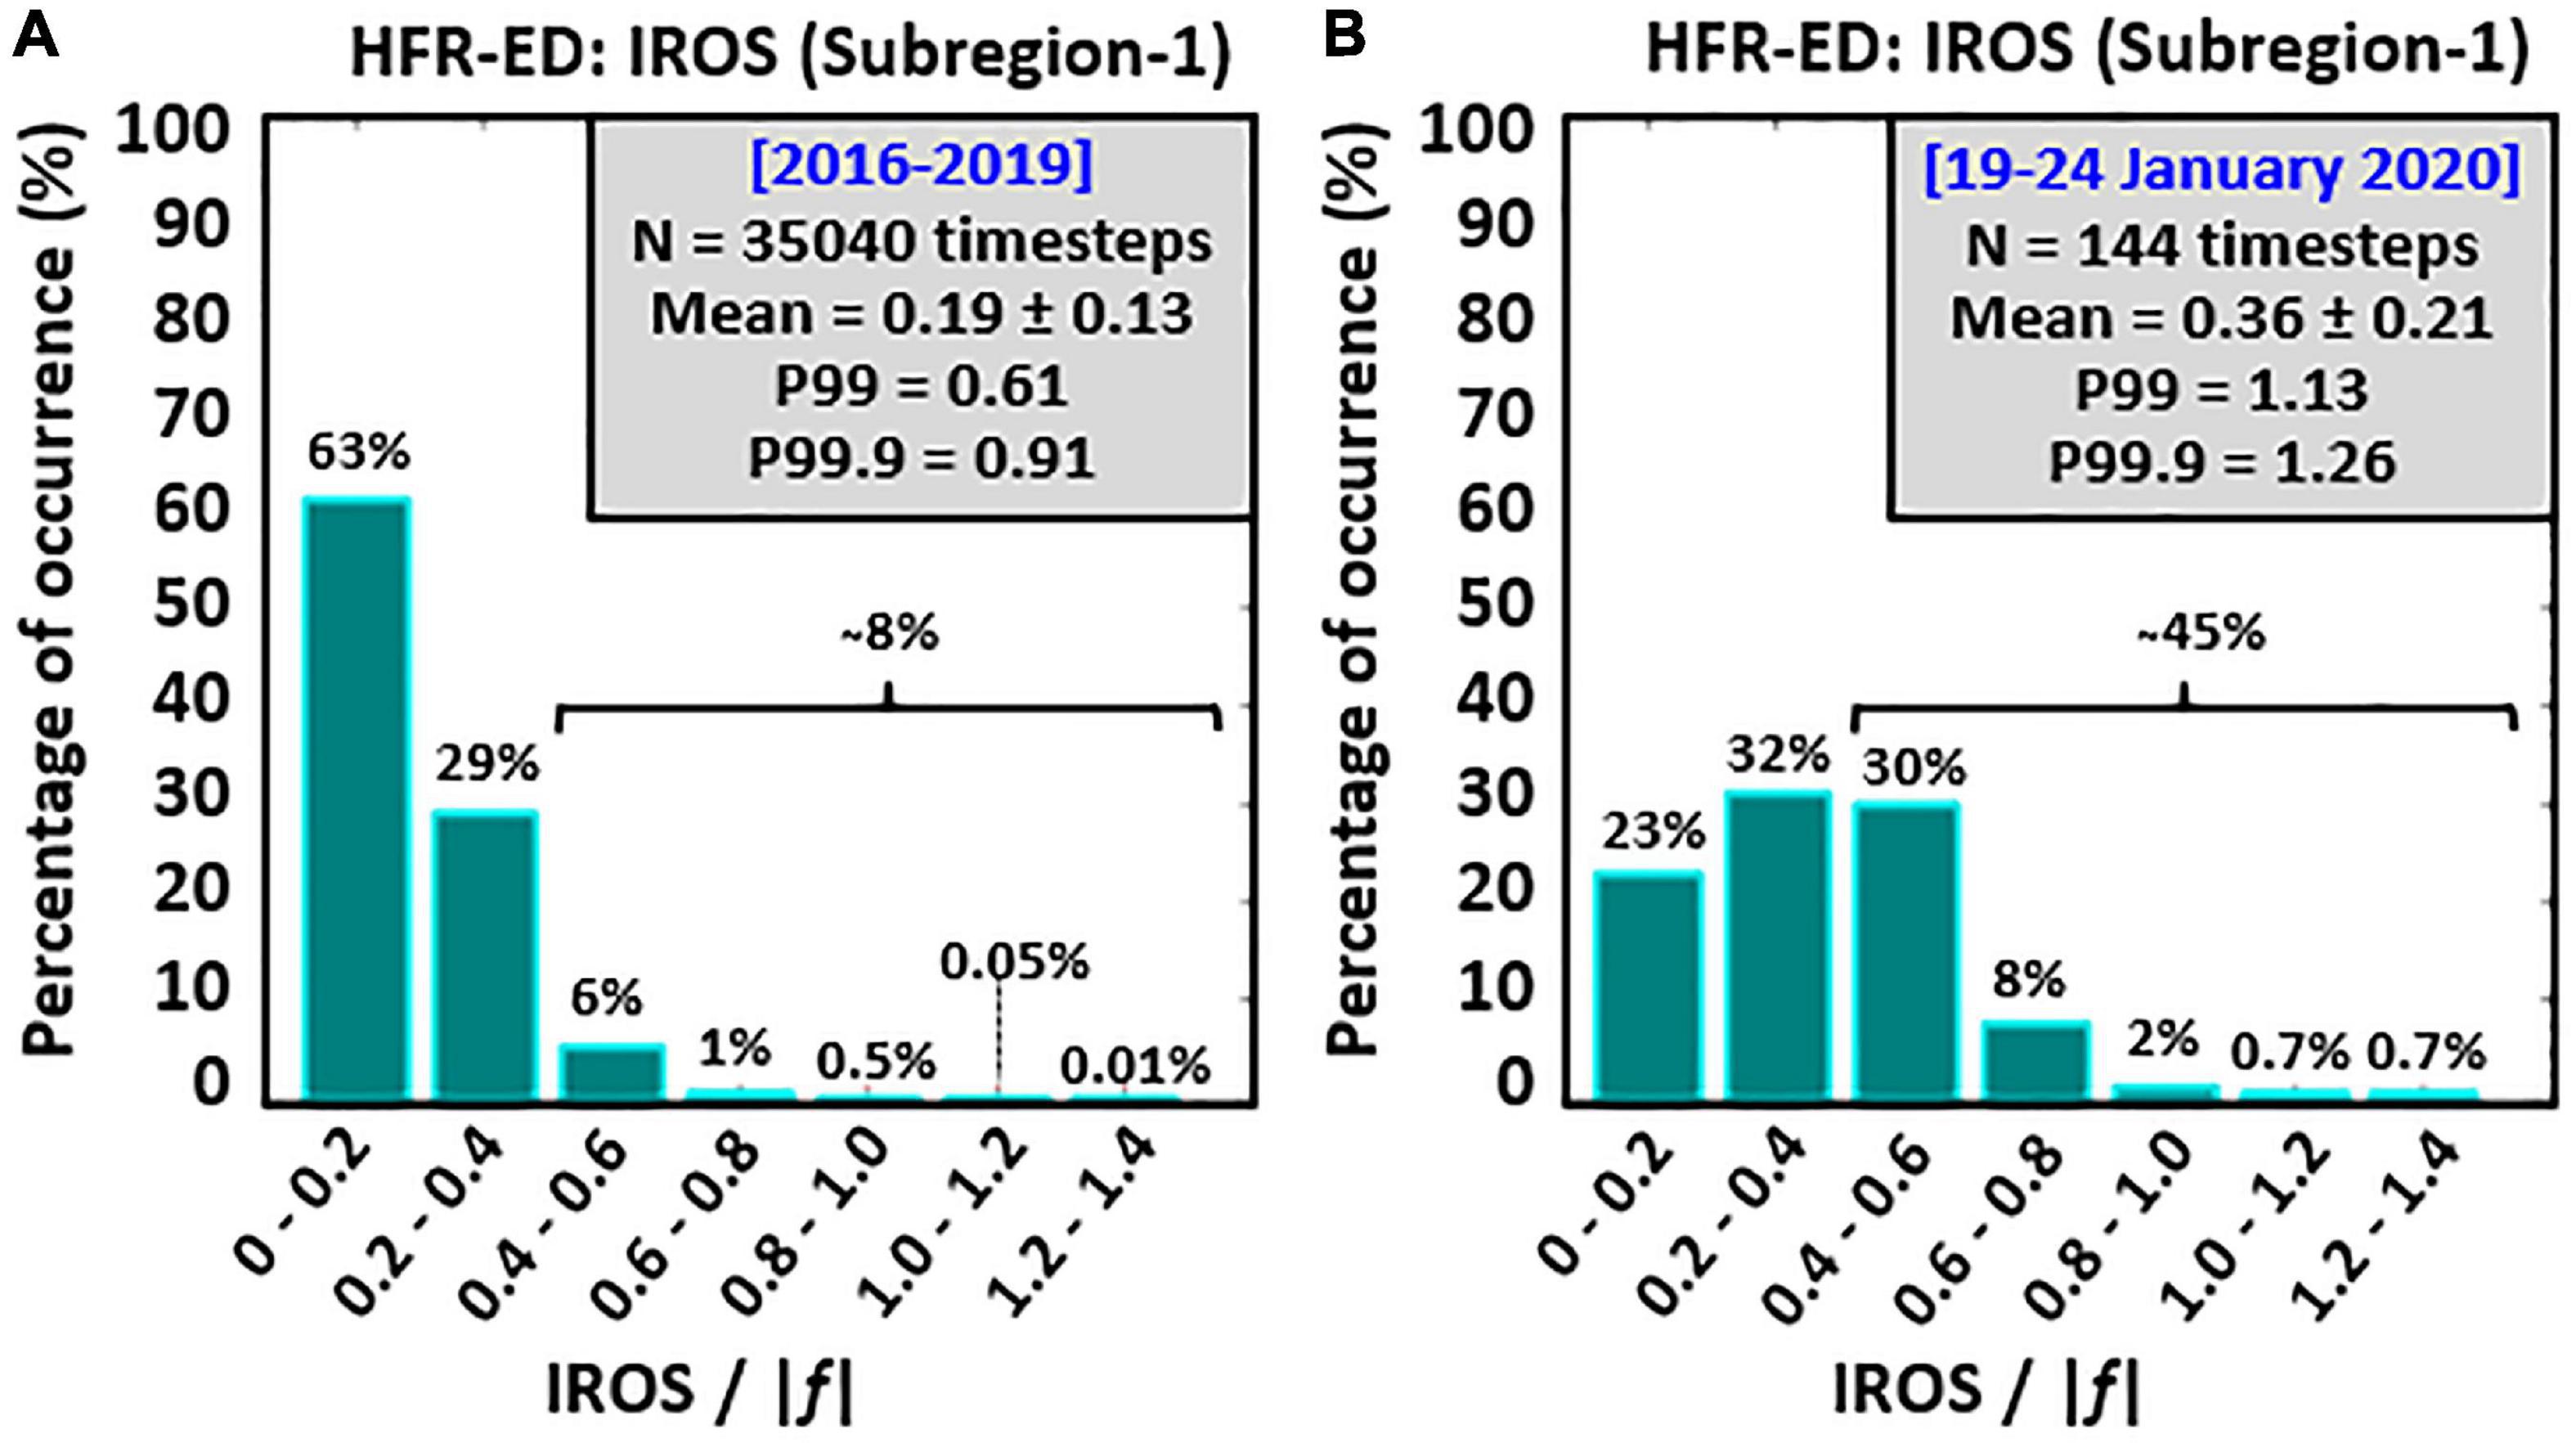
Figure 10. Histogram of the Instantaneous Rate of Separation (IROS), derived from HFR-ED hourly current estimations and spatially averaged over the subregion-1 (defined in Figure 7A) for: (A) the entire historical dataset (2016–2019); (B) the 6-day period when storm Gloria impacted on the Ebro Delta (January 19–24, 2020).
Circulation in the IC
During Gloria’s passage, the automatic weather station located in Ibiza (Wsta in Figure 1A) registered a flash drop of the atmospheric pressure from 1,031 to 1,013 hPa in barely 27 h (Figure 11A). Such an abrupt decrease of 18 hPa was dictated by the southward migration of the low-pressure system during January 18 and 19, which generated an exceptionally sharp gradient of SLP between the northern and southern WMS sub-basins. By the end of the January 19, strong easterlies were predominant over the IC (Figure 11B). While hourly averaged wind speeds were above 11 m s–1 on the January 20 midnight, 1-min records of wind gusts (not shown) fairly exceeded 21 m s–1.
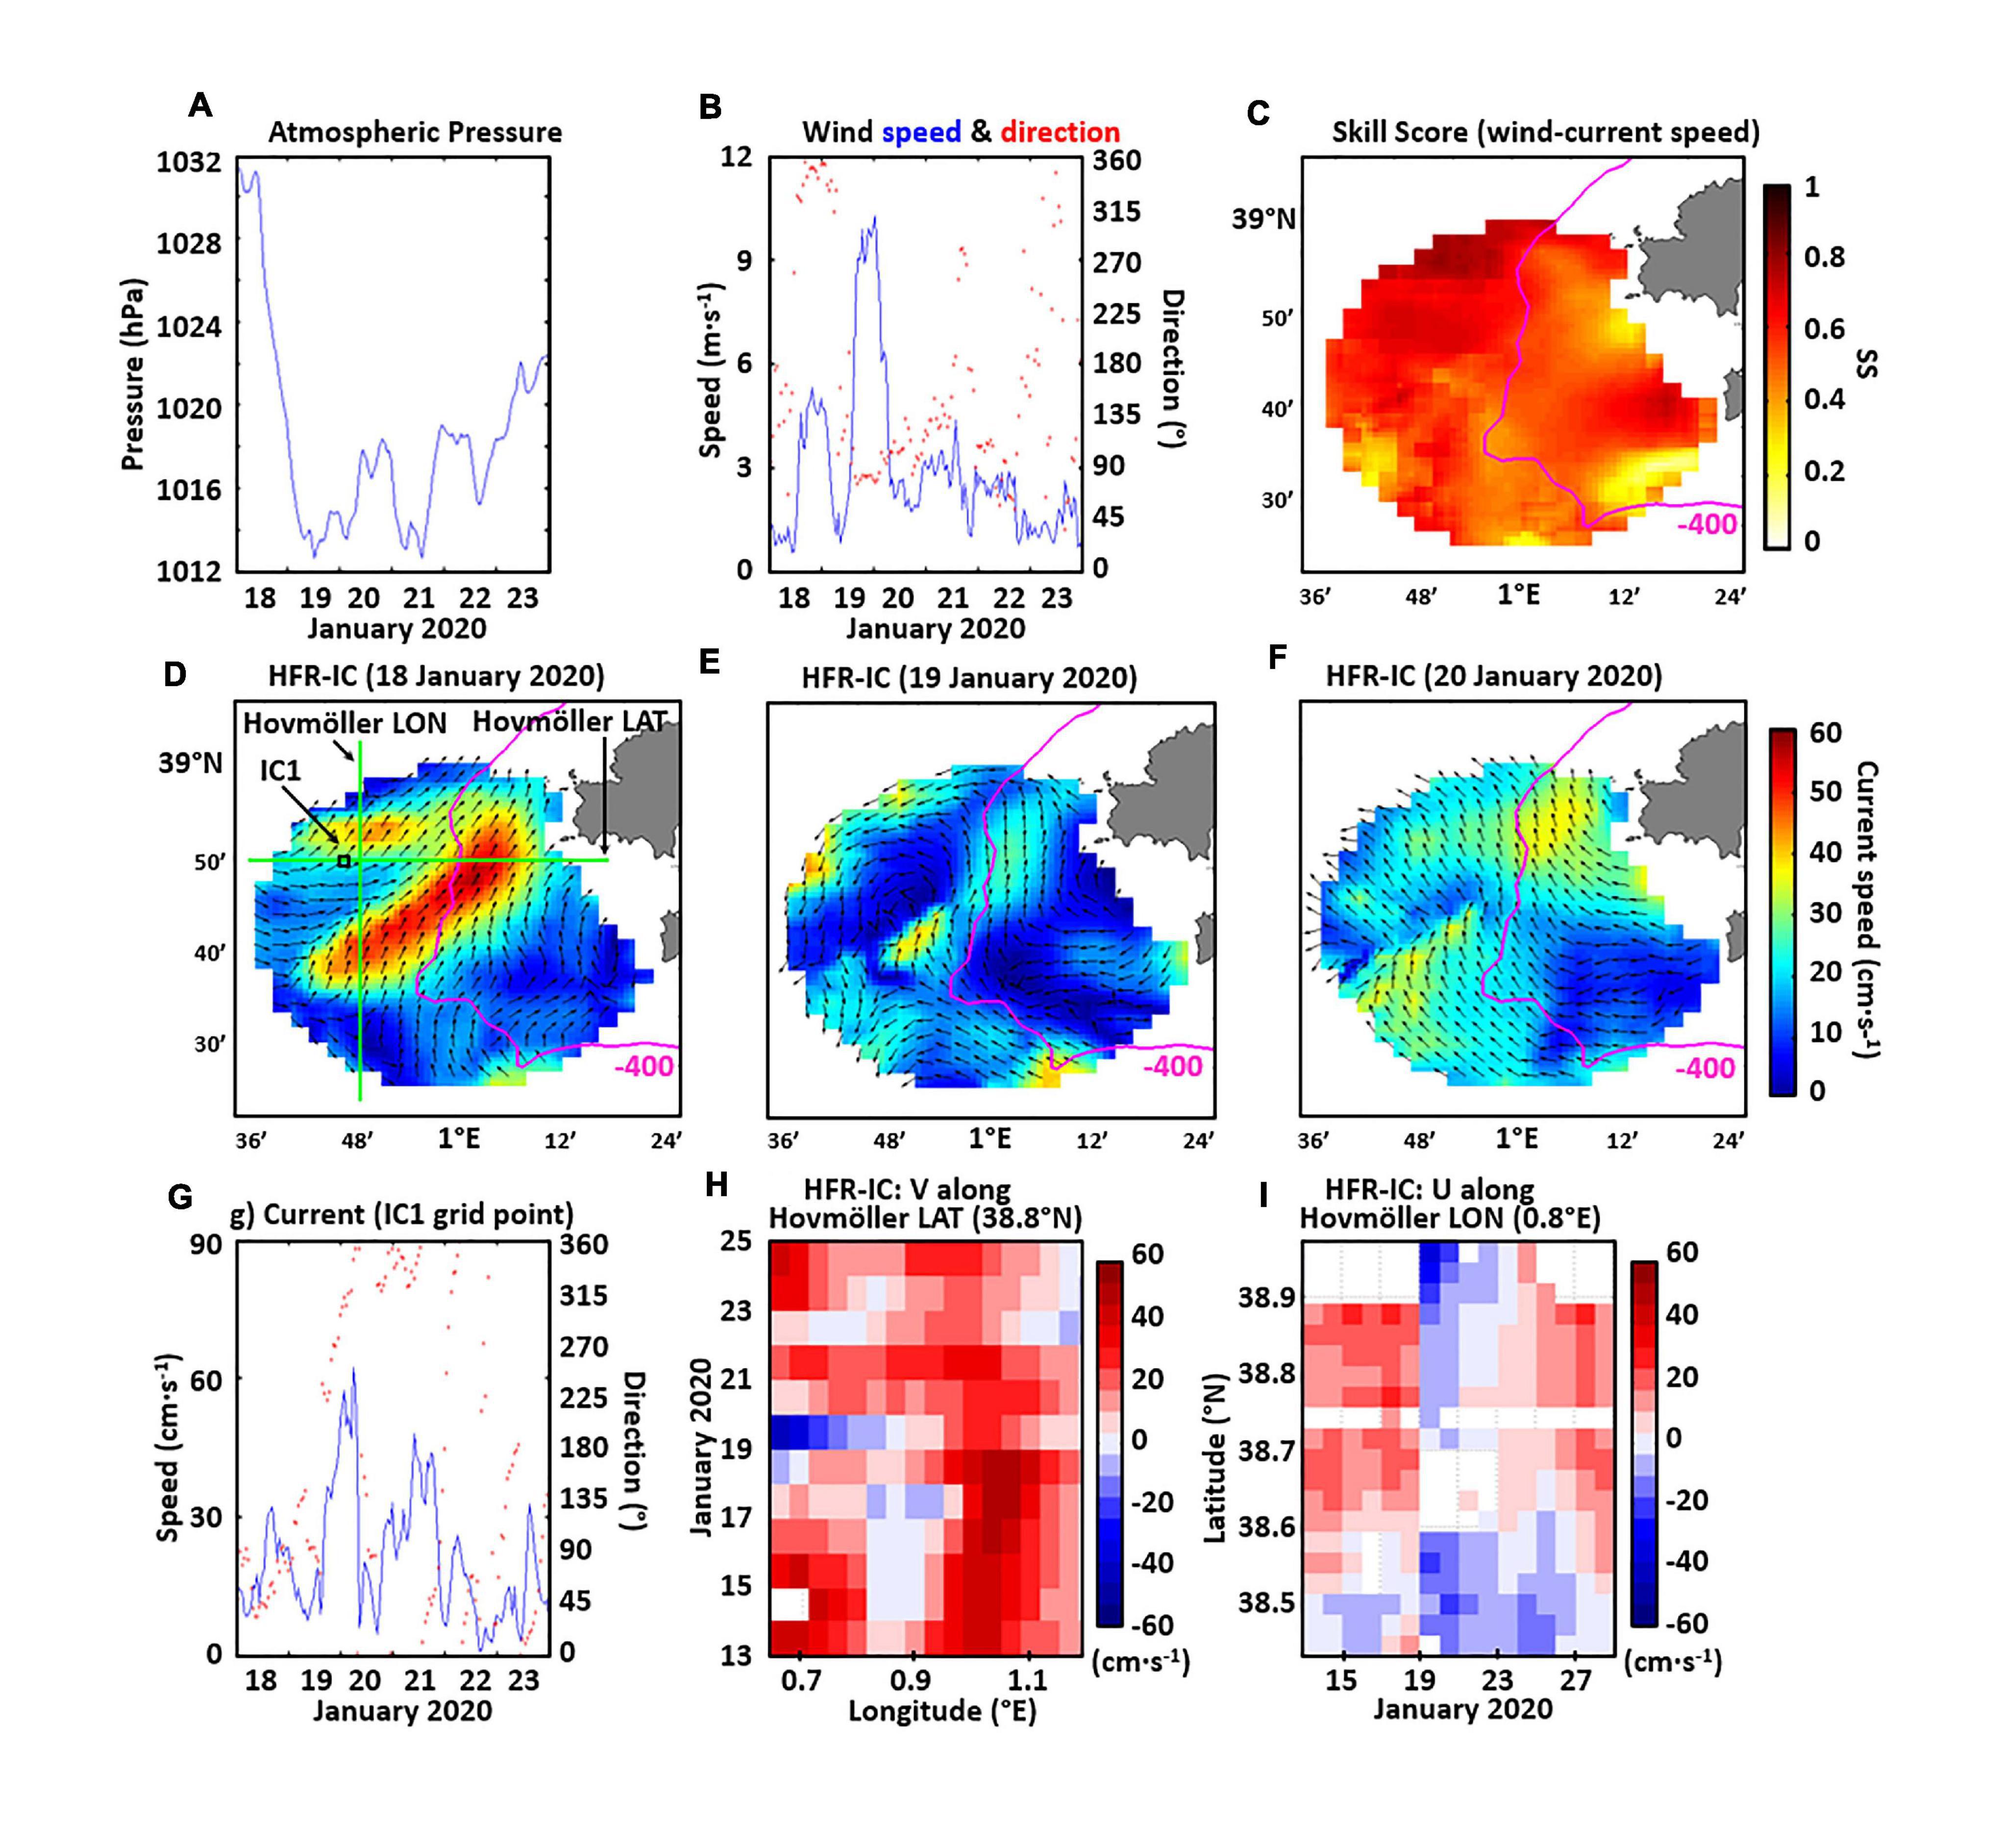
Figure 11. Six-day time series of hourly SLP (A), wind speed (blue line) and direction (red dots) at 25 m height (B) registered by an Autonomous Weather Station (Wsta in Figure 1A); (C) Map of Skill Score (SS) between hourly wind speed registered at Wsta and current speed estimated by HFR-IC, for a 6-day period from January 18–23. Daily surface circulation maps as derived from HFR-IC current estimations before (D), during (E), and after (F) storm Gloria passage. Green lines indicate the latitudinal and longitudinal transects selected to compute Hovmöller diagrams. The location of IC1 grid point (coincident with the Ibiza Channel buoy, out of order during storm Gloria) is denoted by a black square; (G) 6-day time series of hourly surface current speed (blue line) and direction (red dots) at IC1 grid point (°N, °E); (H) Hovmöller diagram of HFR-derived meridional (V) currents along the selected transect at 38.8°N; (I) Hovmöller diagram of HFR-derived zonal (U) currents along the selected transect at 0.8°E. Red (blue) colors indicate northward (southward) and eastward (westward) currents in panels (H) and (I), respectively.
Since local wind has been largely invoked as the main driver of the surface circulation variability in the IC (Lana et al., 2016), a map of SS between wind speeds registered at Wsta and HFR-derived current speeds was computed for a 6-day period (Figure 11C). Results seem to confirm the immediate reaction of the surface circulation, with SS values emerging above 0.6 over most part of the HFR footprint. The direct response of upper oceanic layer to wind forcing was inferred from daily averaged current maps provided by the HFR-IC (Figures 11D,F). The well-defined presence of the Balearic current flowing from the SW to the NW with maximum speeds above 50 cm s–1 was revealed for January 18 (Figure 11D), coherent with previous literature focused on the prevalent circulation features in this sub-basin (Garcia-Ladona et al., 1996). As a result of the rapid shift to powerful easterlies during the January 19, the surface flow turned towards the SW in the western part of the HFR coverage, forming a meander-like structure in the core of the HFR domain (Figure 11E). On January 20th, the daily averaged pattern featured a rather uniform flow toward the NW (Figure 11F), induced by intense-moderate winds blowing from the SE (Figure 11B). The 6-day time series of hourly HFR-derived current speed and direction estimations at IC1 grid point (denoted in Figure 11D) revealed the intensification of the surface flow (with a monthly maximum of 60 cm s–1) and its clockwise veering (from NE to SW during the storm and to NW afterwards) during January 19. At first glance, the resemblance between wind (Figure 11B) and current (Figure 11G) speed time series is noticeable, in concordance with the results exposed in Figure 11C. The results of the best linear fit of scatter plot (not shown) show a slope and a correlation coefficient of 1 and 0.72, respectively.
The Hovmöller diagram of HFR-IC meridional current exhibits the traditional portrait of the Balearic current flowing to the north, abruptly interrupted on the western part during January 19 (Figure 11H). A flow reversal was readily identified, stronger in open waters and weaker toward the center of the domain, from where the northwards flow prevailed over the continental shelf. The following days, the Balearic current restored to its usual pathway to the north along the entire transect. Additionally, the Hovmöller diagram of the zonal component (Figure 11I) shows the overall change in the predominant eastward circulation, which turned westward during January 19–20 along the whole latitudinal transect selected within the HFR-IC domain.
Circulation in the SoG
The upper circulation in the SoG during pre-storm conditions exhibited the classical picture of the strong inflow of Atlantic waters into the Alboran Sea (Figure 12A). The daily averaged surface pattern provided by the HFR-SoG system for January 19 revealed northeastward speeds above 150 cm s–1 in the narrowest section of the strait. By contrast, the HFR footprint for January 20 already showcased the remote effect of Gloria, with an abrupt drop of the AJ speed (Figure 12). Albeit still flowing to the NE, the inflow at SoG1 grid point (denoted in Figure 12A) was rapidly decelerated by 66% to approximately 50 cm s–1. Additionally, it is worth mentioning the presence of the coastal countercurrent in the periphery of Algeciras Bay, tied to the formation of an elongated cyclonic vortex in the northeastern entrance of the SoG.
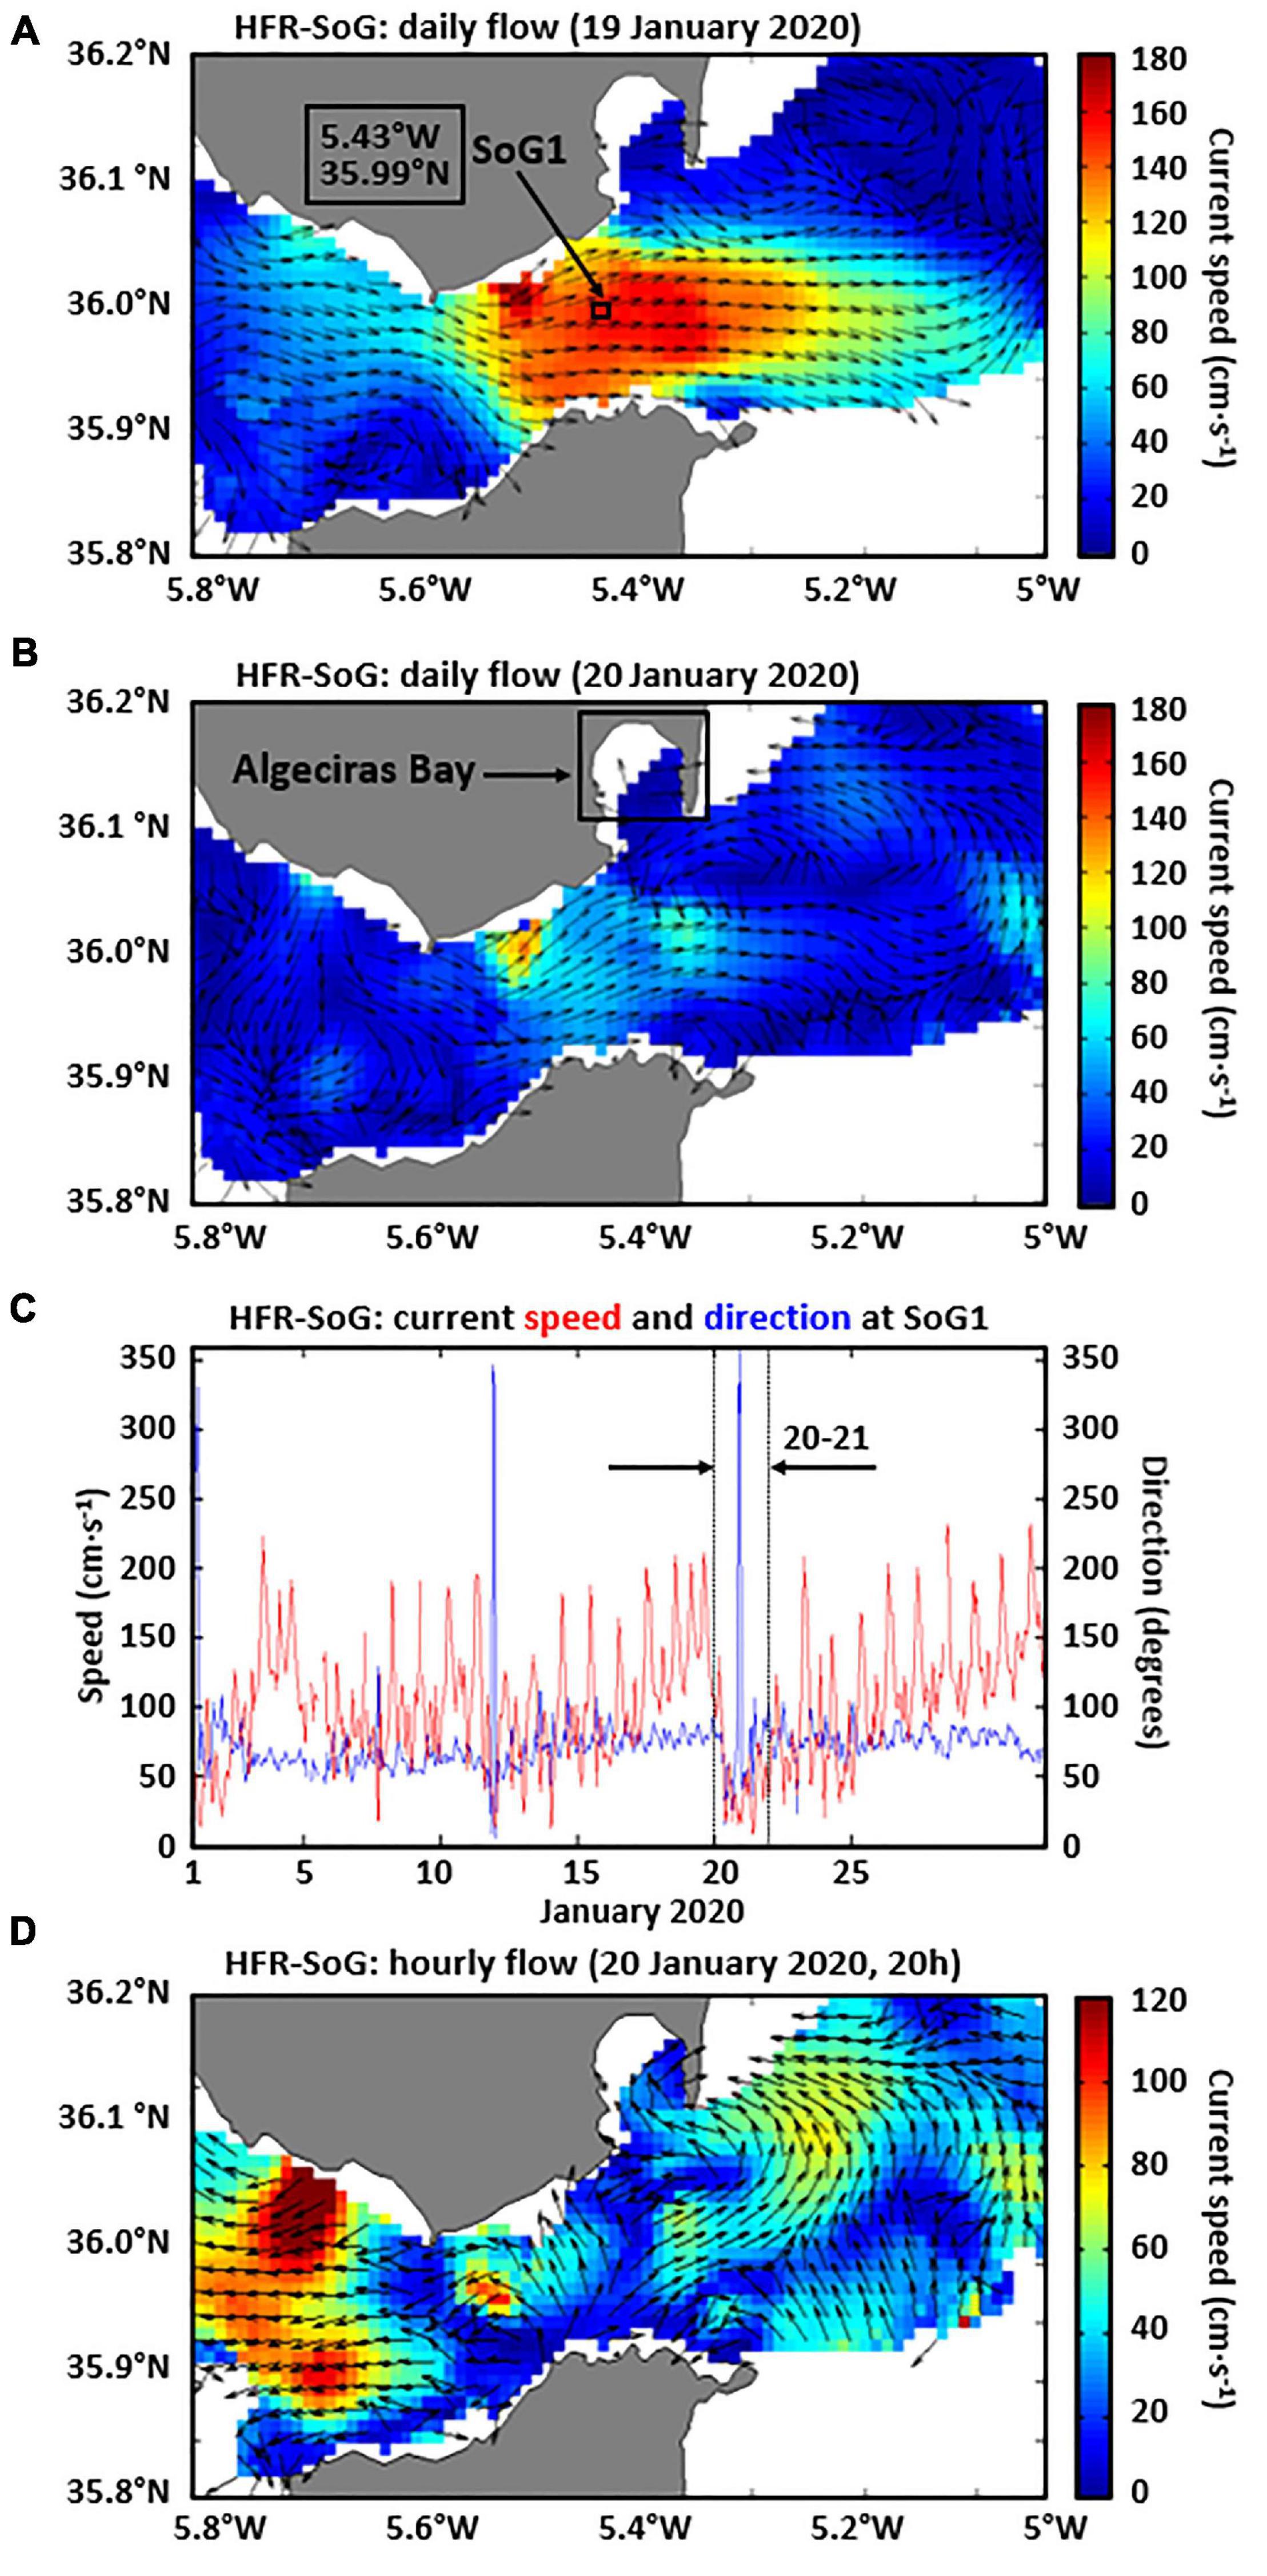
Figure 12. Daily-averaged surface circulation in the Strait of Gibraltar (SoG) as observed with the HFR-SoG system for panel (A) the January 19, 2020 (pre Storm Gloria conditions) and (B) January 20, 2020 (during Storm Gloria); (C) Hourly evolution of surface current speed (red line) and direction (blue line) at SoG1 grid point [denoted in panel (A)] of the HFR-SoG system during January 2020. Abrupt changes in both parameters during Storm Gloria (20–21) are delimited with a dotted black box; (D) HFR-derived hourly surface circulation for January 20, 2020 (20 h).
The monthly monitoring of AJ speed and direction at SoG1 grid point during January 2020 evidenced the tight connection between both parameters (Figure 12C). With current velocities above 50 cm s–1, the AJ seemed to be locked at angles from 70° to 80°. The AJ hourly speed typically fluctuated in the range [50–150] cm s–1, with current pulses often exceeding 200 cm s–1. Short-lived sharp shifts in AJ orientation were concurrent with sporadic speed drops below 50 cm s–1. During the mature stage of Gloria (January 20–21), the combined action of manifold factors modulated the upper layer transport through the SoG, namely: (i) the low-pressure system centered over the northern African coast (Figure 2A); (ii) higher SLP on the Atlantic facade; and (iii) strong and persistent easterlies over the western Alboran Sea and the Gulf of Cadiz (Figure 2B). Served as an example, Figure 12D displays the HFR-derived hourly surface circulation for the January 20 (20 h). Despite the noisy pattern in the WMS side, a rather uniform inversion of the surface flow can be observed in the westernmost sector of the HFR footprint, with westward currents exceeding 70 cm s–1. The complex surface circulation featured in the WMS sector seems to be the result of the intricated interplay between the weakened and more zonal AJ inflow (to the east) and the storm-induced currents (to the west), which are in turn modulated also by barotropic tidal fluctuations. Superimposed to these factors, the presence and morphological configuration of the semi-enclosed Algeciras Bay has been recently reported to influence the SoG dynamics in its easternmost part (García-Lafuente et al., 2019).
Three-Dimensional Response of the Water Column to Gloria
IBI-FC05 predicted 5-day ahead a significant vertical mixing due to the turbulence injected by the surface wind stress in the oceanic mixed layer. As a consequence, MLD deepened below 120 m along most of the shelf break (Figure 13A). The local minimum of MLD (around 75 m) forecasted by IBI-FC05 at 40.67°N was coincident with a locus of maximum horizontal DIV of water masses (Figure 13B). Surface DIV generated upward vertical motions that partially compensated the thickening of the MLD due to Gloria’s passage. By contrast, the along-shore belt of negative DIV (i.e., horizontal convergence) shown in Figure 13B entailed the downward displacement of surface waters to lower levels that underpinned the deepening of the MLD. This convergent zone is precisely where the highest rate of MLD variation (∼60 m) was predicted, according to the black isolines in Figure 13A. However, the MLD barely thickened 30 m in shallower coastal areas.
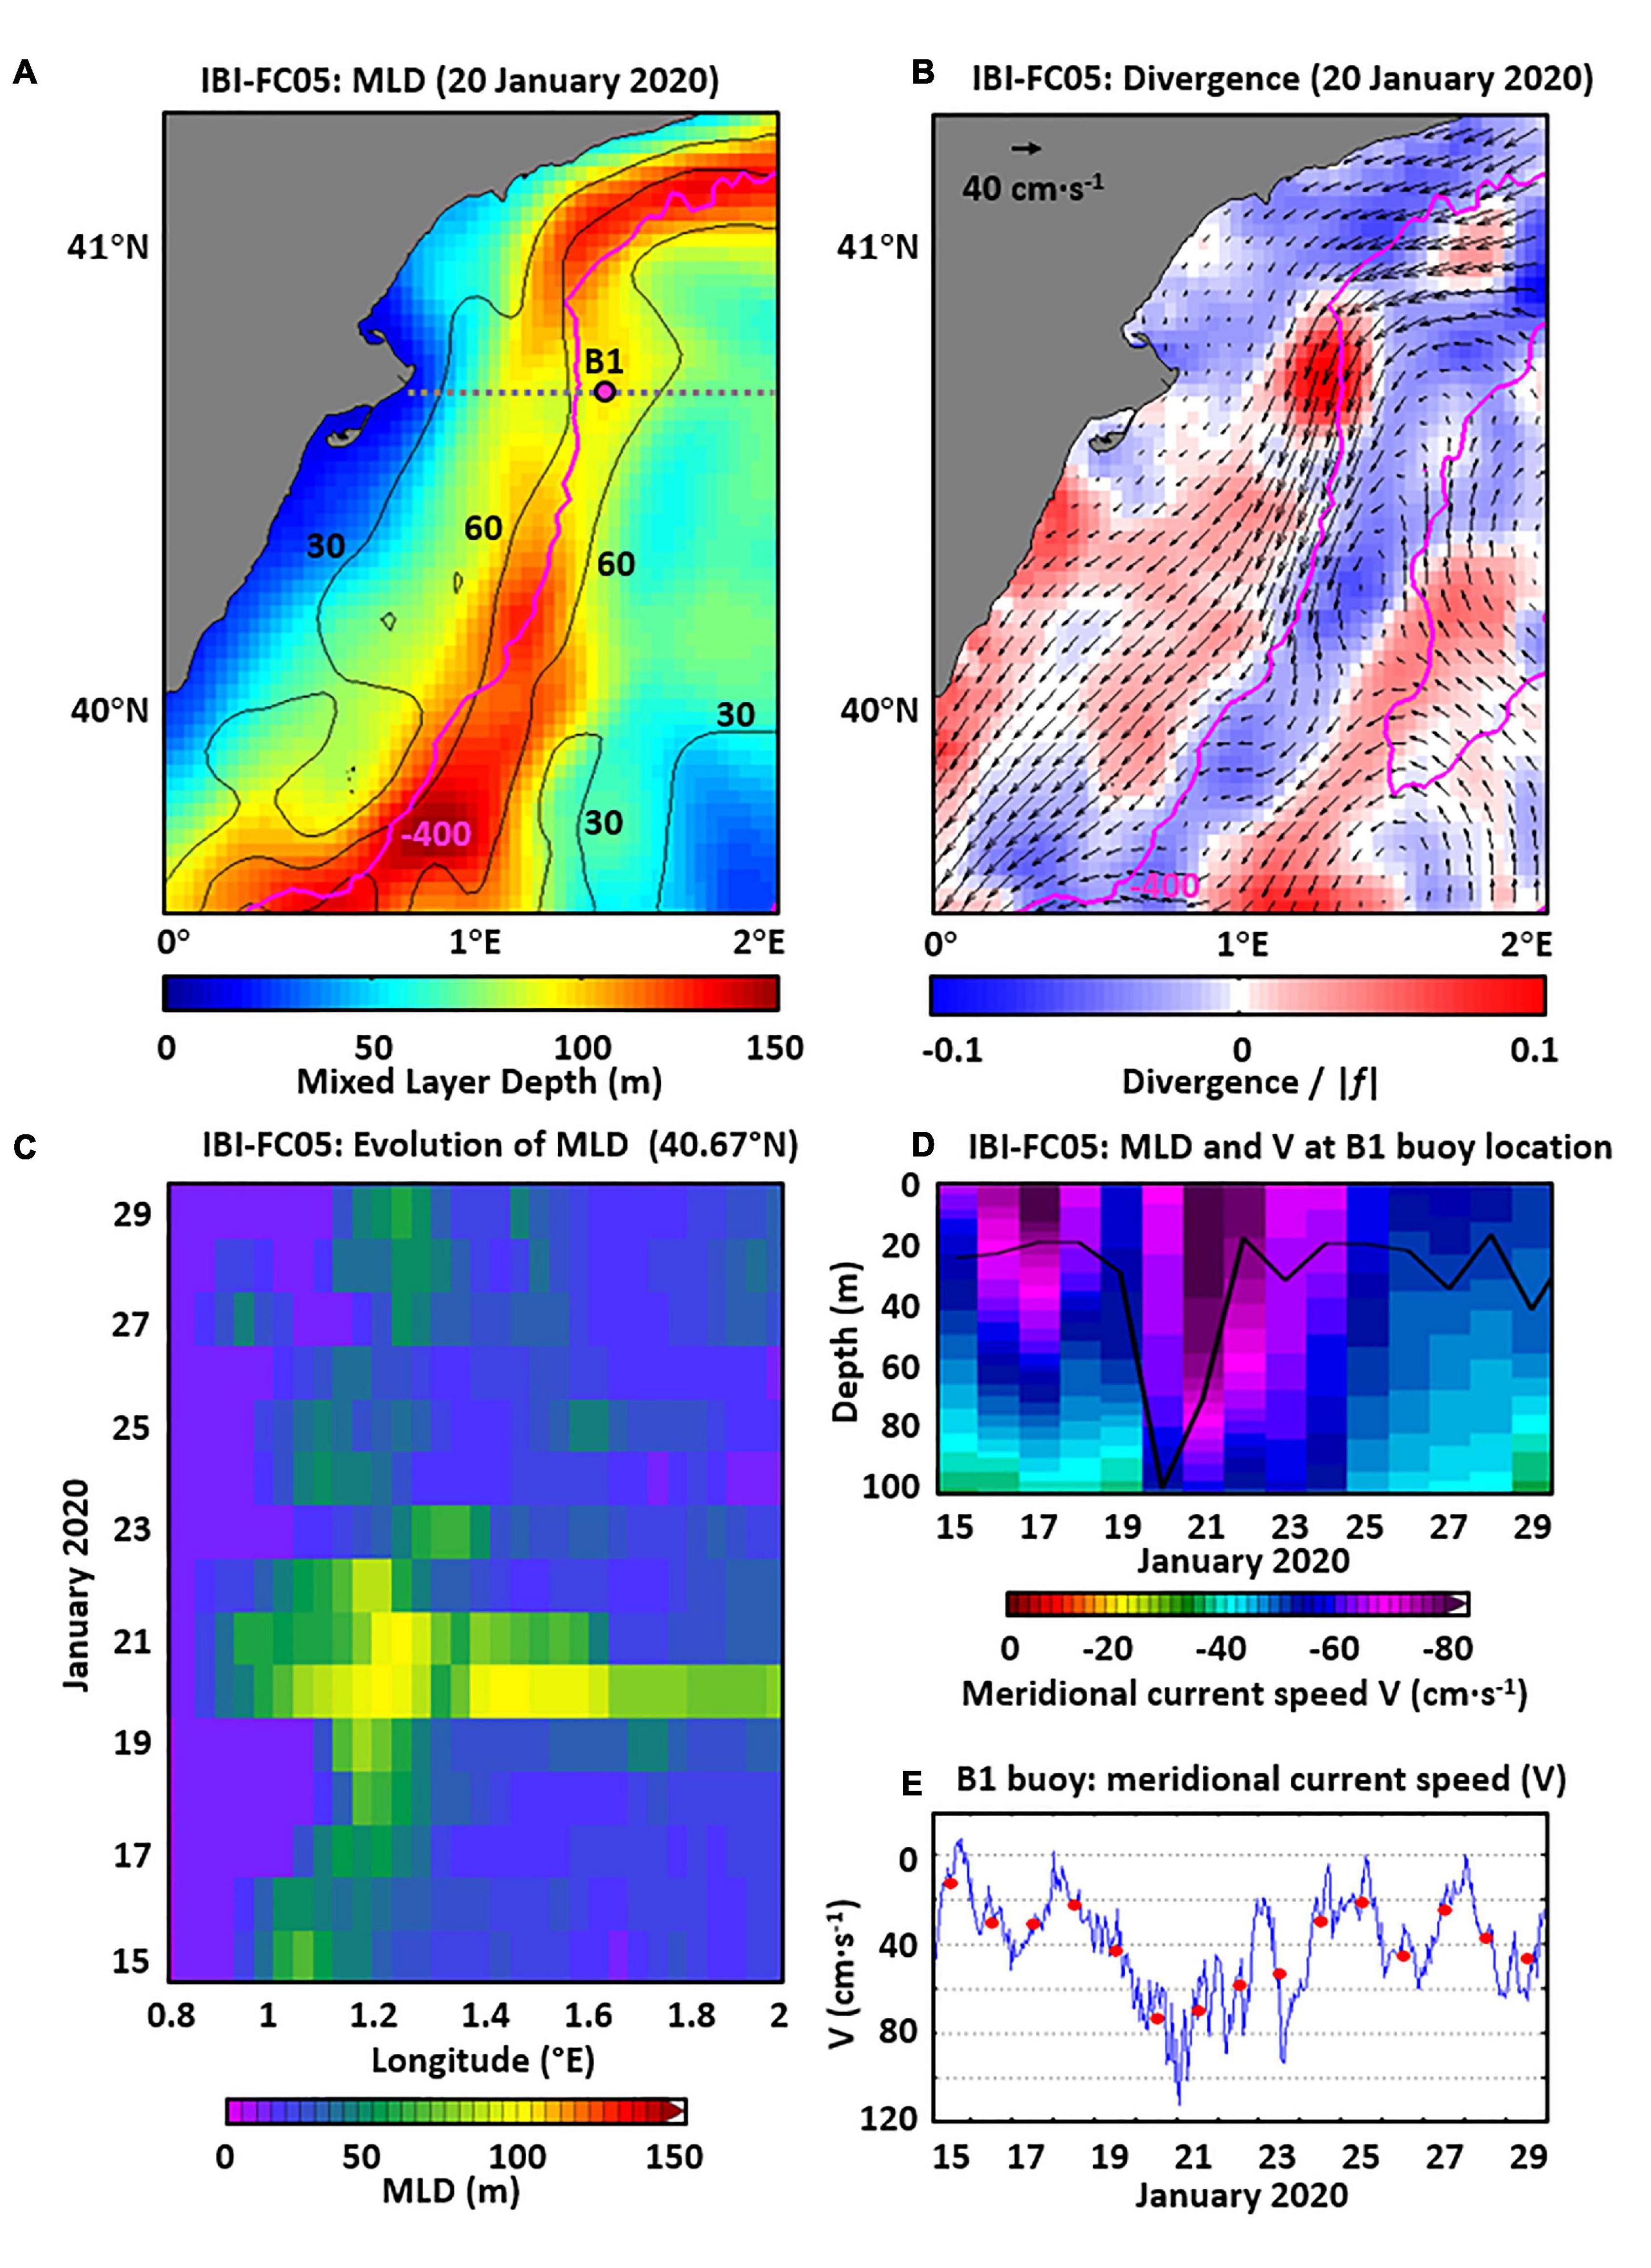
Figure 13. (A) Map of mixed layer depth (MLD) for the January 20, 2020; contours indicate positive difference between MLD of January 20 versus January 18 (48 h before); (B) Map of daily averaged horizontal divergence as derived from IBI surface current outcomes five days ahead (IBI-FC05), for January 20; pink dot represents B1 buoy location; gray dotted line indicates transect of further analysis in panel (C); (C) Hovmöller diagram of daily MLD corresponding to a transect of constant latitude, denoted in panel (B); (D) Temporal evolution of MLD and meridional currents (V), derived from IBI-FC05 outcomes at B1 location: negative values of V indicate southward flow; (E) Time series of meridional (V) currents registered at B1 buoy: hourly and daily averaged values represented by a blue line and red filled dots, respectively.
A Hovmöller diagram computed at a selected transect of constant latitude (40.67°N) revealed that the steep deepening to [75–100] m was mainly delimited to Gloria’s mature stage, January 20 and 21 (Figure 13C). At B1 buoy location (1.47°E, 40.67°N), the temporal evolution of modeled MLD used to fluctuate daily in the range [20–30] m during the second fortnight of January (solid black line in Figure 13D). Gloria caused an exceptional 2-day thickening of the MLD, which was almost concurrent with an overall intensification of the southward flow in the first 100 m of the water column (Figure 13D). Vigorous ocean currents (above 70 cm s–1) were predicted at 80 m depth levels. The evolution of meridional current speeds predicted by IBI-FC05 resembled qualitatively those measured by B1 buoy at 3.5 m depth (Figure 13E). Therefore, it seems evident the prompt upper ocean response to the wind forcing in terms of a quasi-homogeneous deep layer, despite the 1-day delay between the maximum MLD and the peak of southward current speed.
Discussion and Main Conclusion
Storm Gloria can be interpreted in holistic terms as a high-impact once-in-a-decade metocean event in the northern WMS where a combination of several extremes occurred sequentially with common underlying conditions. Percentile technique was used to evaluate extremes, describing the storm from a broader historical framework. Percentiles 99 and 99.9, derived from long-term observational time series, were fairly exceeded for a wealth of metocean parameters, encompassing wind speed, SWH and period, surface current velocity and, to a lesser extent, the sea surface height (Table 2).
From a merely atmospheric perspective, the primary contributors, at synoptic scale, were: (i) the record-breaking anticyclone over central Europe (Figure 2A), with the highest mean sea level barometric pressure reported in London since 1692 (Cornes et al., 2011). It reached 1049.6 hPa at Heathrow Airport, close to the all-time national record of 1053.6 hPa measured at Aberdeen Observatory on January 31, 1902 (Met Office Factsheet, 2016); (ii) the sudden, deep decrease of SLP in the southern WMS, with a constant ratio of almost 1 hPa per hour over a 17-h interval. This ratio is similar to pressure falls of 1 hPa per hour over a 24-h period traditionally ascribed to explosive cyclogenesis development (Allen et al., 2010); and (iii) the exceptional gradient of SLP between the northern and southern WMS sub-basins (Figures 2C,D) that induced very strong easterly winds (above the historical P99.9 set to 15.9 m s–1, see Table 2), that persistently blew for more than 24 consecutive hours over extensive areas of the northern WMS (Figure 2B).
Although out of the scope of the present contribution, it might be worth analyzing in the future the feasibility of a novel index based on the spatially averaged SLP differences between the northern and southern WMS sub-basins. As a proof-of-concept investigation, such an index should be interpreted as a proxy to effectively monitor the severity of metocean conditions in the WMS, linking strong onshore-directed winds, induced extreme waves and the strengthened coastal circulation. In this context, this diagnostic would be similar to other existing teleconnection indices in the Mediterranean, traditionally derived either from the simple difference of some climate variable between two geographical locations or from the Principal Components approach (Criado-Aldeanueva and Soto-Navarro, 2013). The index here proposed would be, for instance, similar to a combination of the Western Europe Pressure Anomaly (WEPA) and the Western Mediterranean Oscillation (WeMO) indexes. The former, based on the SLP gradient between the station Valentia (Ireland) and Santa Cruz de Tenerife (Canary Islands), aims to better explain winter wave height variability along the coast of southwestern Europe (Castelle et al., 2017). The latter is an atmospheric teleconnection pattern defined as the SLP difference between San Fernando (SW Spain) and Padua (NE Italy) cities, developed as an indicator of precipitation on the littoral fringe of eastern Spain (Lopez-Bustins and Lemus-Canovas, 2020). Negative WeMO phases tend to be associated with rainy episodes in most of this territory due to Mediterranean humid easterly flows. Likewise, positive phases of the proposed index (above a predefined threshold to be still determined) would indicate a higher-than-usual wind/wave risk in the levantine coastline. This approach would additionally benefit from the optimal representation of the large-scale atmospheric forcing over the entire WMS basin, while station-based indices at fixed sites might be partially impacted by small-scale transient meteorological events. Therefore, this meaningful index could be used in strategic preparedness policies when predefined thresholds are abruptly and/or persistently exceeded. As previously stated by Adger et al. (2005), the establishment and efficient functioning of multi-hazard early warning systems (MHEWS) are crucial aspects (at both national and international governance levels) to enhance the socio-ecological resilience of coastal communities. These MHEWS should be integrated into robust capacity analysis frameworks, which cover a range of dimensions, such as legislative, planning, infrastructure, technical, scientific and institutional partnerships (Haigh et al., 2018).
In terms of wave height field, B1 buoy registered unprecedented, record-breaking values in the vicinity of ED. The performance of ALFA radar site (from HFR-ED system) was rather consistent despite a slight underestimation of the peak. Note that for a 13.5 MHz system like HFR-ED, the upper limit to the accurate detectability of waves is around 7.07 m (represented by a pink dashed line in Figure 3B). Since waves fairly exceeded not only the P99.9 (established at 4.1 m, see Table 2) but also this predefined threshold, the observed underestimation of the wave height maximum could be motivated by the fact that normal interpretation methods were applied to saturated spectra (Lipa and Nyden, 2005). Two different versions of CODAR Seasonde wave processing tool were used to monitor Gloria’s effects, R7 and R8, with the latter providing a significant (slight) improvement in the incoming Wd (SWH and Tc) for higher range arcs, as reflected by the statistical metrics obtained (Figure 3). Regardless of both the Seasonde software version and the range arc selected to perform the comparison between ALFA site and B1 buoy, the skill of HFR-ED to retrieve wave parameters during storm Gloria can be ranked (from higher to lower) in this order: SWH, Tc and Wd. Moreover, the assumption of homogeneity over the whole of each circular range cell in CODAR Seasonde HFR systems could also partially explain the differences detected between B1 and HFR-ED, due to relevant bathymetric variations in this coastal area. According to the time series collected at TG1 tide-gauge (Figure 3B), the sea water level rose sufficiently to be considered a non-negligible contributing factor. Whereas the P99 (0.61 m) was briefly overpassed, the P99.9 (0.72 m) was never matched (Table 2).
The retrospective comparison of Gloria and Jan2017 extreme episodes revealed that both shared similar directional features for wind and wave fields, which should be categorized as “standard” as they did not represent any substantial anomaly with respect to the given wind-wave climate (Figures 4C,D). On the contrary, the persistently strong wind (blowing over long fetch distances) and high SWH values definitively played a major role in the development of such violent events. The differential factor that turned Gloria into an unprecedented event, hence more intense than Jan2017, is the storm duration (more than four consecutive days) and the persistent surpassing of P99 threshold for several parameters. During Gloria, strong winds (22 h above the P99.9, until the sensor’s permanent outage) and high waves (64 h above the P99.9) were observed. In the case of the Jan2017 event, strong winds and high waves exceeded the P99.9 during 6 and 53 h, respectively. The minimum (usual) storm duration in the northern WMS have been reported to be 6 h (24 h), with waves higher than 5 m usually lasting less than 1 day (Lin-Ye et al., 2016).
With regards to the storm-induced surface circulation, a portion of the detected discrepancies between HFR-ED and B1 buoy current time series could be attributed to a number of elements already enumerated in the literature (Ohlmann et al., 2007). Apart from the instrumental noise, each device presents its own sampling strategy at a specific nominal depth. HFR-ED provides current estimates spatially averaged over vast areas, which are representative of the upper 0.9 m of the water column. By contrast, B1 buoy collects point measurements at a 3.5 m depth. Although the sub-grid horizontal shear and the geophysical variability within the water column might exert an adverse effect on this instrument-to-instrument comparison, results illustrate that HFR-ED performance was accurate during Gloria’s passage. The unprecedented intensification of the Northern Current in its southward pathway and the subsequent restoration back to the usual range of speeds was, to a large extent, adequately reproduced by the HFR-ED system in terms of overall strength and timing (Figures 5A,B).
To quantify particles dispersion and resolve basic flow features during Gloria, maps of current vectors, superimposed with fields of IROS, were derived from hourly HFR-ED estimations (Figures 7, 8). The IROS field during Gloria’s passage exhibited extreme magnitudes in the vicinity of the northern hemidelta (denoted as subregion-1 in Figure 7A), reaching a peak by January 21 (Figure 8C). The mean and P99 values of IROS almost doubled the historical statistics, indicating the unprecedented effect of Gloria on this subregion (Figure 10). Concurrently, a maximum of current speed was observed within the entire HFR-ED footprint (Figure 5D). These findings are of great significance since particle transport and diffusion of passive tracers in the upper ocean are determined not only by strong currents but also by wave-induced Stokes drift and the turbulent mixing generated by breaking waves (Staneva et al., 2021). Then, the peak of IROS at Ebro river mouth seem to suggest the existence of relevant interactions between the existing strong currents and extreme waves. This conjecture, based on HFR-derived observational evidence, would be consistent with recent numerical investigations with coupled models where the combined wave-current effects during storm Gloria were reported (Amores et al., 2020). Previously, Ràfols et al. (2019) successfully investigated the role of such interactions in the northern ED during strong wind events. As a contrasting example, the IROS field during the Jan2017 severe episode was rather moderate in subregion-1 (Figure 9) despite the strong winds (above 15 m s–1) and 6-m high wave (Figure 4). These results illustrate that the lower current speeds observed during Jan2017 (Figure 5C) led to weaker wave-current interactions, which resulted in a reduced seawater dispersion. Additionally, Pérez-Gómez et al. (2021) analyzed outcomes from diverse numerical models to evaluate their skill to predict coastal sea levels during the storm Gloria. The sea level elevation was better captured by the coupled hydrodynamic-wave forecast system running operationally in the Mediterranean Sea within the framework of CMEMS (Clementi et al., 2017). Since there is a feedback mechanism between processes, detailed information about different interactions might lead to an improved predictability of hydrodynamic conditions at sea.
With regards to IBI predictive capabilities five days ahead, results seem to indicate an acceptable model performance in the sea surface despite some limitations that will be herein addressed. The comparison against spatially averaged current and SSH observations (provided by HFR-ED and TG1 tide gauge) led to significantly high SS magnitudes of 0.77 and 0.92, respectively (Figures 5D,E). In both cases, albeit IBI captured the storm-induced peak, this was underpredicted by as much as 20–30%. Since TG1 is the closest station to ED, IBI-FC05 prediction could be considered as a lower bound for the flooded area. In terms of time-averaged maps of surface circulation (Figure 6), the primary IBI-HFR disagreement arises from the presence, detached from the coast, of a counter-clockwise eddy-like circulation structure. While maps of SS reflect a higher IBI–HFR correspondence in regions close to the shoreline (SS above 0.7), the agreement decreases in areas near the eastern outer limits of the HFR footprint. These findings are consistent with similar works on the same topic, where SS values were reported to lie between 0.2 and 0.8 (O’Donncha et al., 2015; Vaz et al., 2018).
Shortcomings detected in IBI model performance should be interpreted according to few forcing agents, like the difficulty in accurately simulating both the Ebro river intense outflow and the wind field over the complex continental shelf. As IBI operational chain do not consider in situ freshwater observations, their impact on the inner shelf dispersive transport is grossly represented, as reflected by the low magnitudes of IROS (Figures 7, 8). Likewise, a more refined atmospheric forecast model might aid to better discriminate topographic structures and replicate submesoscale features of the coastal flow in the northern WMS, as illustrated by Schaeffer et al. (2011). Additionally, as IBI system does not include two-way wave-current interactions, some coastal processes are poorly resolved (or even misrepresented). Since the skill of particle transport simulations depends on wave–ocean circulation interaction processes (Staneva et al., 2021), IBI was not able to properly reproduce the peak of IROS in the northern hemidelta during storm Gloria. A relevant number of works have demonstrated the benefits of coupling wave and circulation systems (Viitak et al., 2016; Clementi et al., 2017). In this context, the two-way coupling has been recently implemented in the new operational version of IBI system, released in December 2020. Future research endeavors should include running a control simulation backwards for the entire 2020 with the new operational version of IBI system to elucidate if the model skillfully predicts the features observed with HFR-ED, not only in the northern hemidelta, but also over the whole continental shelf. Finally, a fraction of the shortcomings detected in IBI performance could be also attributable to the fact that large-scale barotropic flow contributions, associated to SLP anomalies in the entire Mediterranean basin, are not explicitly included in the present numerical configuration. On the contrary, the eastern open boundary conditions in IBI forecast system (at 5°E longitude) are imposed from daily outputs from the parent system (CMEMS GLOBAL), plus the local inverted-barometer effect.
A brief air-sea interaction research near ED was conducted to elucidate the influence of moving storm Gloria on the upper layer physical properties. At seasonal timescales, an intense salinity-driven stratification can be observed in ED estuary as the buoyancy associated with large freshwater discharges overcomes the microtidal forcing. Under these circumstances, the classical two-layered estuarine circulation is predominant, with the surface and the bottom layers flowing in opposite directions (Llebot et al., 2014). However, the impact of extreme events on the top ocean level can alter the traditional thermodynamic picture and modify the MLD (Bouin and Brossier, 2020).
Three-dimensional physical changes modulated by Gloria’s passage were explored by using IBI-FC05 outcomes, indicating a large increase in kinetic energy at near-inertial frequencies and MLD deepening (Figure 13). Strong storm-induced wind forcing caused the water column stratification to start collapsing due to the enhanced vertical mixing. Vigorous southward currents were predicted at 80 m depth (above 70 cm s–1) and also detected by B1 buoy at 3.5 m depth (above 110 cm s–1). The initial MLD prior to Gloria’s passage was around 20–30 m, but shortly after the January 19, the MLD abruptly deepened to greater than 100 m. Afterward, the MLD returned to near pre-storm conditions. Although direct in situ observations were not available to validate the modeled MLD, the estimates here exposed are comparable to the MLD deepening induced by a 2014 Medicane (Bouin and Brossier, 2020) or by several hurricanes in the vicinity of Bermuda (Black and Dickey, 2008). As a reference of Gloria’s effect on the thermodynamic response of the upper ocean, note that 2003 Hurricane Fabian (a category 4 storm on the Saffir-Simpson scale) led to maximum MLD of 50 m (from an initial MLD of 20 m) and produced large inertial currents (up to 100 cm s–1). Previous modeling works investigated the oceanic response to changes in the storm parameters (translation speed, size, and intensity), indicating that broad, intense, slow moving storms induce deeper mixed layers (Wu et al., 2007). In our study case, it seems clear that such factors held a key role in the MLD values obtained.
Finally, HFR technology has proved to be a cutting-edge tool to effectively monitor extreme events in near real-time (from both waves and circulation perspectives) and unveil hydrodynamic aspects (such as wave-current interactions) still unresolved by current state-of-the-art regional ocean models. Besides, the intimate connection between adjacent sub-basins within the WMS was evidenced thanks to the concomitant sea surface overlooking from three HFR systems. The large-scale remote effect of Gloria in immediate choke points, such as the IC and the SoG, was assessed in terms of anomalous circulation patterns that altered the usual exchanges of water masses between the northern and southern WMS sub-basins and between the North Atlantic and the southern WMS, respectively. Surface observations from HFR-IC revealed a southward intensification of the Balearic current by the January 19, particularly in the western part of the spatial coverage (Figure 11H), in accordance with the 3D modeling results presented in Sotillo et al. (2021b) for the same transect (38.8°N) in the IC. In that work, the usual net transport to the north was documented to reverse, reaching anomalous values up to 4 Sv in the southward direction during the storm peak. Additionally, outcomes from Pérez-Gómez et al. (2021) confirmed a small, albeit not negligible, net surface transport from the southern WMS into the Atlantic Ocean during Gloria’s episode. These findings are in consonance with the information provided by HFR-SoG (Figure 12), hereby suggesting that the remote barotropic effect of the strong atmospheric pressure forcing over the WMS, in conjunction with the change in local winds, significantly modulated the variations of the AJ and the occasional flow reversal.
In summary, a wealth of multi-variable extremes, inter-connected in space and time with common driving forces, were identified and monitored in distant regions within the WMS. A HFR network extension to cover a larger portion of the eastern Iberian shoreline would aid to better track severe storms path for timely, proactive emergency management that could reduce both exposure and coastal vulnerability.
Data Availability Statement
The datasets presented in this study can be found in online repositories. The datasets can be found at the E.U. Copernicus Marine Environment Monitoring Service (CMEMS) web catalogue.
Author Contributions
PL, ER, EÁ-F, and MS: conceptualization. MR: methodology. SP, RA, PL, and ER: software. PL, ER, MG-L, and JL-Y: formal analysis and writing-original draft preparation. PL, MG-L, JL-Y, and MF: investigation. SP and RA: resources. EÁ-F, VG, and ME: writing-review and editing. MS, VG, AA-M, and ME: supervision. All authors contributed to the article and approved the submitted version.
Conflict of Interest
PL and RA were employed by company Nologin Consulting SL. MF and AA-M were employed by company Qualitas Remos.
The remaining authors declare that the research was conducted in the absence of any commercial or financial relationships that could be construed as a potential conflict of interest.
Acknowledgments
We are grateful to Qualitas Remos Company for the technical support and useful suggestions about the wave data treatment. We also acknowledge the ECMWF and the Ebro observatory (http://obsebre.es/en) for providing, respectively, the atmospheric fields used to force IBI forecast system and monthly averaged data of total precipitation. This study has been conducted using observational and modeling datasets available thought the E.U. Copernicus Marine Environment Monitoring Service (CMEMS) web catalog.
References
Adger, W. N., Hughes, T. P., Folke, C., Carpenter, S. R., and Rockström, J. (2005). Social-ecological resilience to coastal disasters. Science 309, 1036–1039. doi: 10.1126/science.1112122
Allen, J. T., Pezza, A. B., and Black, M. T. (2010). Explosive cyclogenesis: a global climatology comparing multiple reanalyses. J. Clim. 23, 6468–6484. doi: 10.1175/2010jcli3437.1
Amores, A., Marcos, M., Carrió, D. S., and Gómez-Pujol, L. (2020). Coastal impacts of storm gloria over the northwestern mediterranean. Nat. Hazards Earth Syst. Sci. 20, 1955–1968. doi: 10.5194/nhess-20-1955-2020
Archer, M. R. (2016). The Florida Current: Mean Jet Structure, Meandering, and Velocity Fluctuations Observed with HF Radar. Ph. D. Thesis, University of Miami, Coral Gables, FL.
Archer, M. R., Shay, L. K., Jaimes, B., and Martinez-Pedraja, J. (2015). “Chapter 11 – observing frontal instabilities of the Florida current using high frequency radar,” in Book: Coastal Ocean Observing Systems, eds Y. Liu, H. Kerkering, and R. H. Weisberg (Boston, MA: Academic Press), 179–208. doi: 10.1016/B978-0-12-802022-7.00011-0
Arnone, R. A., Wiesenburg, D. A., and Saunders, K. D. (1990). The origin and characteristics of the Algerian Current. J. Geophys. Res. Oceans 95, 1587–1598. doi: 10.1029/jc095ic02p01587
Barrick, D. E., Evans, M. W., and Weber, B. L. (1977). Ocean surface currents mapped by radar. Science 198, 138–144. doi: 10.1126/science.198.4313.138
Barrick, D. E., and Lipa, B. J. (1986). Correcting for distorted antenna patterns in CODAR ocean surface measurements. IEEE J. Oceanic Eng. 11, 304–309. doi: 10.1109/joe.1986.1145158
Bessa, I., Makaoui, A., Hilmi, K., and Afifi, M. (2018). Variability of the mixed layer depth and the ocean surface properties in the Cape Ghir region, Morocco for the period 2002–2014. Model. Earth Syst. Environ. 4, 151–160. doi: 10.1007/s40808-018-0411-7
Black, W. J., and Dickey, T. D. (2008). Observations and analyses of upper ocean responses to tropical storms and hurricanes in the vicinity of Bermuda. J. Geophys. Res. 113:C08009.
Bouin, M.-N., and Brossier, C. L. (2020). Impact of a medicane on the oceanic surface layer from a coupled, kilometre-scale simulation. Ocean Sci. 16, 1125–1142. doi: 10.5194/os-16-1125-2020
Castelle, B., Dodet, G., Masselink, G., and Scott, T. (2017). A new climate index controlling winter wave activity along the Atlantic coast of Europe: The West Europe Pressure Anomaly. Geophys. Res. Lett. 44, 1384–1392. doi: 10.1002/2016GL072379
Cavaleri, L., Bertotti, L., Torrisi, L., Bitner-Gregersen, E., Serio, M., and Onorato, M. (2012). Rogue waves in crossing seas: the Louis Majesty accident. J. Geophys. Res. 117:C00J10. doi: 10.1029/2012JC007923
Chapman, R. D., and Graber, H. C. (1997). Validation of HF radar measurements. Oceanography 10, 76–79.
Clementi, E., Oddo, P., Drudi, M., Pinardi, N., Korres, G., and Grandi, A. (2017). Coupling hydrodynamic and wave models: first step and sensitivity experiments in the Mediterranean Sea. Ocean Dyn. 67, 1293–1312. doi: 10.1007/s10236-017-1087-7
Cornes, R. C., Jones, P. D., Briffa, K. R., and Osborn, T. J. (2011). A daily series of mean sea-level pressure for London, 1692–2007. Int. J. Climatol. 32, 641–656. doi: 10.1002/joc.2301
Criado-Aldeanueva, F., and Soto-Navarro, F. J. (2013). The mediterranean oscillation teleconnection index: station-based versus principal component paradigms. Adv. Meteorol. 2013:738501. doi: 10.1155/2013/738501
Crombie, D. D. (1955). Doppler spectrum of sea echo at 13.56 Mc/S. Nature 175, 681–682. doi: 10.1038/175681a0
Dao, D.-T., Chien, H., Lai, J.-W., Huan, Y.-H., and Flament, P. (2019). “Evaluation of HF radar in mapping surface wave field in Taiwan Strait under winter monsoon,” in Proceedings of the IEEE Conference Paper: OCEANS 2019 (Marseille: IEEE), 1–7. doi: 10.1109/OCEANSE.2019.8867519
Darmaraki, S., Somot, S., Sevault, F., Nabat, P., Cobos Narvaez, W. D., Cavicchia, L., et al. (2019). Future evolution of marine heatwaves in the Mediterranean Sea. Clim. Dyn. 53, 1371–1392. doi: 10.1007/s00382-019-04661-z
De Alfonso, M., Lin-Ye, J., García-Valdecasas, J. M., Pérez-Rubio, S., Luna, M. Y., Santos-Muñoz, D., et al. (2021). Storm Gloria: sea state evolution based on in-situ measurements and modeled data and its impact on extreme values. Front. Mar. Sci. 8, 1–17.
Egbert, G. D., and Erofeeva, S. Y. (2002). Efficient inverse modeling of barotropic ocean tides. J. Atmos. Oceanic Technol. 19, 183–204. doi: 10.1175/1520-0426(2002)019<0183:eimobo>2.0.co;2
Ferrante, M., Conti, G. O., Fiore, M., Rapisarda, V., and Ledda, C. (2013). Harmful algal blooms in the mediterranean sea: effects on human health. EuroMediterranean Biomed. J. 8, 25–34. doi: 10.3269/1970-5492.2013.8.6
Futch, V. (2009). The Lagrangian Properties of the Flow West of Oahu. Ph. D.Thesis. University of Hawaii at Mnoa, Honolulu, HI.
Futch, V. (2019). Observations of Anticyclones in Hawaii Using Surface Drifters. Ph. D. dissertation, University of Hawaii at Mnoa, Honolulu, HI.
Garcia-Ladona, E., Castellón, A., Font, J., and Tintore, J. (1996). The Balearic current and volume transports in the Balearic basin. Oceanol. Acta 19, 489–497.
García-Lafuente, J., Sammartino, S., Sánchez-Garrido, J. C., and Naranjo, C. (2019). On the role of the bay of Algeciras in the exchange across the strait of Gibraltar. Region. Stud. Mar. Sci. 29:100620. doi: 10.1016/j.rsma.2019.100620
García-León, M. (2018). Coastal Risk Forecast System: Fostering Proactive Management at the Catalan Coast. Doctoral dissertation, Polytechnic University of Catalonia, Barcelona.
García-Sánchez, G., Mancho, A. M., Ramos, A. G., Coca, J., Pérez-Gómez, B., Álvarez-Fanjul, E., et al. (2021). Very high resolution tools for the monitoring and assessment of environmental hazards in coastal areas. Front. Mar. Sci. 7:605804. doi: 10.3389/fmars.2020.605804
Garrabou, J., Gómez-Gras, D., Ledoux, J.-B., Linares, C., Bensoussan, N., López-Sendino, P., et al. (2019). Collaborative database to track mass mortality events in the Mediterranean sea. Front. Mar. Sci. 6:707. doi: 10.3389/fmars.2019.00707
Grases, A., Gracia, V., García-León, M., Lin-Ye, J., and Sierra, J. P. (2020). Coastal flooding and erosion under a changing climate: implications at a low-lying coast (Ebro Delta). Water 12:346. doi: 10.3390/w12020346
Grifoll, M., Aretxabaleta, A. L., and Espino, M. (2015). Shelf response to intense offshore wind. J. Geophys. Res. Oceans 120, 6564–6580. doi: 10.1002/2015jc010850
Haigh, R., Amaratunga, D., and Hemachandra, K. (2018). A capacity analysis framework for multi-hazard early warning in coastal communities. Proc. Eng. 212, 1139–1146. doi: 10.1016/j.proeng.2018.01.147
Haller, G. (2015). Lagrangian coherent structures. Annu. Rev. Fluid Mech. 47, 137–162. doi: 10.1146/annurev-fluid-010313-141322
Haza, A. C., Özgökmen, T. M., Griffa, A., Molcard, A., Poulain, P. M., and Peggion, G. (2010). Transport properties in small-scale coastal flows: relative dispersion from VHF radar measurements in the Gulf of La Spezia. Ocean Dyn. 60, 861–882. doi: 10.1007/s10236-010-0301-7
Hernández-Carrasco, I., Solabarrieta, L., Rubio, A., Esnaola, G., Reyes, E., and Orfila, A. (2018). Impact of HF radar current gap-filling methodologies on the Lagrangian assessment of coastal dynamics. Ocean Sci. 14, 827–847. doi: 10.5194/os-14-827-2018
Hilmi, N., Allemand, D., Cinar, M., Cooley, S., Hall-Spencer, J. M., Haraldsson, G., et al. (2014). Exposure of mediterranean countries to ocean acidification. Water 6, 1719–1744. doi: 10.3390/w6061719
Kara, A. B., Rochford, P. A., and Hurlburt, H. E. (2000). An optimal definition for ocean mixed layer depth. J. Geophys. Res. 105, 16803–16821. doi: 10.1029/2000jc900072
Kassis, D., and Varlas, G. (2021). Hydrographic effects of an intense “medicane” over the central-eastern Mediterranean Sea in 2018. Dyn. Atmos. Oceans 93:101185. doi: 10.1016/j.dynatmoce.2020.101185
Kim, S. Y. (2010). Observations of submesoscale eddies using high-frequency radar-derived kinematic and dynamic quantities. Continent. Shelf Res. 30, 1639–1655. doi: 10.1016/j.csr.2010.06.011
Klein, R. J. T., Nicholls, R. J., and Homalla, F. (2003). Resilience to natural hazards: how useful is this concept? Glob. Environ. Change B Environ. Hazards 5, 35–45. doi: 10.1016/j.hazards.2004.02.001
Konisky, D. M., Hughes, L., and Kaylor, C. H. (2015). Extreme weather events and climate change concern. Clim. Change 134, 533–547. doi: 10.1007/s10584-015-1555-3
Lacoue-Labarthe, T., Nunes, P. A. L. D., Ziveri, P., Cinar, M., Gazeau, F., Hall-Spencer, J. M., et al. (2016). Impacts of ocean acidification in a warming Mediterranean Sea: an overview. Region. Stud. Mar. Sci. 5, 1–11. doi: 10.1016/j.rsma.2015.12.005
Lana, A., Marmain, J., Fernández, V., Tintoré, J., and Orfilia, A. (2016). Wind influence on surface current variability in the Ibiza Channel from HF Radar. Ocean Dyn. 66, 483–497.
Legates, D. R., and McCabe, G. J. (1999). Evaluating the use of “goodness-of-fit” measures in hydrologic and hydroclimatic model validation. Water Resour. Res. 35, 233–241. doi: 10.1029/1998wr900018
Linnenluecke, M. K., Griffiths, A., and Winn, M. (2012). Extreme weather events and the critical importance of anticipatory adaptation and organizational resilience in responding to impacts. Bus. Strat. Environ. 21, 17–32. doi: 10.1002/bse.708
Lin-Ye, J., García-León, M., Gràcia, V., Ortego, M. I., Lionello, P., Conte, D., et al. (2020). Modeling of future extreme storm surges at the NW mediterranean Coast (Spain). Water 12, 472. doi: 10.3390/w12020472
Lin-Ye, J., García-León, M., Gràcia, V., and Sánchez-Arcilla, A. (2016). A multivariate statistical model of extreme events: an application to the Catalan coast. Coast. Eng. 117, 138–156. doi: 10.1016/j.coastaleng.2016.08.002
Lipa, B. J., Barrick, D., and Isaacson, J. (2019). Evaluating HF coastal radar site performance for Tsunami warning. Rem. Sens. 11, 2773. doi: 10.3390/rs11232773
Lipa, B. J., and Nyden, B. (2005). Directional wave information from the SeaSonde. IEEE J. Oceanic Eng. 30, 221–231. doi: 10.1109/joe.2004.839929
Lipa, B. J., Nyden, B., Barrick, D., and Kohut, J. (2008). HF Radar Sea-Echo from shallow water. Sensors 8, 4611–4635. doi: 10.3390/s8084611
Llebot, C., Rueda, F. J., Solé, J., Artigas, M. L., and Estrada, M. (2014). Hydrodynamic states in a wind-driven microtidal estuary (Alfacs Bay). J. Sea Res. 85, 263–276. doi: 10.1016/j.seares.2013.05.010
Lopez-Bustins, J. A., and Lemus-Canovas, M. (2020). The influence of the Western mediterranean oscillation upon the spatiotemporal variability of precipitation over Catalonia (northeastern of the Iberian Peninsula). Atmos. Res. 236: 104819. doi: 10.1016/j.atmosres.2019.104819
Lorente, P., Piedracoba, S., Sotillo, M. G., and Álvarez-Fanjul, E. (2019a). Long-term monitoring of the Atlantic Jet through the Strait of Gibraltar with HF radar observations. J. Mar. Sci. Tech. 7, 1–16.
Lorente, P., Piedracoba, S., Sotillo, M. G., Aznar, R., Amo-Baladrón, A., Pascual, A., et al. (2016b). Ocean model skill assessment in the NW Mediterranean using multi-sensor data. J. Operat. Oceanogr. 9, 1–18. doi: 10.1080/1755876X.2016.1215224
Lorente, P., Piedracoba, S., Soto-Navarro, J., and Álvarez-Fanjul, E. (2015). Evaluating the surface circulation in Ebro Delta (NE Spain) with quality-controlled High-Frequency radar measurements. Ocean Sci. 11, 921–935. doi: 10.5194/os-11-921-2015
Lorente, P., Piedracoba, S., Soto-Navarro, J., and Álvarez-Fanjul, E. (2016a). Characterizing the surface circulation in Ebro Delta (NW Mediterranean) with HF radar and modeled current data. J. Mar. Syst. 163, 61–79. doi: 10.1016/j.jmarsys.2016.07.001
Lorente, P., Sotillo, M. G., Amo-Baladrón, A., Aznar, R., Levier, B., Aouf, L., et al. (2019b). “The NARVAL software toolbox in support of ocean models skill assessment at regional and coastal scales,” in Computational Science – ICCS 2019. ICCS 2019. Lecture Notes in Computer Science, Vol. 11539, eds J. Rodrigues, P. J. S. Cardoso, J. Monteiro, R. Lam, V. V. Krzhizhanovskaya, M. H. Lees, et al. (Cham: Springer), doi: 10.1007/978-3-030-22747-0_25
Lyard, F., Lefèvre, F., Letellier, T., and Francis, O. (2006). Modelling the global ocean tides: a modern insight from FES2004. Ocean Dyn. 56, 394–415. doi: 10.1007/s10236-006-0086-x
Madec, G. (2008). NEMO Ocean General Circulation Model, Reference Manual, Internal Report. Paris: IPSL.
Mantovani, C., Corgnati, L., Horstmann, J., Rubio, A., Reyes, E., Quentin, C., et al. (2020). Best practices on high frequency radar deployment and operation for ocean current measurement. Front. Mar. Sci. 7:210. doi: 10.3389/fmars.2020.00210
Mascort, R., Badosa, E., Budó, J., Capalleras, X., Soler, J., and Martínez-Silvestre, A. (2020). Stranding of freshwater turtles at different sea beaches in Catalonia after storm Gloria. Bol. Asoc. Herpetol. Esp. 31, 99–108.
Mason, E., Ruiz, S., Bourdalle-Badie, R., Reffray, G., Sotillo, M. G., and Pascual, A. (2019). New insight into 3-D mesoscale eddy properties from CMEMS operational models in the western Mediterranean. Ocean Sci. 15, 1111–1131. doi: 10.5194/os-15-1111-2019
McFeeters, S. K. (1996). The use of the normalized difference water index (NDWI) in the delineation of open water features. Int. J. Rem. Sens. 17, 1425–1432. doi: 10.1080/01431169608948714
Melet, A., Teatini, P., Le Cozannet, G., Jamet, C., Conversi, A., Benveniste, J., et al. (2020). Earth observations for monitoring marine coastal hazards and their drivers. Surv. Geophys. 41, 1489–1534. doi: 10.1007/s10712-020-09594-5
Met Office Factsheet (2016). Weather extremes. National Meteorological Library and Archive Factsheet 9 - Weather extremes. Devon: Met Office.
Miles, T., Seroka, G., and Glenn, S. (2017). Coastal ocean circulation during Hurricane Sandy. J. Geophys. Res. Oceans 122, 7095–7114. doi: 10.1002/2017jc013031
Milglietta, M. M., and Rotunno, R. (2019). Development mechanisms for Mediterranean tropical -like cyclones (medicanes). Q. J. R. Meteorol. Soc. 145, 1444–1460. doi: 10.1002/qj.3503
Millot, C., and Taupier-Letage, I. (2005). “Circulation in the Mediterranean Sea,” in The Mediterranean Sea. Handbook of Environmental Chemistry, Vol. 5K, ed. A. Saliot (Berlin: Springer), doi: 10.1007/b107143
Nolan, P. J., Serra, M., and Ross, S. D. (2020). Finite-time Lyapunov exponents in the instantaneous limit and material transport. Nonlinear Dyn. 100, 3825–3852. doi: 10.1007/s11071-020-05713-4
O’Donncha, F., Hartnett, M., Nash, S., Ren, L., and Ragnoli, E. (2015). Characterizing observed circulation patterns within a bay using HF radar and numerical model simulations. J. Mar. Syst. 142, 96–110. doi: 10.1016/j.jmarsys.2014.10.004
Ohlmann, C., White, P., Washburn, L., Terril, E., Emery, B., and Otero, M. (2007). Interpretation of coastal HF radar-derived currents with high-resolution drifter data. J. Atmos. Ocean. Technol. 24, 666–680. doi: 10.1175/jtech1998.1
Paduan, J. D., and Washburn, L. (2013). High-frequency radar observations of the ocean surface surface currents. Annu. Rev. Sci. 5, 115–136. doi: 10.1146/annurev-marine-121211-172315
Palanques, A., and Guillen, J. (1998). Coastal changes in the Ebro Delta: natural and human factors. J. Coast. Conserv. 4, 17–26. doi: 10.1007/bf02806485
Pérez-Gómez, B., García-León, M., and Sánchez-Arcilla, A. Clementi, E., Mösso-Aranda, C., Pérez-Rubio, S. et al. (2021). Understanding sea level processes during Western Mediterranean storm Gloria. Front. Mar. Sci. 8, 1–19. doi: 10.1130/spe109-p1
Poje, A. C., Haza, A. C., Özgökmen, T. M., Magaldi, M. G., and Garraffo, Z. D. (2010). Resolution dependent relative dispersion statistics in a hierarchy of ocean models. Ocean Model. 31, 36–50. doi: 10.1016/j.ocemod.2009.09.002
Radović, V., and Iglesias, I. (2018). Extreme weather events: definition, classification and guidelines towards vulnerability reduction and adaptation management. Good Health Well Being 68, 1–13. doi: 10.1007/978-3-319-71063-1_68-1
Ràfols, L., Grifoll, M., and Espino, M. (2019). Wave-current interactions in a wind-jet region. Ocean Sci. 15, 1–20. doi: 10.5194/os-15-1-2019
Reimann, L., Vafeidis, A. T., Brown, S., Hinkel, J., and Tol, R. S. J. (2018). Mediterranean UNESCO World Heritage at risk from coastal flooding and erosion due to sea-level rise. Nat. Commun. 9:4161. doi: 10.1038/s41467-018-06645-9
Rex, D. F. (1950). Blocking action in the middle troposphere and its effect upon regional climate. Tellus 2, 275–301. doi: 10.1111/j.2153-3490.1950.tb00339.x
Roarty, H., Cook, T., Hazard, L., George, D., Harlan, J., Cosoli, S., et al. (2019). The Global High Frequency Radar Network. Front. Mar. Sci. 6:164. doi: 10.3389/fmars.2019.00164
Roarty, H., Smith, M., Kerfoot, J., Kohut, J., and Glenn, S. (2012). Automated quality control of high frequency radar data. IEEE Oceans 2012, 1–7.
Rockel, B. (2015). The regional downscalling approach: a brief history and recent advances. Curr. Clim. Change Rep. 1, 22–29. doi: 10.1007/s40641-014-0001-3
Rubio, A., Mader, J., Corgnati, L., Mantovani, C., Griffa, A., Novellino, A., et al. (2017). HF radar activity in european coastal seas: next steps towards a pan-European HF radar network. Front. Mar. Sci. 20:8. doi: 10.3389/fmars.2017.00008
Ruiz-Parrado, I., Genua-Olmedo, A., Reyes, E., Mourre, B., Rotllán, P., Lorente, P., et al. (2020). Coastal ocean variability related to the most extreme Ebro river discharge over the last 15 years. J. Operat. Oceanogr. 13, s160–s165.
Salat, J., Garcia, M. A., Cruzado, A., Palanques, A., Arín, L., Gomis, D., et al. (2002). Seasonal changes of water mass structure and shelf-slope exchanges at the Ebro Shelf (NW Mediterranean). Continent. Shelf Res. 22, 327–348. doi: 10.1016/s0278-4343(01)00031-0
Sánchez-Arcilla, A., Gaercía-León, M., Gracia, V., Devoy, R., Stanica, A., and Gault, J. (2016). Managing coastal environments under climate change: Pathways to adaptation. Sci. Total Environ. 572, 1336–1352. doi: 10.1016/j.scitotenv.2016.01.124
Sánchez-Arcilla, A., González-Marco, D., and Bolaños, R. (2008). A review of wave climate and prediction along the Spanish Mediterranean coast. Nat. Hazards Earth Syst. Sci. 8, 1217–1228. doi: 10.5194/nhess-8-1217-2008
Saramul, S. (2017). Seasonal Monsoon variations in surface currents in the Gulf of Thailand revealed by High Frequency radar. Eng. J. 21, 25–37. doi: 10.4186/ej.2017.21.4.25
Schaeffer, A., Garreau, P., Molcard, A., Fraunie, P., and Seity, Y. (2011). Influence of high resolution wind forcing on hydrodynamic modeling of the Gulf of Lions. Ocean Dyn. 61, 1823–1844. doi: 10.1007/s10236-011-0442-3
Schaeffer, A., Gramoulle, A., Roughan, M., and Mantovanelli, A. (2017). Characterizing frontal eddies along the East Australian Current from HF radar observations. J. Geophys. Res. Oceans 122, 3964–3980. doi: 10.1002/2016jc012171
Serra, M., Sathe, P., Rypina, I., Kirincich, A., Ross, S. H., Lermusiaux, P., et al. (2020). Search and rescue at sea aided by hidden flow structures. Nat. Commun. 11:2525. doi: 10.1038/s41467-020-16281-x
Sotillo, B. L., Lorente, P., Guihou, K., Aznar, R., Amo, A., Aouf, L., et al. (2021a). Quality Information Document of the IBI Production Centre, product IBI_ANALYSISFORECAST_PHY_005_001. Available online at: https://resources.marine.copernicus.eu/documents/QUID/CMEMS-IBI-QUID-005-001.pdf (accessed February 1, 2021).
Sotillo, M. G., Cailleau, S., Lorente, P., Levier, B., Aznar, R., Reffray, G., et al. (2015). The MyOcean IBI ocean forecast and reanalysis systems: operational products and roadmap to the future Copernicus Service. J. Operat. Oceanogr. 8, 1–18.
Sotillo, M. G., Mourre, B., Mestres, M., Lorente, P., Liste, M., Aznar, R., et al. (2021b). How did existing operational ocean circulation models forecast a (record-breaking) Western Mediterranean Extreme Event? Front. Mar. Sci. 81–23. doi: 10.1016/j.apor.2011.09.001
Spalding, M. D., Ruffo, S., Lacambra, C., Meliane, I., Hale, L. Z., Shepard, C. C., et al. (2014). The role of ecosystems in coastal protection: adapting to climate change and coastal hazards. Ocean Coast. Manag. 90, 50–57. doi: 10.1016/j.ocecoaman.2013.09.007
Staneva, J., Ricker, M., Carrasco-Alvarez, R., and Breivik, Ø, and Schrum, C. (2021). Effects of wave-induced processes in a coupled Wave–Ocean model on particle transport simulations. Water 13:415. doi: 10.3390/w13040415
Summers, J. K., Harwell, L. C., Smith, L. M., and Buck, K. D. (2018). Measuring community resilience to natural hazards: the natural hazard resilience screening index (NaHRSI)—development and Application to the United States. Geohealth 2, 372–394. doi: 10.1029/2018gh000160
Suzuki, K. (2015). “Storm surge and seiche in Tokyo Bay observed by HF radar,” in Proceedings of the International Society of Offshore and Polar Engineers, The Twenty-fifth International Ocean and Polar Engineering Conference, 21-26 June (Kona, HI).
Tintoré, J., Lana, A., Marmain, J., Fernández, V., Casas, B., and Reyes, E. (2020). HF Radar Ibiza data from date 2012-06-01 (Data set). Balearic Islands Coastal Observing and Forecasting System. Palma: SOCIB, doi: 10.25704/17GS-2B59
Tintoré, J., Pinardi, N., Álvarez-Fanjul, E., Aguiar, E., Álvarez-Berastegui, D., Bajo, M., et al. (2019). Challenges for sustained observing and forecasting systems in the Mediterranean Sea. Front. Mar. Sci. 6:568. doi: 10.3389/fmars.2019.00568
Toguchi, Y., Fujii, S., and Hinata, H. (2018). Tsunami waves and tsunami-induced natural oscillations determined by HF radar in Ise Bay, Japan. J. Geophys. Res Oceans 123, 2965–2980. doi: 10.1029/2017JC013626
Vaz, N., Rodrigues, J. G., Mateus, M., Franz, G., Campuzano, F., Neves, R., et al. (2018). Subtidal variability of the Tagus river plume in winter 2013. Sci. Total Environ. 627, 1353–1362. doi: 10.1016/j.scitotenv.2018.01.325
Viitak, M., Maljutenko, I., Alari, V., Suursaar, U., Rikka, S., and Lagemaa, P. (2016). The impact of surface currents and sea level on the wave field evolution during St. Jude storm in the eastern Baltic Sea. Oceanologia 58, 176–186. doi: 10.1016/j.oceano.2016.01.004
Wolff, C., Nikoletopoulos, T., Hinkel, J., and Vafeidis, A. T. (2020). Future urban development exacerbates coastal exposure in the Mediterranean. Sci. Rep. 10:14420. doi: 10.1038/s41598-020-70928-9
Wolff, C., Vafeidis, A. T., Muis, S., Lincke, D., Satta, A., Lionello, P., et al. (2018). Mediterranean coastal database for assessing the impacts of sea-level rise and associated hazards. Sci. Data 5:180044.
Wu, Y., Platt, T., Tang, C. C. L., and Sathyendranath, S. (2007). Short-term changes in chlorophyll distribution in response to a moving storm: a modelling study. Mar. Ecol. Prog. Ser. 335, 57–68. doi: 10.3354/meps335057
Keywords: storm gloria, HF radar, Western Mediterranean Sea, CMEMS, ocean model and observations comparison
Citation: Lorente P, Lin-Ye J, García-León M, Reyes E, Fernandes M, Sotillo MG, Espino M, Ruiz MI, Gracia V, Perez S, Aznar R, Alonso-Martirena A and Álvarez-Fanjul E (2021) On the Performance of High Frequency Radar in the Western Mediterranean During the Record-Breaking Storm Gloria. Front. Mar. Sci. 8:645762. doi: 10.3389/fmars.2021.645762
Received: 23 December 2020; Accepted: 16 February 2021;
Published: 10 March 2021.
Edited by:
Alejandro Jose Souza, Center for Research and Advanced Studies - Mérida Unit, MexicoReviewed by:
Jorge Alejandro Kurczyn Robledo, National Autonomous University of Mexico, MexicoChristian M. Appendini, National Autonomous University of Mexico, Mexico
Copyright © 2021 Lorente, Lin-Ye, García-León, Reyes, Fernandes, Sotillo, Espino, Ruiz, Gracia, Perez, Aznar, Alonso-Martirena and Álvarez-Fanjul. This is an open-access article distributed under the terms of the Creative Commons Attribution License (CC BY). The use, distribution or reproduction in other forums is permitted, provided the original author(s) and the copyright owner(s) are credited and that the original publication in this journal is cited, in accordance with accepted academic practice. No use, distribution or reproduction is permitted which does not comply with these terms.
*Correspondence: Pablo Lorente, cGxvcmVudGVfZXh0ZXJub0BwdWVydG9zLmVz