 Diana E. Caldarescu
 Thomas Brey
 Doris Abele
 Lars Beierlein2
 Gerrit Lohmann
 Monica Ionita
- 1Paleo-climate Dynamics Section, Alfred Wegener Institute, Helmholtz Centre for Polar and Marine Research, Bremerhaven, Germany
- 2Functional Ecology Section, Alfred Wegener Institute, Helmholtz Centre for Polar and Marine Research, Bremerhaven, Germany
- 3Helmholtz Institute for Functional Marine Biodiversity (HIFMB), University of Oldenburg, Oldenburg, Germany
- 4Faculty of Biology/Chemistry, University of Bremen, Bremen, Germany
- 5Faculty of Physics and Electrical Engineering, University of Bremen, Bremen, Germany
Bivalve sclerochronological records with annually resolved growth bands are applicable proxies in reconstructing features of the hydro-climate system. Here we evaluate the relationship between growth indices of A. islandica, previously collected at approximately 82 m depth in the North Atlantic, and seasonal subsurface temperature at various depths for the 1900–2005 period. Correlations with sea surface temperature at the collection site are not significant during winter and weak for the remaining seasons. The strongest in-phase correlations persist for summer and autumn below 56 m water depth, whereas weaker correlations are lagged by one or two years. We also observe similarities with distant water bodies in the North Atlantic sector, and a corresponding large-scale oceanographic pattern that increases significantly with water depth along the trajectory of the North Atlantic Current. We suggest that by investigating the relationship with the temperature signal at various depths locally and at large-scale increases the reliability and application of bivalve shells as marine archives.
Introduction
Past temperature reconstructions are extremely valuable in the context of understanding climate and modes of natural variability. Since the availability of observational data is limited to the last 150 years, marine archives of biogenic carbonate origin have become attractive indicators for temperature reconstructions. For instance, the carbonate shells of bivalves are used for high resolution spatial-temporal records, most commonly derived from sclerochronological and geochemical analyses. To reconstruct ocean temperatures, Weidman et al. (1994) linked the oxygen isotopic composition (δ18Oshell) of Arctica islandica with annual growth increments, and showed that bottom temperatures are recorded with a precision of ±1.2°C. This study instigated a number of publications exploring the relationship for the North Atlantic sector (e.g., Schöne et al., 2004, 2005a,b; Wanamaker et al., 2008a). The ocean quahog, A. islandica became an important climate archive in the North Atlantic sector, which, due to its extreme longevity, allows reconstruction of past environmental signals on multi-centennial time scales (e.g., Butler et al., 2013; Lohmann and Schöne, 2013; Reynolds et al., 2016). While long-lived A. islandica support paleo reconstructions and δ18Oshell variability in shell growth bands proved to be a reliable proxy for oceanic temperature reconstructions, it remains to be determined how well the shell growth index synchronizes with the temperature signal.
Because the atmosphere is in direct exchange with the uppermost surface of the ocean, and an imminent cause of ocean temperature variability (Czaja et al., 2003; Gastineau et al., 2013), temperature reconstructions usually focus on the upper mixed layer. Recent efforts have been made to monitor ocean temperatures at different water depths, but data availability in the North Atlantic is still spatiotemporally limited. Obtaining a significant correlation of the shell archive with temperature is important to assess synchronization of the shell growth index with oceanic conditions and to retrieve signals of the prevailing climate indices. Thus, to validate the temperature effect on shell growth variability, the initial step in the analysis consists in correlations between growth patterns and instrumental or gridded sea surface temperatures (SST). These correlations are often either weak or insignificant, unable to capture high frequency variability (e.g., Butler et al., 2013), leading to inconclusive assumptions regarding the role of temperature in stimulating shell growth.
Bottom water temperature and food availability are pivotal drivers of shell and tissue growth in bivalves, and it is not always easy to confirm the dominance of one over the other (Witbaard et al., 1998; Ballesta-Artero et al., 2018). For instance, Marali and Schöne (2015) found that 43% of annual growth variability of A. islandica shells around Iceland is explained by water temperature during the growth season, whereas Schöne et al. (2005a) suggested that 65% of annual growth variability is explained by summer temperature and food supply. However, by analyzing A. islandica shells from the Irish Sea, Butler et al. (2010) obtained significant correlations with SST and air temperatures, which were not stable in time and lagged by one year indicating that the delay might come from the physiological response to environmental dynamics. Witbaard et al. (1997) analyzed shell archives of A. islandica from Fladen Ground (between Scotland and Norway), which did not correlate significantly with temperature or plankton data, but rather reflected the local hydrology to affect the observed growth variability. Witbaard et al. (1999) suggested that a combination of temperature, primary productivity and vertical depth-dependent coupling between primary productivity and consumer explains 50% of growth variability in shells from the Faroe Islands, Iceland and the White Sea. Interestingly, in their study the shell growth variance increased by a factor of 1.5 for shells from the North Sea, indicating the relationship between the shell archive and the environmental variability to be strongly site-specific.
In this study, we hypothesize that one central starting point in reconstructing past ocean conditions using bivalve proxy records is by location and depth of the collection site. We selected an annually resolved master shell chronology from Butler et al. (2013), comprising a collection of A. islandica shells from approximately 82 m water depth on the N. Icelandic shelf, to evaluate whether the temperature forcing on the growth signal is depth-dependent, related to stratification dynamics and, hence, synchronized with atmospheric and oceanic modes of variability. We first examined the correlation with the seasonal temperature signal and assessed the synchronicity with local water temperature during the growth period. In a final step, we explored the strength of correlation with seasonal subsurface water temperature spatially over the common analysis period 1900–2005 and examined the large-scale temperature effects on growth variability of A. islandica in the North Atlantic sector. The results of this study explore the potential temperature range and the patterns of thermal shifts that can be reconstructed using the A. islandica shell chronology.
Materials and Methods
Master Shell Chronology
The master chronology used in this study is based on an assemblage of 29 shells of A. islandica, which includes eight individuals with lifespans over 300 years. Shells from this collection had been first mentioned in Wanamaker et al. (2008b) and used later in several other publications (Wanamaker et al., 2012; Butler et al., 2013; Reynolds et al., 2016). The bivalves had been collected during a research cruise in 2006 close to Grimsey Island on the North Icelandic Shelf (NIS) at a water depth of 81–83 m (66.5265°N, −18.19567°W; Figure 1). The region of sampling is under the influence of the warm Irminger Current and the cold East Icelandic Current, which makes it interesting to study. The shell series covers the 649 to 2005 time period; however, shell coverage fluctuates at certain timestamps: (1) the period prior to 1175 is covered by two long-lived bivalves which overlap for a short period of 37 years (952–988), (2) during 1175–1937, the sample coverage fluctuates between three to eight shells, (3) the period after 1960 is covered by 15 overlapping shells (see also Figure 3A in Butler et al., 2013). Here we chose the 1900 to 2005 period as a suitable period for analysis with observational data (see section “Environmental data”), because of scarce data and uncertainties before 1900, and generally because of high expressed population strength used in creating the chronology and indicating that the specimens are synchronized (Wigley et al., 1984; see also Figure 3G in Butler et al., 2013). The growth increments were detrended, a necessary practice for chronology construction due to faster growth during juvenile years. Butler et al. (2013) performed two types of detrending techniques, a deterministic detrending using a negative exponential function and an empirical detrending by regional curve standardization (RCS). We chose to apply only the latter method of detrending because it preserves the low-frequency signals (e.g., Esper et al., 2003; Butler et al., 2010; Butler et al., 2013). For further details on shell collection, treatment, sampling and detrending procedures, please refer to Butler et al. (2013). The master shell chronology was obtained from PANGAEA database.1
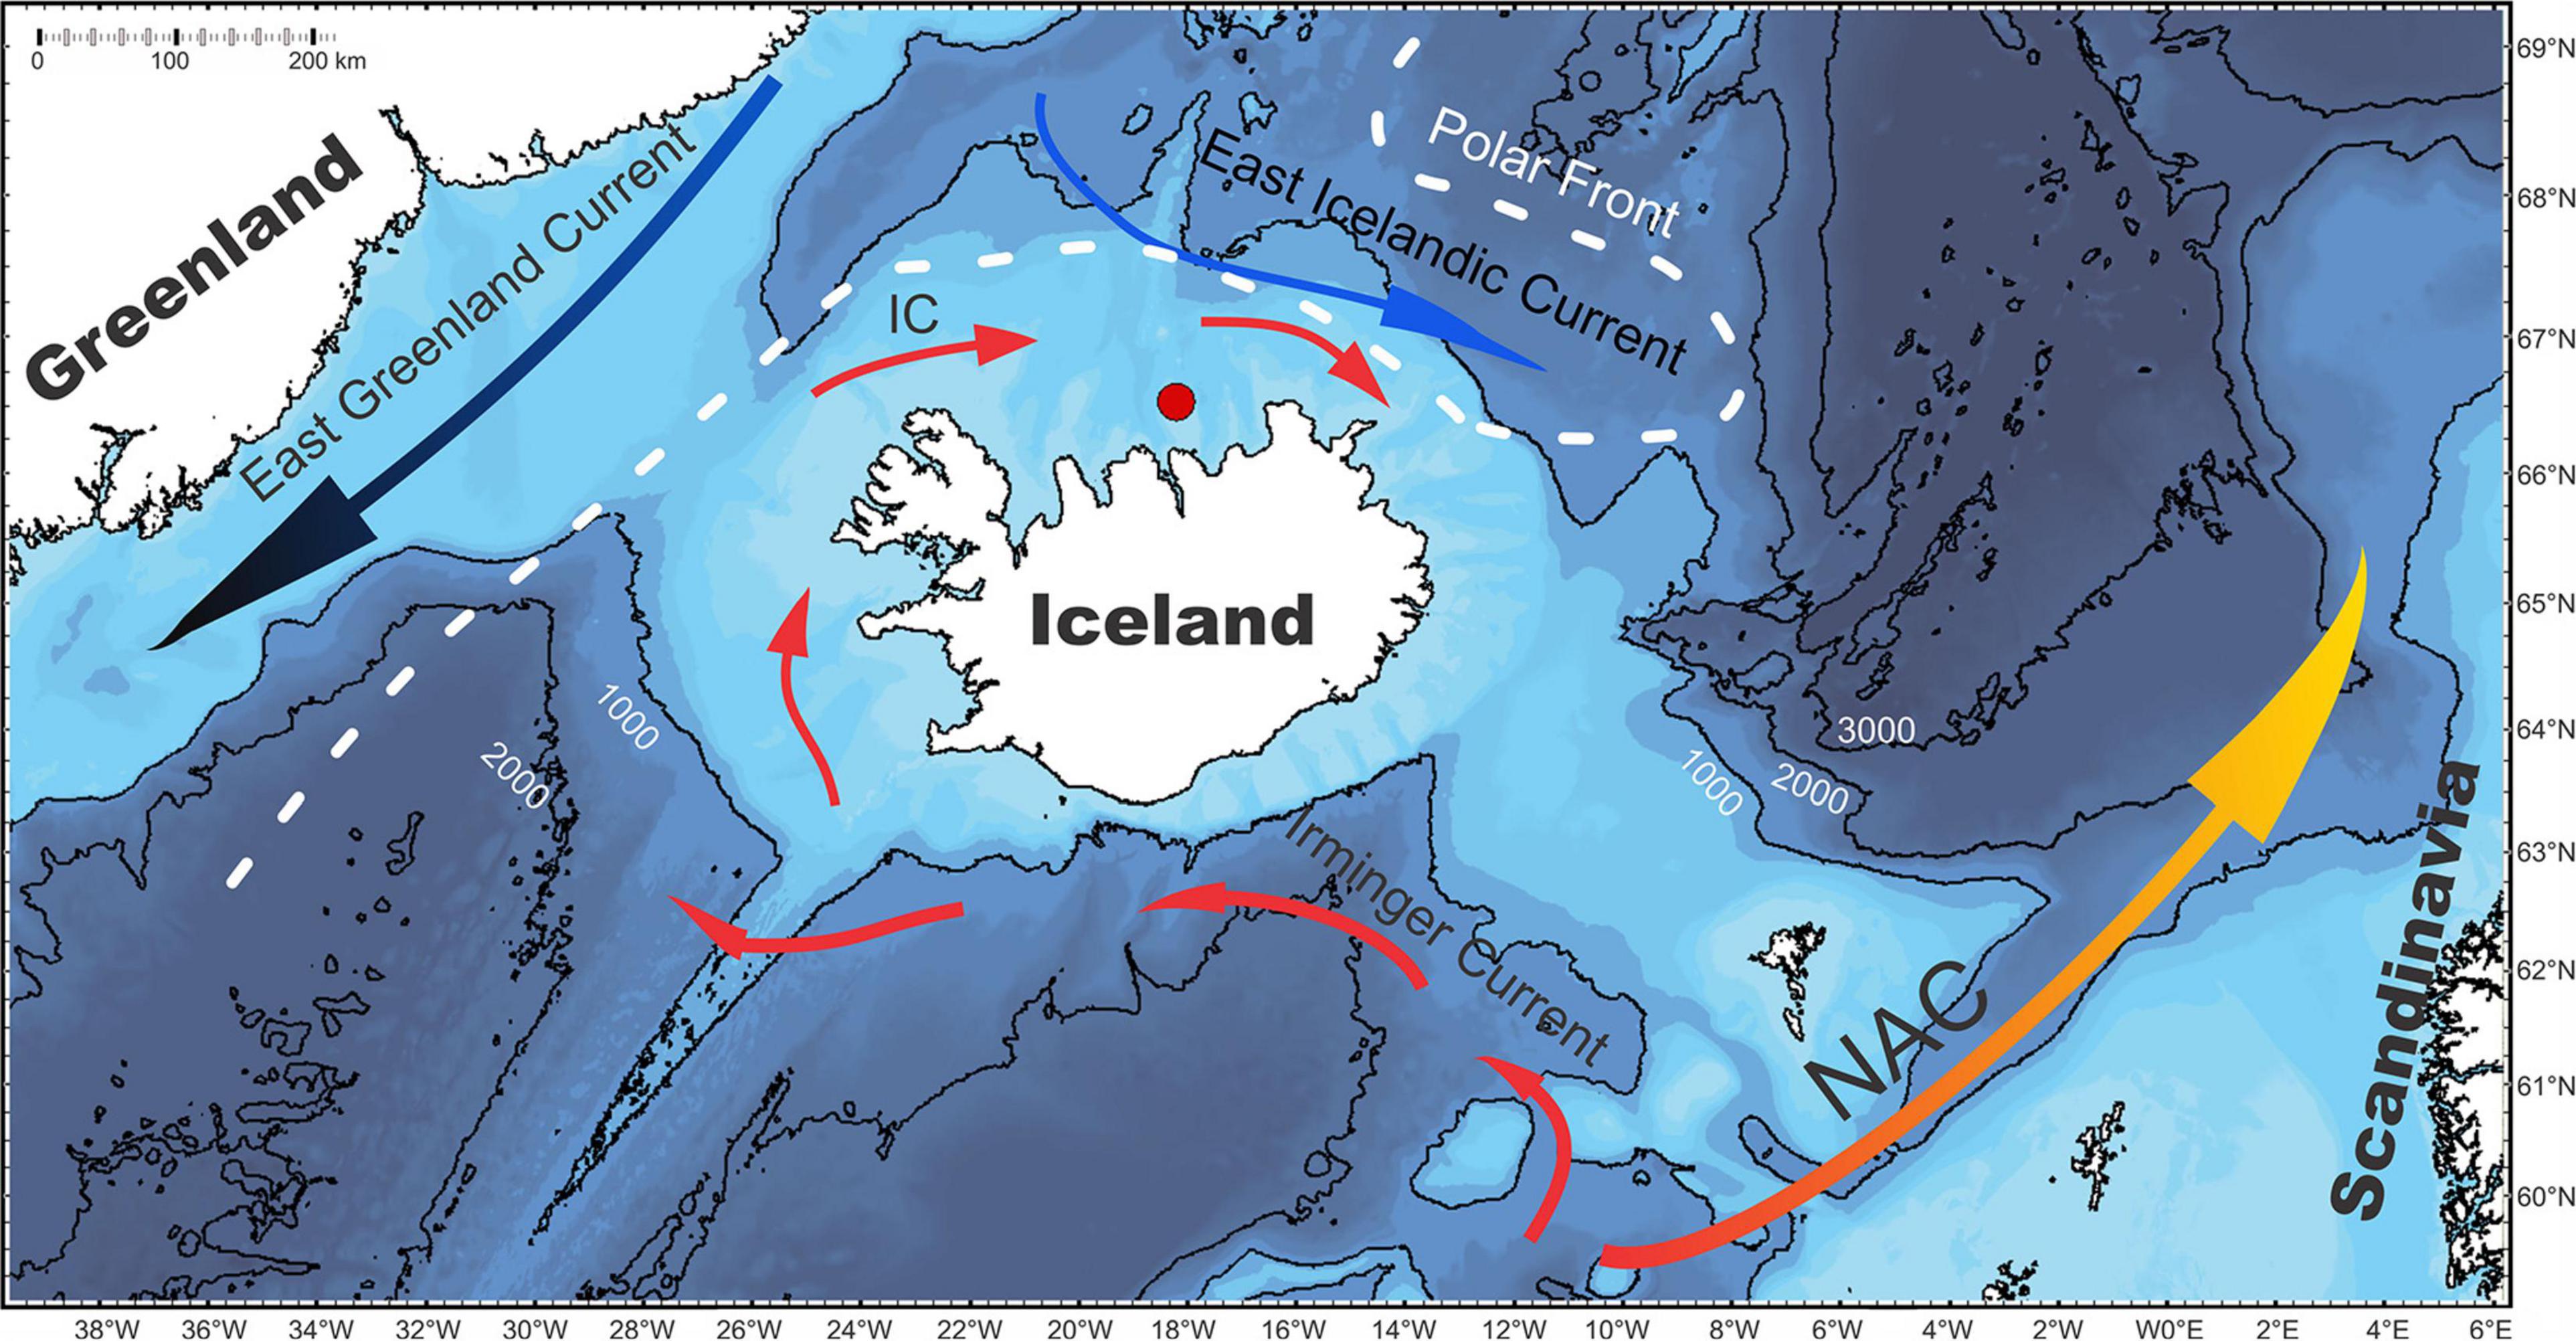
Figure 1. Bathymetric map of the Iceland area. The collection site (red circle) on the North Icelandic Shelf is prone to influences from Irminger Current (IC) and East Icelandic Current (EIC). NAC refers to the North Atlantic Current. Contour lines indicate 1000-m isobaths. The map is adapted after Ran et al. (2011) and Butler et al. (2013).
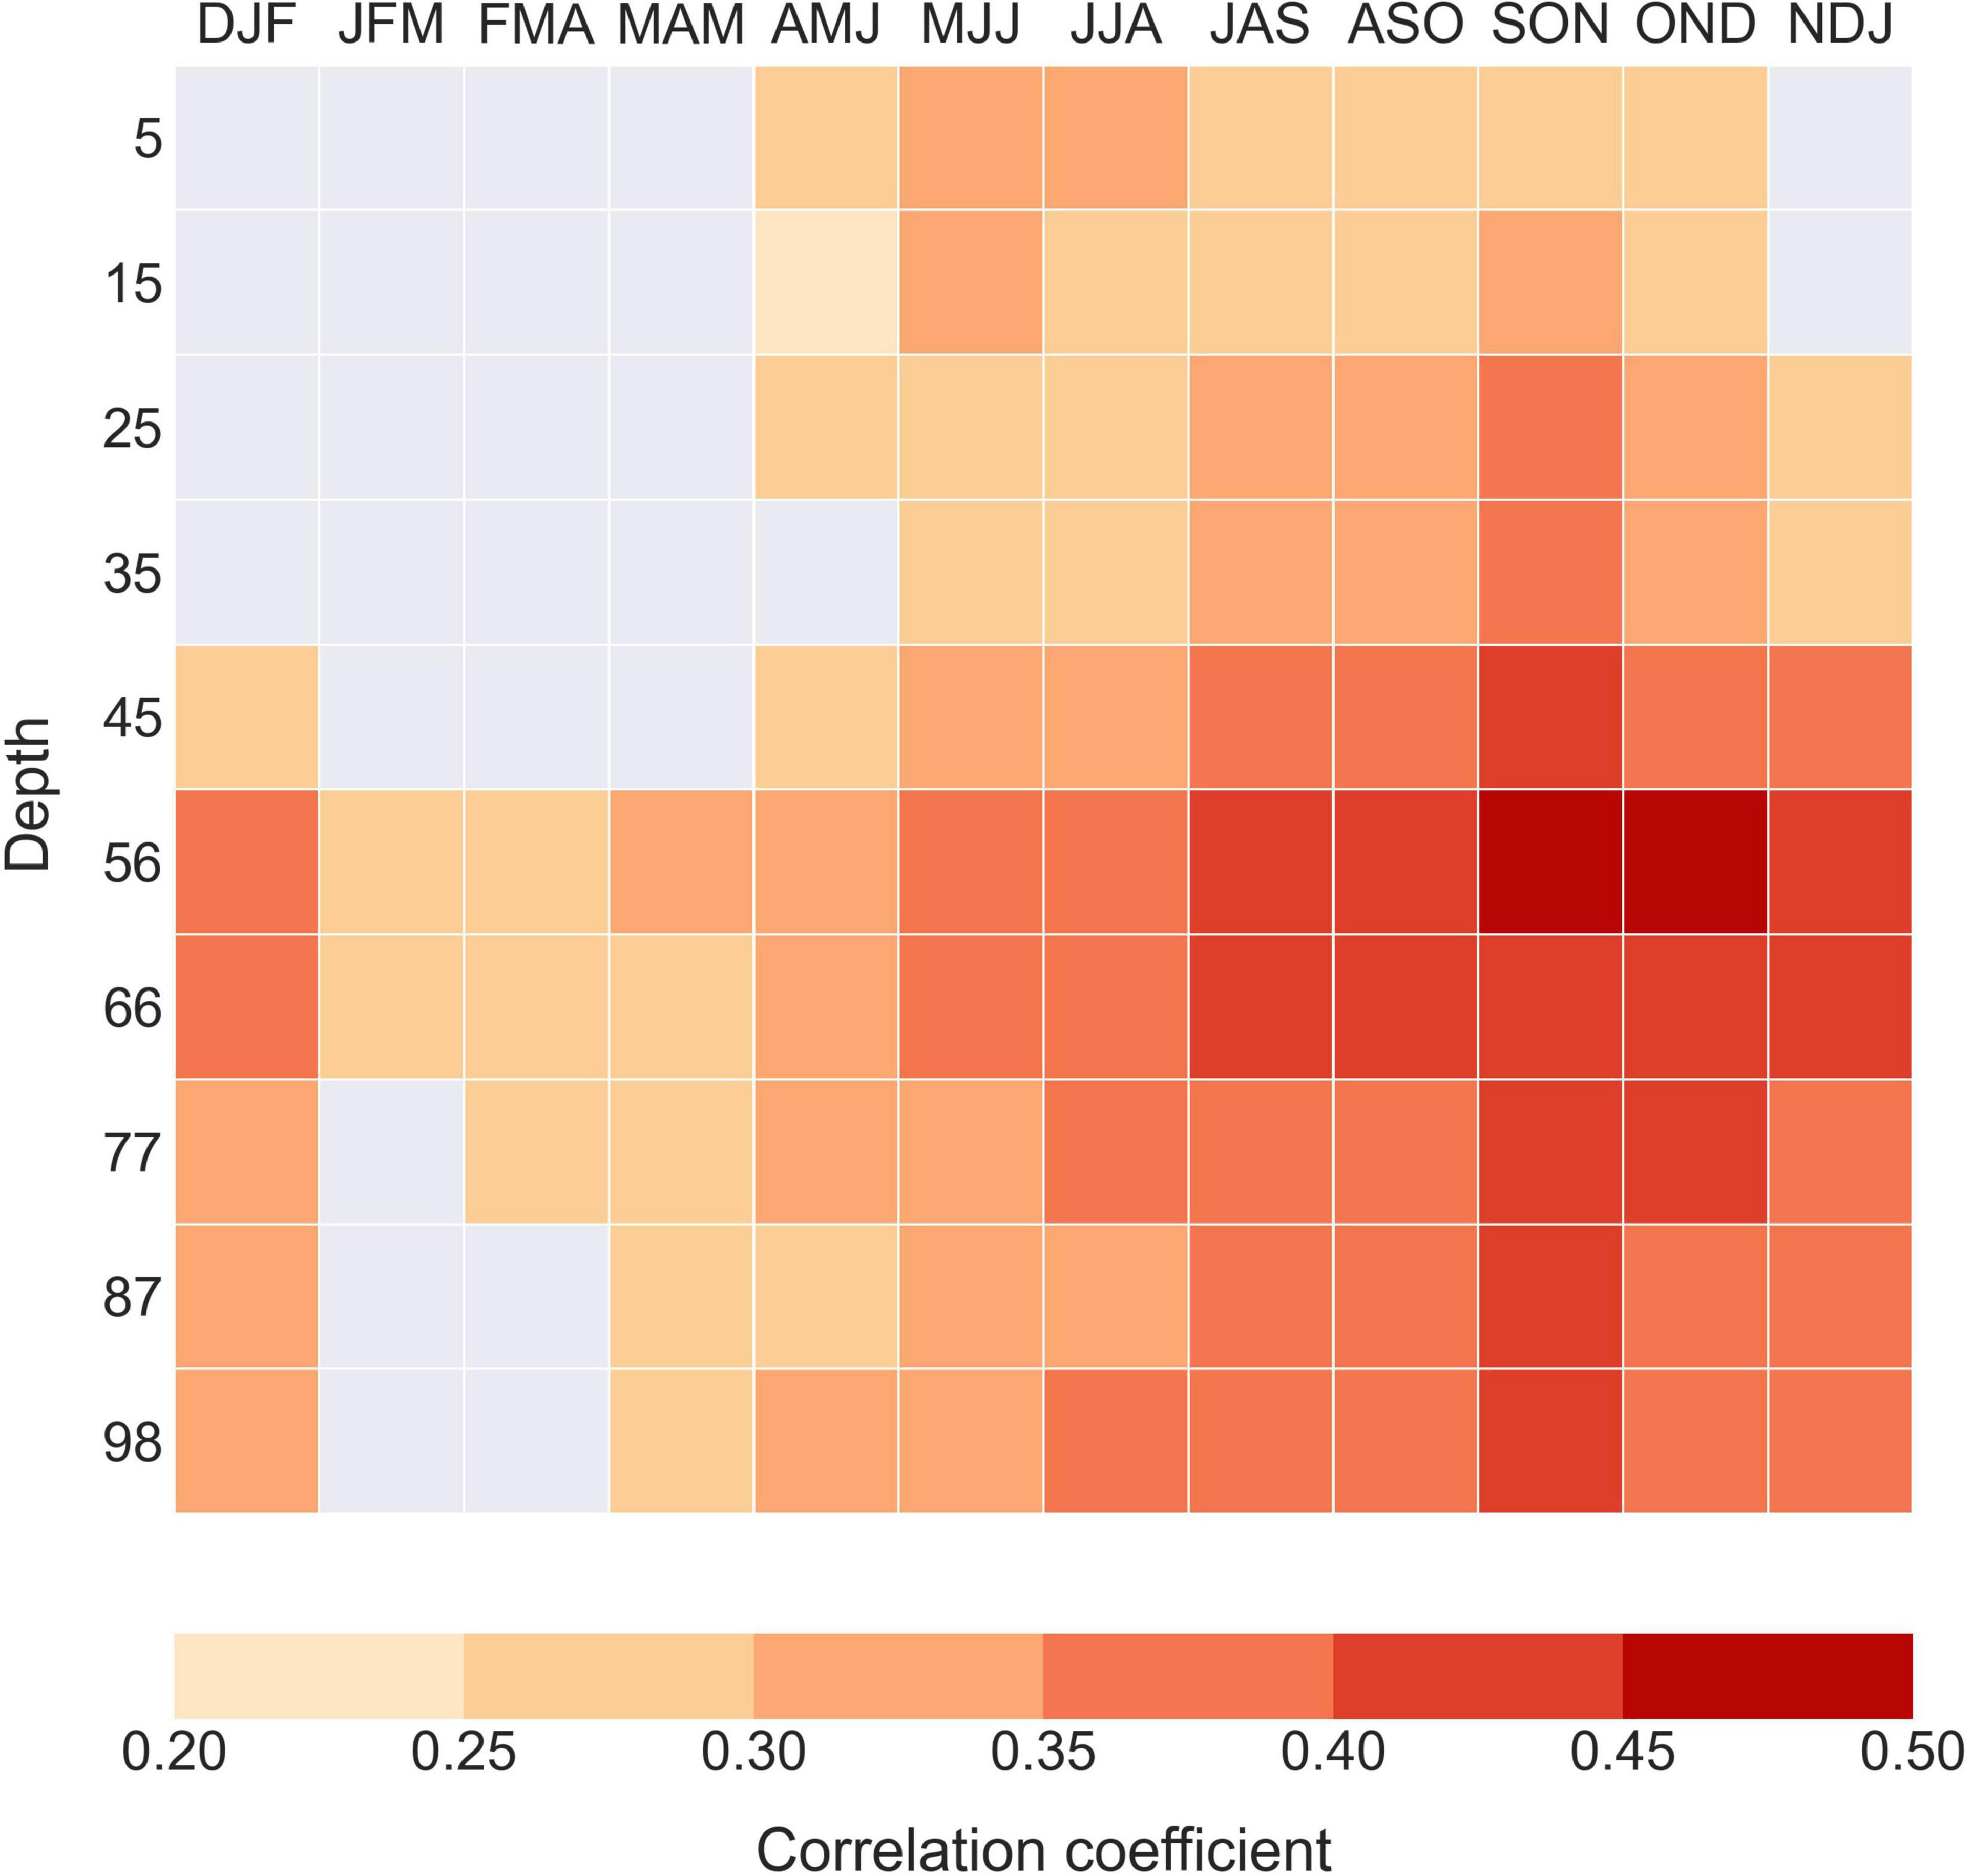
Figure 2. Pearson correlation coefficient (p < 0.01) between the ARMC and subsurface temperature signal extracted from EN4.2.1 dataset (Good et al., 2013) at the collection site (66° N, 18° W) for the 1900–2005 period. The correlation coefficients for p > 0.01 are not shown (gray grids).
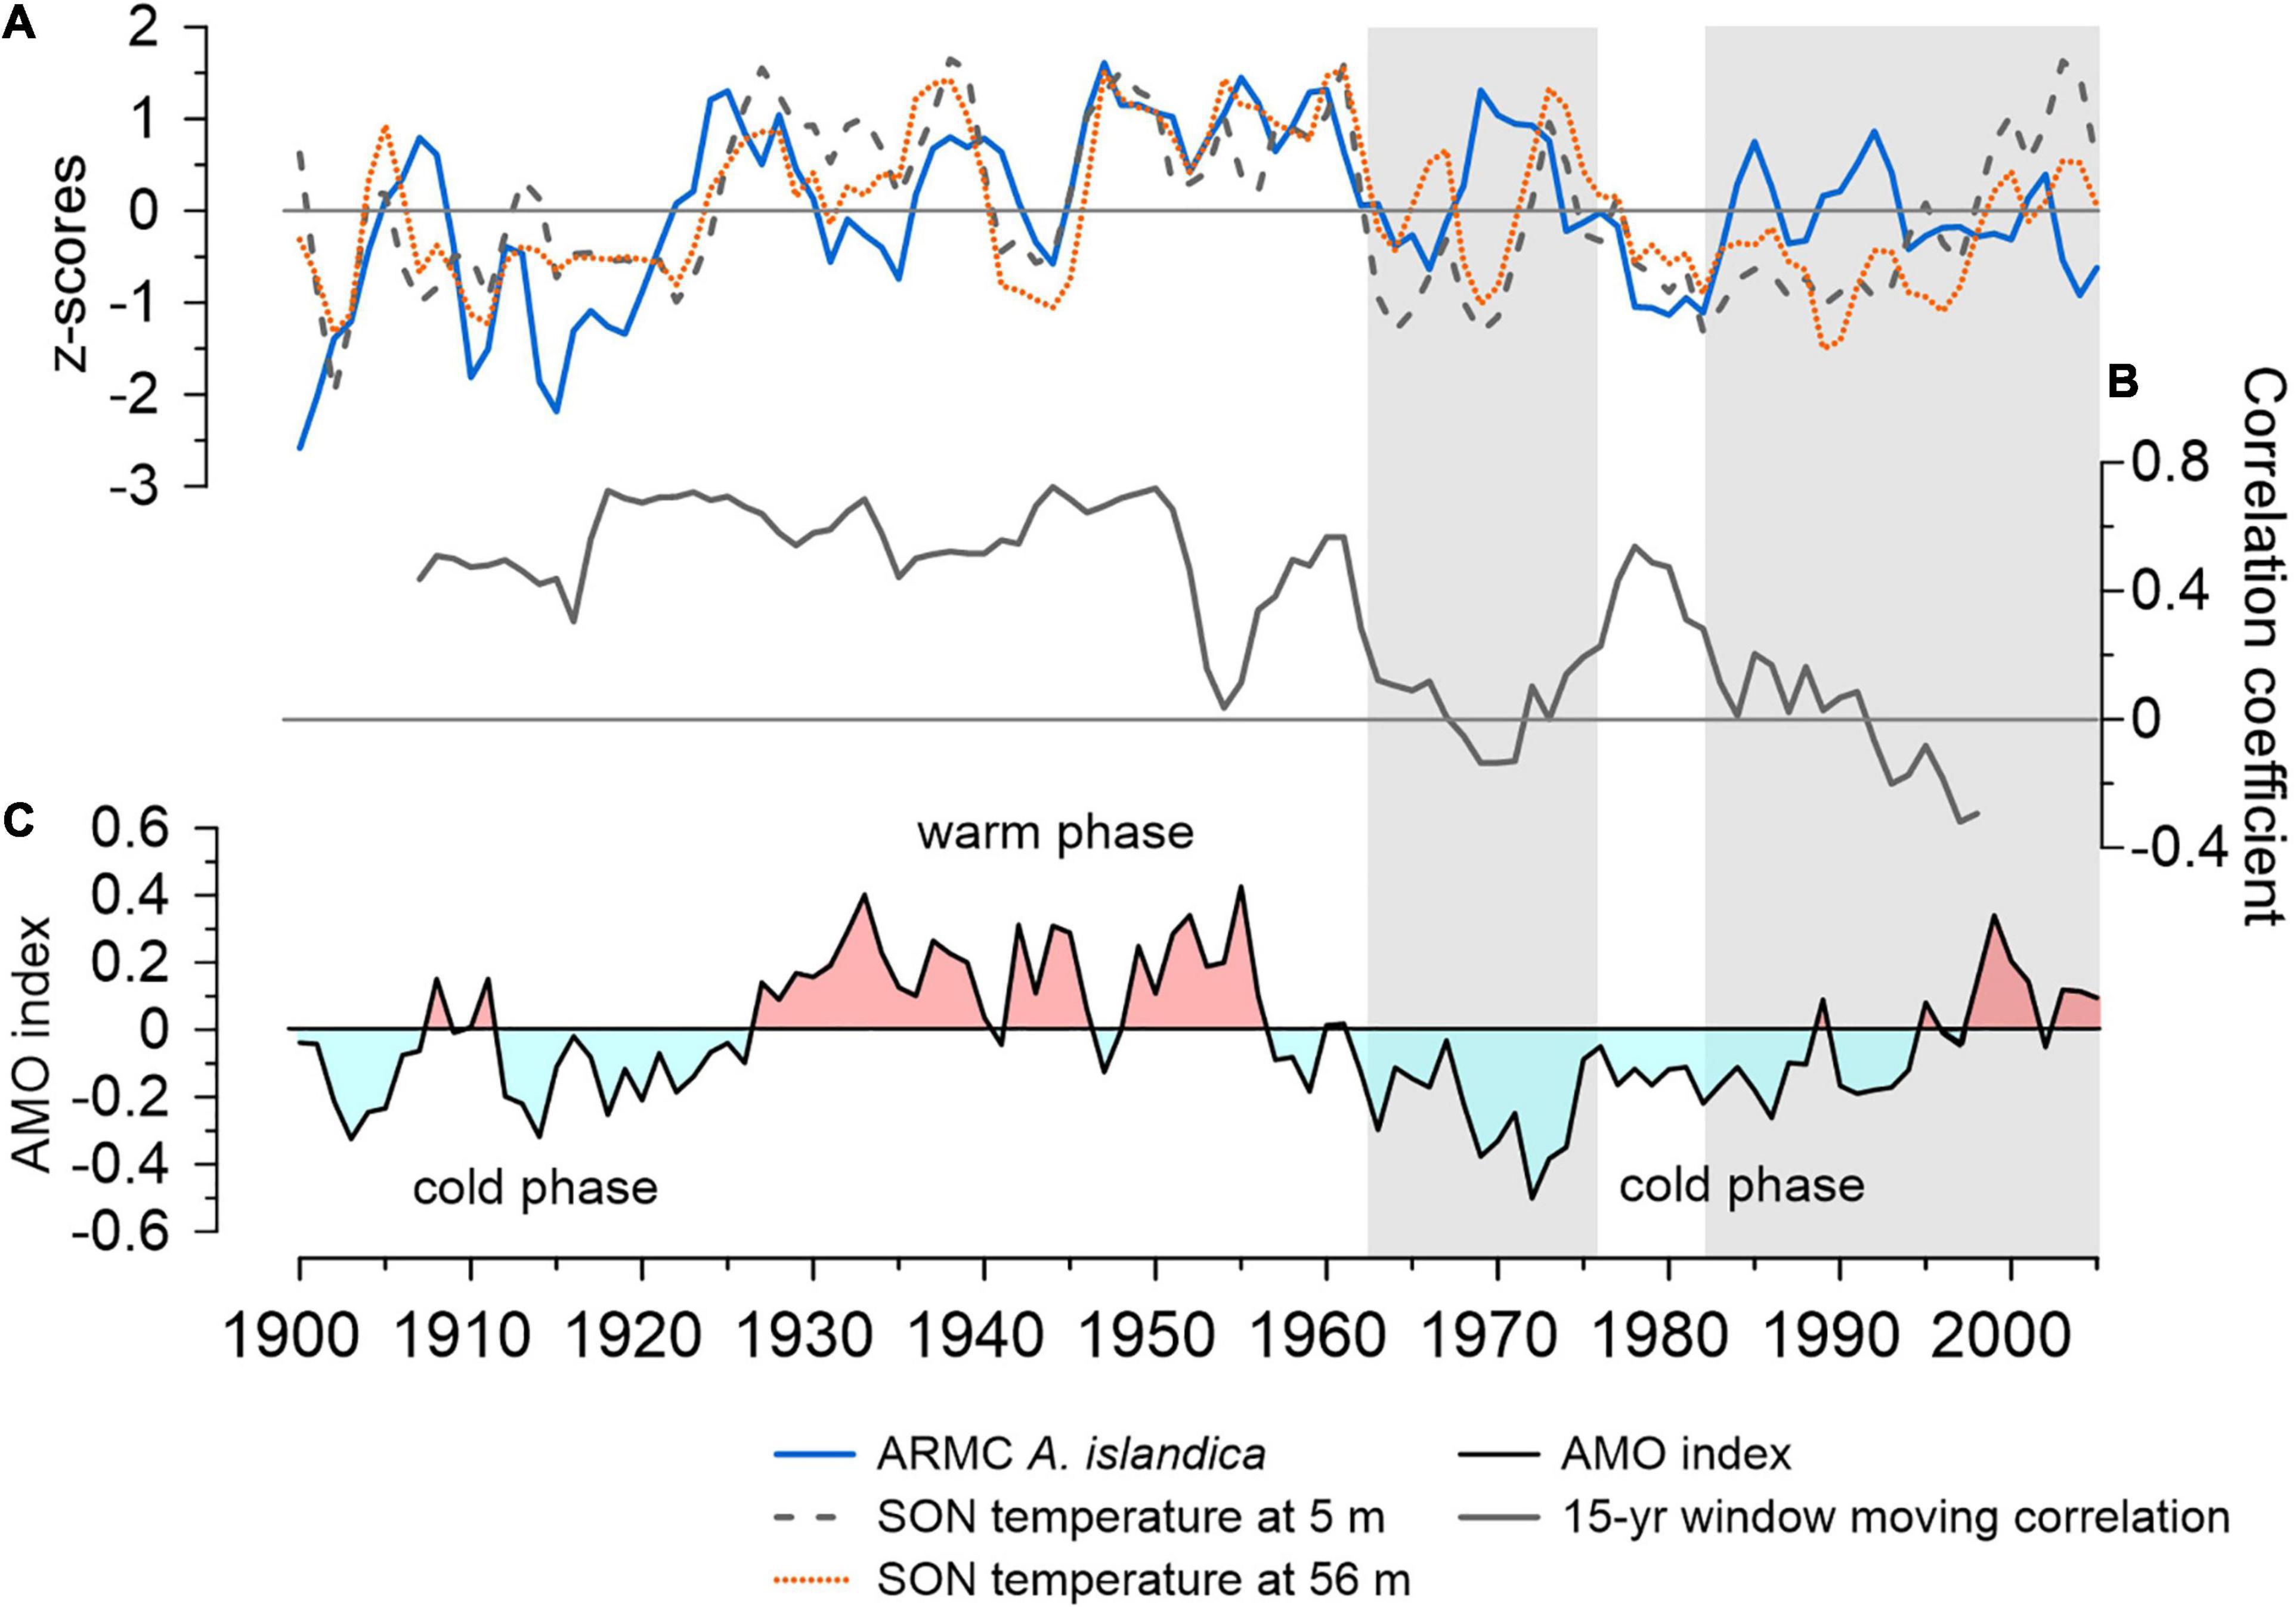
Figure 3. (A) Normalized growth increments of A. islandica (blue line) and autumn (SON) water temperature at 5 m (gray dashed line) and 56 m depth (orange dotted line) between 1900 and 2005. A 5-year low-pass filter (i.e., Savitzky-Golay) was applied to the time series. The water temperatures were extracted at the approximate collection site (66° N, 18° W). (B) The 15-year running correlation between ARMC and temperature signal at 56 m depth. The gray-shaded sections represent periods in which the shell growth variability does not synchronize with the temperature signal. (C) Atlantic Multidecadal Oscillation (AMO) index (van Oldenborgh et al., 2009) showing positive (red shade) and negative (light blue shade) phases in the 1900–2005 period.
Environmental Data
For correlations with the master chronology, we used seasonal subsurface seawater temperature and salinity data extracted from the EN.4.2.1 dataset (Good et al., 2013). This dataset consists of monthly-resolved objectively analyzed temperature and salinity values spaced at 1° on the horizontal grid and 42 depth layers. In general, the temporal and spatial data coverage across all depths is adequate for analysis in the North Atlantic sector (see Supplementary Figure 1). The temperature uncertainty (one standard deviation) is below 1°C, whereas the salinity uncertainty is in the range of 0.1–0.2 psu in the Iceland area (see Supplementary Figure 2). The global ocean temperature and salinity datasets were downloaded from the Met Office website.2 Additionally, we used the Atlantic Multidecadal Oscillation (AMO) index (van Oldenborgh et al., 2009) to associate different time periods with water temperature anomalies in the North Atlantic sector.3 We also used the winter (DJF) North Atlantic Oscillation (NAO) index (Hurrell, 1995) for correlations with the growth index.4 We included in our analysis diatom and copepod abundance data (Batten et al., 2003) from Continuous Plankton Recorder (CPR) for CPR area A6 encompassing the area surrounding Iceland.5 EN.4.2.1 dataset is available for 1900–present, AMO index between 1850–present, NAO index from 1899–present, however, we selected the common analysis period 1900–2005 across all datasets used. The CPR data are available only since 1958.
Data Analysis
The shell archive is an annually-resolved master chronology (ARMC). To assess whether the annual shell signal correlates with year-to-year temperature variations at the approximate collection site (66°N, 18°W), we applied standard statistical methods such as the Pearson correlation over a 3-month moving window (i.e., DJF, JFM, FMA, MAM, AMJ, MJJ, JJA, JAS, ASO, SON, OND, and NDJ). To evaluate whether the relationship between shell signal and seasonal water temperature varies with the water depth of the temperature record, the correlations were computed for 10 different depth layers (i.e., 5, 15, 25, 35, 45, 56, 66, 77, 87, and 98 m). To assess which type of variability drives the strength of the correlation between the ARMC and water temperature, we isolated the low and high frequency components. For the low frequency component, we applied a 5-year Savitzky-Golay filter (Savitzky and Golay, 1964) throughout our time series and calculated the Pearson correlation. Thereafter, we isolated the high frequency residual by subtracting the low pass signal from the time series (following e.g., Wanamaker et al., 2008a). We also investigated the spatial extent of this relationship by creating seasonal grid-point correlation maps for the common time period 1900–2005. Gridded temperature data were linearly detrended prior to the analyses. All statistical analyses consider a significance level of 95% (α = 0.05) or 99% (α = 0.01).
Results
Depth-Dependent Seasonal Variability and Shell Growth
Our results show that the shell growth index time series is significantly and positively correlated with time series of water temperature during late spring, summer and late autumn, both at surface and with increasing depth (Figure 2). The correlation is particularly high at 56–66 m depth throughout the summer and autumn months, and maximal at 56 m depth during SON and OND. In addition, the strongest correlations with water temperature occur during SON along the depth range covered (i.e., 5–98 m depth). Cross-correlation analyses resulted strong and concurrent below 45-meters for summer and autumn (see Supplementary Figure 3C).
There is, however, a prominent dissimilarity between surface and bottom water conditions as the correlations above 45 m depth are either not significant or weak (Figure 2). For instance, there is no significant correlation (p < 0.01) between the ARMC and surface water temperature during winter and spring months, however, some of these correlations are positive at lower significance levels (p < 0.05 and p < 0.1) (Supplementary Figures 3A,B). The strength of the correlation increases below 45-meter depth, but remains generally weaker than observed during summer and autumn months.
Synchronization With Temperature Signal
The strongest correlation between the shell growth index and water temperature for the 1900–2005 period occured during autumn (SON). Additional cross-correlation analyses revealed that such strong correlations are concurrent (Supplementary Figure 3C). To evaluate whether the strong correlation with SON water temperature is stable through time, we selected the depth at which the maximal correlation occurred (i.e., 56 m, Figure 3B). We observed a decreased synchronization with the temperature time series at 56 m depth during 1962–1976 and after 1980s (Figure 3A). It is noteworthy that the decreased growth observed around 1965 matches the decrease in surface water temperature during a cold phase of the Atlantic Multidecadal Oscillation (Figure 3). The positive amplitude observed around 1970 in the ARMC signal is not correlated with water temperature at 5 or 56 m depth. Moreover, the positive growth amplitudes between 1980 and 1995 are also out of sync with the surface and bottom (56–77 m) water temperatures, which were colder than usual and relate to the negative temperature anomalies observed in the North Atlantic region.
Since the maximum correlation occurs during SON with the 56 m water depth time series, we analyzed whether the ARMC signal is dominated by high or low frequencies. In this respect, we obtained a stronger correlation when we isolate the low frequency signal (r = 0.537; p < 0.00001). The correlation between high frequency components of the shell chronology and water temperature is weaker than the low frequency one (r = 0.336, p = 0.000424).
Depth-Dependent Spatial Variability
To analyze the depth dependence variability, we have computed spatial correlation maps by selecting subsurface water temperatures for winter (DJF), spring (MAM), summer (JJA), and autumn (SON) at three different water depths: the surface (5 m), the water depth at which correlations are maximal (56 m) and near the collection depth (77 m) (Figure 4). Positive correlations between the ARMC and water temperatures extend latitudinally from the Labrador Sea to the Arctic Ocean, but also longitudinally from the Baffin Bay to the Barents Sea. The spatial pattern of correlation observed persists at a seasonal level and also becomes stronger at greater depth (i.e., 56–77 m). However, several discrepancies are observed in the correlations with surface and bottom water temperatures. For instance, correlations with surface water temperatures along the NW-Greenland and the Arctic region are substantially weaker than those found at greater depths. Positive correlations with surface water temperatures in the Labrador Sea and the surrounding area are particularly strong only during winter and spring. The strength of the correlation decreases with increasing water depth during DJF, but persists throughout MAM.
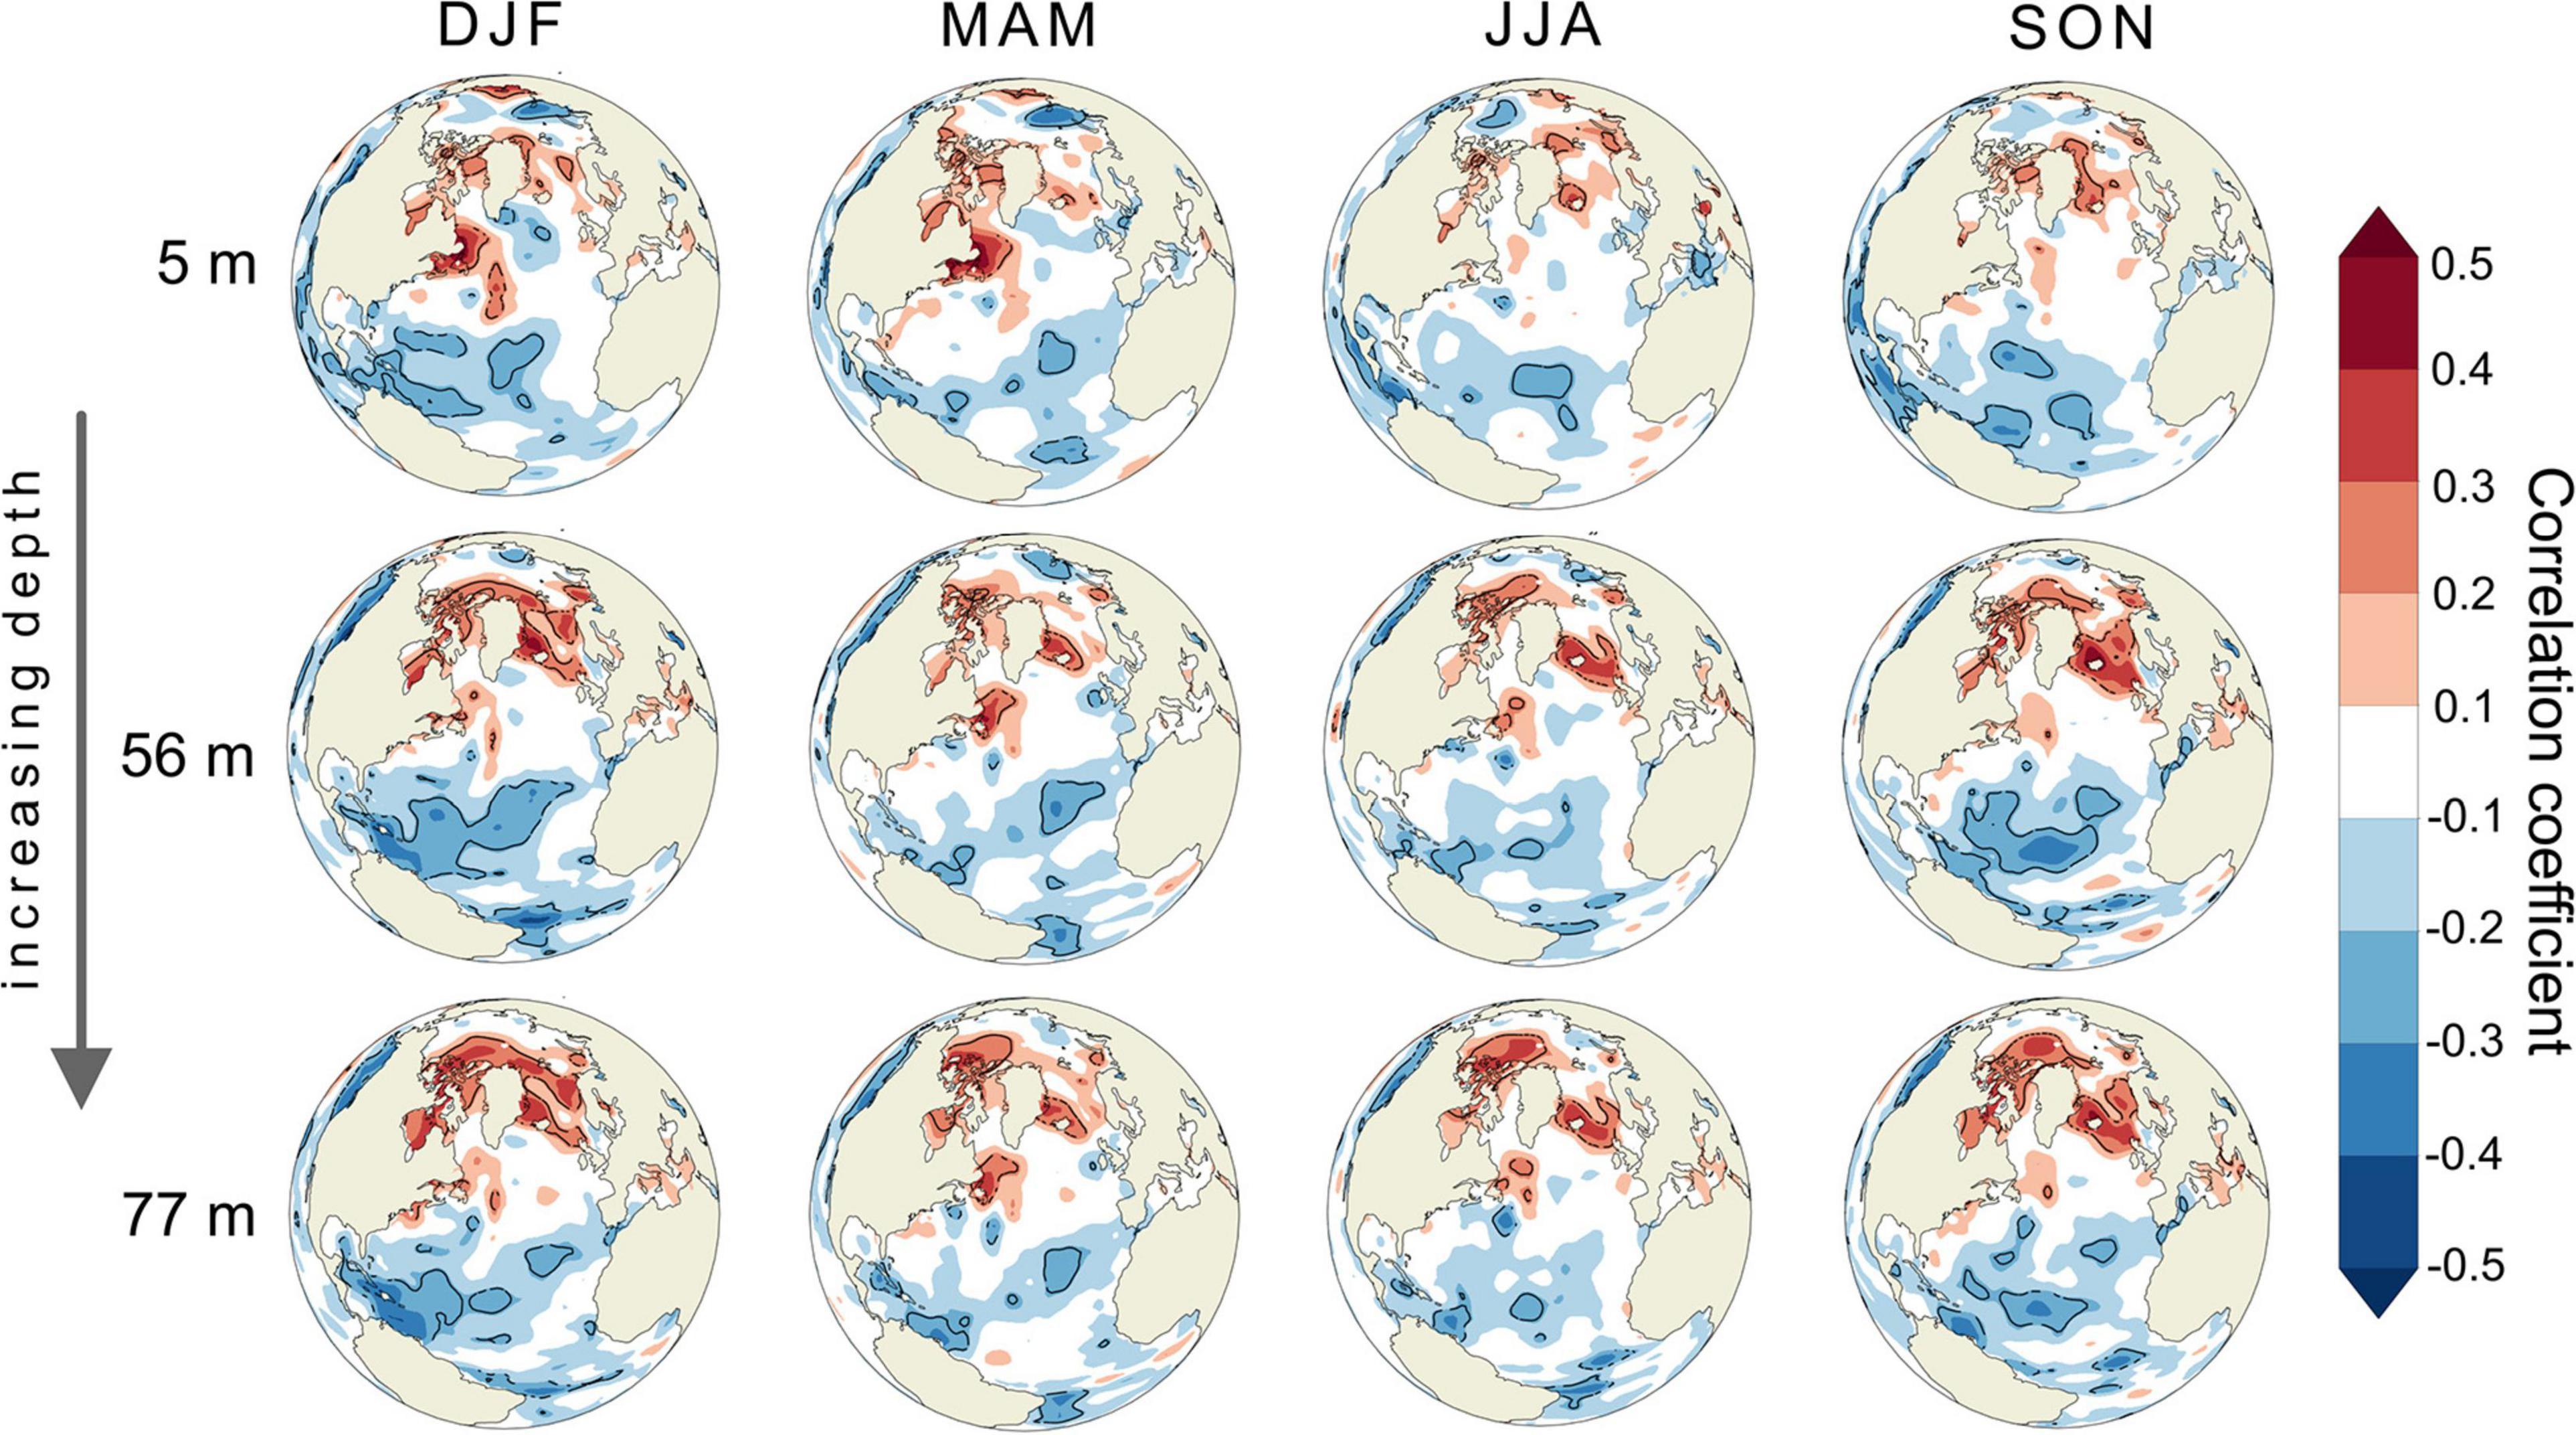
Figure 4. Depth-dependent seasonal variability of growth index time series with water temperature at three different water depths (i.e., 5, 56, and 77 m) for 1900–2005 analysis period. Color shading shows the Pearson correlation coefficient (p < 0.05) between ARMC and seasonal water temperature time series at each grid point.
Negative correlations between the ARMC and subsurface water temperatures prevail in the tropical North Atlantic Ocean and to some extent in the eastern Pacific Ocean. Such strong correlations are observed during DJF and with increasing water depth in the Caribbean Sea. Negative correlations are also localized in the SE-Greenland in between positive centers resembling a tripole structure. This spatial association is present only during winter at 5 m depth.
Discussion
Site-Specific Growth Conditions
To reconstruct past ocean temperatures and capture ocean variability, as well as variability originating from the atmosphere-ocean coupling, highly resolved bivalve records have been recurrently tested and used (e.g., Lohmann and Schöne, 2013; Marali and Schöne, 2015; Mette et al., 2016; Reynolds et al., 2018; Poitevin et al., 2019). However, when it comes to the influence of temperature signals on bivalve shell growth variability, there is contrasting evidence throughout the North Atlantic region. For instance, in the North Sea area, some studies were unable to find a statistically significant correlation with surface water temperatures (e.g., Witbaard, 1996; Epplé et al., 2006). In the Fladen Ground, the observed shell growth variability has been closely connected to local hydrological dynamics and the advective transport of food to the benthos (Witbaard, 1996; Witbaard et al., 1997). In other locations such as the Gulf of Maine and the coast of Newfoundland, shell growth variability has been associated with seasonal water temperature and stratification conditions (Poitevin et al., 2019; Wanamaker et al., 2019). In the region of Iceland, Lohmann and Schöne (2013) found that their record from the northeast coast of Iceland projects onto blocking situations in the northern North Atlantic with northeasterly flow toward Iceland and weakening in the westerly zonal flow over Europe, potentially affecting food availability controlling the local shell growth. On multi-decadal time scales, the same record shows a pronounced variability linked to North Atlantic temperatures and bears similarity with the AMO pattern (Deser and Blackmon, 1993; Dima and Lohmann, 2007).
Although there is a general consensus that regional conditions affect shell growth variability, more precision is required when establishing relationships with ocean temperatures. Absent or temporally limited instrumental temperature data at shell collection depth is often the culprit of weak or inconclusive correlations with water temperature, leaving studies to rely on gridded or instrumental SST data. Butler et al. (2013) used two long (pre-1900) instrumental and gridded SST time series and one instrumental bottom water temperature record (75 m) to test the relationship with A. islandica shell chronology from ∼82 m depth, and found weak correlations with SST data and a statistically insignificant one with the bottom water temperature. The authors furthermore attributed the lack of a strong temperature signal to the possibility that temperature is not the main driver of shell variability, but rather an indirect reflection of phytoplankton productivity in the upper ocean layer. We cannot, at this point, refute the relationship with food availability, however, in our study we found contrasting results upon reanalyzing the shell chronology of Butler et al. (2013). We not only observed weaker strength of correlation with the all-year-round SST signal, but also showed that the temperature signal becomes significantly stronger with increasing water depth layer (Figure 2). The observed dichotomy between surface and bottom water bodies (e.g., Schöne et al., 2005b; Wanamaker et al., 2019) brings to attention the need for multi-seasonal ocean depth-layered temperature profiles in performing correlation analyses.
Synchronization With Seasonal Temperature Signal
It is important to consider that bivalve shell growth is maximal during a specific time of the year. Thus, the correlation with water temperature should be optimized for the peak growing season at the specific collection site. For instance, Wanamaker et al. (2019) identified optimal growth conditions for A. islandica during the February-May period in the Gulf of Maine by performing a similar correlation analysis with monthly temperature data. For the Icelandic region in particular, previous research on stable oxygen isotope profiles and annually-resolved shell growth indices of A. islandica (Schöne et al., 2005a; Reynolds et al., 2016) showed that the growing season starts early in spring and lasts to mid-late autumn (Feb–March to September–October). Reynolds et al. (2016) further suggested that peak growth occurs between June and October when maximum water temperatures are reached, an observation highly consistent with our own results. The correlation with water temperatures at 56 m depth is slightly better (r = 0.449, p < 0.0001) for the peak growth period (JJASO) than for the entire growth season (r = 0.417–0.438, p < 0.0001). The water temperature at the shell collection site ranges from 2.4–3°C in winter to 1.5–2.0°C in spring, 2.4–3.2°C in summer, and 3.2–4.0°C in autumn (Figure 5). Witbaard et al. (1998) showed in their experimental study that maximum height growth in A. islandica occurs between 3.2 and 6.2°C. Despite the EN4.2.1 temperature uncertainties (Supplementary Figure 2A), it is apparent that the ARMC best synchronizes with summer and autumn (JJASO) conditions when water temperatures above 3.2°C prevail, coinciding with depth expansion of the warmer upper ocean mixed layer (Figures 5C,D). Hence, we propose that JJASO is the predominant growth season for A. islandica collected from NIS, but since maximal correlations are found particularly with the autumn (SON) temperatures, we suggest that these temperatures reflect best the observed ARMC signal.
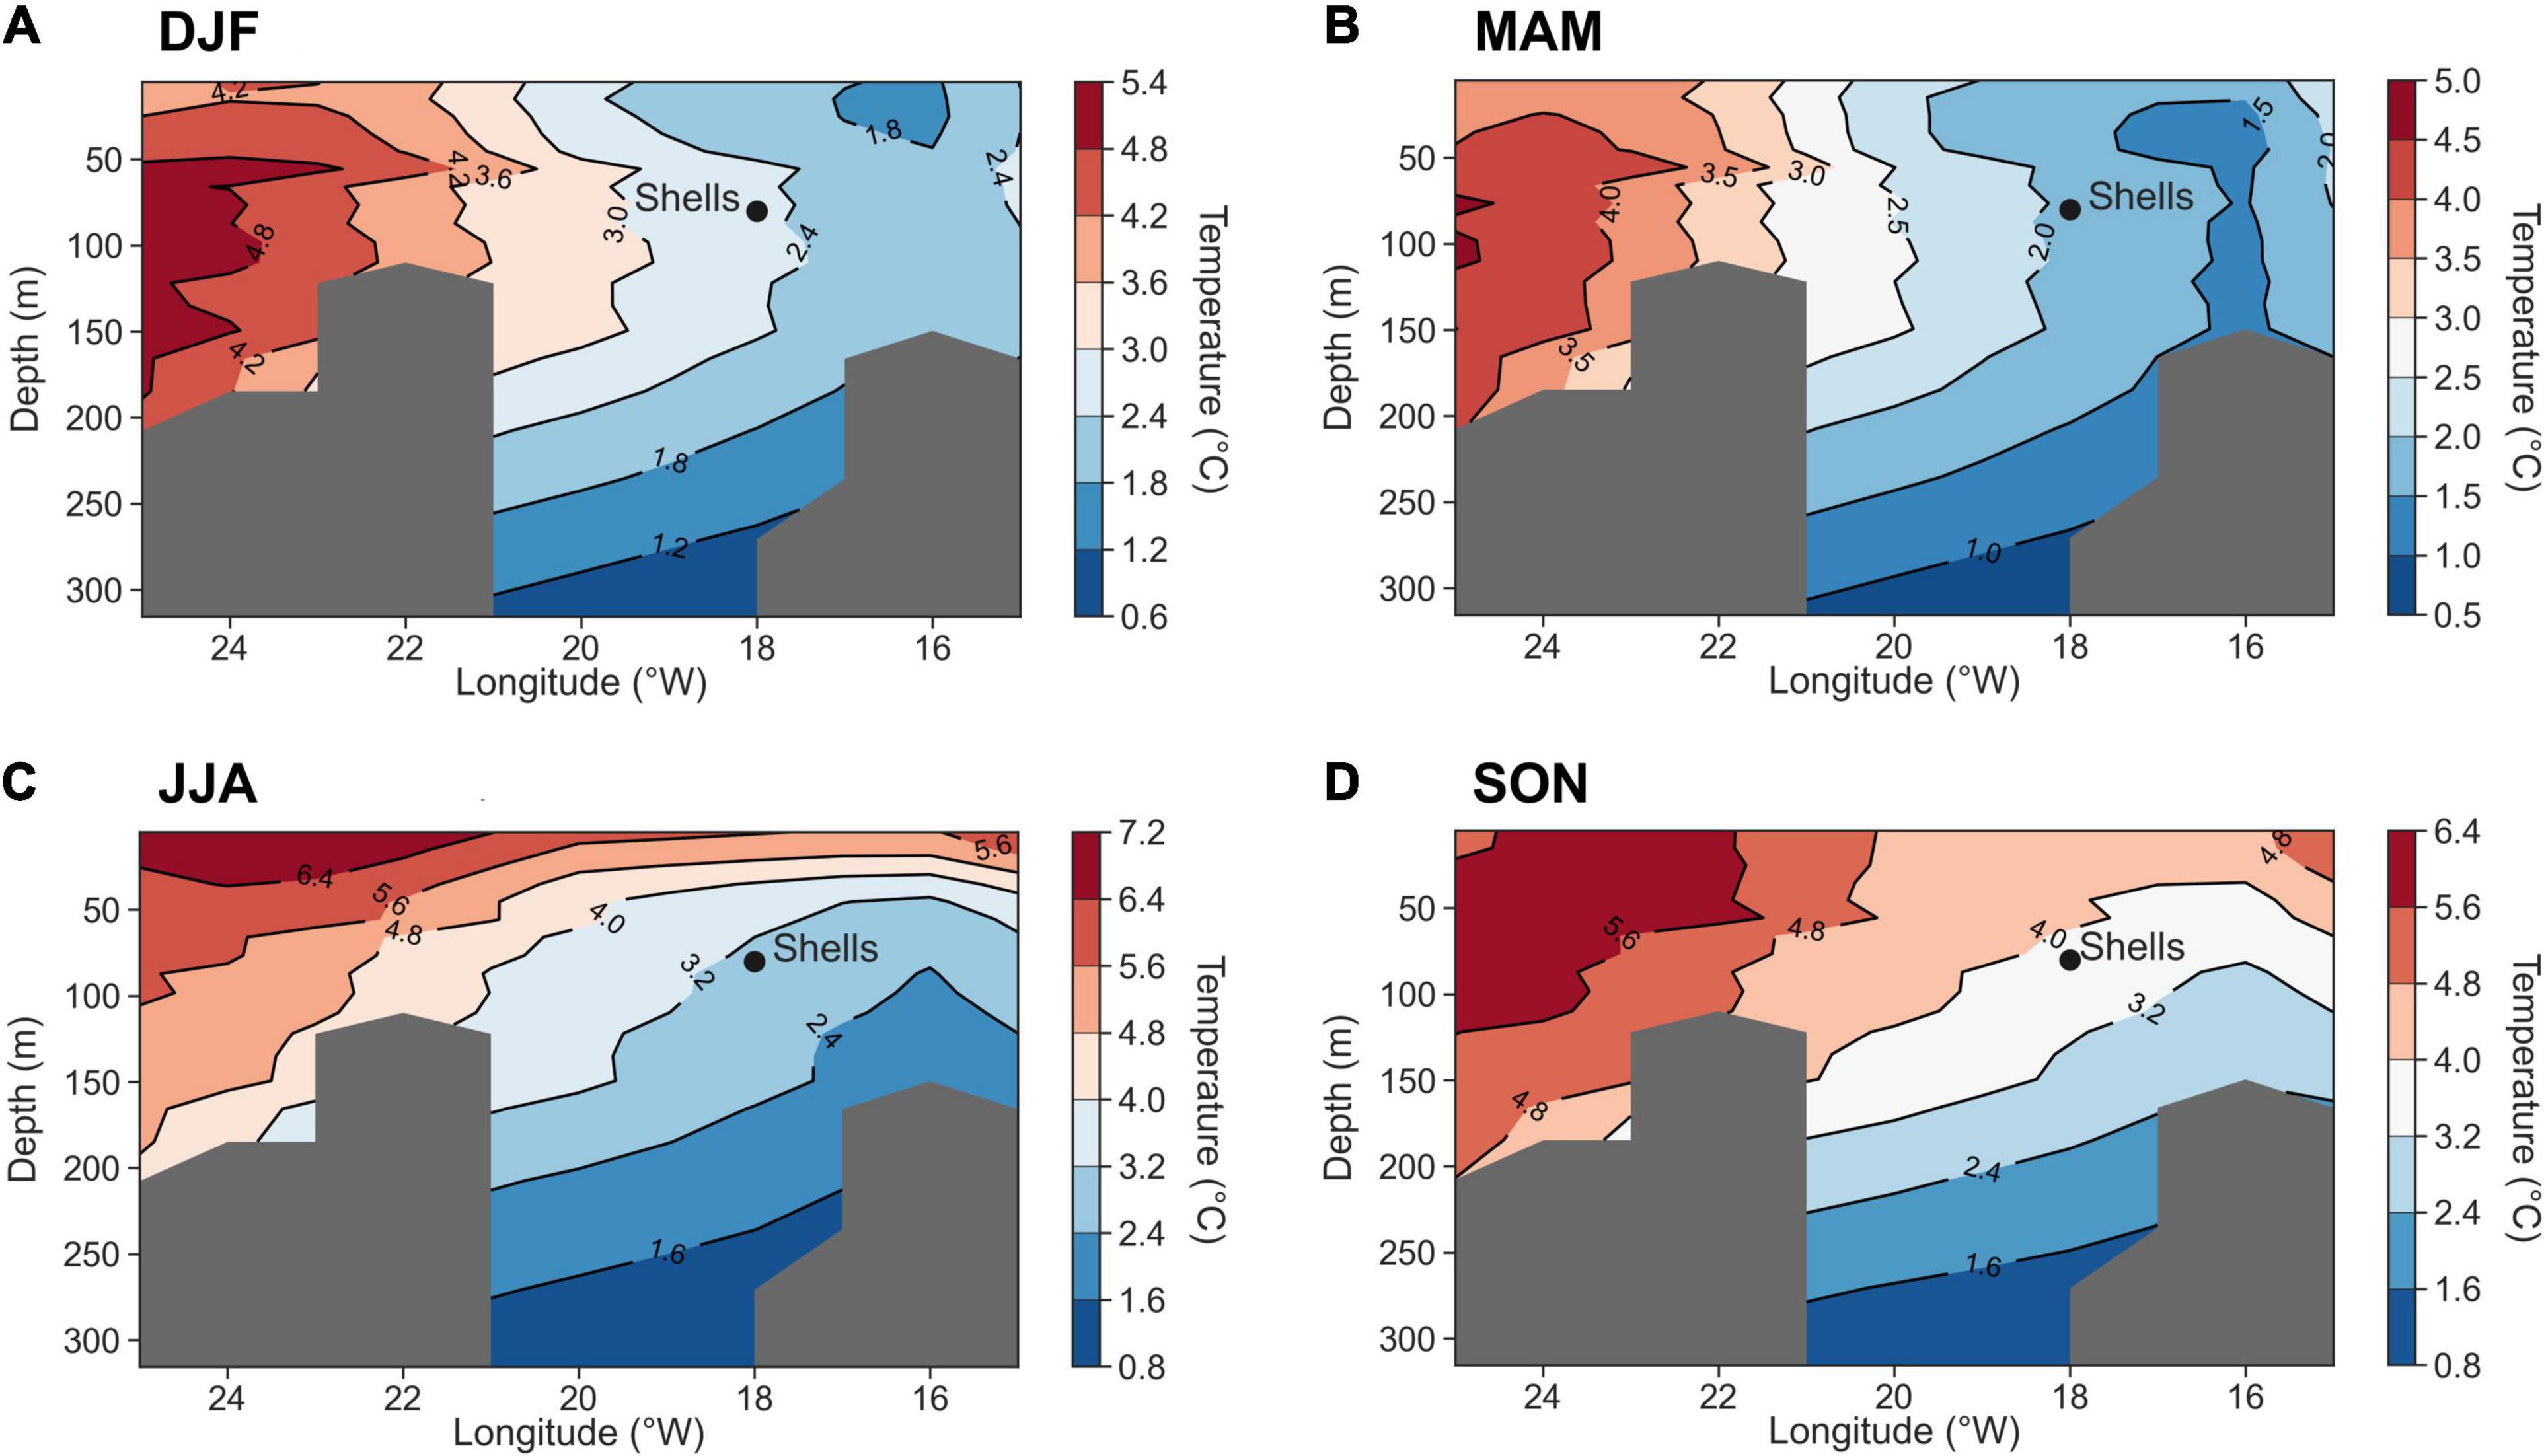
Figure 5. Seasonal temperature-depth profiles along a longitudinal transect (25°W–15°W; 66°N). The EN4.2.1 temperature fields were averaged for (A) winter, (B) spring, (C) summer and (D) autumn for the period 1900–2005. The gray-shaded areas represent no available data.
Failure in identifying the peak growth period reflected by the annually-resolved growth chronology could produce flawed correlations. For instance, Butler et al. (2013) used April–June (AMJ) months for correlations with surface and bottom water temperatures, a period which reflects a strong water column mixing at this location (Figure 5B). Using the EN4.2.1 temperature record, we noticed that the correlation with AMJ surface temperature and at the collection site is generally weaker than with the dominant growth season (see Supplementary Table 1), indicating unfavorable growing conditions. In addition, our correlations with AMJ surface and bottom temperature data are accompanied by a 2-year lag (Supplementary Figure 3). Butler et al. (2010) found similar lags which were attributed to the delayed response of nutrient supply to temperature or possible physiological effects related to reproductive activity. Interestingly, the strongest correlations obtained in this study are centered below the 56 m water depth during summer and autumn and present no time lag (Supplementary Figure 3), indicating a similar thermal relationship between the water bodies around the shell’s site location (Figure 5). In a similar correlations study, Poitevin et al. (2019) found that shallow-water shells from the Newfoundland Shelf correlated significantly with the January and February temperature signal down to 175 m depth and with bottom water temperature (<100 m) for the remaining months (March–December), indicating the distinct impact of seasonal thermal stratification conditions on growth variability.
To better assess the observed thermal stratification pattern and the significance of the 56-m depth boundary layer between the local water bodies, we correlated the year-to-year shell growth variability with the EN4.2.1 salinity record (see Supplementary Figure 4). Salinity does not influence shell growth directly (explained variance <1%), but serves here as indicator of the different water bodies and seasonal stratification dynamics. Our results show significant positive correlations only with water layers below 56 m (Supplementary Figure 4C). The strongest in-phase correlation is present in late spring-early summer (MJJ), coinciding with the eastward movement of a more saline water body toward the collection site (34.80 isocline; Supplementary Figure 5) and with the stratification of the mixed layer throughout the summer and autumn. Strong correlations with seasonal temperature and salinity starting below 56 m depth suggest that the upper mixed layer is above this threshold. In fact, multiple regression analysis showed that 24.3% of the variance is explained by SON water temperature between 56 and 98 m depth, whereas 21.9% of the variance is exclusively explained by the water temperature at 56 m. While this phenomenon may be site-specific, it also reflects the disparity between the upper and lower water bodies, the mixed layer and the water body below the thermocline in their effect on the Arctica shell proxy.
Temporal Synchronization With Temperature Signal
In addition to analyzing the seasonal synchronization with local surface and bottom water temperature determinants of the main growth period and reflective of the seasonal stratification, we suggest that it is equally important to evaluate how stable this coupling was during the 106-year analysis period. The 15-year running correlation (Figure 3B) yielded a significant correlation (r > 0.4) between 1900 and early 1960s, besides a brief decoupling during the early 1950s and for almost a decade between 1970 and 1980. Our analysis showed that the observed growth variability in A. islandica responds to a low-frequency signal (section “Synchronization with temperature signal”), most apparent in the strong coupling with AMO phases during the first six decades (Figure 3). Despite the weak correlation with AMO index (11-year low-pass filter; r = 0.250, p < 0.05), the corresponding temperature anomalies in the North Atlantic sector reflect the dominance of Atlantic and Arctic waters on multi-decadal timescales. In turn, these changes modulate shell growth variability resulting in good coupling (cf., Lohmann and Schöne, 2013). The short-term lack of synchronization with SON water temperature at 56 m depth during the early 1950s could be attributed to quasi-decadal ocean variability and a temporal shift in the seasonal pattern. For instance, by computing a 15-year running correlation with JJA water temperature at 56 m depth, we do not observe such brief decoupling (Supplementary Figure 6). However, by shifting the season by one month at a time (i.e., JAS, ASO, SON, OND), we observe that the correlation decreases gradually (Supplementary Figure 6). Although shell growth variability is best explained by SON temperature during the 1900–2005 period, this finding suggests that short-term changes in the seasonal pattern of coupling can occur and can be tied to shifts in timing of primary productivity patterns, thereby complicating the local hydro-climatic reconstructions. However, the presence of a high frequency ocean component in the growth signal explains why weaker correlations with subsurface water temperature and salinity are often accompanied by a lag (Supplementary Figures 3, 4).
We notice that regardless of the projected season (JJA-SON), the main periods of decreased temporal synchronicity with the water temperature at the collection site remains unchanged (Figure 3 and Supplementary Figure 6). The first decoupled period occurs for almost a decade, between the early 1960s and mid-1970s, coinciding with the occurrence of the Great Salinity Anomaly (GSA) in the Icelandic region (Dickson et al., 1988). The GSA event was an abrupt freshening episode due to extensive sea ice export from the Arctic through the Fram Strait, which affected the entire northern North Atlantic region from mid-1960s to early 1980s (e.g., Ionita et al., 2016). Recognizing such abrupt events in annually-resolved master chronologies is important because it reflects the proxy’s ability to record drastic environmental fluctuations. For instance, decreased shell growth during 1965 is also evident in shallow-water shells from NE Iceland (e.g., Lohmann and Schöne, 2013; Marali and Schöne, 2015), reflecting a common response of the A. islandica population from North Icelandic shelf to GSA. On the other hand, the positive growth anomaly observed during late 1960s and early 1970s might be related, partially, to a methodological bias as additional shells of low biological age are included in the chronology starting with 1940 (Butler et al., 2013). Butler et al. (2010, 2013) mention that time periods in which the chronology is dominated by series of low biological age might bias the RCS values toward higher values.
The decreased growth from the mid-1970s into the early 1980s synchronizes well with negative SST anomalies being preserved in the upper 200–300 m (Dickson et al., 1988). The second period of decreased synchronization with the temperature signal at the collection site starts in the early 1980s and lasts until the end of the shell chronology. This period is characterized by an overall negative temperature anomaly in the North Atlantic sector and a transition in the 1990s toward more positive anomalies. Although the salinity changes are minimal at this location and depth (±0.2 psu during the 1900–2005 period) and such fluctuations may be prone to some errors given the EN4.2.1 dataset’s uncertainty in the North Icelandic shelf area (0.1–0.2 psu; Supplementary Figure 2B), we observed that after 1962, the oscillation is more frequent (Supplementary Figure 7). Multiple regression analysis indicates that prior to the GSA event, 41% in shell variability was explained by SON temperature and MJJ salinity at 56 m depth. The period post-GSA is hydrologically more variable, with interannual to quasi-decadal alternating influences from IC and EIC leading to changes in shell variability that cannot be explained by either temperature or salinity.
Diatom and copepod monthly abundances from CPR (see section “Materials and Methods”) may help to understand the lack of synchronization between temperature and shell growth (Figure 6). Diatom blooms indicate high primary production, but access of the benthos to this production depends to a large extent on the presence of zooplankton (Witbaard et al., 2003). Unfortunately, observational data pre-1950s are lacking, so that this analysis was constrained to a shorter time series (1958–2005). Shell growth index correlates marginally with diatom abundance (r = 0.271, p = 0.063), however, the decrease in A. islandica growth starting around 1962 coincides with a decline in diatom abundance and a diatom-based SST reconstruction (Ran et al., 2011). The correlation with copepod abundance is not significant (r = 0.187, p = 0.202), however, for the period affected by GSA (1962–1976), 36% of shell growth variability is explained by copepod abundance (p = 0.0551). The growth variability after GSA cannot be explained by a three-parameter model (temperature, diatoms and copepods) besides short temporal observations of an inverse relationship with copepod abundance (Witbaard et al., 2003). Lack of synchronization between A. islandica growth and environmental parameters in the late 1970s might also be due to a temporal mismatch between primary and secondary producers and a shift in food availability (Olivier et al., 2020). Apparently, our time series are too short and too noisy to enable the detection of correlation patterns and their development over time consistently. We emphasize that the reduced explained variance with temperature post-1960s may also complicate correlations with observational temperature data which are temporally limited and lack monthly to seasonal resolutions. An example is that the instrumental data used by Butler et al. (2013), namely Siglunes Station, is too short (1947–2005) and contains missing data for a statistically robust correlation (e.g., Bonett and Wright, 2000), in particular with JJA-SON bottom water temperature.
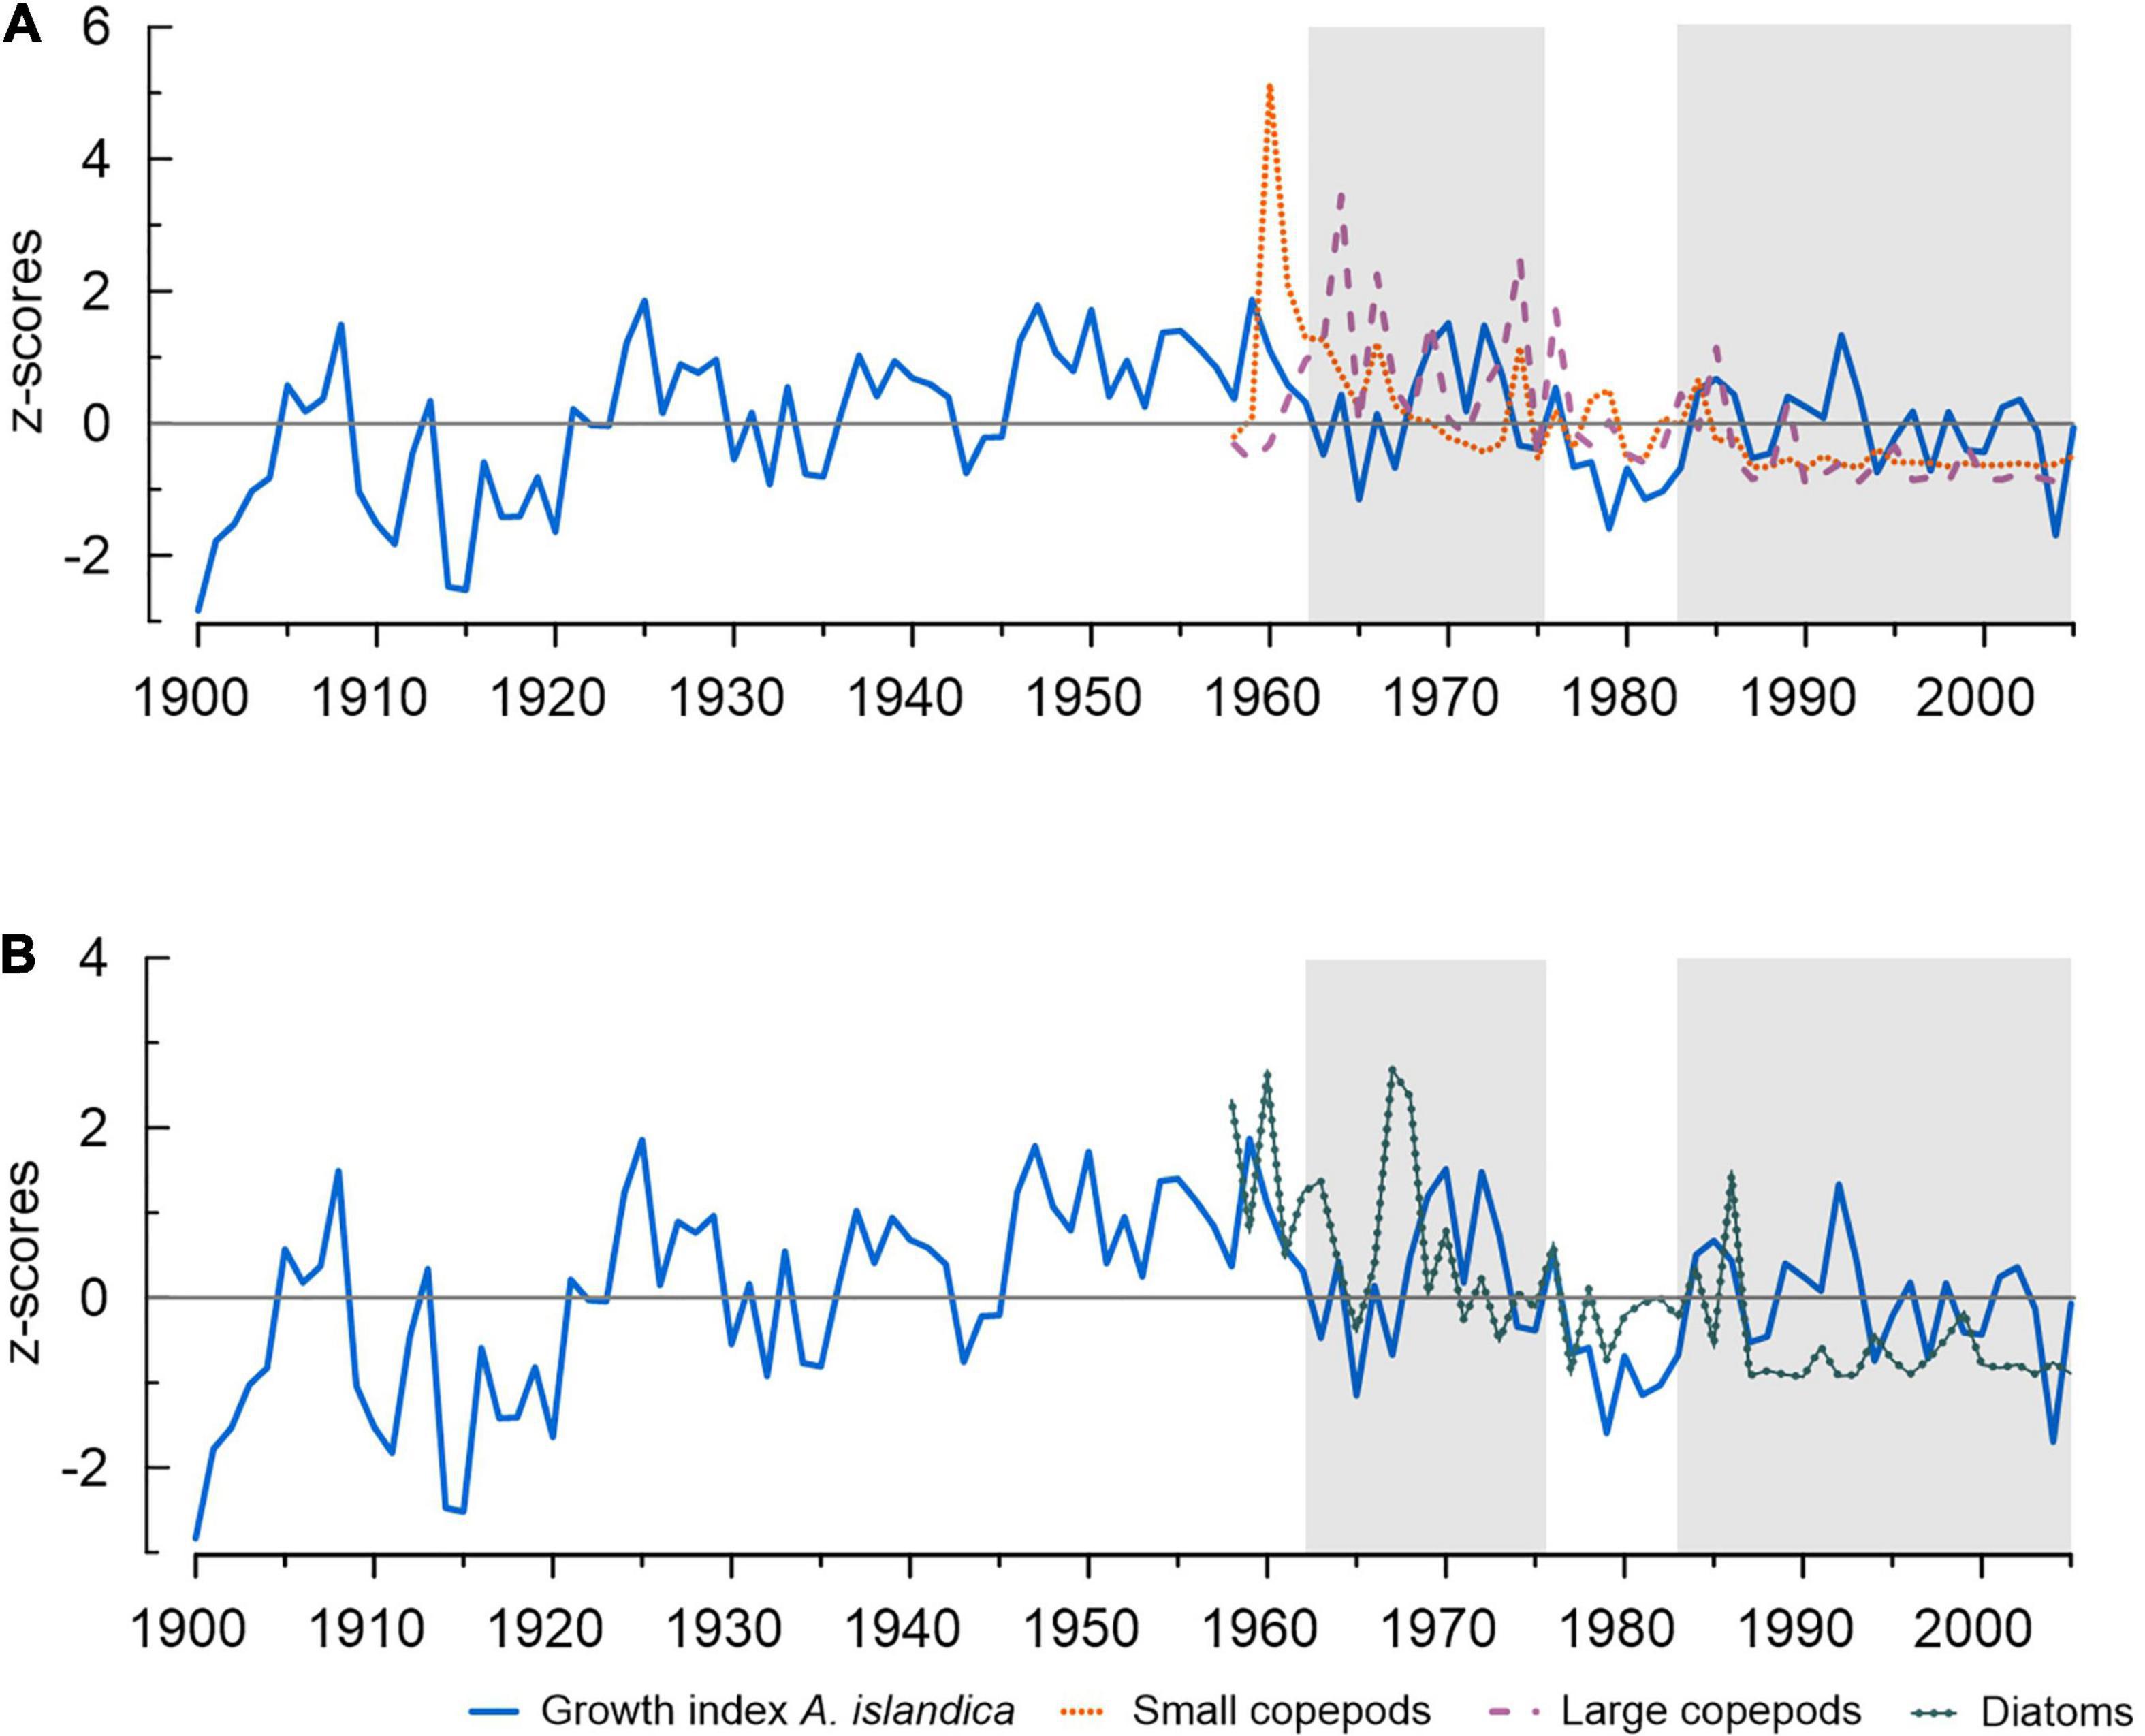
Figure 6. Annual growth variability of A. islandica during 1900–2005. (A) Copepod and (B) Diatom abundances during 1958–2018. Periods of decreased synchronicity with surface (5 m) and water temperature at 56 m depth are shaded (see also Figure 3).
Oceanographic Patterns
By expanding our analysis spatially in the North Atlantic sector, we track the positive relationship with water temperature observed locally, and search for similarities with distant water bodies both at surface and with increasing water depth. For northern Norway, Mette et al. (2016) observed that the explained variance between the master-chronology of A. islandica and water temperature was higher at large-scale than locally. It is, therefore, interesting to address large-scale ocean variability to explain shell growth variability instead of correlating only with local phenomena.
The positive spatial correlation observed spreads along the Norwegian coast and to the Arctic Ocean, following the path of the North Atlantic Current and also along the western margin of Greenland, speaking for a predominant influence of the Labrador Current. Similarly, Mette et al. (2016) and Poitevin et al. (2019) observed that the spatial correlations are stronger for locations along main current paths, i.e., the Labrador Current and the North Atlantic Current. In this study, the spatial pattern of correlation is stronger at water depths approaching the collection site (56–77 m). This suggests that the mixed ocean layer across the observed locations responds to similar intrinsic modes of variability. Since strong correlations are found only below 56 m depth within a broad oceanographic area (Figure 4), we propose that the shell growth variability extracts a common temperature signal in between the mixed layer and the thermocline in the range of the optimal growth temperature. The relatively warm temperature conditions found within this depth range are furthermore suggestive of an intensified North Atlantic Current (NAC) and a predominant influence of Atlantic waters in the Arctic (Spielhagen et al., 2011). The signature of the warm and saline Atlantic water body following the northwards path of the NAC is further observed during spring and summer below 56 m in spatial correlation plots with salinity (Supplementary Figure 8). For the period 1900–2005, we remark that a negative phase in Arctic Oscillation (AO) is generally more dominant, with more warm air reaching the Arctic region.
We also observe a strong positive correlation during winter and spring with the surface waters around the coast of Newfoundland. Poitevin et al. (2019) associated the enhanced shell growth in the area with a negative phase of North Atlantic Oscillation (NAO). The decrease in westerly winds reduces surface ocean heat loss to the atmosphere, thus maintaining a positive ocean temperature anomaly. Such positive anomaly is stronger during spring with increasing water depth, but it is also present during summer and autumn (Figure 4), indicating that the surface warming signal trails at greater depths during the next season. Another feature revealing an ocean-atmosphere interaction is the tripole pattern observed during winter (Figure 4). The tripole pattern is associated with SST anomalies, similar to the ones generated by NAO variability (Deser et al., 2010; Hurrell and Deser, 2010). The fact that this feature is significantly persistent only during winter, suggests that the signal along the path of Labrador Current is a local response of uppermost layer of the ocean to the variability of NAO. Although correlations with winter NAO index are not significant (p > 0.05), we suggest that interactions between NAO and the ocean can be identified interannually during winter, reflecting a winter re-emergence mechanism (Hurrell and Deser, 2010).
The negative temperature association that dominates the tropical Atlantic indicates that the water conditions are inversely related to those experienced by A. islandica in the North Atlantic region. The longitudinal extent and the timing of such negative correlations (i.e., autumn and winter) suggest that these are regions affected by a high-pressure and intensified northeasterly trade-winds which typically prevail during winter (Amador et al., 2006). The strongest correlations are centered along the coast of South America below 56 m depth (Figure 4) and indicate winter mixing associated with the Southern Caribbean coastal upwelling system (Rueda-Roa and Muller-Karger, 2013). The spatial extent covered by our analysis at various depths indicates that by using growth indices of A. islandica, it is possible to track thermal connections between different water bodies.
Conclusion
This study explored the depth-dependent relationship of an annually-resolved master chronology of A. islandica from the North Icelandic shelf to ocean temperatures. Our findings suggest that positive correlations are exclusively found between the mixed layer and thermocline during summer and autumn corresponding to patterns of thermal expansion of the local water bodies. The spatial extent of the analysis from tropical to extra-tropical regions of the North Atlantic Ocean marks potential source regions responsible for driving shell growth variability affected by interannual to quasi-decadal variability associated with NAO and multi-decadal variability linked to AMO. Such results are important in understanding drivers of variability in A. islandica and why correlations with sea surface temperatures can be particularly inconclusive. We, thereby, recommend that for maximizing the use of A. islandica as proxy, correlations should be made, as a first step, with water temperature data during the peak growth period, close to the collection site and depth over a long period of time (e.g., several decades and longer).
In the absence of a strong temperature signal, shell growth might synchronize with other environmental conditions (e.g., high diatom abundances) and competition from zooplankton feeding activity. With GSA-like events to be foreseen in the future, abrupt temperature changes do not only impact the growth, but alter the possibility of coupling the shell growth index to environmental parameters. In retrospective, depending on the location, such periods of decadal decoupling might be useful in identifying temperature and climatic anomalies. The use of growth indices in A. islandica together with other proxy-based temperature reconstructions (e.g., δ18O from same chronology) over the past 1000 years or with model simulations for a more robust outlook, could improve our skills in observing large-scale ocean variability at various water depths. Our results enhance the application of A. islandica to track thermally linked water bodies across a much broader region and emphasizes the need to look not only at the relationship with the sea surface temperature, but also with the water temperature at different depths.
Data Availability Statement
The sources of all primary data this study is based upon are cited in the paper or the Supplementary Material, further inquiries may be directed to the corresponding author.
Author Contributions
DC, MI, and TB designed the project. DC analyzed the data, interpreted the results, and wrote the manuscript with contributions from MI, DA, LB, TB, and GL. All authors contributed to the manuscript and approved the submitted version.
Funding
MI, GL, DA, TB, and LB were supported by Helmholtz Association through the joint program “Changing Earth - Sustaining our Future” (PoF IV) program of the AWI. Funding by the AWI Strategy Fund Project - PalEX (DC) and by the Helmholtz Climate Initiative - REKLIM (MI) was gratefully acknowledged. We acknowledge support by the Open Access Publication Funds of Alfred-Wegener-Institute for Polar and Marine Research.
Conflict of Interest
The authors declare that the research was conducted in the absence of any commercial or financial relationships that could be construed as a potential conflict of interest.
Acknowledgments
We thank Paul Gierz for technical help in creating the spatial correlation maps. We are grateful to Paul G. Butler and others who made available their data for other studies, such as ours, to continue the research. We thank Philippe Archambault for editorial handling and our two reviewers for their expertise and constructive feedback which helped improve our manuscript. We acknowledge the use of gridded temperature and salinity data (https://www.metoffice.gov.uk/hadobs/en4/), diatom and copepod data (https://www.cprsurvey.org/), AMO index (https://climexp.knmi.nl/), and NAO index (https://climatedataguide.ucar.edu/climate-data/hurrell-north-atlantic-oscillation-nao-index-pc-based).
Supplementary Material
The Supplementary Material for this article can be found online at: https://www.frontiersin.org/articles/10.3389/fmars.2021.687318/full#supplementary-material
Footnotes
- ^ https://doi.pangaea.de/10.1594/PANGAEA.816210
- ^ https://www.metoffice.gov.uk/hadobs/en4/
- ^ https://climexp.knmi.nl/
- ^ https://climatedataguide.ucar.edu/climate-data/hurrell-north-atlantic-oscillation-nao-index-pc-based
- ^ https://www.cprsurvey.org/
References
Amador, J. A., Alfaro, E. J., Lizano, O. G., and Magaña, V. O. (2006). Atmospheric forcing of the eastern tropical Pacific: a review. Prog. Oceanogr. 69, 101–142. doi: 10.1016/j.pocean.2006.03.007
Ballesta-Artero, I., Janssen, R., van der Meer, J., and Witbaard, R. (2018). Interactive effects of temperature and food availability on the growth of Arctica islandica (Bivalvia) juveniles. Mar. Environ. Res. 133, 67–77. doi: 10.1016/j.marenvres.2017.12.004
Batten, S. D., Clark, R., Flinkman, J., Hays, G., John, E., John, A. W. G., et al. (2003). CPR sampling: the technical background, materials and methods, consistency and comparability. Prog. Oceanogr. 58, 193–215. doi: 10.1016/j.pocean.2003.08.004
Bonett, D. G., and Wright, T. A. (2000). Sample size requirements for estimating pearson, kendall and spearman correlations. Psychometrika 65, 23–28. doi: 10.1007/BF02294183
Butler, P. G., Richardson, C. A., Scourse, J. D., Wanamaker, A. D., Shammon, T. M., and Bennell, J. D. (2010). Marine climate in the Irish Sea: analysis of a 489-year marine master chronology derived from growth increments in the shell of the clam Arctica islandica. Quat. Sci. Rev. 29, 1614–1632. doi: 10.1016/j.quascirev.2009.07.010
Butler, P. G., Wanamaker, A. D., Scourse, J. D., Richardson, C. A., and Reynolds, D. J. (2013). Variability of marine climate on the North Icelandic shelf in a 1357-year proxy archive based on growth increments in the bivalve Arctica islandica. Palaeogeogr. Palaeoclimatol. Palaeoecol. 373, 141–151. doi: 10.1016/j.palaeo.2012.01.016
Czaja, A., Robertson, A. W., and Huck, T. (2003). “The role of Atlantic Ocean-atmosphere coupling in affecting North Atlantic oscillation variability,” in The North Atlantic Oscillation: Climatic Significance and Environmental Impact, eds J. W. Hurrell, Y. Kushnir, G. Ottersen, and M. Visbeck (Hoboken: Blackwell Publishing Ltd), 147–172. doi: 10.1029/134GM07
Deser, C., Alexander, M. A., Xie, S.-P., and Phillips, A. S. (2010). Sea surface temperature variability: patterns and mechanisms. Ann. Rev. Mar. Sci. 2, 115–143. doi: 10.1146/annurev-marine-120408-151453
Deser, C., and Blackmon, M. L. (1993). Surface climate variations over the North Atlantic Ocean during winter: 1900–1989. J. Clim. 6, 1743–1753. doi: 10.1175/1520-04421993006<1743:SCVOTN<2.0.CO;2
Dickson, R. R., Meincke, J., Malmberg, S.-A., and Lee, A. J. (1988). The “Great Salinity Anomaly” in the Northern North Atlantic 1968–1982. Prog. Oceanogr. 20, 103–151. doi: 10.1016/0079-6611(88)90049-3
Dima, M., and Lohmann, G. (2007). A hemispheric mechanism for the Atlantic Multidecadal Oscillation. J. Clim. 20, 2706–2719. doi: 10.1175/JCLI4174.1
Epplé, V. M., Brey, T., Witbaard, R., Kuhnert, H., and Pätzold, J. (2006). Sclerochronological records of Arctica islandica from the inner German Bight. Holocene 16, 763–769. doi: 10.1191/0959683606hl970rr
Esper, J., Cook, E., Krusic, P., Peters, K., and Schweingruber, F. (2003). Tests of the RCS method for preserving low-frequency variability in long tree-ring chronologies. Tree Ring Res. 59, 81–98.
Gastineau, G., D’Andrea, F., and Frankignoul, C. (2013). Atmospheric response to the North Atlantic Ocean variability on seasonal to decadal time scales. Clim. Dynamics 40, 2311–2330. doi: 10.1007/s00382-012-1333-0
Good, S. A., Martin, M. J., and Rayner, N. A. (2013). EN4: quality controlled ocean temperature and salinity profiles and monthly objective analyses with uncertainty estimates. J. Geophys. Res. Oceans 118, 6704–6716. doi: 10.1002/2013JC009067
Hurrell, J. W. (1995). Decadal trends in the North Atlantic Oscillation: regional temperatures and precipitation. Science 269, 676–679. doi: 10.1126/science.269.5224.676
Hurrell, J. W., and Deser, C. (2010). North Atlantic climate variability: the role of the North Atlantic Oscillation. J. Mar. Syst. 79, 231–244. doi: 10.1016/j.jmarsys.2009.11.002
Ionita, M., Scholz, P., Lohmann, G., Dima, M., and Prange, M. (2016). Linkages between atmospheric blocking, sea ice export through Fram Strait and the Atlantic Meridional Overturning Circulation. Sci. Rep. 6:32881. doi: 10.1038/srep32881
Lohmann, G., and Schöne, B. R. (2013). Climate signatures on decadal to interdecadal time scales as obtained from mollusk shells (Arctica islandica) from Iceland. Palaeogeogr. Palaeoclimatol. Palaeoecol. 373, 152–162. doi: 10.1016/j.palaeo.2012.08.006
Marali, S., and Schöne, B. R. (2015). Oceanographic control on shell growth of Arctica islandica (Bivalvia) in surface waters of Northeast Iceland — Implications for paleoclimate reconstructions. Palaeogeogr. Palaeoclimatol. Palaeoecol. 420, 138–149. doi: 10.1016/j.palaeo.2014.12.016
Mette, M. J., Wanamaker, A. D., Carroll, M. L., Ambrose, W. G., and Retelle, M. J. (2016). Linking large-scale climate variability with Arctica islandica shell growth and geochemistry in northern Norway. Limnol. Oceanogr. 61, 748–764. doi: 10.1002/lno.10252
Olivier, F., Gaillard, B., Thébault, J., Meziane, T., Tremblay, R., Dumont, D., et al. (2020). Shells of the bivalve Astarte moerchi give new evidence of a strong pelagic-benthic coupling shift occurring since the late 1970s in the North Water polynya. Philos. Trans. A Math. Phys. Eng. Sci. 378:20190353. doi: 10.1098/rsta.2019.0353
Poitevin, P., Thébault, J., Siebert, V., Donnet, S., Archambault, P., Doré, J., et al. (2019). Growth response of Arctica Islandica to North Atlantic oceanographic conditions since 1850. Front. Mar. Sci. 6:483. doi: 10.3389/fmars.2019.00483
Ran, L., Jiang, H., Knudsen, K. L., and Eiríksson, J. (2011). Diatom-based reconstruction of palaeoceanographic changes on the North Icelandic shelf during the last millennium. Palaeogeogr. Palaeoclimatol. Palaeoecol. 302, 109–119. doi: 10.1016/j.palaeo.2010.02.001
Reynolds, D. J., Hall, I. R., Slater, S. M., Mette, M. J., Wanamaker, A. D., Scourse, J. D., et al. (2018). Isolating and reconstructing key components of North Atlantic Ocean variability from a sclerochronological spatial network. Paleoceanogr. Paleoclimatol. 33, 1086–1098. doi: 10.1029/2018PA003366
Reynolds, D. J., Scourse, J. D., Halloran, P. R., Nederbragt, A. J., Wanamaker, A. D., Butler, P. G., et al. (2016). Annually resolved North Atlantic marine climate over the last millennium. Nat. Commun. 7:13502. doi: 10.1038/ncomms13502
Rueda-Roa, D. T., and Muller-Karger, F. E. (2013). The southern Caribbean upwelling system: sea surface temperature, wind forcing and chlorophyll concentration patterns. Deep Sea Res. I Oceanogr. Res. Pap. 78, 102–114. doi: 10.1016/j.dsr.2013.04.008
Savitzky, A., and Golay, M. J. E. (1964). Smoothing and differentiation of data by simplified least squares procedures. Anal. Chem. 36, 1627–1639. doi: 10.1021/ac60214a047
Schöne, B. R., Fiebig, J., Pfeiffer, M., Gleβ, R., Hickson, J., Johnson, A. L. A., et al. (2005a). Climate records from a bivalved Methuselah (Arctica islandica, Mollusca; Iceland). Palaeogeogr. Palaeoclimatol. Palaeoecol. 228, 130–148. doi: 10.1016/j.palaeo.2005.03.049
Schöne, B. R., Pfeiffer, M., Pohlmann, T., and Siegismund, F. (2005b). A seasonally resolved bottom-water temperature record for the period AD 1866-2002 based on shells of Arctica islandica (Mollusca, North Sea). Int. J. Climatol. 25, 947–962. doi: 10.1002/joc.1174
Schöne, B. R., Freyre Castro, A. D., Fiebig, J., Houk, S. D., Oschmann, W., and Kröncke, I. (2004). Sea surface water temperatures over the period 1884–1983 reconstructed from oxygen isotope ratios of a bivalve mollusk shell (Arctica islandica, southern North Sea). Palaeogeogr. Palaeoclimatol. Palaeoecol. 212, 215–232. doi: 10.1016/j.palaeo.2004.05.024
Spielhagen, R. F., Werner, K., Sørensen, S. A., Zamelczyk, K., Kandiano, E., Budeus, G., et al. (2011). Enhanced modern heat transfer to the Arctic by warm Atlantic water. Science 331, 450–453. doi: 10.1126/science.1197397
van Oldenborgh, G. J., te Raa, L. A., Dijkstra, H. A., and Philip, S. Y. (2009). Frequency- or amplitude-dependent effects of the Atlantic meridional overturning on the tropical Pacific Ocean. Ocean Sci. 5, 293–301. doi: 10.5194/os-5-293-2009
Wanamaker, A. D., Butler, P. G., Scourse, J. D., Heinemeier, J., Eiríksson, J., Knudsen, K. L., et al. (2012). Surface changes in the North Atlantic meridional overturning circulation during the last millennium. Nat. Commun. 3:899. doi: 10.1038/ncomms1901
Wanamaker, A. D., Griffin, S. M., Ummenhofer, C. C., Whitney, N. M., Black, B., Parfitt, R., et al. (2019). Pacific climate influences on ocean conditions and extreme shell growth events in the Northwestern Atlantic (Gulf of Maine). Clim. Dynamics 52, 6339–6356. doi: 10.1007/s00382-018-4513-8
Wanamaker, A. D., Heinemeier, J., Scourse, J. D., Christopher, A. R., Butler, P. G., Eiríksson, J., et al. (2008b). Very long-lived mollusks confirm 17th century AD tephra-based radiocarbon reservoir ages for north Icelandic shelf waters. Radiocarbon 50, 399–412.
Wanamaker, A. D., Kreutz, K. J., Schöne, B. R., Pettigrew, N., Borns, H. W., Introne, D. S., et al. (2008a). Coupled North Atlantic slope water forcing on Gulf of Maine temperatures over the past millennium. Clim. Dynamics 31, 183–194. doi: 10.1007/s00382-007-0344-8
Weidman, C. R., Jones, G., and Lohmann, K. C. (1994). The long-lived mollusc Arctica islandica: a new paleoceanographic tool for the reconstruction of bottom temperatures for the continental shelves of the northern North Atlantic Ocean. J. Geophys. Res. 99, 305–318. doi: 10.1029/94JC01882
Wigley, T. M. L., Briffa, K. R., and Jones, P. D. (1984). On the average value of correlated time series, with applications in dendroclimatology and hydrometeorology. J. Clim. Appl. Meteorol. 23, 201–213. doi: 10.1175/1520-04501984023<0201:OTAVOC<2.0.CO;2
Witbaard, R. (1996). Growth variations in Arctica islandica L. (Mollusca): a reflection of hydrography-related food supply. ICES J. Mar. Sci. 53, 981–987. doi: 10.1006/jmsc.1996.0122
Witbaard, R., Duineveld, G. C. A., and De Wilde, P. A. W. J. (1997). A long-term growth record derived from Arctica Islandica (Mollusca, Bivalvia) from the Fladen Ground (Northern North Sea). J. Mar. Biol. Assoc. U. K. 77, 801–816. doi: 10.1017/S0025315400036201
Witbaard, R., Duineveld, G. C. A., and de Wilde, P. A. W. J. (1999). Geographical differences in growth rates of Arctica islandica (Mollusca: Bivalvia) from the North Sea and adjacent waters. J. Mar. Biol. Assoc. U. K. 79, 907–915. doi: 10.1017/S0025315498001076
Witbaard, R., Franken, R., and Visser, B. (1998). Growth of juvenile Arctica islandica under experimental conditions. Helgoländer Meeresuntersuchungen 51, 417–431. doi: 10.1007/BF02908724
Keywords: A. islandica, North Atlantic, seasonality, growth index, temperature variability, sclerochronology
Citation: Caldarescu DE, Brey T, Abele D, Beierlein L, Lohmann G and Ionita M (2021) The Influence of Depth-Dependent Seasonal Temperature Variability on Growth Signal in Arctica islandica. Front. Mar. Sci. 8:687318. doi: 10.3389/fmars.2021.687318
Received: 29 March 2021; Accepted: 08 June 2021;
Published: 29 June 2021.
Edited by:
Philippe Archambault, Laval University, CanadaReviewed by:
Julien Thebault, Université de Bretagne Occidentale, FrancePierre Poitevin, Department of Fisheries and Oceans (Canada), Canada
Copyright © 2021 Caldarescu, Brey, Abele, Beierlein, Lohmann and Ionita. This is an open-access article distributed under the terms of the Creative Commons Attribution License (CC BY). The use, distribution or reproduction in other forums is permitted, provided the original author(s) and the copyright owner(s) are credited and that the original publication in this journal is cited, in accordance with accepted academic practice. No use, distribution or reproduction is permitted which does not comply with these terms.
*Correspondence: Diana E. Caldarescu, ZGlhbmEuY2FsZGFyZXNjdUBhd2kuZGU=