 Hung N. Dao
 Hang T. Vu
 Susan Kay
 Sevrine Sailley
- 1Geography Faculty, Hanoi National University of Education, Hanoi, Vietnam
- 2Plymouth Marine Laboratory, Plymouth, United Kingdom
Coral reefs are a natural habitat for many species, as well as being of high economic and touristic significance. However, they represent an extremely sensitive ecosystem with a narrow ecological limit: prolonged high temperatures can lead to bleaching, in which corals expel their symbiotic algae and eventually corals will degrade and die. Based on climate change projections from the Blue Communities regional model, using linear regression, exponential regression, polynomial regression, we found that by the decades 2041–2050 and 2051–2060, whether with RCP 4.5 or RCP 8.5, the environmental temperature will change beyond the coral capacity threshold. Of particular concern is RCP 8.5, where the number of weeks per decade in which SST exceeds the threshold of coral reef bleaching is up to 55, compared to 0 at the beginning of the century. As well, the El Niño phenomenon often heats up waters to abnormally high temperatures in Cu Lao Cham and, it is projected to rise even further. Consequently, the combination of climate change and El Niño will cause abnormal increases in the seawater environment beyond the coral resistance threshold, leading to degradation of this internationally important site. Decisive and practical action must be taken to deal with climate change in this part of the world.
Introduction
Coral reefs contain some of the highest levels of biodiversity among the oceans worldwide. Although they occupy less than 0.1% of the ocean floor, tropical coral reef ecosystems provide habitat for at least 25% of known marine species, with many reef species still to be discovered (Plaisance et al., 2011; Fisher et al., 2015), making it a key habitat for marine biodiversity. Furthermore, coral reefs only cover 0.1% of the seafloor because they grow in very specific environmental conditions: tropical seas with shallow warm water, but not overly warm; strong sunlight for the zooxanthellae algae’s photosynthesis; and lack of turbidity (suspended particles in water tend to absorb radiant energy impeding the coral’s filter-feeding ability, and can even bury corals, so corals are not usually found close to river mouth areas). At high nutrient levels, increased phytoplankton biomass reduces the clarity of the water, impeding the ability of the coral to filter-feed (Alan and Harold, 2011).
According to the Intergovernmental Panel on Climate Change (IPCC), climate change will lead to rising seawater temperature with serious adverse effects on coral reefs (Bindoff et al., 2019). High or largely fluctuating sea water temperatures can cause heat stress leading to expulsion of the zooxanthellae in an event known as coral bleaching; if the event is prolonged corals will degrade and die (Claar et al., 2018). The main cause of coral bleaching today is rising temperatures due to global warming. Bleached corals do not die immediately, but if the temperature is very hot, or too warm for a sustained period of time, they will die from hunger or disease. Warm-water coral reefs have declined by at least 50% over the past 30–50 years in large parts of the world’s tropical regions (Gardner et al., 2003; Bruno and Selig, 2007). Under a moderate greenhouse gas emissions scenario (RCP 4.5) it is likely that most coral reefs will disappear during the period 2040–2050 (Hoegh-Guldberg et al., 2017).
Another risk factor for coral reefs is the occurrence of the El Niño phenomenon. El Niño is an extensive ocean warming event that begins along the coast of Peru and Ecuador and extends westward over the Tropical Pacific (Ahrens, 2009). It is the result of an abnormal interaction between the ocean surface layers and the atmosphere in the tropical Pacific. El Niño varies in a cyclical manner (Lyon, 2004) with an operation cycle lasting from 2 to 7 years, sometimes more than 10 years (Alan and Harold, 2011). The average duration of an El Niño event is 11 months, and the longest is 18 months (El Niño 1982 to 1983) (Lyon, 2004). Statistics show that El Niño has sea surface temperatures (SST) that are higher on average and with increased variability. Strong and very strong El Niño can change the biogeochemical environment, reduce coral cover and cause coral bleaching on a large scale (Hueerkamp et al., 2001; Podestá and Glynn, 2001; Claar et al., 2018; Hughes et al., 2018; Lough et al., 2018).
Previous work (Cai et al., 2014) showed that in the context of climate change, El Niño is becoming stronger. Thus, climate change combined with El Niño will make the temperature regime of seawater more disadvantageous to the coral ecosystem. This study looks at the potential effects of climate change and El Niño with a focus on one vulnerable coral reef system: Cu Lao Cham – Hoi An Biosphere Reserve in Vietnam. This region has rich biodiversity value (Nguyen, 2019), along with a strong cultural identity linked to the reef and harmony between nature and people. Therefore, this site has been recognised as a biosphere reserve under the UNESCO Man and the Biosphere program. The ecosystems of the Cu Lao Cham marine protected area (MPA), including coral reefs, have high natural value (Le, 2016).
Past research on Cu Lao Cham mainly used measurements of physical conditions, however, the collection of data was done at specific times, and was short-term and intermittent. To study the impacts of temperature on the coral ecosystem in Cu Lao Cham in the current context of climate change it is vital that longer-term data and projections of future conditions are attained. Vietnam is at risk of climate change and rising sea level scenarios. However, the parameters used for these scenarios include air temperature and rainfall, but only for the mainland (Tran et al., 2016). For the marine ecosystem, we will use future projection data from the GCRF Blue Communities project.1 Thanks to this helpful source of data, research assessing the impacts of temperature on coral reef ecosystem development at Cu Lao Cham can for the first time be carried out without relying on scenarios developed for land areas.
Methodology and Data
The Study Area
Much research has been conducted on corals in Cu Lao Cham. A total of 277 species of hard coral reefs are estimated at 311.2 ha (Nguyen, 2017a). Coral reefs in Cu Lao Cham are narrowly distributed, mainly concentrated on the west and southwest coast of the big island and around most of the small islands (Figure 1). Almost all coral reefs in Cu Lao Cham are located in shallow water not exceeding 14 m (Nguyen, 2017b). One of the outstanding features in this area is that the ratio between hard and soft corals does not differ too much (hard corals account for 17.3–24.9%, soft corals account for 13.5–20.7%). Cu Lao Cham island and Hon Kho have the highest number of reef-creating hard coral species (79–80 species), followed by Vung Da Bao area (64 species), then Bai Bac, and Vung Da Den (53–57 species), while Bai Dau Tai area has the least species (15 species) (Nguyen, 2017b). The coral ecosystem in Cu Lao Cham is on the edge of serious decline due to tourism, excessive extraction of marine resources and climate change. Long-term research (Nguyen, 2017b) also showed that hard coral cover at most sites measured at Cu Lao Cham fell from 2004 to 2016. In the period 2004–2016, the coral area declined by 47%. The cover of live coral in Cu Lao Cham – Hoi An Biosphere Reserve is about 25% of the total biosphere reserve; within the reserve, coral in Vung Da Ban decreased by 91%; in Bai Bac by 78%, and in Bai Huong by 70% (Figure 1).
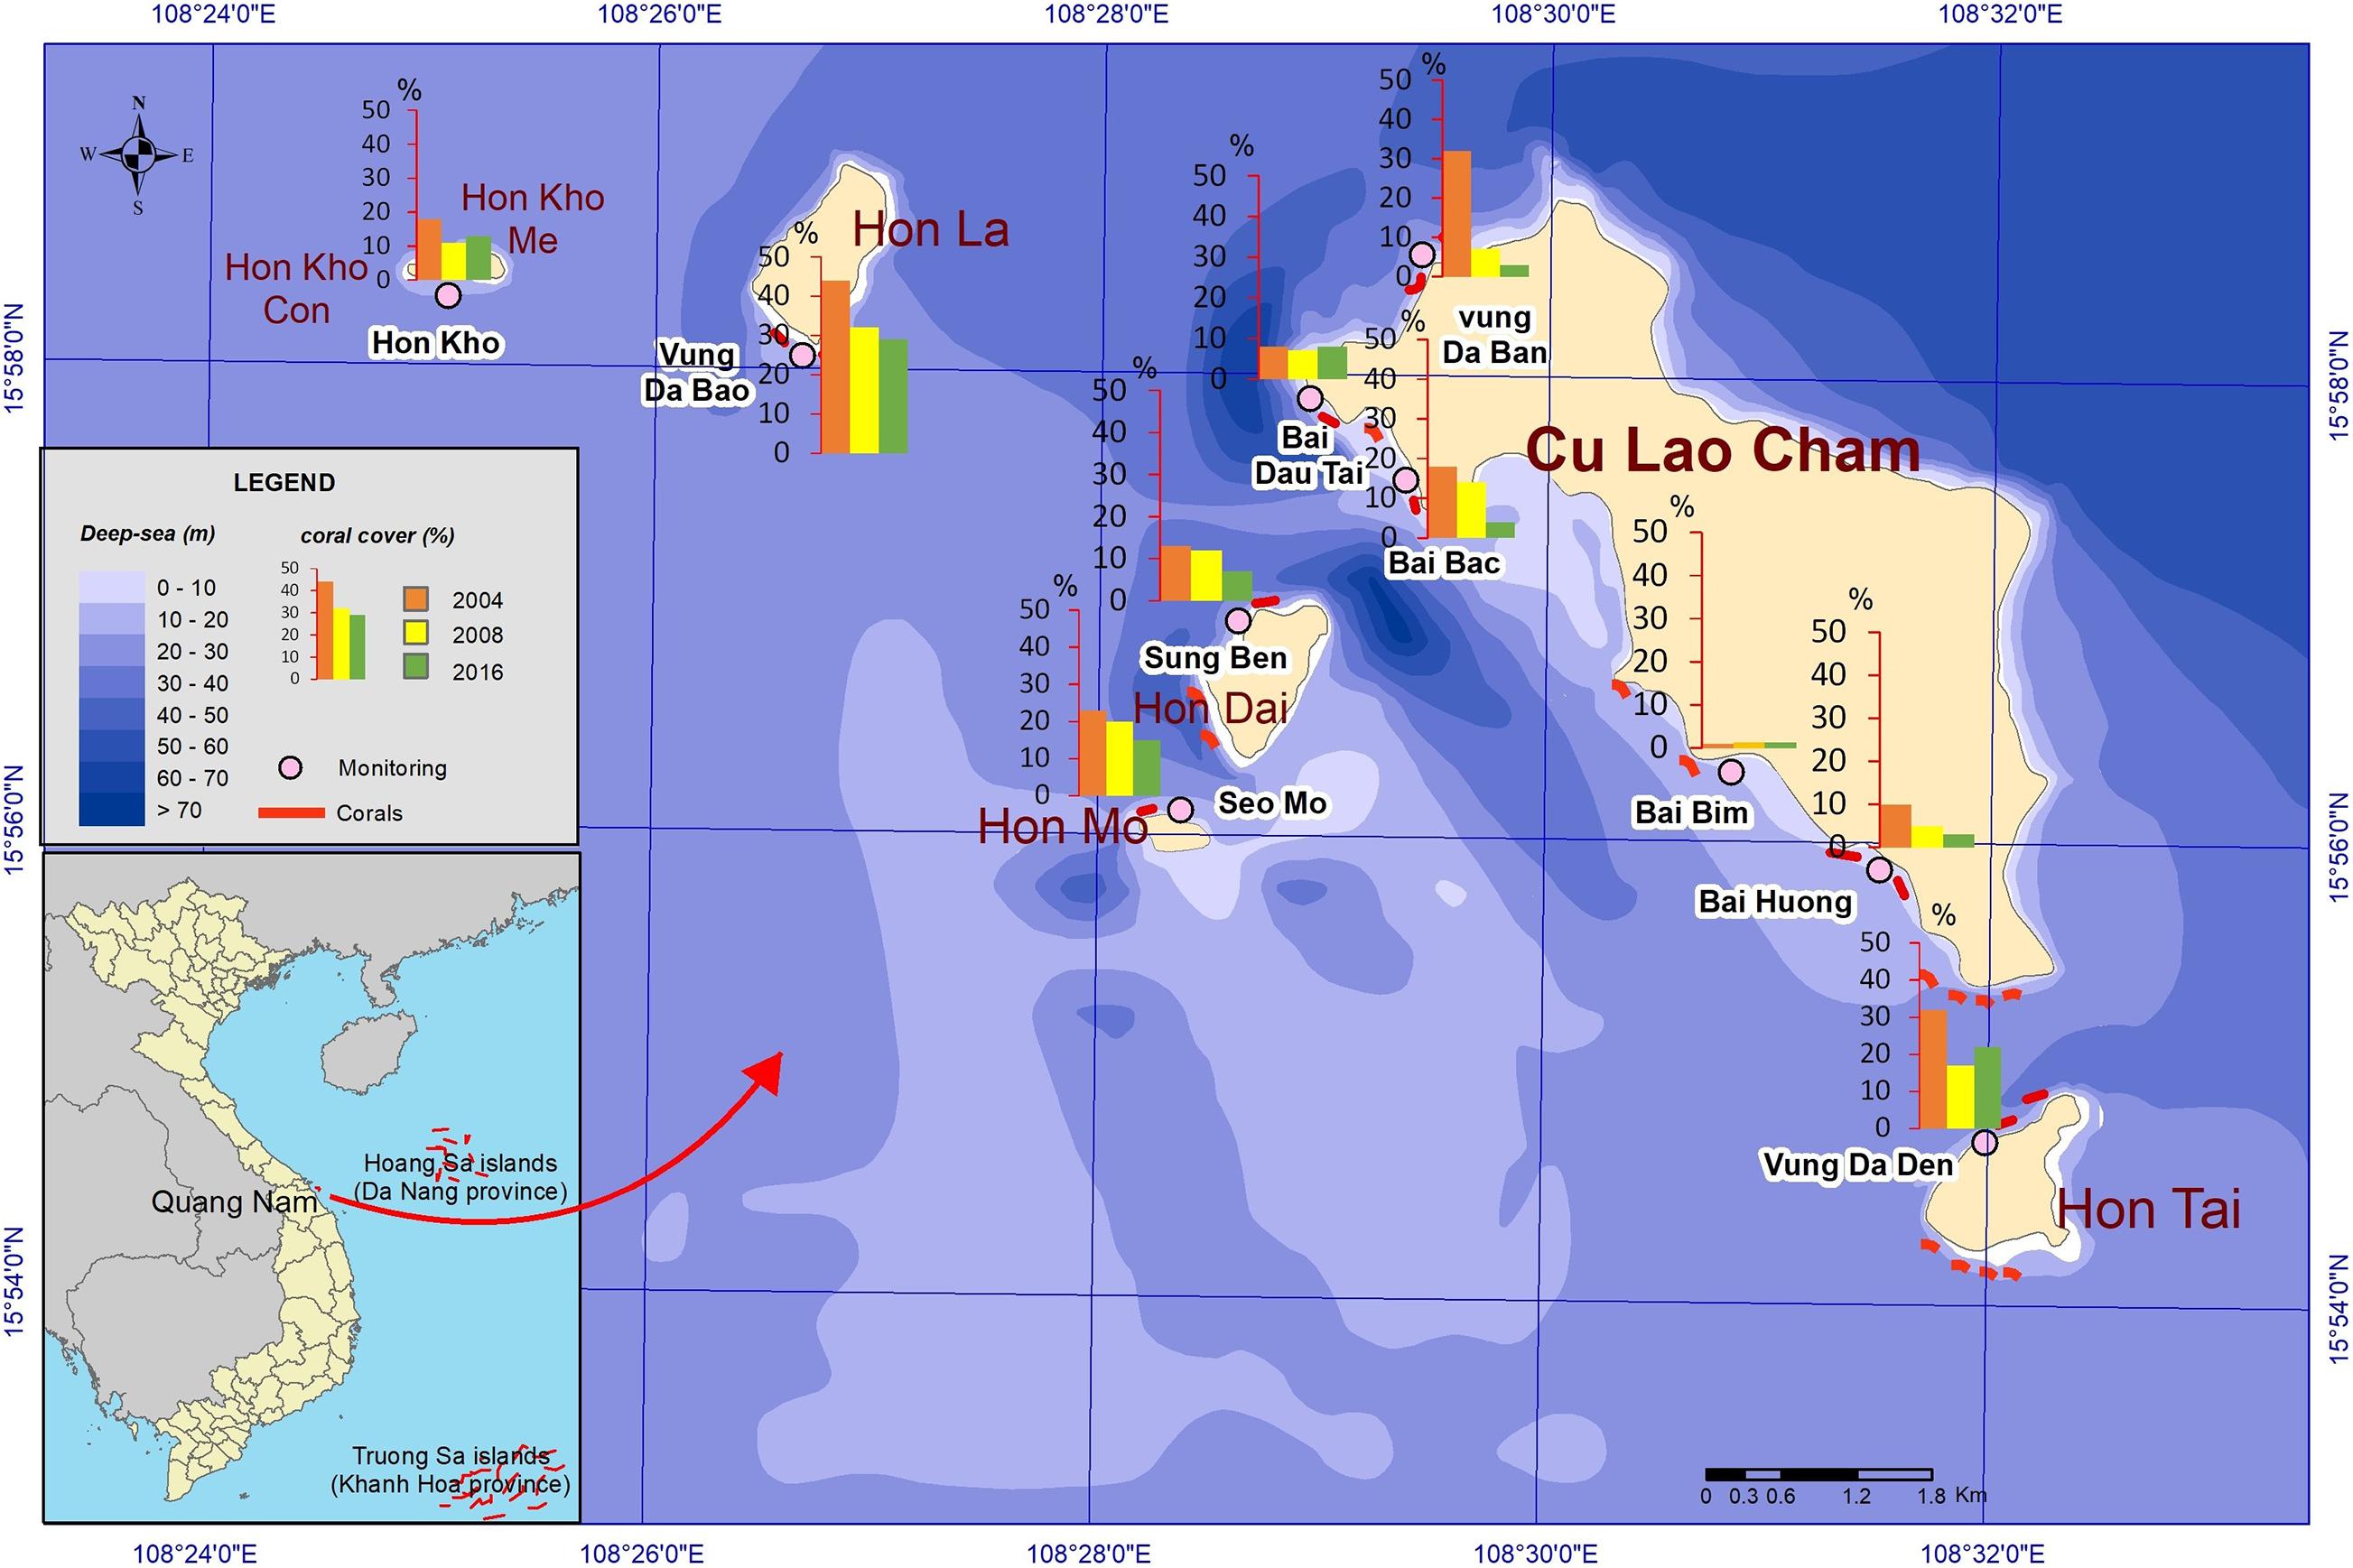
Figure 1. The fluctuation of hard coral cover at monitoring sites by the time (Source data: Nguyen Van Long, 2017, pp. 155).
El Niño Events at Cu Lao Cham
From 1950 to 2021, there were five strong and three very strong El Niño (Jan Null and CCM, 2020). Corresponding to these El Niño warm events in the Pacific, Southeast Asian Seas (SEAS) also revealed a warm state (Wang et al., 2006) and the interannual SST anomalies over the SEAS show a double−peak feature following an El Niño event in the Pacific. The first and second peaks occur around February and August, respectively, in the year following the El Niño year (Wang et al., 2006). However, in February Cu Lao Cham SST is usually affected by the winter northeast monsoon which lowers the temperature so the first peak of the SST anomaly cannot cause heat shock. Subsequently, the risk of El Niño causing heat shock for SST in Cu Lao Cham will fall around August of the following year. This warming combined with the temperature anomalies in the context of climate change can cause heat shock for coral reefs.
Coral is strongly influenced by strong or very strong El Niño events (Ampou et al., 2017). Coral bleaching took place in the Pacific Ocean in 2016 (Brainard et al., 2018). The cause of this was the El Niño of 2015–2016, which had a strong event with the Oceanic Niño Index (ONI) reaching 2.1 (Climate Prediction Center, 2020). According to research for the Vietnam region (Pham, 2014), when El Niño occurred, the SST standard error of the SEAS (including Cu Lao Cham) increased compared to the surrounding area. As a result, seawater in Cu Lao Cham was hotter than usual. According to OISST (Optimum Interpolation Sea Surface Temperature) satellite monthly seawater temperature data, the average sea surface temperature in September 2015 was 30.25°C compared to an average September temperature of 29.3°C (Physical Sciences Laboratory, 2020).
Temperature Limit
Based on previous research (Kleypas, 1997; Guan et al., 2015) we determined ecological SST limits to the coral reef as follows:
Annual SST: 21.7–29.6°C (Guan et al., 2015),
Weekly SST: 18.1–31.5°C (Kleypas, 1997; Guan et al., 2015).
In this study, we calculated the average weekly temperature (from Monday to Sunday) during the historical period 1980–2005 and the period 2005–2060 under the scenarios RCP 4.5 and RCP 8.5 (see below). The results show the number of weeks in which the SST exceeded the threshold limit of corals reefs. SST is the highest in the June to August period in Cu Lao Cham. We found 5-year-average weekly SST in June to August period and compared these to the SST limit for coral reefs.
Projections of future temperature were created using the Proudman Oceanographic Laboratory Coastal Ocean Modelling System (POLCOMS) configured for SEAS (Holt et al., 2009). POLCOMS is a three-dimensional hydrodynamic model that simulates the physical processes of energy and momentum transfer in the ocean; its outputs include temperature, salinity, and current speed. It is suitable for use in a range of water depths from deep ocean to estuaries. The model resolution was 0.1° × 0.1° (about 11 km) and there were 40 vertical levels. Climate change was imposed by applying boundary conditions from a global climate model, HadGEM2-ES (Jones et al., 2011), taken from the Coupled Model Intercomparison Project Phase 5 (Taylor et al., 2012). Surface forcing (temperature, wind, pressure, humidity and radiation) were taken from a regional-scale atmospheric model, HadGEM2-ES-RCA4. Open ocean boundary conditions (temperature, salinity and currents) were taken from the global HadGEM2-ES. The model was run for the period 1970–2098, using initial conditions taken from the World Ocean Atlas 2018 (Locarnini et al., 2013). For 2006 onwards, two different Representative Concentration Pathways (RCPs) of greenhouse gases were applied by using different outputs of HadGEM2-ES, the moderate carbon RCP 4.5, which has greenhouse gas concentration rising until mid-century and then stabilising, and the high carbon RCP 8.5, which has greenhouse gases continuing to rise throughout the 21st century (van Vuuren et al., 2011). The model was validated by comparing monthly mean SST for Cu Lao Cham, 1985–2018, to satellite-based values from the Operational Sea Surface Temperature and Ice Analysis product (OSTIA) (Good et al., 2020) downloaded from the Copernicus Marine Service.2
Model outputs for the period 1980–2060 were analysed to confirm the trend in temperature rise. Model outputs analysis also explained the number of weeks per decade calculation under each scenario, in an effort to find the number of weeks where the temperature exceeds the coral reefs’ threshold limit (31.5°).
Correlation Coefficient
The correlation coefficient between two random quantities X and Y is the mathematical expectation of the product of their standardised deviations (Taylor, 1997).
To construct a regression equation, R2 > 0.5 is acceptable.
Regression
The straight line that best matches the correlation between x and the conditional mean is called the linear regression (Taylor, 1997).
(regression)
where ;
is the outcome criterion calculated from the regression equation,
a is the slope, reflecting the reflection depending on x,
b is a free coefficient, the reflection independent on x.
In this study, an exponential regression is used to describe the relationship between SST and time; polynomial regression is applied to express the relationship between ONI and time.
Results
Model Validation
To assess how well the model outputs match observed sea surface temperatures, monthly mean model values from POLCOMS and from its parent global model, HadGEM2-ES, were plotted against satellite-based observations (Figure 2). Values for both RCP4.5 and RCP8.5 were plotted for 2006 onwards, but for this period there is no systematic difference between the two scenarios and they can be treated as two different runs of the model. The POLCOMS outputs show good agreement with the range and variability of observed temperature. At the lower end of the temperature range the model tends to overestimate the temperature, but for higher temperatures, which are the concern of this study, the bias is close to zero. HadGEM2-ES overestimates temperatures at all parts of the range and shows greater variability than the observations: this illustrates the value of using a regional model for this coastal site.
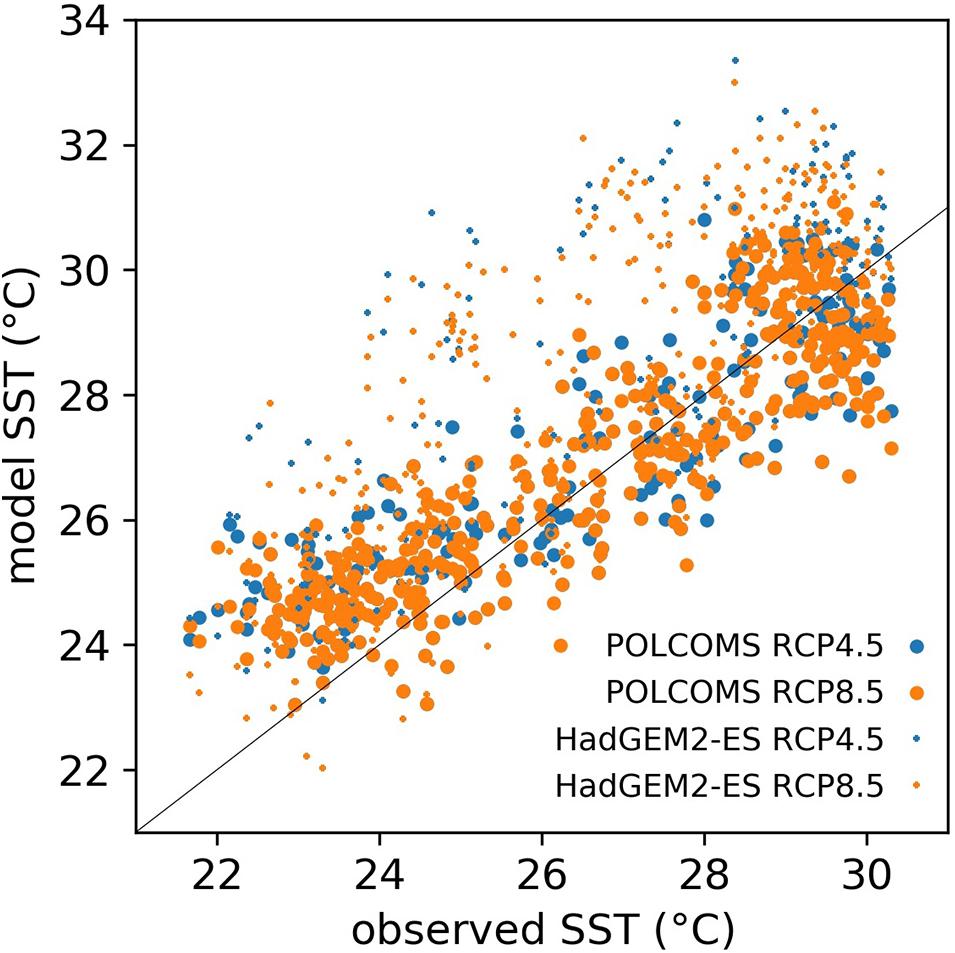
Figure 2. Scatter plot between observed SST and model SST.
Annual Fluctuation of Sea Water Temperature in the Cu Lao Cham Biosphere Reserve
Using a climatology model based on the years 1980–2005, we found that the monthly average SST reaches its highest value in June at 29.6°C and is lowest in January at 24.4°C (Figure 3). Thus, the temperature here has seasonal fluctuations, with an annual amplitude of temperature fluctuations of 5.3°C. In the years 1980–2005 the annual average SST maximum was 27.2°C and the minimum was 26.1°C (Figure 4). These values are well within the ecological limits of coral reefs (21.7–29.6°C).
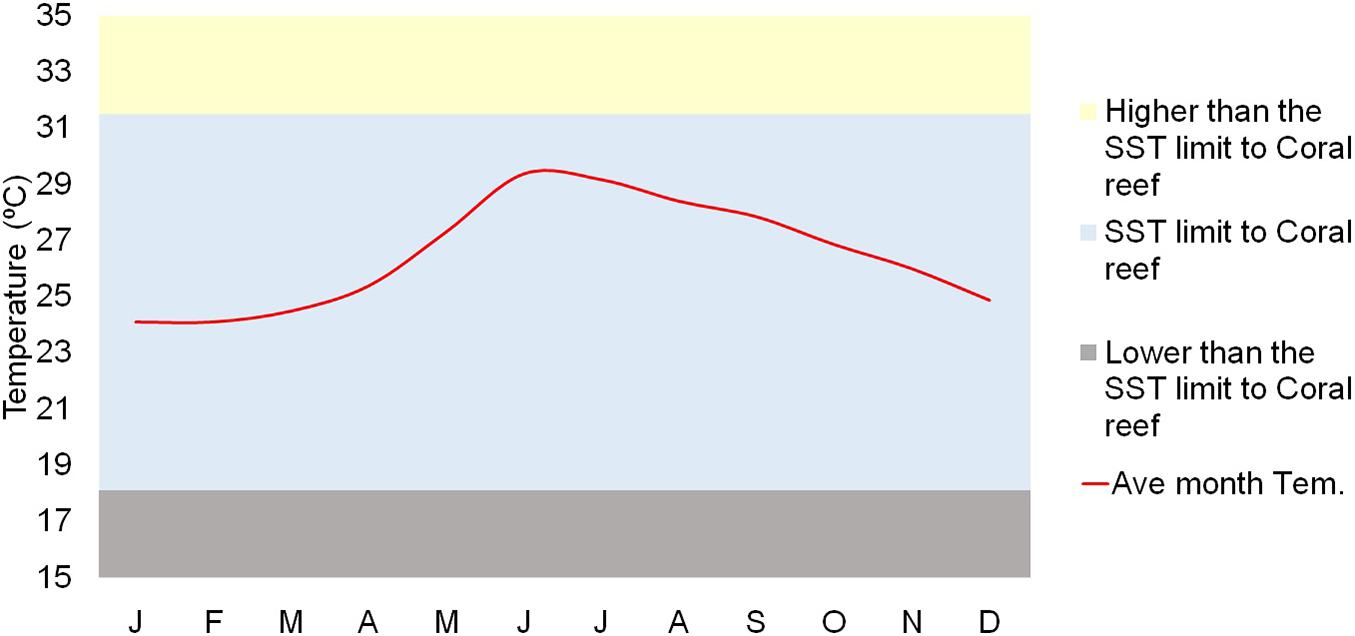
Figure 3. Monthly averages of sea surface temperature in Cu Lao Cham sea (16.0°N–108.5°E) in period 1980–2005.
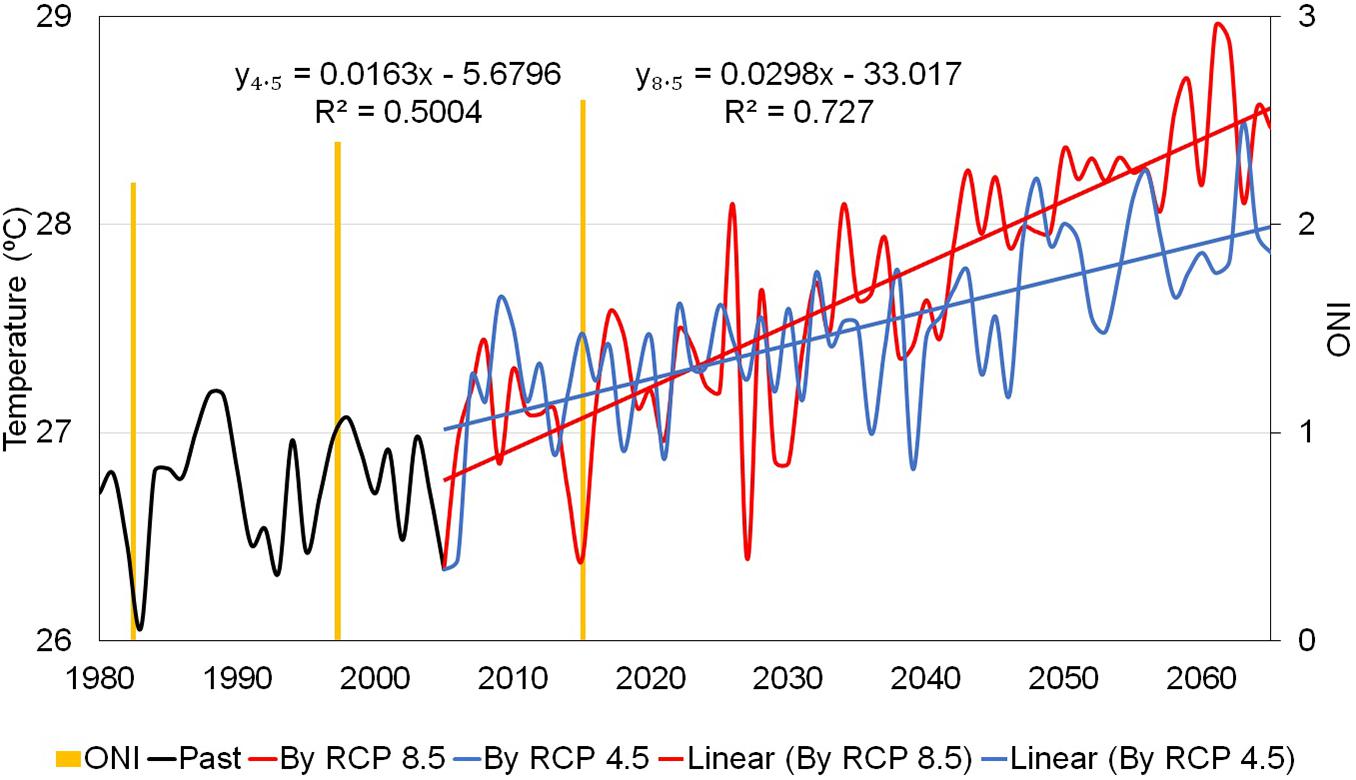
Figure 4. Modelled historic and future annual average sea surface temperature, showing a linear fit to the trend for 2005–2060 under RCP 4.5 (blue) and RCP 8.5 (red). The Oceanic Nino Index for years with strong and powerful El Nino is shown by vertical.
Assessment of Changes in SST According to the Historical Scenario
The yearly fluctuation and changing trend of SST according to the historical, RCP 4.5 and RCP 8.5 scenarios are shown in Figure 4.
According to the RCP 4.5 scenario, the linear fit for temperature rise has a coefficient of determination R2 = 0.5, indicating a reliable trend of annual increase in temperature. The results obtained from the regression equation show that the average annual seawater surface temperature increases by 1.63°C for 100 years. Under RCP 8.5, it can be seen from Figure 4 that there is a close correlation between the rise in temperature and time with R2 = 0.73, meaning that the annual increase trend in temperature is reliable. It can be observed from the regression equation that the annual seawater surface temperature will increase by 2.98°C over 100 years on average.
In conclusion, in the context of climate change it is estimated that annual SST will increase between now and 2060. Annual SST increase according to RCP 8.5 is higher than for RCP 4.5 is 0.0135°C/year.
Number of Weeks per Decade Having an Average SST Exceeding the Limits for Coral Reef Development
Figure 5 shows the number of weeks per decade where the average temperature is above the upper temperature limit of coral (31.5°C). According to the RCP 4.5 scenario, in the decades 1981–1990, 1991–2000, 2001–2020, and 2011–2020 the coral resistance threshold was not exceeded. However, the next decade (2021–2030) contained a week having temperature exceeding the coral resistance threshold. In the decades 2041–2050 and 2051–2060, there were 22 and 10 weeks, respectively, where the temperature exceeded the upper limit of coral.
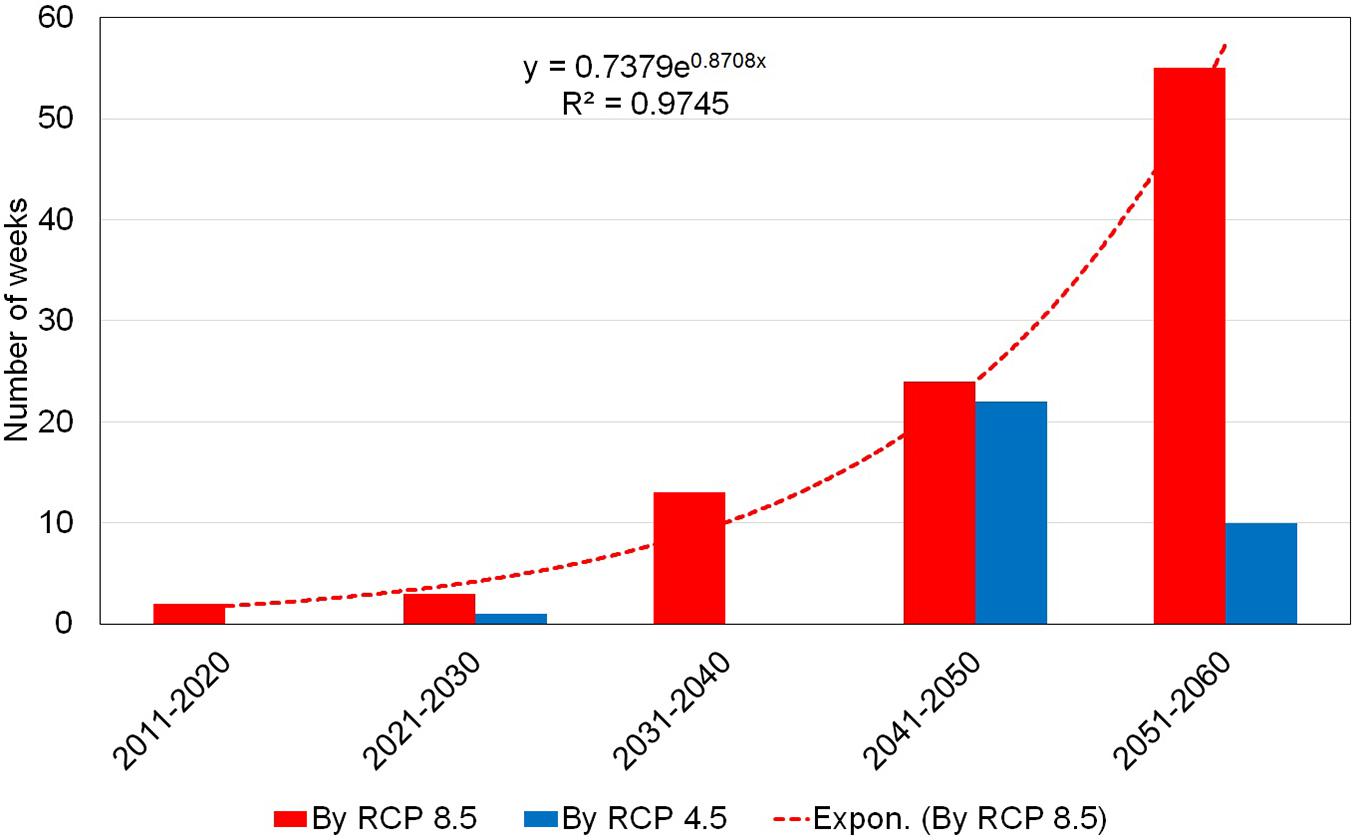
Figure 5. Number of weeks having a temperature exceeding the ecological threshold of coral-31.5°C.
According to the RCP 8.5 scenario, the number of weeks having temperatures above 31.5°C significantly increased over time. Especially in the coming decades (2031–2040, 2041–2050, and 2051–2060) the number of weeks having an average temperature exceeding the threshold increased significantly. It is worth noting here that the number of weeks having a temperature exceeding the threshold increases by the function y = 0.74e0.87x with a very high reliability level (R2 = 0.9745). In the decade 2051–2060, the number of weeks exceeding the threshold was highest, at 55.
Thus, weekly SST exceeding 31.5°C, the capacity of coral reefs, has never happened in the past but will occur regularly in the future. According to the RCP 8.5 scenario, SST in 2051–2060 will have 55 weeks exceeding the threshold, twice that of the RCP 4.5 scenario in 2041–2050. The number of weeks in which SST exceeds the temperature limitation of coral reef increases exponentially according to the RCP 8.5 scenario.
El Niño and the Warming Seawater
ONI data for 1950–2010 (Climate Prediction Center, 2020) served to identify years with strong and very strong El Niño episodes (>1.5 ONI Index value). It can be seen from 50 years of records concerning strong and very strong El Niño, a trend for strong and more very strong El Niño is evident, with average ONI increasing by years according to the equation:
where x is the year; y is ONI.
This equation was used to estimate future values for the ONI in strong El Niño years to 2060 (Figure 6 red dots). In the future, based on eq. 2, if very strong El Niños occur, the ONI value will increase as the years pass. Estimated ONI values for very strong El Niños in future years (Figure 6): by 2030, if very strong El Niños occur, the ONI value could reach 2.7; by 2050–2060 it could reach 2.8.
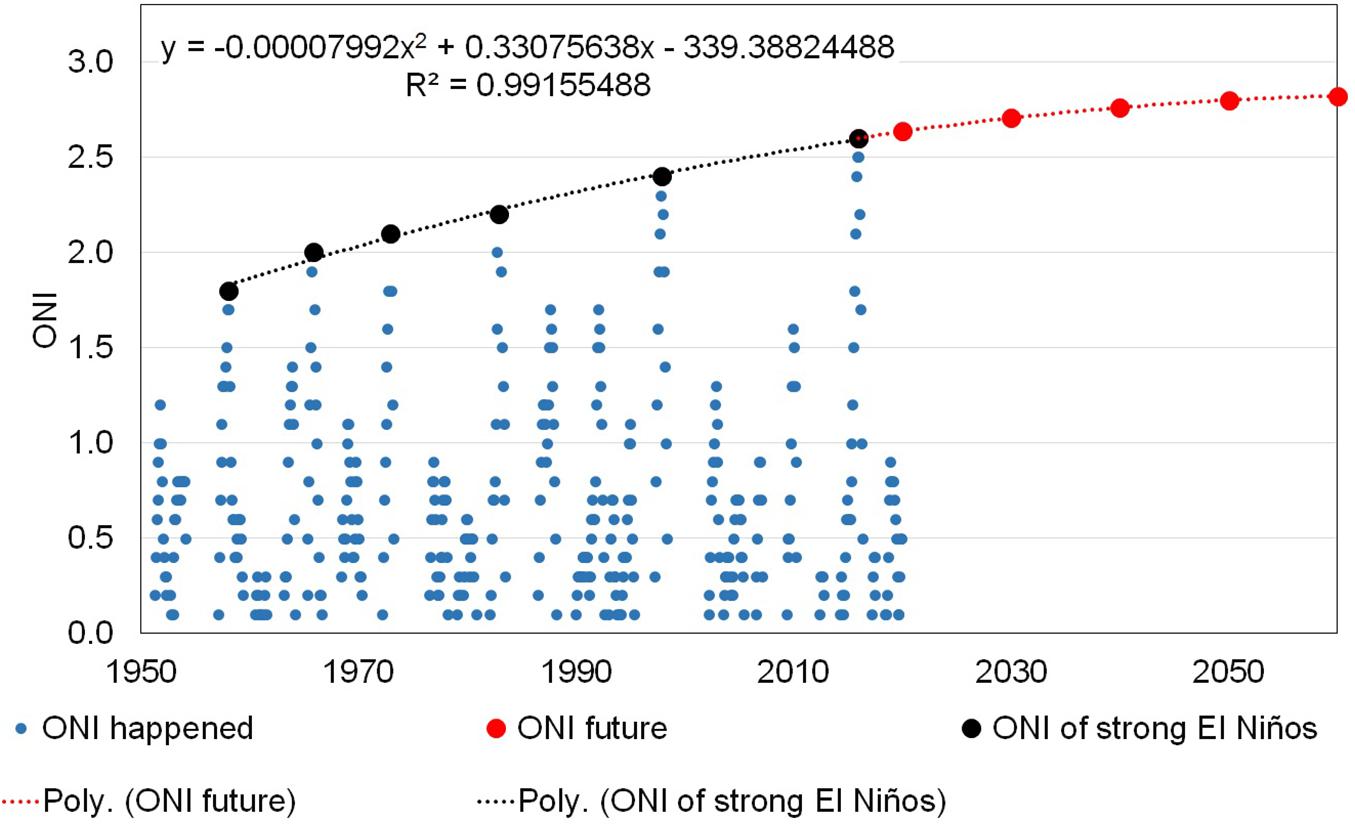
Figure 6. Oceanic Nino Index values for 1958–2020 (blue clots). Strong and powerful ElNmos (Oceanic Nino Index > 1.5) are shown with red dots. The line shows the observed trend of strong and powerful events; this is extrapolated to illustrate possible future.
So, it can be judged that in the future, the intensity of El Niño will be much stronger than what is currently happening, and the subsequent sea surface temperature anomalies will be higher. Their impact on the coral reefs will be more serious than ever before.
Increase in SST Due to the Combination of Climate Change and El Niño
As mentioned previously, the risk of El Nino causing heat shock for SST in Cu Lao Cham will fall around August. Figure 7 shows the 5 years averages of the weekly mean temperature and how these compare to the coral temperature tolerance window. As previously note the hottest months are June and July, closely followed by August. Under RCP 4.5, the number of weeks with an average SST that exceeds the upper limit of coral reef in 2020–2060 increases by 36% in June; 58% in July, and 6% in August. In the other months, there is no week that SST is higher than the threshold capacity of the coral reefs. Similar under RCP 8.5, the number of weeks with an average SST exceeding coral reef upper limit in 2020 to 2060 increases by 42% in June, 47% in July, 10% in August, and 1% in September. There are no other months that are projected to witness an increase in SST above corals’ upper limit under RCP 8.5. Consequently, the combination of high weekly average SST with El Niño is most likely to happen in July and August.
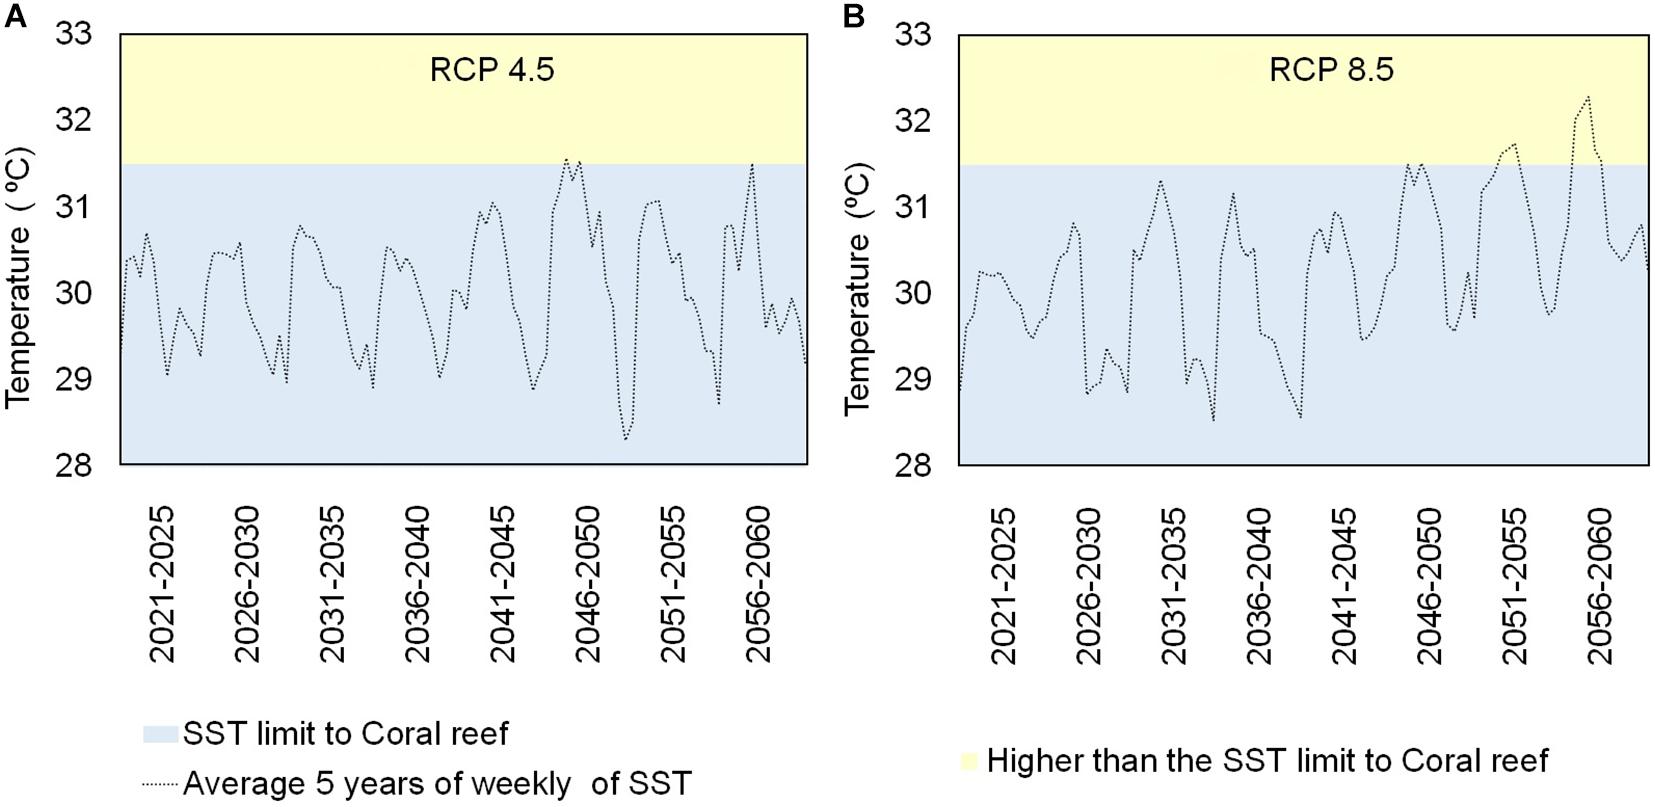
Figure 7. Variation of 5 years average of weekly sea surface temperature in June, July, and August for the period 2021–2065 in Cu Lao Cham. The blue region shows the temperature range in which coral are able to survive.
Discussion
The SEAS is a warm sea meaning that the average sea water temperature is higher than other ocean in the world (Physical Sciences Laboratory, 2021). Results of this is the number of storms is also higher compared with other places (Gray, 1968; Matsuura et al., 2003; Nguyen and Nguyen, 2004). Located in the SEAS, Cu Lao Cham experienced high SST. Therefore, SST is one of the most important factors in assessing the impact of climate change on coral in this area.
Monitoring data about coral in this area are very limited. Coral cover data is only available for 2004, 2008, and 2016, which is not sufficient for a correlation analysis. In addition, the decline of coral in this period may be caused by factors other than temperature change (tourism and excessive extraction of marine resources), and there is no method of how to extrapolate these factors into the future. Therefore, this study is based on results modelling from previous researches.
Impact of seawater temperature on coral reefs in this paper are projections of what is likely to occur which is based on the following assumptions.
Reliability of Ecological Limit
The ecological limit is 31,5°C inherited from research of Suitable environmental ranges for potential coral reef habitats in the tropical ocean (Guan et al., 2015). This limit is widely used in many other studies. For example, the Warming of Coral Reefs in the Florida Keys (Manzello, 2015), Research about coral reefs in Taiwan’s sea (belong to SEAS) (Mayfield et al., 2013).
Reliability of Model
To assess how well the model outputs match observed sea surface temperatures, monthly mean model values from POLCOMS and from its parent global model, HadGEM2-ES, were plotted against satellite-based observations (Figure 2). Values for both RCP4.5 and RCP8.5 were plotted for 2006–2018, but for this period there is no systematic difference between the two scenarios and they can be treated as two different runs of the model. The POLCOMS outputs show good agreement with the range and variability of observed temperature. At the lower end of the temperature range the model tends to overestimate the temperature, but for the higher temperatures which are the concern of this study the bias is close to zero. HadGEM2-ES overestimates temperatures at all parts of the range and shows greater variability than the observations: this illustrates the value of using a regional model for this coastal site.
Assess the Impact of El Niño
It is claimed that strong EN Nino have reduced coral cover. This study mainly inherits conclusion from other studies. Statistical results show the intensity trend of El Niño events is expected to increase. Research by Wang et al. (2006) also show that the consequences of El Niño are positive temperature anomalies in the SEAS. According to NOAA Optimum Interpolation (OI) finds that the SST in the SEAS and Cu Lao Cham sea during the El Nino periods is higher than in other areas. In conclusion, El Niño will increase the temperature in Cu Lao Cham sea.
Although exposure to high water temperatures can be fatal to coral growth, this study is unique in that it assessed the future effects of two thermal stresses: global warming and El Niño.
Conclusion
Climate change has happened throughout the history of the Earth. The evidence found in isotope signatures in fossils shows that Scleractin corals were symbiotic with Symbiodinium for more than 240 million years, most of which could control diverse ecosystems, and functioning in ways that are not too different from today (Muscatine et al., 2005). So, it can be based on the ecological limits given by Kleypas and Guan (Kleypas, 1997; Guan et al., 2015) for assessing the environmental impact on the coral reef for the present and the future.
Our findings highlight that under either RCP scenarios there is a risk of experiencing a decline in coral reefs in Cu Lao Cham, which is especially true for the 2040 and 2050 decades. Beyond the overall increase in temperature there is an increase in how often these temperatures will exceed the temperature preference of coral. This is more pronounced under RCP 8.5, with up to 55 weeks per decade where the temperature is projected to exceed the coral threshold. In addition to the rise in temperature, El Niño strength is projected to increase in the future, and we found that the effect of El Niño is generally impacting the area in August, extending the period of potentially too high temperature from June-July (the two hottest months of the year in the historical period) by one month. The combination of the increase in temperature potentially followed by an El Niño – a stronger and longer El Niño event than at present – would result in a prolonged period of extreme temperature from which the coral reefs of Cu Lao Cham will very likely not recover.
The findings reported here are clear, but they are based on projections made using a single global climate model, downscaled using a single regional model. This initial work needs to be repeated using a range of climate models to: firstly, give greater confidence in the findings; and secondly, make it possible to estimate the uncertainty in the risk of future high-temperature events. Given the coastal location of Cu Lao Cham, regional-scale projections are more appropriate than global models and more regional marine modelling studies are needed to expand on this work. Our research on El Niño was based on extrapolation from multi-decade observations; as the representation of El Niño in climate models improves it will be become possible to base this aspect of the work on models as well.
The combination of weeks having heat shock in the future and El Niño means that the survival of coral reefs in Cu Lao Cham is indeed at great risk. Hopefully, the findings of this research will have practical implications, helping environmental management agencies by providing valid sources of data what will greatly help the biosphere reserve’s conservation.
Data Availability Statement
The original contributions presented in the study are included in the article/supplementary material, further inquiries can be directed to the corresponding author.
Author Contributions
HD: conceptualisation, methodology, and writing – original draft. HD: visualisation. SK: writing – review and editing. SS: writing – review and editing and data curation. All authors contributed to the article and approved the submitted version.
Funding
This work have received funding in part from the Global Challenges Research Fund (GCRF) via its partner UK Research and Innovation (UKRI) under grant agreement reference NE/P021107/1 to the Blue Communities project.
Conflict of Interest
The authors declare that the research was conducted in the absence of any commercial or financial relationships that could be construed as a potential conflict of interest.
Publisher’s Note
All claims expressed in this article are solely those of the authors and do not necessarily represent those of their affiliated organizations, or those of the publisher, the editors and the reviewers. Any product that may be evaluated in this article, or claim that may be made by its manufacturer, is not guaranteed or endorsed by the publisher.
Acknowledgments
For the data from HadGEM2-ES and HadGEM2-ES_RCA4, we acknowledge the World Climate Research Programme’s Working Group on Regional Climate, and the Working Group on Coupled Modelling, former coordinating body of CORDEX and responsible panel for CMIP5. We also thank the climate modelling groups Met Office Hadley Centre and Swedish Meteorological and Hydrological Institute, Rossby Centre, for producing and making available their model output. We also acknowledge the Earth System Grid Federation infrastructure which is an international effort led by the United States Department of Energy’s Program for Climate Model Diagnosis and Intercomparison, the European Network for Earth System Modelling and other partners in the Global Organisation for Earth System Science Portals (GO-ESSP).
Footnotes
References
Ahrens, C. D. (2009). El Niño and the Southern Oscillation,” in Meteorology Today, 9th Edn. Seattle: Brooks/Cole, 276–280.
Alan, P. T., and Harold, V. T. (2011). Coral Reefs and Nutrient Levels,” in Essentials of Oceanography. Hoboken, NY: Prentice Hall, 455.
Ampou, E. E., Johan, O., Menkès, C. E., Niño, F., Birol, F., Ouillon, S., et al. (2017). Coral Mortality Induced by the 2015–2016 El-Niño in Indonesia: the Effect of Rapid Sea Level Fall. Bengaluru, KA: HAL. doi: 10.5194/bg-2016-375
Bindoff, N., Cheung, W. W., Kairo, J., Arstegui, J., Guinder, V., Hallberg, R., et al. (2019). “Chapter 5: changing ocean, marine ecosystems, and dependent communities,” in IPCC Special Report on the Oocean and Cryosphere in a Changing Climate, eds H. O. Pörtner, D. C. Roberts, V. Masson-Delmotte, and P. Zhai.
Brainard, R. E., Oliver, T., McPhaden, M. J., Cohen, A., Venegas, R., Heenan, A., et al. (2018). Ecological impacts of the 2015/16 El Niño in the central equatorial Pacific. Bull. Am. Meteorol. Soc. 99, S21–S26. doi: 10.1175/BAMS-D-17-0128.1
Bruno, J. F., and Selig, E. R. (2007). Regional decline of coral cover in the Indo-Pacific: timing, extent, and subregional comparisons. PLoS One 2:e711. doi: 10.1371/journal.pone.0000711
Cai, W., Borlace, S., Lengaigne, M., Van Rensch, P., Collins, M., Vecchi, G., et al. (2014). Increasing frequency of extreme El Niño events due to greenhouse warming. Nat. Clim. Change 4, 111–116. doi: 10.1038/NCLIMATE2100
Claar, D. C., Szostek, L., McDevitt-Irwin, J. M., Schanze, J. J., and Baum, J. K. (2018). Global patterns and impacts of El Niño events on coral reefs: A meta-analysis. PLoS One 13:e0190957. doi: 10.1371/journal.pone.0190957
Climate Prediction Center (2020). Cold & Warm Episodes by Season. NOAA/National Weather Service. Available online at: https://origin.cpc.ncep.noaa.gov/products/analysis_monitoring/ensostuff/ONI_v5.php (accessed October 7, 2020).
Fisher, R., O’Leary, R. A., Low-Choy, S., Mengersen, K., Knowlton, N., Brainard, R. E., et al. (2015). Species richness on coral reefs and the pursuit of convergent global estimates. Curr. Biol. 25, 500–505. doi: 10.1016/j.cub.2014.12.022
Gardner, T. A., Côté, I. M., Gill, J. A., Grant, A., and Watkinson, A. R. (2003). Long-term region-wide declines in Caribbean corals. Science 301, 958–960. doi: 10.1126/science.1086050
Good, S., Fiedler, E., Mao, C., Martin, M. J., Maycock, A., Reid, R., et al. (2020). The current configuration of the OSTIA system for operational production of foundation sea surface temperature and ice concentration analyses. Remote Sensing 12:720. doi: 10.3390/rs12040720
Gray, W. M. (1968). Global view of the origin of tropical disturbances and storms. Monthly Weather Rev. 96, 669–700. doi: 10.1175/1520-0493(1968)096<0669:gvotoo>2.0.co;2
Guan, Y., Hohn, S., and Merico, A. (2015). Suitable environmental ranges for potential coral reef habitats in the tropical ocean. PLoS One 10:e0128831. doi: 10.1371/journal.pone.0128831
Hoegh-Guldberg, O., Poloczanska, E. S., Skirving, W., and Dove, S. (2017). Coral reef ecosystems under climate change and ocean acidification. Front. Mari. Sci. 4:158. doi: 10.3389/fmars.2017.00158
Holt, J., Harle, J., Proctor, R., Michel, S., Ashworth, M., Batstone, C., et al. (2009). Modelling the global coastal ocean. philosophical transactions. Series A Mathem. Phys. Eng. Sci. 367, 939–951. doi: 10.1098/rsta.2008.0210
Hueerkamp, C., Glynn, P. W., D’Croz, L., Maté, J. L., and Colley, S. B. (2001). Bleaching and recovery of five eastern pacific corals in an El Niño-related temperature experiment. Bull. Mari. Sci. 69, 215–236.
Hughes, T. P., Anderson, K. D., Connolly, S. R., Heron, S. F., Kerry, J. T., Lough, J. M., et al. (2018). Spatial and temporal patterns of mass bleaching of corals in the Anthropocene. Science 359, 80–83. doi: 10.1126/science.aan8048
Jan Null, and CCM. (2020). El Niño and La Niña Years and Intensities, Based on Oceanic Niño Index (ONI). Golden Gate Weather Services. Available online at: https://ggweather.com/enso/oni.htm (accessed October 7, 2020).
Jones, C. D., Hughes, J. K., Bellouin, N., Hardiman, S. C., Jones, G. S., Knight, J., et al. (2011). The HadGEM2-ES implementation of CMIP5 centennial simulations. Geosci. Model Dev. 4, 543–570. doi: 10.5194/gmd-4-543-2011
Kleypas, J. A. (1997). Modeled estimates of global reef habitat and carbonate production since the last glacial maximum (Kleypas, 1997). Paleoceanography 12, 533–545. doi: 10.1029/97PA01134
Kleypas, J. A. (1997). Modeled estimates of global reef habitat and carbonate production since the last glacial maximum. Paleoceanography 12, 533–545. doi: 10.1029/97pa01134
Le, N. T. (2016). Cu Lao Cham – Hoi An Biosphere Reserve. Viet Nam MAB. Available online at: http://mabvietnam.net/khu-du-tru-sinh-quyen-the-gioi-cu-lao-cham-hoi-an (accessed October 7, 2020)
Locarnini, R. A., Mishonov, A. V., Antonov, J. I., Boyer, T. P., Garcia, H. E., Baranova, O. K., et al. (2013). World Ocean Atlas 2013. Temperature. NOAA Atlas NESDIS. MaryLand: National Environmental Satellite, Data and Information Service.
Lough, J. M., Anderson, K. D., and Hughes, T. P. (2018). Increasing thermal stress for tropical coral reefs: 1871–2017. Sci. Rep. 8, 1–8. doi: 10.1038/s41598-018-24530-9
Lyon, B. (2004). The strength of El Niño and the spatial extent of tropical drought. Adv. Earth Space Sci. 31, 1–4. doi: 10.1029/2004GL020901
Manzello, D. P. (2015). Rapid recent warming of coral reefs in the florida keys. Sci. Rep. 5:16762. doi: 10.1038/srep16762
Matsuura, T., Yumoto, M., and Iizuka, S. (2003). A mechanism of interdecadal variability of tropical cyclone activity over the western North Pacific. Clim. Dyn. 21, 105–117. doi: 10.1007/s00382-003-0327-3
Mayfield, A. B., Chen, M.-N., Meng, P.-J., Lin, H.-J., Chen, C.-S., and Liu, P.-J. (2013). The physiological response of the reef coral Pocillopora damicornis to elevated temperature: results from coral reef mesocosm experiments in Southern Taiwan. Mari. Environ. Res. 86, 1–11. doi: 10.1016/j.marenvres.2013.01.004
Muscatine, L., Goiran, C., Land, L., Jaubert, J., Cuif, J.-P., and Allemand, D. (2005). “Stable isotopes (δ13C and δ15N) of organic matrix from coral skeleton,” in Proceedings of the National Academy of Sciences, 1525–1530. doi: 10.1073/pnas.0408921102
Nguyen, D. N., and Nguyen, T. H. (2004). Climate and Climate Resources in Vietnam. Hanoi: Agriculture Publisher.
Nguyen, T. T. V. (2017a). Fish resources in ecosystems in coastal areas of Quang Nam-Da Nang. Ph. D, Philosophy in Biology. Viet Nam Academy of Science and Technology.
Nguyen, V. H. (2019). Tourism and poverty: perspectives and experiences of local residents in Cu Lao Cham MPA, Vietnam. Tourism Mari. Environ. 14, 179–197. doi: 10.3727/154427319x15631036242632
Nguyen, V. L. (2017b). Investigating and Proposing Solutions for Management and Sustainable use of Biodiversity Resources in the Cu Lao Cham - Hoi An Biosphere Reserve.” Hoi An: Management of World Biosphere reserve of Cu Lao Cham- Hoi An. Nha Trang: Institute of Oceanography, Vietnam Academy of Science & Technology. doi: 10.3727/154427319x15631036242632
Pham, D. T. (2014). The regime of sea surface temperature in the ENSO regions, the territory of Vietnam and the Southeast Asian Seas in the period of development of ENSO in the context of climate change. Vietnam J. Hydrometeor. 646, 29–34.
Physical Sciences Laboratory. (2020). NOAA Optimum Interpolation (OI) Sea Surface Temperature (SST) V2. NOAA. Available online at: https://psl.noaa.gov/data/gridded/data.noaa.oisst.v2.html (accessed October 7, 2020).
Physical Sciences Laboratory (2021). NOAA Extended Reconstructed Sea Surface Temperature (SST) V5. 325 Broadway Boulder, CO 80305-3328. NOAA. Available online at: https://psl.noaa.gov/data/gridded/data.noaa.ersst.v5.html (accessed June 14, 2021).
Plaisance, L., Caley, M. J., Brainard, R. E., and Knowlton, N. (2011). The diversity of coral reefs: what are we missing? PLoS One 6:e25026. doi: 10.1371/journal.pone.0025026
Podestá, G. P., and Glynn, P. W. (2001). The 1997–98 El nino event in panama and galapagos: an update of thermal stress indices relative to coral bleaching. Bull. Mari. Sci. 69, 43–59.
Taylor, J. (1997). Introduction to Error Analysis, the Study of Uncertainties in Physical Measurements. 648 Broadway, Suite 902. New York, NY: University Science Books.
Taylor, K. E., Stouffer, R. J., and Meehl, G. A. (2012). An overview of CMIP5 and the experiment design. J. Bull. Am. Meteorol. Soc. 93, 485–498. doi: 10.1175/bams-d-11-00094.1
Tran, T., Nguyen, V. T., Huynh, T. L. H., Mai, V. K., Nguyen, X. H., and Doan, H. P. (2016). Climate Change and Sea Level Rises Scenario for Vietnam. Ha Noi: Ministry of Natural Resources and Environment Publishing House. Available online at: http://www.imh.ac.vn/files/doc/KichbanBDKH/KBBDKH_2016.pdf [accessed October 7, 2020)
van Vuuren, D. P., Edmonds, J., Kainuma, M., Riahi, K., Thomson, A., Hibbard, K., et al. (2011). The representative concentration pathways: an overview. Clim. Change 109:5. doi: 10.1007/s10584-011-0148-z
Keywords: biosphere reserve, climate change, El Niño, heat shock, coral reefs, Southeast Asian Seas
Citation: Dao HN, Vu HT, Kay S and Sailley S (2021) Impact of Seawater Temperature on Coral Reefs in the Context of Climate Change. A Case Study of Cu Lao Cham – Hoi An Biosphere Reserve. Front. Mar. Sci. 8:704682. doi: 10.3389/fmars.2021.704682
Received: 03 May 2021; Accepted: 13 July 2021;
Published: 09 August 2021.
Edited by:
Anastazia T. Banaszak, National Autonomous University of Mexico, MexicoReviewed by:
Hiroya Abe, National Institute for Environmental Studies (NIES), JapanPi-Jen Liu, National Dong Hwa University, Taiwan
Copyright © 2021 Dao, Vu, Kay and Sailley. This is an open-access article distributed under the terms of the Creative Commons Attribution License (CC BY). The use, distribution or reproduction in other forums is permitted, provided the original author(s) and the copyright owner(s) are credited and that the original publication in this journal is cited, in accordance with accepted academic practice. No use, distribution or reproduction is permitted which does not comply with these terms.
*Correspondence: Hung N. Dao, ZGFvbmdvY2h1bmc2OUBnbWFpbC5jb20=