 Gerd Krahmann1*
 Damian L. Arévalo-Martínez1
 Andrew W. Dale1
 Marcus Dengler1
 Anja Engel1
 Nicolaas Glock1,2
 Patricia Grasse1,3
 Johannes Hahn1,4
 Helena Hauss1
 Mark J. Hopwood1
 Rainer Kiko1,5
 Alexandra N. Loginova1,6
 Carolin R. Löscher7
 Marie Maßmig1
 Alexandra-Sophie Roy8
 Renato Salvatteci9,10
 Stefan Sommer1
 Toste Tanhua1
 Hela Mehrtens1
- 1GEOMAR, Helmholtz Centre for Ocean Research Kiel, Kiel, Germany
- 2Institute for Geology, Department of Earth Science, University of Hamburg, Hamburg, Germany
- 3German Centre for Integrative Biodiversity Research (iDiv) Halle-Jena-Leipzig, Leipzig, Germany
- 4Federal Maritime and Hydrographic Agency, Hamburg, Germany
- 5Laboratoire d‘Océanographie de Villefranche-sur-Mer, Villefranche-sur-Mer, France
- 6Institute of Oceanology Polish Academy of Sciences, Sopot, Poland
- 7Nordcee, Department of Biology and DIAS, University of Southern Denmark, Odense, Denmark
- 8Genomic Microbiology, Institute of Microbiology, Kiel University, Kiel, Germany
- 9Institute of Geosciences, Kiel University, Kiel, Germany
- 10Center for Ocean and Society, Kiel University, Kiel, Germany
From 2008 to 2019, a comprehensive research project, ‘SFB 754, Climate – Biogeochemistry Interactions in the Tropical Ocean,’ was funded by the German Research Foundation to investigate the climate-biogeochemistry interactions in the tropical ocean with a particular emphasis on the processes determining the oxygen distribution. During three 4-year long funding phases, a consortium of more than 150 scientists conducted or participated in 34 major research cruises and collected a wealth of physical, biological, chemical, and meteorological data. A common data policy agreed upon at the initiation of the project provided the basis for the open publication of all data. Here we provide an inventory of this unique data set and briefly summarize the various data acquisition and processing methods used.
Introduction
The distribution of oxygen in the ocean interior is controlled by an intimate interplay of physics and biogeochemistry. Circulation and mixing transport oxygen from the near-surface, where it is produced by photosynthesis and exchanged with the atmosphere, into the ocean interior. Oxygen consumption occurs throughout the ocean and is essentially driven by bacterial respiration of organic matter. Both the supply and consumption of oxygen are sensitive to climate change in ways that are not fully understood. A central objective of the Collaborative Research Center 754 (Sonderforschungsbereich ‘SFB 754, Climate – Biogeochemistry Interactions in the Tropical Ocean’) was to better understand the observed changes in ocean oxygen distribution (see Figure 1) and thoroughly investigate the climate-biogeochemistry system in the tropical Atlantic and Pacific Oceans. The program was financed from 2008 through 2019 by the German Research Foundation (DFG).
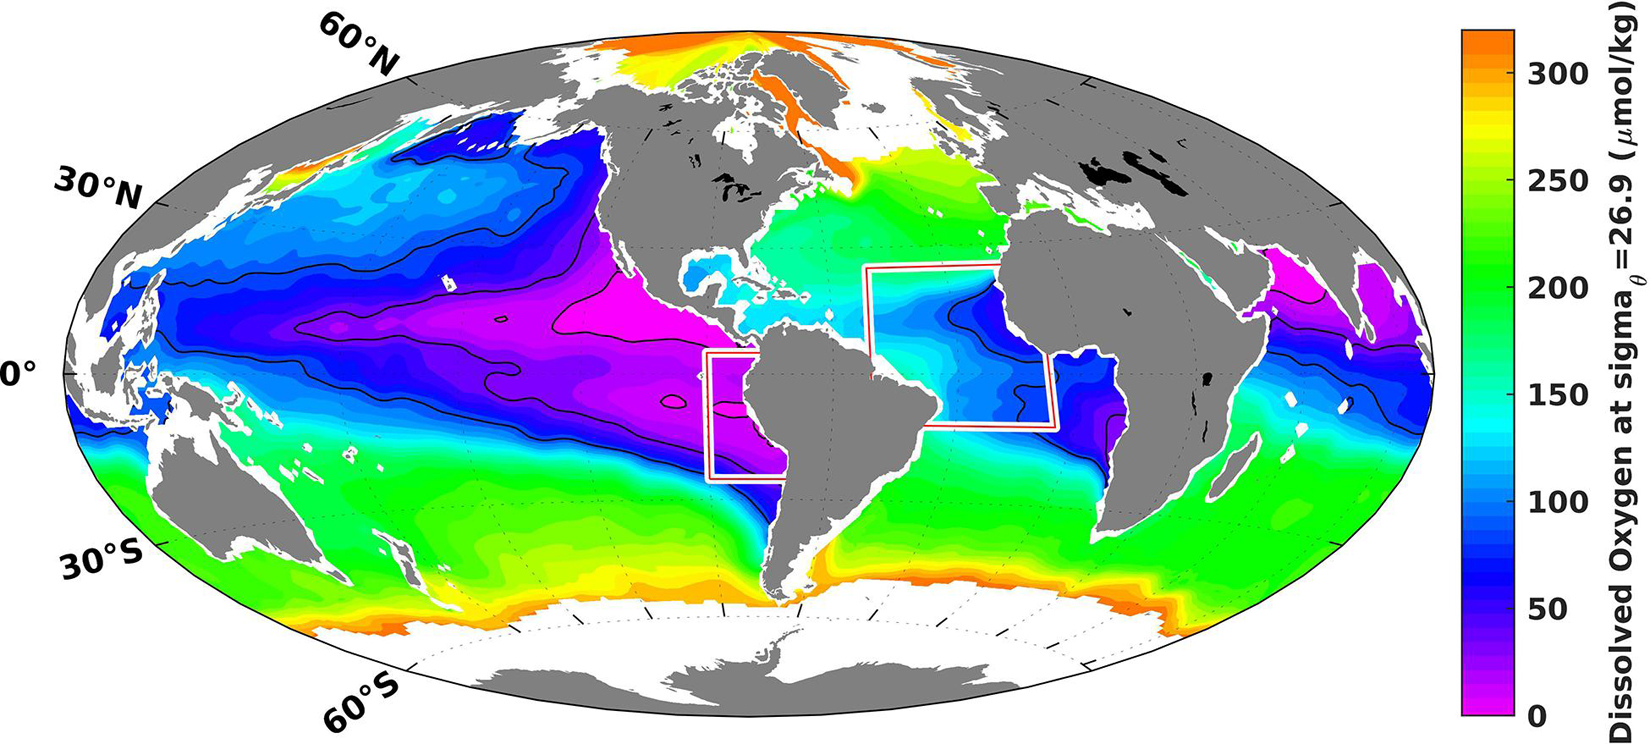
Figure 1. The two working areas of the SFB 754 overlaid on the climatological content of dissolved oxygen on the potential density surface sigmaθ 26.9 (between 200 and 500 m depth in tropical regions). The map is based on data from the World Ocean Atlas 2018 (Garcia et al., 2018).
Addressing the SFB 754 goals required a highly multi-disciplinary approach. The SFB 754 built upon the wide-ranging marine expertise available at the GEOMAR Helmholtz Centre for Ocean Research Kiel and Kiel University, both in Kiel, Germany. Biological, chemical, and physical oceanography, sediment biogeochemistry, marine ecology, molecular microbiology, paleoceanography, geology, as well as climate and biogeochemical modeling all contributed to the project. The SFB 754 was organized in 18 highly interdisciplinary science sub-projects striving to answer the key questions of the project. An outreach sub-project complemented the scientific sub-projects with programs for pupils and the general public. A dedicated central data management team was hosted by the GEOMAR data management and supported and supervised the curation and publication of all data collected by the SFB 754. To date 799 peer-reviewed scientific papers, theses, presentations, and other publications have been generated by the members of the SFB 7541. In many of these publications observational data sets are fully described, assessed, used, and originally published. The aim of this article is to summarize and list these published observational data sets collected by the SFB 754 all together in a clear structured way for easier access and find-ability.
Observational and Experimental Program
During the 12-year life-cycle the SFB 754 conducted or participated in a total of 34 research cruises on large research vessels (see Table 1 and Figures 2–7). Data from these cruises constitute the bulk of the SFB 754 archive. The three 4-year long phases allowed for the development and adaptation of the observational and experimental program. Questions arising from the data already collected were incorporated into new sub-projects for the subsequent project phases.
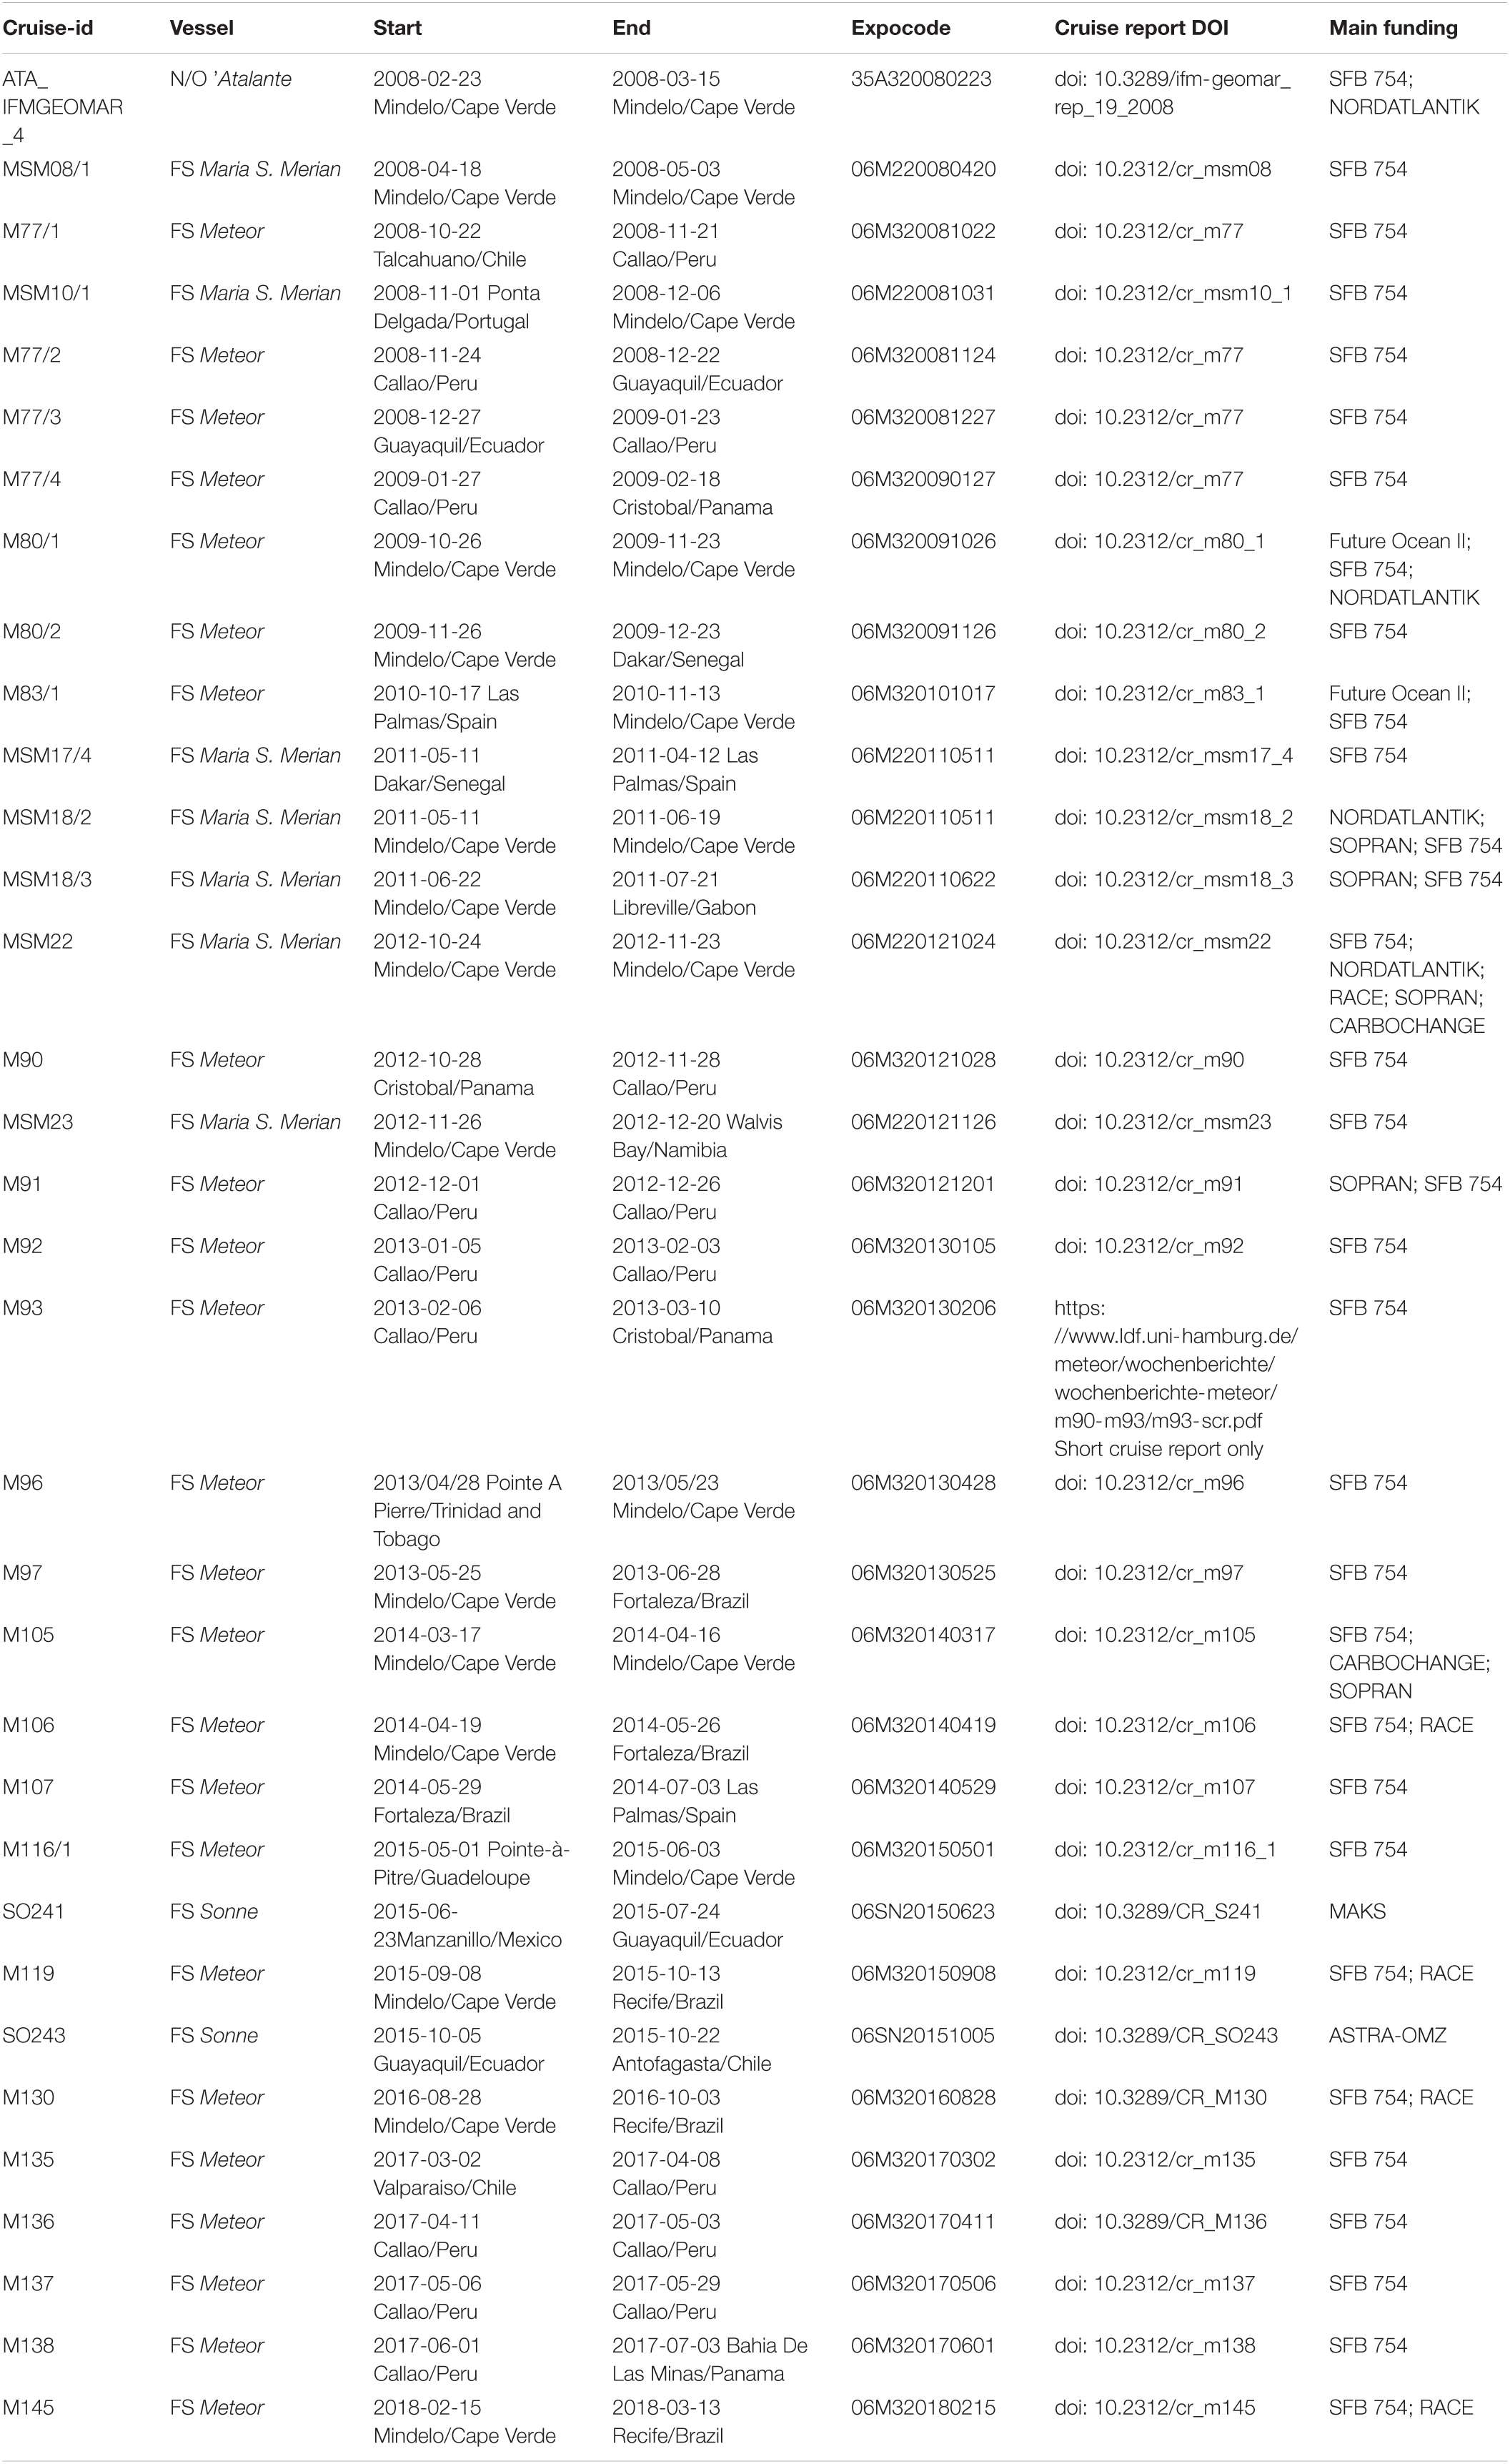
Table 1. Cruises on large research vessels in chronological order.
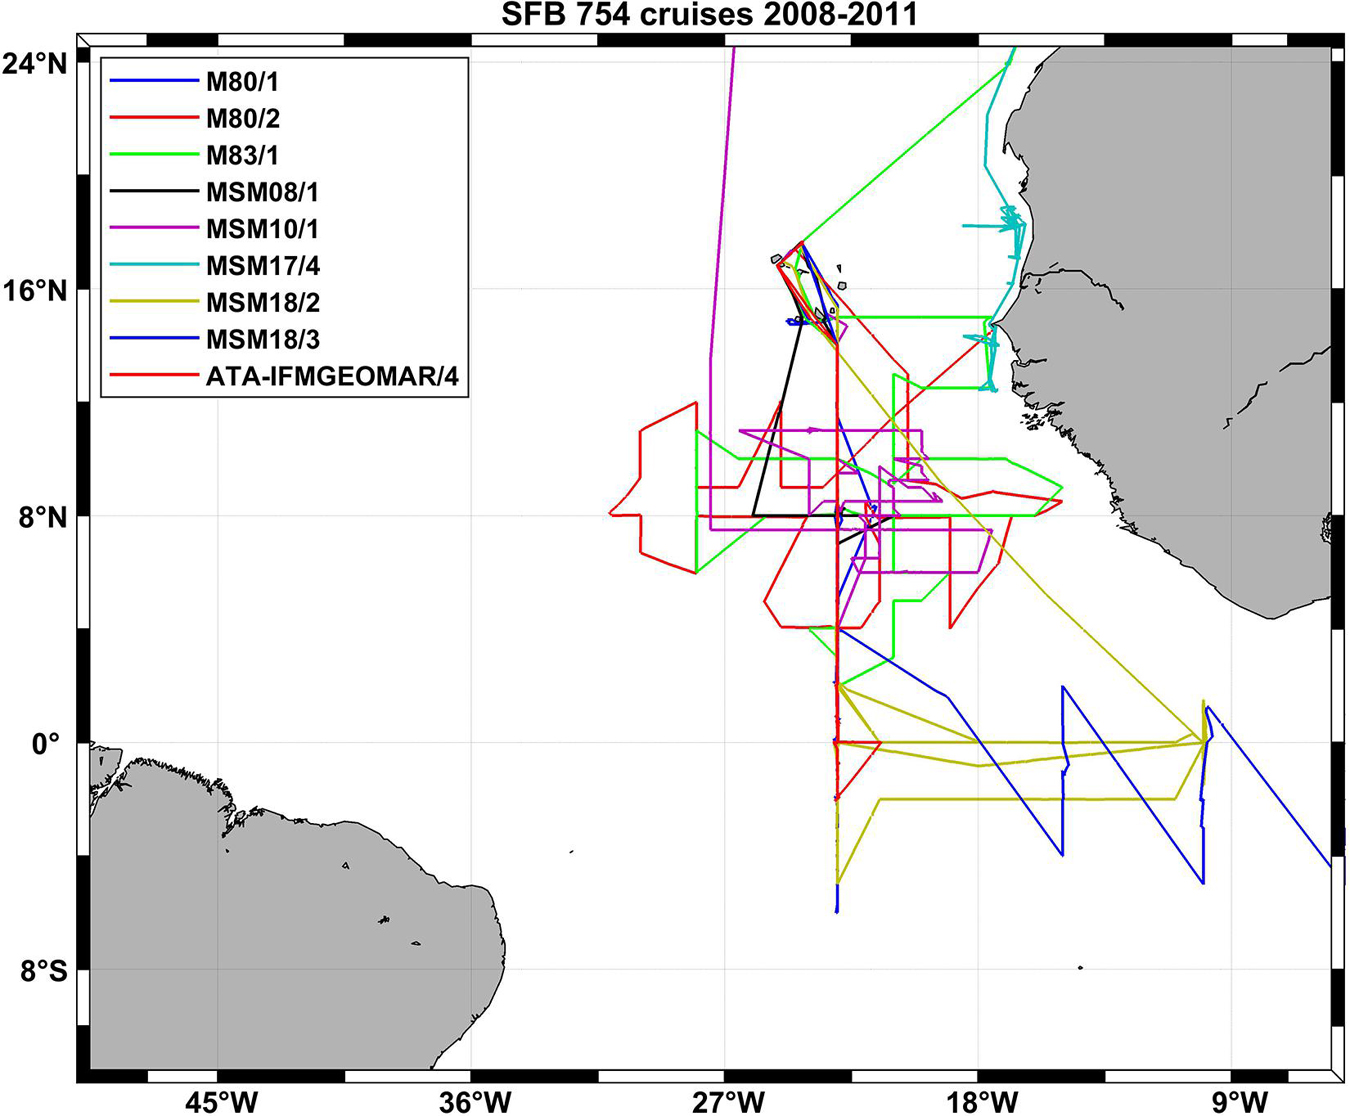
Figure 2. Cruise tracks of nine SFB 754 cruises in the Atlantic Ocean in the first funding period of the project (2008–2011).
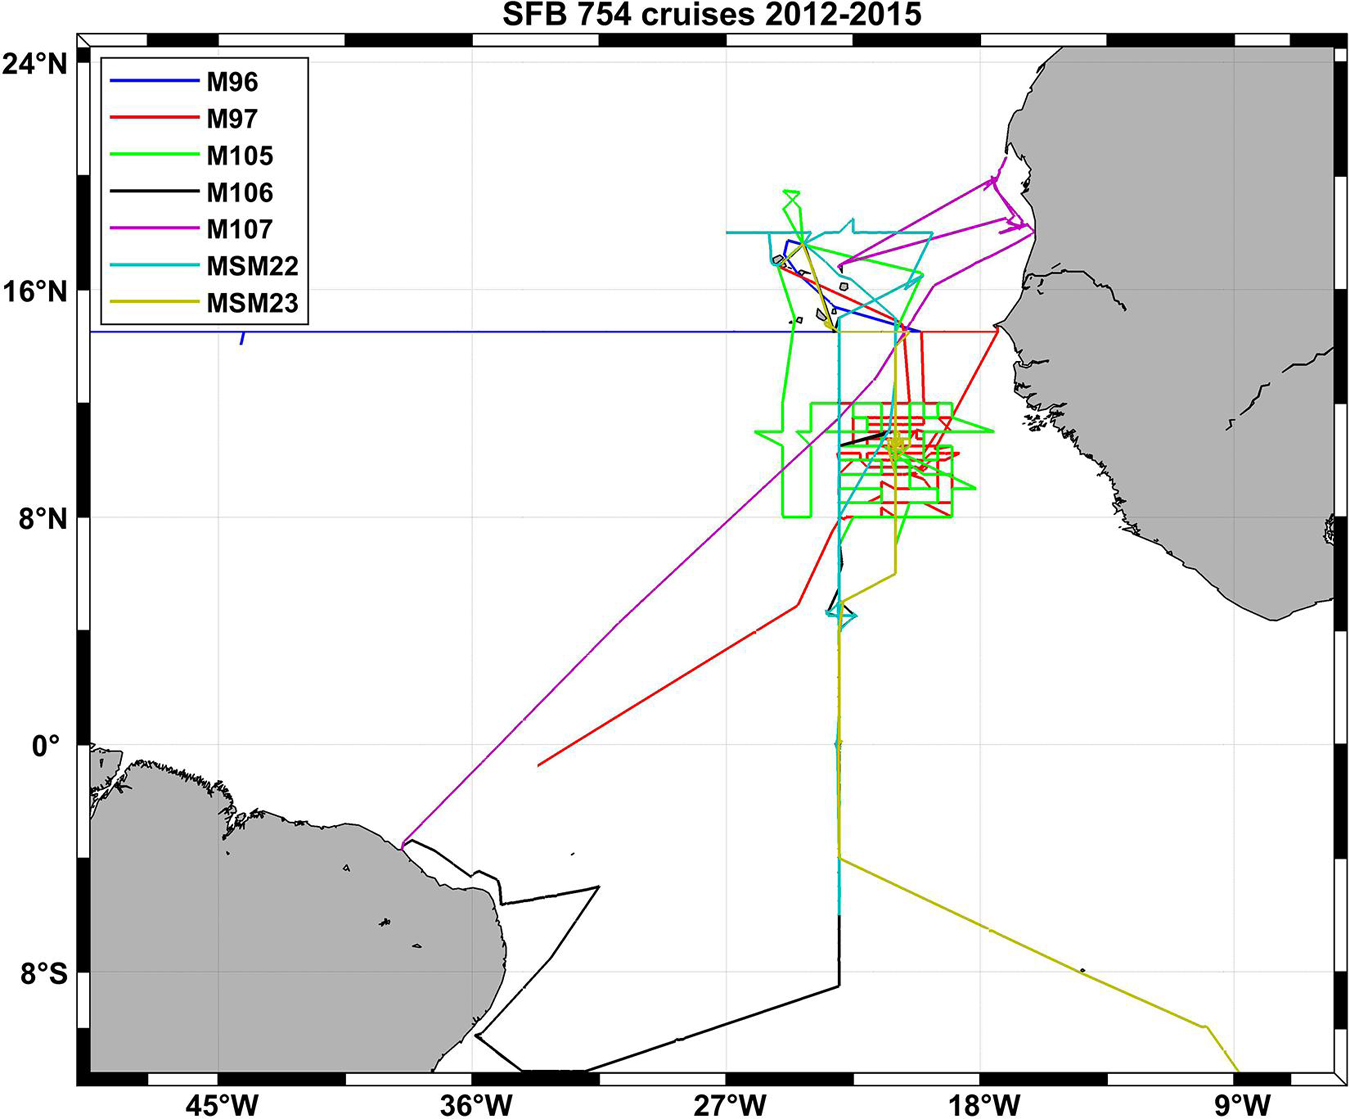
Figure 3. Cruise tracks of seven SFB 754 cruises in the Atlantic Ocean in the second funding period of the project (2012–2015).
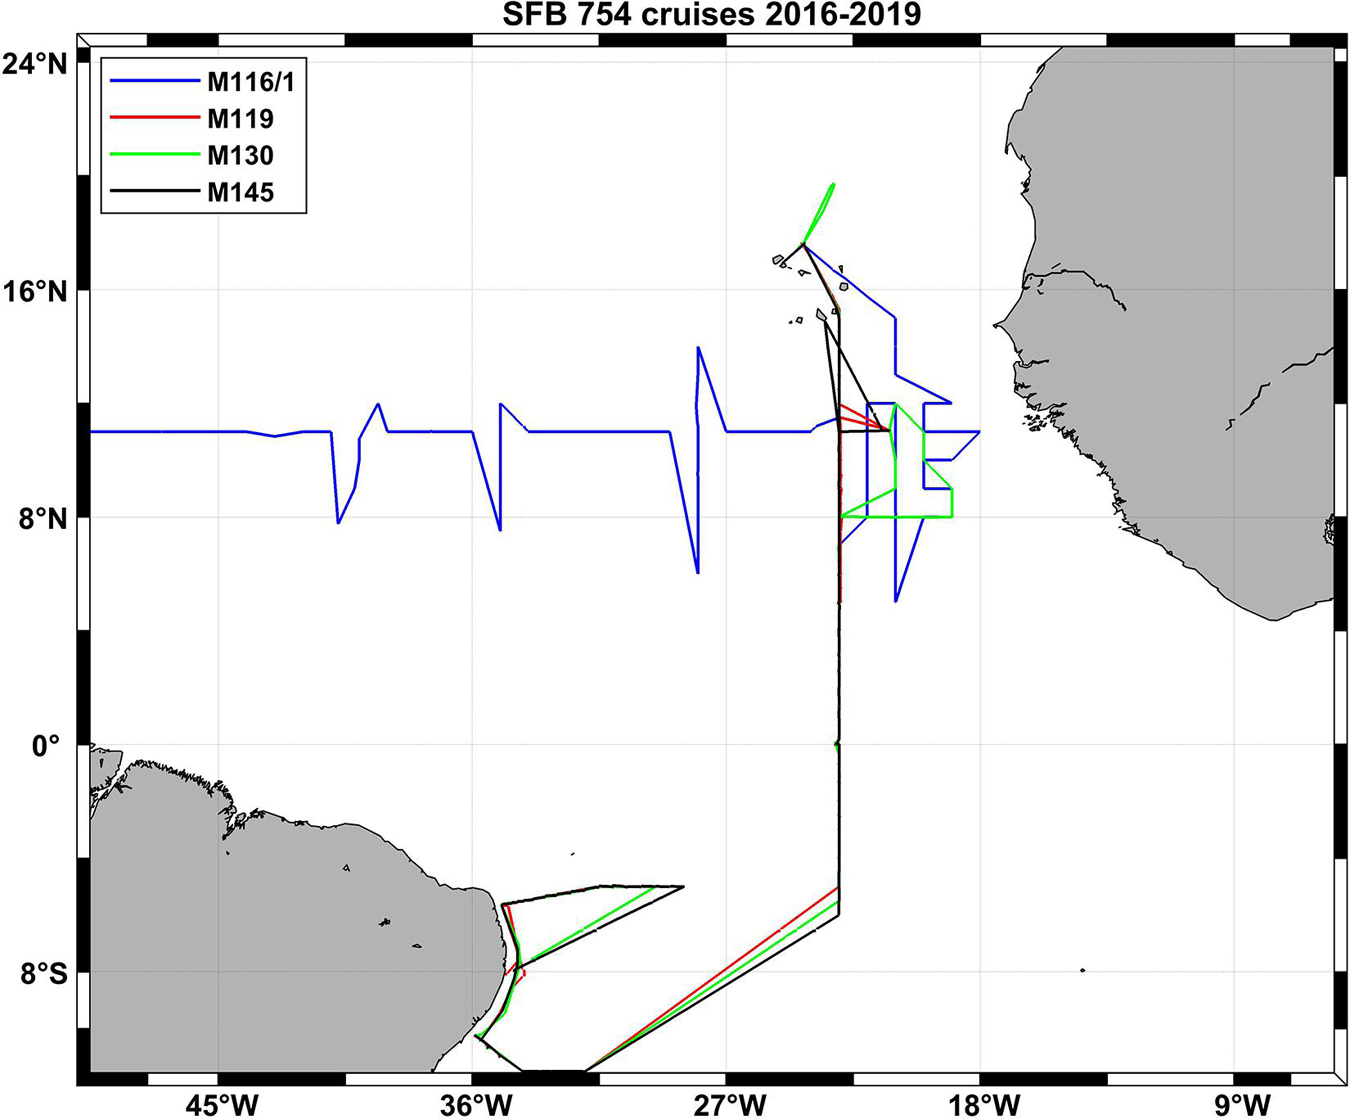
Figure 4. Cruise tracks of four SFB 754 crusies in the Atlantic Ocean in the third funding period of the project (2016–2019).
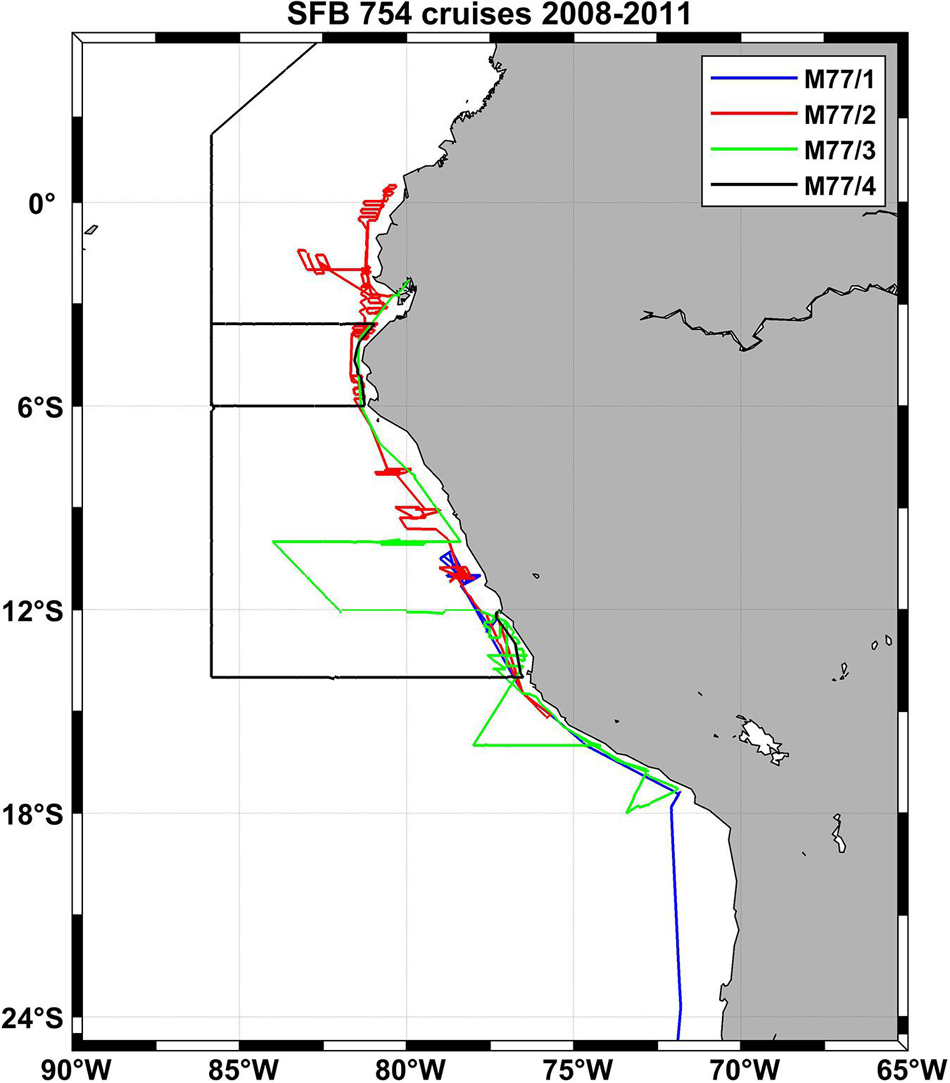
Figure 5. Cruise tracks of four SFB 754 cruises in the Pacific in the first funding period of the project (2008–2011).
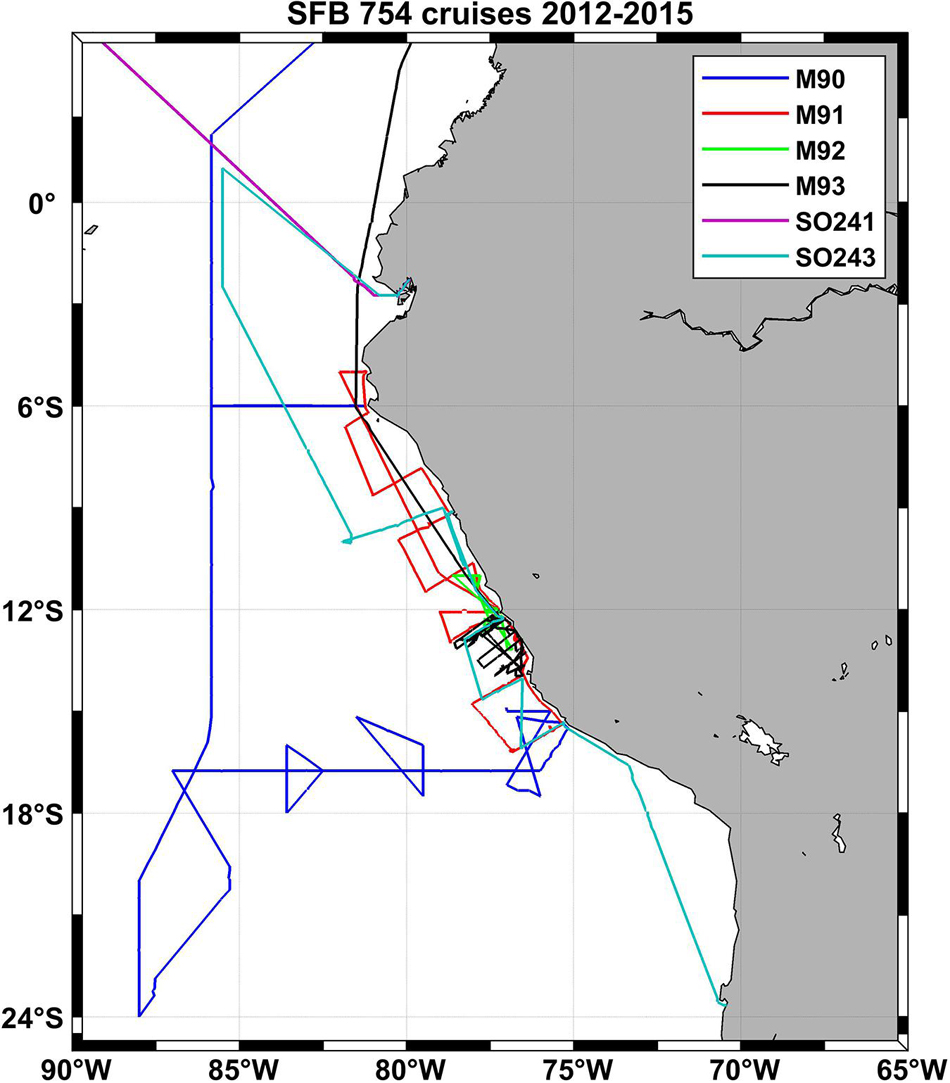
Figure 6. Cruise tracks of six SFB 754 cruises in the Pacific in the second funding period of the project (2012–2015).
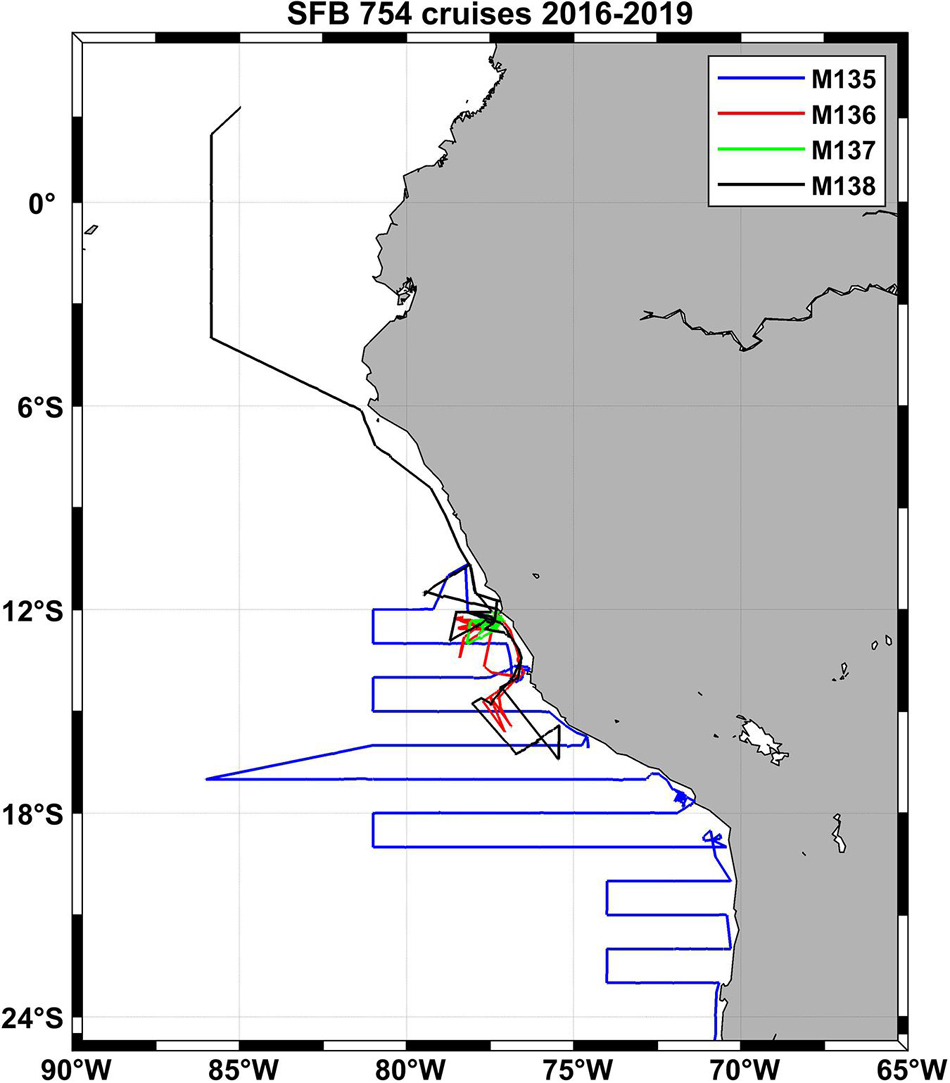
Figure 7. Cruise tracks of four SFB 754 cruises in the Pacific in the third funding period of the project (2016–2019).
Data Management
One of the first steps after the inception of the SFB 754 was the development and implementation of a common data policy2. Binding for all scientists of the SFB 754, it regulated how fully processed data sets should be curated, stored, distributed, and finally published, as well as the latency of this process. This data policy and its strict application is one of the reasons for the success of the SFB 754 with 421 peer reviewed publications at the time of writing.
The data management was based on two pillars: Internally the data were stored for, and distributed among, the scientists of the SFB 754 within the Ocean Science Information System (OSIS3, select ‘SFB754’ in the context) of GEOMAR. OSIS allows for the storage of different versions of the data set from preliminary and raw data shortly after collection, over calibrated data to the final data ready for publication. However, the OSIS system was not designed or suited to store and serve final data for the long-term. In the final step the data were thus published and made freely available at the World Data Center PANGAEA4 or at other more specific data centers.
Because of the diverse scientific fields and measurements involved, the rules of the data policy were quite generic. At the same time, an important goal was to ensure the timely exchange of data between the various research groups within the SFB 754. Within 3 months after data collection, meta-data for the measurements had to be entered into OSIS, and after 6 months initial versions had to be uploaded. The final publication of the data on PANGAEA was due 3 years after collection leaving sufficient time for analyses by members of the SFB 754. To support the adherence to the rules automatic reminders were sent by OSIS to the scientists responsible for the data sets. More than 1100 data sets have to date been published on PANGAEA5 (see text footnote 5 for a complete and up-to-date listing), while a small number (about 100) is still being processed and will be published in the near future. For easier accessibility, the data from the different scientific fields using different methods and instruments have been separated into data collections at PANGAEA (see Table 2). Some of the data sets have been published elsewhere on more specialized databases. These are explicitly mentioned in the text below.
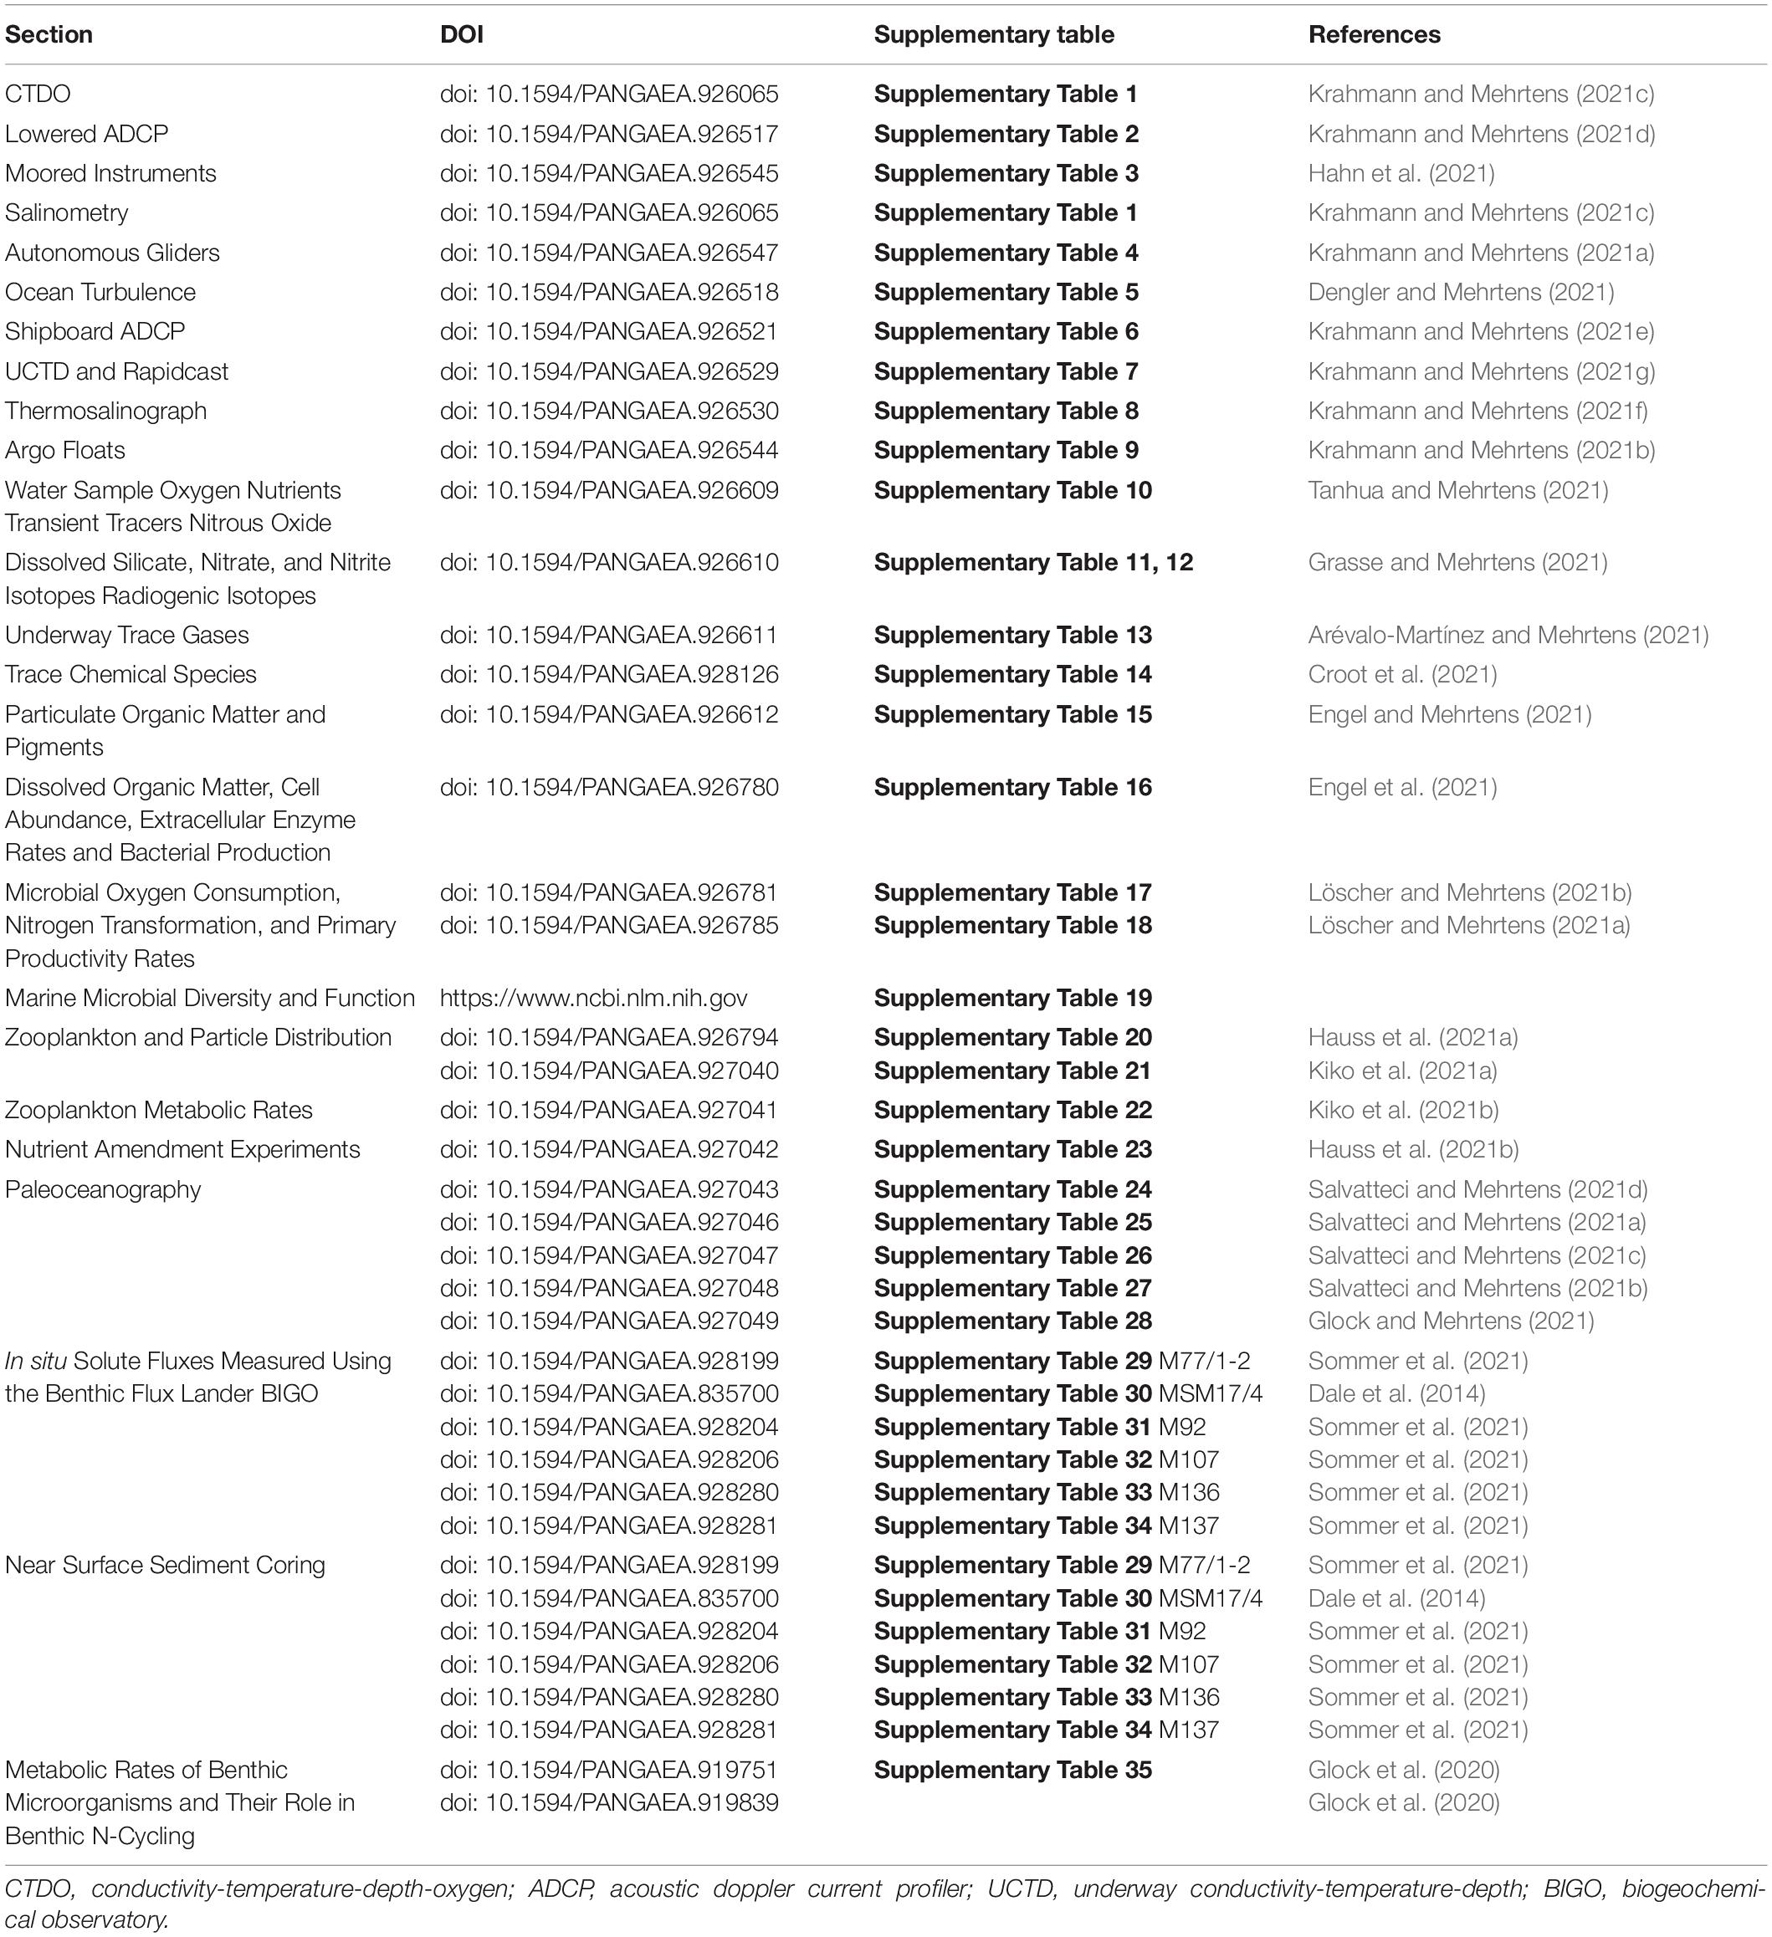
Table 2. Data set collections at PANGAEA related to the descriptive sections.
Observational and Experimental Methods and Data
During its 12-year existence, the SFB 754 used a large number of observational and experimental methods to assess the physical and biogeochemical state of the tropical oceans and the interactions between its components. The resulting data sets have been described, assessed, used, and incorporated in a large number of publications. Here we briefly summarize the methods used and refer to the relevant publications in which the methods have been described in detail. Data set collections have been created on PANGAEA for each of the following subsections (see Table 2). Each collection on PANGAEA also includes a pdf document with a summarizing table listing ancillary information and all relevant data set DOIs. Table 1 lists the research cruises with their start and end dates together with the DOIs of the cruise reports where additional information about the data collected and methods used can be found.
Physical Oceanography
Measurements of physical parameters in the surface layer and throughout the water column were a core element of the observational program of the SFB 754. They delivered information on the physical processes that determine the water masses and their properties in the regions of interest and at the same time set conditions for the various biogeochemical processes that determine the oxygen distribution.
Conductivity-Temperature-Depth-Oxygen (CTDO) Measurements
Conductivity-temperature-depth-oxygen (CTDO) measurements were acquired on 32 of the major research cruises performed as part of the SFB 754 or other collaborative or complementary projects (Krahmann and Mehrtens, 2021c; see Table 2 and Supplementary Table 1). Seabird 911plus systems equipped with dual temperature-conductivity-oxygen sensors were employed. All systems had a 24-bottle water sampling rosette with 10 l Niskin bottles. On some cruises only 22 bottles were mounted to accommodate a lowered Acoustic Doppler Current Profiler for deep ocean current observations. Water sampling, processing, and calibration followed GO-SHIP recommendations (McTaggart et al., 2010; Swift, 2010; Uchida et al., 2010) and included the recommended steps Data Conversion, Sensor Time-Alignment, Creation of Bottle Files, Outlier Removal, Pressure Sensor Filtering, Conductivity Cell Thermal Mass Correction, Ship Roll Correction, and Deck Offset Correction by Loop Editing, as well as Derivation of Calculated Properties. After these steps, conductivity and oxygen readings were calibrated against values determined with salinometry (see section “Salinometry”) and Winkler titration [see section “Discrete Oxygen Measurements (Winkler Titration)”], respectively. Finally, the downcast data were averaged over 1 dbar wide intervals. An independent upcast calibration was used to obtain calibrated CTDO values coincident with the discrete water samples. These values entered the bottle file described in section “Chemical Oceanography.”
In addition to the CTDO measurements, basically all CTDO casts included either a Dr. Haardt or a Wetlabs FLNTU fluorometer for CHL-a fluorescence. Several other sensors, such as a Wetlabs CDOM fluorometer and turbidity sensor, a Wetlabs C-Star transmissometer, a Photosynthetically Active Radiation (PAR) sensor manufactured by Biospherical Instruments, or a Seabird/Satlantic Submersible Ultraviolet Nitrate Analyzer (SUNA) have been attached to the CTDO system on some of the cruises or casts, depending on the availability of the sensors and their pressure ratings. SUNA data were processed following the procedures outlined in Sakamoto et al. (2009) and Sakamoto et al. (2017) and calibrated against Nitrate measurements from discrete bottle samples (see section “Nutrient Measurements”). To CHL-a and CDOM fluorescence, turbidity, transmissometer beam attenuation, and PAR data only the manufacturer’s calibrations were applied in the published data sets. Details about the sensors used on each cruise can be found in the respective cruise reports (see Table 1).
Lowered Acoustic Doppler Current Profiler (LADCP) Measurements
Lowered acoustic doppler current profiler (LADCP) measurements were performed on all research cruises that concentrated on open ocean areas (Krahmann and Mehrtens, 2021d; see Table 2 and Supplementary Table 2) while on cruises that worked mostly in shallow waters, ocean current measurements by the shipboard ADCP [see section “Shipboard Acoustic Doppler Current Profiler (SADCP) Measurements”] were deemed sufficient. GEOMAR used a two-instrument LADCP configuration with two Teledyne RDI 300 kHz workhorse ADCPs mounted in down- and up-looking positions. Data collection and processing was performed according to recommendations in the GO-SHIP best practices manual (Thurnherr et al., 2010).
Moored Instrument Measurements
Almost all long-term moored observations of the SFB 754 were conducted in the tropical Atlantic between the equator and 18° N, except for one mooring that was deployed in the tropical South Pacific (Hahn et al., 2021; see Table 2 and Supplementary Table 3). Moorings were typically equipped with instruments recording pressure, temperature, conductivity, dissolved oxygen, and current velocity. The moorings at 17.6° N, 24.2° W which have been deployed in the same location for several periods were additionally equipped with biogeochemical sensors recording variables such as partial pressure of CO2 (pCO2), fluorescence, and particle fluxes. Instruments with pressure, temperature, conductivity, and oxygen sensors were calibrated in situ immediately prior to and after a mooring deployment period by attaching them to the CTD frame during CTDO casts. Correction terms were then developed from the difference between the sensor readings and the calibrated CTDO data during several minute-long calibration stops. These correction terms were then applied to the full deployment periods. This ensured best data quality with recognition of potential sensor drifts and also allowed for the estimation of calibration and measurement errors (Hahn et al., 2014; Bittig et al., 2018; Berx et al., 2019). Moored Acoustic Doppler Current Profiler bin depths were corrected using the sound speed at instrument depth following the approach by Shcherbina et al. (2005). Velocities were not corrected, but respective measurement errors were assumed as described in Hahn et al. (2014). For all instruments within a mooring that did not record pressure, full deployment pressure time series were estimated by linearly interpolating between the instruments having a pressure sensor.
Salinometry
The conductivity sensors of the CTD were calibrated against International Association for the Physical Sciences of the Ocean (IAPSO) Standard Seawater samples with known conductivities using Guildline Autosal B instruments. On all cruises two Autosals were available and used to measure between 100 and 1000 samples (typically 300–400 for a cruise or 4–5 per CTD cast). The procedures used for the calibration followed the recommendations in the GO-SHIP manual (Kawano, 2010). The results from the salinometer measurements are included in the source files for CTD data published on PANGAEA (Krahmann and Mehrtens, 2021c).
Autonomous Gliders
Autonomous gliders were deployed during several cruises but also as stand-alone missions independent from large research vessels (Krahmann and Mehrtens, 2021a; see Table 2 and Supplementary Table 4). Two different generations of Teledyne Webb Research Slocum gliders were used, G1 and G2. All gliders were equipped with Seabird CTD systems, G1 gliders with an unpumped and G2 gliders with a pumped version, respectively. An Aanderaa optode was present on all gliders to observe dissolved oxygen concentrations. Optical fluorescence and backscatter sensors manufactured by Wetlabs were also present on all gliders albeit in different configurations. They allowed the determination of CHL-a (excitation and emission wavelengths of 470 and 695 nm, respectively) and CDOM (excitation and emission wavelengths of 370 and 460 nm, respectively) concentrations and the turbidity (scattering wavelength of 470 nm) of the waters. All glider data were processed using a GEOMAR-developed software (Thomsen et al., 2016) resulting in gridded fields for all observed variables. During a small number of glider deployments, a Seabird/Satlantic SUNA Nitrate sensor was attached to a glider. SUNA data were processed following the procedures outlined in Sakamoto et al. (2009) and Sakamoto et al. (2017) and calibrated against Nitrate measurements from nearby CTDO casts with discrete Nitrate measurements. Microstructure sensors were also attached to gliders on several deployments (see following section).
Ocean Turbulence Measurements
Ocean turbulence measurement programs were carried out during 22 cruises to quantify the dissipation rate of turbulent kinetic energy and infer rates of turbulent mixing (Dengler and Mehrtens, 2021; see Table 2 and Supplementary Table 5). The shipboard microstructure profiling systems (MSS) were manufactured by Sea & Sun Technology and consisted of a profiler (MSS90-D, S/N 26, 32, and 73), a winch having 500–1000 m of cable, and a data interface. All profilers were equipped with three microstructure shear sensors, a fast-response temperature sensor (PF07), an acceleration sensor, and two tilt sensors as well as conductivity (Sea & Sun Tech.), temperature (Sea & Sun Tech.), pressure (Keller), turbidity (Seapoint), and oxygen sensors sampling with a lower response time. The profilers were optimized to sink at a rate of 0.5–0.6 m s–1. Standard processing procedures were used to determine the rate of kinetic energy dissipation of turbulence in the water column (see Schafstall et al., 2010).
Additionally, during several autonomous glider missions, a microstructure probe was mounted to the top of the gliders. These probes (MicroRider) were manufactured by Rockland Scientific and carried two microstructure shear and temperature sensors as well as pressure, accelerometer and tilt sensors. The data processing is detailed in Foltz et al. (2020).
Shipboard Acoustic Doppler Current Profiler (SADCP) Measurements
Shipboard acoustic doppler current profiler (SADCP) data were acquired on 33 of the research cruises (Krahmann and Mehrtens, 2021e; see Table 2 and Supplementary Table 6). On FS Meteor, FS Maria S. Merian, and FS Sonne II two Teledyne RDI Ocean Surveyor systems with 38 and 75 kHz transmission frequency were used, while on NO l’Atalante a single 75 kHz system was used. All data were processed with a software package developed at GEOMAR following the GO-SHIP standards (Firing and Hummon, 2010). The data were subsequently averaged over 1-min intervals, converted to a NetCDF based format, and published. For a small number of cruises, the signal strength information of the SADCP data has been used to estimate the backscatter in the ocean. These data sets were processed following Mullison (2017) and published separately from the regular SADCP data (Krahmann and Mehrtens, 2021e; see Table 2 and Supplementary Table 6).
Underway Conductivity-Temperature-Depth (UCTD) and Rapidcast Measurements
During the second funding phase (2012–2015) a new CTD system became available that could be deployed from a moving ship. First a Teledyne Oceanscience UCTD and later a Teledyne Oceanscience Rapidcast system were acquired and deployed successfully on several cruises (Krahmann and Mehrtens, 2021g; see Table 2 and Supplementary Table 7). They allowed for the sampling of water masses at high horizontal resolution (ranging from less than 1 km for the Rapidcast system to 10 km for deep UCTD casts) with good accuracy of the pressure, temperature, and conductivity sensors. Processing of the data involved mostly the fall-rate dependent correction of the thermal lag of the conductivity sensor and followed the approach described by Ullman and Hebert (2014). Subsequently the corrected data were calibrated against the calibrated coincident Thermosalinograph (see subsequent section) and the calibrated nearby CTD data. The typical accuracies of the final pressure, temperature, and salinity data are 1 dbar, 0.01°C, and 0.01 g/kg, respectively.
Thermosalinograph (TSG) Measurements
For 32 SFB 754 cruises near-surface temperatures and salinities were collected using the ships’ thermosalinograph systems. The four ships on which the major cruises were conducted were equipped with different systems with either one or two thermosalinographs in parallel or in alternating operating mode (Krahmann and Mehrtens, 2021f; see Table 2 and Supplementary Table 8). All TSG data were cross-calibrated against the calibrated CTD data at the depth of the seawater intake for the TSG systems.
Argo Floats
The SFB 754 also made a contribution to the global Argo float program6. In 2009, 2011, and 2014 several floats equipped with additional Aanderaa oxygen sensors were deployed off Peru to study the effects of mesoscale eddies on the flow field and the water masses (Czeschel et al., 2018; Krahmann and Mehrtens, 2021g; see Table 2 and Supplementary Table 9). An effort was made to ensure the float data was compatible with the other observations of the SFB 754. Temperature data was deemed sufficiently accurate and no corrections were applied. Salinity data was corrected by the German Hydrographic Office using the approach from Owens and Wong (2009). Oxygen data were calibrated using different approaches depending on the availability of concurrent reference measurements (see for details Czeschel et al., 2011; Czeschel et al., 2012, 2018; Stramma et al., 2014). A number of regular Argo floats (without oxygen sensor) were deployed in the tropical Atlantic to accompany a tracer release experiment (see section “Transient Tracer Measurements”). Additionally several of the cruises were used to deploy regular Argo floats on behalf of the German Hydrographic Office.
Chemical Oceanography
The chemical oceanography program was comprehensive and included a range of different measurements whose scope was adapted to the different research questions of the cruises. While on all cruises chemical measurements were performed on water samples collected from the regular CTD/rosette system additional measurements were made on some cruises on water pumped continuously along the route of the ship. Measurements of oxygen from water samples and CTDO sensors were conducted during all cruises. On all cruises but MSM23 nutrient measurements were conducted, while measurements of transient tracers and the deliberately released tracer CF3SF5 were conducted only on nine cruises (see Supplementary Table 10). In addition, measurements of stable and radiogenic isotopes, the inorganic carbon system, nitrous oxide (N2O), iodide, trace chemical species, and a range of other variables were conducted during the SFB 754. For a description of the not so frequently measured variables see the cruise reports (see Table 1).
Discrete Oxygen Measurements (Winkler Titration)
In order to control the performance of the CTDO oxygen sensors as well as for their calibration discrete water samples (a few hundred to more than one thousand depending on the focus of the cruise) were collected and measured covering most CTDO casts (Tanhua and Mehrtens, 2021; see Table 2 and Supplementary Table 10). Samples were collected in 100 ml wide-necked WOCE glass bottles with pre-defined volumes. Oxygen samples were collected immediately after the CTDO cast was finished and always directly after the sampling of transient tracers. The sample bottles were flushed with at least three times its volume and the samples were free of air-bubbles. Immediately after sampling, the seawater samples were spiked from the bottom with the fixation solutions (NaI/NaOH and MnCl2). Some 10 to 20% of the discrete samples were collected as duplicates or triplicates in order to quantify sampling and titration uncertainties.
The oxygen concentration was determined by Winkler titration within a minimum of 40 min and a maximum of 16 h after sampling following GO-SHIP best practices (Langdon, 2010). Details of oxygen measurements can be found in the cruise reports (Table 1) of the individual cruises. For all cruises, we followed the standard procedures for compensating for impurities in the reagents and oxygen in the fixation solution. On cruises in the Southeast Tropical Pacific very low oxygen concentrations were found (well below 5 μmol/kg) and on the third set of cruises in the area (M135 to M138, see Table 1) we additionally compensated for a presumed sampling blank, i.e., contamination from air during sampling and fixation, and outgassing from the PVC Niskin bottles. The blank was determined by comparing titrated oxygen concentrations in the central depths of the oxygen minimum layer where we had previously determined that there was no oxygen present.
Nutrient Measurements
Nutrients were measured on-board for a sub-set of the cruises, and on another sub-set the samples were frozen for post-cruise processing in Kiel (Tanhua and Mehrtens, 2021; see Table 2 and Supplementary Table 10). Nutrient measurements on-board were performed with QuAAtro gas-segmented continuous flow analyzers (AutoAnalyzers) from SEAL Analytical. The exact methods used are listed in the cruise reports (see Table 1) and were normally: Nitrite and Nitrate – Q-068-05 Rev 11; Nitrite – Q-070-05 Rev 6; Phosphate – Q-064-05 Rev 8; Silicate – Q-066-05 Rev 5. The precision of the nutrient measurements was calculated as the average of the standard deviation from the replicate measurements of samples, and are recorded in the cruise reports. For the majority of the cruises where nutrients were measured on-board, reference Material for Nutrients in Seawater (RMNS) from the General Environmental Technos (KANSO) Co., Ltd., Osaka/Japan were used. Normally, reference material samples were measured as triplicates at least once in every sampling run. For nutrient analysis we followed the GO-SHIP best practices for nutrient measurements (Hydes et al., 2010).
Transient Tracer Measurements
Three tracer release experiments were conducted during the SFB 754 using the artificial tracer CF3SF5; two in the tropical North Atlantic, and one in the tropical South Pacific (Tanhua and Mehrtens, 2021; see Table 2 and Supplementary Table 10). The analytical technique for measuring this tracer is similar to that of the transient tracers CFC-12 and SF6. Both transient (i.e., CFC-12 and SF6) and released (CF3SF5) tracers were measured on 9 of the SFB 754 cruises. The tracers were measured using gas chromatograph/purge-and-trap techniques modified from Bullister and Weiss (1988). The sampling for CF3SF5 was focused around the density where the tracer was released, whereas the transient tracer sampling covered the whole depth of the CTDO profiles. The sampling volume for transient tracers was around 200 ml, whereas the sampling volume for CF3SF5 varied with time after injections (i.e., based on the expected concentration range) from 20 to 1000 ml.
Water Column Measurements of N2O
Extensive discrete sampling for measurements of N2O was carried out on seven cruises during the time span of the SFB 754 (Tanhua and Mehrtens, 2021; see Table 2 and Supplementary Table 10). Samples were collected with either the CTD/rosette or a pump-CTD system (see Löscher et al., 2012; Kock et al., 2016) and measured directly on board or at the Chemical Oceanography department of GEOMAR. Samples were analyzed by means of a headspace equilibration method coupled to gas chromatography with electron capture detection (for details, see Kock et al., 2016 and references therein).
Dissolved Silicate, Nitrate, and Nitrite Isotopes
Seawater samples for stable isotopes measurements of dissolved silicate (δ30Si), nitrate (δ15NO3–) and nitrite (δ15NO2–) were collected from the CTD/rosette on a number of SFB 754 cruises (Grasse et al., 2021; see Table 2 and Supplementary Table 11). Samples for δ30Si were collected during M77/3, M77/4, M90, and M93 and immediately acidified to pH 2 after filtration (Ehlert et al., 2012; Grasse et al., 2013, 2016). Sample preparation was in accordance the GEOTRACES7 protocol and samples for δ30Si were measured at GEOMAR on a Nu Plasma MC-ICP-MS (Nu InstrumentsTM, Wrexham, United Kingdom). δ15NO3– and δ15NO2– samples were collected during M77/3, M77/4, M90, M92, and M93. Samples containing nitrite concentrations below 0.1 μmol/l were acidified with 25% HCl (pH 1–2), otherwise samples were kept frozen until analysis (Altabet et al., 2012; Ryabenko et al., 2012; Bourbonnais et al., 2015; Hu et al., 2016). The isotopic composition of both N-species was measured using the Cd reduction/azide method (McIlvin and Altabet, 2005).
Radiogenic Isotopes
Seawater samples for Rare Earth Element (REE) concentrations and neodymium (Nd) isotopes were collected during M77/3 and M77/4 off Peru (Grasse et al., 2012) and during M90 in the Panama Basin (Grasse et al., 2017, 2021; see Table 2 and Supplementary Table 12). Samples were collected with the CTD/rosette and filtered through 0.45 μm nitrocellulose acetate filters (Millipores) shortly after sampling. For analysis of Nd isotopes 20 l of seawater were collected for each sample and treated following GEOTRACES protocol (van de Flierdt et al., 2012). Nd isotope measurements were carried out on a Nu plasma MC-ICPMS as well as on a Thermo Scientific TIMS TRITON. The concentrations of dissolved REEs in seawater were measured with a SeaFAST online preconcentration system (Elemental Scientific Inc.) connected to an Agilent 7500ce quadrupole ICP-MS at GEOMAR (Hathorne et al., 2012).
Underway Trace Gas Measurements
Continuous measurements of the climate-relevant trace gases carbon dioxide (CO2), nitrous oxide (N2O), and carbon monoxide (CO) in the surface ocean and overlying atmosphere were conducted during 9 SFB 754 cruises (Arévalo-Martínez and Mehrtens, 2021; see Table 2 and Supplementary Table 13) spanning the North, South, and equatorial Atlantic, as well as the South and equatorial Pacific. Trace gases were analyzed by laser spectroscopy-based gas analyzers coupled to air-water equilibration chambers as described in Arévalo-Martínez et al. (2013) and Arévalo-Martínez et al. (2019). All trace gas measurements were quality-controlled to achieve the international standards for marine CO2 (Bender et al., 2002), N2O (Bange et al., 2019), and atmospheric CO (Zellweger et al., 2019; to date there is no accepted standard for seawater measurements). The final quality-controlled data are available through the Surface Ocean CO2 Atlas (SOCAT8) and the MarinE MethanE and NiTrous Oxide (MEMENTO)9 database as well as on PANGAEA (Arévalo-Martínez and Mehrtens, 2021; see Table 2 and Supplementary Table 13).
Trace Chemical Species
Trace metal clean sampling equipment was deployed on a sub-set of cruises (see Croot et al., 2021; see Table 2 and Supplementary Table 14) to facilitate the observation of contamination prone chemical parameters.
All trace metal sample collection, handling, and analysis was conducted in accordance with GEOTRACES protocols which have been updated through the SFB 754 program (Cutter et al., 2014). All cruises with trace metal work (Supplementary Table 14) deployed an overpressurized clean container on deck to process contamination-prone samples at sea, except cruise M92 where sample handling was undertaken underneath laminar flow hoods. For cruises from 2008 to 2013, PTFE-coated 8 l GO-FLO bottles (General Oceanics) were mounted on a Kevlar wire with sample handling and preservation as per Chever et al. (2015). From 2014 onward, 24 Ocean Test Equipment (OTE) samplers were deployed mounted on a powder coated sampling CTD (Sea-Bird SBE25) rosette using a Kevlar conducting cable with sample handling and preservation as per Rapp et al. (2019).
Prior to 2014, dissolved trace metal concentrations were largely determined by graphite furnace atomic absorption spectroscopy after offline pre-concentration as per Schlosser et al. (2018) with calibration of all elements via standard addition. Post 2014, dissolved trace metal samples were analyzed via Inductively Coupled Plasma Mass Spectrometry after offline pre-concentration using a SeaFAST system exactly as per Rapp et al. (2017). A number of trace metal isotopes were also analyzed with forthcoming data sets expected to expand the limited available isotopic data for the Peruvian OMZ with analysis as per Chever et al. (2015) for Fe and Xie et al. (2019) for Cd.
In addition to dissolved trace metal concentrations, a number of redox sensitive trace species were quantified. These included Fe(II) and H2O2 concentrations determined using flow injection analysis (Schlosser et al., 2018; Croot et al., 2019), and other reactive oxygen species as per Wuttig et al. (2013). Metal-speciation was also explored through titrations to characterize metal-ligand interactions with analytical methods as per Baars and Croot (2015) for Co species, and Gledhill and Van Den Berg (1994) for Fe(III) species.
Biological Oceanography
Pelagic biological field work of varying extent was carried out during most cruises. Topics spanned from marine biogeochemistry and microbiology to zooplankton and nekton ecology, and methods included field observations as well as on-board incubations for microbial as well as metazoan metabolic rate determination and large-scale experimental set-ups with various treatments such as bioassays, shipboard mesocosms, and a mesocosm experiment off Callao using the KOSMOS system.
Particulate Organic Matter and Pigment Analysis
Particulate organic matter (POM) distribution in the water column was on several cruises (Engel and Mehrtens, 2021; see Table 2 and Supplementary Table 15) determined after filtration onto pre-combusted, acid-washed GF/F filters (Franz et al., 2012b). Blanks for POM determinations were obtained by analyzing filters that were treated the same way as sample filters but without sample addition; this includes rinsing of filters with filtered seawater. Blank values were subtracted from sample values. For particulate organic carbon (POC) and particulate nitrogen (PN), filters were exposed to fuming hydrochloric acid for 12 h to remove carbonate and subsequently dried (60°C, 12 h). Analyses were carried out with a Euro EA elemental analyzer calibrated with an acetanilide standard. Particulate organic phosphorus (POP) collected on GF/F filters was determined colorimetrically as ortho-phosphate after potassium peroxydisulfate digestion following the method of Hansen and Koroleff (1999). Biogenic silica (BSi) was determined from material filtered onto cellulose acetate filters (0.8 μm), dissolved with 25 ml NaOH (0.1 M) at 85°C for 2 h 15 min in a shaking water bath and analyzed after cooling as Si(OH)4 according to the method by Hansen and Koroleff (1999). Biogenic opal was calculated assuming a water content of ∼10% (Mortlock and Fröhlich, 1989).
Samples for phytoplankton pigment concentrations were collected by filtration of seawater from the CTD/rosette through GF/F filters, and stored at −80°C immediately after filtration. Pigments were extracted by adding 2 ml acetone (90%) to each filter sample followed by homogenization in a cell mill (Edmund Buehler GmbH). Each sample was then centrifuged and the supernatant was filtered through a 0.2 μm Teflon filter and analyzed by High-Performance Liquid Chromatography (HPLC) after Franz et al. (2012b). Seawater samples (4 ml) were collected for analyses of the phytoplankton community composition by flow cytometry to complement phytoplankton pigment data, fixed with hexamine/formalin solution and stored at −80°C.
Transparent exopolymer particles (TEP) and Coomassie stainable particles were filtered under low pressure (<150 mbar) onto 25 mm Nucleopore polycarbonate membrane filters (0.4 μm pore size, Whatman Ltd.) and stained with Alcian Blue and Coomassie Brilliant Blue, respectively. Each filter was placed on the white side of a semi-transparent glass slide (Cytoclear©) and stored frozen at −20°C until analysis. TEP and CSP were determined by microscopy and subsequent image analysis (Engel, 2009).
Export flux of particles was characterized using surface-tethered sediment traps (Engel et al., 2017), with Particle Interceptor-Traps (PIT) following Knauer et al. (1979). Each PIT had an inside diameter of 7 cm, an outside diameter of 7.6 cm and a height of 53 cm, leading to an aspect ratio of 7.5. PITs were covered with a baffle system consisting of smaller acrylic tubes attached to the top end and filled with a 0.2 μm filtered brine solution containing 50 g l–1 sodium chloride to reduce drag-induced movement within the trap. For preservation, formalin (2% final concentration) was added to the brine solution. Recovered samples were, at first, passed through a 500 μm nylon mesh. Swimmers were removed from the mesh using forceps under a binocular microscope. The remaining particles, which stuck to the mesh, were transferred back to the sample.
Dissolved Organic Matter, Cell Abundance, Extracellular Enzyme Rates, and Bacterial Production
For dissolved organic carbon (DOC) and total dissolved nitrogen (TDN), samples (20 ml) were collected in duplicate on a number of cruises (Engel et al., 2021; see Table 2 and Supplementary Table 16), filtered through combusted (8 h, 500°C) GF/F filters or through syringe filters (0.45 μm glass microfiber GD/X membrane, WhatmanTM) that were rinsed with 50 ml sample and filled into combusted (8 h, 500°C) glass ampoules. Samples were acidified with 80 μl of 85% phosphoric acid or 20 μl of 30% ultrapure hydrochloric acid, heat-sealed immediately and stored at 4°C in the dark until analysis. DOC samples were analyzed by high-temperature catalytic oxidation (TOC-VCSH, Shimadzu), as described in more detail in Engel and Galgani (2016).
Samples for the analysis of dissolved amino acids, which are a combination of free and hydrolysable amino acids (DAA, ∼4 ml), and dissolved combined carbohydrates (DCHO, ∼16 ml) were filtered through rinsed Acrodisc® 0.45 μm GHP membrane (Pall) in combusted vials (8 h, 500°C) and stored at −20°C, respectively. Prior to analysis DAA were hydrolyzed using 6 N HCl at 100°C for 20 h. Determination of DAA was carried out on a 1260 HPLC system (Agilent), following the methods described by Lindroth and Mopper (1979) and Dittmar et al. (2009), with modifications as described in Engel and Galgani (2016). For the analysis of free amino acids (FAA) the same samples were processed without hydrolyzation. DCHO samples were desalted by membrane dialysis (1 kDa, Spectra Por) and hydrolyzed using 1 M HCl for 20 h at 100°C prior to analyses. Samples were analyzed after Engel and Händel (2011) with a high-performance anion exchange chromatography (HPAEC) (DIONEX ICS3000DC). More detail on molecular DOM composition may be found in Loginova et al. (2019), Maßmig et al. (2020), and Maßmig and Engel (2021).
Bacterial abundance was determined by flow cytometry on a FACS Calibur (Becton Dickinson) after Gasol and del Giorgio (2000) from 1.6 ml sample, fixed with 0.75 μl 25% glutaraldehyde on board and stored at −80°C until analyses. To 400 μl sample 10 μl Flouresbrite® fluorescent beads (Polyscience, Inc.) and 10 μl Sybr Green (Invitrogen) were added.
For the extracellular enzymes leucine aminopeptidase and β-glucosidase, potential hydrolytic rates were determined after Hoppe (1983). L-leucine-7-amido-4-methylcoumarin (Sigma Aldrich) and 4-methylumbelliferyl-β-D-glucopyranoside (Acros Organics) were used as fluorescent substrate analogs and added in final concentrations of 1, 5, 10, 20, 50, 80, 100, and 200 μmol l–1 in 69 well plates (Costar). Afterward, 200 μl sample were added and fluorescence was measured with a plate reader fluorometer (FLUOstar Optima, BMG labtech) (excitation: 355 nm; emission: 460 nm) after 0 and 12 h of incubation. For details about incubation conditions and subsequent calculations see Maßmig et al. (2020).
Bacterial production was determined by measuring the incorporation of labeled leucine (3H) that was added at a saturating final concentration of 20 nmol (specific activity 100 Ci mmol–1, Biotrend) in 1.5 ml of sample (Kirchman et al., 1985; Smith and Azam, 1992). After 3 h of incubation, samples were extracted via the centrifugation method according to Smith and Azam (1992) and measured with a liquid scintillation counter (Hidex 300 SL, TriathalerTM, FCI). For the estimation of incorporated carbon, a conversion factor of 1.5 kg C mol–1 leucine was used (Simon and Azam, 1989). For further details about incubation conditions, sample treatment, and subsequent calculations see Maßmig et al. (2020).
FDOM samples were filtered through 0.2 μm polyethersulfone syringe filters (CHROMAPHIL® Xtra PES−45/25) and stored into 15 ml combusted (450°C, 8 h) amber−glass vials and at −20°C.
FDOM was determined using 3D−Excitation-Emission-Matrix (EEM) fluorescence spectroscopy followed by parallel factor analysis (PARAFAC). EEM spectra were obtained using a Cary Eclipse Fluorescence Spectrophotometer (Agilent Technologies) within 230–455 nm excitation wavelength range in 5 nm intervals and within 290–700 nm emission wavelength range in 2 nm intervals. All FDOM samples were brought to room temperature before the analyses, the measurements were performed under temperature-controlled conditions at 19°C using Cary Single Cell Peltier Accessory (VARIAN). All the fluorescence measurements were performed at 0.2 s integration times and 5 nm slit width on both monochromators.
The 3D fluorescence spectra were corrected and analyzed by PARAFAC (Stedmon and Bro, 2008), using “drEEM toolbox for MATLAB” after Murphy et al. (2013). The humification and biological indexes were calculated after (Zsolnay et al., 1999). CDOM samples were collected into combusted (450°C, 8 h) 40 ml amber−glass vials. All samples were passed through 0.2 μm polyethersulfone syringe filters (CHROMAPHIL® Xtra PES−45/25, MACHEREY−NAGEL GmbH & Co.KG) before storage at 4°C. Samples were processed within 1–90 days. The measurements were performed at room temperature (∼19°C) using Shimadzu® 1800 UV−VIS double−beam spectrophotometer within 230–750 nm wavelength range against MilliQ water at 1 nm intervals. More details on the spectroscopic analyses may be found in Loginova et al. (2015, 2016, 2020).
Microbial Oxygen Consumption, Nitrogen Transformation, and Primary Productivity Rates
Dinitrogen (N2) and carbon (C) fixation rates were measured on nine cruises (Löscher and Mehrtens, 2021b; see Table 2 and Supplementary Table 17) using shipboard incubation experiments, complemented with nutrient and oxygen manipulations. During cruises M77/3, M77/4, and M80/2, N2 fixation was measured using the bubble addition method following Montoya et al. (1996). During M80/2 a novel method based on 15N2 gas pre-dissolution, which was developed by Mohr et al. (2010), was tested in parallel to the method of Montoya et al. (1996). An underestimation of N2 fixation rates by the classic method has been observed (Großkopf et al., 2012) and therefore the novel ‘pre-dissolution method’ was applied during the following cruises (M83/1, M90, M91, M93, M97, M104, and M107). Single cell N2 fixation rates to differentiate the contribution of different clades of N2 fixers were measured using a NanoSIMS (Martínez-Pérez et al., 2016). C fixation was determined using 13C-bicarbonate additions (e.g., Großkopf et al., 2012; Löscher et al., 2014) and heterotrophic C turnover was determined using 13C-glucose additions (Löscher et al., 2014, 2016).
Potential rates for microaerobic respiration and aerobic organic matter degradation as a source of ammonia (NH4+) in the Peruvian OMZ was assessed using an 18O2 labeling approach suitable for microaerobic respiration (Holtappels et al., 2014). Further, the effects of O2 depletion associated with marine snow particles on microbial respiration was explored by combining 18O2 labeling experiments with in situ particle size analysis and modeling of aggregate-size dependent respiration (Kalvelage et al., 2015). Anammox, denitrification, and nitrification, as well as N2O production rates were measured on several cruises (Kalvelage et al., 2011; Löscher et al., 2012; Bourbonnais et al., 2017; Callbeck et al., 2017; Frey et al., 2020; Löscher and Mehrtens, 2021a; see Table 2 and Supplementary Table 18) using isotope fractionation studies, 15N tracer additions, and inhibitor studies.
Marine Microbial Diversity Function
In order to identify key groups of microbes for C, N, and O2 turnover, microbial metabolic rate measurements were complemented with analyses of metagenomes and metatranscriptomes from the Eastern Tropical South Pacific (ETSP) and Eastern Tropical North Atlantic (ETNA). In addition, key gene and transcript characterization and quantification for aerobic respiration (Kalvelage et al., 2015), N2 fixation (Großkopf et al., 2012; Löscher et al., 2014, 2015, 2016, 2020), anammox, denitrification, and nitrification (Löscher et al., 2012, 2015, 2016; Kalvelage et al., 2013) were carried out using Sanger sequencing and quantitative real time polymerase chain reactions (PCRs) as described in Löscher et al. (2012, 2014). To assure high quality sampling of nucleic acids, sample filtration times did not exceed 20 min and samples were shock-frozen in liquid N2 and stored at −80°C (e.g., Löscher et al., 2014). Early metagenomic and -transcriptomic analyses targeted an understanding of microbial communities in the surface waters above the OMZ, the oxyclines, OMZ core waters, and sulfidic anoxic waters, as summarized in Löscher et al. (2016) and were based on Pyrosequencing technology (e.g., Desai et al., 2013; Schunck et al., 2013). Due to the rapid advance in sequencing technologies, it was possible to generate more conclusive metagenomes for targeted studies on sulfur, N, and O2 cycling during M90–M93. Nine metagenomes were sequenced using Illumina HiSeq technology (Callbeck et al., 2018) from those cruises. On those data sets, genome assemblies and phylogenetic classifications were carried out to explore the role of a key microbial cluster, SUP05, and its role in OMZ sulfur and nitrogen turnover. Metagenomes from the ETNA cruise M107 were sequenced in the context of the development of anoxic water masses in collaboration with the DFG-funded Cluster of Excellence ‘The Future Ocean’ (Löscher et al., 2015). In addition to full metagenomes, targeted community studies were carried out using 16S rDNA amplicon sequencing sequenced on Illumina MiSeq sequencers from the same anoxic eddy in the ETNA and from the Peruvian OMZ (Löscher et al., 2015; Scholz et al., 2016). All published sequences were submitted to the National Center for Biotechnology Information’s archives (NCBI10; see Table 2 and Supplementary Table 19). Physical DNA libraries are archived at GEOMAR and the University of Southern Denmark, and subsamples are available on request from C. Löscher.
In addition to this mainly pelagic work, transcriptomes, and genomes of the denitrifying benthic foraminifera Globobulimina turgida and G. auriculata from the seasonally hypoxic Swedish Gullmar Fjord were analyzed (Woehle et al., 2018). The obtained information was used to describe the foraminifera unique eukaryotic ability to denitrify and colonize low-oxygen environments. Sequences were submitted to the NCBI’s Sequence Read Archive (accession numbers SRR6202052 – SRR6202078) and to the transcriptome sequencing archive (accession numbers GGCE00000000 and GGCD00000000). The genome assembly was submitted to NCBI (draft genomes PIVH00000000- PIWH00000000; unassigned contigs: PJEL00000000). Furthermore, individually amplified 18S rRNA gene sequences of the two analyzed foraminiferal species were submitted to GenBank (MG800664 to MG800667).
Zooplankton and Particle Distribution
A Hydrobios Multinet Midi with an aperture of 0.25 m2 and five nets (mesh size 200 μm) was deployed for vertically stratified tows on several cruises (Hauss et al., 2021a; see Table 2 and Supplementary Table 20), mostly in paired day–night tows to quantify diel vertical migration. Standard depths used for these deployments were 1000–600–300–200–100–0 m. On cruise M93, a Multinet Maxi (nine nets, 333 μm mesh) was used instead. Samples were fixated in 4% formaldehyde in seawater solution, scanned at GEOMAR or at the Ocean Science Center Mindelo, Mindelo/Cape Verde, and analyzed using automated imaging software (Gorsky et al., 2010) allowing taxonomical classification as well as the estimation of taxon-specific biomass (Lehette and Hernández-León, 2006) and metabolic rates. Scanned image data are available on EcoTaxa11 (Picheral et al., 2017) upon request from R. Kiko and H. Hauss. Taxon-specific biomass and metabolic rate estimates are publicly available on PANGAEA (Kiko and Hauss, 2019; Kiko et al., 2020).
To expand the ecological knowledge on fragile organisms (such as giant rhizaria, medusae, ctenophores, and siphonophores) in situ imaging techniques were employed in addition to net sampling. An Underwater Vision Profiler 5 (UVP5; Picheral et al., 2010) was routinely mounted on the CTD/rosette during most SFB 754 cruises since 2012 (Kiko et al., 2021a; see Table 2 and Supplementary Table 21). During the cruises in 2012 and 2013 a UVP5 was used that was kindly provided by the Laboratoire d’Océangraphie de Villefranche-sur-Mer (France). The instrument consists of one down facing HD camera in a steel pressure case and two red LED lights which illuminate a 0.88 to 0.93 l volume (depending on the actual set-up). During the downcast, the UVP5 takes 3–20 pictures of the illuminated field per second. For each picture, the particles are counted and sized immediately and the data are stored in the instrument for later analysis. Furthermore, images of particles with a size >500 μm are saved as separate “vignettes” – small cut-outs of the original picture – which allow for later, computer assisted, identification of these particles and their assignment into different particle, phyto-, and zooplankton groups. Since the UVP5 was integrated in the CTD and has its own pressure sensor, fine-scale vertical distribution of particles and major planktonic groups can be related to environmental data. UVP5 particle and zooplankton data from all cruises can be accessed on EcoTaxa (see text footnote 11; Picheral et al., 2017). UVP5 particle data have undergone further quality controls since their first publication and were merged with data from other international collaborators to yield a global data set. This data set, to be found at doi: 10.1594/PANGAEA.924375 supersedes the previous UVP5 particle data sets and should be used for further research, whereas the original data sets are still available for reference.
Zooplankton Metabolic Rates
Zooplankton metabolic rates (oxygen respiration and ammonium excretion) at different temperatures, oxygen, and carbon dioxide partial pressures (Kiko et al., 2015, 2016) were measured during three cruises (Kiko et al., 2021b; see Table 2 and Supplementary Table 22). Zooplankton was collected by different nets and the entire catch immediately transferred to 10 l beakers containing pre-cooled seawater. Diel vertical migrators were sampled at the surface at night. Individuals for respiration rate measurements were isolated immediately and maintained in filtered seawater for 1 to 13 h at the chosen experimental temperature (13, 18, or 23°C). Only animals appearing unharmed and fit were used for experiments. Water for the respiration and excretion rate trials was UV-treated, filtered over a 0.2 μm sterile filter, and supplemented with antibiotics (25 mg l–1 ampicillin and 25 mg l–1 streptomycin). Subsequently, the water was bubbled with different Gas mixtures (N2, O2, CO2; see Kiko et al., 2016 for details) adjusted to represent different environmental pO2 and pCO2 levels. Incubation bottles (12 to 280 ml) were pre-filled with the respective incubation water and the animals quickly added, transferring as little water as possible. The incubation bottles were equipped with a PreSense oxygen microsensor spot and readout was conducted from the outside, using a fiber optic cable and a 4- or 10-channel Oxy-Mini (PreSens Precision Sensing GmbH, Regensburg, Germany). Incubations were conducted in the dark in 10 l water baths located inside temperature-controlled incubators. Experiments were generally conducted for a maximum of 16 h to avoid microbial growth, which would have affected the ammonium measurements. Generally, three incubations were combined with one animal free control incubation, which served to estimate microbial background respiration and ammonium concentrations in these controls. As oxygen levels within the bottles declined, respiration rates could also be estimated at other than the pre-set conditions. After an acclimation phase of 1 h, respiration rates were calculated for 1-h intervals using a linear regression. The microbial background respiration rate was subtracted from the experimental incubation respiration rate to yield the animal’s respiration rate. Generally, 1 or 15 ml water samples were collected at the end of the incubation to determine ammonium concentrations fluorometrically according to Holmes et al. (1999). Ammonium excretion rates were calculated as the difference between the incubation and animal-free controls. Animals used in the experiments were afterward recovered, frozen at −80°C, and transported to the home laboratory, where their dry-weight was determined. The rates presented should be considered routine metabolic rates, as activity was not monitored continuously (Prosser, 1961). Please refer to Kiko et al. (2015, 2016) for further experimental details.
Nutrient Amendment Experiments
Bioassays with amendment of DIN, DIP, and various trace elements were conducted in short-term replicated bottle incubations to determine limiting elements for phytoplankton growth (Browning et al., 2017; Hauss et al., 2021b; see Table 2 and Supplementary Table 23). Shipboard mesocosm experiments with a duration from 7 to 11 days were conducted on several cruises in the ETNA and ETSP and land-based on Cape Verde to determine the impact of N:P stoichiometry on the pelagic community (Franz et al., 2012a; Hauss et al., 2012; Czerny et al., 2016; Meyer et al., 2016) and dissolved organic compounds (Engel et al., 2015; Loginova et al., 2015). In austral summer 2017, a large-scale in situ mesocosm experiment was conducted off Callao (Peru) using the KOSMOS facilities. Deep water was injected into the mesocosms to simulate an upwelling event and the response of the planktonic ecosystem was monitored for 50 days (Bach et al., 2020).
Paleoceanography
One of the objectives of the SFB 754 was the reconstruction of the factors controlling the intensity and the spatial extent of the OMZ in the Eastern Tropical Pacific, specifically off Peru, since the Last Glacial Maximum (21000 years ago). For the purpose of these paleoceanographic studies, long gravity cores were recovered during four scientific expeditions (M77/1, M77/2, M92, and M135; see Figure 8). During the cruises M77/1 and M77/2 in 2008, 51 sediment cores were retrieved below and in the centre of the OMZ, from ∼17° S to the equator (see Figure 8). Most of the records collected in the core of the OMZ (i.e., ∼200 to ∼500 m depth), from ∼8 to 15° S, show sedimentary discontinuities during the Holocene (last 11700 years), which preclude high resolution paleoceanographic reconstructions in this area (Salvatteci et al., 2014, 2016; Erdem et al., 2016). Based on the information collected during M77/1 and M77/2 and also on the scientific literature, cruise M135 aimed specifically at finding the most complete Holocene sequence in the Eastern Tropical South Pacific. For this purpose, a detailed paleoceanographic survey took place at ∼17° S, an area that is less affected by processes that can produce sediment discontinuities. Six sediment cores were retrieved, two of which contained the most complete sediment sequences for the last 10000 years (Salvatteci et al., 2019).
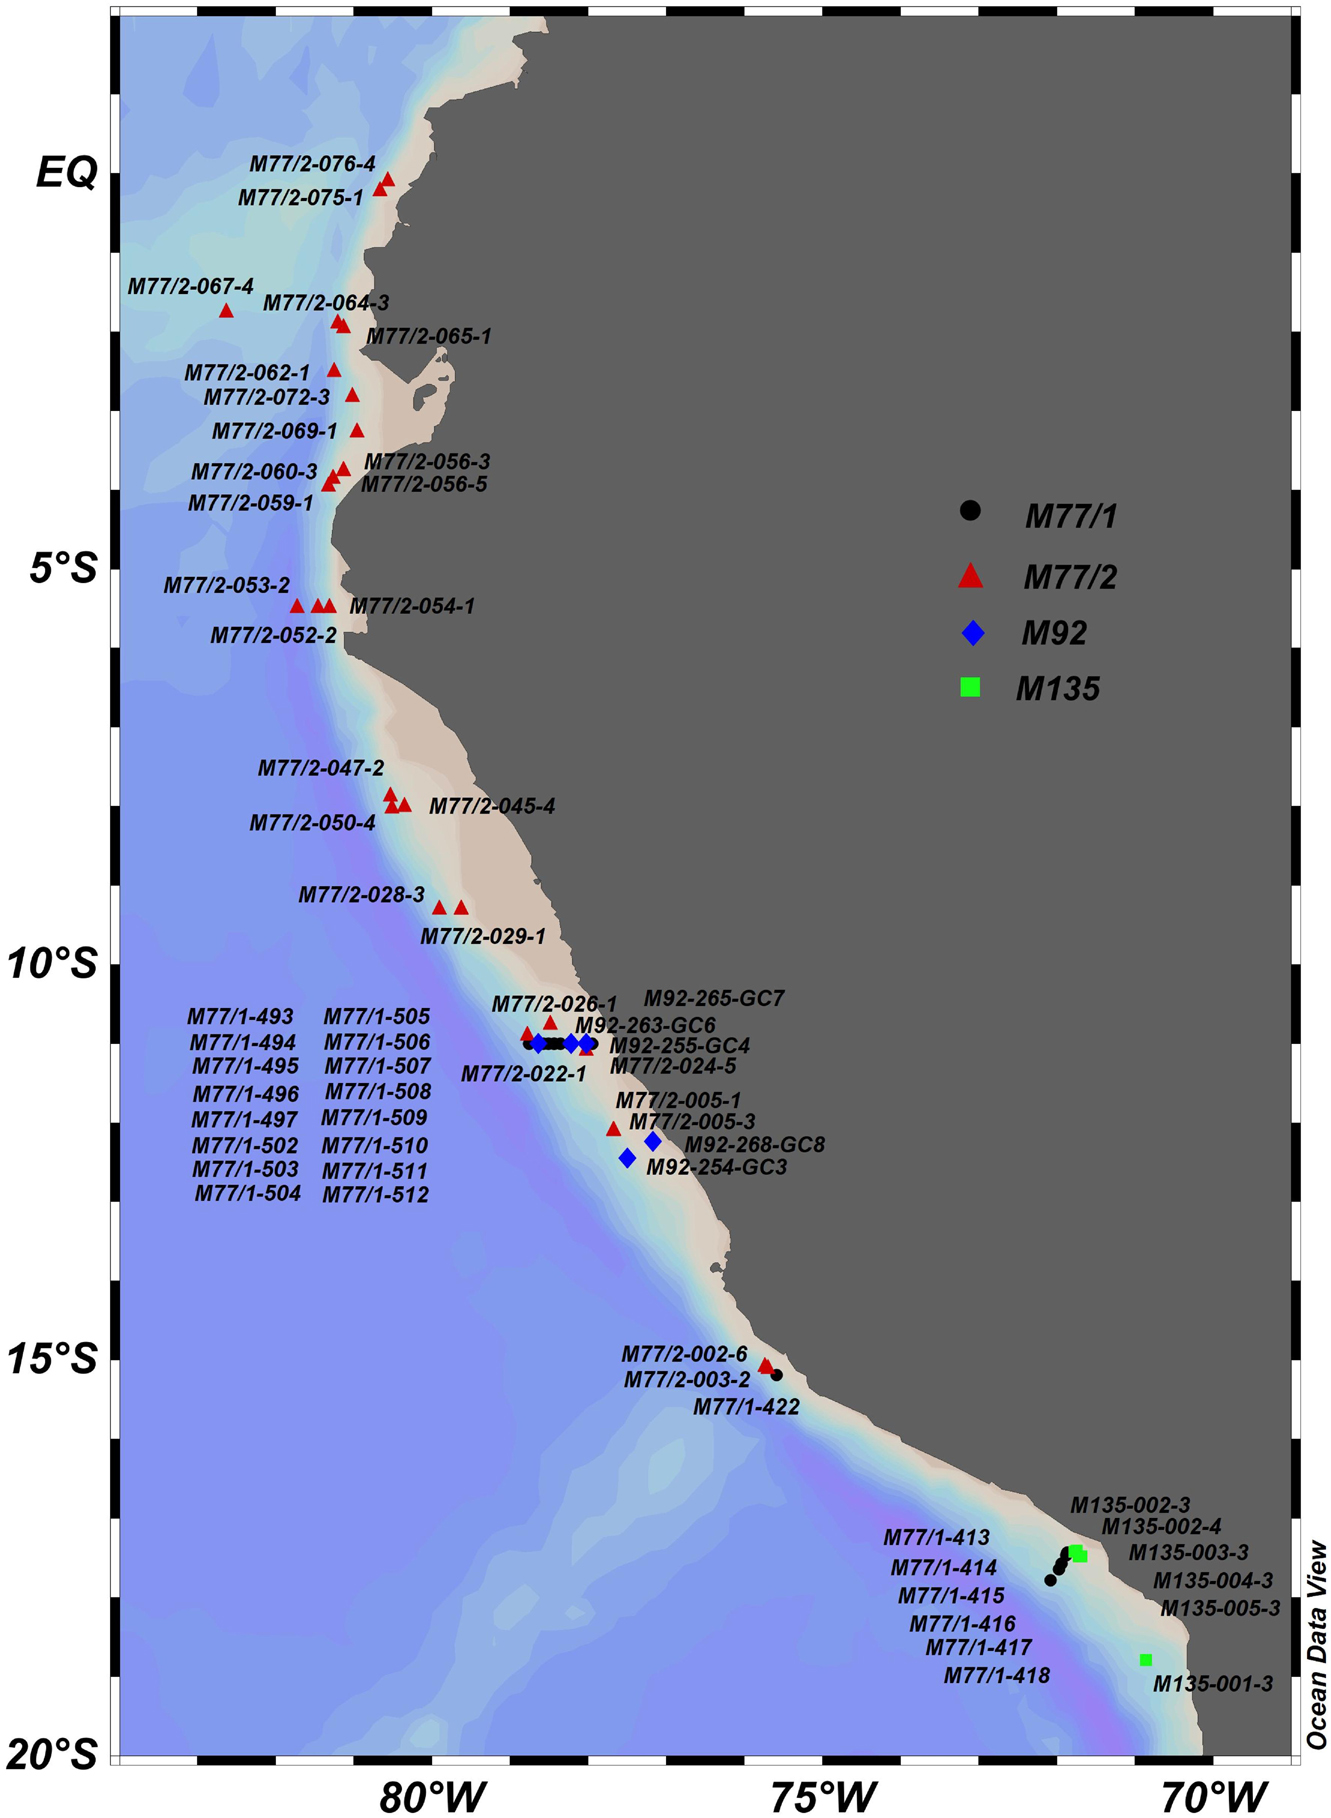
Figure 8. Map of the Eastern Tropical South Pacific showing the location of the gravity cores and piston cores taken during cruises M77/1 (black circles), M77/2 (red triangles), M92 (blue diamonds) and M135 (green squares).
Data from the gravity and piston cores collected during cruises M77/1, M77/2, M92, and M135 have been assembled by Salvatteci and Mehrtens (2021d); see Table 2 and Supplementary Table 24. A piston corer was used on cruise M77/2 while on M77/1, M92, and M135 a long gravity corer was employed. In total, 57 sediment cores were collected on the four cruises. The water depths of the sampling sites ranged from 144 to 2591 m; however, most of the cores were retrieved in the core of the OMZ, i.e., between ∼200 and ∼700 m depth. The average sediment recovery of the piston cores was 1168 cm. For the gravity cores, the average sediment recovery was 318 cm for M77/1 and 609 cm for M135. At the time of writing, these sediment cores have been used in 17 scientific publications that aim to understand climate and ocean variability and its effect on the OMZ at multiple timescales (Salvatteci and Mehrtens, 2021d; see Table 2 and Supplementary Table 24). Age models (Salvatteci and Mehrtens, 2021a; see Table 2 and Supplementary Table 25), X-Ray Fluorescence (XRF) measurements (Salvatteci and Mehrtens, 2021c; see Table 2 and Supplementary Table 26), and other geochemical records (Salvatteci and Mehrtens, 2021b; see Table 2 and Supplementary Table 27) have been assembled and published. In addition, core tops of near sediment surface cores from multiple-corers (MUCs) have been used to establish local calibrations for several paleoproxies, such as redox-sensitive elements in foraminifera (i.e., Mn/Ca, I/Ca, and Fe/Ca), foraminiferal assemblages, and stable Mo and N isotopes (Glock and Mehrtens, 2021; see Table 2 and Supplementary Table 28).
Benthic Fluxes and Surface Sediment Sampling
In the Peruvian upwelling area, benthic biogeochemical fieldwork focused on the FS Meteor cruises M77/1, M77/2, M92, M136, and M137. Off Mauritania, benthic investigations were mainly conducted on FS Maria S. Merian cruise MSM17/4 and FS Meteor cruise M107 (Sommer et al., 2021; see Table 2 and Supplementary Table 29–35). Research questions addressed organic carbon degradation, associated element cycling, and solute fluxes in the benthic boundary layer in response to variable bottom water redox conditions and hydrodynamic forcing (e.g., Bohlen et al., 2011; Noffke et al., 2012; Dale et al., 2014, 2016, 2019, 2021; Lomnitz et al., 2016; Sommer et al., 2016; Schroller-Lomnitz et al., 2019; Loginova et al., 2020; Plass et al., 2020). Effects of variable bottom water conditions on seabed nutrient and trace metal release were studied during in situ and ex situ sediment incubations and the analysis of pore water geochemistry. Further emphasis was placed on resolving the imprint of specific microbial processes and foraminiferal metabolic activity on element turnover and exchange across the sediment water interface (e.g., Glock et al., 2013, 2019, 2020; Gier et al., 2016, 2017; Scholz et al., 2016, 2017). The results were further interpreted using benthic numerical models (e.g., Bohlen et al., 2011; Dale et al., 2014, 2015, 2016, 2017, 2019). The corresponding DOIs are listed in the Supplementary Table 29–35.
In situ Solute Fluxes Measured Using the Benthic Flux Lander BIGO
Benthic solute fluxes of major elements traversing the Peruvian OMZ at 11° S and 12° S were determined based on data measured in situ using the two Biogeochemical Observatories BIGO I and BIGO II during FS Meteor cruises M77/1-2 (2008, 11° S; see also Supplementary Table 29), M92 (2013, 12° S; see also Supplementary Table 31), M136 (2017, 12° S; see also Supplementary Table 34) and M137 (2017, 12° S; see also Supplementary Table 35). Solutes fluxes along a zonal transect at 18° N off Mauritania were determined during the FS Maria S. Merian cruise MSM17/4 in 2011 (see also Supplementary Table 30) and FS Meteor cruise M107 in 2014 (see also Supplementary Table 32). The landers are described in detail by Pfannkuche and Linke (2003) and Sommer et al. (2008; 2009; 2016). Note that during the cruises M77/1-2 the landers were named BIGO and BIGO T instead of the usual terminology of BIGO I and BIGO II.
During all cruises the basic functioning principle of the BIGO type lander was the same. However, for some measurements and experiments the lander set-up was modified slightly. Details of the modifications are provided in cruise reports and specific publications. In brief, the BIGO lander contained two circular flux chambers (internal diameter 28.8 cm, area 651.4 cm2). BIGO T contained only one flux chamber because the second one was replaced by the underwater mass spectrometer TETHYS, operated by R. Camilli (Woods Hole Oceanographic Institution). A TV-guided launching system allowed smooth emplacement of the observatories at selected sites on the sea floor. Several hours after the observatories were placed on the sea floor the chambers were slowly driven onto the sediment (∼30 cm h–1). During this initial time period, the water inside the flux chamber was periodically replaced with ambient bottom water. After the chamber was fully driven into the sediment, the chamber water was again replaced with ambient bottom water to flush out solutes that might have been released from the sediment during chamber insertion. The water volume enclosed by each benthic chamber was variable but typically ranged from 7 to 18 l. To determine benthic solute fluxes, four (M77/1, M77/2) or eight sequential water samples (M92, M107, M136, M137, MSM17/4) were removed periodically with glass syringes (volume of each syringe ∼ 46 to 47 ml). The syringes were connected to the chamber using 1 m long Vygon tubes. Prior to deployment, these tubes were filled with distilled water and care was taken to avoid enclosure of air bubbles. An additional syringe water sampler (four or eight sequential samples) was used to monitor the ambient bottom water. The sampling ports for ambient bottom water were positioned about 30–60 cm above the sediment-water interface.
For the measurement of the dinitrogen/argon ratio (N2/Ar), CO2 and/or dissolved inorganic carbon (DIC) concentrations on cruises M92, M107, M136, M137, and MSM17/4, water samples were pumped into four (M92, M107, and MSM17/4) or eight (M136 and M137) 750 mm long glass tubes with an internal diameter of 4.6 mm (volume ∼12.5 ml) using self-constructed underwater peristaltic pumps. Prior to deployment, each glass tube was filled with distilled water that was completely replaced by the sample without dilution. Four (M92 and MSM17/4) or eight tubes (M136, M137, and M107) were used to sample each chamber and the ambient bottom water. During all cruises, the incubations at the sea floor were conducted for time periods of at least 24 h and to up 48 h, defined as the time interval between insertion of the chamber into the sediment and filling of the last syringe. Immediately after retrieval of the observatories, the water samples were transferred to the on-board cool room for further sample processing.
Dissolved O2 concentrations in each chamber and in the ambient bottom water were measured using optodes (Aanderaa Systems; Tengberg et al., 2006). As reported by Tengberg et al. (2006) the precision of the sensors was ±1 μM at higher O2 concentrations in the range of 300–500 μM and improved (±0.5 μM) at O2 concentrations below 300 μM. Salinity effects on the measured O2 concentration were corrected internally by the optode using a salinity of 35. O2 concentrations were cross-calibrated with automated Winkler O2 measurements in parallel water samples. For the calculation of the total oxygen uptake (TOU), the linear part of the O2 time series after the start of the chamber incubation was used. In addition to O2, fluxes of nitrate (NO3–), nitrite (NO2–), ammonium (NH4+), phosphate (PO43), and silicic acid (H4SiO4) were measured routinely. During some lander deployments, further biogeochemical parameters such as sulfide (e.g., M92), dissolved organic matter (M136/M137), or trace metals (M136/M137) were measured.
Fluxes of routinely measured solutes were calculated from the linear increase or decrease of concentration versus time and the height of the water in each chamber. Starting with cruises M136 and M137, a logistic function in addition to linear regression was used to capture the occasional sigmoidal temporal trend of solute concentrations.
The landers were also equipped to recover the surface layer of the incubated sediment (∼10–15 cm), which serves as a check for sediment disruption during seafloor operations and chamber insertion. The sediment surface for most deployments during the cruises was intact and undisturbed. The sediment was routinely subsampled for geochemical pore water analysis and, depending on the specific goals of the cruise, for biological analyses (e.g., foraminifera, sulfur bacteria, bacterial metagenomic analyses, and viruses). Details of sampling and processing of water and sediment samples, as well as their geochemical analysis, are presented in the respective cruise reports (see Tables 1, 2) and specific publications (given above).
As indicated above, in addition to standard flux measurements of the natural system, during Meteor cruise M137 a series of in situ experiments was conducted. During these incubations, NO3– and O2 concentrations inside the benthic chamber were experimentally manipulated (cf. cruise report from M137; see Table 1). During cruises M136 and M137, the BIGO lander was slightly modified to enable trace metal measurements in the benthic chambers and in the bottom water (cooperation with F. Scholz, GEOMAR). To determine gradients of nutrients and trace metals within the benthic boundary layer, the BIGO was equipped with an extendable arm (cooperation with F. Scholz, GEOMAR). Subsequent to the placement of the lander on the seafloor, the arm unfolded and allowed water sampling at several heights above the seafloor. Water samples were collected in appropriate sampling bags.
Near-Surface Sediment Coring
Undisturbed sediment cores for the biogeochemical analysis of near surface sediment were retrieved using a multiple-corer (MUC) and using push-cores inserted into the sediment retrieved with the BIGO incubation chambers once on deck. The MUC was equipped with 6–8 Perspex liners, 60 cm long with an internal diameter of 10 cm. The MUC was lowered into the sediment with a speed of 0.3 m s–1 in all deployments. Once on the sea floor, the liners were pushed into the sediment under gravity by a set of lead weights. Penetration ranged from 10 to 50 cm depending on the sediment type. BIGO push-cores had a diameter of 10 cm and recovered around 5–20 cm of sediment. After retrieval, all cores were transferred to an on-board cool room set to the temperature of the bottom water and processed immediately. Supernatant bottom water of the MUC cores was sampled and filtered for subsequent analyses. In general, at least one MUC and one BIGO sediment core was collected at the same site, but not necessarily on the same day. Sub-sampling for redox-sensitive parameters (e.g., dissolved Fe, nutrients) was mainly achieved by sectioning the sediment cores inside an argon filled glove bag. The sampling depth resolution increased from 0.5 or 1 cm at the surface to 4 cm at larger depths. Sediment samples were then spun in a refrigerated centrifuge at 4000 g for 20 min to separate the porewater from the particulates. Subsequently, the porewater samples were filtered (0.2 μm cellulose-acetate syringe filters) under argon. In sandy sediments (MSM17/4, M107), rhizone samplers were used to extract porewaters. BIGO cores were sliced either under argon or ambient atmosphere depending on the cruise. Standard analytes measured in porewater included nutrients, trace metals, total alkalinity, major ions, and dissolved hydrogen sulfide.
Metabolic Rates of Benthic Microorganisms and Their Role in Benthic N-Cycling
Denitrification and oxygen respiration rates of benthic microorganisms (i.e., foraminifera) were measured during one cruise to the Peruvian OMZ (M137) and one research trip to the Swedish Gullmar Fjord (Woehle et al., 2018; Glock et al., 2019). The rates were calculated from linear steady-state gradients of nitrous oxide or oxygen in glass microcapsules (after Høgslund et al., 2008; Piña-Ochoa et al., 2010; Glock et al., 2019). Abundances of living benthic foraminifera were determined on three cruises to the Peruvian OMZ (Mallon et al., 2012; Glock et al., 2013; Erdem et al., 2020). Total abundances and individual metabolic rates were used to upscale to the total contribution of foraminifers to benthic N-fluxes and nitrate storage (Glock et al., 2013, 2019). On M137, intracellular phosphate storage was also investigated (Glock et al., 2020).
Summary
The SFB 754 project was a milestone for the investigation of biogeochemical and physical interactions in the tropical oceans. The extended period of funding granted by the German Research Foundation allowed for the development of a highly interdisciplinary research program that has lead to a wealth of new insights documented in a large number of publications, theses, and presentations. The open access publication of the large number of different data sets collected during the project can be expected to form a lasting legacy well beyond the project itself. We anticipate and look forward to many more publications and projects that will build upon this unique basis.
Data Availability Statement
The datasets presented in this study can be found in online repositories. The names of the repository/repositories and accession number(s) can be found in the article/Supplementary Material.
Author Contributions
Each of authors wrote subsections of the manuscript and provided data for the tables. GK combined the input and wrote the common sections. HM handled the data submissions to PANGAEA. All authors contributed to the article and approved the submitted version.
Funding
We gratefully acknowledge the financial support for the “Sonderforschungsbereich 754: Climate-Biogeochemistry Interactions in the Tropical Ocean” by the DFG. The main support for the cruises M91 and MSM18/3 came through the BMBF-funded joint projects SOPRAN I-III (FKZ 03F0462, 03F0611, and 03F0662). Cruise SO243 was mainly supported by the BMBF-funded project SO243 – ASTRA-OMZ (FKZ 03G0243A). Support for cruises ATA_IFMGEOMAR_4, M80/1, MSM18/2, MSM22, M130, and M145 came also through the BMBF-funded joint projects NORDATLANTIK, RACE, and RACE II (FKZ 03F0443B, 03F0651B, and 03F0729C). Cruises MSM22 and M105 received further support from the EU-funded project CARBOCHANGE (grant 264879).
Conflict of Interest
The authors declare that the research was conducted in the absence of any commercial or financial relationships that could be construed as a potential conflict of interest.
Publisher’s Note
All claims expressed in this article are solely those of the authors and do not necessarily represent those of their affiliated organizations, or those of the publisher, the editors and the reviewers. Any product that may be evaluated in this article, or claim that may be made by its manufacturer, is not guaranteed or endorsed by the publisher.
Acknowledgments
We would like to extend our sincere thanks to the authorities from the countries bordering the Eastern Tropical Pacific and the Tropical Atlantic for granting the permissions to conduct studies in their territorial waters. The captains and crews of the research vessels made our measurements possible with their much appreciated invariably skilled support. Principal investigators, scientists, students, technicians, administrators, and support personnel all worked together to form the SFB 754 and a big thank you goes to all of them. The Deutsche Forschungsgemeinschaft of course deserves our deep gratitude for making such long-term and large-scale science projects possible.
Supplementary Material
The Supplementary Material for this article can be found online at: https://www.frontiersin.org/articles/10.3389/fmars.2021.723304/full#supplementary-material
Footnotes
- ^ https://oceanrep.geomar.de/view/project_type/SFB754/
- ^ https://oceanrep.geomar.de/47369
- ^ https://www.sfb754.de/sfb754-osis
- ^ https://www.pangaea.de
- ^ https://www.pangaea.de/?q=sfb754
- ^ https://argo.ucsd.edu
- ^ https://www.geotraces.org
- ^ https://www.socat.info/
- ^ https://memento.geomar.de/
- ^ https://www.ncbi.nlm.nih.gov/
- ^ https://ecotaxa.obs-vlfr.fr/
References
Altabet, M., Ryabenko, E., Stramma, L., Wallace, D., Frank, M., Grasse, P., et al. (2012). An eddy-stimulated hotspot for fixed nitrogen-loss from the Peru oxygen minimum zone. Biogeosciences 9, 4897–4908. doi: 10.5194/bg-9-4897-2012
Arévalo-Martínez, D. L., Beyer, M., Krumbholz, M., Piller, I., Kock, A., Steinhoff, T., et al. (2013). A new method for continuous measurements of oceanic and atmospheric N2O, CO and CO2: performance of off-axis integrated cavity output spectroscopy (OA-ICOS) coupled to non-dispersive infrared detection (NDIR). Ocean Sci. 9, 1071–1087. doi: 10.5194/os-9-1071-2013
Arévalo-Martínez, D. L., and Mehrtens, H. (eds) (2021). Data From: SFB754 Underway Trace Gases Data. World Data Center PANGAEA.
Arévalo-Martínez, D. L., Steinhoff, T., Brandt, P., Körtzinger, A., Lamont, T., Rehder, G., et al. (2019). N2O emissions from the northern Benguela upwelling system. Geophys. Res. Lett. 46, 3317–3326. doi: 10.1029/2018GL081648
Baars, O., and Croot, P. L. (2015). Dissolved cobalt speciation and reactivity in the eastern tropical North Atlantic. Mar. Chem. 173, 310–319. doi: 10.1016/j.marchem.2014.10.006
Bach, L. T., Paul, A. J., Boxhammer, T., von, der Esch, E., Graco, M., et al. (2020). Factors controlling plankton community production, export flux, and particulate matter stoichiometry in the coastal upwelling system off Peru. Biogeosciences 17, 4831–4852. doi: 10.5194/bg-17-4831-2020
Bange, H. W., Arévalo-Martínez, D. L., de la Paz, M., Farías, L., Kaiser, J., Kock, A., et al. (2019). A harmonized Nitrous Oxide (N2O) ocean observation network for the 21st century. Front. Mar. Sci. 6:157. doi: 10.3389/fmars.2019.00157
Bender, M., Doney, S., Feely, R. A., Fung, I., Gruber, N., Harrison, R., et al. (2002). A Large-Scale CO2 Observing Plan: In Situ Oceans and Atmosphere (LSCOP), A Contribution to the Implementation of the U.S. Carbon Cycle Science Plan. Springfield VA: National Technical Information Service, 209.
Berx, B., Cunningham, S., von Appen, W.-J., Atamanchuk, D., Brown, P., Fraser, N., et al. (2019). Report on the Observational Potential of the TMAs. Available online at: https://doi.org/10.3289/atlantos_d3.18 (accessed August 25, 2021).
Bittig, H. C., Körtzinger, A., Neill, C., van Ooijen, E., Plant, J. N., Hahn, J., et al. (2018). Oxygen optode sensors: principle, characterization, calibration, and application in the ocean. Front. Mar. Sci. 4:429. doi: 10.3389/fmars.2017.00429
Bohlen, L., Dale, A. W., Sommer, S., Mosch, T., Hensen, C., Noffke, A., et al. (2011). Benthic nitrogen cycling traversing the Peruvian oxygen minimum zone. Geochim. Cosmochim. Acta 75, 6094–6111. doi: 10.1016/j.gca.2011.08.010
Bourbonnais, A., Altabet, M. A., Charoenpong, C. N., Larkum, J., Hu, H., Bange, H. W., et al. (2015). N-loss isotope effects in the Peru oxygen minimum zone studied using a mesoscale eddy as a natural tracer experiment. Global Biogeochem. Cy. 29, 793–811. doi: 10.1002/2014GB005001
Bourbonnais, A., Letscher, R. T., Bange, H. W., Echevin, V., Larkum, J., Mohn, J., et al. (2017). N2O production and consumption from stable isotopic and concentration data in the Peruvian coastal upwelling system. Global Biogeochem. Cy. 31, 678–698. doi: 10.1002/2016GB005567
Browning, T. J., Achterberg, E. P., Rapp, I., Engel, A., Bertrand, E. M., Tagliabue, A., et al. (2017). Nutrient co-limitation at the boundary of an oceanic gyre. Nature 551, 242–246. doi: 10.1038/nature24063
Bullister, J. L., and Weiss, R. F. (1988). Determination of CCl3F and CCl2F2 in seawater and air. Deep-Sea Res. 35, 839–853. doi: 10.1016/0198-0149(88)90033-7
Callbeck, C., Lavik, G., Stramma, L., Kuypers, M. M. M., and Bristow, L. (2017). Enhanced nitrogen loss by eddy-induced vertical transport in the offshore Peruvian oxygen minimum zone. PLoS One 12:e0170059. doi: 10.1371/journal.pone.0170059
Callbeck, C. M., Lavik, G., Ferdelman, T. G., Fuchs, B., Gruber-Vodicka, H. R., Hach, P. H., et al. (2018). Oxygen minimum zone ‘cryptic sulfur cycling’ sustained by offshore transport of key sulfur oxidizing bacteria. Nat. Commu. 9:1729. doi: 10.1038/s41467-018-04041-x
Chever, F., Rouxel, O. J., Croot, P. L., Ponzevera, E., Wuttig, K., and Auro, M. (2015). Total dissolvable and dissolved iron isotopes in the water column of the Peru upwelling regime. Geochim. Cosmochim. Acta 162, 66–82. doi: 10.1016/j.gca.2015.04.031
Croot, P. L., Heller, M. I., and Wuttig, K. (2019). Redox Processes Impacting the Flux of Iron(II) from Shelf Sediments to the OMZ along the Peruvian Shelf. ACS Earth Sp. Chem. 3, 537–549. doi: 10.1021/acsearthspacechem.8b00203
Croot, P. L., Hopwood, M. J., Rapp, I., and Mehrtens, H. (eds) (2021). Data From: SFB754 Trace Metal Concentrations of Water Samples. World Data Center PANGAEA. doi: 10.1594/PANGAEA.928126
Cutter, G., Andersson, P., Codispoti, L., Croot, P., Francois, R., Lohan, M., et al. (2014). Sampling and Sample-handling Protocols for GEOTRACES Cruises, V2.0. Toulouse: GEOTRACES International Project Office.
Czerny, J. M. S., Hauss, H., Löscher, C. R., and Riebesell, U. (2016). Dissolved N:P ratio changes in the eastern tropical North Atlantic: effect on phytoplankton growth and community structure. Mar. Ecol. Prog. Ser. 545, 49–62. doi: 10.3354/meps11600
Czeschel, R., Schütte, F., Weller, R. A., and Stramma, L. (2018). Transport, properties, and life cycles of mesoscale eddies in the eastern tropical South Pacific. Ocean Sci. 14, 731–750. doi: 10.5194/os-14-731-2018
Czeschel, R., Stramma, L., and Johnson, G. C. (2012). Oxygen decreases and variability in the eastern equatorial Pacific. J. Geophys. Res. 117:C11019. doi: 10.1029/2012JC008043
Czeschel, R., Stramma, L., Schwarzkopf, F. U., Giese, B. S., Funk, A., and Karstensen, J. (2011). Middepth circulation of the eastern tropical South Pacific and its link to the oxygen minimum zone. J. Geophys. Res. 116, C01015. doi: 10.1029/2010JC006565
Dale, A. W., Bourbonnais, A., Altabet, M., Wallmann, K., and Sommer, S. (2019). Isotopic fingerprints of benthic nitrogen cycling in the Peruvian oxygen minimum zone. Geochim. Cosmochim. Acta 245, 406–425. doi: 10.1016/j.gca.2018.10.025
Dale, A. W., Graco, M., and Wallmann, K. (2017). Strong and dynamic benthic-pelagic coupling and feedbacks in a coastal upwelling system (Peruvian shelf). Front. Mar. Sci. 4:29. doi: 10.3389/fmars.2017.00029
Dale, A. W., Paul, M., Clemens, D., Scholz, F., Schroller-Lomnitz, U., Wallmann, K., et al. (2021). Recycling and burial of biogenic silica in an open margin oxygen minimum zone. Global Biogeochem. Cycles 35:e2020GB006583. doi: 10.1029/2020GB006583
Dale, A. W., Sommer, S., Lomnitz, U., Bourbonnais, A., and Wallmann, K. (2016). Biological nitrate transport in sediments on the Peruvian margin mitigates benthic sulfide emissions and drives pelagic N loss during stagnation events. Deep-Sea Res. Pt. I 112, 123–136. doi: 10.1016/j.dsr.2016.02.013
Dale, A. W., Sommer, S., Lomnitz, U., Montes, I., Treude, T., Liebetrau, V., et al. (2015). Organic carbon production, mineralisation and preservation on the Peruvian margin. Biogeosciences 12, 1537–1559. doi: 10.5194/bg-12-1537-2015
Dale, A. W., Sommer, S., Ryabenko, E., Noffke, A., Bohlen, L., Wallmann, K., et al. (2014). Benthic nitrogen fluxes and fractionation of nitrate in the Mauritanian oxygen minimum zone (Eastern Tropical North Atlantic). Geochim. Cosmochim. Acta 134, 234–256. doi: 10.1016/j.gca.2014.02.026
Dengler, M., and Mehrtens, H. (eds) (2021). Data From: SFB754 Turbulence Measurements (MSS). World Data Center PANGAEA. doi: 10.1594/PANGAEA.926518
Desai, D., Schunck, H., Löser, J., and LaRoche, J. (2013). Fragment Recruitment on Metabolic Pathways (FROMP): comparative metabolic profiling of metagenomes and metatranscriptomes. Bioinformatics 29, 790–791. doi: 10.1093/bioinformatics/bts721
Dittmar, T., Cherrier, J., and Ludwichowski, K. U. (2009). “The analysis of amino acids in seawater,” in Practical Guidelines for the Analysis of Seawater, ed. O. Wurl (Boca Raton, FL: CRC Press), 67–77.
Ehlert, C., Grasse, P., Mollier-Vogel, E., Böschen, T., Franz, J., Souza, G., et al. (2012). Factors controlling the silicon isotope distribution in waters and surface sediments of the Peruvian coastal upwelling. Geochim. Cosmochim. Acta 99, 128–145. doi: 10.1016/j.gca.2012.09.038
Engel, A. (2009). “Determination of marine gel particles,” in Practical Guidelines for the Analysis of Seawater, ed. O. Wurl (Boca Raton, FL: CRC Press).
Engel, A., Borchard, C., Loginova, A. N., Meyer, J., Hauss, H., and Kiko, R. (2015). Effects of varied nitrate and phosphate supply on polysaccharidic and proteinaceous gel particles production during tropical phytoplankton bloom experiments. Biogeoscience 12, 5647–5665. doi: 10.5194/bg-12-5647-2015
Engel, A., and Galgani, L. (2016). The organic sea-surface microlayer in the upwelling region off the coast of Peru and potential implications for air-sea exchange processes. Biogeosciences 13, 989–1007. doi: 10.5194/bg-13-989-2016
Engel, A., and Händel, N. (2011). A novel protocol for determining the concentration and composition of sugars in particulate and in high molecular weight dissolved organic matter (HMW-DOM) in seawater. Mar. Chem. 127, 180–191. doi: 10.1016/j.marchem.2011.09.004
Engel, A., Loginova, A., Maßmig, M., and Mehrtens, H. (eds) (2021). Data From: SFB754 Dissolved Organic Matter, Cell Abundance, Extracellular Enzyme Rates, and Bacterial Production. World Data Center PANGAEA. doi: 10.1594/PANGAEA.926780
Engel, A., and Mehrtens, H. (eds) (2021). Data from: SFB754 Particulate Organic Matter and Pigment Analysis. World Data Center PANGAEA. doi: 10.1594/PANGAEA.926612
Engel, A., Wagner, H., Le Moigne, F. A., and Wilson, S. T. (2017). Particle export fluxes to the oxygen minimum zone of the eastern tropical North Atlantic. Biogeosciences 14, 1825–1838. doi: 10.5194/bg-14-1825-2017
Erdem, Z., Schönfeld, J., Glock, N., Dengler, M., Mosch, T., Sommer, S., et al. (2016). Peruvian sediments as recorders of an evolving hiatus for the last 22 thousand years. Quat. Sci. Rev. 137, 1–14. doi: 10.1016/j.quascirev.2016.01.029
Erdem, Z., Schönfeld, J., Rathburn, A. E., Pérez, M.-E., Cardich, J., and Glock, N. (2020). Bottom-water deoxygenation at the Peruvian margin during the last deglaciation recorded by benthic foraminifera. Biogeosciences 17, 3165–3182. doi: 10.5194/bg-17-3165-2020
Firing, E., and Hummon, J. M. (2010). “Ship-mounted acoustic doppler current profilers,” in The GO-SHIP Repeat Hydrography Manual: A Collection of Expert Reports and Guidelines, eds E. M. Hood, C. L. Sabine, and B. M. Sloyan (Lyon: ICPO).
Foltz, G. R., Hummels, R., Dengler, M., Perez, R. C., and Araujo, M. (2020). Vertical turbulent cooling of the mixed layer in the Atlantic ITCZ and trade wind regions. J. Geophys. Res. 125:e2019JC015529. doi: 10.1029/2019JC015529
Franz, J., Krahmann, G., Lavik, G., Grasse, P., Dittmar, T., and Riebesell, U. (2012a). Dynamics and stoichiometry of nutrients and phytoplankton in waters influenced by the oxygen minimum zone in the eastern tropical Pacific. Deep-Sea Res. Pt. I, 62, 20–31. doi: 10.1016/j.dsr.2011.12.004
Franz, J., Hauss, H., Sommer, U., Dittmar, T., and Riebesell, U. (2012b). Production, partitioning and stoichiometry of organic matter under variable nutrient supply during mesocosm experiments in the tropical Pacific and Atlantic Ocean. Biogeosciences 9, 4629–4643. doi: 10.5194/bgd-9-5755-2012
Frey, C., Bange, H. W., Achterberg, E. P., Jayakumar, A., Löscher, C. R., Arevalo-Martinez, D. L., et al. (2020). Regulation of nitrous oxide production in low-oxygen waters off the coast of Peru. Biogeosciences 17, 2263–2287. doi: 10.5194/bg-17-2263-2020
Garcia, H. E., Weathers, K., Paver, C. R., Smolyar, I., Boyer, T. P., Locarnini, R. A., et al. (2018). World Ocean Atlas 2018: Dissolved Oxygen, Apparent Oxygen Utilization, and Oxygen Saturation. Washington, D.C: U.S. Government Printing Office.
Gasol, J. M., and del Giorgio, P. A. (2000). Using flow cytometry for counting natural planktonic bacteria and understanding the structure of planktonic bacterial communities. Sci. Mar. 64, 197–224. doi: 10.3989/scimar.2000.64n2197
Gier, J., Löscher, C. R., Dale, A. W., Sommer, S., Lomnitz, U., and Treude, T. (2017). Benthic dinitrogen fixation traversing the oxygen minimum zone off mauritania (NW Africa). Front. Mar. Sci. 4:390. doi: 10.3389/fmars.2017.00390
Gier, J., Sommer, S., Löscher, C. R., Dale, A. W., Schmitz, R. A., and Treude, T. (2016). Nitrogen fixation in sediments along a depth transect through the Peruvian oxygen minimum zone. Biogeosciences 13, 4065–4080. doi: 10.5194/bg-13-4065-2016
Gledhill, M., and Van Den Berg, C. M. G. (1994). Determination of complexation of iron(III) with natural organic complexing ligands in seawater using cathodic stripping voltammetry. Mar. Chem. 47, 41–54. doi: 10.1016/0304-4203(94)90012-4
Glock, N., and Mehrtens, H. (eds) (2021). Data from: SFB754 core-top Calibrations of Paleo-Proxies, PANGAEA. doi: 10.1594/PANGAEA.927049
Glock, N., Romero, D., Roy, A. S., Woehle, C., Dale, A. W., Schönfeld, J., et al. (2020). A hidden sedimentary phosphate pool inside benthic foraminifera from the Peruvian upwelling region might nucleate phosphogenesis. Geochim. Cosmochim. Acta 289, 14–32. doi: 10.1016/j.gca.2020.08.002
Glock, N., Roy, A.-S., Weissenbach, J., Revsbech, N. P., et al. (2019). Metabolic preference of nitrate over oxygen as an electron acceptor in foraminifera from the Peruvian oxygen minimum zone. Proc. Natl. Acad. Sci. U S A. 116, 2860–2865. doi: 10.1073/pnas.1813887116
Glock, N., Schönfeld, J., Eisenhauer, A., Hensen, C., Mallon, J., and Sommer, S. (2013). The role of benthic foraminifera in the benthic nitrogen cycle of the Peruvian oxygen minimum zone. Biogeosciences 10, 4767–4783. doi: 10.5194/bg-10-4767-2013
Gorsky, G., Ohman, M. D., Picheral, M., Gasparini, S., Stemmann, L., Romagnan, J.-B., et al. (2010). Digital zooplankton image analysis using the ZooScan integrated system. J. Plankt. Res. 32, 285–303. doi: 10.1093/plankt/fbp124
Grasse, P., Bosse, L., Hathorne, E. C., Böning, P., Pahnke, K., and Frank, M. (2017). Short-term variability of dissolved rare earth elements and neodymium isotopes in the entire water column of the Panama Basin. Earth Planet. Sci. Lett. 475, 242–253. doi: 10.1016/j.epsl.2017.07.022
Grasse, P., Ehlert, C., and Frank, M. (2013). The influence of water mass mixing on the dissolved Si isotope composition in the Eastern Equatorial Pacific. Earth Planet. Sci. Lett. 380, 60–71. doi: 10.1016/j.epsl.2013.07.033
Grasse, P., Hauss, H., and Mehrtens, H. (eds) (2021). Data from: SFB754 Stable and Radiogenic Isotope(measurements). Los Angeles, CA: World Data Center PANGAEA, doi: 10.1594/PANGAEA.926530
Grasse, P., and Mehrtens, H. (eds) (2021). Data From: SFB754 Stable and Radiogenic Isotope Measurements. PANGAEA: World Data Center. doi: 10.1594/PANGAEA.926530
Grasse, P., Ryabenko, E., Ehlert, C., Altabet, M. A., and Frank, M. (2016). Silicon and nitrogen cycling in the upwelling area off Peru: a dual isotope approach. Limnol. Oceanogr. 61, 1661–1676. doi: 10.1002/lno.10324
Grasse, P., Stichel, T., Stumpf, R., Stramma, L., and Frank, M. (2012). The distribution of neodymium isotopes and concentrations in the Eastern Equatorial Pacific: water mass advection versus particle exchange. Earth Planet. Sci. Lett. 353, 198–207. doi: 10.1016/j.epsl.2012.07.044
Großkopf, T., Mohr, W., Baustian, T., Schunck, H., Gill, D., Kuypers, M. M. M., et al. (2012). Doubling of marine dinitrogen-fixation rates based on direct measurements. Nature 488, 361–364. doi: 10.1038/nature11338
Hahn, J., Brandt, P., Greatbatch, R. J., Krahmann, G., and Körtzinger, A. (2014). Oxygen variance and meridional oxygen supply in the tropical North East Atlantic oxygen minimum zone. Climate Dynamics 43, 2999–3024. doi: 10.1007/s00382-014-2065-0
Hahn, J., Krahmann, G., and Mehrtens, H. (eds) (2021). Data from: SFB754(moorings) 2006-2018. World Data Center PANGAEA. doi: 10.1594/PANGAEA.926545
Hansen, H. P., and Koroleff, F. (1999). “Determination of nutrients,” in Methods of Seawater Analysis, ed. K. Grasshof (Hoboken, NJ: Wiley).
Hathorne, E., Haley, B., Stichel, T., Grasse, P., Zieringer, M., and Frank, M. (2012). Online preconcentration ICP-MS analysis of rare earth elements in seawater. Geochem. Geophy. Geosy. 13, 1–12. doi: 10.1029/2011gc003907
Hauss, H., Franz, J. M., and Sommer, U. (2012). Changes in N: pstoichiometry influence taxonomic composition and nutritional quality of phytoplankton in the Peruvian upwelling. J. Sea Res. 73, 74–85. doi: 10.1016/j.seares.2012.06.010
Hauss, H., Kiko, R., and Mehrtens, H. (eds) (2021a). Data from: SFB754 Multinet Zooplankton Distribution. World Data Center PANGAEA. doi: 10.1594/PANGAEA.926794
Hauss, H., Kiko, R., Löscher, C. R., and Mehrtens, H. (eds) (2021b). Data from: SFB754 Nutrient Amendment Experiments. World Data Center PANGAEA. doi: 10.1594/PANGAEA.927042
Høgslund, S., Revsbech, N. P., Cedhagen, T., Nielsen, L. P., and Gallardo, V. A. (2008). Denitrification, nitrate turn over, and aerobic respiration by benthic foraminiferans in the oxygen minimum zone off Chile. J. Exp. Mar. Biol. Ecol. 359, 85–91. doi: 10.1016/j.jembe.2008.02.015
Holmes, R. M., Aminot, A., Kérouel, R., Hooker, B. A., and Peterson, B. J. (1999). A simple and precise method for measuring ammo-nium in marine and freshwater ecosystems. Can. J. Fish. Aquat.Sci. 56, 1801–1808. doi: 10.1139/cjfas-56-10-1801
Holtappels, M., Tiano, L., Kalvelage, T., Lavik, G., Revsbech, N. P., and Kuypers, M. M. M. (2014). Aquatic respiration rate measurements at low oxygen concentrations. PLoS One 9:e89369. doi: 10.1371/journal.pone.0089369
Hoppe, H.-G. (1983). Significance of exoenzymatic activities in the ecology of brackish water: measurements by means of methylumbelliferyl-substrates. Mar. Ecol.-Prog. Ser. 11, 299–308. doi: 10.3354/meps011299
Hu, H., Bourbonnais, A., Larkum, J., Bange, H. W., and Altabet, M. A. (2016). Nitrogen cycling in shallow low oxygen coastal waters off Peru from nitrite and nitrate nitrogen and oxygen isotopes. Biogeosciences 13, 1453–1468. doi: 10.5194/bg-13-1453-2016
Hydes, D. J., Aoyama, M., Aminot, A., Bakker, K., Becker, S., Coverly, S., et al. (2010). “The GO-SHIP repeat hydrography manual: a collection of expert reports and guidelines. version 1,” in Recommendations for the Determination of Nutrients in Seawater to High Levels of Precision and Inter-Comparability using Continuous Flow Analysers, eds E. M. Hood, C. L. Sabine, and B. M. Sloyan (Lyon: ICPO).
Kalvelage, T., Jensen, M. M., Contreras, S., Revsbech, N. P., Lam, P., Günter, M., et al. (2011). Oxygen sensitivity of anammox and coupled N-cycle processes in oxygen minimum zones. PLoS One 6:e29299. doi: 10.1371/journal.pone.0029299
Kalvelage, T., Lavik, G., Jensen, M. M., Revsbech, N. P., Löscher, C. R., Schunck, H., et al. (2015). Aerobic microbial respiration in oceanic oxygen minimum zones. PLoS One 10:e0133526. doi: 10.1371/journal.pone.0133526
Kalvelage, T., Lavik, G., Lam, P., Contreras, S., Arteaga, L., Löscher, C., et al. (2013). Nitrogen cycling driven by organic matter export in the south pacific oxygen minimum zone. Nature Geosci. 6, 228–234. doi: 10.1038/ngeo1739
Kawano, T. (2010). “Method for salinity (Conductivity Ratio) measurement,” in The GO-SHIP Repeat Hydrography Manual: A Collection of Expert Reports and Guidelines, eds E. M. Hood, C. L. Sabine, and B. M. Sloyan (Lyon: ICPO).
Kiko, R., Brandt, P., Christiansen, S., Faustmann, J., Kriest, I., Rodrigues, E., et al. (2020). Zooplankton-Mediated fluxes in the eastern tropical North Atlantic. Front. Mar. Sci. 7:358. doi: 10.3389/fmars.2020.00358
Kiko, R., and Hauss, H. (2019). On the estimation of zooplankton-mediated active fluxes in Oxygen Minimum Zone regions. Front. Mar. Sci. 6:741. doi: 10.3389/fmars.2019.00741
Kiko, R., Hauss, H., Buchholz, F., and Melzner, F. (2016). Ammonium excretion and oxygen respiration of tropical copepods and euphausiids exposed to oxygen minimum zone conditions. Biogeosciences 13, 2241–2255. doi: 10.5194/bg-13-2241-2016
Kiko, R., Hauss, H., Dengler, M., Sommer, S., and Melzner, F. (2015). The squat lobster Pleuroncodes monodon tolerates anoxic “dead zone” conditions off Peru. Mar. Biol. 162, 1913–1921. doi: 10.1007/s00227-015-2709-6
Kiko, R., Hauss, H., and Mehrtens, H. (eds) (2021a). Data from: SFB754 Zooplankton and Particle Distribution from UVP5 measurements. World Data Center PANGAEA. doi: 10.1594/PANGAEA.927040
Kiko, R., Hauss, H., and Mehrtens, H. (eds) (2021b). Data from: SFB754 Zooplankton Respiration and Ammonium Excretion. World Data Center PANGAEA. doi: 10.1594/PANGAEA.927041
Kirchman, D., K’nees, E., and Hodson, R. (1985). Leucine incorporation and its potential as a measure of protein synthesis by bacteria in natural aquatic systems. Appl. Environ. Microbiol. 49, 599–607. doi: 10.1128/AEM.49.3.599-607.1985
Knauer, G. A., Martin, J. H., and Bruland, K. W. (1979). Fluxes of particulate carbon, nitrogen, and phosphorus in the upper water column of the northeast Pacific. Deep-Sea Res. 26, 97–108. doi: 10.1016/0198-0149(79)90089-X
Kock, A., Arévalo-Martínez, D. L., Löscher, C. R., and Bange, H. W. (2016). Extreme N2O accumulation in the coastal oxygen minimum zone off Peru. Biogeosciences 13, 827–840. doi: 10.5194/bg-13-827-2016
Krahmann, G., and Mehrtens, H. (eds) (2021a). Data from: SFB754 autonomous Glider Data. World Data Center PANGAEA. doi: 10.1594/PANGAEA.926547
Krahmann, G., and Mehrtens, H. (eds) (2021b). Data from: SFB754 CTD Data and Additional Sensors used on the CTDO System. World Data Center PANGAEA. doi: 10.1594/PANGAEA.926065
Krahmann, G., and Mehrtens, H. (eds) (2021c). Data from: SFB754 Deployments of Oxygen-sensor Equipped ARGO Floats. World Data Center PANGAEA. doi: 10.1594/PANGAEA.926544
Krahmann, G., and Mehrtens, H. (eds) (2021d). Data from: SFB754 LADCP Data. World Data Center PANGAEA. doi: 10.1594/PANGAEA.926065
Krahmann, G., and Mehrtens, H. (eds) (2021e). Data from: SFB754 SADCP Data (velocities and backscatter). World Data Center PANGAEA. doi: 10.1594/PANGAEA.926521
Krahmann, G., and Mehrtens, H. (eds) (2021f). Data from: SFB754 Thermosalinograph (TSG) Measurements. World Data Center PANGAEA. doi: 10.1594/PANGAEA.926530
Krahmann, G., and Mehrtens, H. (eds) (2021g). Data from: SFB754 UCTD and Rapidcast Data. World Data Center PANGAEA. doi: 10.1594/PANGAEA.926529
Langdon, C. (2010). “Determination of dissolved oxygen in seawater by winkler titration using the amperometric technique,” in The GO-SHIP Repeat Hydrography Manual: A Collection of Expert Reports and Guidelines, eds E. M. Hood, C. L. Sabine, and B. M. Sloyan (Lyon: ICPO).
Lehette, P., and Hernández-León, S. (2006). Zooplankton biomass estimated from digitalized images in Antarctic waters: a calibration exercise. J. Geophys. Res. 111, 1–6. doi: 10.1029/2005JC002887
Lindroth, P., and Mopper, K. (1979). High performance liquid chromatographic determination of subpicomole amounts of amino acids by precolumn fluorescence derivatization with O-phthaldialdehyde. Anal. Chem. 51, 1667–1674. doi: 10.1021/ac50047a019
Loginova, A. N., Borchard, C., Meyer, J., Hauss, H., Kiko, R., and Engel, A. (2015). Effects of nitrate and phosphate supply on chromophoric and fluorescent dissolved organic matter in the Eastern Tropical North Atlantic: a mesocosm study. Biogeosciences 12, 6897–6914. doi: 10.5194/bg-12-6897-2015
Loginova, A. N., Dale, A. W., LeMoigne, F. A. C., Thomsen, S., Sommer, S., Wallmann, K., et al. (2020). Sediment release of dissolved organic matter to the oxygen minimum zone off Peru. Biogeosciences 17, 4663–4679. doi: 10.5194/bg-17-4663-2020
Loginova, A. N., Thomsen, S., Dengler, M., Lüdke, J., and Engel, A. (2019). Diapycnal dissolved organic matter supply into the upper Peruvian oxycline. Biogeosciences 16, 2033–2047. doi: 10.5194/bg-16-2033-2019
Loginova, A. N., Thomsen, S., and Engel, A. (2016). Chromophoric and fluorescent dissolved organic matter in and above the oxygen minimum zone off Peru. J. Geophys. Res.: Oceans 121, 7973–7990. doi: 10.1002/2016JC011906
Lomnitz, U., Sommer, S., Dale, A. W., Löscher, C. R., Noffke, A., Wallmann, K., et al. (2016). Benthic phosphorus cycling in the Peruvian oxygen minimum zone. Biogeosciences 13, 1367–1386. doi: 10.5194/bg-13-1367-2016
Löscher, C. R., Bourbonnais, A., Dekaezemacker, J., Charoenpong, C. N., Altabet, M. A., Bange, H. W., et al. (2016). N2 fixation in eddies of the eastern tropical South Pacific Ocean. Biogeosciences 13, 2889–2899. doi: 10.5194/bg-13-2889-2016
Löscher, C. R., Fischer, M. A., Neulinger, S. C., Philippi, M., Fiedler, B., Hauss, H., et al. (2015). Hidden biosphere in an oxygen-depleted Atlantic open ocean eddy reveals future implications of ocean deoxygenation on primary production in the eastern tropical North Atlantic. Biogeosciences 12, 7467–7482. doi: 10.5194/bg-12-7467-2015
Löscher, C. R., Großkopf, T., Desai, F., Gill, D., Schunck, H., Croot, P., et al. (2014). Facets of diazotrophy in the oxygen minimum zone waters off Peru. ISME J. 8, 2180–2192. doi: 10.1038/ismej.2014.71
Löscher, C. R., Kock, A., Könneke, M., LaRoche, J., Bange, H. W., and Schmitz, R. A. (2012). Production of oceanic nitrous oxide by ammonia-oxidizing archaea. Biogeosciences 9, 2419–2429. doi: 10.5194/bg-9-2419-2012
Löscher, C. R., and Mehrtens, H. (eds) (2021a). Data from: SFB754 Microbial Oxygen Consumption and Nitrogen Loss Processes. World Data Center PANGAEA. doi: 10.1594/PANGAEA.926785
Löscher, C. R., and Mehrtens, H. (eds) (2021b). Data from: SFB754 Nitrogen and Carbon Fixation and N-cycle Gene Abundance. World Data Center PANGAEA. doi: 10.1594/PANGAEA.926781
Löscher, C. R., Mohr, W., Bange, H. W., and Canfield, D. E. (2020). No nitrogen fixation in the Bay of Bengal? Biogeosciences 17, 851–864. doi: 10.5194/bg-17-851-2020
Mallon, J., Glock, N., and Schönfeld, J. (2012). “The response of benthic foraminifera to low-oxygen conditions of the Peruvian oxygen minimum zone,” in ANOXIA: Evidence for Eukaryote Survival and Paleontological Strategies, Cellular Origin, Life in Extreme Habitats and Astrobiology 21, eds A. V. Altenbach, J. M. Bernhard, and J. Seckbach (New York, NY: Springer), 305–321. doi: 10.1007/978-94-007-1896-8_16
Martínez-Pérez, C., Mohr, W., Löscher, C. R., Dekaezemacker, J., Littmann, S., Yilmaz, P., et al. (2016). The small unicellular diazotrophic symbiont, UCYN-A, is a key player in the marine nitrogen cycle. Nat. Microbiol. 1:16163. doi: 10.1038/nmicrobiol.2016.163
Maßmig, M., and Engel, A. (2021). Dissolved organic matter in the upwelling system off Peru: Imprints of bacterial activity and water mass characteristics. J. Geophys. Res. Biogeosci. 126:e2020JG006048. doi: 10.1029/2020JG006048
Maßmig, M., Lüdke, J., Krahmann, G., and Engel, A. (2020). Bacterial degradation activity in the eastern tropical South Pacific oxygen minimum zone. Biogeosciences 17, 215–230. doi: 10.5194/bg-17-215-2020
McIlvin, M. R., and Altabet, M. A. (2005). Chemical conversion of nitrate and nitrite to nitrous oxide for nitrogen and oxygen isotopic analysis in freshwater and seawater. Anal. Chem. 77, 5589–5595. doi: 10.1021/ac050528s
McTaggart, K. E., Johnson, G. J., Johnson, M. C., Delahoyde, F. M., and Swift, J. H. (2010). “Notes on CTD/O2 data acquisition and processing using seabird hardware and software,” in The GO-SHIP Repeat Hydrography Manual: A Collection of Expert Reports and Guidelines, eds E. M. Hood, C. L. Sabine, and B. M. Sloyan (Lyon: ICPO)
Meyer, J., Löscher, C. R., Neulinger, S. C., Reichel, A. F., Loginova, A., Borchard, C., et al. (2016). Changing nutrient stoichiometry affects phytoplankton production, DOP accumulation and dinitrogen fixation - a mesocosm experiment in the eastern tropical North Atlantic. Biogeosciences 13, 781–794. doi: 10.5194/bg-13-781-2016
Mohr, W., Grosskopf, T., Wallace, D. W., and LaRoche, J. (2010). Methodological underestimation of oceanic nitrogen fixation rates. PloS One 5:e12583. doi: 10.1371/journal.pone.0012583
Montoya, J. P., Voss, M., Kähler, P., and Capone, D. G. (1996). A simple, high-precision, high-sensitivity tracer assay for N2 fixation. Appl. Environ. Microbiol. 62, 986–993. doi: 10.1128/AEM.62.3.986-993.1996
Mortlock, R. A., and Fröhlich, P. N. (1989). A simple method for the rapid determination of biogenic opal in pelagic marine sediments. Deep-Sea Res., Part A 36, 1415–1426. doi: 10.1016/0198-0149(89)90092-7
Mullison, J. (2017). “Backscatter estimation using broadband acoustic doppler current profilers-updated,” in Proceedings of the ASCE Hydraulic Measurements & Experimental Methods Conference, (Durham, NH), 1–5.
Murphy, K. R., Stedmon, C. A., Graeber, D., and Bro, R. (2013). Fluorescence spectroscopy and multi-way techniques. PARAFAC, Anal. Methods 5, 6557–6566. doi: 10.1039/c3ay41160e
Noffke, A., Hensen, C., Sommer, S., Scholz, F., Bohlen, L., Mosch, T., et al. (2012). Benthic iron and phosphorus fluxes across the Peruvian oxygen minimum zone. Limnol. Oceanogr. 57, 851–867. doi: 10.4319/lo.2012.57.3.0851
Owens, W. B., and Wong, A. P. S. (2009). An improved calibration method for the drift of the conductivity sensor on autonomous CTD profiling floats by θ-S climatology. Deep-Sea Res. Pt. I 56, 450–457. doi: 10.1016/j.dsr.2008.09.008
Pfannkuche, O., and Linke, P. (2003). GEOMAR landers as long-term deep-sea observatories. Sea Technol. 44, 50–55.
Picheral, M., Colin, S., and Irisson, J.-O. (2017). EcoTaxa, a Tool for the Taxonomic Classification of Images. Availabel online at: http://ecotaxa.obs-vlfr.fr (accessed January 14, 2020)
Picheral, M., Guidi, L., Stemmann, L., Karl, D. M., Iddaoud, G., and Gorsky, G. (2010). The underwater vision profiler 5: an advanced Instrument for high spatial resolution studies of particle size spectra and zooplankton. Limnol. Oceanogr.-Meth. 8, 462–473. doi: 10.4319/lom.2010.8.462
Piña-Ochoa, E., Høgslund, S., Geslin, E., Cedhagen, T., Revsbech, N. P., Nielsen, L. P., et al. (2010). Widespread occurence of nitrate storage and denitrification among Foraminifera and Gromiida. Proc. Natl. Acad. Sci. U S A. 107, 1148–1153. doi: 10.1073/pnas.0908440107
Plass, A., Schlosser, C., Sommer, S., Dale, A. W., Achterberg, E. P., Scholz, F., et al. (2020). The control of hydrogen sulfide on benthic iron and cadmium fluxes in the oxygen minimum zone off Peru. Biogeosciences 17, 3685–3704. doi: 10.5194/bg-17-3685-2020
Prosser, C. L. (1961). “Oxygen: respiration and metabolism,” in Comparative Animal Physiology, eds C. L. Prosser and F. A. Brown (Philadelphia: Saunders), 165–211.
Rapp, I., Schlosser, C., Menzel Barraqueta, J. L., Wenzel, B., Lüdke, J., Scholten, J., et al. (2019). Controls on redox-sensitive trace metals in the Mauritanian oxygen minimum zone. Biogeosciences 16, 4157–4182. doi: 10.5194/bg-16-4157-2019
Rapp, I., Schlosser, C., Rusiecka, D., Gledhill, M., and Achterberg, E. P. (2017). Automated preconcentration of Fe, Zn, Cu, Ni, Cd, Pb, Co, and Mn in seawater with analysis using high-resolution sector field inductively-coupled plasma mass spectrometry. Anal. Chim. Acta 976, 1–13. doi: 10.1016/j.aca.2017.05.008
Ryabenko, E., Kock, A., Bange, H. W., Altabet, M. A., and Wallace, D. W. (2012). Contrasting biogeochemistry of nitrogen in the Atlantic and Pacific Oxygen Minimum Zones. Biogeosciences 9, 203–215. doi: 10.5194/bg-9-203-2012
Sakamoto, C. M., Johnson, K. S., and Coletti, L. J. (2009). Improved algorithm for the computation of nitrate concentrations in seawater using an in situ ultraviolet spectrophotometer. Limnol. Oceanogr.-Meth. 7, 132–143. doi: 10.4319/lom.2009.7.132
Sakamoto, C. M., Johnson, K. S., Coletti, L. J., and Jannasch, H. W. (2017). Pressure correction for the computation of nitrate concentrations in seawater using an in situ ultraviolet spectrophotometer. Limnol. Oceanogr.-Meth. 15, 897–902. doi: 10.1002/lom3.10209
Salvatteci, R., Field, D., Sifeddine, A., Ortlieb, L., Ferreira, V., Baumgartner, T., et al. (2014). Cross-stratigraphies from a seismically active mud lens off Peru indicate horizontal extensions of laminae, missing sequences, and a need for multiple cores for high resolution records. Mar. Geol. 357, 72–89. doi: 10.1016/j.margeo.2014.07.008
Salvatteci, R., Gutierrez, D., Sifeddine, A., Ortlieb, L., Druffel, E., Boussafir, M., et al. (2016). Centennial to millennial-scale changes in oxygenation and productivity in the Eastern Tropical South Pacific during the last 25 000 years. Quat. Sci. Rev. 131, 102–117. doi: 10.1016/j.quascirev.2015.10.044
Salvatteci, R., and Mehrtens, H. (eds) (2021a). Data from: SFB754 Age Models and Sedimentation Rates of Sediment Cores. World Data Center PANGAEA. doi: 10.1594/PANGAEA.927046
Salvatteci, R., and Mehrtens, H. (eds) (2021b). Data from: SFB754 Downcore Proxy records. World Data Center PANGAEA. doi: 10.1594/PANGAEA.927048
Salvatteci, R., and Mehrtens, H. (eds) (2021c). Data from: SFB754 downcore X-Ray Fluorescence (XRF) Measurements on Sediment Cores. World Data Center PANGAEA. doi: 10.1594/PANGAEA.927047
Salvatteci, R., and Mehrtens, H. (eds) (2021d). Data from: SFB754 long gravity cores and Piston Cores. World Data Center PANGAEA. doi: 10.1594/PANGAEA.927043
Salvatteci, R., Schneider, R. R., Blanz, T., and Mollier-Vogel, E. (2019). Deglacial to holocene ocean temperatures in the humboldt current system as indicated by alkenone paleothermometry. Geophys. Res. Lett. 46, 281–292. doi: 10.1029/2018gl080634
Schafstall, J., Dengler, M., Brandt, P., and Bange, H. (2010). Tidal-induced mixing and diapycnal nutrient fluxes in the Mauritanian upwelling region. J. Geophys. Res.-Oceans 115:C10014. doi: 10.1029/2009jc005940
Schlosser, C., Streu, P., Frank, M., Lavik, G., Croot, P. L., Dengler, M., et al. (2018). H2S events in the Peruvian oxygen minimum zone facilitate enhanced dissolved Fe concentrations. Sci. Rep. 8:12642. doi: 10.1038/s41598-018-30580-w
Scholz, F., Löscher, C. R., Fiskal, A., Sommer, S., Hensen, C., Lomnitz, U., et al. (2016). Nitrate-dependent iron oxidation limits iron transport in anoxic ocean regions. Earth Planet. Sci. Lett. 454, 272–281. doi: 10.1016/j.epsl.2016.09.025
Scholz, F., Siebert, C., Dale, A. W., and Frank, M. (2017). Intense molybdenum accumulation in sediments underneath a nitrogenous water column and implications for the reconstruction of paleo-redox conditions based on molybdenum isotopes. Geochim. Cosmochim. Acta 213, 400–417. doi: 10.1016/j.gca.2017.06.048
Schroller-Lomnitz, U., Hensen, C., Dale, A. W., Scholz, F., Clemens, D., Sommer, S., et al. (2019). Dissolved benthic phosphate, iron and carbon fluxes in the Mauritanian upwelling system and implications for ongoing deoxygenation. Deep-Sea Res. Pt. I 143, 70–84. doi: 10.1016/j.dsr.2018.11.008
Schunck, H., Lavik, G., Desai, D. K., Großkopf, T., Kalvelage, T., Löscher, C. R., et al. (2013). GiantHydrogen sulfide plume in the oxygen minimum zone off peru supports chemolithoautotrophy. PLoS One 8:e68661. doi: 10.1371/journal.pone.0068661
Shcherbina, A. Y., Rudnick, D. L., and Talley, L. D. (2005). Ice-draft profiling from bottom-mounted ADCP data. J. Atmos. Ocean. Technol. 22, 1249–1266. doi: 10.1175/jtech1776.1
Simon, M., and Azam, F. (1989). Protein content and protein synthesis rates of planktonic marine bacteria. Mar. Ecol.-Prog. Ser. 51, 201–213. doi: 10.3354/MEPS051201
Smith, D. C., and Azam, F. (1992). A simple, economical method for measuring bacterial protein synthesis rates in seawater using 3Hleucine. Mar. Microb. Food Web 6, 107–114.
Sommer, S., Dale, A., Lomnitz, U., and Mehrtens, H. (eds) (2021). Data from: SFB754 Benthic Work (BIGO and MUC geochemistry). Los Angeles, CA: World Data Center PANGAEA, doi: 10.1594/PANGAEA.927050
Sommer, S., Gier, J., Treude, T., Lomnitz, U., Dengler, M., Cardich, et al. (2016). Depletion of oxygen, nitrate and nitrite in the Peruvian oxygen minimum zone cause an imbalance of benthic nitrogen fluxes. Deep-Sea Res. Pt. I 112, 113–122. doi: 10.1016/j.dsr.2016.03.001
Sommer, S., Linke, P., Pfannkuche, O., Schleicher, T., Schneider, V., Deimling, J., et al. (2009). Seabed methane emissions and the habitat of frenulate tubeworms on the Captain Arutyunov mud volcano (Gulf of Cadiz). Mar. Ecol. Prog. Ser. 382, 69–86. doi: 10.3354/meps07956
Sommer, S., Türk, M., Kriwanek, S., and Pfannkuche, O. (2008). Gas exchange system for extended in situ benthic chamber flux measurements under controlled oxygen conditions: First application—Sea bed methane emission measurements at Captain Arutyunov mud volcano. Limnol. Oceanogr.-Meth. 6, 23–33. doi: 10.4319/lom.2008.6.23
Stedmon, C. A., and Bro, R. (2008). Characterizing dissolved organic matter fluorescence with parallel factor analysis: a tutorial. Limnol. Oceanogr.-Meth. 6, 572–579. doi: 10.4319/lom.2008.6.572
Stramma, L., Weller, R. A., Czeschel, R., and Bigorre, S. (2014). Eddies and an extreme water mass anomaly observed in the eastern south Pacific at the Stratus mooring. J. Geophys. Res. 119, 1068–1083. doi: 10.1002/2013JC009470
Swift, J. H. (2010). “Reference quality water sample data: notes on data acquisition,” in The GO-SHIP Repeat Hydrography Manual: A Collection of Expert Reports and Guidelines, eds E. M. Hood, C. L. Sabine, and B. M. Sloyan (Lyon: ICPO).
Tanhua, T., and Mehrtens, H. (eds) (2021). Data from: SFB754(Hydrochemical)Measurements from Water Samples. Los Angeles, CA: PANGAEA, doi: 10.1594/PANGAEA.926609
Tengberg, A., Hovdenes, J., Andersson, H. J., Brocandel, O., Diaz, R., Hebert, D., et al. (2006). Evaluation of a lifetime-based optode to measure oxygen in aquatic systems. Limnol. Oceanogr.-Meth. 4, 7–17. doi: 10.4319/lom.2006.4.7
Thomsen, S., Kanzow, T., Krahmann, G., Greatbatch, R., Dengler, M., and Lavik, G. (2016). The formation of a subsurface anticyclonic eddy in the Peru-Chile Undercurrent and its impact on the near-coastal salinity, oxygen and nutrient distributions. J. Geophys. Res.: Oceans. 121, 476–501. doi: 10.1002/2015JC010878
Thurnherr, A. M., Visbeck, M., Firing, E., King, B. A., Hummon, J. M., Krahmann, G., et al. (2010). “A manual for acquiring lowered doppler current profiler data,” in The GO-SHIP Repeat Hydrography Manual: A Collection of Expert Reports and Guidelines, eds C. L. Sabine and B. M. Sloyan (Lyon: ICPO).
Uchida, H., Johnson, G. C., and McTaggart, K. E. (2010). “CTD oxygen sensor calibration procedures,” in The GO-SHIP Repeat Hydrography Manual: A Collection of Expert Reports and Guidelines, eds E. M. Hood, C. L. Sabine, and B. M. Sloyan (Lyon: ICPO).
Ullman, D. S., and Hebert, D. (2014). Processing of underway CTD data. J. Atmosp. Ocean. Tech. 31, 984–998. doi: 10.1175/JTECH-D-13-00200.1
van de Flierdt, T., Pahnke, K., Amakawa, H., Andersson, P., Basak, C., Coles, B., et al. (2012). GEOTRACES intercalibration of neodymium isotopes and rare earth element concentrations in seawater and suspended particles. Part 1: reproducibility of results for the international intercomparison. Limnol. Oceanogr.-Meth. 10, 234–251. doi: 10.4319/lom.2012.10.234
Woehle, C., Roy, A.-S., Glock, N., Wein, T., Weissenbach, J., Rosenstiel, P., et al. (2018). A novel eukaryotic denitrification pathway in foraminifera. Curr. Biol. 28, 2536–2543. doi: 10.1016/j.cub.2018.06.027
Wuttig, K., Heller, M. I., and Croot, P. L. (2013). Pathways of superoxide (O2-) decay in the Eastern Tropical North Atlantic. Environ. Sci. Technol. 47, 10249–10256. doi: 10.1021/es401658t
Xie, R. C., Rehkämper, M., Grasse, P., van de Flierdt, T., Frank, M., and Xue, Z. (2019). Isotopic evidence for complex biogeochemical cycling of Cd in the eastern tropical South Pacific. Earth Planet. Sci. Lett. 512, 134–146. doi: 10.1016/j.epsl.2019.02.001
Zellweger, C., Steinbrecher, R., Laurent, O., Lee, H., Kim, S., Emmenegger, L., et al. (2019). Recent advances in measurement techniques for atmospheric carbon monoxide and nitrous oxide observations. Atmos. Meas. Tech. 12, 5863–5878. doi: 10.5194/amt-12-5863-2019
Keywords: biogeochemistry, oceanography, tropical ocean, oxygen, climate, oxygen minimum zone
Citation: Krahmann G, Arévalo-Martínez DL, Dale AW, Dengler M, Engel A, Glock N, Grasse P, Hahn J, Hauss H, Hopwood MJ, Kiko R, Loginova AN, Löscher CR, Maßmig M, Roy A-S, Salvatteci R, Sommer S, Tanhua T and Mehrtens H (2021) Climate-Biogeochemistry Interactions in the Tropical Ocean: Data Collection and Legacy. Front. Mar. Sci. 8:723304. doi: 10.3389/fmars.2021.723304
Received: 10 June 2021; Accepted: 16 August 2021;
Published: 28 September 2021.
Edited by:
Maria Ll. Calleja, Max Planck Institute for Chemistry, GermanyReviewed by:
Craig Alexander Carlson, University of California, Santa Barbara, United StatesDennis Arthur Hansell, University of Miami, United States
Copyright © 2021 Krahmann, Arévalo-Martínez, Dale, Dengler, Engel, Glock, Grasse, Hahn, Hauss, Hopwood, Kiko, Loginova, Löscher, Maßmig, Roy, Salvatteci, Sommer, Tanhua and Mehrtens. This is an open-access article distributed under the terms of the Creative Commons Attribution License (CC BY). The use, distribution or reproduction in other forums is permitted, provided the original author(s) and the copyright owner(s) are credited and that the original publication in this journal is cited, in accordance with accepted academic practice. No use, distribution or reproduction is permitted which does not comply with these terms.
*Correspondence: Gerd Krahmann, Z2tyYWhtYW5uQGdlb21hci5kZQ==