 Janice Natasha1*
 Brian L. Stockwell1
 Amandine D. Marie2,3
 John Hampton4
 Neville Smith4
 Simon Nicol4
 Ciro Rico5*
- 1Molecular Analytics Laboratory (MOANA-LAB), School of Agriculture, Geography, Environment, Ocean and Natural Sciences, The University of the South Pacific, Suva, Fiji
- 2ESE, Ecology and Ecosystems Health, Institute Agro, INRAE, Rennes, France
- 3Agence de Recherche Pour la Biodiversité à la Réunion, Saint-Gilles, France
- 4Oceanic Fisheries Programme, Pacific Community (SPC), Nouméa, New Caledonia
- 5Instituto de Ciencias Marinas de Andalucía (ICMAN), Consejo Superior de Investigaciones Científicas, Campus Universitario Río San Pedro, Puerto Real, Spain
The current management of the bigeye tuna (Thunnus obesus) fishery in the Western and Central Pacific Ocean (WCPO) is based on a “single-stock” paradigm. We investigated the spatial and temporal distribution of the neutral and potentially adaptive genetic diversity in samples collected from waters near Micronesia, Marshall, Phoenix and Gilbert Islands and French Polynesia using genotyping by sequence and single nucleotide polymorphisms (SNP). Analysis of 144 individuals and 2,682 SNP did not provide any substantial evidence to challenge the current assumption of panmixia in the WCPO using putatively neutral loci. However, there was a signal of potentially adaptive divergence (FST range 0.11–0.24) of samples collected in 2013 in the exclusive economic zone of the Phoenix Islands, possibly because of exposure to differing selective constraints. The geographic origin of these tuna remains to be determined, as the samples originate from tagging cruises that sample large schools of tuna, and some of those tuna have subsequently showed substantial movement. We highly recommend further studies involving large sample sizes of larvae and young-of-the-year across the region and over multiple years to uncover the underlying processes that are potentially driving adaptive divergence and to infer any biological significance it may have on conservation and management of tropical bigeye tuna fishery stock.
Introduction
The current management strategy for the Western and Central Pacific Ocean (WCPO) bigeye tuna (Thunnus obesus, Lowe 1839) fishery is based on a “single-stock” paradigm. However, the recent discovery of population structure using genomic analyses of yellowfin tuna (T. albacares) within the WCPO (Grewe et al., 2015; Pecoraro et al., 2018; Anderson et al., 2019a), the Atlantic Ocean (Pecoraro et al., 2018) and waters around South Africa (Mullins et al., 2018) suggest that investigations to understand the distribution in time and space of the genetic diversity in other fish with different life history traits is warranted. Factors such as larval behavior and dispersal due to ocean currents (Levin, 2006), oceanographic fronts (Galarza et al., 2009), retention of pelagic eggs and larvae by eddies and gyres in the ocean (Myksvoll et al., 2014), poor adjustment of larvae to their place of destination leading to isolation by adaptation (Nosil et al., 2009), geographic distance (Slatkin, 1993), sea-scape (Riginos et al., 2016), environmental variables (Riccioni et al., 2013; Benestan et al., 2016) and habitat geomorphology (Lal et al., 2017) could potentially limit gene flow in marine environments and lead to population structure. Of particular interest, is the use of loci under potential selection to assess the geographic and temporal distribution of adaptive genetic diversity to uncover levels of population structure and local adaptation in previously presumed panmictic or nearly genetically homogenous species (Gagnaire et al., 2015). For example, the evidence of within-ocean adaptive genetic divergence in yellowfin (Grewe et al., 2015; Mullins et al., 2018; Pecoraro et al., 2018) and albacore (T. alalunga) (Anderson et al., 2019b) underpins the need to understand the population structure over evolutionary and ecological scales for improved conservation and management of commercially important tunas.
The Pacific bigeye tuna is mainly abundant in the central and eastern Pacific Ocean (Leroy et al., 2015). Pacific bigeye tuna populations were previously considered to be over-exploited (Harley et al., 2015) and listed in the IUCN Red List of Threatened Species as vulnerable (Collette et al., 2011); however, more recent stock assessments based on a range of new information, including a better understanding of age and growth, report that the probability that the WCPO stock is currently in an over-exploited condition is low (McKechnie et al., 2017; Ducharme-Barth et al., 2020). At present, the management of bigeye tuna in the Pacific Ocean is conducted, by the relevant Regional Management Fisheries Organizations (RMFO), as two separate stocks. In the WCPO, the fishery is managed by the Western and Central Pacific Fisheries Commission (WCPFC), while in the Eastern Pacific Ocean (EPO), it is under the administrative responsibility of the Inter-American Tropical Tuna Commission (IATTC) (Kumar and Kocour, 2015). The split into two stocks has no biological basis and is purely a matter of governance. Extensive tagging data suggests three putative stock boundaries in the equatorial Pacific Ocean; western, central and eastern with higher levels of abundance and fidelity in eastern and western regions and six additional putative stocks in areas beyond 10°N and three in areas beyond 10°S (Schaefer et al., 2015; Moore et al., 2020a). The data also suggest that the equatorial Central Pacific region may behave as a transition zone between these stocks resulting in a “fluid” rather than hard delineation of stock boundaries (Schaefer et al., 2015; Moore et al., 2020a).
The current understanding of population genetic structure for the Pacific bigeye tuna is based on scant and outdated genetic data. Results of previous studies on population genetics of bigeye tunas using Tg blood group system (Suzuki et al., 1962), serum esterase (Fujino and Kang, 1968), PCR-RFLP of mtDNA and microsatellite generated distances (Grewe and Hampton, 1998) and polymorphism of sequence variations in mitochondrial Cyt b genes (Wu et al., 2014) are consistent with panmixia or indicate very weak population differentiation in the Pacific Ocean. A study of global genetic structure of bigeye tuna using mtDNA haplotype diversity indicated that samples from the Atlantic were genetically distinct from those found in Indian and Pacific Oceans (Bremer et al., 1998). This finding was also confirmed by Durand et al. (2005) and Gonzalez et al. (2008) who reported highly significant mtDNA haplotype frequency differences between Atlantic and Indian or Pacific Ocean samples. However, no significant differences were found among fish captured within oceans, or between Indo-Pacific stocks.
Genomic approaches have been introduced to uncover the distribution of the neutral and potentially adaptive genetic diversity of marine organisms using Next Generation Sequencing (NGS) for underlying environmentally constrained variations that might be under selective pressure (Allendorf et al., 2008). The so called “outlier loci” can unravel genetic differentiation patterns where neutral markers often remain uninformative. In addition, large datasets of neutral markers such as those obtained using genomic approaches can be more informative than small datasets for high gene flow species (Gagnaire et al., 2015). Outlier loci have been used to identify locally adapted populations and redefine conservation and management units in fish such as those depicted in FishPopTrace, a Pan-European project using state-of-the-science technology for sustainable fisheries (Nielsen et al., 2012). This approach is gaining popularity due to the efficiency of selection in opposing the homogenizing effect of migration in comparison to drift (Gagnaire et al., 2015).
In this study, we investigated the genetic structure and the possibility of adaptive divergence in bigeye tunas among five geographically distinct sampling areas across the WCPO and over a span of 3 years and including replicated temporal samples from the Marshall Islands. Using Single Nucleotide Polymorphisms (SNPs), we determined if the temporal and spatial distribution of the neutral and potentially adaptive genetic diversity supports the widely accepted paradigm of panmixia within ocean basins in bigeye tuna.
Materials and Methods
All methods and experimental protocols were approved by The University of the South Pacific’s (USP) Faculty of Science, Technology and Environment (FSTE) Research Committee and were carried out in accordance with their guidelines and regulations.
Sample Collection
Tissue samples were collected from muscle plug biopsies of bigeye tuna from five geographical locations across the exclusive economic zones (EEZs) of four island nations and territories, namely, Phoenix and Gilbert Islands of Kiribati, Republic of the Marshall Islands, French Polynesia, and Federated States of Micronesia in the WCPO. Samples were collected between 2011 and 2014 by observers on fishing vessels and by scientists during research tagging cruises (Figure 1 and Supplementary Table 1). The fish specimens were obtained for analysis from tissue samples archived in the Tissue Bank managed under the auspices of the Western and Central Fisheries Commission (WCPFC), in Noumea, New Caledonia. The samples were taken from an overall area spanning about 60 degrees of longitude and 20 degrees of latitude.
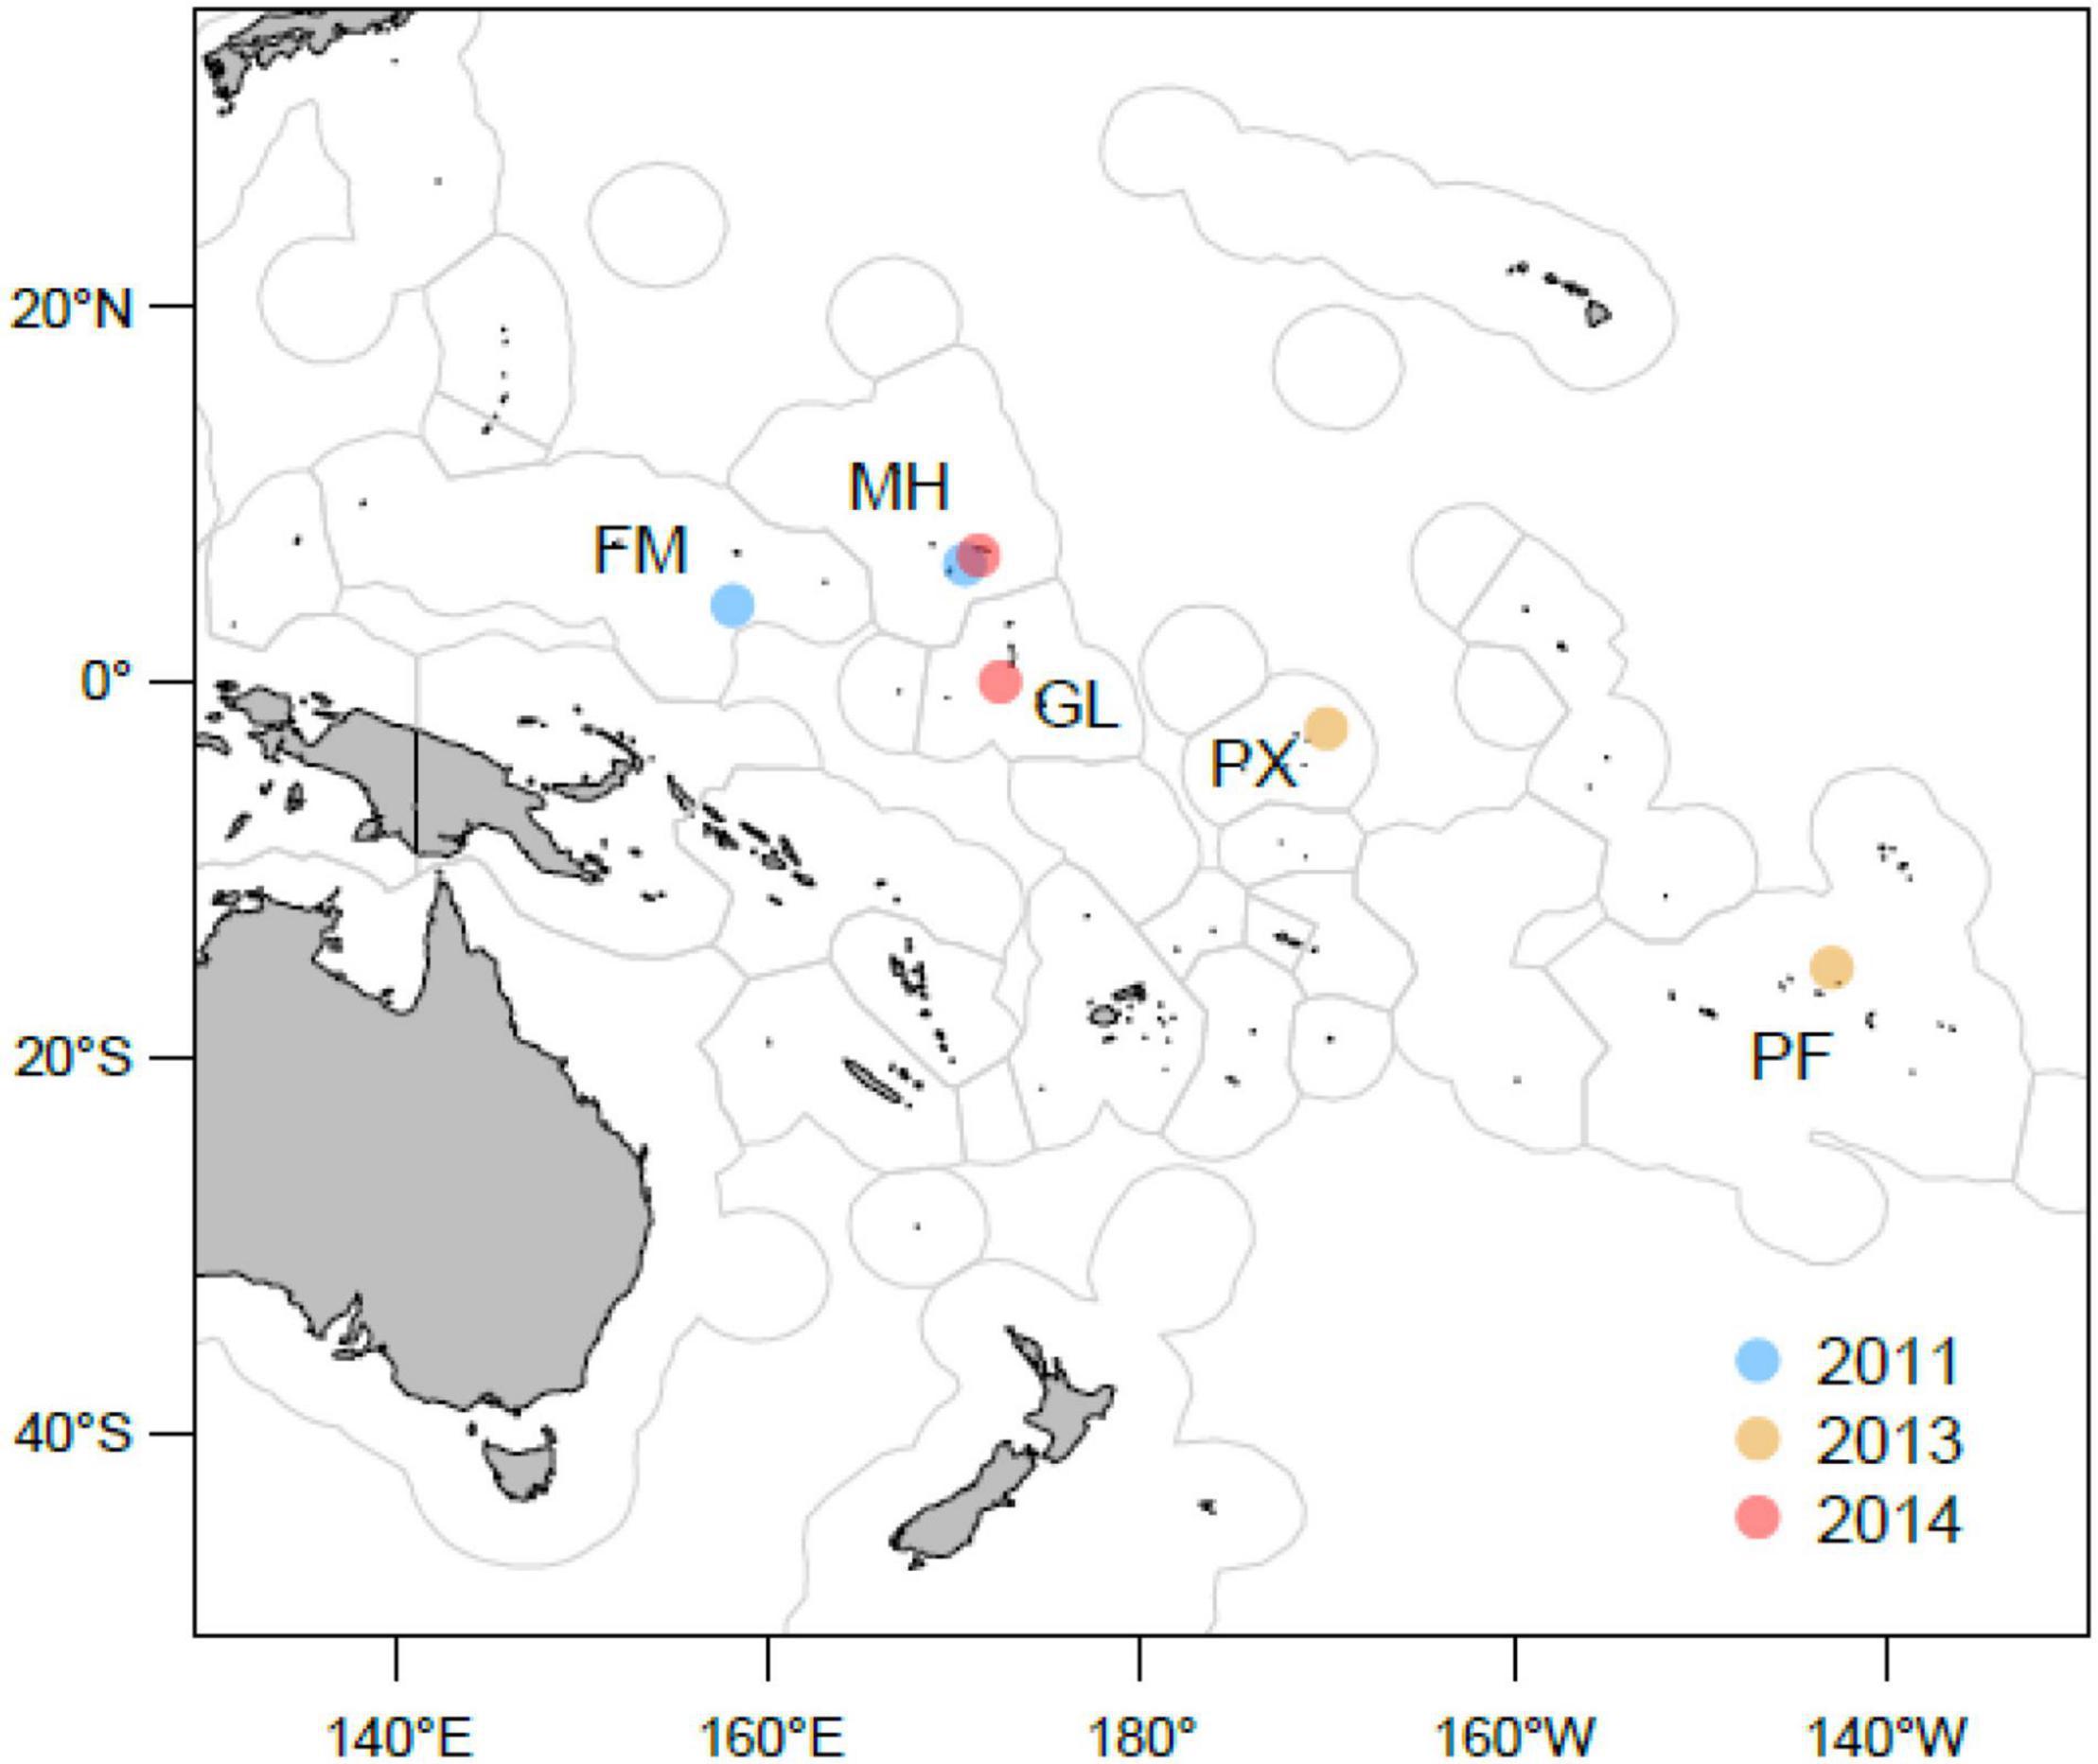
Figure 1. Locations of population samples in the WCPFC area used for genetic comparisons. Circles represent coordinates within 1° square where samples were collected. Samples of bigeye (T. obesus) were obtained by observers in commercial fishing vessels and tagging cruises in the exclusive economic zones (blue contour) of Federated States of Micronesia (FM), French Polynesia (PF), Gilbert (GL) and Phoenix (PX) Islands of Kiribati and Marshall Islands (MH). Color codes refer to the year were samples were collected. This figure was produced by Jed Macdonald from of the Secretariat of the Pacific Community (SPC) using ArcGIS V10.3.
Given the migratory nature of tunas we aimed to minimize the chances of analyzing individuals of the same population captured at different sites, months or years apart, by collecting three samples within 6 weeks of each other at different locations. We also selected two temporal samples collected in 2011 and 2014 in roughly the same area and season. Subsampling from the muscle plug biopsies was performed using sterilized surgical procedures to avoid cross contamination of tissue between samples. A summary of sample locations, numbers, average fork length and year caught is provided in Supplementary Table 1.
DArTseq Genotyping and Single Nucleotide Polymorphisms Quality Control
DNA extraction and sequencing was conducted by Diversity Arrays Technology PL (DArT). The genotyping protocols used for the current study are described in Anderson et al. (2019a,b). The returned dataset was further filtered for locus quality by removing all but one SNP per sequenced DNA fragment, any duplicate SNPs possessing identical Clone IDs and SNPs with a call rate below 95%; a minimum read depth of 7 and minor allele frequency (MAF) below 5%. Hardy Weinberg Equilibrium (HWE) for each locus in the primary dataset was assessed across all populations using the Arlequin v.3.5.1.3 software package using locus by locus test type, 10,000,000 steps in Markov chain and 100,000 dememorization steps (Excoffier et al., 2005). No single locus was found to deviate from HWE (P < 0.0001) across all populations and thus, no loci were removed after this filtering step. The raw and filtered dataset in Genepop file format analyzed for this study can be found in the Open Science Framework (OSF) repository (10.17605/OSF.IO/6ZRA3).
Outlier Detection
The polymorphic SNPs of all sample collections were screened together to detect outlier loci using three different methods. The first method involved the use of fixation index (FST) outlier approach developed by Beaumont and Nichols (1996) and implemented in LOSITAN (Antao et al., 2008). The Force mean FST option was selected to approximate desired mean FST by running a bisection algorithm over repeated 1,000,000 simulations, P-value of 0.95 and False Discovery Rate (FDR) of 10%. The detailed method of identification of outliers using this approach is outlined in Grewe et al. (2015). The second method involved the use of the Bayesian simulation-based test of Beaumont and Balding (2004) that has been further refined and implemented in the software BayeScan 2.1 (Foll, 2012) with default settings (burn-in = 50,000, sample size = 5,000, total iterations = 100,000, pilot runs = 20 × 5,000) and a FDR of 10%. The third method involved the use of software HacDivSel which employs the Extreme Outlier Set (EOS) test using a two-step heuristic algorithm to make pairwise population comparisons (Carvajal-Rodríguez, 2017). HacDivSel made 15 pairwise comparisons and generated outlier loci for each paired comparison.
Outlier SNPs generated from LOSITAN were used for the study. These outlier SNPs were removed from the primary dataset to generate a selectively neutral loci dataset (NL). Only candidates for directional selection (known as Loci Under Potential Selection, LUPS, hereafter) were retained for the study.
Population Genetics Structure: Neutral vs. Potentially Adaptive Divergence
Population structure analyses were carried out in parallel on putatively neutral and outlier loci panels to compare different patterns of population. Linkage disequilibrium (LD) for each pair of SNPs in selectively neutral dataset was tested in all population samples using PLINK1.9 (Chang et al., 2015). One locus from each pair of loci identified as linked with r2≥ 0.7 and was subsequently removed from the dataset. All population samples were filtered concurrently to allow comparison between populations.
Since relatedness among population samples can skew population structure results (Selwyn et al., 2016) and may also indicate contamination or duplication of DNA samples (Flickinger et al., 2015), we tested for the presence of full-sibling (FS) and half-sibling (HS) relationships from neutral SNP genotype data using TrioML with COANCESTRY (v. 1.01.7) (Wang, 2011). The filtered genotypes were run initially to estimate the degree of relatedness. The cut-off r-values for categorizing relatedness coefficients into full-sib (FS) and half-sib (HS) were determined by simulating 200 dyads in each group based on the allele frequencies generated from the initial run. The r cut-off values were used to identify the FS and HS in the empirical dataset. Individuals with the highest multilocus heterozygosity from each of the FS and HS pairs were excluded as a signal of potential contamination (Petrou et al., 2019) from the primary dataset. Since Petrou et al. (2019) found that contaminated samples of herring tend to have higher multilocus individual heterozygosity (HI > 0.4; median = 0.45), which in turn inflated the population structure, bigeye individuals with exceptionally high multilocus heterozygosity (HI > 0.4), regardless of its association with kin groups, were also removed to reduce potential biasness in estimating population structure. The final primary dataset was filtered for a second time using the same aforementioned SNP quality filtering steps and outlier loci detection but without potential bias introduced by potentially cross-contaminated individuals.
Filtered neutral loci datasets, obtained from the second round of dataset filtering, were subjected to descriptive population genetics analyses including observed, expected, and sample size-corrected multilocus heterozygosity averaged across all loci in Genetix v.4.05.2 (Belkhir et al., 2004). We tested deviations from HWE of the observed value of FIS using 1,000 permutations in Genetix v.4.05.2 (Belkhir et al., 2004). Through this procedure, FIS estimates from the real data are then compared with the distribution obtained by permutation of alleles within populations making it possible to obtain an estimate of the probability of obtaining a value > or = to the value observed under the null hypothesis (i.e., panmixia). Pairwise FST values were calculated for both neutral and outlier datasets at a significance level of 0.05, performed across 10,000 permutations to test for genetic differentiation among populations using the Arlequin v.3.5.1.3 software package (Excoffier et al., 2005). The sequential Bonferroni method (Rice, 1989) for multiple comparisons was applied to correct the significance level. Discriminant analysis of principle components (DAPC) (Jombart et al., 2010), a multivariate approach, was conducted on both datasets (NL and LUPS) and tested for alpha optimization (maximized inter-population variation given a minimum number of principle components). The main genetic clusters (k) were inferred using two methods. First, a k-means clustering was employed using the number of principle components retained by implementing the Bayesian Information Criterion (BIC) method with the use of adegenet function “find.clusters” using the Adegenet package v2.0.1 in R-studio (Jombart and Collins, 2015). Secondly, a model-based estimation of ancestry in unrelated individuals implemented in ADMIXTURE v. 1.3.0 software package was used (Alexander et al., 2009) which adopts the likelihood model embedded in structure and compares the cross-validation error (CV) to recommend k. Successive k-values from one to six were run on ADMIXTURE and the lowest associated CV error was selected as the best k. The k-value obtained was used for Monte Carlo assignment tests using functions “assign.MC” and “assign.kfold” performed in assignPOP (Chen et al., 2018) using a support vector machine (svm) predictive model. Since population genetic analyses suggest that temporal samples of Marshall Islands were genetically similar, they were pooled together into a single population for migration analysis. Gene flow among populations was estimated by calculating the directional relative migration using the neutral dataset on the web-based software application divMigrate-online (Sundqvist et al., 2016) based on the Nm (effective number of migrants) statistic (Alcala et al., 2014) and with alpha value of 0.05. Plots with only statistically significant asymmetric links between population pairs were generated by the software application.
Results
Single Nucleotide Polymorphisms Data Validation
The raw dataset contained 39,661 SNPs genotyped for 175 individuals across the six population samples of bigeye tuna. Upon strict quality control filtering, the final dataset contained 144 individuals with 2,682 putatively neutral loci across the sample collections (Table 1). A small number of individuals with high average observed heterozygosity were found to be kin with other individuals by TrioML algorithm for genetic relatedness (Supplementary Table 3). With no means to validate the exceptionally high heterozygosity in individuals of interest and the potential for the presence of kin groups to misrepresent population structure (Selwyn et al., 2016) or indicate contamination or duplication of DNA samples (Flickinger et al., 2015), all three individuals with Ho > 0.4 (Supplementary Table 2) and 7 other individuals with the highest multilocus heterozygosity and appearing more than once in the potential sibling-pairs were removed from the dataset. A total of 10 individuals were removed.

Table 1. Number of neutral loci remaining after each quality control filtering step.
Descriptive Genetic Diversity
The average number of alleles ranged from 1.97 to 1.99 in individuals caught from the five geographic locations. The observed (Ho) and expected (Hnb) multilocus heterozygosity ranged from 0.23 to 0.27 and from 0.25 to 0.26, respectively. While the Phoenix Island (2013) sample showed a heterozygote excess, the FIS value is not significantly different from zero. In contrast, inbreeding coefficients (FIS) for all other samples were significantly different from zero and ranged from 0.035 to 0.122 (Table 2).

Table 2. Bigeye tuna sampling information and genetic diversity indices.
Population Structure, Probability of Membership and Migration Patterns Based on Neutral Loci
Pairwise fixation index (FST) provided low estimates of genetic differentiation between the six sample collections (FST ranged from 0.001 to 0.004). Significant but marginal genetic differentiation (P < 0.007 after Bonferroni Correction, Table 3) was detected between samples collected from the Phoenix (2013) and Gilbert (2014) Islands in the EEZ of Kiribati (FST = 0.003, P = 0.001), Phoenix Island (2013) and French Polynesia (2013) (FST = 0.003, P = 0.006) and between the Gilbert (2014) and Marshall Islands (2011) (FST = 0.004, P = 0.002).
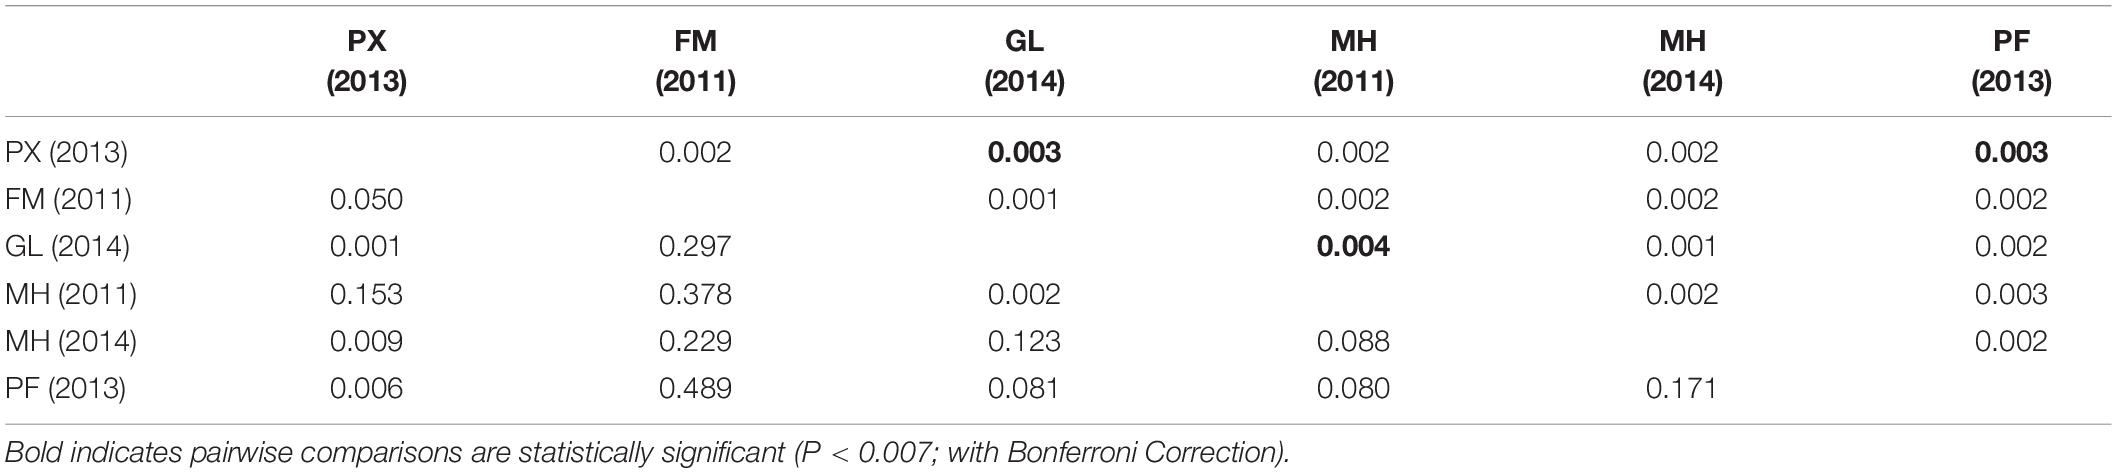
Table 3. Pairwise FST values (above diagonal) and associated P-values (below diagonal) between geographical population samples based on neutral loci (NL).
The analysis of individual clustering using the Bayesian Information Criterion (BIC) method and a comparison of cross-validation error values with successive values of k on ADMIXTURE (Table 4) detected the presence of one putative genetic cluster (k = 1) of bigeye tuna within the WCPO as also shown by the Discriminant Analysis of Principal Components (DAPC) (α-score optimized to retain 48 principal components (Figure 2A). Likewise, bigeye individuals from the six sample collections were poorly allocated as Monte-Carlo assignment accuracy ranged between 20 and 25% only (results not shown). Migration patterns based on neutral loci (Figure 3) showed high significant unidirectional gene flow in collections from same year (Figures 3A–C) and asymmetrical gene flow of bigeye individuals between the sample collection sites with migration coefficients ranging from 0.56 to 1 (Figure 3D).
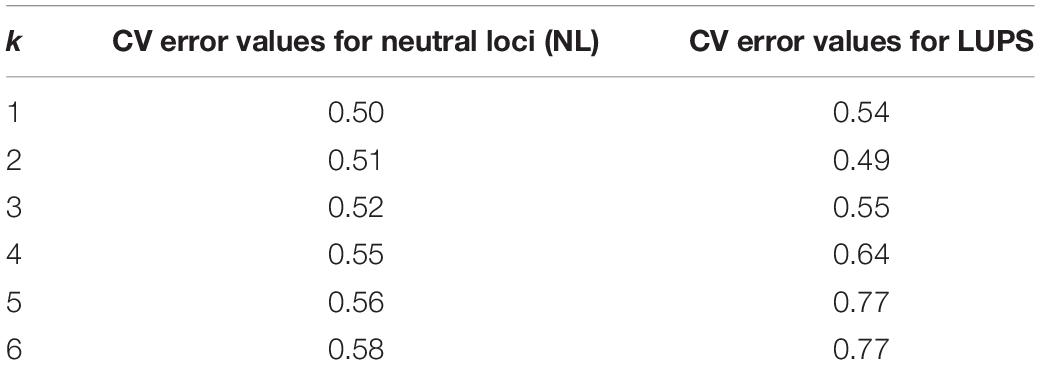
Table 4. Cross-validation error values for successive k of 1–6 on ADMIXTURE.
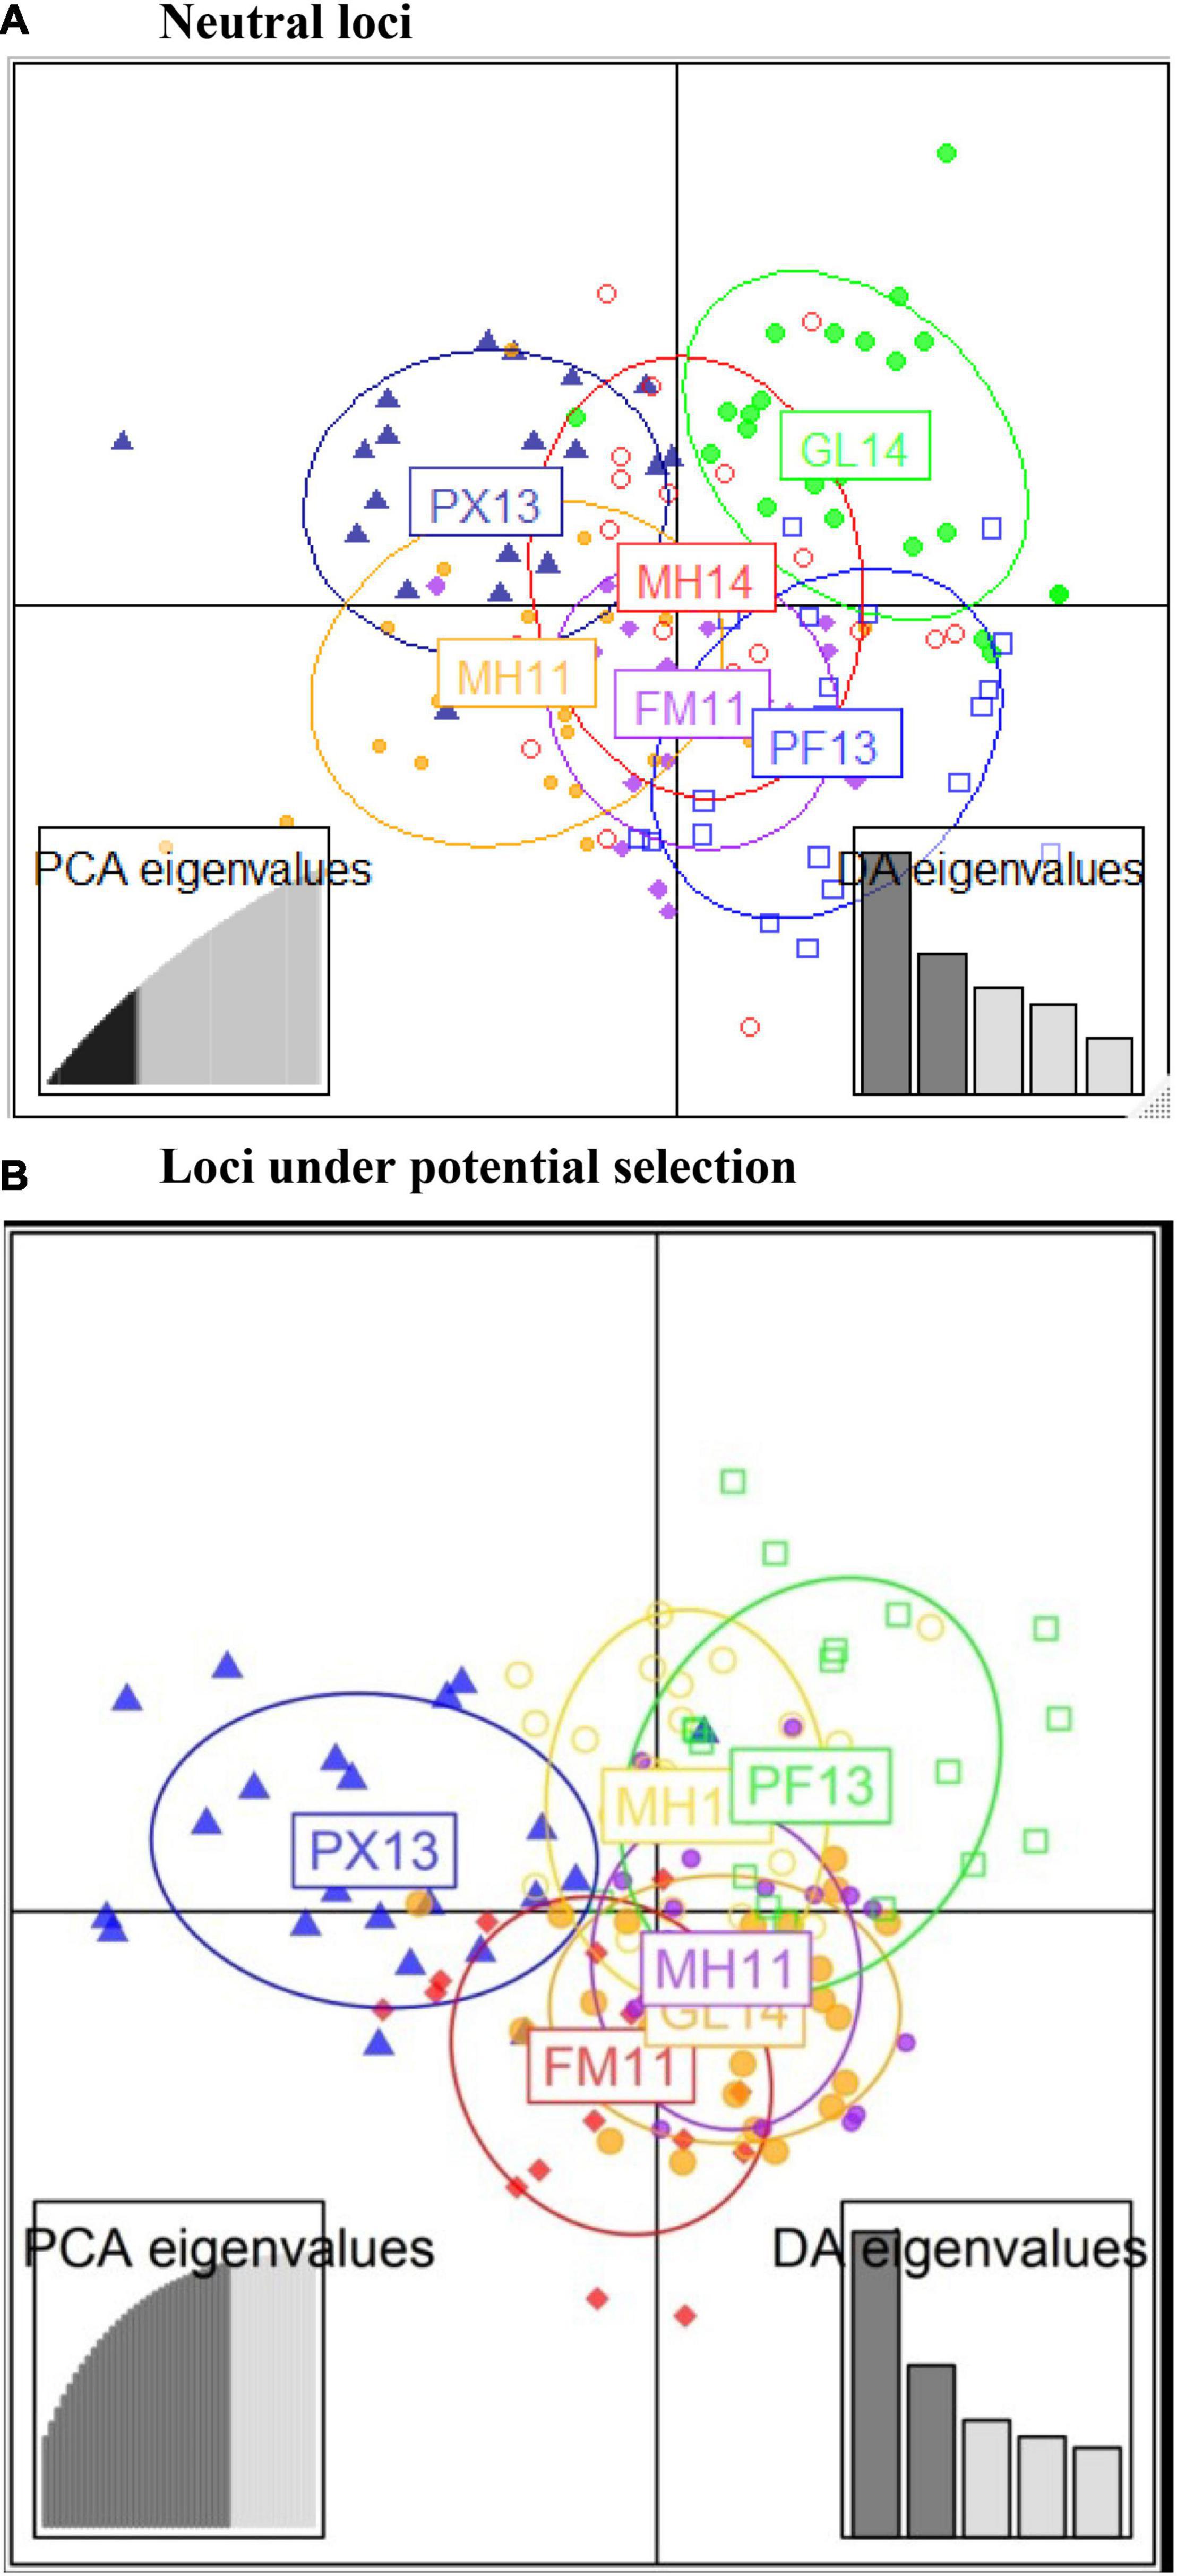
Figure 2. Discriminant analysis of principal components (DAPC) depicts the extent to which bigeye tuna individuals overlap between population clusters using (A) neutral and (B) outlier SNP loci.
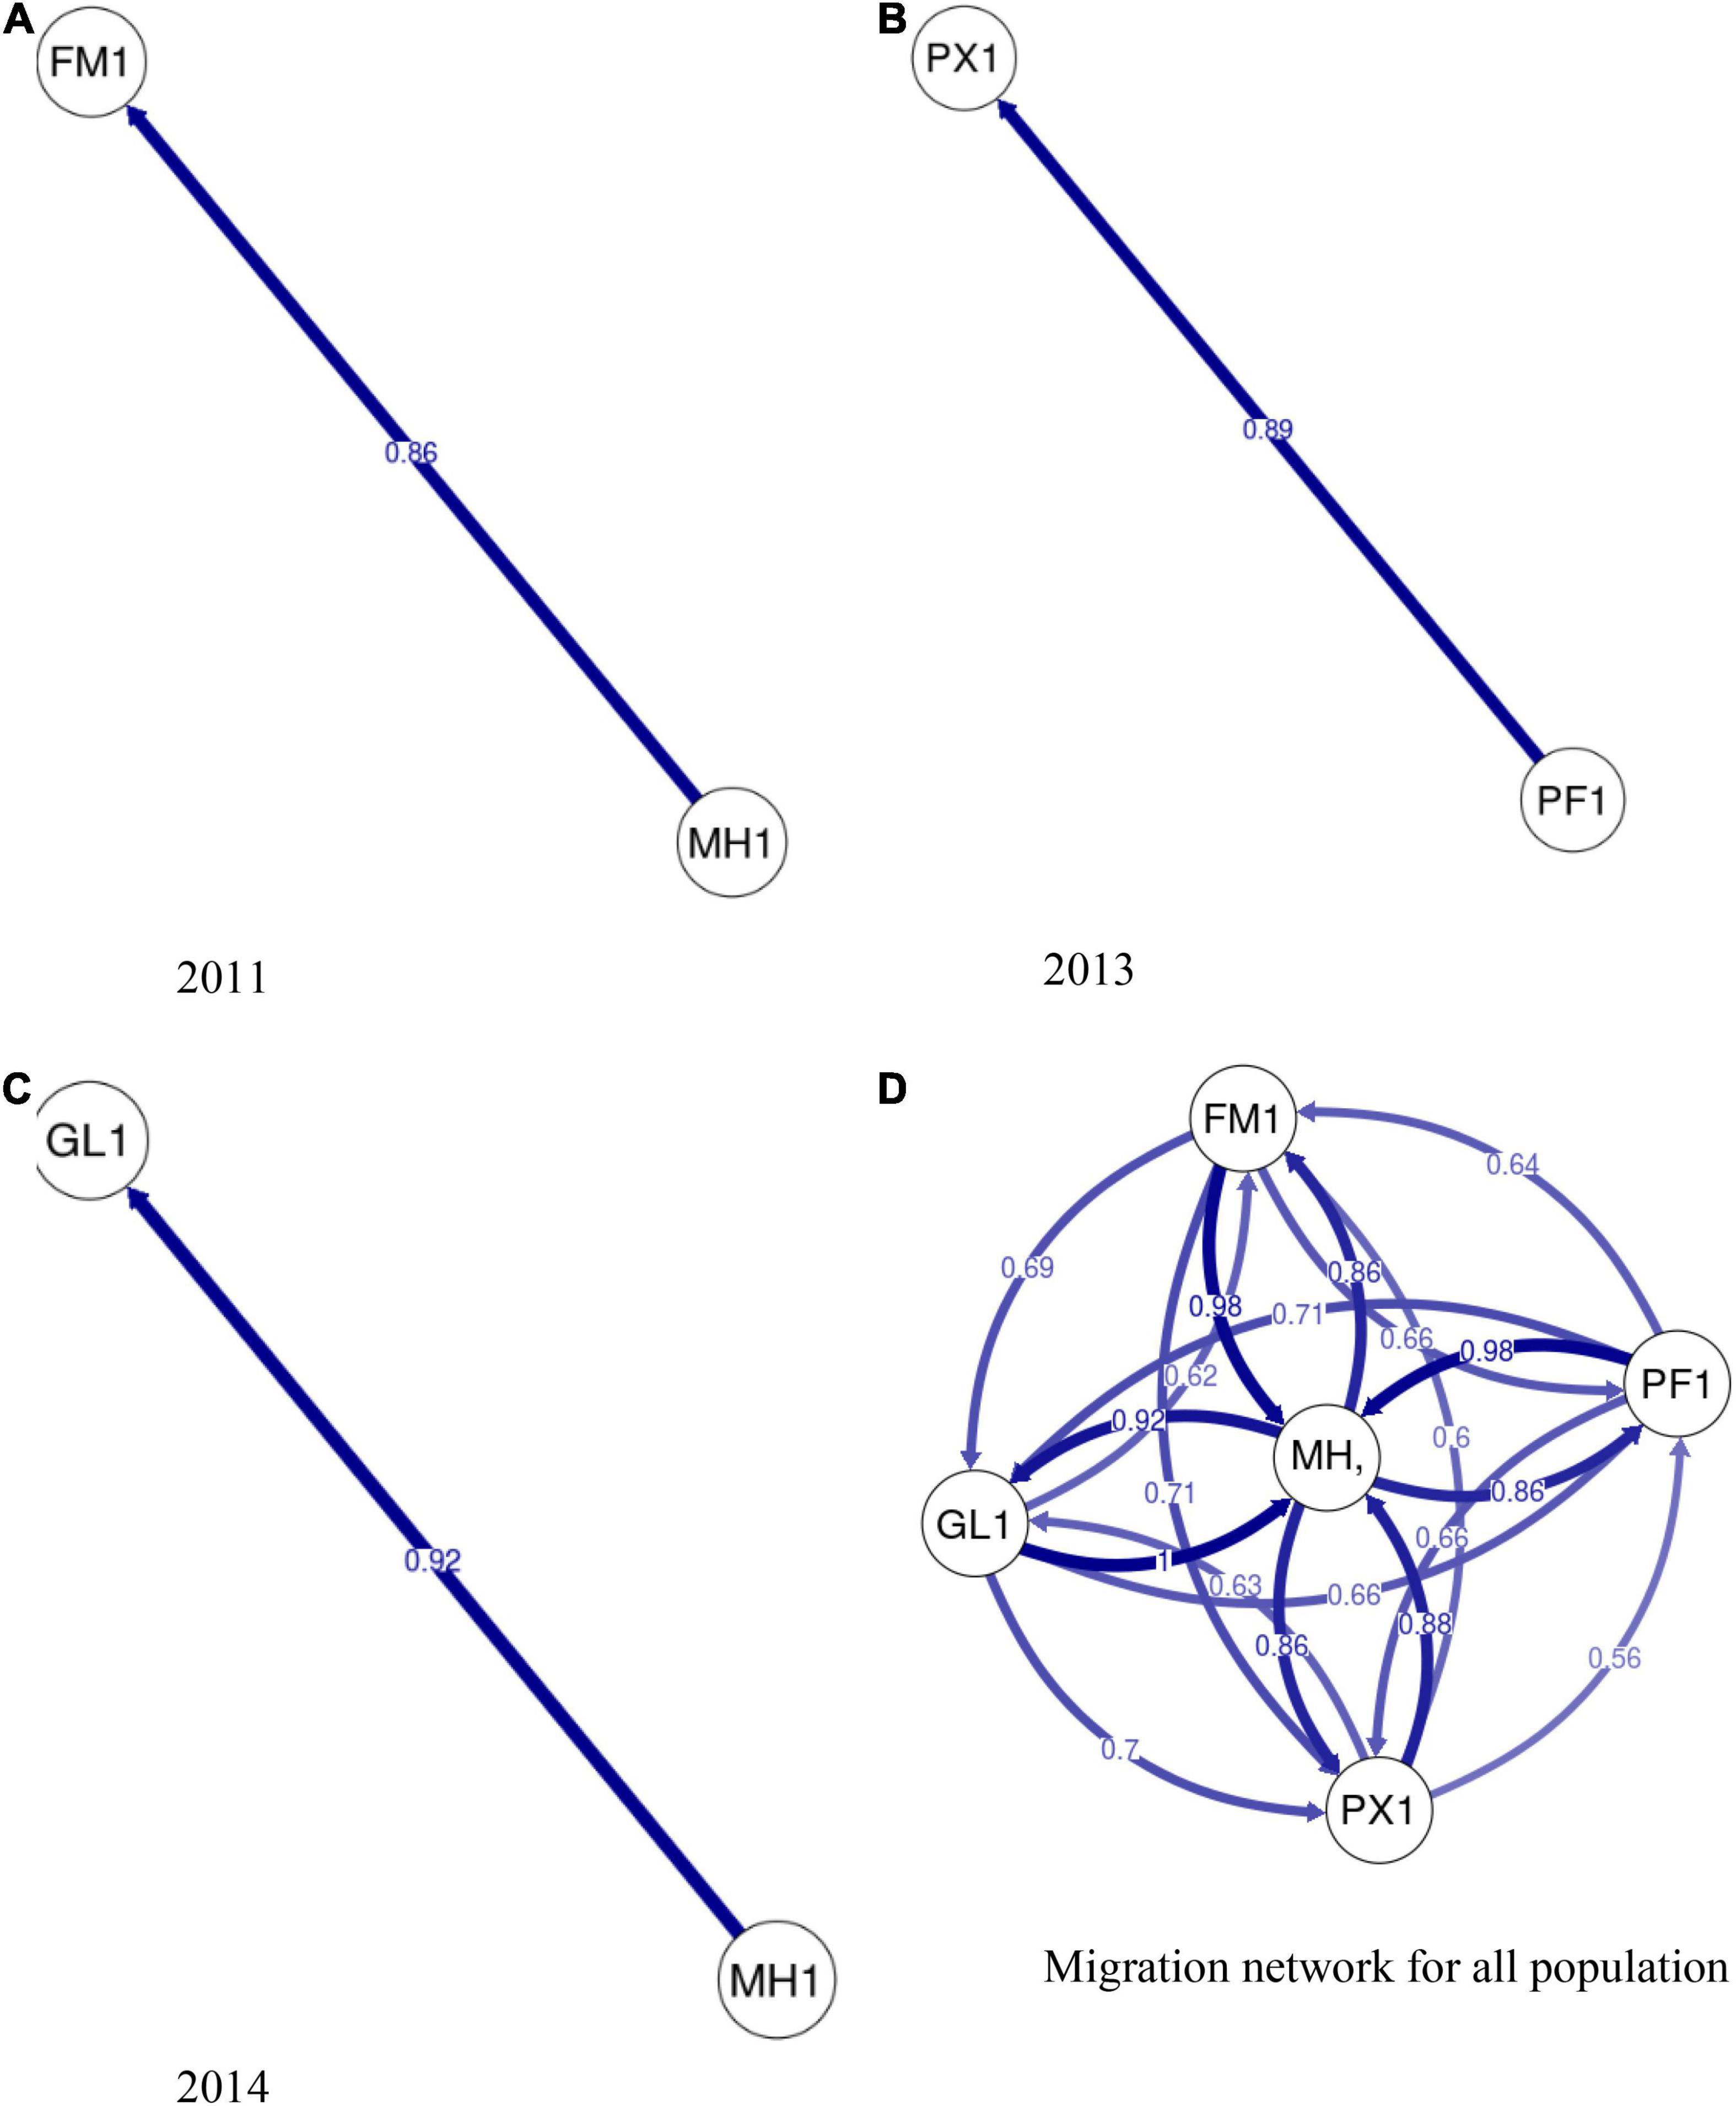
Figure 3. Directional relative migration network for sampled bigeye tuna. Directional relative migration estimated by divMigrate-online using Nm migration statistic. Arrows indicate the direction of gene flow and numbers show relative migration coefficient. Arrows with higher numbers appear thicker and stronger in color. Spatial relative migration estimated between (A) FM and MH in 2011 (B) PX and PF in 2013. (C) GL and MH in 2014. (D) Illustrates the calculated migration values, with no filter threshold, for all populations sampled. Temporal samples from Marshall Islands were pooled into a single population to estimate migration network for all populations.
Outlier Detection and Population Structure Analysis Based on Potentially Adaptive Loci
LOSITAN generated 56 outlier loci out of which 26 loci were candidates for directional selection (LUPS). BayeScan generated a panel of 11 LUPS under directional selection, which were also identified by LOSITAN. The 11 loci detected by both methods are the same. HacDivSel generated 492 LUPS from the 15 pairwise sample comparisons made resulting in varying numbers of LUPS for each comparison. However, none of the LUPS identified by HacDivSel were common in all the paired comparisons.
The pairwise FST values based on the 26-LUPS panel from LOSITAN ranged from 0.113 to 0.237, with significant population differentiation between PX (2013) and rest of population samples, PF (2013) and the rest and between FM (2011) and MH (2014) (Table 5). The pairwise FST values based on LUPS from HacDivSel ranged from 0.098 to 0.171 and 11-LUPS panel from BayeScan ranged from 0.173 to 0.349 (Supplementary Tables 3, 4). The LUPS panel from HacDivSel showed significant population differentiation between all population samples except between FM (2011) and GL (2014) while the LUPS panel from BayeScan showed significant population differentiation between PX (2013) and the rest. The three algorithms generated varying numbers of LUPS and magnitude of differentiation but all indicated population structure, particularly between the Phoenix Islands sample and the rest. The analysis of individual clustering using the Bayesian Information Criterion (BIC) method and a comparison of cross-validation error values with successive values of k on ADMIXTURE detected two putative genetic clusters (k = 2), suggesting that indeed, the Phoenix Islands are different from the rest as ADMIXTURE seems to indicate a gradient between these populations and the other ones, although not a strict separation (Figures 2B, 4). However, scatterplots generated by the Discriminant Analysis of the Principal Components (α-score optimized to retain 31 principal components) did not show any distinct cluster, rather an overlapping of the sample collections (Figures 2B, 4). Likewise, the ADMIXTURE graph also fails to show any distinct geographically non-admixed population. Similarly, the Monte-Carlo assignment accuracy for the six sample collections ranged from zero to 50% (results not shown) despite the large and significant FST values between Phoenix Island and other sample collections.
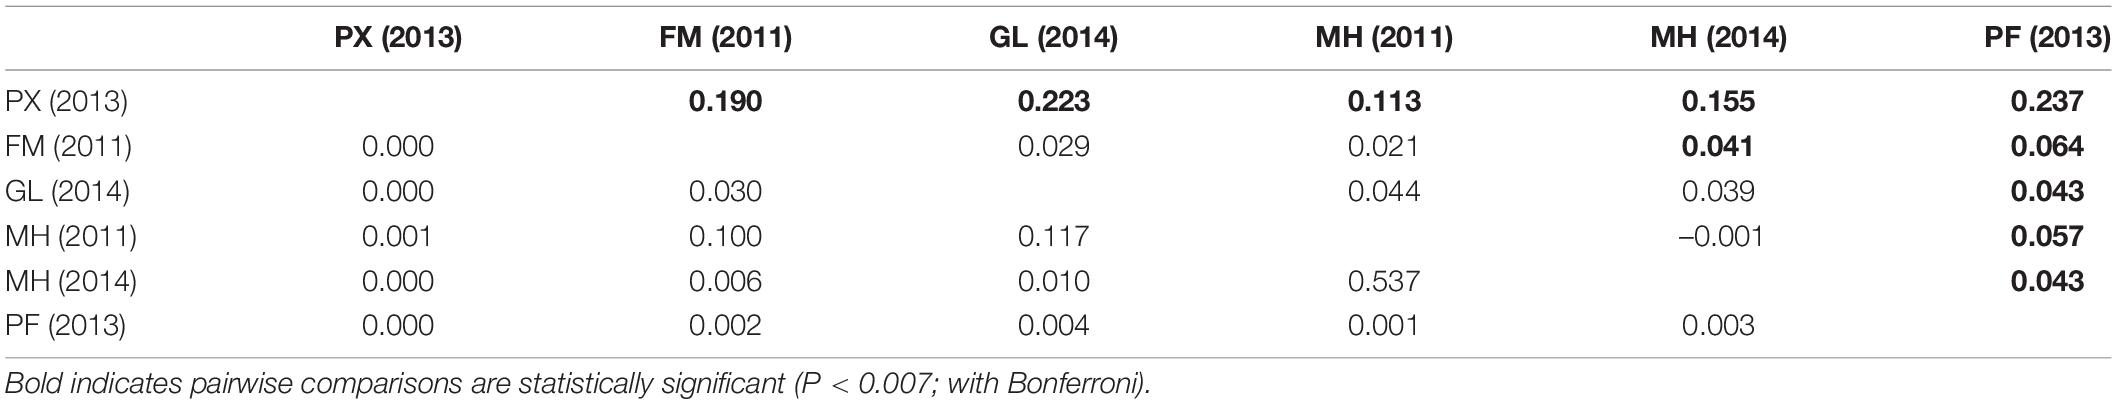
Table 5. Pairwise FST values (above diagonal) and associated P-values (below diagonal) between geographical population samples based on a panel of 26 loci under potential selection (LUPS) obtained from LOSITAN.
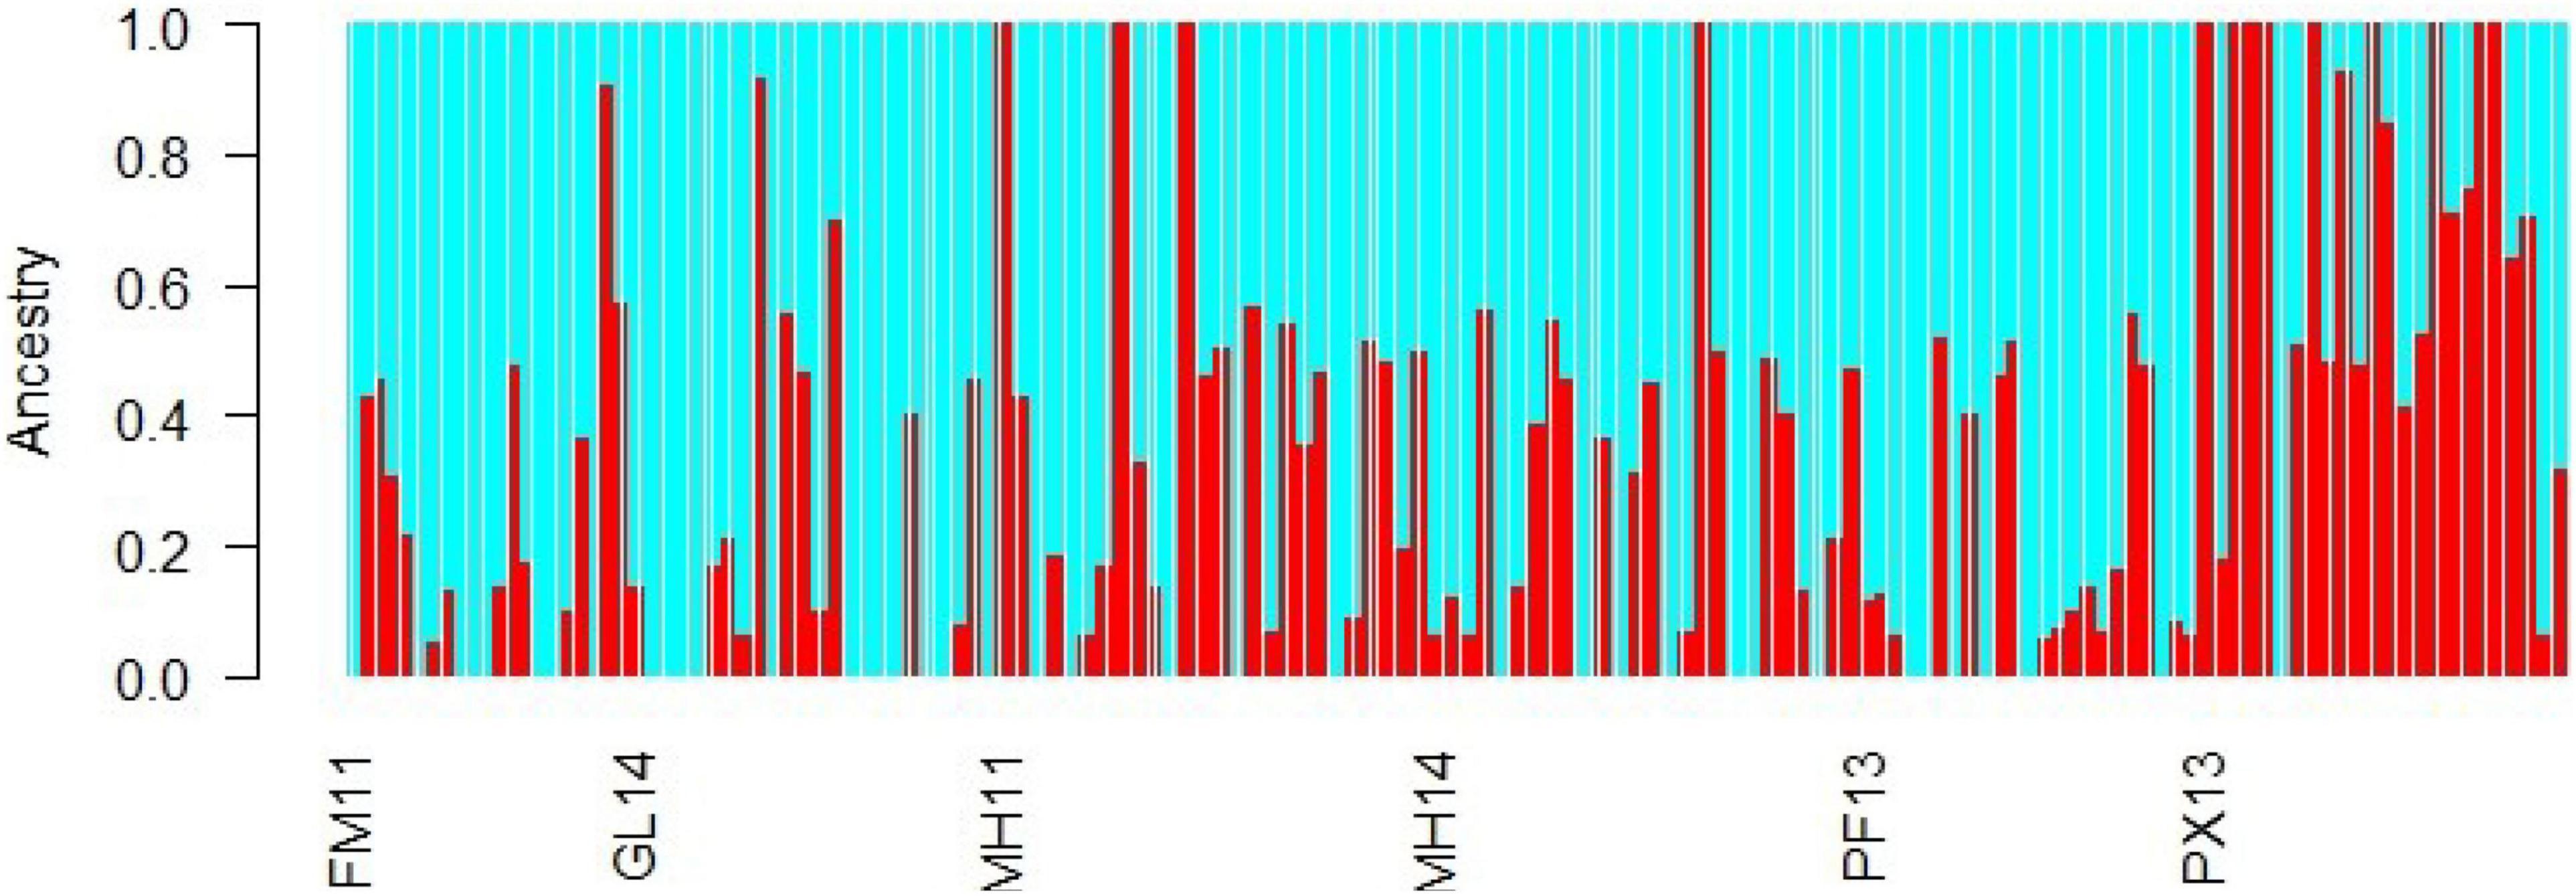
Figure 4. ADMIXTURE bar plot for the spatial and temporal comparisons of samples for k = 2 for LUPS. Bars indicate probability of membership of individuals to each of these sampling locations/years. The probability of membership identifies clusters with similar levels of integrity than scatter plots of Figure 2B. While PX13 sample appears slightly more homogeneous than the remaining samples, no cluster shows lack of admixed genetic makeup.
Discussion
This study examined broad scale population genetic structure in bigeye tunas across the WCPO. It is also the most geographically comprehensive population genetic analysis of bigeye tunas carried out to date in the region with a novel panel of neutral SNP markers (N = 2,682) using 144 fish collected across five locations. Most population genetic studies of tunas and other oceanodromous species include samples from different locations within ocean basins collected in different times of the year and often in different years (e.g., Grewe et al., 2015).
The significant inbreeding coefficients (FIS) observed in all population samples with the exception of the Phoenix Island can be due to genotyping artifacts, selection, non-random mating, inbreeding, small effective population sizes, migration and admixture. Fisheries overexploitation has also been associated with heterozygous deficits. For example, Hoarau et al. (2005) found that populations of plaice (Pleuronectes platessa) examined between 1924 and 1960 were in HWE, whereas populations examined after a fisheries peak in the 1970’s were not. The authors were able to attribute the significant heterozygote deficiencies found from 1970 onward to inbreeding and overexploitation. Unfortunately, we do not have access to archived samples to verify if the analyzed tuna populations were in HWE before the major expansion of tuna fisheries after WWII. Genotyping artifacts are unlikely to be a major cause because the quality filtering steps used in this study are quite stringent and no single locus deviated from HWE in all populations (e.g., Kilian et al., 2012; Lal et al., 2017). Selection is unlikely to explain these results because the loci identified as potentially under selection per dataset were removed before the estimation of population fixation indices. Regardless of whether observed heterozygosity may be a consequence of inbreeding, genetic drift, migration, or admixture of genetically differentiated samples, all mechanisms are associated with the presence of population structure. Non-random mating and inbreeding possibly occur, supported by evidence of the presence of kin aggregations. However, these individuals with very high heterozygosity were removed before the estimation of FIS and it is more likely that they are the result of cross contamination. In addition, the presence of kin aggregations in a population sample is predicted to have a stronger effect on FST than on FIS (Yearsley et al., 2013), contrary to what we observe. Therefore, admixture is the most likely explanation for the positive inbreeding coefficient observed (Wahlund, 1928). DAPC scatter and ADMIXTURE bar plots, especially for LUPS show that some individuals within sampled locations have a mixed multilocus genotype, suggesting some genetic sub-structuring in fish sampled at individual sites (Figures 2, 4).
Assessments of the population structure at putatively neutral loci identified very small levels of structure to infer any biological significance and they are suggestive of panmixia. The low, yet significant, FST values calculated are characteristic of highly mobile species and similar to the ranges reported for the Atlantic bluefin (Puncher et al., 2018), South Pacific albacore (Anderson et al., 2019b) and yellowfin tunas (Mullins et al., 2018; Pecoraro et al., 2018). The large population sizes, high potential for gene flow and therefore, a negligible effect of genetic drift explain the minuscule population heterogeneity observed at neutral loci (Palumbi, 1994). Tagging of bigeye tuna in the region (Schaefer et al., 2015) shows extensive mixing of individuals, suggesting genetic exchange between the collection sites and corroborates well with our analyses on population structure [pairwise fixation indices (FST), DAPC and assignPOP]. Because our results also suggest extensive gene flow observed at neutral loci in the WCPO region, there is no evidence to disagree with results of previous studies on bigeye tuna using PCR-RFLP (Bremer et al., 1998; Chow et al., 2000) and mitochondrial DNA (Durand et al., 2005; Chiang et al., 2006) that are consistent with panmixia in the Pacific Ocean. Accordingly, we suggest no need to revise the current management policy.
However, in contrast to the panmictic structure suggested by the neutral loci, all panels of LUPS suggest that bigeye tuna, especially those collected from the EEZ of Phoenix Islands, may be subject to complex physical, ecological and evolutionary processes that are signaling an elevated level of differentiation and must be further researched. Furthermore, the comparisons between samples collected in Marshall (2011 and 2014) and Phoenix Islands indicate that the potential adaptive divergence observed may be stochastic due to population dynamics, such as rate of reproduction and spawning dynamics, larval survival and recruitment, adult mortality, and migration, which change between years. Temporal genetic variability has also been reported among bluefin tuna populations in the western and eastern Atlantic Ocean (Puncher et al., 2018), which argues for the necessity of multi-year sampling for investigating population structure of migratory marine fishes. Since at least 80 SNPs are recommended to detect low levels of differentiation among highly mobile species (Ryman et al., 2006; Hauser et al., 2011), this preliminary result must be interpreted with caution as the sample size and the number of LUPS are both small.
The stock structure of tunas may be more complex than previously thought. There are uncertainties in spawning dynamics, the degree of spawning site fidelity and localized residency, provenance of individuals, spatial variation in length-to-age, linkages with adjacent “stocks” and effects of climate change on these processes (Moore et al., 2020a). There is also recent evidence of population differentiation found using LUPS in yellowfin (Grewe et al., 2015) and South Pacific albacore tunas (Anderson et al., 2019b), and the first genetic evidence of natal homing in Atlantic bluefin tuna (Rodríguez-Ezpeleta et al., 2019).
In view of these complexities and uncertainties Moore et al. (2020a,b) identified several general sampling considerations and potential sampling designs to help overcome uncertainties in future studies on stock structure and provenance of tuna. For example, the use of temporally repeated sampling preferably of all age classes including larvae, young of the year (YoY) and actively spawning adults captured in or close to spawning areas is highly recommended. Long-lived migratory fishes with ocean-wide distributions caught from feeding aggregations are not suitable for population genetic studies because they are likely to represent stock mixtures that may generate inconsistent allele frequencies (Puncher et al., 2018). Multiple-year sampling of larvae and YoY from spawning areas helps to reduce the risk of false positives for divergence, which may occur due to sampling bias, temporal variation in the survival of larvae and the sweepstake effect (Larson and Julian, 1999; Maes et al., 2006; Puncher et al., 2018). Furthermore, to alleviate bias such as the Allendorf-Phelps effect, where the samples may represent the progeny of a small number of breeding adults rather than entire population (Allendorf and Phelps, 1981), it was proposed to use about 40–60 fish samples per spatio-temporal stratum with equal proportions of both sexes. Furthermore, sampling over consecutive years across different ENSO phases, and multiple sampling in equatorial regions within the same year to test for intra-annual patterns, would also be appropriate.
In addition to the suggestions and key research questions proposed by Moore et al. (2020a,b) we recommend sampling in the western part of the EEZ of the Phoenix Island (Sibert et al., 2012) and the Phoenix Island Protected Area (PIPA) (Hernández et al., 2019), which are already known spawning areas for the bigeye tuna. In a study on natal homing in Atlantic Bluefin tuna, Rodríguez-Ezpeleta et al. (2019) found genetic differentiation between samples from two main spawning grounds in the Northwest Atlantic and Mediterranean Sea using thousands of genome-wide SNP markers obtained from more than 200 larvae and small YoY. The sampling design involving the use of larvae, small YoY and/or actively spawning adults captured in or close to known spawning areas will help investigate if bigeye tunas also display homing behavior (i.e., sexually mature individuals return to the same spawning areas where their progenitors spawned). As reported by Rodríguez-Ezpeleta et al. (2019), this will enable the development of an origin traceability tool which effectively assigns tuna catch to a given stock based on where they were spawned rather than where they were caught for more effective tuna fisheries management.
While the analyses carried in the current study are robust, it is not possible with the available data to ascertain the exact reasons for the observed signals of differentiation of the Phoenix Island sample or to establish its biological relevance. As emphasized previously, the results should be interpreted with caution as there are a number of uncertainties surrounding the sampling strategy for this study, for example, the use of smaller sample size increases the likelihood for the Allendorf-Phelps effect. This is particularly important for the sample from the Phoenix Island that indicates family effects in the form of heterozygote excess. In addition, the mixed age composition of population samples used in the study and the lack of temporally repeated sampling further add uncertainties to the patterns observed. Nevertheless, we argue that these results are sufficiently informative to encourage further research in this important area.
Conclusion
The current study represents the most geographically comprehensive population genetic assessment of bigeye tuna in the WCPO to date. It provides no substantial evidence to challenge panmixia using potentially neutral loci. However, there are signals of differentiation of samples captured from the EEZ of the Phoenix Island when using LUPS to estimate population partitioning. However, with the available data we are unable to discern the underlying processes leading to divergence in potentially adaptive loci among samples of putatively different geographic origin. Due to the uncertainties surrounding the use of fish caught from a possibly mixed-stock fishery and the opportunistic sampling used in this study, we recommend further high-resolution genomic assessments involving larger samples sizes of spatio-temporal samples of larvae, YoY and actively spawning individuals from throughout bigeye spawning habitat in the Pacific to strengthen future population genetic studies of tropical tunas.
Data Availability Statement
The raw and filtered genotype datasets in Genepop file format analyzed for this study can be found in the Open Science Framework (OSF) repository (10.17605/OSF.IO/6ZRA3).
Ethics Statement
The Animal Ethics Committee of the University of the South Pacific reviewed and approved this study.
Author Contributions
CR conceived the project and wrote the grant proposal that funded the study. JN designed and conducted analyses with significant input from BS and AM, collected data, and wrote the manuscript with assistance from CR. JH, SN, and NS were representatives of the Secretariat of the Pacific Community (SPC) and provided fisheries science and management expertise to the study. CR critically revised the manuscript ensuring accuracy and integrity of the data and analyses. SPC was also responsible for tissue sample collection, facilitated sample access and preparation of Figure 1. All authors contributed to the final manuscript.
Funding
The genomic analyses in this work were funded by the University of the South Pacific Strategic Research Themes Intramural Program project no. F1006-R1001-71502-622. Funding for the tuna tissue bank was provided by the WCPFC as part of Project 35b.
Conflict of Interest
The authors declare that the research was conducted in the absence of any commercial or financial relationships that could be construed as a potential conflict of interest.
Publisher’s Note
All claims expressed in this article are solely those of the authors and do not necessarily represent those of their affiliated organizations, or those of the publisher, the editors and the reviewers. Any product that may be evaluated in this article, or claim that may be made by its manufacturer, is not guaranteed or endorsed by the publisher.
Acknowledgments
We gratefully acknowledge all the observers, research staff, and port samplers who collected tissue samples; Valerie Allain for establishing the tissue bank; Jed Macdonald of SPC for preparing Figure 1; Maria Ines Rico and Francois Roupsard for technical assistance with sample preparation; and Anthony Beeching and Feleti P. Teo from the Western and Central Pacific Fisheries Commission (WCPFC) for facilitating and granting access to the Tissue Bank.
Supplementary Material
The Supplementary Material for this article can be found online at: https://www.frontiersin.org/articles/10.3389/fmars.2022.799684/full#supplementary-material
References
Alcala, N., Goudet, J., and Vuilleumier, S. (2014). On the transition of genetic differentiation from isolation to panmixia: what we can learn from GST and D. Theor. Popul. Biol. 93, 75–84.
Alexander, D. H., Novembre, J., and Lange, K. (2009). Fast model-based estimation of ancestry in unrelated individuals. Genome Res. 19, 1655–1664. doi: 10.1101/gr.094052.109
Allendorf, F. W., England, P. R., Luikart, G., Ritchie, P. A., and Ryman, N. (2008). Genetic effects of harvest on wild animal populations. Trends Ecol. Evol. 23, 327–337. doi: 10.1016/j.tree.2008.02.008
Allendorf, F. W., and Phelps, S. R. (1981). Use of allelic frequencies to describe population structure. Can. J. Fish. Aquat. Sci. 38, 1507–1514.
Anderson, G., Lal, M., Hampton, J., Smath, N., and Rico, C. (2019a). Close kin proximity in yellowfin tuna (Thunnus albacares) as a driver of population genetic structure in the tropical western and central Pacific Ocean. Front. Mar. Sci. 6:341.
Anderson, G., Hampton, J., Smath, N., and Rico, C. (2019b). Indications of strong adaptive population genetic structure in albacore tuna (Thunnus alalunga) in the southwest and central Pacific Ocean. Ecol. Evol. 9, 10354–10364. doi: 10.1002/ece3.5554
Antao, T., Lopes, A., Lopes, R. J., Beja-Pereira, A., and Luikart, G. (2008). LOSITAN: a workbench to detect molecular adaptation based on a F ST-outlier method. BMC Bioinformatics 9:323. doi: 10.1186/1471-2105-9-323
Beaumont, M. A., and Balding, D. J. (2004). Identifying adaptive genetic divergence among populations from genome scans. Mol. Ecol. 13, 969–980. doi: 10.1111/j.1365-294x.2004.02125.x
Beaumont, M. A., and Nichols, R. A. (1996). Evaluating loci for use in the genetic analysis of population structure. Proc. R. Soc. Lond. B 263, 1619–1626. doi: 10.1098/rspb.1996.0237
Belkhir, K., Borsa, P., Chikhi, L., Raufaste, N., and Bonhomme, F. (2004). GENETIX 4.05, Population Genetics Software for Windows TM. Montpellier: Université de Montpellier II.
Benestan, L., Quinn, B. K., Maaroufi, H., Laporte, M., Clark, F. K., Greenwood, S. J., et al. (2016). Seascape genomics provides evidence for thermal adaptation and current-mediated population structure in American lobster (Homarus americanus). Mol. Ecol. 25, 5073–5092. doi: 10.1111/mec.13811
Bremer, J. A., Stéquert, B., Robertson, N., and Ely, B. (1998). Genetic evidence for inter-oceanic subdivision of bigeye tuna (Thunnus obesus) populations. Mar. Biol. 132, 547–557.
Carvajal-Rodríguez, A. (2017). HacDivSel: two new methods (haplotype-based and outlier-based) for the detection of divergent selection in pairs of populations. PLoS One 12:e0175944. doi: 10.1371/journal.pone.0175944
Chang, C. C., Chow, C. C., Tellier, L. C., Vattikuti, S., Purcell, S. M., and Lee, J. J. (2015). Second-generation PLINK: rising to the challenge of larger and richer datasets. Gigascience 4:7. doi: 10.1186/s13742-015-0047-8
Chen, K. Y., Marschall, E. A., Sovic, M. G., Fries, A. C., Gibbs, H. L., and Ludsin, S. A. (2018). assign POP: an r package for population assignment using genetic, non-genetic, or integrated data in a machine-learning framework. Methods Ecol. Evol. 9, 439–446. doi: 10.1111/2041-210x.12897
Chiang, H.-C., Hsu, C.-C., Lin, H.-D., Ma, G. C., Chiang, T.-Y., and Yang, H.-Y. (2006). Population structure of bigeye tuna (Thunnus obesus) in the South China Sea, Philippine Sea and western Pacific Ocean inferred from mitochondrial DNA. Fish. Res. 79, 219–225. doi: 10.1016/j.fishres.2005.11.026
Chow, S., Okamoto, H., Miyabe, N., Hiramatsu, K., and Barut, N. (2000). Genetic divergence between Atlantic and Indo-Pacific stocks of bigeye tuna (Thunnus obesus) and admixture around South Africa. Mol. Ecol. 9, 221–227. doi: 10.1046/j.1365-294x.2000.00851.x
Collette, B., Acero, A., Amorim, A. F., Boustany, A., Canales Ramirez, C., Cardenas, G., et al. (2011). Thunnus obesus. IUCN Red List Threatened Species 2011:e.T21859A9329255. doi: 10.2305/IUCN.UK.2011-2.RLTS.T21859A9329255.en
Ducharme-Barth, N., Vincent, M., Hampton, J., Hamer, P., Williams, P., and Pilling, G. (2020). Stock Assessment of Bigeye Tuna in the Western and Central Pacific Ocean. WCPFC-SC16-2020/SA-WP-03. Kolonia: Western and Central Pacific Fisheries Commission.
Durand, J.-D., Collet, A., Chow, S., Guinand, B., and Borsa, P. (2005). Nuclear and mitochondrial DNA markers indicate unidirectional gene flow of Indo-Pacific to Atlantic bigeye tuna (Thunnus obesus) populations, and their admixture off southern Africa. Mar. Biol. 147, 313–322.
Excoffier, L., Laval, G., and Schneider, S. (2005). Arlequin (version 3.0): an integrated software package for population genetics data analysis. Evol. Bioinform. 1:117693430500100003.
Flickinger, M., Jun, G., Abecasis, G. R., Boehnke, M., and Kang, H. M. (2015). Correcting for sample contamination in genotype calling of DNA sequence data. Am. J. Hum. Genet. 97, 284–290. doi: 10.1016/j.ajhg.2015.07.002
Fujino, K., and Kang, T. (1968). Transferrin groups of tunas. Genetics 59:79. doi: 10.1093/genetics/59.1.79
Gagnaire, P. A., Broquet, T., Aurelle, D., Viard, F., Souissi, A., Bonhomme, F., et al. (2015). Using neutral, selected, and hitchhiker loci to assess connectivity of marine populations in the genomic era. Evol. Appl. 8, 769–786. doi: 10.1111/eva.12288
Galarza, J. A., Carreras-Carbonell, J., Macpherson, E., Pascual, M., Roques, S., Turner, G. F., et al. (2009). The influence of oceanographic fronts and early-life-history traits on connectivity among littoral fish species. Proc. Natl. Acad. Sci. U.S.A. 106, 1473–1478. doi: 10.1073/pnas.0806804106
Gonzalez, E. G., Beerli, P., and Zardoya, R. (2008). Genetic structuring and migration patterns of Atlantic bigeye tuna, Thunnus obesus (Lowe, 1839). BMC Evol. Biol. 8:1. doi: 10.1186/1471-2148-8-252
Grewe, P., Feutry, P., Hill, P., Gunasekera, R., Schaefer, K., Itano, D., et al. (2015). Evidence of discrete yellowfin tuna (Thunnus albacares) populations demands rethink of management for this globally important resource. Sci. Rep. 5:16916. doi: 10.1038/srep16916
Grewe, P. M., and Hampton, J. (1998). An Assessment of Bigeye (Thunnus obesus) Population Structure in the Pacific Ocean, Based on Mitochondrial DNA and DNA Microsatellite Analysis. Clayton, VIC: CSIRO Marine Research.
Harley, S., Williams, P., Nicol, S., Hampton, J., and Brouwer, S. (2015). The Western and Central Pacific Tuna Fishery: 2014 Overview and Status of Stocks. Tuna Fisheries Assessment Report, no. 15. Noumea, NC: Secretariat of the Pacific Community.
Hauser, L., Baird, M., Hilborn, R., Seeb, L. W., and Seeb, J. E. (2011). An empirical comparison of SNPs and microsatellites for parentage and kinship assignment in a wild sockeye salmon (Oncorhynchus nerka) population. Mol. Ecol. Resour. 11, 150–161. doi: 10.1111/j.1755-0998.2010.02961.x
Hernández, C. M., Witting, J., Willis, C., Thorrold, S. R., Llopiz, J. K., and Rotjan, R. D. (2019). Evidence and patterns of tuna spawning inside a large no-take Marine Protected Area. Sci. Rep. 9:10772. doi: 10.1038/s41598-019-47161-0
Hoarau, G., Boon, E., Jongma, D. N., Ferber, S., Palsson, J., Van Der Veer, H. W., et al. (2005). Low effective population size and evidence for inbreeding in an overexploited flatfish, plaice (Pleuronectes platessa L.). Proc. R. Soc. B Biol. Sci. 272, 497–503. doi: 10.1098/rspb.2004.2963
Jombart, T., and Collins, C. (2015). A Tutorial for Discriminant Analysis of Principal Components (DAPC) Using Adegenet 2.0.0. London: Imperial College London, MRC Centre for Outbreak Analysis and Modelling.
Jombart, T., Devillard, S., and Balloux, F. (2010). Discriminant analysis of principal components: a new method for the analysis of genetically structured populations. BMC Genetics 11:94. doi: 10.1186/1471-2156-11-94
Kilian, A., Wenzl, P., Huttner, E., Carling, J., Xia, L., Blois, H., et al. (2012). Diversity arrays technology: a generic genome profiling technology on open platforms. Methods Mol. Biol. 888, 67–89. doi: 10.1007/978-1-61779-870-2_5
Kumar, G., and Kocour, M. (2015). Population genetic structure of tunas inferred from molecular markers: a review. Rev. Fish. Sci. Aquacult. 23, 72–89.
Lal, M. M., Southgate, P. C., Jerry, D. R., Bosserelle, C., and Zenger, K. R. (2017). Swept away: ocean currents and seascape features influence genetic structure across the 18,000 Km Indo-Pacific distribution of a marine invertebrate, the black-lip pearl oyster Pinctada margaritifera. BMC Genomics 18:66. doi: 10.1186/s12864-016-3410-y
Larson, R. J., and Julian, R. M. (1999). Spatial and Temporal Genetic Patchiness in Marine Populations and Their Implications for Fisheries Management. California Cooperative Oceanic Fisheries Investigations Report. 94–99.
Leroy, B., Nicol, S., Lewis, A., Hampton, J., Kolody, D., Caillot, S., et al. (2015). Lessons learned from implementing three, large-scale tuna tagging programmes in the western and central Pacific Ocean. Fish. Res. 163, 23–33.
Levin, L. A. (2006). Recent progress in understanding larval dispersal: new directions and digressions. Integr. Comp. Biol. 46, 282–297. doi: 10.1093/icb/icj024
Maes, G. E., Pujolar, J., Hellemans, B., and Volckaert, F. A. (2006). Evidence for isolation by time in the European eel (Anguilla anguilla L.). Mol. Ecol. 15, 2095–2107. doi: 10.1111/j.1365-294x.2006.02925.x
McKechnie, S., Pilling, G., and Hampton, J. (2017). Stock Assessment of Bigeye Tuna in the Western and Central Pacific Ocean. WCPFC-SC13-2017/SA-WP-05. Kolonia: Western and Central Pacific Fisheries Commission.
Moore, B. R., Bell, J. D., Evans, K., Farley, J., Grewe, P. M., Hampton, J., et al. (2020a). Defining the stock structures of key commercial tunas in the Pacific Ocean I: current knowledge and main uncertainties. Fish. Res. 230:10 5525.
Moore, B. R., Adams, T., Allain, V., Bell, J. D., Bigler, M., Bromhead, D., et al. (2020b). Defining the stock structures of key commercial tunas in the Pacific Ocean II: sampling considerations and future directions. Fish. Res. 230;105524. doi: 10.1016/j.fishres.2020.105524
Mullins, R. B., Mckeown, N. J., Sauer, W. H., Shaw, P. W., and Grant, H. E. W. S. (2018). Genomic analysis reveals multiple mismatches between biological and management units in yellowfin tuna (Thunnus albacares). ICES J. Mar. Sci. 75, 2145–2152.
Myksvoll, M. S., Jung, K.-M., Albretsen, J., and Sundby, S. (2014). Modelling dispersal of eggs and quantifying connectivity among Norwegian coastal cod subpopulations. ICES J. Mar. Sci. 71, 957–969. doi: 10.1093/icesjms/fst022
Nielsen, E., Cariani, A., Aoidh, E., Maes, G., Milano, I., Ogden, R., et al. (2012). Gene-associated markers provide tools for tackling illegal fishing and false eco-certification. Nat. Commun. 3:851.
Nosil, P., Funk, D. J., and Ortiz-Barrientos, D. (2009). Divergent selection and heterogeneous genomic divergence. Mol. Ecol. 18, 375–402.
Palumbi, S. R. (1994). Genetic divergence, reproductive isolation, and marine speciation. Annu. Rev. Ecol. Syst. 25, 547–572.
Pecoraro, C., Babbucci, M., Franch, R., Rico, C., Papetti, C., Chassot, E., et al. (2018). The population genomics of yellowfin tuna (Thunnus albacares) at global geographic scale challenges current stock delineation. Sci. Rep. 8:13890. doi: 10.1038/s41598-018-32331-3
Petrou, E. L., Drinan, D. P., Kopperl, R., Lepofsky, D., Yang, D., Moss, M. L., et al. (2019). Intraspecific DNA contamination distorts subtle population structure in a marine fish: decontamination of herring samples before restriction-site associated sequencing and its effects on population genetic statistics. Mol. Ecol. Resour. 19, 1131–1143. doi: 10.1111/1755-0998.12978
Puncher, G. N., Cariani, A., Maes, G. E., Van Houdt, J., Herten, K., Cannas, R., et al. (2018). Spatial dynamics and mixing of bluefin tuna in the Atlantic Ocean and Mediterranean Sea revealed using next-generation sequencing. Mol. Ecol. Resour. 18, 620–638. doi: 10.1111/1755-0998.12764
Riccioni, G., Stagioni, M., Landi, M., Ferrara, G., Barbujani, G., and Tinti, F. (2013). Genetic structure of bluefin tuna in the Mediterranean Sea correlates with environmental variables. PLoS One 8:e80105. doi: 10.1371/journal.pone.0080105
Rice, W. R. (1989). Analyzing tables of statistical tests. Evolution 43, 223–225. doi: 10.1111/j.1558-5646.1989.tb04220.x
Riginos, C., Crandall, E. D., Liggins, L., Bongaerts, P., and Treml, E. A. (2016). Navigating the currents of seascape genomics: how spatial analyses can augment population genomic studies. Curr. Zool. 62:zow067. doi: 10.1093/cz/zow067
Rodríguez-Ezpeleta, N., Díaz-Arce, N., Walter, J. F. III, Richardson, D. E., Rooker, J. R., Nøttestad, L., et al. (2019). Determining natal origin for improved management of Atlantic bluefin tuna. Front. Ecol. Environ. 17:439–444. doi: 10.1126/science.1161473
Ryman, N., Palm, S., André, C., Carvalho, G. R., Dahlgren, T. G., Jorde, P. E., et al. (2006). Power for detecting genetic divergence: differences between statistical methods and marker loci. Mol. Ecol. 15, 2031–2045. doi: 10.1111/j.1365-294X.2006.02839.x
Schaefer, K., Fuller, D., Hampton, J., Caillot, S., Leroy, B., and Itano, D. (2015). Movements, dispersion, and mixing of bigeye tuna (Thunnus obesus) tagged and released in the equatorial Central Pacific Ocean, with conventional and archival tags. Fish. Res. 161, 336–355. doi: 10.1016/j.fishres.2014.08.018
Selwyn, J. D., Hogan, J. D., Downey-Wall, A. M., Gurski, L. M., Portnoy, D. S., and Heath, D. D. (2016). Kin-aggregations explain chaotic genetic patchiness, a commonly observed genetic pattern, in a marine fish. PLoS One 11:e0153381. doi: 10.1371/journal.pone.0153381
Sibert, J., Senina, I., Lehodey, P., and Hampton, J. (2012). Shifting from marine reserves to maritime zoning for conservation of Pacific bigeye tuna (Thunnus obesus). Proc. Natl. Acad. Sci. U.S.A. 109, 18221–18225. doi: 10.1073/pnas.1209468109
Slatkin, M. (1993). Isolation by distance in equilibrium and non-equilibrium populations. Evolution 54, 264–279. doi: 10.1111/j.1558-5646.1993.tb01215.x
Sundqvist, L., Keenan, K., Zackrisson, M., Prodöhl, P., and Kleinhans, D. (2016). Directional genetic differentiation and relative migration. Ecol. Evol. 6, 3461–3475. doi: 10.1002/ece3.2096
Suzuki, A., Shimizu, Y., and Morio, T. (1962). Serological studies of the races of tuna. VI. Bigeye-3 antigen occurred in the albacore. Rep. Nankai Reg. Fish. Res. Lab. 16, 67–70.
Wahlund, S. (1928). Zusammensetzung von populationen und korrelationserscheinungen vom standpunkt der vererbungslehre aus betrachtet. Hereditas 11, 65–106.
Wang, J. (2011). COANCESTRY: a program for simulating, estimating and analysing relatedness and inbreeding coefficients. Mol. Ecol. Resour. 11, 141–145. doi: 10.1111/j.1755-0998.2010.02885.x
Wu, Z., Xu, Q., Zhu, J., Dai, X., and Xu, L. (2014). Genetic population structure of the bigeye tuna Thunnus obesus in the central Pacific Ocean based on mtDNA Cytb sequences. Fish. Sci. 80, 415–426. doi: 10.1007/s12562-014-0712-3
Keywords: bigeye tuna (Thunnus obesus), population genetic structure, panmixia, Western and Central Pacific Ocean, adaptive divergence
Citation: Natasha J, Stockwell BL, Marie AD, Hampton J, Smith N, Nicol S and Rico C (2022) No Population Structure of Bigeye Tunas (Thunnus obesus) in the Western and Central Pacific Ocean Indicated by Single Nucleotide Polymorphisms. Front. Mar. Sci. 9:799684. doi: 10.3389/fmars.2022.799684
Received: 21 October 2021; Accepted: 25 February 2022;
Published: 07 April 2022.
Edited by:
Taewoo Ryu, Okinawa Institute of Science and Technology Graduate University, JapanReviewed by:
Juha Merilä, University of Helsinki, FinlandDidier Aurelle, Aix-Marseille Université, France
Copyright © 2022 Natasha, Stockwell, Marie, Hampton, Smith, Nicol and Rico. This is an open-access article distributed under the terms of the Creative Commons Attribution License (CC BY). The use, distribution or reproduction in other forums is permitted, provided the original author(s) and the copyright owner(s) are credited and that the original publication in this journal is cited, in accordance with accepted academic practice. No use, distribution or reproduction is permitted which does not comply with these terms.
*Correspondence: Ciro Rico, Y2lyby5yaWNvQGNzaWMuZXM=; Janice Natasha, amFuaWNlLm5hdGFzaGFAdXNwLmFjLmZq