 Sune Agersnap1*
 Eva Egelyng Sigsgaard1Mads Reinholdt Jensen1Marcelo De Paula Avila1Henrik Carl2Peter Rask Møller2,3Simon Leed Krøs4Steen Wilhelm Knudsen2,5Mary S. Wisz6Philip Francis Thomsen1*
- 1Department of Biology, Aarhus University, Aarhus, Denmark
- 2Natural History Museum of Denmark, University of Copenhagen, Copenhagen, Denmark
- 3Norwegian College of Fishery Science, UiT - The Arctic University of Norway, Tromsø, Norway
- 4The Danish Society for Nature Conservation, Copenhagen, Denmark
- 5NIVA Denmark Water Research, Copenhagen, Denmark
- 6Sasakawa Global Ocean Institute, World Maritime University, Malmö, Sweden
Marine biodiversity is threatened by human activities. To understand the changes happening in aquatic ecosystems and to inform management, detailed, synoptic monitoring of biodiversity across large spatial extents is needed. Such monitoring is challenging due to the time, cost, and specialized skills that this typically requires. In an unprecedented study, we combined citizen science with eDNA metabarcoding to map coastal fish biodiversity at a national scale. We engaged 360 citizen scientists to collect filtered seawater samples from 100 sites across Denmark over two seasons (1 p.m. on September 29th 2019 and May 10th 2020), and by sampling at nearly the exact same time across all 100 sites, we obtained an overview of fish biodiversity largely unaffected by temporal variation. This would have been logistically impossible for the involved scientists without the help of volunteers. We obtained a high return rate of 94% of the samples, and a total richness of 52 fish species, representing approximately 80% of coastal Danish fish species and approximately 25% of all Danish marine fish species. We retrieved distribution patterns matching known occurrence for both invasive, endangered, and cryptic species, and detected seasonal variation in accordance with known phenology. Dissimilarity of eDNA community compositions increased with distance between sites. Importantly, comparing our eDNA data with National Fish Atlas data (the latter compiled from a century of observations) we found positive correlation between species richness values and a congruent pattern of community compositions. These findings support the use of eDNA-based citizen science to detect patterns in biodiversity, and our approach is readily scalable to other countries, or even regional and global scales. We argue that future large-scale biomonitoring will benefit from using citizen science combined with emerging eDNA technology, and that such an approach will be important for data-driven biodiversity management and conservation.
Introduction
Global biodiversity is threatened by anthropogenically driven changes (Dirzo et al., 2014; Ceballos et al., 2020; Habibullah et al., 2021). In marine environments, biodiversity has been negatively affected by factors such as climate change (Doney et al., 2012), acidification and overfishing (McCauley et al., 2015; Luypaert et al., 2020; Rastelli et al., 2020). For example, global fish abundance has declined by approximately 38% in the last 50 years (Hutchings et al., 2010). However population trends are regularly monitored for only a limited number of commercially important open water species (Hutchings et al., 2010; Heessen et al., 2015). Coastal areas are particularly important for biodiversity, providing among other things nursery areas for fishes and essential ecosystem services to society (Berglund et al., 2018). However, marine fish biodiversity in coastal areas is not monitored regularly due to lack of direct commercial value, difficulties in standardizing monitoring methods, safety of observing personnel, and/or lack of taxonomic expertise (Kristensen et al., 2014; Andersen et al., 2015; Heessen et al., 2015; Gold et al., 2021). In Denmark, ca. 210 marine fish species have been registered to date, of which 64 are associated with coastal areas (Carl and Møller, 2021). Three Danish citizen science projects, at present, continuously register coastal fishes. These are; (i) the web-based “catch journal” (in Danish “fangstjournalen”), where recreational anglers register their catches (Gundelund et al., 2021), (ii) the “key fishermen” (in Danish: “Nøglefisker”) project, where amateur fishermen using standardized gill and fyke nets continuously register their catches from specific locations (Kristensen et al., 2014), and (iii) The Atlas of Danish Fishes (Hereafter, Fish Atlas) (in Danish: “Fiskeatlas”), managed by the Natural History Museum of Denmark, University of Copenhagen. While the former two initiatives focus only on five to ten species that are valuable to fishermen and anglers, the Fish Atlas has since 2009 been gathering verified registrations spanning 200 years, for all the ca. 210 marine species found in Danish waters. The Fish Atlas is a citizen science project, because it relies partly on observations made by citizens from all over Denmark, and currently provides the most comprehensive national overview of past and current fish diversity (Carl and Møller, 2021).
The recent increase in citizen science-based research has created a new platform for large-scale research in the natural sciences (Newman et al., 2012; Sutherland et al., 2015; Kelly et al., 2020). In biodiversity research, citizen science was initially used to collect specimens for identification and registration by experts, and often on a relatively small scale (Roger and Klistorner, 2016). However, new methods like smartphone apps, [e.g., the Danish platform Arter (in English: Species) (Arter, 2022), the global platforms iNaturalist (2022) and eBird (Sullivan et al., 2009)] and eDNA analyses simplify the collection of samples and observations, making them more suitable for involving volunteers (i.e., citizen scientists) in large-scale biodiversity analyses.
The use of eDNA approaches (eDNA metabarcoding in particular) has in the last decade settled as a robust method for studying biodiversity of entire communities (Thomsen and Willerslev, 2015; Taberlet et al., 2018). Various environmental samples have been applied to this end, including freshwater (Agersnap et al., 2017; Strand et al., 2019; Jensen et al., 2021a), seawater (Thomsen et al., 2016; Sigsgaard et al., 2017; Knudsen et al., 2019), and terrestrial samples (Yoccoz et al., 2012; Thomsen and Sigsgaard, 2019; Zinger et al., 2019). The degradation rate of eDNA varies significantly across substrates, but relatively fast degradation within days or weeks has been demonstrated for aquatic samples (Thomsen et al., 2012a,b; Sigsgaard et al., 2016). For aquatic samples, the eDNA approach thus provides a close to immediate picture of species presence, and changes in aquatic eDNA composition have been shown to reflect seasonal turnover in fish communities (Sigsgaard et al., 2017; Stoeckle et al., 2017; Ushio et al., 2017). However, the large short-term variation in eDNA compositions (West et al., 2020; Zhang et al., 2020) makes it challenging to separate spatial variation in species composition from temporal variation, especially when monitoring eDNA across large geographical areas.
Monitoring large areas is also time-consuming and labor intensive, and several studies have thus identified the considerable potential in using eDNA together with citizen science to cover larger spatial scales (Larson et al., 2020; Meyer et al., 2021; Tøttrup et al., 2021). One of the first attempts to integrate citizen science and eDNA-based monitoring focused on the great crested newt (Triturus cristatus) in a national survey in the United Kingdom (Biggs et al., 2015). Here, citizen scientists collected water samples from local ponds during the breeding season of T. cristatus and shipped the samples to a research laboratory for eDNA analysis. Samples were analyzed using species-specific quantitative PCR (qPCR) assays. The study showed that citizen scientists were able to collect high quality eDNA samples, and that a citizen science-based eDNA approach can supplement traditional monitoring methods for endangered species. Today, citizen science-based eDNA projects monitoring entire communities of organisms are emerging. Meyer et al. (2021) recently presented an ambitious long-term citizen science project, “CALeDNA,” which seeks to investigate statewide biodiversity in California using eDNA. They have successfully involved more than a thousand “community scientists” in collecting eDNA samples and have built up the necessary infrastructure to receive and analyze large amounts of samples. Data from this project have been coupled with multiple environmental variables by Lin et al. (2021), illuminating the potential to use citizen science to establish new biodiversity baselines across the tree of life.
Here, we present the first citizen science-based eDNA study investigating marine biodiversity at a national scale. Marine water samples were filtered on the same day at the same time by volunteers in autumn 2019 and spring 2020 from 100 locations along the Danish coast. Analyzing the samples by means of eDNA metabarcoding, we performed a nationwide, seasonal “BioBlitz” of marine fish. Comparing the obtained eDNA data with the Fish Atlas database (Carl and Møller, 2021), we show that eDNA samples collected by untrained citizen scientists are of sufficient quality to provide reliable data on coastal fish communities. Although citizen science in combination with eDNA remains in its infancy (Larson et al., 2020), we argue that this combination will become an important means for large-scale biomonitoring of marine biodiversity in the future.
Materials and Methods
Citizen Scientist Recruitment and Framework
The research project described here was named ‘‘HavBlitz’’ (HB) (English: SeaBlitz)1 and represents a research collaboration between three universities and a Danish NGO. The Danish Society for Nature Conservation (DN) was in charge of recruitment of volunteers and communication with citizen scientists. DN is the largest environmental NGO in Denmark. It has a member base of 130,000 and more than 1,300 volunteers and is represented by local units in 96 out of 98 Danish municipalities. DN has experience in engaging their members in citizen science from previous projects in Denmark (‘‘Biodiversity now’’).2 Our aim was to involve members of DN, but also to find volunteers outside the NGO. Members were approached through DN newsletters and social media, whereas non-members were targeted through news stories in national media. Participants had to live up to the following requirements: (1) they had to be in good physical shape, (2) they had to live within an hour of driving from the sampling location, and (3) they had to have a freezer in order to preserve the collected sample.
Water sampling kits were sent to the volunteers approximately four weeks prior to sampling. Each water sampling kit contained a sterile 0.22 μm Sterivex-GP filter unit (Merck Life Science, Søborg, Denmark), luerlock caps, a 140 mL syringe, two pairs of gloves, a face mask, zip lock bags containing a silica gel packet (MiniPax ® absorbent packets), and a sampling protocol. Two independent volunteers visited each location in each season, both of which sampled 1 L of water, resulting in two samples from each location per season. In a few cases, only one volunteer visited the location, and the person was therefore asked to collect two samples. Volunteers were kept motivated and informed through multiple newsletters and texts, beginning one month prior to sampling. Most volunteers were also in direct contact with DN either by email or phone. As the volunteers returned samples using the Danish postal service, these could not be kept frozen at all times. We therefore performed a pilot test of using silica gel to dry the samples and thus potentially provide a better preservation of DNA, as suggested by Bakker et al. (2017). These tests indicated that silica gel had a positive effect on DNA preservation (unpublished data), and 5 g of silica gel was therefore included in the sampling kits.
Questionnaire for Citizen Scientists
A short questionnaire was sent out to all citizen scientists involved in sampling in the first season (autumn, 2019) to obtain feedback on the process and improve the experience for the volunteers at the second sampling event. We asked the following four questions: (1) “How satisfied have you been with your education/preparations for the sampling?” (2) “How would you evaluate environmental DNA sampling as a volunteer?” (3) “Would you participate in a similar citizen science project with DN another time?” (4) “Would you recommend to other people to participate in a similar citizen science project with DN?” Responses were made using ranked categories (e.g., “Very dissatisfied,” “Dissatisfied,” “Moderate,” “Satisfied,” “Very satisfied”) (Supplementary Figure 1).
Study Sites and Sampling
We selected a total of 100 coastal sites, covering Denmark from south to north and west to east (Figure 1 and Supplementary Table 1). The sampling sites chosen were hard substrate habitats at stone piers and groynes, often in connection with a harbor, to provide easy access for the volunteers. The water depth was between 0.5 and 3 m, and the sampling was initiated at precisely 1 p.m. on the 29th of September 2019 (this sampling event is hereafter referred to as autumn or HB1) and again at 1 p.m. on the 10th of May 2020 (spring or HB2). The volunteers were instructed both through a written protocol and a video protocol. At some locations, the filters clogged before reaching the desired water volume of 1 L. Between 300 and 1,000 mL of surface water were thus filtered per sample. Weather conditions varied across sampling sites, with moderate to strong westerly winds affecting some of the sampling on exposed locations such as the west coast of Denmark. At certain sampling locations, the volunteers were instructed to deviate a little from the exact location to find shelter and calmer water. To our knowledge, all samples were taken in dry weather, but some locations had rain prior to sampling. During sampling, the volunteers were able to call a telephone hotline and access a Facebook page for immediate questions. Samples were collected using single use gloves and face masks and were subsequently kept in a zip lock bag with a silica gel packet. The volunteers brought the samples home and stored them in their own freezers within 1 hour after sampling. After a minimum of 24 hours of freezing, samples were sent to Aarhus University using the Danish postal service (PostNord), which delivers domestic packages within 24–72 hours. Upon arrival, the samples were stored in a –20°C freezer until DNA extraction. Correlation between filtered water volume and species richness in each sample was investigated using a Pearson correlation analysis from the R-package ggpubr (v. 0.4.0) (Kassambara, 2020).
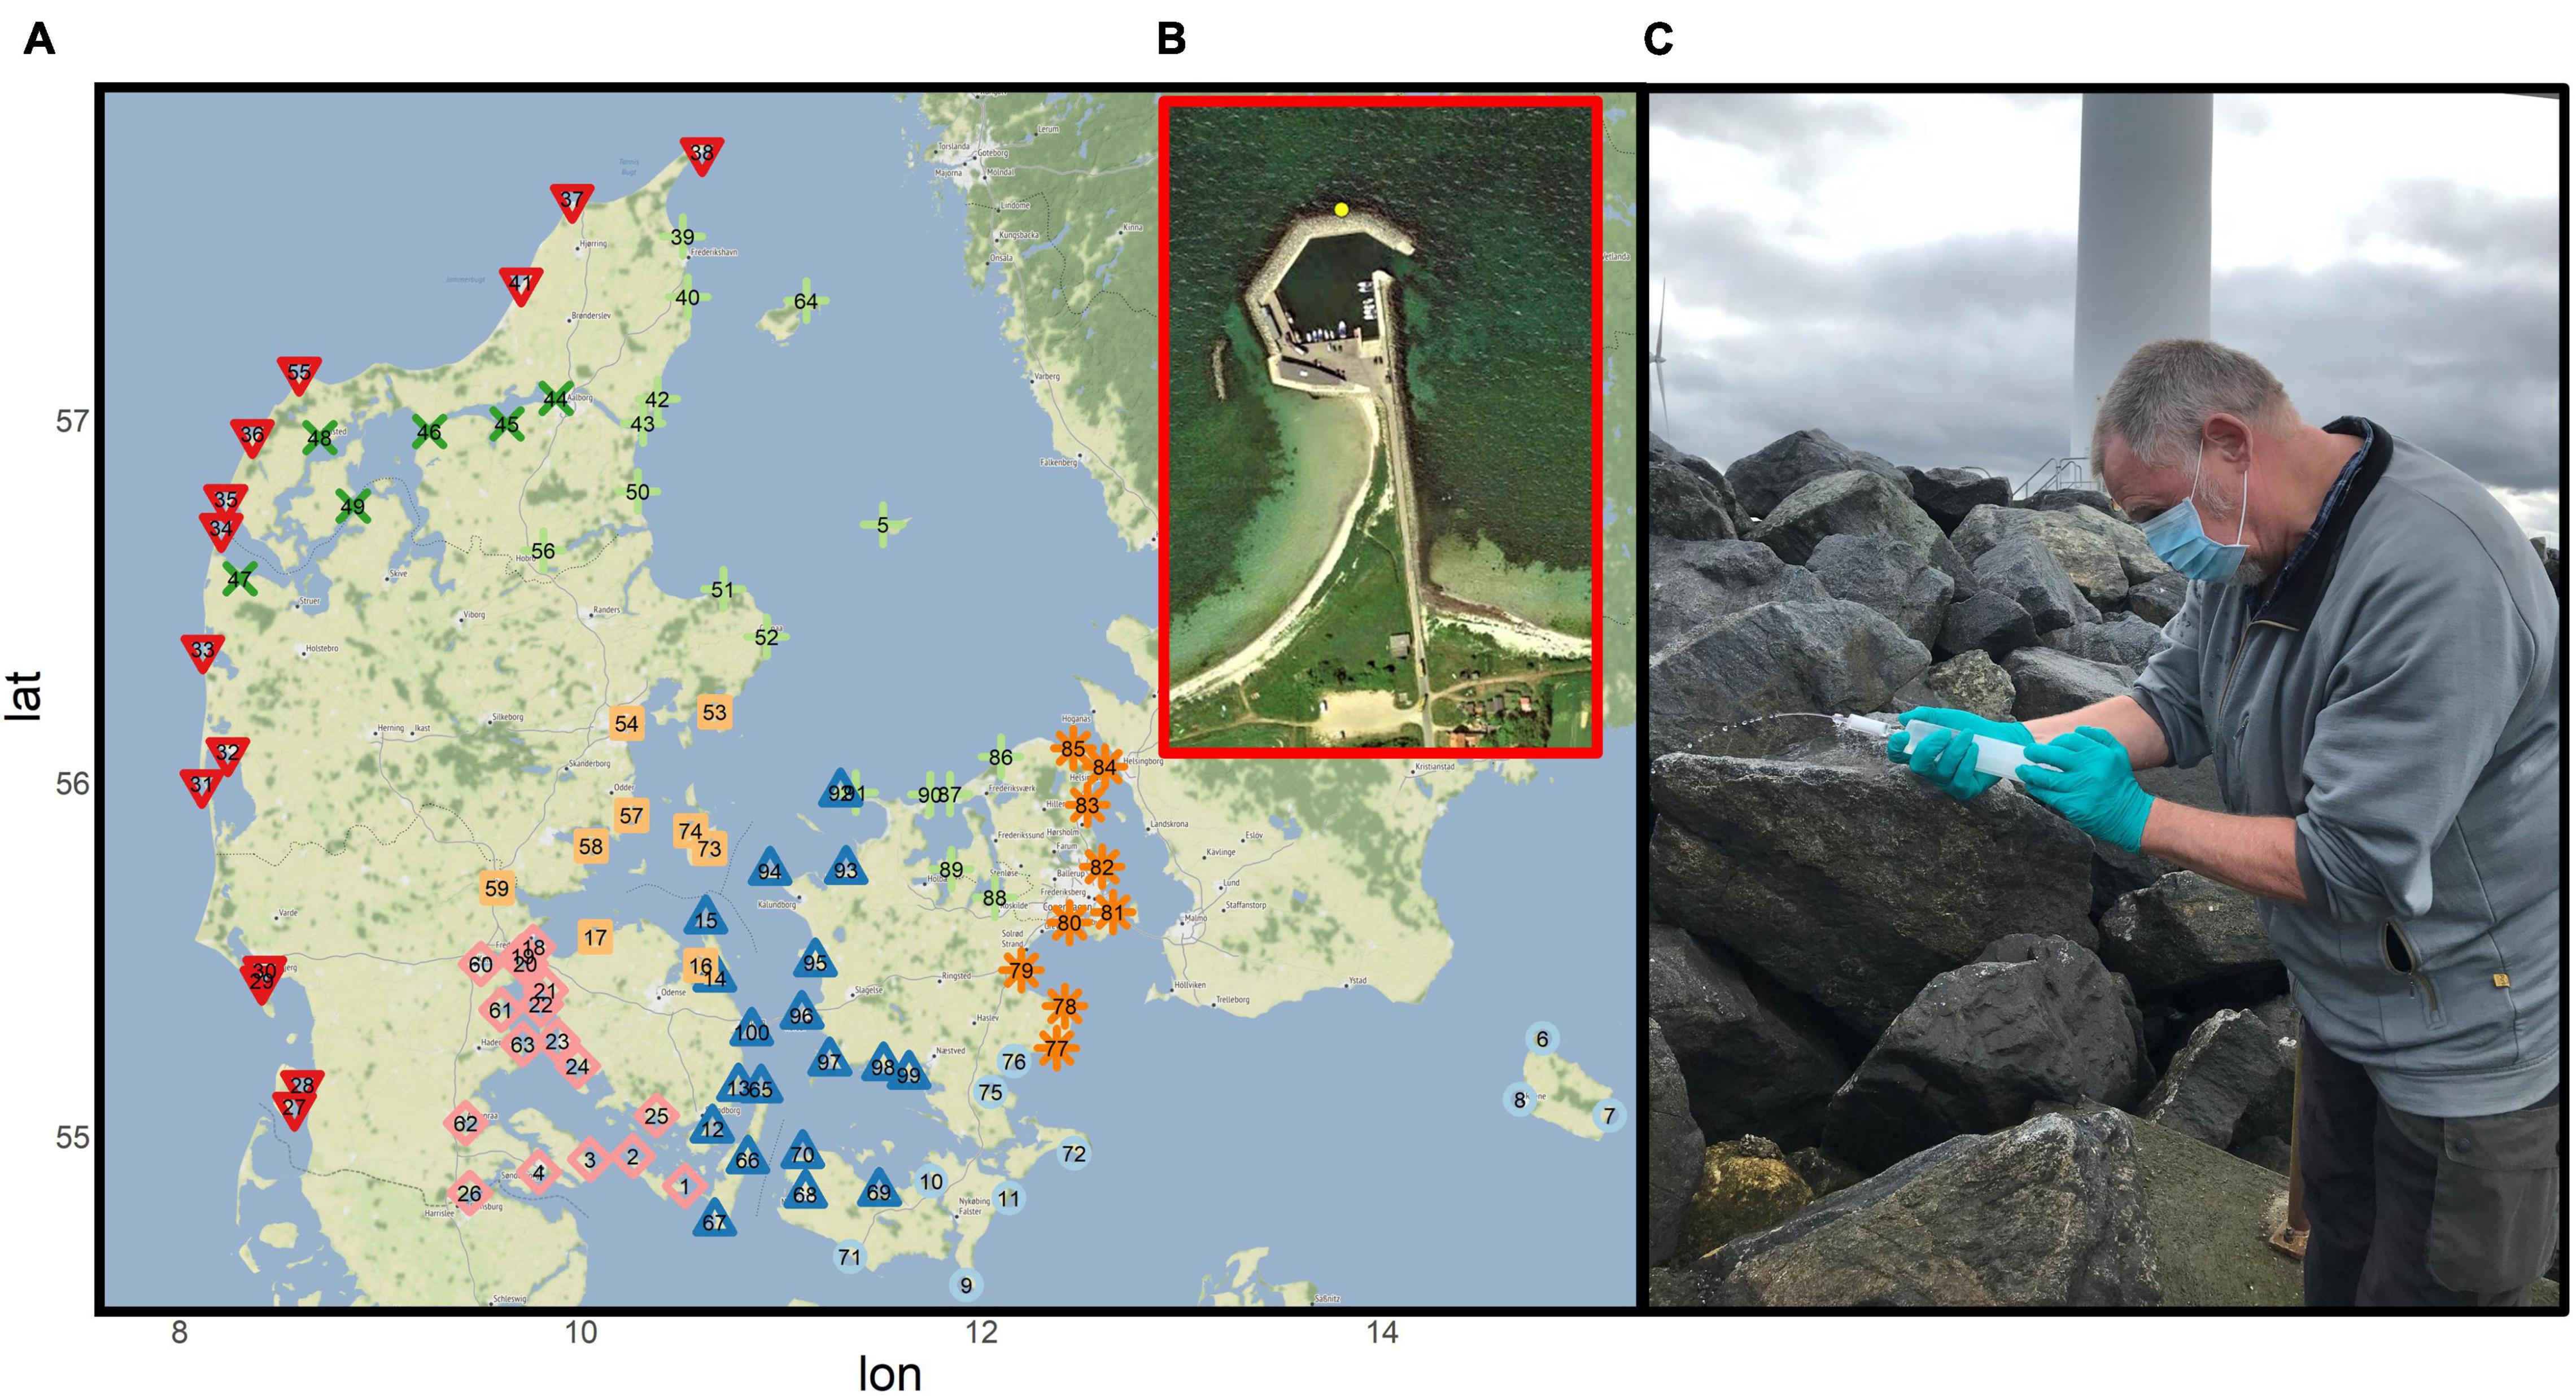
Figure 1. (A) Map of sampling sites in Denmark showing the 100 locations, which were sampled by citizen scientist on the 29th of September 2019 and again on the 10th of May 2020. Locations are divided into eight sub-areas based on marine regions, North Sea (red, triangle-down), Limfjord (dark green, cross), Kattegat (light green, plus), Samso Belt (light orange, squares), Great Belt (dark blue triangle-up), Little Belt (pink, diamond), Baltic Sea (light blue, circle), and The Sound (dark orange, asterix). (B) Røsnaes Harbour (number 94 on the map) representing a typical sampling site. (C) The citizen scientist Niels-Ole Hørlyk filtering water through the filter at Bønnerup Harbour (number 51 on the map) on the 29th of September 2020 (Photograph by: Niels-Ole Hørlyk).
DNA Extraction
All DNA extractions from filters were carried out in a clean laboratory facility at the Department of Biology, Aarhus University, which is dedicated to eDNA samples and other samples of low or degraded DNA content. Systematic decontamination routines are in place, including separated pre- and post-PCR work and UV-light. Prior to extractions, all samples were cleaned on the outside using DNA AWAY™ (Thermo Fisher Scientific, Carlsbad, CA, United States). DNA was extracted using the DNeasy ® Blood & Tissue kit (Qiagen, Hilden, Germany). We used four times more AL buffer and proteinase K compared to the manufacturer’s protocol and an incubation time of 2–3 hours. Beads (1 g) were added to each sample together with ATL buffer and vortexed rigorously for 3 min prior to incubation. The two samples from the same location and season were pooled after incubation and mixed with AL buffer and 96% ethanol. The mixture was then spun through a spin column and washed with AW1 and AW2 buffer, before finally being incubated with elution buffer AE (2*60 μL) over two rounds of 37°C for 10 minutes (Sigsgaard et al., 2019). An extraction negative control (CNE) was included for each extraction batch, resulting in eight and twelve blanks per season, respectively. All extracted samples and extraction blanks were stored at –20°C until further analysis.
PCR Amplification
PCR amplification was performed using a primer mix containing both the Tele02 and the Elas01 primers (Taberlet et al., 2018). These primers are modified versions of the MiFish universal and MiFish elasmobranch primers designed by Miya et al. (2015) and, of which the forward primer Tele02-F was first presented by Thomsen et al. (2016) as “V05F_898.” The forward primer Tele02-F (5’-AAACTCGTGCCAGCCACC-3’) and the reverse primer Tele02-R (3’-GGGTATCTAATCCCAGTTTG-5’), together amplify approximately 167 bp of the 12S rRNA gene in the mitochondrial DNA (mtDNA) (Taberlet et al., 2018). Primers were uniquely tagged. Tags were designed using the OligoTag program (Coissac, 2012), and consisted of six nucleotides with a distance of at least three bases between any two tags. Tags were preceded by two or three random bases; NNN or NN (Barba et al., 2014), and identical tags were used on the forward and reverse primers for each sample (Zinger et al., 2019), to eliminate errors due to tag jumps (Schnell et al., 2015).
The samples from a season could not be PCR amplified all at once and were thus divided into two separate PCR setups. Every PCR setup included one PCR replicate of each of around 50 samples, one replicate of each of the corresponding CNEs, and one template control (NTC). To obtain technical replicates, each PCR setup was repeated four times, using identical tags for each PCR replicate, but a unique tag for each sample. Some samples of darker color were diluted 1:10 times prior to PCR to avoid inhibition. PCR reactions were performed in 25 μL reactions, using 10 μL HotStarTaq Master Mix (Qiagen, Cat. no. 203445), 10 μL H2O, 1 μL BSA (Bionordica, Cat. no. B9000S), 1 μL of primer mix [Tele01-F (5 μM), Tele01-R (5 μM), Elas01-F (5 μM), Elas01-R (5 μM)] and 3 μL DNA template. Thermocycler conditions were: an initial 15 minutes denaturing at 95°C, followed by 45 cycles of 94°C for 30 s, 50°C for 30 s, and 72°C for 60 s, and a final extension step of 72°C for 7 minutes. DNA yield and fragment sizes were checked on 2% agarose gels stained with GelRed™.
Library Building and Illumina Sequencing
PCR amplicons were mixed into sixteen pools, corresponding to the four repetitions of each of the four PCR setups. A volume of 4 μL was used of each PCR replicate. Pools were purified using the MinElute PCR purification kit (Qiagen), following the manufacturer’s protocol, except for at the last incubation step, which was done using 2*20 μL elution buffer over two rounds of 37°C for 10 minutes. A purification blank was included. Library building was done using the TruSeq DNA PCR-free LT sample Prep Kit from Illumina, with a 750 ng input of PCR products from each pool, as measured using the Qubit HS DNA Kit (Thermofisher Scientific, Carlsbad, CA, United States). For autumn samples, library building was done at Aarhus University, while libraries for spring samples were built by Novogene (Cambridge, United Kingdom). All libraries were sequenced by Novogene (Cambridge, United Kingdom) on an Illumina NovaSeq platform, using 150 PE sequencing and requesting 10 gigabasepairs (Gb) per library.
Bioinformatic Data Filtering and Analyses
The data were analyzed using the pipeline MetaBarFlow (Sigsgaard et al., 2022), which uses the python-based workflow tool gwf and parallel computing to process metabarcoding data. The workflow is mainly based on scripts from Frøslev et al. (2017) and the DADA2 error modelling (Callahan et al., 2016). The exact workflow used for the current paper are available upon request.
Raw reads were demultiplexed and trimmed of primers using Cutadapt (Martin, 2011), then quality trimmed with Sickle (Joshi and Fass, 2011) and filtered using the DADA2 algorithm (Callahan et al., 2016), an updated version of the DADA algorithm by Rosen et al. (2012). Up till this point, we followed the same bioinformatic procedure with the same parameter settings as in Sigsgaard et al. (2020). Amplicon Sequence Variants (ASVs) were then compared with a locally downloaded version of the NCBI nt database (downloaded April 6th, 2020, and November 26th, 2020, respectively for HB1 and HB2) using “blastn” (Benson et al., 2005). Results were shared with the citizen scientists when ready, which is why we used two different versions of the nt database. We specified up to 500 sequence hits, a minimum of 90% query coverage per high-scoring segment pair, and a minimum of 80% sequence similarity. Each sequence was then taxonomically classified using the R package taxizedb (Chamberlain and Arendsee, 2020), including only hits with 100% query coverage. All ASVs were also matched against our own newly created sequence database containing 12S mtDNA barcodes from Danish fish species, using Geneious (Kearse et al., 2012). These sequences are generated by Jensen et al., 2022 and available on NCBI with accession numbers MW995331-MW995387, but were not publicly available at the time of our blast query. We here specified thresholds of 100% query coverage and 100% sequence similarity. When a query sequence matched to a different species in our own database than in NCBI nt, the hit from our own database was given priority, due to the 100% similarity specifications applied and because sequences were thoroughly curated from Danish fish specimens. Hits with ambiguity in best matches were investigated for distribution of the matching species and if only one of the best matches were known to be present in Denmark, this species was chosen. In cases where several of the best matching species could appear in Denmark, we applied a last common ancestor identification. Finally, after inspecting all blastn outputs, only hits with a sequence similarity ≥ 99% and a query coverage of 100% were retained. The identified sequences from the Elas01 primers did not provide any additional species and the further data analysis was therefore only performed on sequences from the Tele02 primers.
ASVs occurring in an extraction blank or PCR blank in a higher number than in any seawater sample were excluded. Taxa occurring only in a single PCR replicate across the dataset were also removed. For each sample, the four PCR replicates were individually rarefied to the median read depth of all PCR replicates and aggregated and rarefied to the minimum median read depth of all samples (Cárcer et al., 2011). This was done to reduce differences induced by variation in sequencing depth. Rarefaction curves were performed using the function rarecurve from the R package vegan v. 2.5-7 (Oksanen et al., 2020) to explore whether the sequencing depth was sufficient to cover the taxonomic diversity present in each of the PCR replicates (Supplementary Figure 6). After normalization of sample reads, we filtered out taxa with a total read count below 500 reads for each season. Within each sample, taxa below a threshold of one in ten thousand of the total reads were removed, as suggested by Alberdi et al. (2017).
Bioinformatic analyses were run using the high-performance computing facility GenomeDK, Center for Genome Analysis and Personalized Medicine, Aarhus University. All data analyses subsequent to the taxonomic classification were performed in R v. 4.0.5 (R Core Team, 2020).
Danish National Fish Atlas Data
The Danish National Fish Atlas database holds a collection of almost all available records on fish occurrences in Denmark. For each of the 100 eDNA sampling locations, we retrieved a list of all marine, brackish and freshwater fish species recorded from within a 5 km radius. For each location, records from the Fish Atlas list were filtered in three steps: (i) identification quality, by using only records where specimens and/or photographs could confirm the identification of the fish, (ii) unique species name, by merging multiple records of the same species, (iii) species-level identifications, by removing family or genus level records. Coastal species are defined by the scientist behind the Fish Atlas, as species that are inhabiting and regularly observed along the coastal areas of Denmark.
Dissimilarity and Waterway Distances
Waterway distances were calculated using a custom R-script (available upon request). We used the “landmask” file (EEA, 2017) from the European Environmental Agency (EEA) to define terrain as either water or landmass at a maximum resolution of 500 m * 500 m (for a few locations we had to use higher resolution for connecting spatial points). All calculated waterway distances were plotted on a map and visually inspected to ensure that the shortest path was chosen. Whittaker dissimilarity scores between all location pairs (Whittaker, 1960) were calculated using the vegdist function of the R package vegan (v.2.5-7) (Oksanen et al., 2020), specifying Bray-Curtis as the distance metric and using presence/absence data. Linear regression was used to correlate distance and dissimilarity between sites. For both the dissimilarity and community composition analysis (see below), the two eDNA seasons were combined into one eDNA dataset and only locations where eDNA samples yielded > 10 unique species, when summing the findings from the two seasons, were included (n = 84).
Community Composition Analysis
To assess community composition, Jaccard distances (Jaccard, 1901; Tanimoto, 1957) were calculated and ordinated in three dimensions ordinated in three dimensions, but presented ordinates in pairs as two dimensional plots using non-metric multidimensional scaling (NMDS) with the vegdist function. The analyses were computed separately for each dataset (eDNA and Fish Atlas) and sampling sites were grouped into eight sub-areas (North Sea, Limfjord, Kattegat, Samso Belt, Great Belt, Little Belt, Baltic Sea and The Sound), based on geographical distribution (Teilmann et al., 2008; Brown et al., 2019; see Figure 1). To evaluate the effect of sub-areas and datasets, Jaccard dissimilarity matrices were tested for multivariate analysis of variance (PERMANOVA—adonis function) and homogeneity of variance (PERMDISP2—betadisper function) with bias adjustment for different sample sizes, both using 999 permutations. Significant differences in distance-to-centroid among sub-areas were evaluated using the TukeyHSD function. The envfit function was applied to investigate the association between latitude, longitude and community composition. All functions were from the R package vegan (v.2.5-7) (Oksanen et al., 2020).
Results
Sampling and Citizen Science
We engaged 178 and 182 citizen scientists for the sampling event in autumn 2019 (HB1) and spring 2020 (HB2), respectively. Together, they collected 185 and 188 water samples from 97 and 98 locations along the Danish coast, respectively (Figure 1). We received 172 (93%) and 176 (94%) of the collected samples and managed to extract eDNA from samples representing 96 and 95 locations, respectively. Combining both seasons, we successfully covered all 100 locations. A small but significant and positive correlation between volume of filtered water and species richness was found (R2 = 0.04 and p < 0.045).
A total of 80% of the citizen scientists replied to the questionnaire. The difficulty of eDNA sampling for volunteers was evaluated as “moderate” to “very easy” by 86% of respondents. When asked about their satisfaction with the preparations prior to sampling, 82% answered “moderate” to “highly satisfied.” And when asked whether they would participate in a similar citizen science event again, 97% answered that they would “most likely” or “definitely” do so, and 93% would recommend participation to others. The two biggest issues described by the citizen scientists were the difficulties associated with manually pushing water through the filter and climbing on the piers to collect water (Supplementary Figure 1).
Metabarcoding Reads and Taxonomic Diversity Obtained
A total of 1,221 M raw reads corresponding to 610.5 M read pairs were generated. Across all sixteen libraries, representing both seasons, we obtained a relatively equal sequencing depth with 31.21- 47.15 M reads per library (average of 38.15 M reads per library). After initial filtering and trimming, a total of 4–1,800 K reads per sample were retained (average of 339 K reads per sample, n = 191). The CNEs (n = 20) retained 0–0.31 M reads and NTCs (n = 20) retained 0–0.1 M reads. In total, we obtained 12,880 ASVs across all samples and both seasons, 5,161 of which matched metazoans. A total of 105 taxa could be taxonomically identified, including 52 bony fish taxa, 24 mammal taxa, 24 bird taxa, one taxon of starfish, one taxon of amphibians and three bacterial taxa (Table 1 and Supplementary Table 2). Fish and mammals constituted the majority of the reads, constituting 65% and 25% of the total reads, respectively (Supplementary Figure 2). Filtering out hits to other vertebrates than fishes, we obtained fish eDNA from 16 orders, 27 families, 48 genera, and 52 species across all water samples and across both seasons (Table 1 and Figure 2A). Certain species are identical in the Tele02 barcode (Supplementary Table 3) and matches to such species pairs were conservatively counted as one species. Both extraction and PCR controls contained ASVs representing Homo sapiens. Extraction blanks contained only one fish ASV, representing bleak (Alburnus alburnus). This species was also detected in the water samples, but in lower read abundance, and was thus removed from the dataset. PCR controls contained no fish ASVs.
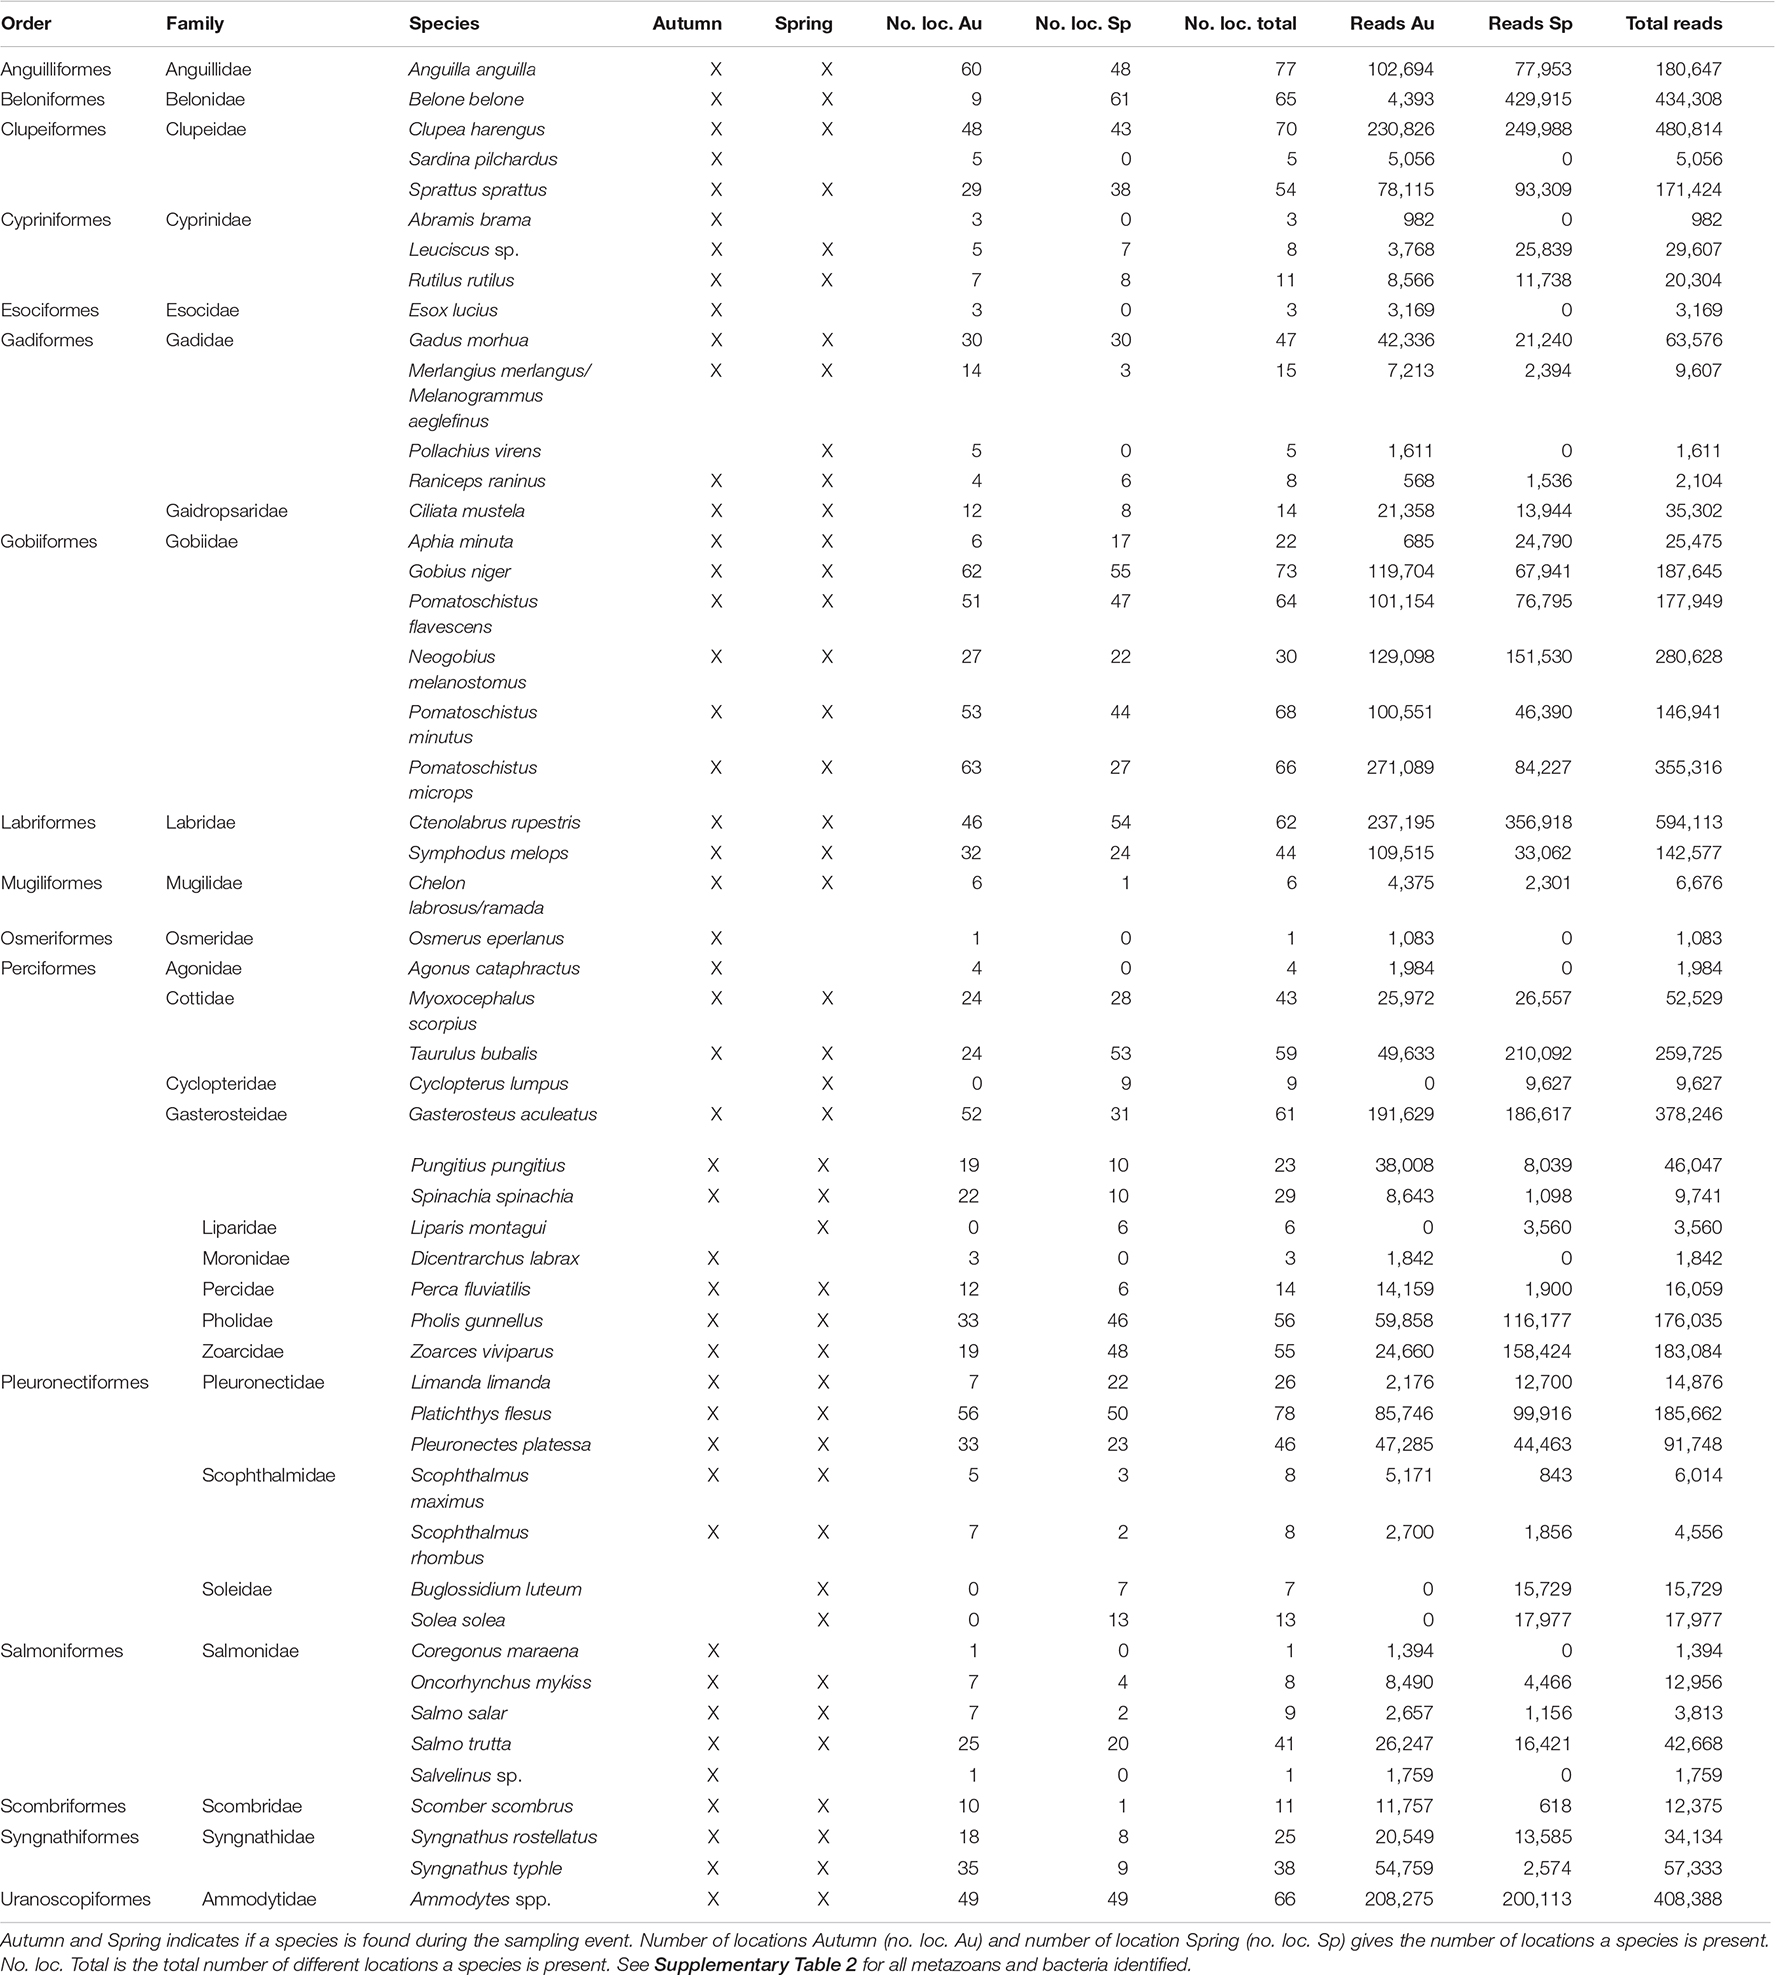
Table 1. Overview of seasonal presence and sequence abundance in both autumn and spring of all fish taxa identified.
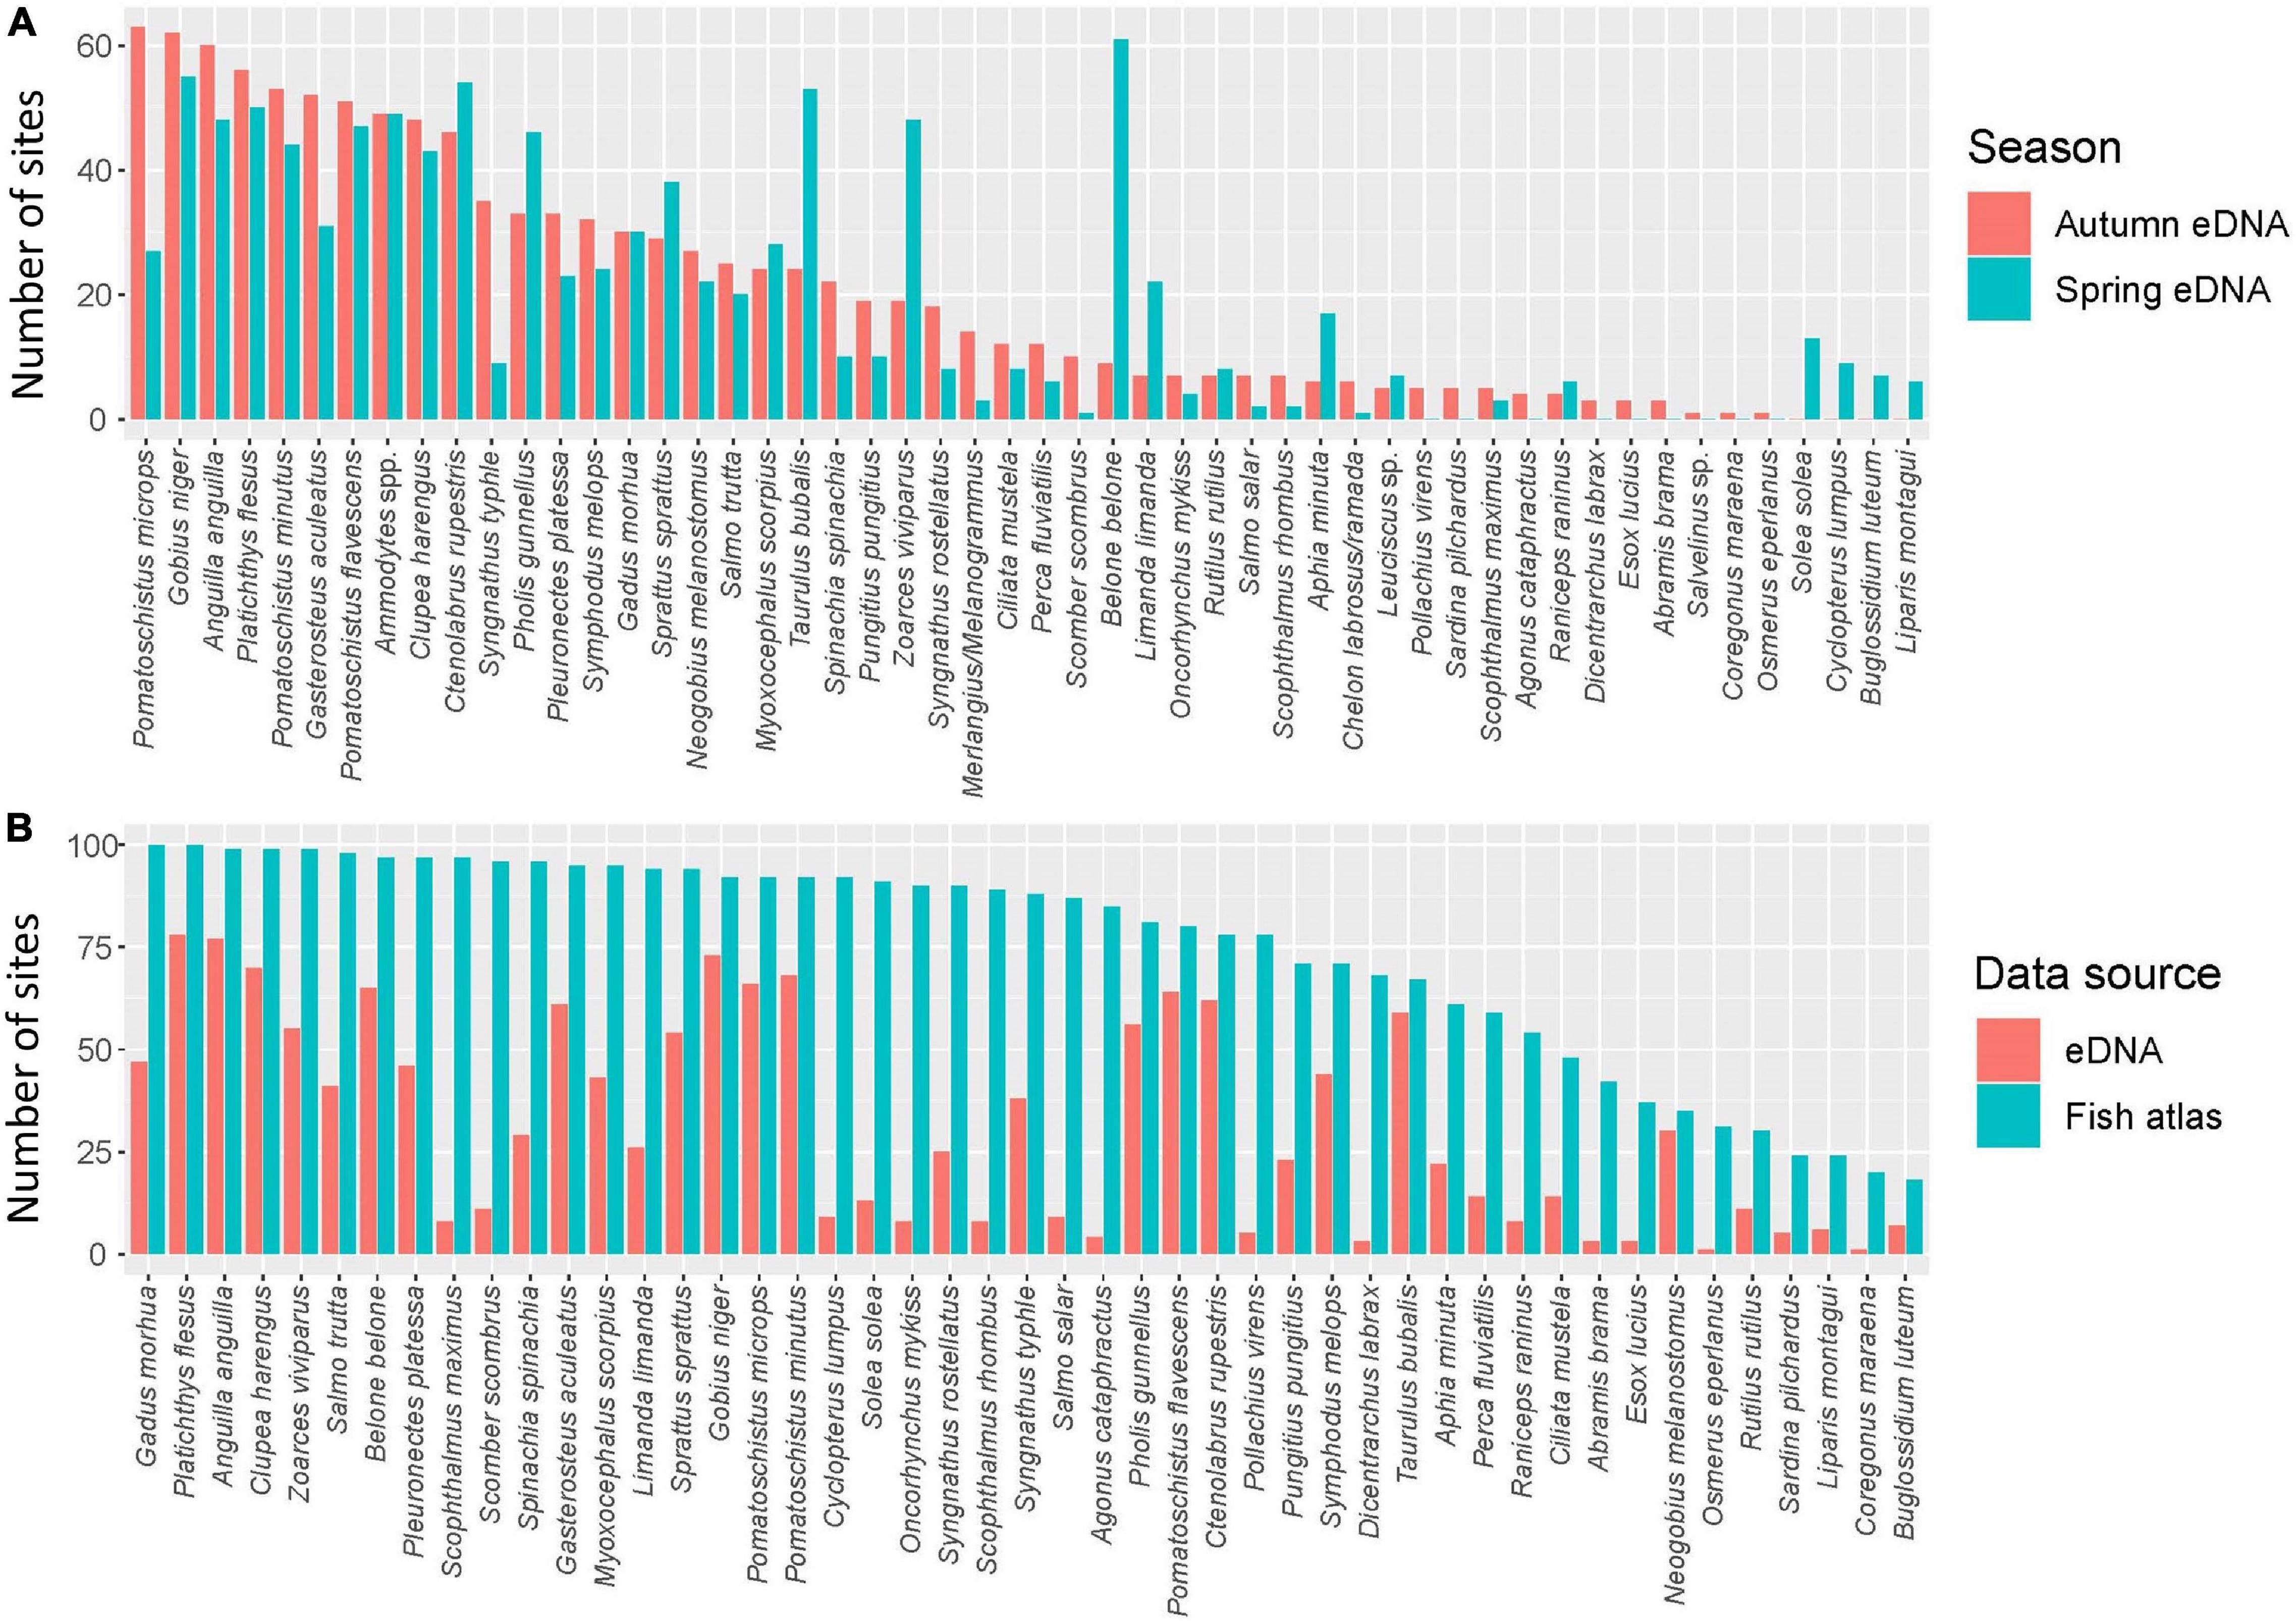
Figure 2. The number of locations each species occurs in. (A) Occurrence patterns between the two seasons autumn (blue) and spring (red). (B) Accumulated occurrence patterns from eDNA for both seasons (red) and the Fish Atlas (blue). For the comparison between the fish atlas and both seasons, only species that were identified to species level were included, with the exception of Ammodytes spp. and Salvelinus sp.
Excluding taxa represented by less than one ten thousandth of the total read count per sample removed between one and three taxa from nine samples in HB1 and from each of thirty samples in HB2. Removal of more than three taxa occurred only in a single sample, HB051 in HB2, where eleven taxa were removed. The removed taxa included two obvious contaminants (i.e., species that have never been recorded along the Danish coasts); whale shark (Rhincodon typus) with 486 reads and blue whiting (Micromesistius poutassou) with 159 reads. Environmental samples containing whale shark DNA were processed in our lab around the same time as the samples for the current study and this is most likely the source of contamination. Other taxa removed by the threshold were unlikely to be contaminants (i.e., species that are known to occur along the Danish coasts and could be true detections), including topknot (Zeugopterus punctatus) with 275 reads, golden grey mullet (Chelon auratus) with 439 reads and European anchovy (Engraulis encrasicolus) with 469 reads.
Seasonal Occurrence of Fish eDNA
We detected a total of 48 fish species in the autumn 2019 sampling, and 43 species in the spring 2020 sampling (Table 1 and Figure 2A). The European flounder (Platichthys flesus) was the most frequently detected species overall, while the common goby (Pomatoschistus microps) and the seasonally migratory garfish (Belone belone) were the most frequently detected species in autumn and in spring, respectively. The latter two species were among several species exhibiting a substantial seasonal difference in occurrence (Figure 2A). Species only occurring in one season were generally found at very few locations (the most frequent being the common sole (Solea solea), which was found on 13 locations in the spring, but none in the autumn) (Table 1).
Comparison of eDNA and Fish Atlas Data
The Fish Atlas data indicated that most of the detected species are common and widely distributed in Denmark (Table 1 and Figure 2B). Of the ca. 210 Danish marine fish species, 64 are known to occur in the coastal areas. The 52 species detected in the current study thus represent approximately 25% of all Danish marine fishes and approximately 80% of all Danish coastal fishes. In the Fish Atlas data for the study locations, Skagen Harbour had the highest richness with 138 registered fish species and Kolund Harbour had the lowest with 28 species registered. In Skagen Harbour and Kolund Harbour, we detected 26 and 12 species with eDNA, respectively (Supplementary Figure 3). The highest richness inferred from eDNA across both seasons was found at Spodsbjerg, with 29 different species. Importantly, we found a low, but significant positive correlation (Pearson correlation test, R2-value 0.06, p < 0.05) between the diversity values obtained from eDNA and from Fish Atlas data (Supplementary Figure 4).
Fish Species Distributions
We generated a national distribution map for each species based on the eDNA results and compared this with Fish Atlas data for the same locations (Figure 3 and Supplementary Figure 5). For species with a distinct distribution, e.g., the round goby, an invasive species with an Eastern distribution (Figure 3A), or the two-spotted goby (Pomatoschistus flavescens), which does not occur along the west coast of Jutland (Figure 3B)—or species with a clear seasonal pattern, such as the garfish (Figure 3C), the two datasets were highly congruent. For species widely distributed across Denmark, such as the endangered European eel, eDNA results also captured this general pattern (Figure 3D).
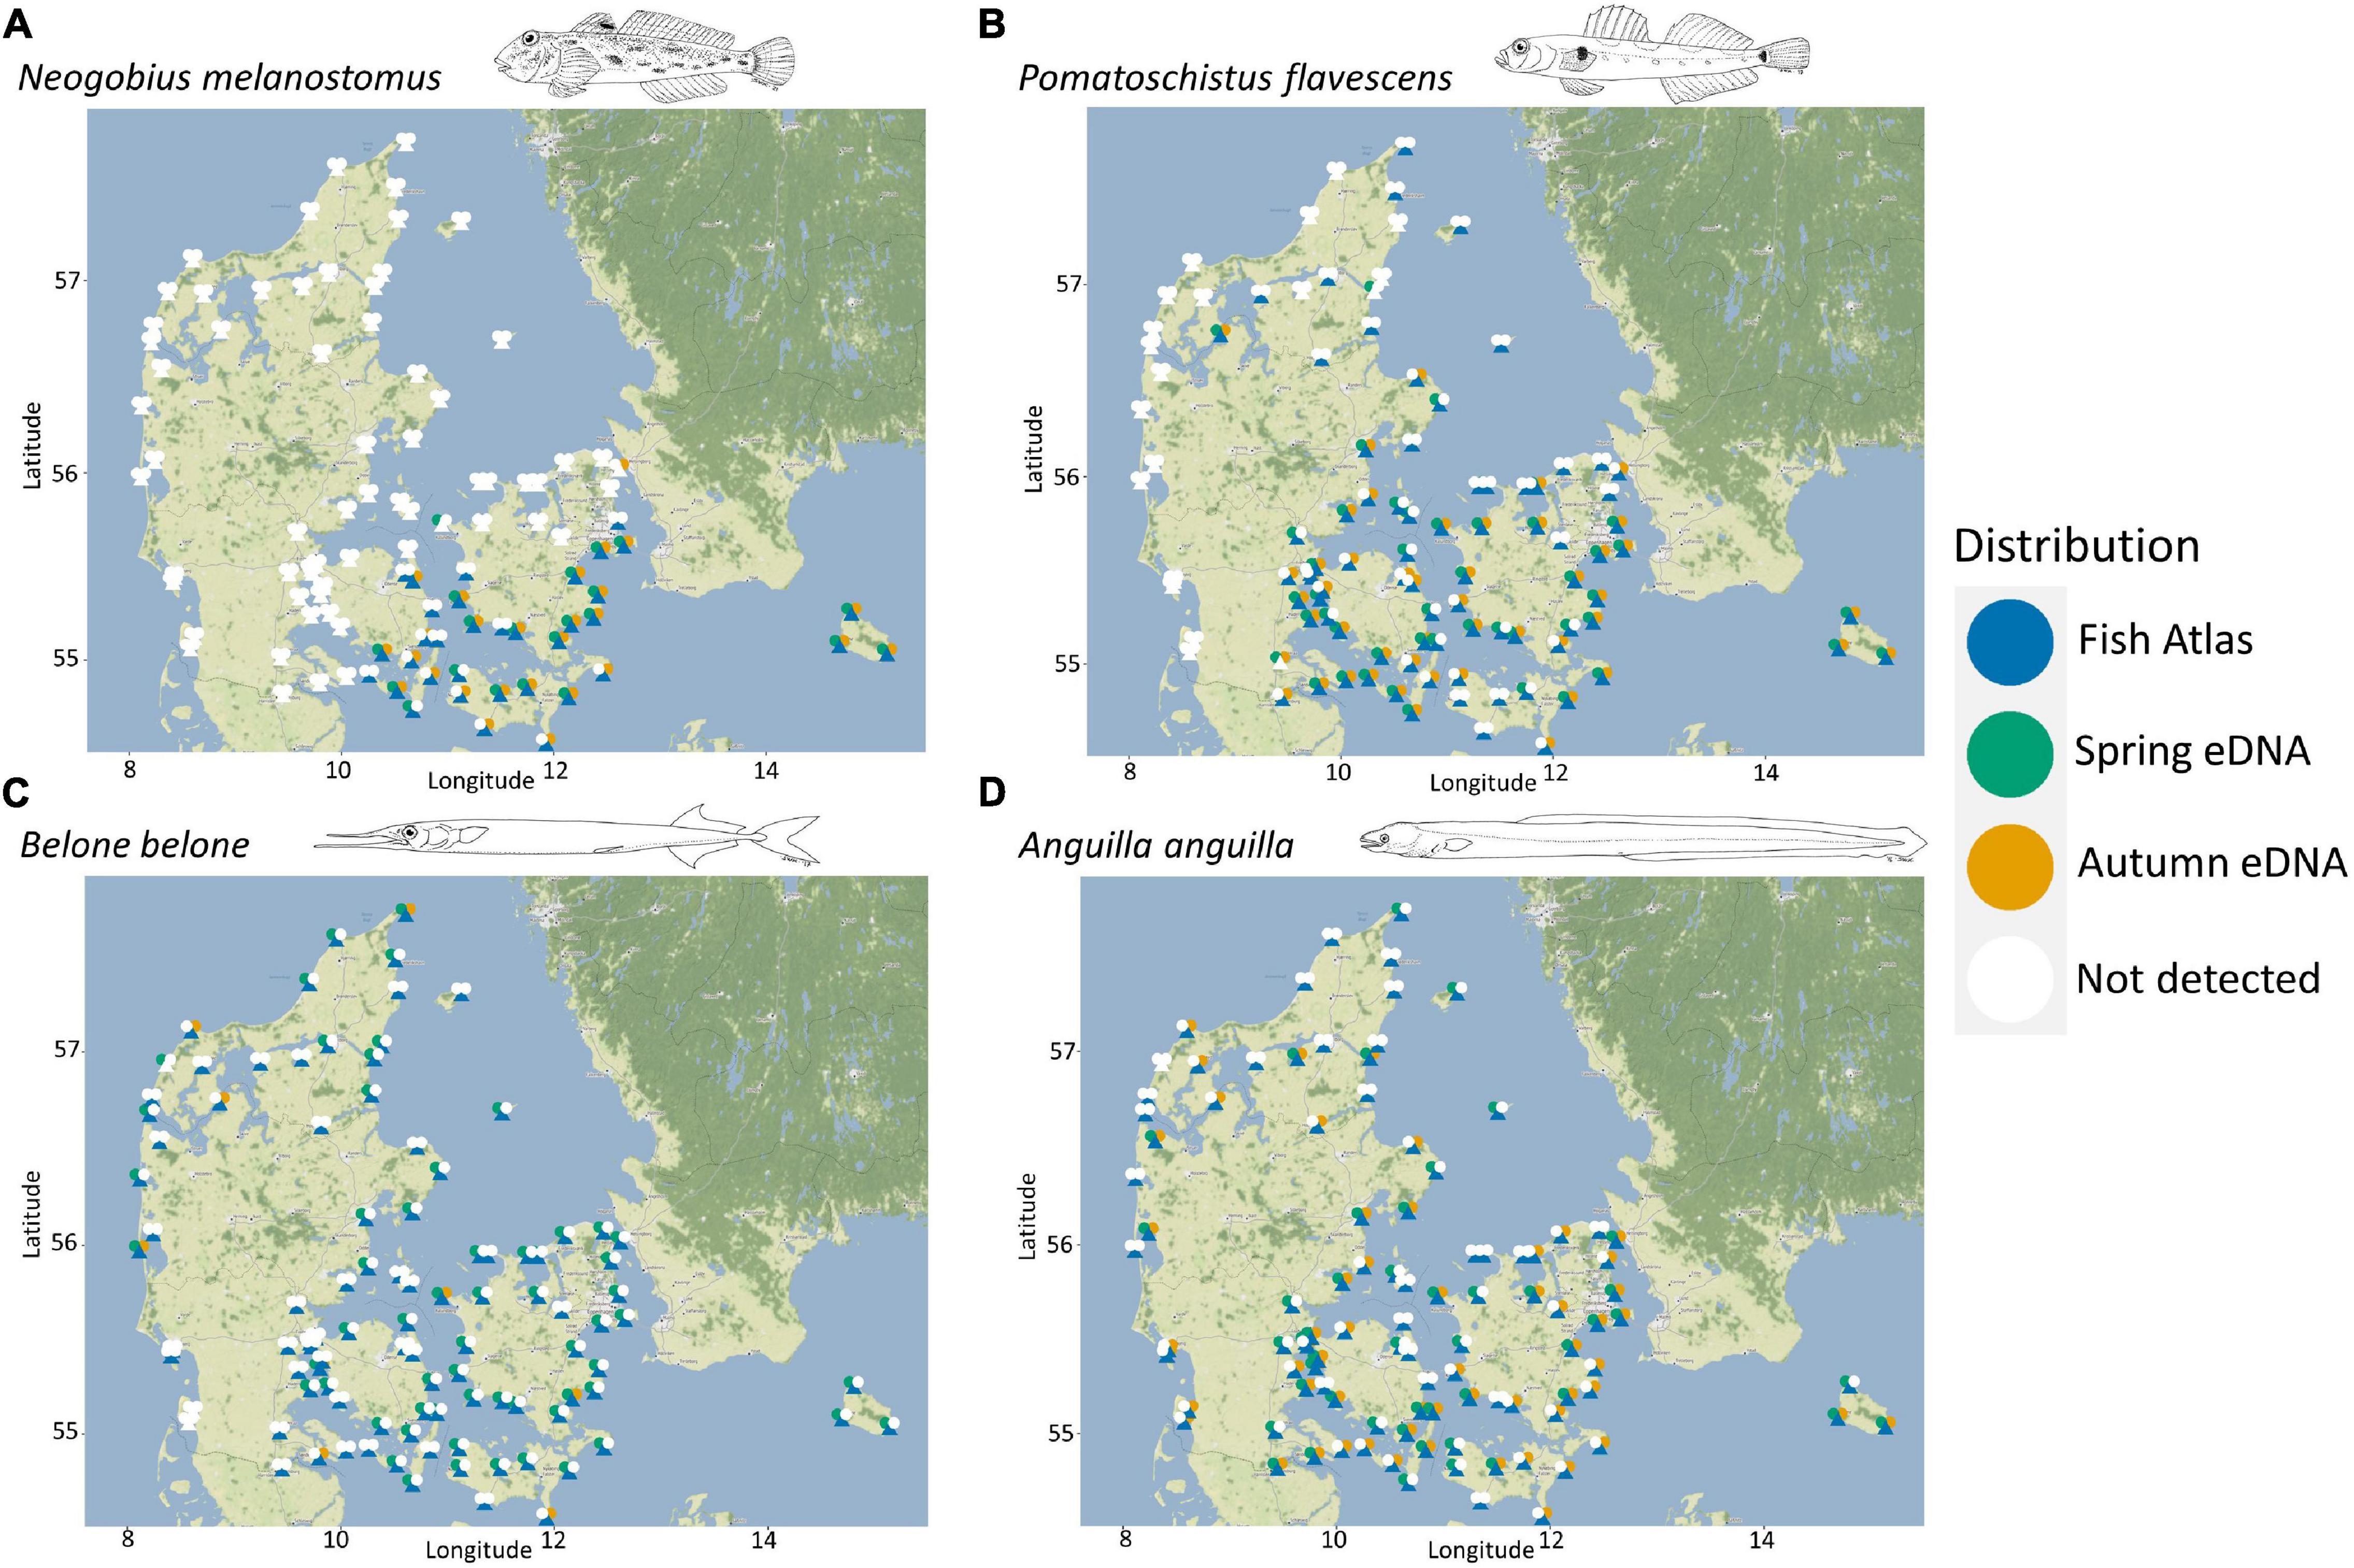
Figure 3. Species distribution examples representing: (A) round goby (Neogobius melanostomus), an invasive species with an eastern distribution and an ongoing western expansion, (B) two-spotted goby (Pomatoschistus flavescens), a species with a restricted distribution (i.e., not found on the west coast of Jutland), (C) garfish (Belone belone), the species with the strongest seasonally diverging signal in occurrence, (D) European eel (Anguilla anguilla), an endangered species with a wide distribution. Detections with eDNA during spring (bluish green) or autumn (vermilion) are represented by the “left” and “right” circle, respectively. Registrations by the Fish Atlas (blue) are represented by triangles. White colored triangles or “left” and “right” circles indicate that the species is not detected on the location for the particular dataset. All fish drawings have been made by Steen Wilhelm Knudsen.
Dissimilarity and Distance Matrix
Whittaker dissimilarity scores between sampling locations ranged from 0.05 to 1.00 (average: 0.45), with the locations HB082 (Skovshoved Harbour) and HB095 (Mullerup Harbour) which are 186 km apart, being the most similar. Three location pairs showed no overlap in species composition; HB025 (Fjellebro Harbour) and HB035 (groyn at Agger) which are 411 km apart, HB035 and HB075 (Praesto Harbour) which are 458 km apart and HB075 and HB040 (Saeby Harbour) which are 313 km apart (Figure 1 and Figure 4A). We found a highly significant positive correlation between “distance between locations” and “Whittaker dissimilarity” (Figure 4B) (adjusted R2 = 0.20 and p < 0.001).
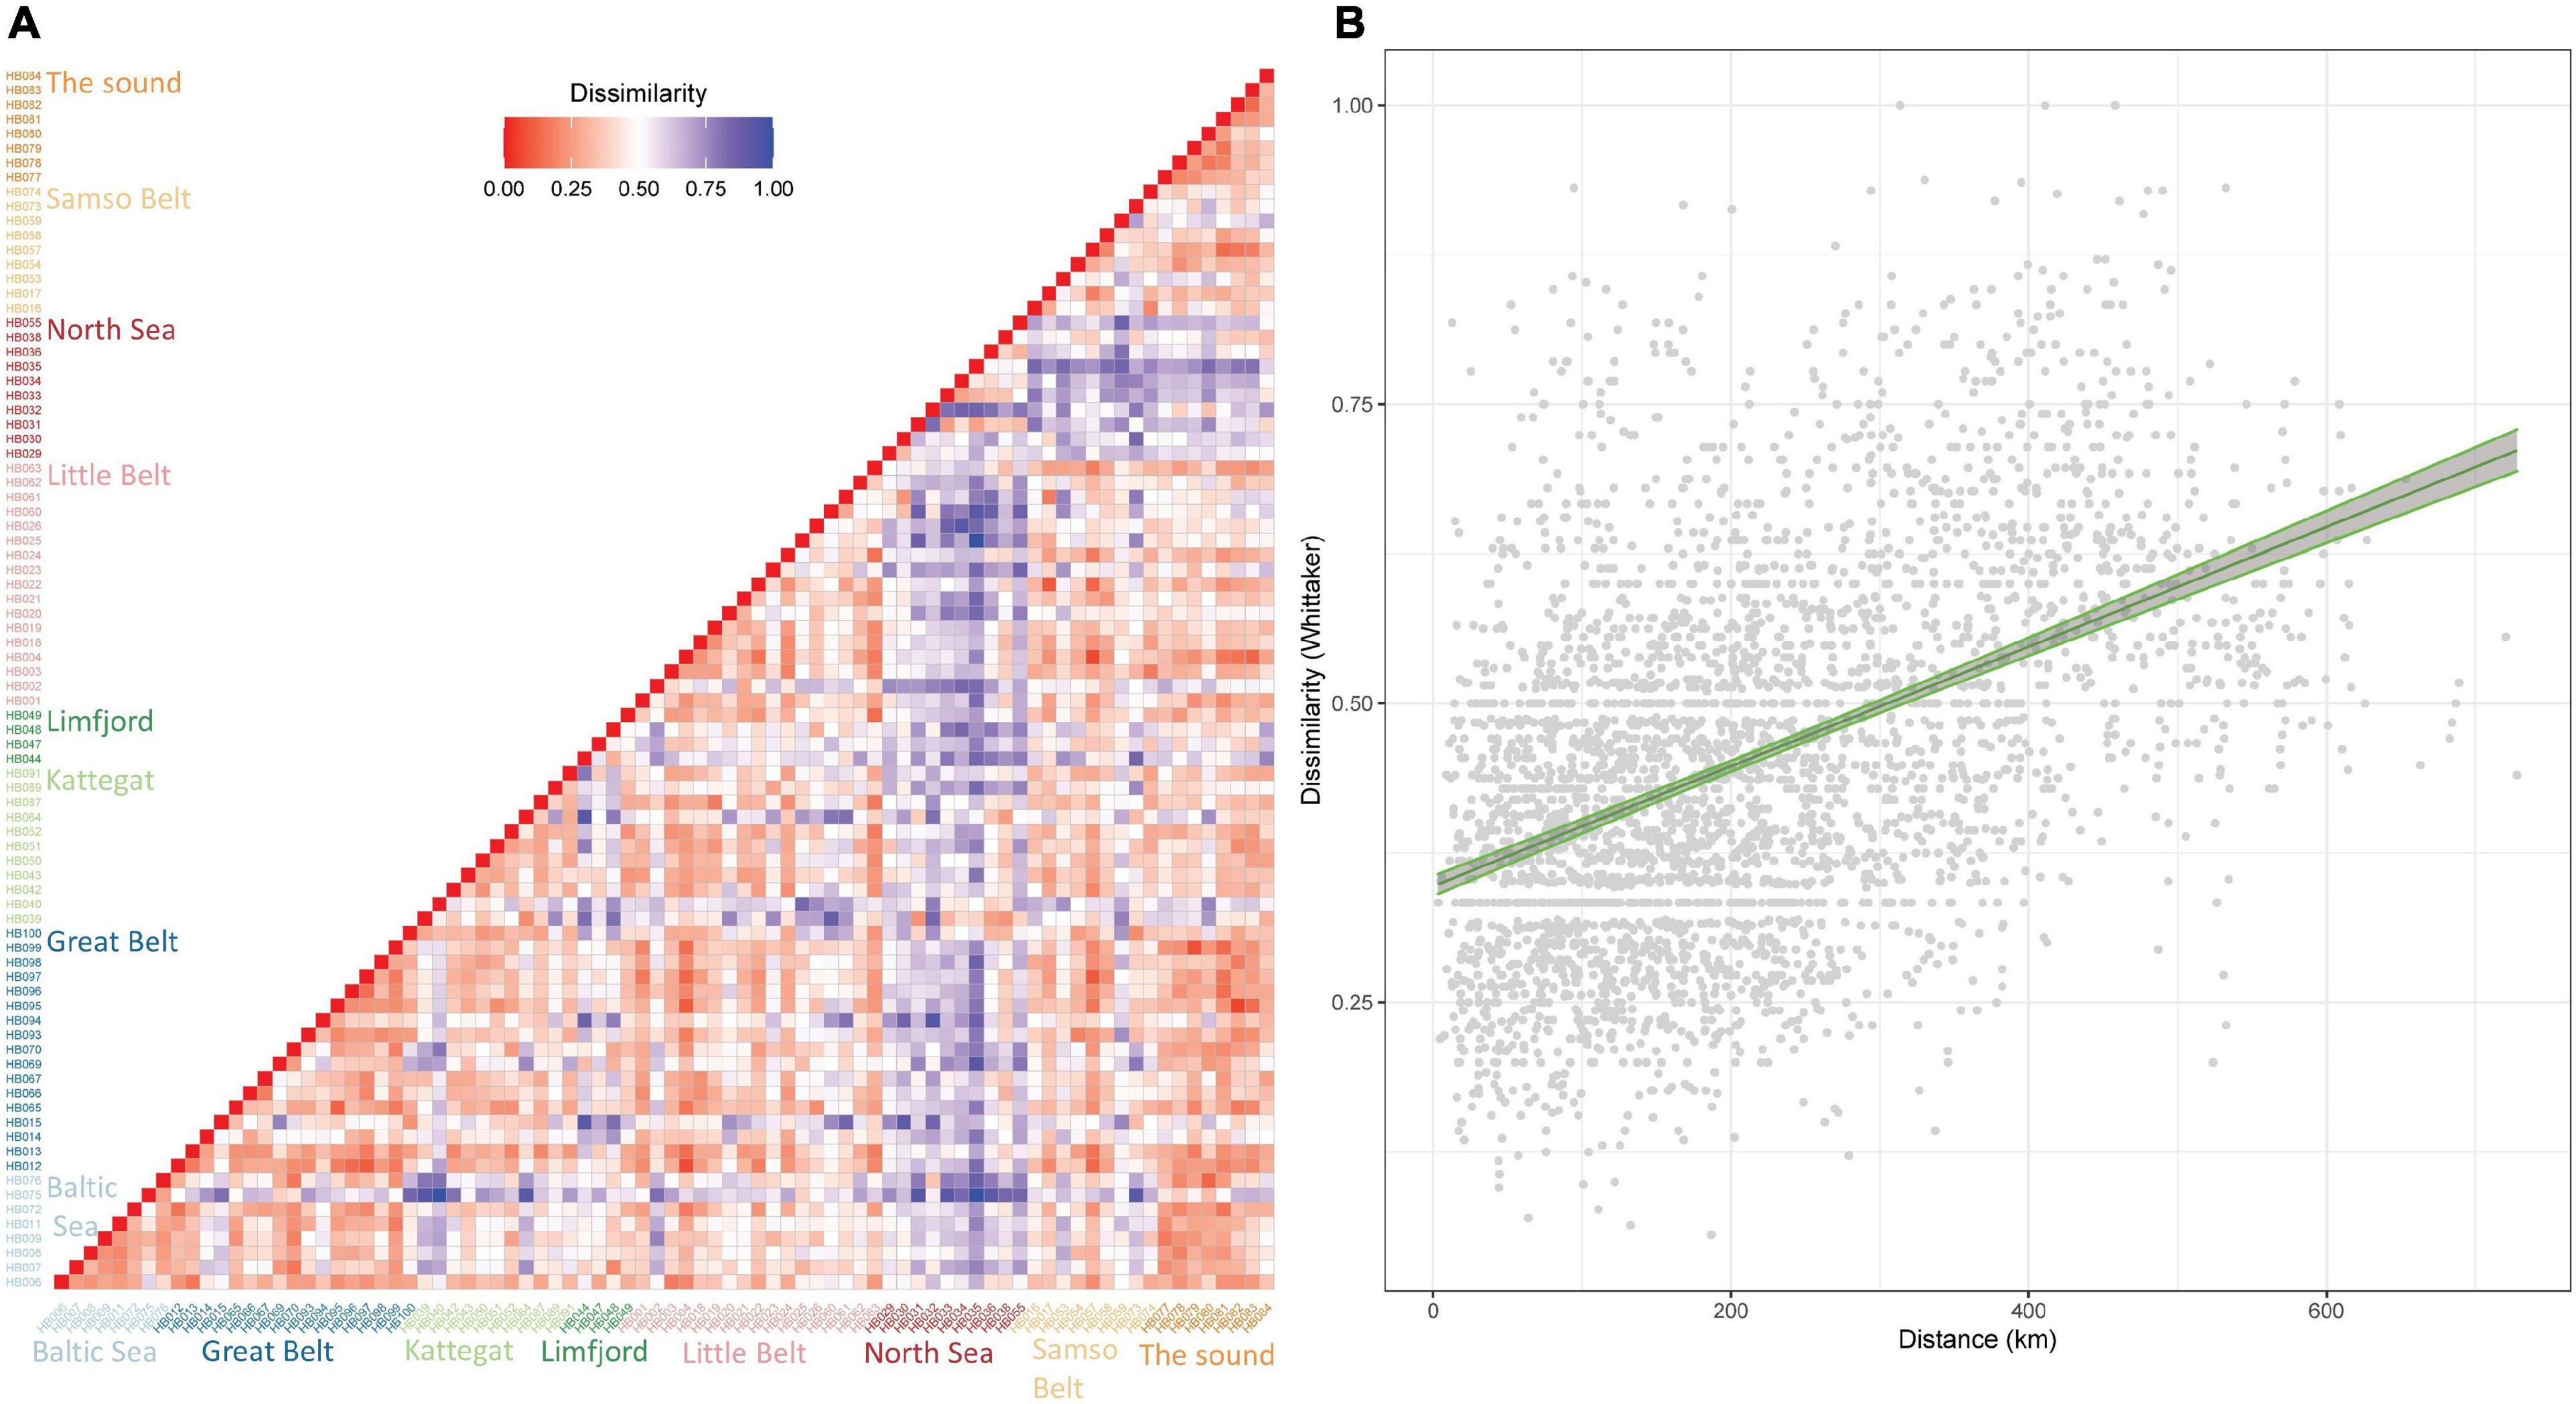
Figure 4. (A) Presence-absence beta diversity between locations. A heatmap representing the Whittaker dissimilarity matrix among locations. Locations are colored according to sub-areas: North Sea (red), Limfjord (dark green), Kattegat (light green), Samso Belt (light orange), Great Belt (dark blue), Little Belt (pink), Baltic Sea (light blue) and The Sound (dark orange). There is a pattern that locations on the Danish west coast (“North Sea”) are more dissimilar to the other locations. (B) Using linear regression, there is a highly significant correlation between dissimilarity and distance between locations. Confidence intervals of 95% are shown in grey along the line with edges of the confidence intervals in green.
Community Composition Analysis
Ordinations of eDNA and Fish Atlas records from 84 sites, based on species presence-absence data, are shown as two dimensional plots along three axes in Figure 5. For both eDNA and Fish Atlas data, a significant effect of sub-area was detected, and the proportion of variance explained by the sub-area was identical (PERMANOVA; p < 0.001; R2 = 0.26, same values for both datasets). There was a difference between the dispersion of sites among sub-areas for eDNA (PERMDISP; p < 0.03), but not for the Fish Atlas dataset (p < 0.19). However only the North Sea and The Sound showed a significant difference in distance-to-centroid (p < 0.03). A congruent distribution of sub-area centroids for eDNA and Fish Atlas data was found, such that North Sea consistently exhibited the highest axis 1 scores followed by Kattegat, while Baltic Sea and Limfjord always exhibited the lowest axis 1 score (Figures 5A–D). No clear pattern was observed between The Sound, Samso Belt, Little Belt and Great Belt. Moreover, a moderate association was observed between latitude and longitude and eDNA community structures (R2 = 0.07 and R2 = 0.04, respectively).
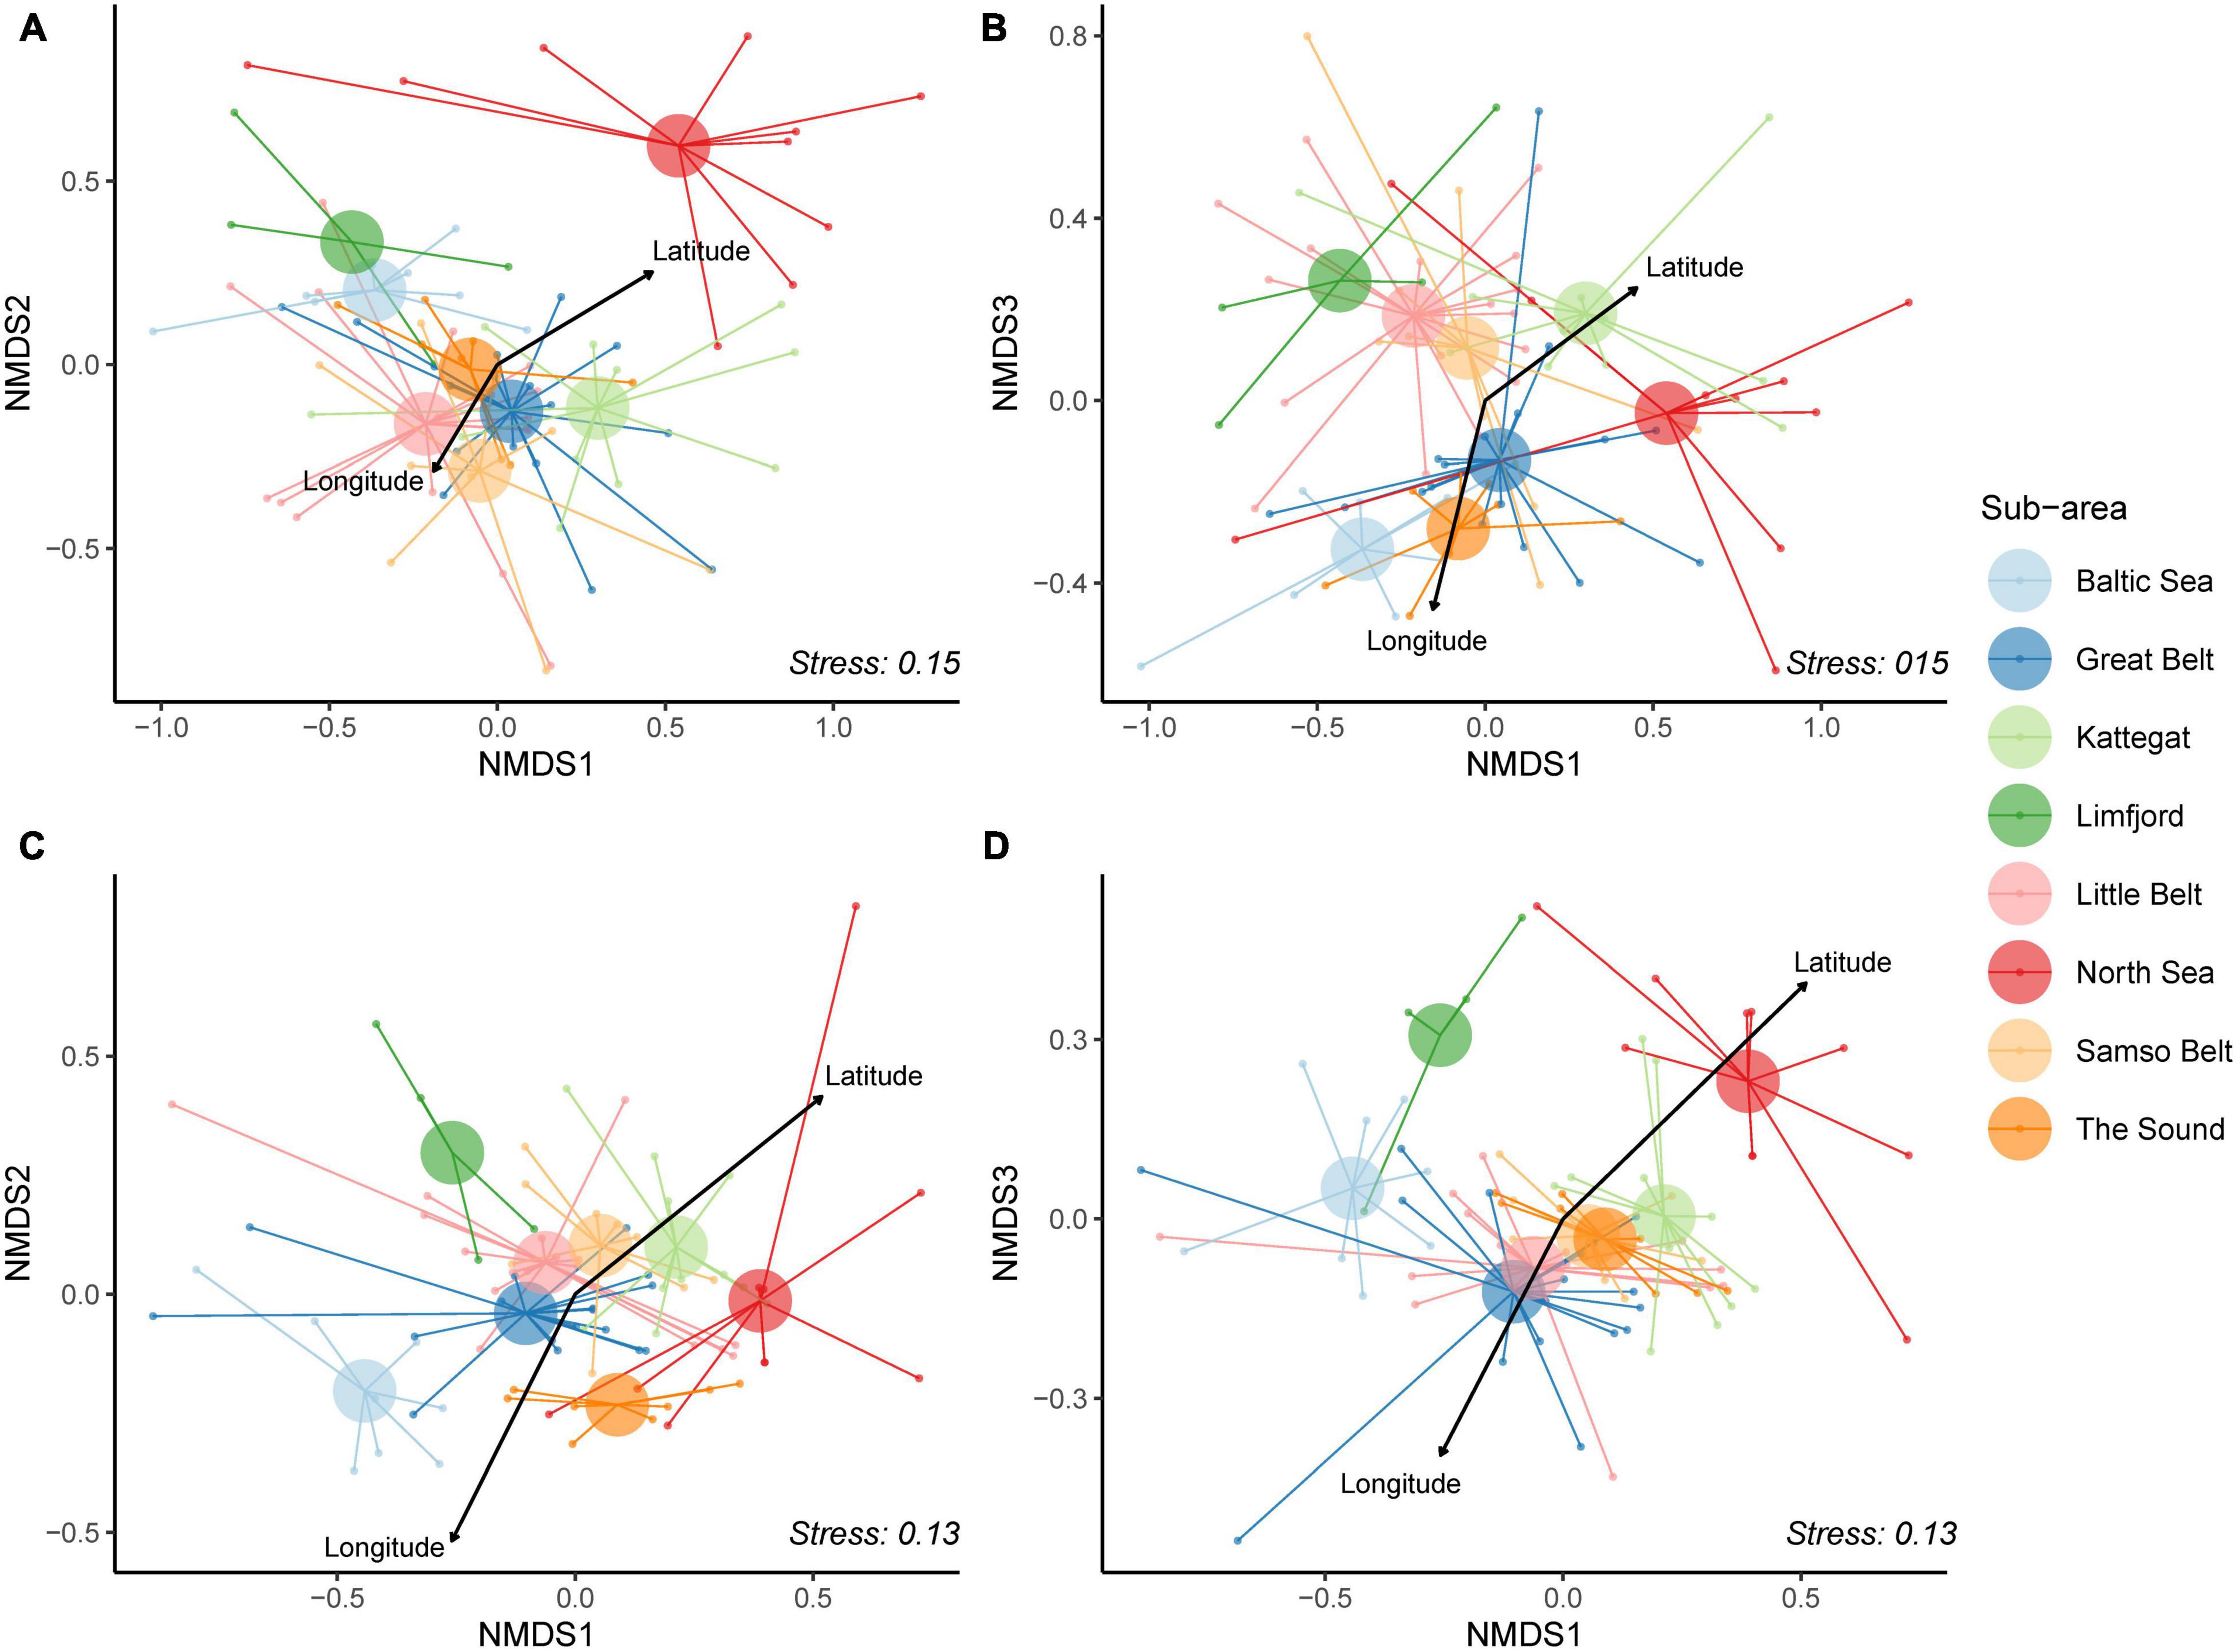
Figure 5. Non-metric multidimensional scaling (NMDS) on three dimensions were used on the presence-absence data for both datasets. (A) eDNA dataset on axis one and two. (B) eDNA dataset on axis one and three. (C) Fish Atlas dataset on axis one and two. (D) Fish Atlas dataset on axis one and three. The centroid of the sub-areas is enlarged and colored according to sub-areas: North Sea (red), Limfjord (dark green), Kattegat (light green), Samso Belt (light orange), Great Belt (dark blue), Little Belt (pink), Baltic Sea (light blue) and The Sound (dark orange). The Latitude and Longitude are showed, with the arrow length corresponding to their relative importance.
Discussion
Environmental DNA metabarcoding has become an established approach in aquatic biological research as well as in applied biodiversity monitoring, where eDNA methods offer new possibilities for the study of spatial and temporal distribution of biotas not possible or sustainable with traditional methods. However, eDNA sampling at larger spatial scales is difficult, as samples need to be collected within a relatively short time to be comparable. Fortunately, the eDNA sampling itself is quite simple compared to the more complicated downstream analyses, requiring clean laboratory facilities and rigorous laboratory and bioinformatic protocols. We therefore attempted to solve the challenge of covering large spatial scales on a short temporal scale by combining eDNA metabarcoding with citizen science. We performed a nationwide eDNA monitoring survey of the Danish coastal fish fauna by engaging 360 volunteers to filter water using a standardized protocol at 100 sites over two seasons. Our approach demonstrated eDNA detection of approximately 80% of registered coastal Danish fish species. Despite the many different people involved in sampling, our results show seasonal variation in fish communities in accordance with known phenology, and we retrieve realistic distribution patterns of species with restricted distributions, including invasive, rare and cryptic species.
eDNA Sampling and Citizen Science
Citizen science has seen increased use in recent years within the biological sciences (Kelly et al., 2020; de Sherbinin et al., 2021; Wehn et al., 2021). Our study demonstrates that large-scale volunteer recruitment to marine eDNA projects is tenable, and we benefitted from a high level of commitment from the citizen scientists (94% of the samples were completed and returned). Also, the answers to our questionnaire indicated that the approach was perceived positively by the participants. The Sterivex filter provides a simple setup that decreases the risk of contamination and is easy to handle by volunteers. Some locations yielded a total number of fish species that was surprisingly low, given previous knowledge of the sites. For example, 16 locations (16% of total) yielded ≤ 10 detected fish species (Supplementary Table 1), while the actual number of species is most likely higher, given registrations in the Fish Atlas database (Supplementary Table 1). This is partly explained by variation in the amounts of filtered water, but might also be due to other factors such as, (i) the heterogenous distribution of eDNA in the water column leading to a high degree of random variation with only 2 samples (Cantera et al., 2019), (ii) varying shipment times of samples to the lab, (iii) stochasticity in PCR and sequencing success, or (iv) variation in quality of the samples. However, true diversity may also simply have been low at certain sites, due to biotic or abiotic factors at the time of sampling (Holm-Hansen et al., 2019). Regardless, the overall high congruence of eDNA results with previous knowledge and the high percentage of Danish coastal fish species detected, demonstrates that the citizen science approach is a powerful way of applying eDNA analysis at large spatial scales.
Monitoring the Danish Fish Fauna Using Citizen Science-Based eDNA Metabarcoding
Some species known to be common in the coastal waters of Denmark were absent from the eDNA data. This can be a result of one or more of the same factors mentioned above for low species richness values. In addition, some species may not have an optimal affinity to the primers. The undetected species included greater weever (Trachinus draco), common dragonet (Callionymus lyra), Atlantic horse mackerel (Trachurus trachurus), straightnose pipefish (Nerophis ophidion), painted goby (Pomatoschistus pictus) and greater pipefish (Syngnathus acus). Nester et al. (2020) showed that the Syngnathidae family were rarely detected due to taxonomic biases of the MiFish-U primers. But of the undetected species above, only C. lyra had (two) mismatches to Tele02-F and none had mismatches to Tele02-R (no sequences were available for P. pictus).
Contrary to the absence of common species in the eDNA data, a few uncommon and rather cryptic species were indeed detected. One example is Montagu’s seasnail (Liparis montagui), a small (2–10 cm) bottom-dwelling, brown to yellowish fish, commonly distributed in the northeastern Atlantic Ocean (Florin et al., 2013). Montagu’s seasnail inhabits the coastal waters where it hides under rocks and on macroalgae. It is rarely caught or observed, as it is tiny and inconspicuous, so its occurrence is likely underestimated. There are less than a hundred total registrations in Denmark, and they are primarily from the coastal areas facing toward Kattegat (Carl and Knudsen, 2018).
No truly unexpected or deep-water species were detected in the entire survey, which supports the validity of an eDNA citizen science approach. Salmonids are regular contaminants in eDNA studies (Kelly et al., 2014; Thomsen et al., 2016; Stoeckle et al., 2017), likely due to their widespread consumption, and the detections of Atlantic salmon (Salmo salar), sea trout (Salmo trutta) and rainbow trout (Onchorynchus mykiss) might therefore partly be due to false positives. The same may be the case for the European sea bass (Dicentrarchus labrax) and for the single detection of Salvelinus sp. in Vejle fjord. Stoeckle et al. (2017) unexpectedly detected eDNA from the former species in an estuary and speculates if this could be a result of sampling near areas with wastewater contamination. However, at least for the three salmonids, the distribution patterns obtained do not show obvious signs of contamination and species of Salvelinus are occasionally registered from streams in Jutland (Carl et al., 2012).
One of the most notable advantages of the current citizen science-based eDNA approach is the possibility of simultaneous sampling across a large spatial scale such as the entire coast of a country. Simultaneous sampling reduces the effect of temporal variations in environmental or biological parameters (Buxton et al., 2017; Djurhuus et al., 2020) on the results to an absolute minimum, facilitating comparisons between sites. Beentjes et al. (2019) investigated temporal and spatial patterns of eDNA in dune lakes and found large differences in eDNA composition between samples taken one week apart. Monuki et al. (2021) found day to day variation in marine fish eDNA composition from the same site in consistency with known fish behavior. Ely et al. (2021) shows that eDNA composition changed significant across time of day and that eDNA can display considerable heterogeneity, on an hourly basis. Jensen et al. (2022) sampled eDNA at a coastal site every hour for 32 consecutive hours and found differences in species composition between samples taken only one hour apart, although the most significant difference was between samples collected at midday and those collected at midnight. The only other way to sample simultaneously across many sites would be to deploy autonomous samples (Hansen et al., 2020). They are currently prohibitively expensive but could be a future possibility.
As expected, we found a significant positive correlation between geographical distance and community dissimilarity (Figure 4B). This may largely be explained by salinity, as those locations that are furthest apart in Danish seas are generally also the locations with the largest differences in salinity. The North Sea in the west holds the highest salinity levels in the area, while the Baltic Sea in the east holds the lowest.
National Fish Atlas Data vs. eDNA
We compared our eDNA data with data from the National Fish Atlas, as this is the most comprehensive database of Danish marine fish and provides an accurate distribution pattern for most species. We did not expect similar richness values for the two approaches, given that the Fish Atlas has accumulated observations for more than 200 years, while the eDNA data were collected in two days. Also, sampling and registration intensity for the Fish Atlas has varied during the long project period leading to inflated differences in detected species richness between sampling locations. Finally, some species might not occur on locations that they have previously been registered on, due to e.g., habitat destruction or eutrophication (Agger et al., 2012). Thus, the eDNA data cannot be expected to reflect the entire inventory of species in the Fish Atlas or the community composition found in this database for each of the locations. On the other hand, trends or patterns found across such different datasets are likely to be biologically meaningful. Intriguingly, we found a correlation of species richness between the two methods across the 100 sites (Supplementary Figure 4), which we argue indicates that robust citizen science-based eDNA programs can yield authentic maps of relative richness over large spatial scales. Moreover, the congruent geographical structure in community composition observed between eDNA and Fish Atlas datasets (Figure 5) indicates to some extent that eDNA can be used to characterize overall large-scale geographical patterns in fish species composition.
Species Distributions and Seasonality Patterns From Citizen Science Sampled eDNA
For species with restricted distributions, eDNA monitoring provided distribution maps highly similar to the Fish Atlas data (Figure 3 and Supplementary Figure 5). This was most notably the case for the round goby, which is one of the most wide-ranging invasive fish species in Europe (Kornis et al., 2012; Azour et al., 2015; Brandner et al., 2018). The round goby is a benthic species native to the Black Sea region, where it thrives and breeds in both fresh and saline water (Carl et al., 2019a). It is widely distributed in the Baltic region and was discovered at Bornholm, Denmark, in 2008 (Azour et al., 2015). It has since increased its distribution range every year and has now become highly abundant in southeastern Denmark. The species’ current distribution was closely reflected in the eDNA, which suggests that a citizen science-based eDNA approach could effectively be applied for early detections of invasive species (Mahon and Jerde, 2016; Holman et al., 2019; Larson et al., 2020). Two-spotted goby and the corkwing wrasse (Symphodus melops) are widely distributed in Denmark along the east coast toward Kattegat and the inner Danish waters (Carl et al., 2019b; Carl and Møller, 2019), except for the western coast of Jutland and around Bornholm a pattern which eDNA monitoring reflected.
For several species with known differences in seasonal distributions, these differences were clearly evident in the eDNA. Especially for the garfish (Belone belone), which was found almost exclusively in the spring samples (nine vs. 61 locations) (Figures 2A, 3C), in accordance with the species’ migratory behavior (MacKenzie and Carl, 2021). Longspined bullhead (Taurulus bubalis) breeds in Danish waters from April to May, where it can be found near the coast at low water depths (Carl, 2019). The seasonal distribution of eDNA (Supplementary Figure 5) reflects this behavior, as the species was found on twice as many locations in spring as in autumn (53 vs. 24) (Figure 2 and Supplementary Figure 5).
Perspectives for Future eDNA Research
The general congruence in species richness, distributions and compositions between fish eDNA analyses and Fish Atlas registrations indicates that eDNA samples of good quality can be collected by citizen scientists. Studies in eDNA have evolved from taking a few samples and targeting a limited number of species with species-specific assays (Ficetola et al., 2008; Thomsen et al., 2012b; Sigsgaard et al., 2015; Jensen et al., 2018), over metabarcoding of entire species communities (Port et al., 2016; Sigsgaard et al., 2020; Jensen et al., 2021a), to large metabarcoding projects using multiple primer sets to capture as much biodiversity as possible over large spatial scales (Bakker et al., 2019). In recent years, population-level patterns have been explored with eDNA samples using intra-specific primers to reveal population characteristics (Sigsgaard et al., 2016) and to haplotype individuals (Dugal et al., 2022). Less specific primers have also been used to simultaneously target intra- and interspecific genetic variation (Turon et al., 2020). Similarly, target capture probes have been applied to target entire mitochondrial genomes and even nuclear eDNA from single species (Pinfield et al., 2019; Jensen et al., 2021b).
Biodiversity data collected at fine spatial resolutions over broad geographical extents are needed to inform decision making (Wisz et al., 2013, 2020). Coastal ecosystems around the world are vulnerable to the expansion of human activities and the acceleration of Anthropocene impacts (Jouffray et al., 2020). The complexity of marine environments and pace of Anthropocene change requires that methods to monitor change be scaled up in space and time. We believe that the combination of citizen science and eDNA metabarcoding tools shows promise for helping to fill crucial data gaps, especially when conventional scientific monitoring is not feasible.
The UN Decade of Ocean Science for Sustainable Development (2021–2030) calls for, among other things, improved accessibility of ocean science, engagement of a diversity of stakeholders, methods that advance citizen science, activities that promote ocean literacy, and tools to improve the understanding and prediction of ocean dynamics in coastal areas and beyond (Ryabinin et al., 2019; Claudet et al., 2020). Our approach to engage citizen scientists in an eDNA-based monitoring of biodiversity in coastal areas helps to address all of these aims. Citizen science not only has the potential to bolster monitoring data, it also helps to engage citizens in science and ocean issues (Kelly et al., 2020). We therefore hope that the approach will be used across nations and stakeholders within the current decade to strengthen our knowledge about biodiversity in coastal areas.
Data Availability Statement
The datasets presented in this study can be found in online repositories. The names of the repository/repositories and accession number(s) can be found below: Dryad (https://doi.org/10.5061/dryad.x69p8czkn).
Ethics Statement
All volunteers in this study actively applied to participate on the terms described, and to be a member of the Danish Society for Nature Conservation (DSNC). All personal information were subject to the most recent data protection guideline [General Data Protection Regulation (GDPR)] in Denmark. All volunteers were covered by members accident insurance from DSNC, during sampling and transportation back and forth to the location. All participants from the first sampling event voluntarily participated in the questionnaire in this study. All participation in this survey was voluntary, and no compensation was provided.
Author Contributions
PT, ES, PM, and MW conceived the idea for the project. SA, ES, SLK, and PT organized the involvement of citizen scientists and sampling protocols. SA, HC, PM, and PT were involved in validating and communicating the findings to the citizen scientists. SA and ES performed the bioinformatic analysis with inputs from MJ. SA performed the data analysis, assisted by MJ and MA, with inputs from SWK, ES, PM, MW, and PT. HC and PM provided the comparative Fish Atlas data. SA led the manuscript writing with assistance and input from all authors, but specially MJ, MA, and PT. All authors contributed to the manuscript drafts and approved the final version.
Funding
This study was supported by the Velux Foundations (grant 21517), the Carlsberg Foundation (grant CF18-0949), and the Faculty of Natural Sciences, Aarhus University (grant 27744).
Conflict of Interest
The authors declare that the research was conducted in the absence of any commercial or financial relationships that could be construed as a potential conflict of interest.
Publisher’s Note
All claims expressed in this article are solely those of the authors and do not necessarily represent those of their affiliated organizations, or those of the publisher, the editors and the reviewers. Any product that may be evaluated in this article, or claim that may be made by its manufacturer, is not guaranteed or endorsed by the publisher.
Acknowledgments
We thank all the citizen scientists from the Danish Society for Nature Conservation for collecting the samples. We thank Sophie Ingeholm and Sara Bundgaard who did most of the communication with the volunteers. We thank the four Danish aquariums (Den Blå Planet, Kattegat Centeret, Øresundsakvariet, and Nordsøen Oceanarium) for taking part in the sampling. We thank our technical staff Katrine Bay Jensen, Trine Bech Søgaard, and Annie Brandstrup for doing most of the laboratory work. We also thank the high-performance computing facility GenomeDK at Aarhus University for enabling us to run computationally challenging tasks.
Supplementary Material
The Supplementary Material for this article can be found online at: https://www.frontiersin.org/articles/10.3389/fmars.2022.824100/full#supplementary-material
Footnotes
References
Agersnap, S., Larsen, W. B., Knudsen, S. W., Strand, D., Thomsen, P. F., Hesselsøe, M., et al. (2017). Monitoring of noble, signal and narrow-clawed crayfish using environmental DNA from freshwater samples. PLoS One 12:e0179261. doi: 10.1371/journal.pone.0179261
Agger, P., Baatrup-Pedersen, A., Bregnballe, T., Bruun, H. H., Buttenschøn, R. M., Dalgaard, T., et al. (2012). Danmarks Natur Frem Mod 2020 – Om at Stoppe Tabet af Biologisk Mangfoldighed. København: Det Grønne Kontaktudvalg, c/o Danmarks Naturfredningsforening.
Alberdi, A., Aizpurua, O., Gilbert, M. T. P., and Bohmann, K. (2017). Scrutinizing key steps for reliable metabarcoding of environmental samples. Methods Ecol. Evol. 9, 134–147. doi: 10.1111/2041-210X.12849
Andersen, J., Pedersen, S., Thaulow, J., Stuer-Lauridsen, F., Kristensen, D., and Cochrane, S. (2015). Monitoring of Non-Indigenous Species in Danish Marine Waters. Available Online at: http://naturstyrelsen.dk/media/132530/nst-monis-report-final.pdf
Arter (2022). Arter. Available online at: https://arter.dk/landing-page [accessed January 24, 2022].
Azour, F., Deurs, M., van, Behrens, J., Carl, H., Hüssy, K., et al. (2015). Invasion rate and population characteristics of the round goby Neogobius melanostomus: effects of density and invasion history. Aquat. Biol. 24, 41–52. doi: 10.3354/ab00634
Bakker, J., Wangensteen, O. S., Baillie, C., Buddo, D., Chapman, D. D., Gallagher, A. J., et al. (2019). Biodiversity assessment of tropical shelf eukaryotic communities via pelagic eDNA metabarcoding. Ecol. Evol. 9, 14341–14355. doi: 10.1002/ece3.5871
Bakker, J., Wangensteen, O. S., Chapman, D. D., Boussarie, G., Buddo, D., Guttridge, T. L., et al. (2017). Environmental DNA reveals tropical shark diversity in contrasting levels of anthropogenic impact. Sci. Rep. 7:16886. doi: 10.1038/s41598-017-17150-2
Barba, M. D., Miquel, C., Boyer, F., Mercier, C., Rioux, D., Coissac, E., et al. (2014). DNA metabarcoding multiplexing and validation of data accuracy for diet assessment: application to omnivorous diet. Mol. Ecol. Resour. 14, 306–323. doi: 10.1111/1755-0998.12188
Beentjes, K. K., Speksnijder, A. G. C. L., Schilthuizen, M., Hoogeveen, M., and van der Hoorn, B. B. (2019). The effects of spatial and temporal replicate sampling on eDNA metabarcoding. PeerJ 7:e7335. doi: 10.7717/peerj.7335
Benson, D. A., Karsch-Mizrachi, I., Lipman, D. J., Ostell, J., and Wheeler, D. L. (2005). GenBank. Nucleic Acids Res. 33, D34–D38. doi: 10.1093/nar/gki063
Berglund, J., Boström, J., Clausen, P., Gamfeldt, L., Gundersen, H., Hancke, K., et al. (2018). “Biodiversity, ecosystems, local knowledge and customary use in the Kalix archipelago,” in Nordic IPBES-like Assessment of Biodiversity and Ecosystem Services in Coastal Ecosystems Case Areas, TemaNord, Vol. 532, ed. H. Tunón (Copenhagen: Nordic Council of Ministers), 29–61. doi: 10.6027/TN2018-532
Biggs, J., Ewald, N., Valentini, A., Gaboriaud, C., Dejean, T., Griffiths, R. A., et al. (2015). Using eDNA to develop a national citizen science-based monitoring programme for the great crested newt (Triturus cristatus). Biol. Conserv. 183, 19–28. doi: 10.1016/j.biocon.2014.11.029
Brandner, J., Cerwenka, A. F., Schliewen, U. K., and Geist, J. (2018). Invasion strategies in round goby (Neogobius melanostomus): is bigger really better? PLoS One 13:e0190777. doi: 10.1371/journal.pone.0190777
Brown, E. J., Kokkalis, A., and Støttrup, J. G. (2019). Juvenile fish habitat across the inner Danish waters: habitat association models and habitat growth models for European plaice, flounder and common sole informed by a targeted survey. J. Sea Res. 155:101795. doi: 10.1016/j.seares.2019.101795
Buxton, A. S., Groombridge, J. J., Zakaria, N. B., and Griffiths, R. A. (2017). Seasonal variation in environmental DNA in relation to population size and environmental factors. Sci. Rep. 7:46294. doi: 10.1038/srep46294
Callahan, B. J., McMurdie, P. J., Rosen, M. J., Han, A. W., Johnson, A. J. A., and Holmes, S. P. (2016). DADA2: high-resolution sample inference from Illumina amplicon data. Nat. Methods 13, 581–583. doi: 10.1038/nmeth.3869
Cantera, I., Cilleros, K., Valentini, A., Cerdan, A., Dejean, T., Iribar, A., et al. (2019). Optimizing environmental DNA sampling effort for fish inventories in tropical streams and rivers. Sci. Rep. 9:3085. doi: 10.1038/s41598-019-39399-5
Cárcer, D. A., de, Denman, S. E., McSweeney, C., and Morrison, M. (2011). Evaluation of subsampling-based normalization strategies for tagged high-throughput sequencing data sets from gut microbiomes. Appl. Environ. Microbiol. 77, 8795–8798. doi: 10.1128/AEM.05491-11
Carl, H. (2019). “Langtornet ulk,” in Atlas Over Danske Saltvandsfisk. Statens Naturhistoriske Museum, eds H. Carl and P. R. Møller. Available online at: https://fiskeatlas.ku.dk/artstekster/Langtornet_ulk_Fiskeatlas.pdf (accessed October 24, 2021).
Carl, H., Azour, F., and Møller, P. R. (2019a). “Sortmundet kutling,” in Atlas Over Danske Saltvandsfisk. Statens Naturhistoriske Museum, eds H. Carl and P. R. Møller. Available online at: https://fiskeatlas.ku.dk/artstekster/Sortmundet_kutling_Fiskeatlas.pdf (accessed October 24, 2021).
Carl, H., Christiansen, S. V. S., Møller, P. R., Carl, H., and Møller, P. R. (eds) (2019b). “Savgylte. I,” in Atlas OverDanske Saltvandsfisk. StatensNaturhistoriske Museum. Available online at: https://fiskeatlas.ku.dk/artstekster/Savgylte_Fiskeatlas.pdf (accessed October 24, 2021).
Carl, H., Berg, S., Rasmussen, G., Nielsen, J., and Møller, P. (2012). Atlas over Danske Ferskvandsfisk. Statens Naturhistoriske Museum, Denmark, 1st Edn, Copenhagen: Natural History Museum of Denmark.
Carl, H., and Knudsen, S. W. (2018). “Saerfinnet ringbug. I,” in Atlas Over Danske Saltvandsfisk. Statens Naturhistoriske Museum, eds H. Carl and P. R. Møller. Available online at: https://fiskeatlas.ku.dk/artstekster/S_rfinnet_ringbug_Fiskeatlas.pdf (accessed October 24, 2021).
Carl, H., and Møller, P. R. (2019). “Toplettet kutling. I,” in Atlas Over Danske Saltvandsfisk. Statens Naturhistoriske Museum, eds H. Carl and P. R. Møller. Available online at: https://fiskeatlas.ku.dk/artstekster/Toplettet_kutling_Fiskeatlas.pdf (accessed October 24, 2021).
Carl, H., and Møller, P. R. (2021). Fiskeatlas. Available online at: https://fiskeatlas.ku.dk/[accessed October 28, 2021].
Ceballos, G., Ehrlich, P. R., and Raven, P. H. (2020). Vertebrates on the brink as indicators of biological annihilation and the sixth mass extinction. Proc. Natl. Acad. Sci. U.S.A. 117, 13596–13602. doi: 10.1073/pnas.1922686117
Chamberlain, S., and Arendsee, Z. (2020). Tools for Working with “Taxonomic” Databases [R package taxizedb version 0.2.0]. Available online at: https://CRAN.R-project.org/package=taxizedb [accessed January 24, 2022].
Claudet, J., Bopp, L., Cheung, W. W. L., Devillers, R., Escobar-Briones, E., Haugan, P., et al. (2020). A roadmap for using the UN decade of ocean science for sustainable development in support of science, policy, and action. One Earth 2, 34–42. doi: 10.1016/j.oneear.2019.10.012
Coissac, E. (2012). “OligoTag: a program for designing sets of tags for next-generation sequencing of multiplexed samples,” in Data Production and Analysis in Population Genomics: Methods and Protocols, eds F. Pompanon and A. Bonin (Totowa, NJ: Humana Press), 13–31. doi: 10.1007/978-1-61779-870-2_2
de Sherbinin, A., Bowser, A., Chuang, T.-R., Cooper, C., Danielsen, F., Edmunds, R., et al. (2021). The critical importance of citizen science data. Front. Clim. 3:650760. doi: 10.3389/fclim.2021.650760
Dirzo, R., Young, H. S., Galetti, M., Ceballos, G., Isaac, N. J. B., and Collen, B. (2014). Defaunation in the Anthropocene. Science 345, 401–406. doi: 10.1126/science.1251817
Djurhuus, A., Closek, C. J., Kelly, R. P., Pitz, K. J., Michisaki, R. P., Starks, H. A., et al. (2020). Environmental DNA reveals seasonal shifts and potential interactions in a marine community. Nat. Commun. 11:254. doi: 10.1038/s41467-019-14105-1
Doney, S. C., Ruckelshaus, M., Emmett Duffy, J., Barry, J. P., Chan, F., English, C. A., et al. (2012). Climate change impacts on marine ecosystems. Annu. Rev. Mar. Sci. 4, 11–37. doi: 10.1146/annurev-marine-041911-111611
Dugal, L., Thomas, L., Jensen, M. R., Sigsgaard, E. E., Simpson, T., Jarman, S., et al. (2022). Individual haplotyping of whale sharks from seawater environmental DNA. Mol. Ecol. Resour. 22, 56–65. doi: 10.1111/1755-0998.13451
EEA (2017). CLC 2012 Reference Land Mask (Resolution 100m). EEA Geospatial Data Catalogue. Available online at: https://sdi.eea.europa.eu/catalogue/EEA_Reference_Catalogue/api/records/228e9bf2-0b81-4506-ab72-d42dd2ad19b6 [accessed November 2, 2021].
Ely, T., Barber, P. H., Man, L., and Gold, Z. (2021). Short-lived detection of an introduced vertebrate eDNA signal in a nearshore rocky reef environment. PLoS One 16:e0245314. doi: 10.1371/journal.pone.0245314
Ficetola, G. F., Miaud, C., Pompanon, F., and Taberlet, P. (2008). Species detection using environmental DNA from water samples. Biol. Lett. 4, 423–425. doi: 10.1098/rsbl.2008.0118
Florin, A.-B., Herrera, J., Lorance, P., and Keskin, Ç (2013). IUCN Red List of Threatened Species: Liparis montagui. IUCN Red List of Threatened Species. Available online at: https://www.iucnredlist.org/en [accessed September 11, 2021].
Frøslev, T. G., Kjøller, R., Bruun, H. H., Ejrnaes, R., Brunbjerg, A. K., Pietroni, C., et al. (2017). Algorithm for post-clustering curation of DNA amplicon data yields reliable biodiversity estimates. Nat. Commun. 8:1188. doi: 10.1038/s41467-017-01312-x
Gold, Z., Sprague, J., Kushner, D. J., Marin, E. Z., and Barber, P. H. (2021). eDNA metabarcoding as a biomonitoring tool for marine protected areas. PLoS One 16:e0238557. doi: 10.1371/journal.pone.0238557
Gundelund, M. C., Venturelli, D. P. A., Hartill, M. B. W., Hyder, D. K., Olesen, M. H. J., and Skov, D. C. (2021). Evaluation of a citizen science platform for collecting fisheries data from coastal sea trout anglers. Can. J. Fish. Aquat. Sci. 78, 1576–1586. doi: 10.1139/cjfas-2020-0364
Habibullah, M. S., Din, B. H., Tan, S.-H., and Zahid, H. (2021). Impact of climate change on biodiversity loss: global evidence. Environ. Sci. Pollut. Res. 29, 1073–1086. doi: 10.1007/s11356-021-15702-8
Hansen, B. K., Jacobsen, M. W., Middelboe, A. L., Preston, C. M., Marin, R., Bekkevold, D., et al. (2020). Remote, autonomous real-time monitoring of environmental DNA from commercial fish. Sci. Rep. 10:13272. doi: 10.1038/s41598-020-70206-8
Heessen, H. J. L., Daan, N., and Ellis, J. R. (eds). (2015). Fish Atlas of the Celtic Sea, North Sea, and Baltic Sea. Wageningen: Academic Publishers. doi: 10.3920/978-90-8686-878-0
Holman, L. E., de Bruyn, M., Creer, S., Carvalho, G., Robidart, J., and Rius, M. (2019). Detection of introduced and resident marine species using environmental DNA metabarcoding of sediment and water. Sci. Rep. 9:11559. doi: 10.1038/s41598-019-47899-7
Holm-Hansen, T. H., Carl, H., Gravlund, P., Krag, M. A., and Møller, P. R. (2019). Assessing structure and seasonal variations of a temperate shallow water fish assemblage through Snorkel Visual Census. Cybium 43, 341–350. doi: 10.26028/CYBIUM/2019-434-004
Hutchings, J. A., Minto, C., Ricard, D., Baum, J. K., and Jensen, O. P. (2010). Trends in the abundance of marine fishes. Can. J. Fish. Aquat. Sci. 67, 1205–1210. doi: 10.1139/F10-081
iNaturalist (2022). iNaturalist. Available online at: https://www.inaturalist.org/ [accessed January 20, 2022].
Jaccard, P. (1901). Distribution de la flore alpine dans le bassin des Dranses et dans quelques régions voisines. Bull. Société Vaudoise Sci. Nat. 37, 241–272.
Jensen, M. R., Knudsen, S. W., Munk, P., Thomsen, P. F., and Møller, P. R. (2018). Tracing European eel in the diet of mesopelagic fishes from the Sargasso Sea using DNA from fish stomachs. Mar. Biol. 165:130. doi: 10.1007/s00227-018-3390-3
Jensen, M. R., Sigsgaard, E. E., Agersnap, S., Rasmussen, J. J., Baattrup-Pedersen, A., Wiberg-Larsen, P., et al. (2021a). Seasonal turnover in community composition of stream-associated macroinvertebrates inferred from freshwater environmental DNA metabarcoding. Environ. DNA 3, 861–876. doi: 10.1002/edn3.193
Jensen, M. R., Sigsgaard, E. E., Ávila, M. D. P., Agersnap, S., Brenner-Larsen, W., Sengupta, M. E., et al. (2022). Short-term temporal variation of coastal marine eDNA. Environ. DNA. doi: 10.1002/edn3.285
Jensen, M. R., Sigsgaard, E. E., Liu, S., Manica, A., Bach, S. S., Hansen, M. M., et al. (2021b). Genome-scale target capture of mitochondrial and nuclear environmental DNA from water samples. Mol. Ecol. Resour. 21, 690–702. doi: 10.1111/1755-0998.13293
Joshi, N. A., and Fass, J. N. (2011). Sickle: A Sliding-Window, Adaptive, Quality-Based Trimming Tool for FastQ Files (Version 1.33) [Software]. Available at https://github.com/najoshi/sickle (accessed November 10, 2021).
Jouffray, J.-B., Blasiak, R., Norström, A. V., Österblom, H., and Nyström, M. (2020). The blue acceleration: the trajectory of human expansion into the ocean. One Earth 2, 43–54. doi: 10.1016/j.oneear.2019.12.016
Kassambara, A. (2020). ggpubr: “ggplot2” Based Publication Ready Plots. Available online at: https://CRAN.R-project.org/package=ggpubr [accessed August 27, 2021].
Kearse, M., Moir, R., Wilson, A., Stones-Havas, S., Cheung, M., Sturrock, S., et al. (2012). Geneious basic: an integrated and extendable desktop software platform for the organization and analysis of sequence data. Bioinformatics 28, 1647–1649. doi: 10.1093/bioinformatics/bts199
Kelly, R., Fleming, A., Pecl, G. T., von Gönner, J., and Bonn, A. (2020). Citizen science and marine conservation: a global review. Philos. Trans. R. Soc. B Biol. Sci. 375:20190461. doi: 10.1098/rstb.2019.0461
Kelly, R. P., Port, J. A., Yamahara, K. M., and Crowder, L. B. (2014). Using environmental DNA to census marine fishes in a large mesocosm. PLoS One 9:e86175. doi: 10.1371/journal.pone.0086175
Knudsen, S. W., Ebert, R. B., Hesselsøe, M., Kuntke, F., Hassingboe, J., Mortensen, P. B., et al. (2019). Species-specific detection and quantification of environmental DNA from marine fishes in the Baltic Sea. J. Exp. Mar. Biol. Ecol. 510, 31–45. doi: 10.1016/j.jembe.2018.09.004
Kornis, M. S., Mercado-Silva, N., and Vander Zanden, M. J. (2012). Twenty years of invasion: a review of round goby Neogobius melanostomus biology, spread and ecological implications. J. Fish Biol. 80, 235–285. doi: 10.1111/j.1095-8649.2011.03157.x
Kristensen, L., Støttrup, J., Andersen, S. K., and Degel, H. (2014). Registrering af Fangster i de Danske Kystområder med Standardredskaber: Nøglefiskerrapport 2011-2013. DTU Aqua. Available online at: https://orbit.dtu.dk/en/publications/registrering-af-fangster-i-de-danske-kystomr%C3%A5der-med-standardreds [accessed April 19, 2020].
Larson, E. R., Graham, B. M., Achury, R., Coon, J. J., Daniels, M. K., Gambrell, D. K., et al. (2020). From eDNA to citizen science: emerging tools for the early detection of invasive species. Front. Ecol. Environ. 18, 194–202. doi: 10.1002/fee.2162
Lin, M., Simons, A. L., Harrigan, R. J., Curd, E. E., Schneider, F. D., Ruiz-Ramos, D. V., et al. (2021). Landscape analyses using eDNA metabarcoding and Earth observation predict community biodiversity in California. Ecol. Appl. 31:e02379. doi: 10.1002/eap.2379
Luypaert, T., Hagan, J. G., McCarthy, M. L., and Poti, M. (2020). “Status of marine biodiversity in the anthropocene,” in YOUMARES 9 - The Oceans: Our Research, Our Future: Proceedings of the 2018 conference for YOUng MArine RESearcher in Oldenburg, Germany, eds S. Jungblut, V. Liebich, and M. Bode-Dalby (Cham: Springer International Publishing), 57–82. doi: 10.1007/978-3-030-20389-4_4
MacKenzie, B., and Carl, H. (2021). “Hornfisk. I,” in Atlas Over Danske Saltvandsfisk. Statens Naturhistoriske Museum, eds H. Carl and P. R. Møller. Available online at: https://fiskeatlas.ku.dk/artstekster/Hornfisk_Atlastekst.pdf (accessed October 24, 2021).
Mahon, A. R., and Jerde, C. L. (2016). Using environmental DNA for invasive species surveillance and monitoring. Methods Mol. Biol. 1452, 131–142. doi: 10.1007/978-1-4939-3774-5_8
Martin, M. (2011). Cutadapt removes adapter sequences from high-throughput sequencing reads. EMBnet J. 17, 10–12. doi: 10.14806/ej.17.1.200
McCauley, D. J., Pinsky, M. L., Palumbi, S. R., Estes, J. A., Joyce, F. H., and Warner, R. R. (2015). Marine defaunation: animal loss in the global ocean. Science 347:1255641. doi: 10.1126/science.1255641
Meyer, R., Ramos, M., Lin, M., Schweizer, T., Gold, Z., Ramos, D., et al. (2021). The CALeDNA program: citizen scientists and researchers inventory California’s biodiversity. Calif. Agric. 75, 20–32. doi: 10.3733/ca.2021a0001
Miya, M., Sato, Y., Fukunaga, T., Sado, T., Poulsen, J. Y., Sato, K., et al. (2015). MiFish, a set of universal PCR primers for metabarcoding environmental DNA from fishes: detection of more than 230 subtropical marine species. R. Soc. Open Sci. 2:150088. doi: 10.1098/rsos.150088
Monuki, K., Barber, P. H., and Gold, Z. (2021). eDNA captures depth partitioning in a kelp forest ecosystem. PLoS One 16:e0253104. doi: 10.1371/journal.pone.0253104
Nester, G. M., Brauwer, M. D., Koziol, A., West, K. M., DiBattista, J. D., White, N. E., et al. (2020). Development and evaluation of fish eDNA metabarcoding assays facilitate the detection of cryptic seahorse taxa (family: Syngnathidae). Environ. DNA 2, 614–626. doi: 10.1002/edn3.93
Newman, G., Wiggins, A., Crall, A., Graham, E., Newman, S., and Crowston, K. (2012). The future of citizen science: emerging technologies and shifting paradigms. Front. Ecol. Environ. 10, 298–304. doi: 10.1890/110294
Oksanen, J., Blanchet, F. G., Friendly, M., Kindt, R., Legendre, P., McGlinn, D., et al. (2020). vegan: Community Ecology Package. Available online at: https://CRAN.R-project.org/package=vegan [accessed August 26, 2021].
Pinfield, R., Dillane, E., Runge, A. K. W., Evans, A., Mirimin, L., Niemann, J., et al. (2019). False-negative detections from environmental DNA collected in the presence of large numbers of killer whales (Orcinus orca). Environ. DNA 1, 316–328. doi: 10.1002/edn3.32
Port, J. A., O’Donnell, J. L., Romero-Maraccini, O. C., Leary, P. R., Litvin, S. Y., Nickols, K. J., et al. (2016). Assessing vertebrate biodiversity in a kelp forest ecosystem using environmental DNA. Mol. Ecol. 25, 527–541. doi: 10.1111/mec.13481
R Core Team (2020). R: A Language and Environment for Statistical Computing. Vienna: R Foundation for Statistical Computing.
Rastelli, E., Petani, B., Corinaldesi, C., Dell’Anno, A., Lo Martire, M., Cerrano, C., et al. (2020). A high biodiversity mitigates the impact of ocean acidification on hard-bottom ecosystems. Sci. Rep. 10:2948. doi: 10.1038/s41598-020-59886-4
Roger, E., and Klistorner, S. (2016). BioBlitzes help science communicators engage local communities in environmental research. JCOM 15:A06. doi: 10.22323/2.15030206
Rosen, M. J., Callahan, B. J., Fisher, D. S., and Holmes, S. P. (2012). Denoising PCR-amplified metagenome data. BMC Bioinformatics 13:283. doi: 10.1186/1471-2105-13-283
Ryabinin, V., Barbière, J., Haugan, P., Kullenberg, G., Smith, N., McLean, C., et al. (2019). The UN decade of ocean science for sustainable development. Front. Mar. Sci. 6:470. doi: 10.3389/fmars.2019.00470
Schnell, I. B., Bohmann, K., and Gilbert, M. T. P. (2015). Tag jumps illuminated – reducing sequence-to-sample misidentifications in metabarcoding studies. Mol. Ecol. Resour. 15, 1289–1303. doi: 10.1111/1755-0998.12402
Sigsgaard, E. E., Carl, H., Møller, P. R., and Thomsen, P. F. (2015). Monitoring the near-extinct European weather loach in Denmark based on environmental DNA from water samples. Biol. Conserv. 183, 46–52. doi: 10.1016/j.biocon.2014.11.023
Sigsgaard, E. E., Nielsen, I. B., Bach, S. S., Lorenzen, E. D., Robinson, D. P., Knudsen, S. W., et al. (2016). Population characteristics of a large whale shark aggregation inferred from seawater environmental DNA. Nat. Ecol. Evol. 1:4. doi: 10.1038/s41559-016-0004
Sigsgaard, E. E., Nielsen, I. B., Carl, H., Krag, M. A., Knudsen, S. W., Xing, Y., et al. (2017). Seawater environmental DNA reflects seasonality of a coastal fish community. Mar. Biol. 164:128. doi: 10.1007/s00227-017-3147-4
Sigsgaard, E. E., Olsen, K., Hansen, M. D. D., Hansen, O. L. P., Høye, T. T., Svenning, J.-C., et al. (2020). Environmental DNA metabarcoding of cow dung reveals taxonomic and functional diversity of invertebrate assemblages. Mol. Ecol. 30, 3374–3389. doi: 10.1111/mec.15734
Sigsgaard, E. E., Soraggi, S., Jensen, M. R., Repollés, A. G., Thomassen, E. E., and Thomsen, P. F. (2022). MetaBarFlow (Version 0.1.0) [Computer Software]. doi: 10.5281/zenodo.6006700
Sigsgaard, E. E., Torquato, F., Frøslev, T. G., Moore, A. B. M., Sørensen, J. M., Range, P., et al. (2019). Using vertebrate environmental DNA from seawater in biomonitoring of marine habitats. Conserv. Biol. 34, 697–710. doi: 10.1111/cobi.13437
Stoeckle, M. Y., Soboleva, L., and Charlop-Powers, Z. (2017). Aquatic environmental DNA detects seasonal fish abundance and habitat preference in an urban estuary. PLoS One 12:e0175186. doi: 10.1371/journal.pone.0175186
Strand, D. A., Johnsen, S. I., Rusch, J. C., Agersnap, S., Larsen, W. B., Knudsen, S. W., et al. (2019). Monitoring a Norwegian freshwater crayfish tragedy: eDNA snapshots of invasion, infection and extinction. J. Appl. Ecol. 56, 1661–1673. doi: 10.1111/1365-2664.13404
Sullivan, B. L., Wood, C. L., Iliff, M. J., Bonney, R. E., Fink, D., and Kelling, S. (2009). eBird: a citizen-based bird observation network in the biological sciences. Biol. Conserv. 142, 2282–2292. doi: 10.1016/j.biocon.2009.05.006
Sutherland, W. J., Roy, D. B., and Amano, T. (2015). An agenda for the future of biological recording for ecological monitoring and citizen science. Biol. J. Linn. Soc. 115, 779–784. doi: 10.1111/bij.12576
Taberlet, P., Bonin, A., Zinger, L., and Coissac, E. (2018). Environmental DNA: For Biodiversity Research and Monitoring. Oxford: Oxford University Press.
Teilmann, J., Sveegaard, S., Dietz, R., Petersen, I. K., and Berggren, P. (2008). High Density Areas for Harbour Porpoises in Danish Water. NERI Technical Report No. 657. Aarhus: Aarhus University, 84.
Thomsen, P. F., Kielgast, J., Iversen, L. L., Møller, P. R., Rasmussen, M., and Willerslev, E. (2012a). Detection of a diverse marine fish fauna using environmental DNA from seawater samples. PLoS One 7:e41732. doi: 10.1371/journal.pone.0041732
Thomsen, P. F., Kielgast, J., Iversen, L. L., Wiuf, C., Rasmussen, M., Gilbert, M. T. P., et al. (2012b). Monitoring endangered freshwater biodiversity using environmental DNA. Mol. Ecol. 21, 2565–2573. doi: 10.1111/j.1365-294X.2011.05418.x
Thomsen, P. F., Møller, P. R., Sigsgaard, E. E., Knudsen, S. W., Jørgensen, O. A., and Willerslev, E. (2016). Environmental DNA from seawater samples correlate with trawl catches of subarctic, deepwater fishes. PLoS One 11:e0165252. doi: 10.1371/journal.pone.0165252
Thomsen, P. F., and Sigsgaard, E. E. (2019). Environmental DNA metabarcoding of wild flowers reveals diverse communities of terrestrial arthropods. Ecol. Evol. 9, 1665–1679. doi: 10.1002/ece3.4809
Thomsen, P. F., and Willerslev, E. (2015). Environmental DNA – an emerging tool in conservation for monitoring past and present biodiversity. Biol. Conserv. 183, 4–18. doi: 10.1016/j.biocon.2014.11.019
Tøttrup, A., Svenningsen, L., Rytter, M., Lillemark, M., Møller, P., and Knudsen, S. (2021). Citizens in the lab: performance and validation of eDNA results. Citiz. Sci. Theory Pract. 6:35. doi: 10.5334/cstp.382
Turon, X., Antich, A., Palacín, C., Praebel, K., and Wangensteen, O. S. (2020). From metabarcoding to metaphylogeography: separating the wheat from the chaff. Ecol. Appl. 30:e02036. doi: 10.1002/eap.2036
Ushio, M., Murakami, H., Masuda, R., Sado, T., Miya, M., Sakurai, S., et al. (2017). Quantitative monitoring of multispecies fish environmental DNA using high-throughput sequencing. bioRxiv [Preprint] doi: 10.1101/113472
Wehn, U., Gharesifard, M., Ceccaroni, L., Joyce, H., Ajates, R., Woods, S., et al. (2021). Impact assessment of citizen science: state of the art and guiding principles for a consolidated approach. Sustain. Sci. 16, 1683–1699. doi: 10.1007/s11625-021-00959-2
West, K. M., Stat, M., Harvey, E. S., Skepper, C. L., DiBattista, J. D., Richards, Z. T., et al. (2020). eDNA metabarcoding survey reveals fine-scale coral reef community variation across a remote, tropical island ecosystem. Mol. Ecol. 29, 1069–1086. doi: 10.1111/mec.15382
Whittaker, R. H. (1960). Vegetation of the siskiyou mountains, oregon and California. Ecol. Monogr. 30, 279–338. doi: 10.2307/1943563
Wisz, M. S., Pottier, J., Kissling, W. D., Pellissier, L., Lenoir, J., Damgaard, C. F., et al. (2013). The role of biotic interactions in shaping distributions and realised assemblages of species: implications for species distribution modelling. Biol. Rev. Camb. Philos. Soc. 88, 15–30. doi: 10.1111/j.1469-185X.2012.00235.x
Wisz, M. S., Satterthwaite, E. V., Fudge, M., Fischer, M., Polejack, A., St. John, M., et al. (2020). 100 opportunities for more inclusive ocean research: cross-disciplinary research questions for sustainable ocean governance and management. Front. Mar. Sci. 7:576. doi: 10.3389/fmars.2020.00576
Yoccoz, N. G., Bråthen, K. A., Gielly, L., Haile, J., Edwards, M. E., Goslar, T., et al. (2012). DNA from soil mirrors plant taxonomic and growth form diversity. Mol. Ecol. 21, 3647–3655. doi: 10.1111/j.1365-294X.2012.05545.x
Zhang, Y., Pavlovska, M., Stoica, E., Prekrasna, I., Yang, J., Slobodnik, J., et al. (2020). Holistic pelagic biodiversity monitoring of the Black Sea via eDNA metabarcoding approach: from bacteria to marine mammals. Environ. Int. 135:105307. doi: 10.1016/j.envint.2019.105307
Keywords: citizen science (CS), biomonitoring, BioBlitz, eDNA metabarcoding, marine fish
Citation: Agersnap S, Sigsgaard EE, Jensen MR, Avila MDP, Carl H, Møller PR, Krøs SL, Knudsen SW, Wisz MS and Thomsen PF (2022) A National Scale “BioBlitz” Using Citizen Science and eDNA Metabarcoding for Monitoring Coastal Marine Fish. Front. Mar. Sci. 9:824100. doi: 10.3389/fmars.2022.824100
Received: 28 November 2021; Accepted: 25 January 2022;
Published: 28 March 2022.
Edited by:
Jian-Wen Qiu, Hong Kong Baptist University, Hong Kong SAR, ChinaReviewed by:
Jeff Eble, Florida Institute of Technology, United StatesChloe Victoria Robinson, Ocean Wise Research, Canada
Paul Barber, University of California, Los Angeles, United States
Copyright © 2022 Agersnap, Sigsgaard, Jensen, Avila, Carl, Møller, Krøs, Knudsen, Wisz and Thomsen. This is an open-access article distributed under the terms of the Creative Commons Attribution License (CC BY). The use, distribution or reproduction in other forums is permitted, provided the original author(s) and the copyright owner(s) are credited and that the original publication in this journal is cited, in accordance with accepted academic practice. No use, distribution or reproduction is permitted which does not comply with these terms.
*Correspondence: Sune Agersnap, c2FnZXJzbmFwQGJpby5hdS5kaw==; Philip Francis Thomsen, cGZ0aG9tc2VuQGJpby5hdS5kaw==