 Santhi Madhavan Samyuktha1
 Devarajan Malarvizhi2
 Adhimoolam Karthikeyan3
 Manickam Dhasarathan4
 Arumugam Thanga Hemavathy5
 Chocklingam Vanniarajan1
 Venugopal Sheela6Sundarrajan Juliet Hepziba1
 Muthaiyan Pandiyan7
 Natesan Senthil8*
- 1Department of Plant Breeding and Genetics, Agricultural College and Research Institute, Tamil Nadu Agricultural University, Madurai, India
- 2Agricultural Research Station, Tamil Nadu Agricultural University, Bhavanisagar, India
- 3Department of Biotechnology, Centre of Innovation, Agricultural College and Research Institute, Tamil Nadu Agricultural University, Madurai, India
- 4Agroclimate Research Centre, Directorate of Crop Management, Tamil Nadu Agricultural University, Coimbatore, India
- 5Department of Pulses, Centre for Plant Breeding and Genetics, Tamil Nadu Agricultural University, Coimbatore, India
- 6Department of Rice, Centre for Plant Breeding and Genetics, Tamil Nadu Agricultural University, Coimbatore, India
- 7Agricultural College and Research Institute, Tamil Nadu Agricultural University, Vazhavachanur, India
- 8Department of Plant Molecular Biology and Bioinformatics, Centre for Plant Molecular Biology and Biotechnology, Tamil Nadu Agricultural University, Coimbatore, India
In the present study, fifty-two mungbean (Vigna radiata) genotypes were evaluated for seven morphological traits at three different environments in South Indian state Tamil Nadu, namely Virinjipuram (E1), Eachangkottai (E2), and Bhavanisagar (E3) during Kharif 2017, 2018, and 2019, respectively. The data collected were subjected to variability and correlation analyses, followed by stability analysis using additive main effects and multiplicative interaction (AMMI) model, genotype and genotype × environment interaction effects (GGE) biplot. Variablility was observed among the genotypes for the following traits viz., plant height, days to fifty per cent flowering, number of pods per plant, pod length, number of seeds per pod, hundred seed weight and grain yield. Correlation analysis showed that the trait number of pods per plant was significantly associated with grain yield. The G × E was smaller than the genetic variation of grain yield as it portrayed the maximum contribution of genotypic effects (61.07%). GGE biplot showed E3 as a highly discriminating and representative environment. It also identified environment-specific genotypes viz., EC 396111 for E1, EC 396125 for E2 and EC 396101 for E3 environments. The genotypes with minimum genotype stability index (GSI) viz., V2802BG (7), HG 22 (13), and EC 396098 (13) were observed with wide adaptation and high yields across all the three environments. In summary, we identified stable genotypes adapted across environments for grain yield. These genotypes can be used as parent/pre-breeding materials in future mungbean breeding programs.
Introduction
Mungbean (Vigna radiata) is one of the widely adapted, stress-tolerant, and nutritious grain legumes. It is an inexpensive source of protein (24–26%), carbohydrate (51%), minerals (4%), and vitamins (3%) for the people of Asia and Africa (Karthikeyan et al., 2014). In combination with cereals and other grain legumes, it is a valuable component of cropping systems in many areas, with its ability to fix nitrogen and reduce soil erosion. The crop is grown on more than six million hectares in tropics and subtropics of Africa, Asia, Australia, and America (Nair et al., 2013, 2019; AVRDC, 2019). However, Asia solely contributes to 90% of world mungbean production and India is the leading mungbean producer in the world. But, the average yield of mungbean is low. It is mainly due to recent changes in climate and inclement weather conditions throughout the year in general and during the cropping season in particular (Biswas et al., 2018). Grain yield is one of the complex quantitative traits, which has high environmental interaction. Hence, it is essential to carry out selection based on yield stability evaluation than average performance in multiple environmental conditions (Kang, 1993; Tariku et al., 2013; Islam et al., 2015). Genotype × environment interaction (G × E) is a major obstacle for the crop to attain full genetic gain (Gruneberg et al., 2005). Thus, plant breeding programs focus on increasing crop yield in a particular targeted macro environment or a wide range of growing conditions. A clear knowledge of G × E interaction in mungbean is required before plant breeders confidently decide (i) ideotype design, (ii) choosing the best parental combination based on the traits, (iii) tracing the suitable environment condition to test the genotypes, (iv) fixing the breeding objectives based on the yield, (v) identify the best crop management practices, and (vi) to draw up recommendations for areas of optimal cultivar adaptation (Xavier et al., 2018).
Many researchers have conducted the studies on stability performance for grain yield using different set of mungbean genotypes at diverse agro-climatic zones (Ullah et al., 2012; Win et al., 2018). To date, several statistical models proposed to analyze stability and G × E interaction of traits by conventional analysis. Additive main effects and multiplicative interaction model (AMMI) and genotype and genotype × environment interaction effects (GGE) model are widely used because these models let the detection of G × E interaction in terms of the crossover effect resulting from great changes in the ranking of the genotypes across the environments. Moreover, AMMI and GGE have been found particularly useful in visualizing G × E effects in graphical representation. Also, both models were widely used to examine the mungbean genotype in the multi-environment cultivar trials (Thangavel et al., 2011; Asfaw et al., 2012; Ullah et al., 2012; Win et al., 2018). Thangavel et al. (2011) evaluated the yield-related traits data of 58 mungbean genotypes including local cultivars, landraces and advanced breeding lines at six moisture stress location-year environments. The results showed that drought tolerance in mungbean is the effect of enhanced vegetative growth and effective partitioning of photoassimilates to root growth to obtain good yield under drought conditions. Correlation analysis showed several environmental factors (minimum temperature, relative humidity, soil pH, and rainfall) had interacted and influenced the yield-related traits of mungbean. In another study, thirty mungbean genotypes were evaluated in four environments to identify the high yielding and stable genotypes. Results showed that genotypes namely “NFM-7-13” and “NFM-11-3” were found to be stable in performance across environments (Ullah et al., 2012). Seven mungbean genotypes originated from India were tested at three locations in Ethiopia for over 2 years. Among the seven genotypes, MH-96-4 exhibited stable performance across the environments (Asfaw et al., 2012).
With this background knowledge, the objectives of this research were: (i) to identify the trait variability and association of morphological traits with mungbean grain yield (ii) to study the effect of G × E interaction toward the variation in grain yield across the South Indian state Tamil Nadu, namely Virinjipuram (E1), Eachangkottai (E2), and Bhavanisagar (E3) amongst 52 mungbean genotypes and (iii) to identify the best mungbean genotypes suitable for across environments and for a particular environment, based on grain yield.
Materials and Methods
Environments
Field experiments were conducted at three different environments in the South Indian state of Tamil Nadu, namely, Agricultural Research Station, Virinjipuram (E1) (12° 5′ N latitude and 79° E longitude), Agricultural College and Research Institute, Eachangkottai (E2) (8° 46′ N latitude and 77° 42′ E longitude) and Agricultural Research Station, Bhavanisagar (E3) (11° 29′ N latitude and 77° 08′ E longitude) during Kharif 2017, 2018, and 2019, respectively. The environments E1, E2, and E3 are popular mungbean growing regions that fall under three different agro-ecological zones of Tamil Nadu viz., North Eastern zone, Cauvery Delta zone and North Western zone. Mungbean yellow mosaic virus was the major issue in these environments whereas, moderate problem of bruchids, powdery mildew and cersospora leaf spot were also prevalent. Details of the soil and meteorological conditions during the crop growth period are presented in Table 1.
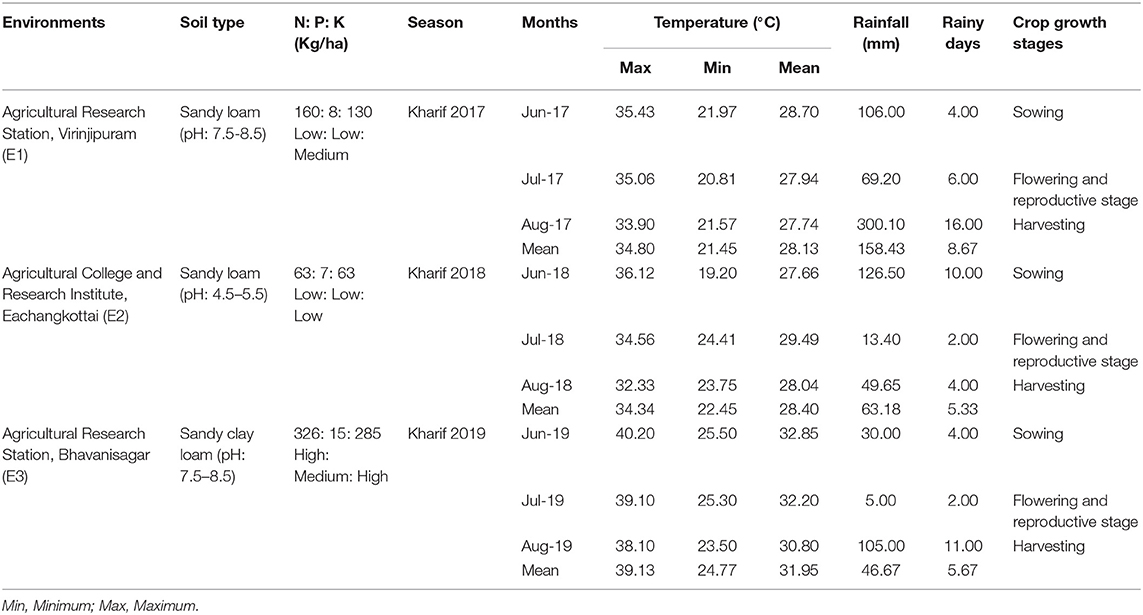
Table 1. Weather parameters during crop growth stages.
Plant Genetic Materials
A total of 52 mungbean genotypes originated from different parts of northern India, Asian and African countries along with two checks viz., CO 8 and VBN 3 were used in this study. These genotypes exhibited resistant or moderately resistant to mungbean yellow mosaic virus, bruchids, powdery mildew, and cercospora leaf spot (Somta et al., 2008; Karthikeyan et al., 2011, 2019; Pandiyan et al., 2011; Senthil et al., 2012; Sudha et al., 2013; Chotechung et al., 2016; Schafleitner et al., 2016; Kaewwongwal et al., 2017; Samyuktha et al., 2019). Seeds of these mungbean genotypes were obtained from the Asian Vegetable Research and Development Center, Taiwan, National Bureau of Plant Genetic Resources, India and Department of Plant Genetic Resources, Tamil Nadu Agricultural University, India.
Experimental Design and Agronomic Practices
All the mungbean genotypes were raised in a randomized block design with three replications in each environment. The land was ploughed to fine tilth condition and the basal fertilizer of 25 kg N + 50 Kg P2O5 + 25 Kg K2O/ha was applied. Each genotype was planted in a 4-meter row in ridges and furrows with the spacing of 30 ×10 cm involving a plot size of 4 ×1.5 m in each environment. Agronomic practices and plant protection measures accomplished throughout the crop growth period as per the recommendations given in TNAU Crop Production Guide Agriculture. (2020). Irrigation was done immediately after sowing. The application of per-emergence herbicide Pendimethalin @ 1 liter/ha was done on the third day before providing life irrigation. The succeeding irrigation was given at an interval of 7–10 days. One hand weeding was done at 30 Days After Sowing (DAS) to provide a weed-free environment. Foliar application of DAP 20 g/l was applied during the flowering stage to maximize the pod setting percentage. The following plant protection measures were followed for good establishment of the crop. The spraying of Imidacloprid 17.8 SL @ 250 ml/ha was done at 15 DAS to control the sucking pests, and Chlorantraniliprole 18.5% SC @ 150 ml/ha at 50% flowering stage. After 15–20 days, Flubendiamide 39.35% SC 100 ml/ha was applied to suppress the pod borer infestation.
Evaluation of Morphological Traits
The morphological observations were recorded on 10 randomly selected plants in each genotype based on the descriptors of mungbean [IBPGR, 1980]. The traits viz., plant height (cm), days to fifty per cent flowering, number of pods per plant, pod length (cm), number of seeds per pod, hundred seed weight (g) and grain yield (g) were recorded. The mean data used in the analysis was the average value of each genotype from all three environments (E1, E2, and E3).
Statistical Analysis
The mean data of 10 randomly selected plants in each genotype for each trait were used for determining the range and overall mean of each environment. Correlation between grain yield and other yield attributing traits in each environment were performed using SPSS 16.0 version (SPSS. Inc USA, 2007). The stability for grain yield in 52 mungbean genotypes was carried out using various stability models viz., AMMI, GSI, and GGE biplot. AMMI analysis was carried out using the software GEA-R version 4.1 (Angela et al., 2015) with the model equation:
where Yij is the yield of ith genotype in the jth environment;
μ is the grand mean;
gi and ej represent the genotype and environment deviations from the grand mean, respectively
τn stands for the eigenvalue of principal component (PC) axis n
γin and δin are the genotype and environment principal components scores for axis n and
ε represents the error term (Gauch, 1992).
The AMMI stability value (ASV) was calculated by the method formulated by Purchase et al. (2000).
Where SS represents the sum of squares of first (IPCA1) and second (IPCA2) interaction principal component axes; and IPCA1 and IPCA2 are the genotypic scores obtained from the AMMI model.
Genotype selection index (GSI) was obtained by following the method devised by Farshadfar and Sutka (2003).
Where GSIi denotes the genotype selection index for ith genotype, RYi is rank of mean grain yield for ith genotype, RASVi represents rank for the AMMI stability value for the ith genotype.
GGE analysis was performed using the software GEA-R version 4.1 (Angela et al., 2015) with the model equation:
Where Yij is the yield of ith genotype in the jth environment; Gi and Ej represent the genotype and environment deviations from the grand mean, respectively; μ denotes the grand mean λk is the eigenvalue of the PCA axis k; αik and γjk indicate the genotype and environment PC scores, respectively, for the axis k and eij denotes the error term.
Results
Analysis of variance showed significant difference among all the morphological traits under study. The variation in yield and yield attributing are displayed in Table 2. The mean of plant height ranged from 32.99 cm (E1) to 42.16 cm (E2). The trait days to fifty per cent flowering varied from 40 days (E1) to 41 days (E3). The environment E1 showed minimum mean value for number of pods per plant (28.27) whereas E3 expressed maximum mean of 34.69. The mean of pod length ranged from 8.43 cm (E1) to 8.68 cm (E2). The mean of number of seeds per pod varied from 10.84 (E1) to 10.95 (E2). The trait hundred seed weight recorded minimum mean of 4.43 g (E1) to a maximum of 4.61 g (E3). Grain yield ranged from a minimum mean of 9.89 g in E2 to a maximum of 11.32 g in E3. The genotypic correlations between grain yield and other independent traits in mungbean across three environments are given in Table 3. Among the 63 associations, 15 were having significant positive association, while 13 were having significant negative association. The trait number of pods per plant was identified as the important yield attributing trait that showed highly significant positive association with grain yield in all the three tested environments. The stability analyses were carried out for grain yield in three environments viz., Virinjipuram (E1), Eachangkottai (E2) and Bhavanisagar (E3).
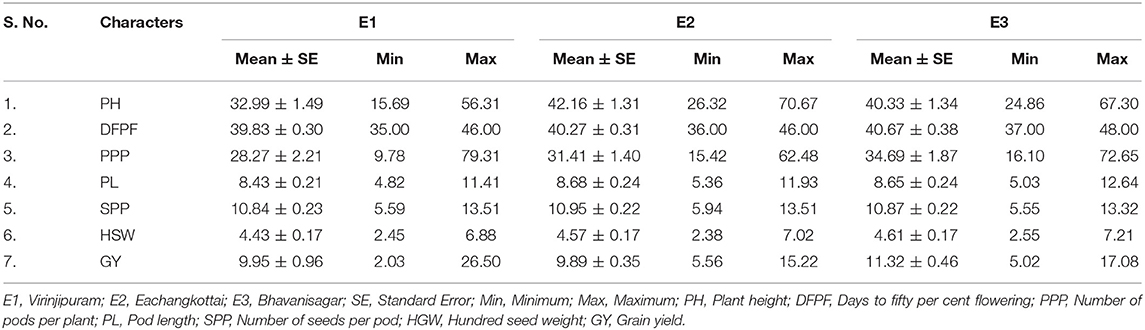
Table 2. Mean and range of quantitative traits of mungbean in different environments.
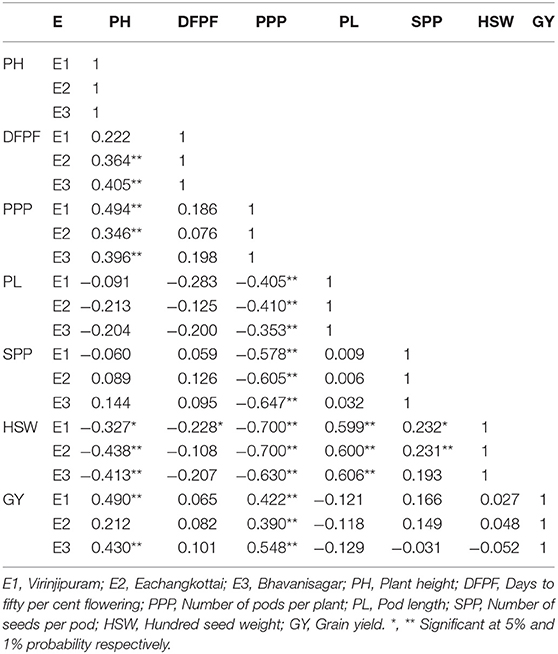
Table 3. Genotypic correlations between grain yield and independent traits in mungbean.
Stability Analysis for Grain Yield
Analysis of Variance
AMMI analysis of variance for pooled mean grain yield of 52 genotypes from three environments (E1, E2, and E3) explained that the major portion of the total sum of squares contributed by genotypic effects (61.07%) followed by GEI effects (21.82%) and environmental effects (17.10%) (Table 4). AMMI ANOVA revealed significant differences among 52 mungbean genotypes and three environments. This depicts that the grain yield of mungbean influenced by genotype (G), environment (E), and also the interaction between genotype and environment (GEI). AMMI analysis further partitioned the GEI into the first two multiplicative terms namely PC1 and PC2 with a contribution of 67.76 and 32.24% of GEI sum of squares. The presence of a significant proportion of GEI necessitates the analysis of the stability of mungbean genotypes over environments.
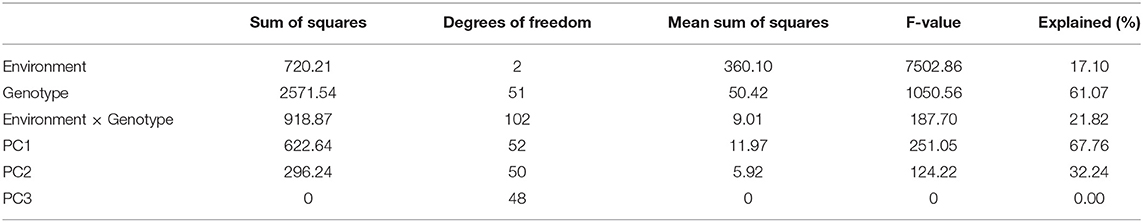
Table 4. AMMI analysis of variance for mean grain yield of 52 mungbean genotypes from three different locations during Kharif 2017, 2018, and 2019.
Grouping of Test Environments
Grain yield analysis of mungbean revealed that the average environment means ranged from 8.25 g (E1) to 11.32 g (E3). Nineteen genotypes showed above-average yield in the E1 environment. Twenty-two genotypes in E2 and 28 genotypes in the E3 environment outperformed the average yield of the corresponding genotypes in a particular environment (Table 5). There exists a negative correlation between all the environments E1, E2, and E3 under study since the angle between the environments is higher than 90° (Figure 1). The present study showed that the environment E3 was found with the longest vector having more discriminating power compared to the other two environments. The Average Environment Axis (AEA) view compared the environments in relation to an ideal environment. The environment E3 had the smallest angle with the AEA, hence the E3 environment is highly representative. The Average Environment Coordinate (AEC) axis projected the stability of the accessions. The highly stable genotypes indicated by a small perpendicular line to the AEC axis whereas the increase in the length of the perpendicular line denoted the decrease in stability of the genotypes. Genotypes (G2, G42, G33, G43, G4, and G49) were highly stable with low to good yielding ability. The genotype G37 was highly unstable because it was far away from the AEC axis followed by G36, G34, G14, and G12. These genotypes expressed good yielding ability (Figure 1).
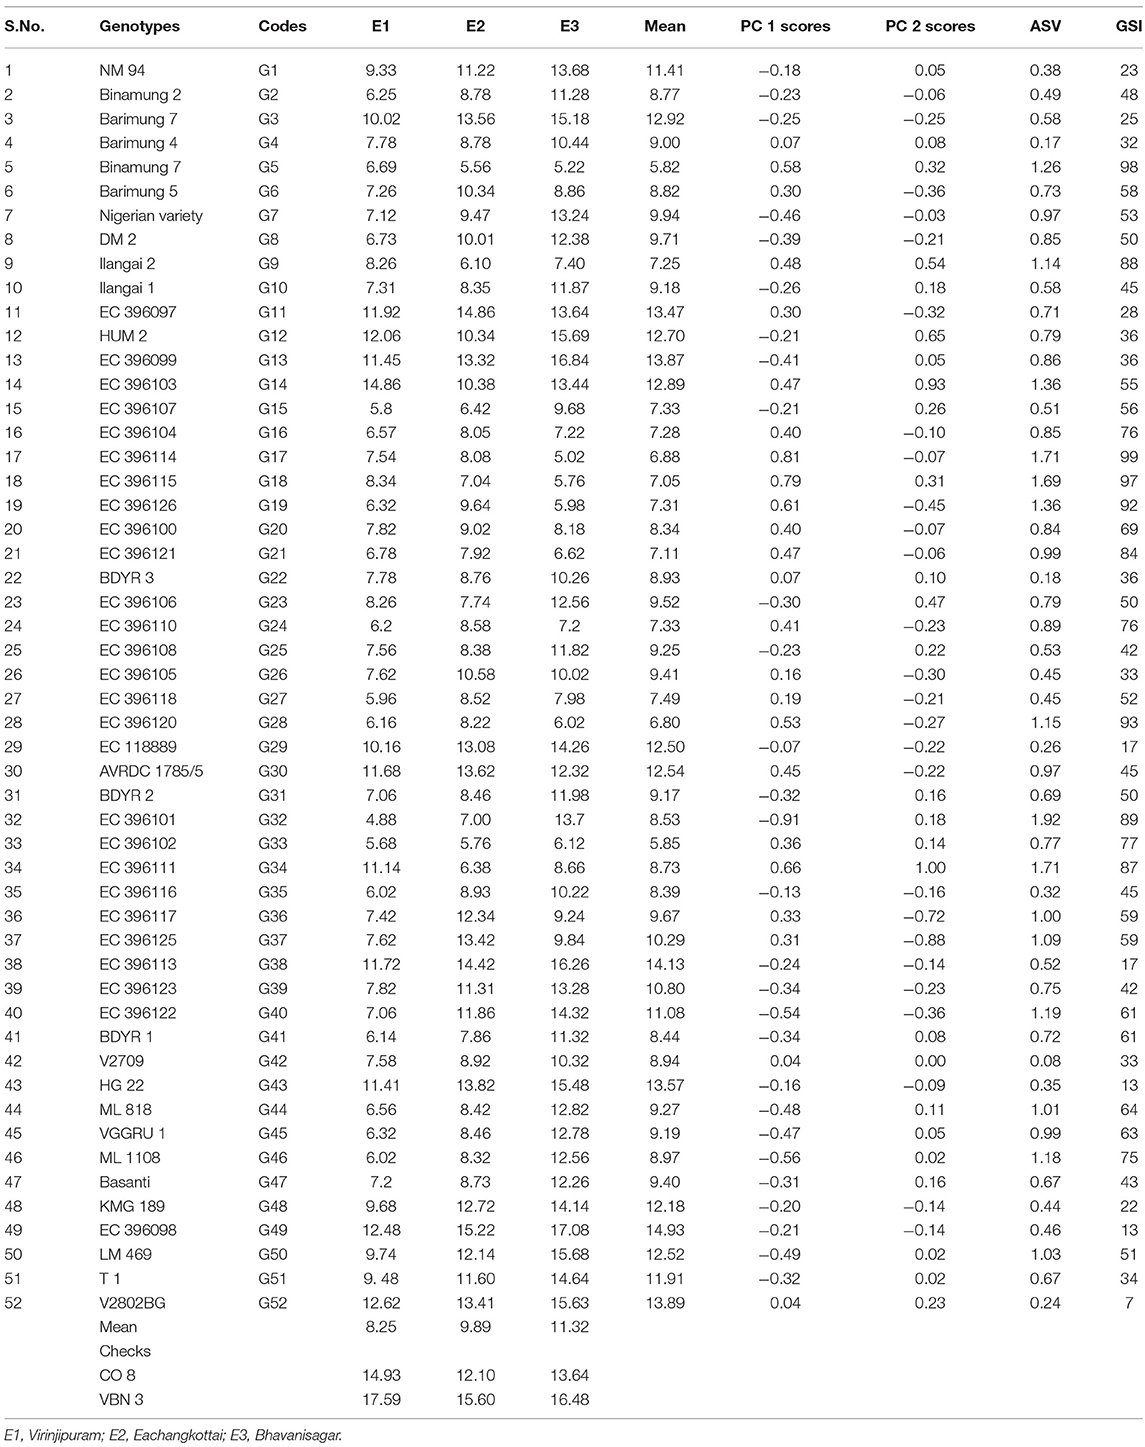
Table 5. Mean grain yield, AMMI stability value (ASV) and genotype selection index (GSI) of mungbean accessions.
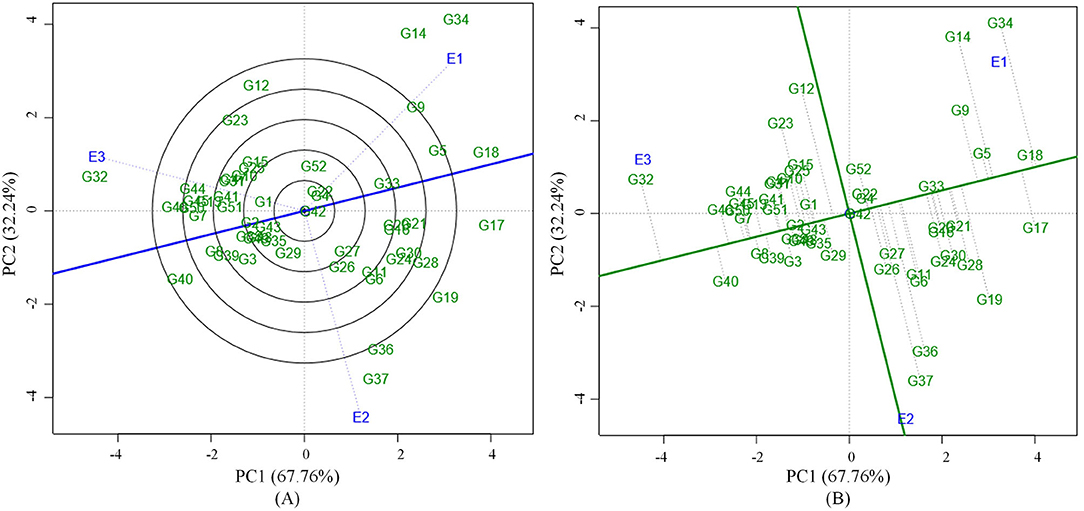
Figure 1. (A) GGE biplot based on environment focused scaling for the comparison of three environments in relation to average environment axis (AEA) (blue line that passes through the biplot origin and the average environment). (B) Average Environment Coordination (AEC) view based on environment focused scaling for the pooled mean performance and the stability of 52 mungbean genotypes.
Genotype Response to Wider Adaptation
AMMI analysis showed the interaction component IPCA 1 with 67.76% of the total interaction sum of squares, whereas IPCA 2 attributed for 32.24%. The performance of genotypes in a specific environment, as well as the overall performance across all the test environments, can be effectively analyzed in the presence of two or more PCA axes. IPCA 1 scores for grain yield over three locations were plotted against genotype and environment scores along with the environments (E1, E2, and E3) (Figure 2). The genotypes plotted on right side of the central axis formed based on grand mean, exhibited high yield compared to those on the left side of the axis. Five genotypes exhibited the above-average performance with positive interaction effect were present in the quadrant I. Fourteen genotypes in the quadrant IV also showed the above-average performance but having a negative interaction effect. About 19 genotypes along with the environment E1 falling under quadrant II showed below-average performance with a positive interaction effect. The environment E2 is between quadrant I and II. About 14 genotypes present in quadrant III also exhibited below-average performance with negative interaction effect with the environment E3. About 10 genotypes having IPCA 1 score nearer to zero as it exhibited between −0.18 to 0.19 (Table 5) which were stable across all the test environments (E1, E2, and E3). A set of nine genotypes found to be less stable as it explained moderately larger scores.
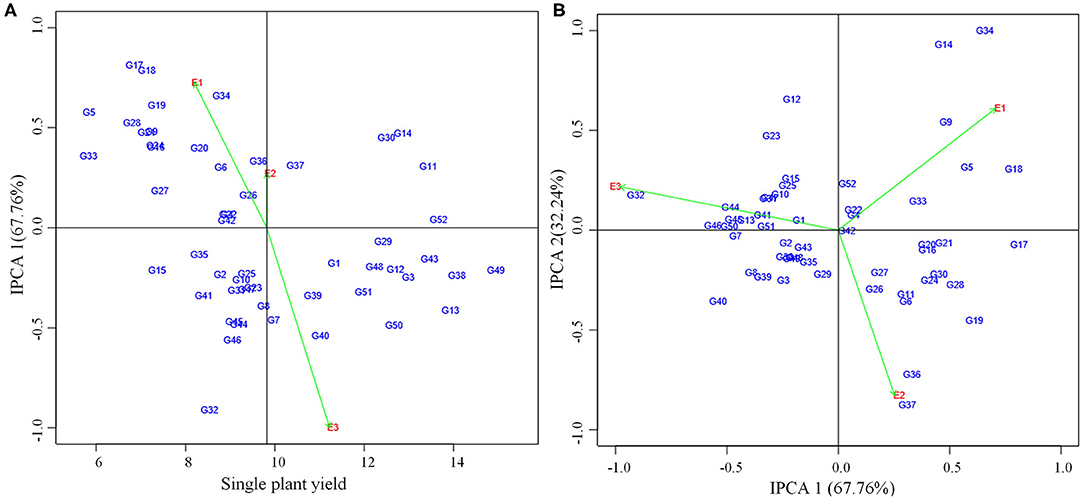
Figure 2. (A) AMMI I biplot showing main effects and IPCA1 interaction effects of 52 mungbean genotypes and three environments on grain yield of mungbean. (B) AMMI II biplot of first two principal components (IPCA1 vs IPCA2) of interaction effects.
For the maximum exploration of GEI, the IPCA 1 scores visualized against IPCA 2 in the form of a graph (Figure 2). The 15 genotypes with IPCA 2 value ranging between −0.09 to 0.08 located nearer to the center of the biplot, produced highly stable grain yield across all the test environments. Twenty four genotypes fall under medium stable genotypes category which surrounded the highly stable genotypes in the graph. The highly unstable 13 genotypes that were far away from the center, had also been identified from the biplot. Furthermore, the biplot showed a highly interactive environment as E3 as well as the genotypes (G34 and G14) that contributed largely to the GEI. The genotypes G34 and G14 particularly performed well in E1. The genotypes G36 and G37 were particularly adapted to E2, whereas the genotype G32 had more interaction with E3.
According to ASV, the genotypes close to 0 (G42, G4, G22, and G52) were highly stable, whereas the genotypes having high value (G32, G34, G17, and G18) were found to be highly unstable (Table 5). GSI integrates both yield and stability across environments. Genotypes with lower GSI (G52, G43, and G49) were desirable since they combine high mean yield performance with stability. The genotypes G43 and G52 outperformed the check (CO 8) in E2 and E3. The genotype G49 outperformed both the checks (CO 8 and VBN 3) in E3 whereas outperformed the check CO 8 in E2.
Genotype Response to Specific Adaptation
Locating the most suitable accession for each environment can be done by which-won-where pattern analysis. In this, a polygon is produced by joining the genotypes far away from the origin consisted of all the other genotypes inside the polygon (Figure 3). The polygon is further portioned into eight different sectors using the rays (red line) that were starting from biplot origin and passing perpendicular to the sides of the polygon. The genotypes in a sector are similar in performance compared to the genotypes in other sectors. E1 environment is more suitable for the following genotypes viz., G34, G14, G18, G5, and G9 which are located in the same sector whereas the environment E2 is highly desirable for G37, G36, G6, G11, G26, and G27. The sector that consisted of the E3 environment contained many numbers of genotypes thus portraying that the E3 environment is highly suitable for the expression of most of the genotypes. Few of those genotypes that performed well in E3 were G32, G40, G46, G44, G45, G50, G7, G8, G39, G13, G41, and G51. The genotypes plotted at each vertex of the polygon were the best performing genotype to the environment nearer to the vertex. In this case, G34, G37, and G32 were the peak genotypes that are highly suitable for the environments E1, E2, and E3 respectively. The genotype G37 outperformed the check (CO 8) in E2 whereas G32 outperformed check (CO 8) in E3.
Figure 3. Which-won-where pattern of 52 genotypes and three environments based on symmetrical scaling showing winning genotype in each environment.
Discussion
In the present study, there existed considerable trait variation among the 52 mungbean genotypes studied, besides number of pods per plant was identified as the key character for yield increase in mungbean. The grain yield performance of 52 mungbean genotypes were evaluated in three different environments [Virinjipuram (E1), Eachangkottai (E2), and Bhavanisagar (E3)] of Tamil Nadu, Southern state of India for the identification of stable genotypes adapted across environments. The selected environments for our study are popular mungbean growing regions that fall under three different agro- ecological zones of Tamil Nadu. The selection for yield improvement is a complex phenomenon, should be decided in accounting genotypes along with the environmental interactions. Stability models help in studying the G × E interaction and assists in identifying the specifically and generally adapted genotypes for particular and all the test environments, respectively (Gauch, 2006; Yan et al., 2007). The best performing and most stable accessions identified will be utilized for prebreeding purpose to develop promising mungbean genotypes. GGE biplot investigated the G × E interaction in a more precise manner. The angle between environments denotes the association among environments. In the present study, the cosine of the angle between all the environments was higher than 90° indicating the negative association among the environments. On the contrary, Yan and Kang (2003) reported a positive correlation between two environments as the angle between the environments was lower than 90°. This negative correlation between environments depicts the presence of high cross over G × E interaction.
The ability of any test environment can be visualized with the aid of discriminating power and representativeness view of the environment (Dehghani et al., 2006). The length of the environment vectors is proportional to the standard deviation within the respective environments on the biplot and also displays the discriminating ability of the environments (Yan and Tinker, 2006). The environment E3 was more discriminating in comparison with the other two environments. The representativeness of the environments can be assessed in the presence of AEA. Having a minimum angle with AEA, the E3 environment was designated as the most representative environment. In the view of discriminating power and representativeness, the generally adapted genotypes will be selected from the environment E3, whilst the specifically adapted genotypes will be selected from environments E1 and E2. The results of discriminating ability and representativeness were in line with the reports of Asfaw et al. (2012) and Ullah et al. (2012) in mungbean. The highly stable genotypes viz., G2, G42, G33, G43, G4, and G49 identified concerning AEC and showed low to better yielding ability. The genotypes G37, G36, G34, G14 and G12 were highly unstable as located far away from the AEC, exhibited good yielding ability. The results were in accordance with the interpretation of Asfaw et al. (2012) in mungbean. According to which-won-where pattern analysis, G34, G37, and G32 were the vertex cultivars in E1, E2, and E3 environments, respectively for expressing the better yielding ability. The promising performance of vertex genotypes in the desired environment was also been reported by Asfaw et al. (2012) in mungbean.
AMMI results revealed the major contribution of the genotypic effects followed by GEI effects and environmental effects. The high value in IPCA 1 was sufficient to study the total G × E interaction that was in accordance with the findings of Win et al. (2017). Based on the performance of genotypes across different environments, AMMI 1 classified the genotypes as most stable and high yielding genotypes (G52, G29, and G43), less stable and high yielding genotypes (G37, G30, G14, and G11) and most stable and low yielding genotypes viz., G42, G22 and G4 as reported by Kilic (2014) in barley. From AMMI 2 biplot the highly interactive environment (E3) and genotypes (G34 and G14) were identified. The precise adaptation of genotypes to the appropriate environment has also been visualized with the help of biplot. E1 was more suitable for the genotype G34. The genotype G37 expressed the high yielding potential in E2, whereas the genotype G32 showed positive interaction with E3. The trait number of pods per plant was the yield driving trait in all the three environments. Win et al. (2018) also reported the better performance of particular mungbean genotypes for each environment under study. Based on GSI, the following genotypes viz., G52 (V2802BG), G43 (HG 22), and G49 (EC 396098) were identified as stable and high yielding across all the test environments under study.
In summary, the present study revealed that the genotypes namely EC 396111 (G34) (E1), EC 396125 (G37) (E2), and EC 396101 (G32) (E3) were suitable for the particular environment and the genotypes viz., V2802BG, HG 22, and EC 396098 were highly suitable for all the three environments. Genetic potential of the genotype and prevailing irregularity of environmental conditions like the variation in weather factor, soil types, and diverse ecologies of tested environment might contribute to the superior/inferior performance/stability of the genotypes over locations. The genotypes used in this study previously known for its pests and disease resistance. Further the present study revealed the stability of grain yield performance over environments. Hence the prudent use of these genotypes as parent/ pre-breeding material hold great potential in future breeding programmes in mungbean to develop varieties with high yield coupled with resistance to biotic stresses.
Data Availability Statement
The original contributions presented in the study are included in the article/supplementary material, further inquiries can be directed to the corresponding author/s.
Author Contributions
DM, NS, and SS conceived and designed the methods and experiments. SS, DM, and MP managed the fieldwork. SS, DM, MP, and SH conducted the phenotype screening. SS, MD, AK and SH performed data analysis. CV, AH, and VS provided suggestions on experiments. SS, AK, and NS drafted the manuscript. All authors contributed to the article and approved the submitted version.
Funding
The work was financially supported through grants from the Department of biotechnology, Government of India under the BioCARe (No. BT/PR19568/BIC/101/321/2016 dt. 19.06.2017) scheme entitled Introgression of bruchid resistant gene (s) from Vigna genotypes into popular mungbean (Vigna radiata L.) variety through marker assisted backcross breeding.
Conflict of Interest
The authors declare that the research was conducted in the absence of any commercial or financial relationships that could be construed as a potential conflict of interest.
References
Angela, P., Mateo, V., Gregorio, A., Francisco, R., Jose, C., and Juan, B. (2015). GEA-R (Genotype × Environment Analysis with R for Windows) Version 4.1, hdl:11529/10203, CIMMYT Research Data and Software Repository Network, V16; GEA-R_v4.1_BASE_setup.exe. Mexico.
Asfaw, A., Gurum, F., Alemayehu, F., and Rezene, Y. (2012). Analysis of multi-environment grain yield trials in mung bean Vigna radiata (L.) Wilczek based on GGE bipot in Southern Ethiopia. J. Agri. Sci. Tech. 14, 389–398.
AVRDC. (2019). The International Mungbean Improvement Network helps unlock the potential of Mungbean to Improve System Productivity and Livelihoods. Available online at: https://avrdc.org/intl-mungbean-network/
Biswas, J. C., Kalra, N., Maniruzzaman, M., Choudhury, A. K., Jahan, M. A. H. S., Hossain, M. B., et al. (2018). Development of mungbean model (MungGro) and its application for climate change impact analysis in Bangladesh. Ecol. Model 384, 1–9. doi: 10.1016/j.ecolmodel.2018.05.024
Chotechung, S., Somta, P., Chen, J., Yimram, T., Chen, X., and Srinives, P. (2016). A gene encoding a polygalacturonase-inhibiting protein (PGIP) is a candidate gene for bruchid (Coleoptera: bruchidae) resistance in mungbean (Vigna radiata). Theor. Appl. Genet. 129, 1673–1683. doi: 10.1007/s00122-016-2731-1
Dehghani, H., Ebadi, A., and Yousefi, A. (2006). Biplot analysis of genotype by environment interaction for barley yield in Iran. Agron J. 98, 388–393. doi: 10.2134/agronj2004.0310
Farshadfar, E., and Sutka, J. (2003). Locating QTLs controlling adaptation in wheat using AMMI model. Cereal Res. Commun. 31, 249–254. doi: 10.1007/BF03543351
Gauch, H. G. (1992). Statistical Analysis of Regional Yield Trials: AMMI Analysis of Factorial Designs. (Amsterdam, Netherlands: Elsevier Science Publishers).
Gauch, H. G. (2006). Statistical analysis of yield trials by AMMI and GGE. Crop Sci. 46, 1488–1500. doi: 10.2135/cropsci2005.07-0193
Gruneberg, W. J., Manrique, K., Zhang, D., and Hermann, M. (2005). Genotype × environment interactions for a diverse set of sweet potato clones evaluated across varying Eco geographic conditions in Peru. Crop Sci. 45, 2160–2171. doi: 10.2135/cropsci2003.0533
IBPGR, (1980). Descriptors for Vigna mungo and V. radiata. Rome: International Board for Plant Genetic Resources. 11–15.
Islam, M. R., Sarker, M. R. A., Sharma, N., Rahman, M. A., Collard, B. C. Y., Gregorio, G. B., et al. (2015). Assessment of adaptability of recently released salt tolerant rice varieties in coastal regions of South Bangladesh. Field Crops Res. 190, 34–43. doi: 10.1016/j.fcr.2015.09.012
Kaewwongwal, A., Chen, J., Somta, P., Kongjaimun, A., Yimram, T., Chen, X., and Srinives, P. (2017). Novel alleles of two tightly linked genes encoding polygalacturonase-inhibiting proteins (VrPGIP1 and VrPGIP2) associated with the Br locus that confer bruchid (Callosobruchus spp.) resistance to mungbean (Vigna radiata) accession V2709. Front. Plant Sci. 8:1692. doi: 10.3389/fpls.2017.01692
Kang, M. S. (1993). Simultaneous selection for yield and stability in crop performance trials: consequences for growers. Agron J. 85, 754–757. doi: 10.2134/agronj1993.00021962008500030042x
Karthikeyan, A., Samyuktha, S. M., Malarvizhli, D., Pandiyan, M., and Senthil, N. (2019). “Evaluation of mungbean (Vigna radiata) genotypes for resistance to mungbean yellow mosaic virus (MYMV),” in Indian Science Congress. Chennai: SRM University, 97.
Karthikeyan, A., Shobhana, V. G., Sudha, M., Raveendran, M., Senthil, N., Pandiyan, M., and Nagarajan, P. (2014). Mungbean yellow mosaic virus (MYMV): a threat to green gram (Vigna radiata) production in Asia. Int. J. Pest Manage. 60, 314–324. doi: 10.1080/09670874.2014.982230
Karthikeyan, A., Sudha, M., Pandiyan, M., Senthil, N., Shobhana, V. G., and Nagarajan, P. (2011). Screening of MYMV resistant mungbean (Vigna radiata (L) Wilczek) progenies through agroinoculation. Int. J. Plant Pathol. 2:115125. doi: 10.3923/ijpp.2011.115.125
Kilic, H. (2014). Additive main effects and multiplicative interactions (AMMI) analysis of grain yield in barley genotypes across environments. Tarim Bilim. Derg. 20, 337–344. doi: 10.15832/tbd.44431
Nair, R. M., Pandey, A. K., War, A. R., Hanumantharao, B., Shwe, T., Alam, A. K. M. M., et al. (2019). Biotic and abiotic constraints in mungbean production—progress in genetic improvement. Front. Plant Sci. 10:1340. doi: 10.3389/fpls.2019.01340
Nair, R. M., Yang, R. Y., Easdown, W. J., Thavarajah, D., Thavarajah, P., Hughes, J. D. A., and Keatinge, J. D. H. (2013). Biofortification of mungbean (Vigna radiata) as a whole food to enhance human health. J. Sci. Food Agric. 93, 1805–1813. doi: 10.1002/jsfa.6110
Pandiyan, M., Senthil, N., Karthikeyan, A., Packiyaraj, D., Jagadeesh, S., Geetha, S., et al. (2011). “Development of MYMV resistant genotypes in Green gram through Agroinoculation analysis,” in National Symposium on Advances in Crop Improvement and Stress Management (ACISM), Chidambaram: Faculty of agriculture, Annamalai University, 45.
Purchase, J. L., Hatting, H., and Vandeventer, C. S. (2000). Genotype × environment interaction of winter wheat (Triticum aestivum L.) in South Africa: II. stability analysis of yield performance. South Afric. J. Plant Soil. 17, 101–107. doi: 10.1080/02571862.2000.10634878
Samyuktha, S. M., Karthikeyan, A., Venugopal, S., Hepziba, S. J., Malarvizhi, D., and Senthil, N. (2019). “Evaluation of greengram (Vigna radiata (L.) Wilczek) germplasm for genetic diversity and bruchid resistance,” in Proceedings of the 106th Indian Science Congress. Phagwara; Jalandhar: Lovely Professional University, 91.
Schafleitner, R., Huang, S. M., Chu, S. H., Yen, J. Y., Lin, C. Y., Yan, M. R., et al. (2016). Identification of single nucleotide polymorphism markers associated with resistance to bruchids (Callosobruchus spp.) in wild mungbean (Vigna radiata var. sublobata) and cultivated V. radiata through genotyping by sequencing and quantitative trait locus analysis. BMC Plant Biol. 16:159. doi: 10.1186/s12870-016-0847-8
Senthil, N., Murukarthick, J., Pandiyan, M., Karthikeyan, A., Sudha, M., Raveendran, M., et al. (2012). Paithumbase-biometrical traits based query system for studying mungbean [Vigna radiata (L.) Wilczek] phenomics. Int. J. Appl. 4, 36–39. doi: 10.5120/ijais12-450819
Somta, C., Somta, P., Tomooka, N., Ooi, P. C., Vaughan, D. A., and Srinives, P. (2008). Characterization of new sources of mungbean (Vigna radiata (L.) Wilczek) resistance to bruchids, Callosobruchus spp.(Coleoptera: Bruchidae). J. Stored Prod. Res,. 44, 316-321. doi: 10.1016/j.jspr.2008.04.002
Sudha, M., Karthikeyan, A., Nagarajan, P., Raveendran, M., Senthil, N., Pandiyan, M., et al. (2013). Screening of mungbean (Vigna radiata) germplasm for resistance to Mungbean yellow mosaic virus using agroinoculation. Can. J. Plant Pathol. 35, 424–430. doi: 10.1080/07060661.2013.827134
Tariku, S., Taddesse, L., Bitew, M., and Asfaw, M. (2013). Genotype by environment interaction and grain yield stability analysis of rice (Oryza sativa L.) genotypes evaluated in north western Ethiopia. Net. J. Agric. Sci. 1, 10–16.
Thangavel, P., Anandan, A., and Eswaran, R. (2011). AMMI analysis to comprehend genotype-by-environment (GE) interactions in rainfed grown mungbean (Vigna radiata L.). Aust. J. Crop Sci. 5:1767.
TNAU Crop Production Guide Agriculture. (2020). Available online at: agritech.tnau.ac.in/pdf/AGRICULTURE.pdf
Ullah, H., Khalil, I. H., Khalil, I. A., Fayaz, M., Yan, J., and Ali, F. (2012). Selecting high yielding and stable mungbean (Vigna radiata (L.) Wilczek) genotypes using GGE biplot techniques. Can. J. Plant Sci. 92, 951–960. doi: 10.4141/cjps2011-162
Win, K. S., Win, K., Min, T. D., Htwe, N. M., and Shwe, T. (2017). Additive main effects and multiplicative interactions (AMMI) analysis of seed yield stability and adaptability in mungbean (Viga radiata L. Wilczek) genotypes. Agric. Res. J. 72–79.
Win, K. S., Win, K., Min, T. D., Htwe, N. M., and Shwe, T. (2018). Genotype by environment interaction and stability analysis of seed yield, agronomic characters in mungbean (Vigna radiata L. Wilczek) genotypes. Int. J. Adv. Res. 6, 926–934. doi: 10.21474/IJAR01/6750
Xavier, A., Jarquin, D., Howard, R., Ramasubramanian, V., Specht, J. E., Graef, G. L., et al. (2018). Genome-wide analysis of grain yield stability and environmental interactions in a multiparental soybean population. G3 8, 519–529. doi: 10.1534/g3.117.300300
Yan, W., and Kang, M. S. (2003). “GGE biplot analysis: a graphical tool for breeders,” in Geneticists and Agronomists, 1st Edn. (Boca Raton, FL: CRC Press). 288. doi: 10.1201/9781420040371
Yan, W., Kang, M. S., Ma, B., Woods, S., and Cornelius, P. L. (2007). GGE biplot vs AMMI analysis of genotype-by-environment data. Crop Sci. 47, 643–655. doi: 10.2135/cropsci2006.06.0374
Keywords: GGE, AMMI, GSI, G × E interaction, mungbean
Citation: Samyuktha SM, Malarvizhi D, Karthikeyan A, Dhasarathan M, Hemavathy AT, Vanniarajan C, Sheela V, Hepziba SJ, Pandiyan M and Senthil N (2020) Delineation of Genotype × Environment Interaction for Identification of Stable Genotypes to Grain Yield in Mungbean. Front. Agron. 2:577911. doi: 10.3389/fagro.2020.577911
Received: 30 June 2020; Accepted: 12 October 2020;
Published: 07 December 2020.
Edited by:
Najeeb Ullah, University of Queensland, AustraliaReviewed by:
Smi Ullah, The University of Sydney, AustraliaYajun Hu, Chinese Academy of Sciences, China
Rafaqat Ali Gill, Chinese Academy of Agricultural Sciences, China
Copyright © 2020 Samyuktha, Malarvizhi, Karthikeyan, Dhasarathan, Hemavathy, Vanniarajan, Sheela, Hepziba, Pandiyan and Senthil. This is an open-access article distributed under the terms of the Creative Commons Attribution License (CC BY). The use, distribution or reproduction in other forums is permitted, provided the original author(s) and the copyright owner(s) are credited and that the original publication in this journal is cited, in accordance with accepted academic practice. No use, distribution or reproduction is permitted which does not comply with these terms.
*Correspondence: Natesan Senthil, c2VudGhpbF9uYXRlc2FuQHRuYXUuYWMuaW4=; orcid.org/0000-0002-2930-0715