 Andrew G. McKenzie-Gopsill
 Sasan Amirsadeghi
 Sherry Fillmore3
 Clarence J. Swanton
- 1Charlottetown Research and Development Centre, Agriculture and Agri-Food Canada, Charlottetown, PE, Canada
- 2Department of Plant Agriculture, University of Guelph, Guelph, ON, Canada
- 3Kentville Research and Development Centre, Agriculture and Agri-Food Canada, Kentville, NS, Canada
Photosynthetic responses of common bean (Phaseolus vulgaris L.) to increasing durations of weed-free and weedy environments were investigated using a critical period for weed control study under field conditions. The presence of weeds induced the shade avoidance response and was accompanied by a reduced red to far-red ratio (R/Fr) of reflected light supporting previous assertions it is an important signal regulating crop-weed interactions. Despite increases in stomatal conductance and leaf intercellular [CO2] with increasing duration of weed presence, CO2 assimilation and photosynthetic efficiency continually declined. This coincided with reduced Calvin cycle capacity suggesting induction of biochemical rather than stomatal limitations on photosynthesis. Weed removal prior to reproductive stages resulted in maintenance of high photosynthetic capacity. When weed presence extended to reproductive stages and beyond the critical period for weed control, however, CO2 assimilation and photosynthetic efficiency never recovered. Yield was highly correlated with photosynthetic efficiency and in a similar manner, declined with increasing durations of weed presence through reduced seeds per plant. We conclude that the lasting consequence of weed competition is impairment of photosynthesis, which may provide an important mechanism to explain yield loss.
Introduction
Neighboring weeds have a profound effect on the light environment of emerging crop seedlings, when competition for resources and mutual shading is negligible (Ballaré, 1999). Light signals reflected and transmitted from neighboring weeds, such as low quantity and quality, measured as the ratio of red to far-red (R/Fr) light, are perceived by a wide array of sensory photoreceptors including phytochromes, which absorb radiation in the red (R, λ = 660 nm) and far-red (Fr, λ = 730 nm) spectra (Fraser et al., 2016). This reversible R/Fr-dependent activation/inactivation of phytochrome serves as a sensitive molecular switch controlling expression of selected genes that elicit reprogramming of plant growth, development, defense, and metabolism upon the perception of low R/Fr signals for the induction of shade avoidance characteristics (Smith, 1982; Quail, 1991; Franklin and Whitelam, 2005; Krahmer et al., 2018; Buti et al., 2020).
Low R/Fr light and depletion of active phytochrome have been associated with reduced biomass accumulation in controlled environments (Kharshiing and Sinha, 2016; Yang et al., 2016). In a similar manner, early responses of crop plants to low R/Fr light signals, reflected from neighboring weeds, has been implicated in induction of the shade avoidance response (SAR) and reductions in biomass accumulation and yield potential under field conditions (Page et al., 2009; Green-Tracewicz et al., 2012). These long-term effects have been associated with reduced capacity to acquire resources and induction of the SAR rather than direct resource limitation caused by weed competition (Rajcan and Swanton, 2001). For example, under non-resource limiting conditions, an early low R/Fr treatment of maize (Zea mays L.) plants through high density sowing and thinning at canopy closure (V7 stage) had a significant long-term impact on average shoot biomass and grain yield per plant (Markham and Stoltenberg, 2010). Similarly, maize seedlings exposed to weeds until V4 prior to their removal, displayed reduced biomass, chlorophyll content and yield (Horvath et al., 2018). Several studies support the notion that reductions in yield potential are positively related to the duration of weed presence following crop seedling emergence and the SAR and that yield potential is not recovered following weed removal (Van Acker et al., 1993; Page et al., 2010; Green-Tracewicz et al., 2012; Fickett et al., 2013b; Horvath et al., 2018).
The critical period for weed control (CPWC) is defined by the time frame during a crop's life cycle during which weed presence has the most detrimental effect on yield (Swanton and Valente, 2018). The importance of this empirical notion is exemplified by the large number of field experiments demonstrating significant yield loss in maize (5–26%), soybean (5–27%), and common bean (60–80%) due to delayed weed control following crop emergence (Woolley et al., 1993; Fickett et al., 2013a,b). Despite the demonstration of long-term impact of weed presence during the CPWC on season-long crop growth, development and yield potential, the underlying mechanisms have remained largely unknown. A solid body of evidence indicates that phytochrome depletion via Fr light reflected from neighboring weeds and induction of the SAR impact a suite of photosynthetic processes (Eskins and Duysen, 1984; Barreiro et al., 1992; Boccalandro et al., 2009; Liu et al., 2012; Hu et al., 2013; Fox et al., 2015; Yang et al., 2016; McKenzie-Gopsill et al., 2019). Other studies reported the negative impact of Fr light on the synthesis, activity and capacity of Calvin cycle enzymes (Graham et al., 1968; Schopfer, 1977; Fox et al., 2015). Reductions in photosynthesis and changes in the activity of Calvin cycle enzymes as a result of proximity to neighboring plants or phytochrome depletion are also implicated in reduced biomass and yield in Arabidopsis, maize, and soybean (Kasperbauer, 1987; Iqbal and Wright, 1999; Reynolds et al., 2007; Kharshiing and Sinha, 2016; Yang et al., 2016; McKenzie-Gopsill et al., 2019). The impacts of Fr light on photosynthetic responses, however, are not consistent across plant species. For example, supplemental Fr light resulted in increased CO2 assimilation and biomass accumulation in tomato, barley, and several ornamental species (Park and Runkle, 2017; Kalaitzoglou et al., 2019; Klem et al., 2019). Despite the impact of Fr light on the photosynthetic apparatus, it remains unclear how Fr light may limit CO2 assimilation of certain crop species in response to low R/Fr light reflected from neighboring weeds (Kasperbauer and Peaslee, 1973; Warrington et al., 1989). Therefore, determination of the impact of weeds on leaf-level photosynthesis during the CPWC and throughout the growing season is an important step toward understanding the mechanisms of yield loss due to early-season weed presence and potential for crop improvement.
In this study, we addressed the question of whether photosynthetic responses of crop seedlings to early emerging weeds is important for subsequent maintenance of photosynthetic efficiency and yield potential. Specifically, we tested the following four hypotheses. First, there will be a critical period for weed control in common bean and it will be accompanied by the SAR. Second, the presence of weeds will decrease CO2 assimilation and photosynthetic efficiency. Third, CO2 assimilation and photosynthetic efficiency will not recover, when weeds are present during the critical period for weed control. Lastly, weeds will have a legacy effect on photosynthesis and photosynthetic efficiency following their removal.
Materials and Methods
Plant Materials and Experimental Design
Field trials were conducted in an experimental farm (Harrington, PE, Canada; 46°20′57.60″N, 63°9′8.23″W) at the Charlottetown Research and Development Center in 2019. The soil (organic matter 3%, pH 6.6) is classified as a Orthic Humo-Ferric Podzol. The field was residue tilled and rolled prior to seeding with no further fertilization or pest management. Common bean (cv CDC Panther) seeds were planted to a target density of 47 plants m−2 in 45 cm rows on July 4th, 2019 with a commercial grain drill (1300 End Wheel Min-Till Drill, Great Plains Ag, Salina USA). Upon bean emergence, experimental plots (2 × 5 m) were designed as a randomized complete block with 4 replications, 2 main plots and 7 sub-plots with growing environments (weedy vs. weed-free) as the main plot and treatments (weed removal/addition timing) as sub-plots for a total of 14 treatment combinations and 56 plots. Each experimental plot consisted of 4 rows of beans and all measurements were taken from the center 2 rows. Two series of treatments were established. The first consisted of increasing durations of weed interference allowing weeds to compete until defined stages of bean growth (V1, V2, V3, V4, R1, and R4) at which stage weeds were removed and plots maintained weed-free for the remainder of the season (Table 1). The second consisted of increasing durations of weed-free periods allowing bean plants to remain weed-free until defined stages of bean growth (V1, V2, V3, V4, R1, and R4) at which stage weeds were allowed to grow for the remainder of the season (Table 1). In addition, weedy and weed-free control treatments were maintained weedy and weed-free all season, respectively. Timing of weed removal/addition was determined by BBCH growth stages and were based on the weed-free control. Weed populations were naturally occurring and consisted of a mix of green pigweed (Amaranthus powellii S. Wats.), redroot pigweed (Amaranthus retroflexus L.), common lambsquarters (Chenopodium album L.), yellow foxtail (Setaria glauca L. Beauv.), corn spurrey (Spergula arvensis L.), common chickweed [Stellaria media (l.) Vill.], wild mustard (Sinapis arvensis L.), and barnyard grass [Echinochloa crus-galli (L.) Beauv.]. Weed density was determined 4 and 8 weeks after planting by counting all weed species in a 0.5 m2 quadrat within each plot. In all cases, weeds were controlled with hand-weeding. Following bean harvest, internode length was measured on the 1st, 2nd, 3rd, and 4th internodes on 5 plants plot−1. In addition, mineral nutrient content of soil and plant were determined in three bulked 0–15 cm soil samples plot−1 and collected bean tissues, respectively. Mineral nutrients were determined using the Melich III procedure and carbon and nitrogen content determined using an elemental analyser (vario Max C/N, Elementar, Ronkonkoma, USA).
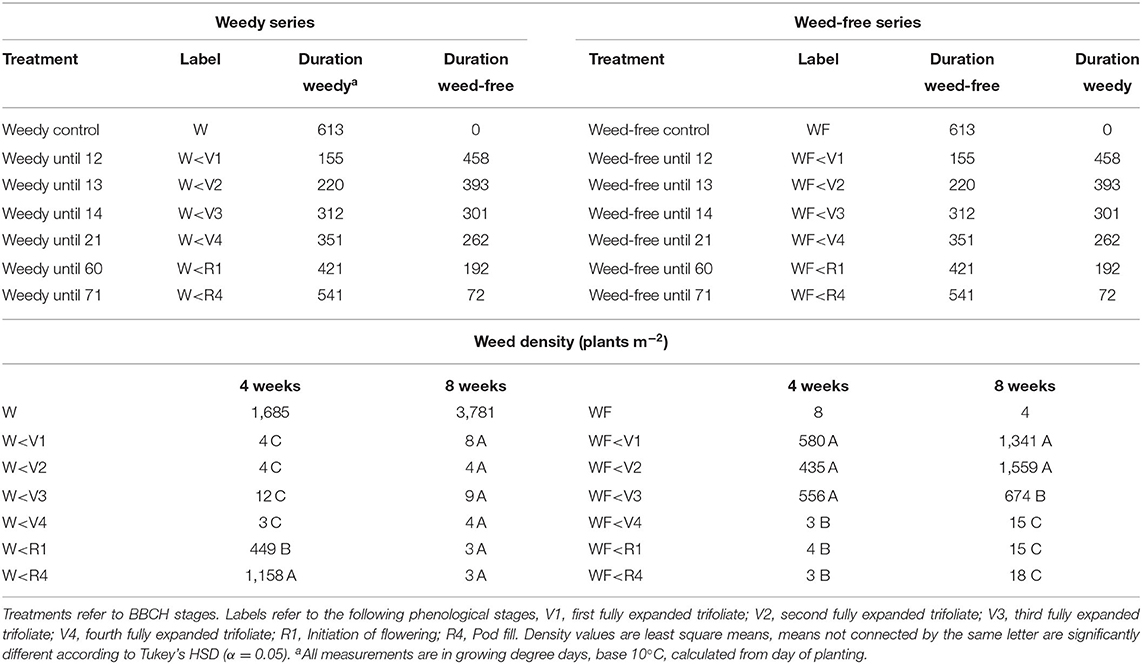
Table 1. Treatment list, labels, duration of weedy, and weed-free conditions and weed density at 4 and 8 weeks after planting.
Photosynthesis Measurements
Gas exchange parameters were measured on the middle leaf of the youngest unshaded and fully expanded trifoliate in two randomly selected plants plot−1 each week starting at V1 and concluding at R4 for a total of 8 weeks. Gas exchange parameters were measured between 8:00 and 11:00 h with a portable photosynthesis system (LI-6800F, LI-COR Biosciences, Lincoln, NE, USA) equipped with a multiphase flash fluorometer (6800-01A, LI-COR Biosciences, Lincoln, NE, USA). Prior to measuring each plot, incoming photosynthetically active radiation (PAR, μmol photons m−2 s−1) was measured with an attached quantum point sensor (LI-190R, LI-COR Biosciences, Lincoln, NE, USA) positioned 5 cm above the bean canopy. Chamber light intensity was matched to ambient light with 10% PPFD (photosynthetic photon flux density, μmol photons m−2 s−1) provided by blue LEDs, balance red. For all measurements, chamber conditions were set at a flow rate of 600 μmol s−1, leaf chamber air [CO2] of 400 μmol mol−1, vapor pressure deficit (VPd) of 1.5 kPa measured at the leaf and a leaf temperature of 25 ± 0.2°C. After placing the leaf in the sample chamber, evapotranspiration rate (E), net CO2 assimilation rate (An), stomatal conductance to water vapor (gs) and leaf intercellular [CO2] (Ci) were recorded once gas exchange and fluorescence parameters reached steady-state. Intrinsic water use efficiency (WUE) was estimated as: WUE = An/gs. Quantum yield of PSII (ΦPSII) was estimated following gas exchange measurements with a saturating flash of 8,000 μmol m−2 s−1 and recording steady-state (Fs) and maximal fluorescence (). ΦPSII was estimated as: ΦPSII = ( – Fs)/. In addition, electron transport rate (J) (μmol m−2 s−1) was estimated as: J = ΦPSII × Q × α1 × β, where Q represents incoming light intensity, α1 represents leaf absorbance and β represents the fraction of absorbed quanta reaching PSII (assumed as 0.5 for common bean, a C3 plant; Ögren and Evans, 1993).
CO2 Response Curves
A significant limitation of CO2 response curves is the time required to capture data in the field. A new technique, the rapid A/Ci response (RACir), seeks to alleviate this bottleneck by reducing the time required to capture data to 10 min (Stinziano et al., 2017). The RACir method was validated prior to the first week of measurements. Validation was conducted by testing both the traditional and RACir methods on the same leaf area on separate 3 plants. Estimation of apparent Rubisco activity (Vc, max) and regeneration of RuBP (Jmax) were performed as described previously (Dubois et al., 2007) and estimates and root mean square error (Stinziano et al., 2017) were compared using SAS v9.4 (SAS Institute, Cary, USA). For traditional A/Ci, the following chamber [CO2] were used: 400, 300, 250, 200, 150, 100, 50, 400, 400, 400, 500, 600, 700, 800, 900, and 1,000. For RACir, chamber [CO2] was ramped from 10 to 500 μmol mol−1 over a period of 5 min. Minimal differences in estimated parameters were found between the two methods (Supplementary Figure 1 and Supplementary Table 1) and therefore, RACir was used for the duration of the experiments. Each week following survey measurements and between 11:00 and 13:00 h, RACir curves were conducted as described above on the youngest unshaded and fully expanded trifoliate of two randomly selected plants from weed-free (WF) and weedy (W) control plots. Following each measurement, an empty chamber measurement was taken using an identical CO2 ramp. Chamber conditions were identical to survey measurements with temperature control at the leaf set to 25°C. Vc, max and Jmax were estimated as described above.
Light Measurements
In addition to weekly PAR measurements, incoming and reflected light spectral composition including PAR, photon flux density, photon flux density of blue, green, red, and far-red light (μmol photons m−2 s−1) were recorded in each plot during week 8 using a portable spectrometer (LI-180, LI-COR Biosciences, Lincoln, NE, USA). The spectrometer was held level 15 cm above the soil surface within the common bean canopy. The R/Fr was calculated from photon flux density of red and far-red light.
Yield Evaluation
When beans reached physiological maturity (BBCH = 89), all treatment plots and controls were combine harvested and dried at 60°C to 14% moisture prior to weighing. Seeds were counted and protein content (%) and thousand seed weights determined.
Statistical Analysis
All data were analyzed using SAS v9.4 (SAS Institute, Cary, USA) unless otherwise indicated. Light measurements were analyzed with a mixed model and main and sub-plots as the fixed effect and the interaction of replication, main plot, and sub-plot as random effects. Gas exchange and chlorophyll fluorescence parameters were analyzed as a combined dataset with regression analysis as a mixed model. Fixed effects consisted of the regression of treatment and growing environment by regression of growth stage. Linear and quadratic contrasts were used to compare weedy vs. weed-free treatments, weedy vs. weed-removal each week and weed-free vs. weed-addition each week and by vegetative vs. reproductive stages. Yield data was initially analyzed as a mixed model with the main plot as the fixed effect and replication and subplot as the random effects. For determination of the critical period, least square means of yield were generated and converted to percent of weed-free control. Converted means were then analyzed with non-linear regression in SigmaPlot v14.0 (Systat Software Inc., San Jose, USA) using a sigmoidal 4-parameter Gompertz equation: Yield = y° + a × e∧(−e∧(−χ − x°) / b)), where y° represents the starting point of the curve, a is the yield asymptote, x° and b are constants, e represents the exponential function and χ represents GDDs. Least square means for calculated parameters were used for principal component analysis. The first two principal components explained >75% of variation and were retained.
Results
Weed Presence Impacts Reflected Light Quality
Growing degree days (GDDs) steadily accumulated throughout the growing season. A period of minimal precipitation occurred during the middle of the growing season from 20 days after planting (DAP) to 50 DAP (Figure 1A). Weed density in treatments experiencing weedy environments ranged from 435 to 1,158 plants m−2 at 4 weeks. This increased throughout the season to a high of 3,781 plants m−2 at week 8 in the weedy control treatment. In contrast, weed density remained below 18 plants m−2 in all treatments experiencing weed-free environments throughout the season. Total incoming PPFD above the bean canopy did not differ between weed-free and weedy environments (p = 0.459) or treatments (p = 0.694). Incoming PPFD, however, differed across weeks (p < 0.001). In general, PPFD declined throughout the growing season from a high of 1302.04 μmol photons m−2 s−1 during the first week to a low of 166.08 μmol photons m−2 s−1 in the seventh week (Figure 1A). Despite incoming PPFD above the bean canopy being similar between growing environments and treatments, significant differences in reflected light quality were observed within the bean canopy (Figures 1B,C). The weedy environment significantly decreased the reflected R/Fr by 70% compared to weed-free environments (p = 0.070). No differences in incoming or reflected blue, green or UV light were found between treatments. In addition, no differences in light interception (LI) within the canopy were found between weed-free and weedy treatments. At the end of season, soil nitrate (p = 0.064) and plant tissue N content (p = 0.482) did not differ between weed-free and weedy environments or treatments (Supplementary Table 2).
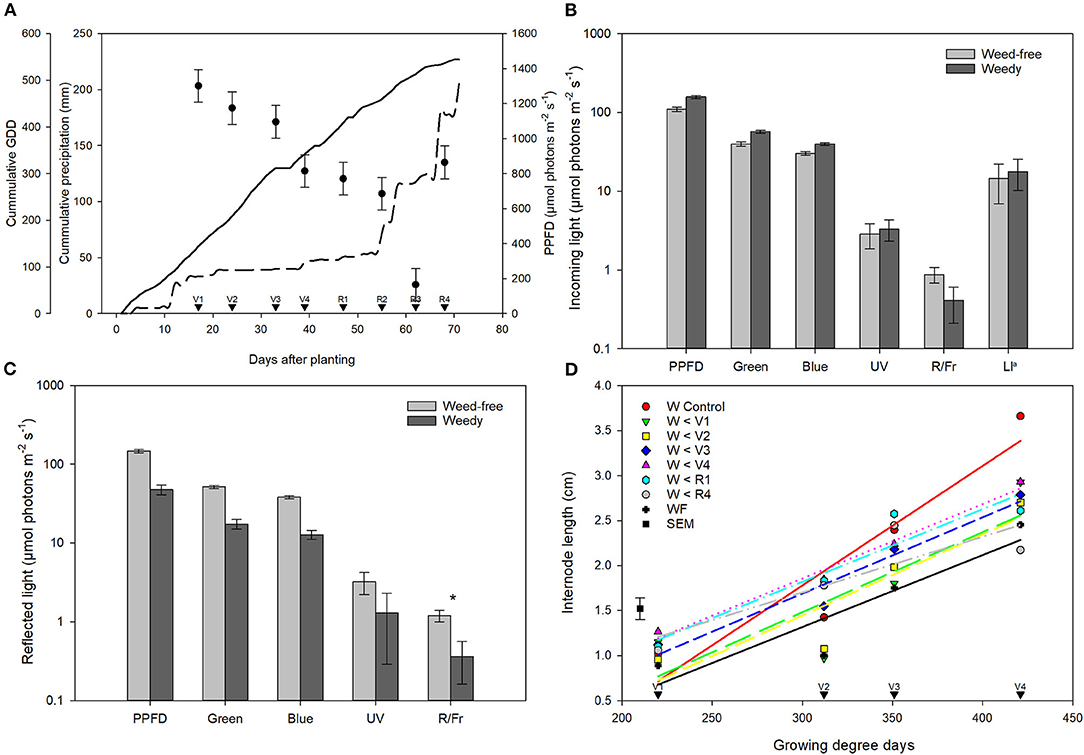
Figure 1. Characterization of growing environment throughout the season. (A) Total incoming photosynthetic photon flux density (PPFD, μmol photons m−2 s−1; •), cumulative precipitation (mm, - - -), and growing degree days (GDD, base 10°C, calculated from day of planting; –) for the duration of the experiments. Data for PPFD represent least square means of all treatments across 8 growth stages (n = 896) ± SEM. Growth stages of common bean are indicated with arrows. (B) Incoming and (C) reflected light quality measured within the common bean canopy at 8 weeks after emergence (n = 56). Data is presented on a log scale for clarity ± SEM. Asterisks indicate significant differences between weed-free and weedy treatments at p = 0.1. (D) Internode length (cm) of 1st, 2nd, 3rd, and 4th nodes of weedy and weed-free treatments at V1, V2, V3, and V4, respectively. aLI—light interception. Note—R/Fr values are unitless.
Duration of Weed Presence Increases Internode Elongation
Weed competition had a significant impact on internode length (p < 0.001). Overall, internode length increased in weedy treatments compared to weed-free conditions at all 4 initial internodes (Figure 1D). Weed removal prior to V1 decreased elongation in subsequent internodes, whereas, internode elongation increased with increasing weed presence. The addition of weeds at any stage, however, did not impact internode elongation. These results suggest that internode elongation, a hallmark of the SAR, is induced in common bean by neighboring weeds. A period of weed-free conditions during early development, however, may result in a reduced capacity for common bean to respond to neighboring plant cues.
Duration of Weed Competition Impacts Yield and Seed Quality
Measurements of yield in the weed removal and weed addition series revealed that the critical weed-free period required for maintaining 95% yield was from emergence until 280 GDD, whereas the critical period for weed removal was from planting to 185 GDD (Figure 2A). Based on these data, we conclude that the critical period for weed control in common bean that prevents >5% yield loss is from 185 to 280 GDD. Seeds per plant followed a similar pattern to yield and declined with increasing duration of weed presence (Figure 2B). No effect of treatment was found on seeds per plant in the weed-free series. Thousand seed weight (TSW), seed protein, and oil content were not affected by weed-free or weedy conditions. TSW and seed protein correlated with seeds per plant and declined with increasing seeds per plant (Figure 2C).
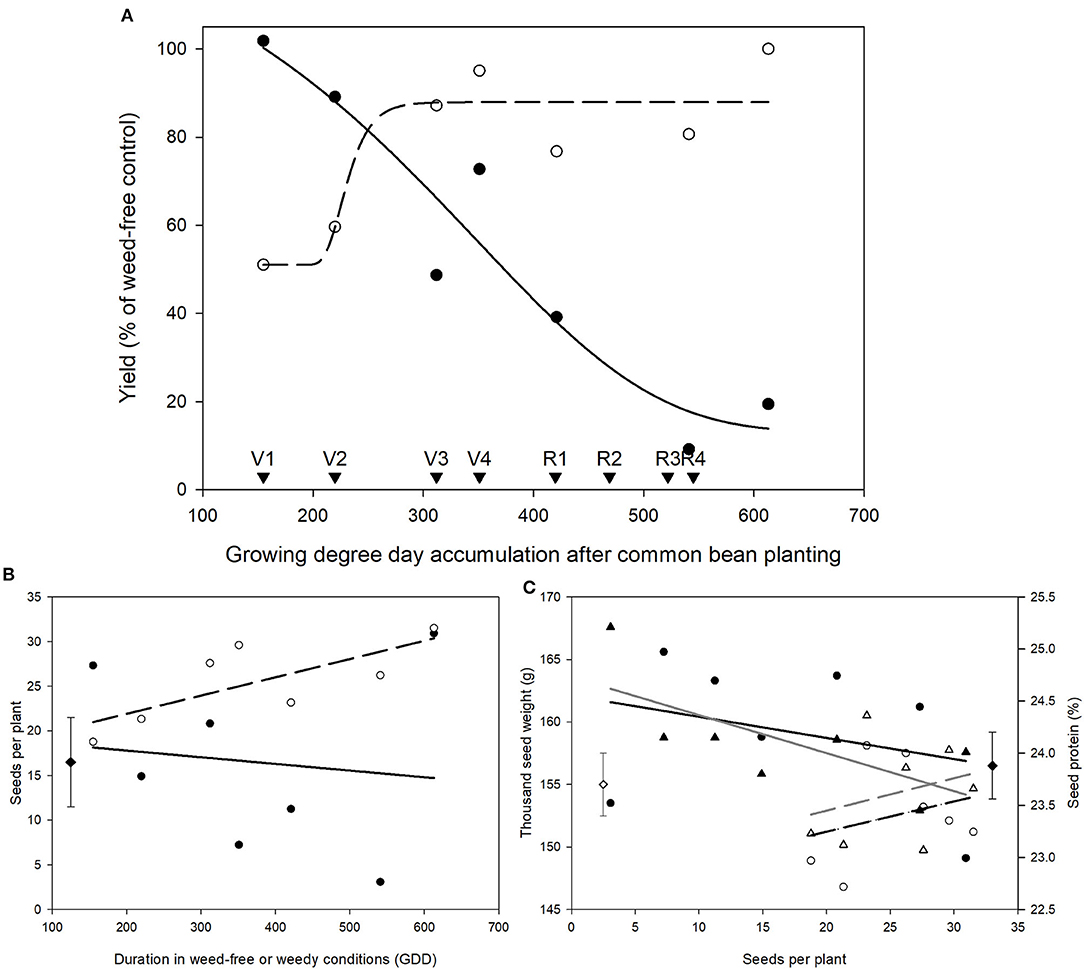
Figure 2. Impact of increasing durations of weed-free (∘, - - -) and weedy (•, –) conditions on common bean yield (A) and seeds per plant (B). Yield responses were fit with a 4-parameter Gompertz curve with the following equations for weed-free and weedy series, respectively; yield = 51.06 + 36.89 × e∧(−e∧(−(χ − 225.48)/14.52)) and yield = 13.07 + 119.03 × e∧(−e∧(−(χ − 347.51)/−165.11)). Relationship between seeds per plant and thousand seed weight (WF = ∘, - - -; W = •, –) and seed protein content (WF = Δ, - - -; W = ▴, –) (C). Data represent least square means of 4 replications per treatment (n = 56). Growth stages of common bean are indicated with arrows. Grand mean (♦, seeds per plant and seed protein; ♢, thousand seed weight) ± SEM is included for reference.
Photosynthetic Efficiency of PSII and Electron Transport Rate Correlate With Yield
Principal component analysis was used to investigate correlations between gas exchange and chlorophyll fluorescence parameters with yield. The first and second principal components explained 47 and 28% of the variation in the data (Figure 3). Treatments with minimal weed presence during vegetative growth (WF, WF < R4, W < V1, W < V3, and W < V4) had higher yield, An, ΦPSII, and J. Yield significantly correlated with ΦPSII (ρ = 0.62; p = 0.018) and J (ρ = 0.66; p = 0.033; Table 2), whereas An was significantly correlated with ΦPSII (ρ = 0.92; p < 0.001), J (ρ = 0.96; p < 0.001), and TSW (ρ = 0.68; p = 0.007).
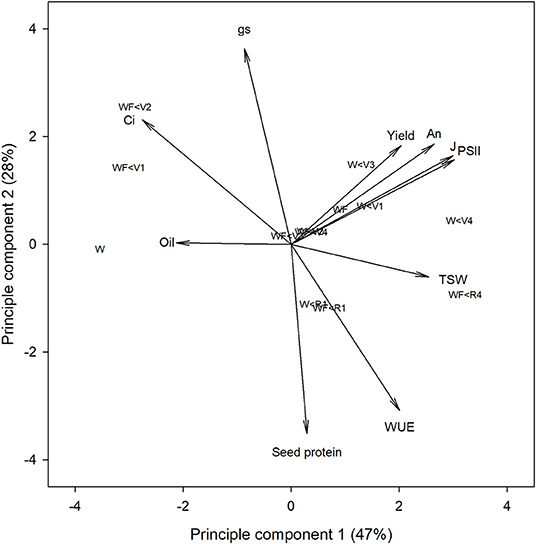
Figure 3. Principal component analysis of gas exchange, chlorophyll fluorescence and yield parameters of common bean in response to increasing durations of weed-free (WF) and weedy (W) conditions.
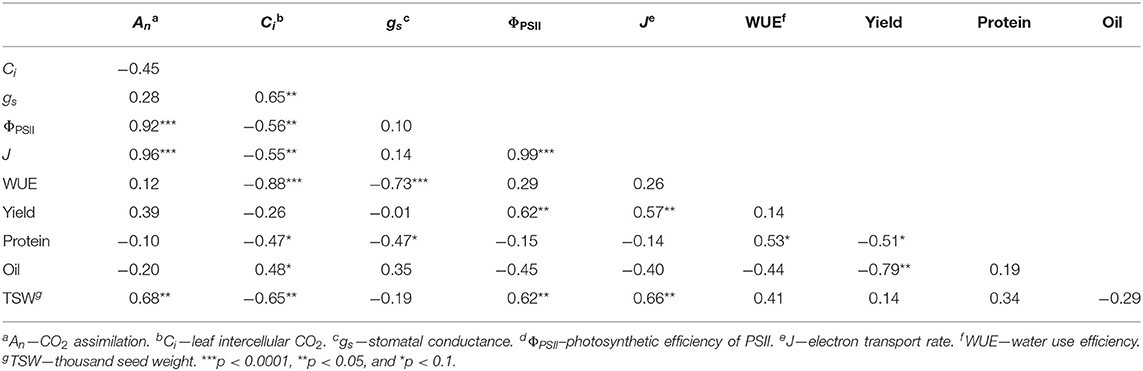
Table 2. Pearson correlation coefficients (ρ) between gas exchange, chlorophyll fluorescence, and yield parameters.
Duration of Weed Competition Influences Rate of CO2 Assimilation (An)
Weed competition, growth stage and their interaction (p < 0.001) had a significant impact on An (Table 3). Overall, weed competition significantly decreased An compared to weed-free conditions and this effect differed based on common bean phenology (Figures 4A,B; p = 0.005). Throughout the vegetative stages, weed competition reduced An by an average of 5.5% compared to weed-free control treatments. This trend continued throughout the reproductive stages with a further reduction in An of 11%. Evidence of recovery of An was observed, when weeds were removed (Figure 5). The degree of An recovery, however, depended on common bean phenology (p < 0.001). Weed presence at vegetative stages (V1, V2, V3, and V4) maintained higher An than weed removal at reproductive stages or the weedy control (p = 0.005; Figure 5). For example, the highest An values were observed, when weeds were removed at V3 (27.0 μmol CO2 m−2 s−1) and V4 (28.7 μmol CO2 m−2 s−1) as common beans were transitioning to reproductive phases (Figure 4B). This is in contrast to the treatments, which experienced weed competition until R4 (7.0 μmol CO2 m−2 s−1) and in the weed-free series, when weed competition was imposed at V2 (8.0 μmol CO2 m−2 s−1). Weed addition following a weed-free period did not impact An regardless of common bean phenology (Table 3). These results suggest that removing weeds up to and including V4 results in An recovery, whereas weed removal at reproductive stages results in an irreversible reduction in An. In addition, any length of weed-free period during the early vegetative stages of common bean prevents the impact of weeds on An.
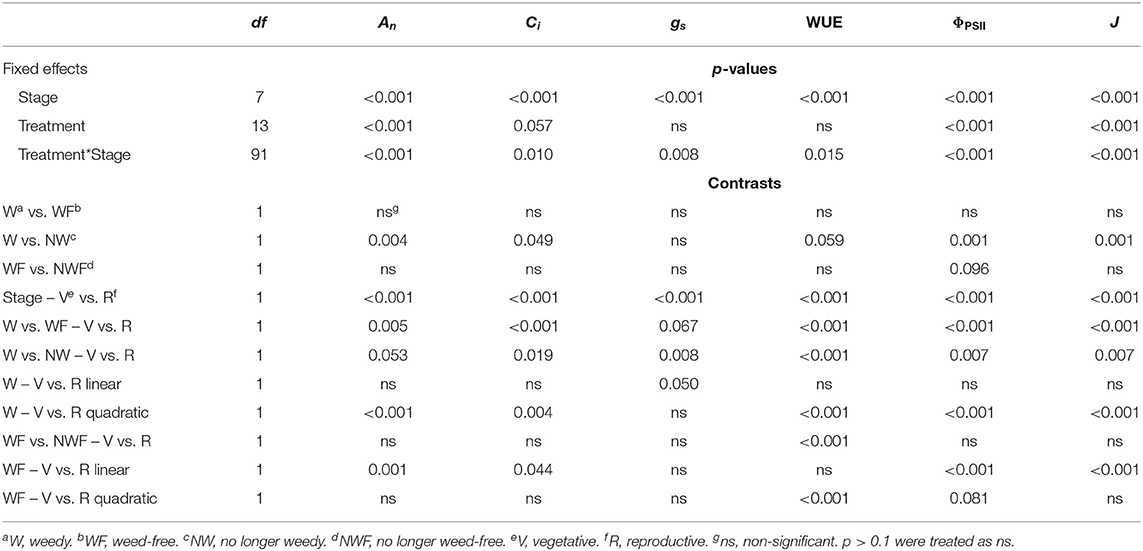
Table 3. Analysis of variance for gas exchange and chlorophyll fluorescence parameters for common bean exposed to increasing durations of weed-free and weedy conditions.
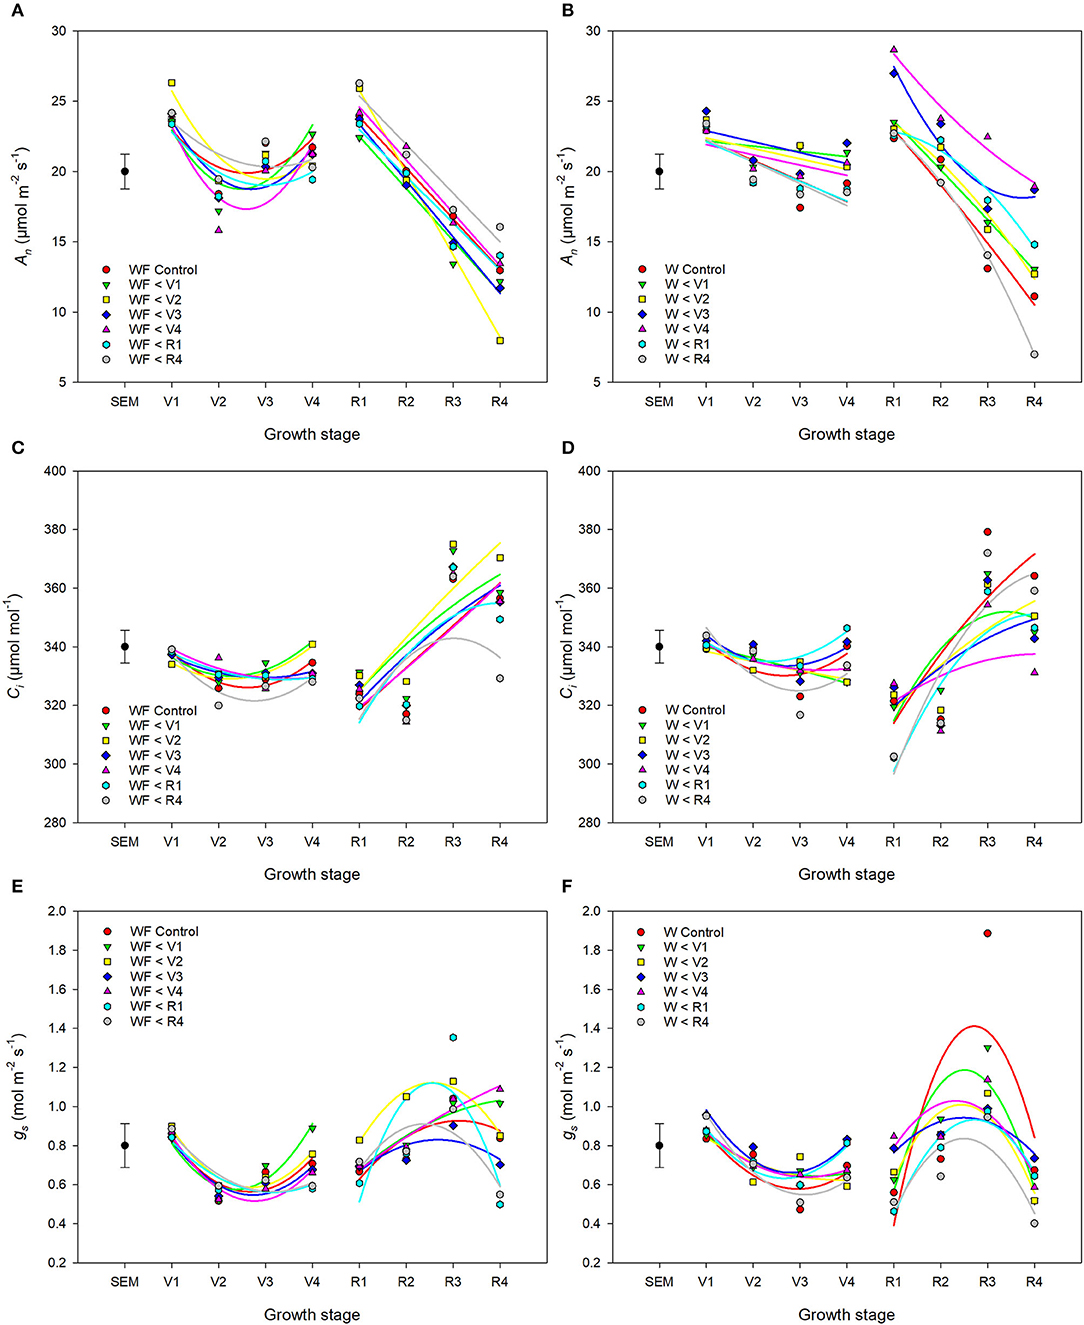
Figure 4. Changes in gas exchange parameters An (A,B), Ci (C,D), and gs (E,F) of common bean throughout the growing season in response to increasing duration of weed-free (A,C,E) (WF) and weedy (B,D,F) (W) conditions. Regression lines for each treatment were partitioned between vegetative and reproductive stages. Data represent least square means of 4 replications per treatment across 8 growth stages (n = 896). Grand mean ± SEM is included for reference.
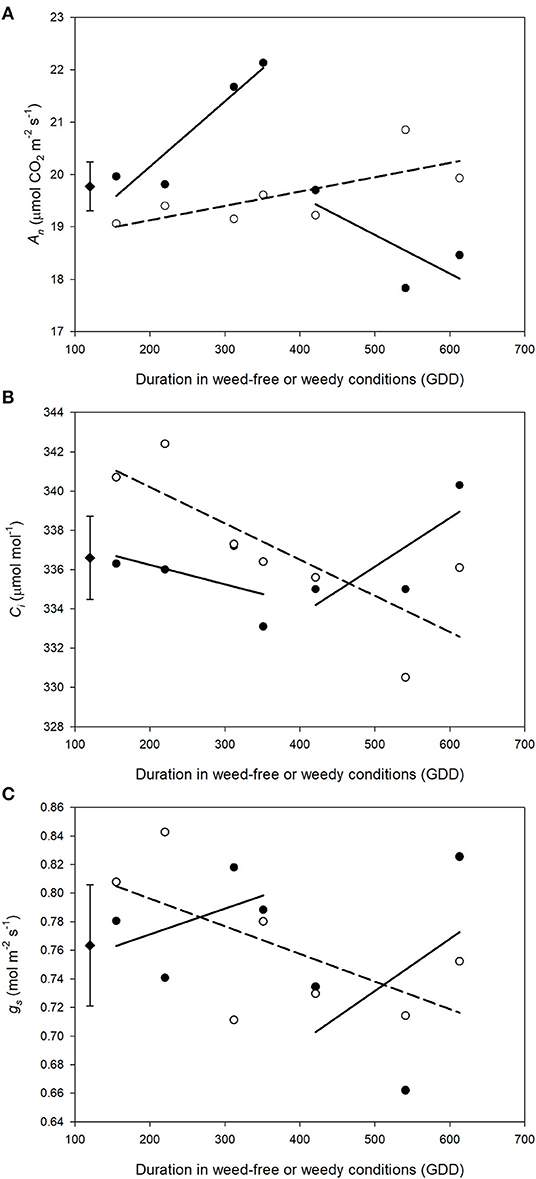
Figure 5. Impact of increasing duration of weed-free (∘) and weedy (•) conditions on gas exchange parameters An (A), gs (B), Ci (C). Regression lines for the weedy series was partitioned between vegetative and reproductive stages. Data represent least square means of 4 replications per treatment throughout the growing season (n = 896). Grand mean (♦) ± SEM is included for reference.
Duration of Weed Competition Influences Leaf Intercellular [CO2] (Ci) and Stomatal Conductance (gs)
The interaction of weed competition and growth stage had a significant impact on Ci and gs (p = 0.010, p = 0.008; Table 3). Similar to An, the effects of weed removal on Ci (p = 0.019) and gs (p = 0.008) were dependent on common bean phenology. Weed removal between V1 and V4 resulted in constant Ci (311.0 and 365.0 μmol CO2 mol−1) throughout the growing season (Figures 4C,D). Weed competition during reproductive stages and all season increased Ci up to 379.0 and 364.0 μmol mol−1 for the weedy control and 372.0 and 359.0 μmol mol−1 for the W>R4 at R3 and R4 growth stages, respectively (Figures 4C,D). Weed competition initially reduced gs compared to weed removal and then rapidly increased toward the end of the season (Figures 4E,F). Weed removal at vegetative stages (V1–V4) resulted in maintenance of gs, whereas weed removal at reproductive stages did not result in recovery of gs and consistently had the lowest gs of all treatments. Increasing duration of weed competition during vegetative stages decreased gs and increased Ci, whereas gs and Ci increased, when weed competition extended to reproductive stages (Figure 5). Similar to An, as long as a period of weed-free conditions occurred at the start of the growing season Ci and gs were not significantly impacted by the addition of weeds later in the season (Figures 4C–F and Table 3). In general, however, Ci and gs declined with increasing duration of weed-free conditions (Figure 5).
Duration of Weed Competition Impacts Water Use Efficiency (WUE)
Throughout common bean vegetative growth, WUE remained relatively constant and declined during reproductive stages (Figures 6A–C). Weed competition, growth stage and their interaction (p = 0.015) significantly impacted WUE (Table 3). The impact of weed removal (p < 0.001) and weed addition (p < 0.001) on WUE depended on common bean phenology. During the vegetative stages, weed removal at V1 and V2 resulted in an increase of WUE compared to all other weedy treatments from 22.1 and 22.1 μmol mol−1 to 29.6 and 31.4 μmol mol−1, respectively (Figure 6B). Weed removal during reproductive growth, however, resulted in an initial increase at R1 to 35.2 and 34.6 μmol mol−1 for W>R1 and W>R4 followed by a rapid decline and recovery in W>R1 at R4. No recovery, however, was observed for W>R4 as it continued to decline along with the weedy control to 13.5 and 9.8 μmol mol−1 at R4, respectively. A similar response was observed following weed addition as longer durations of weed-free periods resulted in higher WUE (Figures 6A,C). Increased duration of weed competition increased WUE, when competition occurred through the vegetative stages, whereas WUE decreased during reproductive stages (Figure 6C). Overall, these results suggest that weed presence decreases WUE and longer durations of weed presence further decreases WUE. In addition, recovery of WUE is possible following the removal of weeds at any point prior to R4.
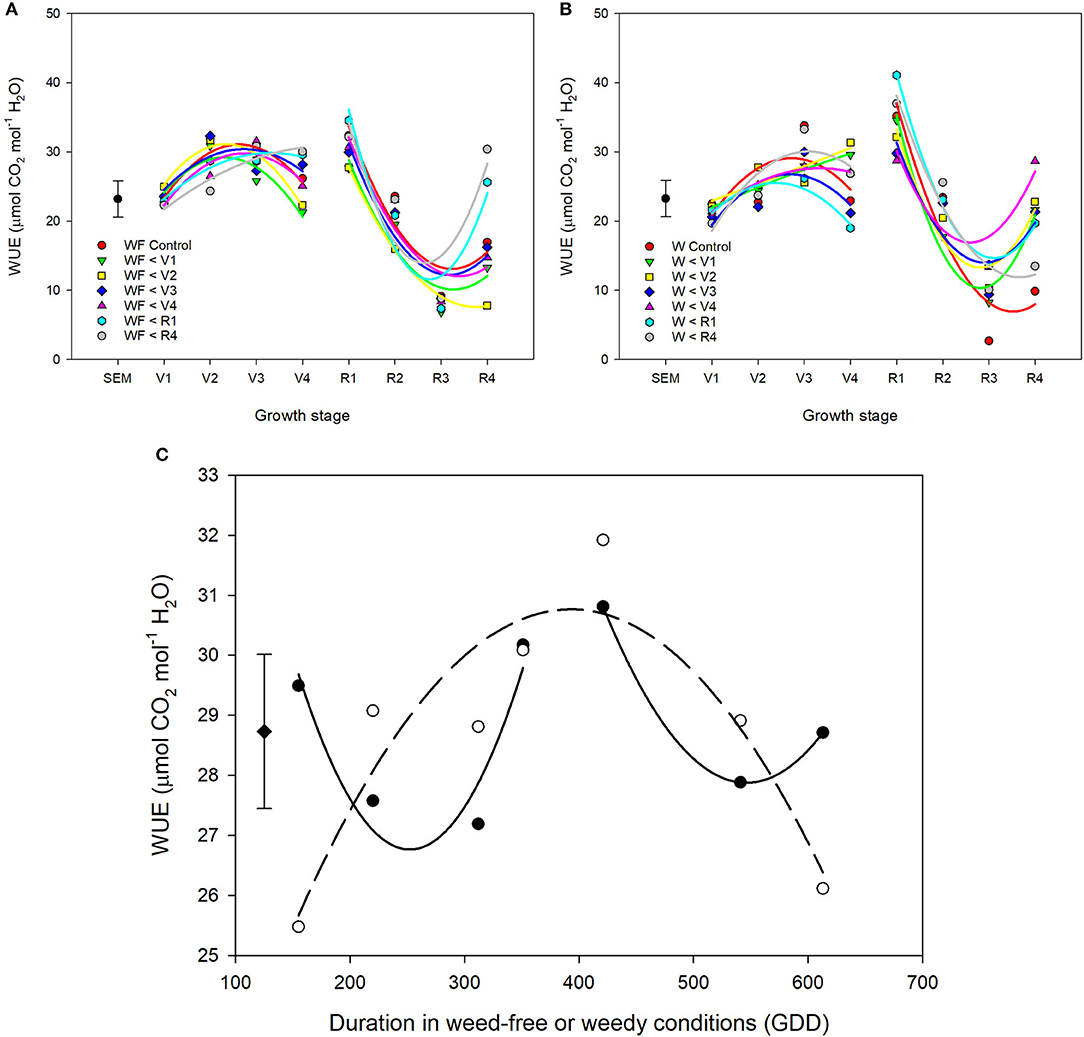
Figure 6. Water use efficiency (WUE) of common bean throughout the growing season in response to increasing durations of weed-free (WF) (A) and weedy (W) (B) conditions. Regression lines for each treatment were partitioned between vegetative and reproductive stages. Data represent least square means of 4 replications per treatment across 8 growth stages (n = 896). Grand mean ± SEM is included for reference. The response of WUE to duration of weed-free (∘) and weedy (•) conditions (C). Grand mean (♦) ± SEM is included for reference. Data represent least square means of 4 replications per treatment throughout the growing season (n = 896).
Duration of Weed Competition Impacts Photosynthetic Efficiency (ΦPSII) and Electron Transport Rate (J)
ΦPSII and J remained relatively constant throughout common bean vegetative stages and rapidly declined during reproductive stages (Figures 7, 8). Overall, ΦPSII and J responses did not differ between the weedy and weed-free series (Table 3). In the weedy series, weed removal significantly impacted ΦPSII (p = 0.001) and J (p = 0.001). In contrast in the weed-free series, weed addition slightly impacted ΦPSII (p =0.096) and had no effect on J. Similar to gas exchange parameters, the effect of weeds on ΦPSII and J depended on common bean phenology (Table 3). Weed competition resulted in a decline of ΦPSII during vegetative stages compared to weed removal treatments. This response, however, differed from reproductive stages (p = 0.007) as weed removal at V4 or R1 maintained higher ΦPSII compared to weed removal at R4 or weedy all season (Figure 3). For example, weed removal at V4 resulted in maintenance of high ΦPSII (0.42–0.27) during reproductive stages compared to all other weed removal treatments. Weed competition all season and weed removal at R4 reduced ΦPSII to the lowest levels for weedy (0.13 and 0.17) all season and 0.17 and 0.13 for weed removal at R4 at the R3 and R4 stages, respectively. The response of J to weed removal and weed duration was similar to ΦPSII with the lowest values (70.24 and 86.08) in the weedy series for weedy all season and 86.31 and 64.24 for weed removal at R4 at the R3 and R4 stages, respectively (Figure 3). A longer duration of weed-free condition resulted in increased ΦPSII compared to weed addition treatments (Figures 3, 8). Compared to the weedy series, there was no difference in this response across common bean phenology in the weed-free series (Table 3). Similarly, the addition of weeds following a weed-free period had no effect on J regardless of phenology.
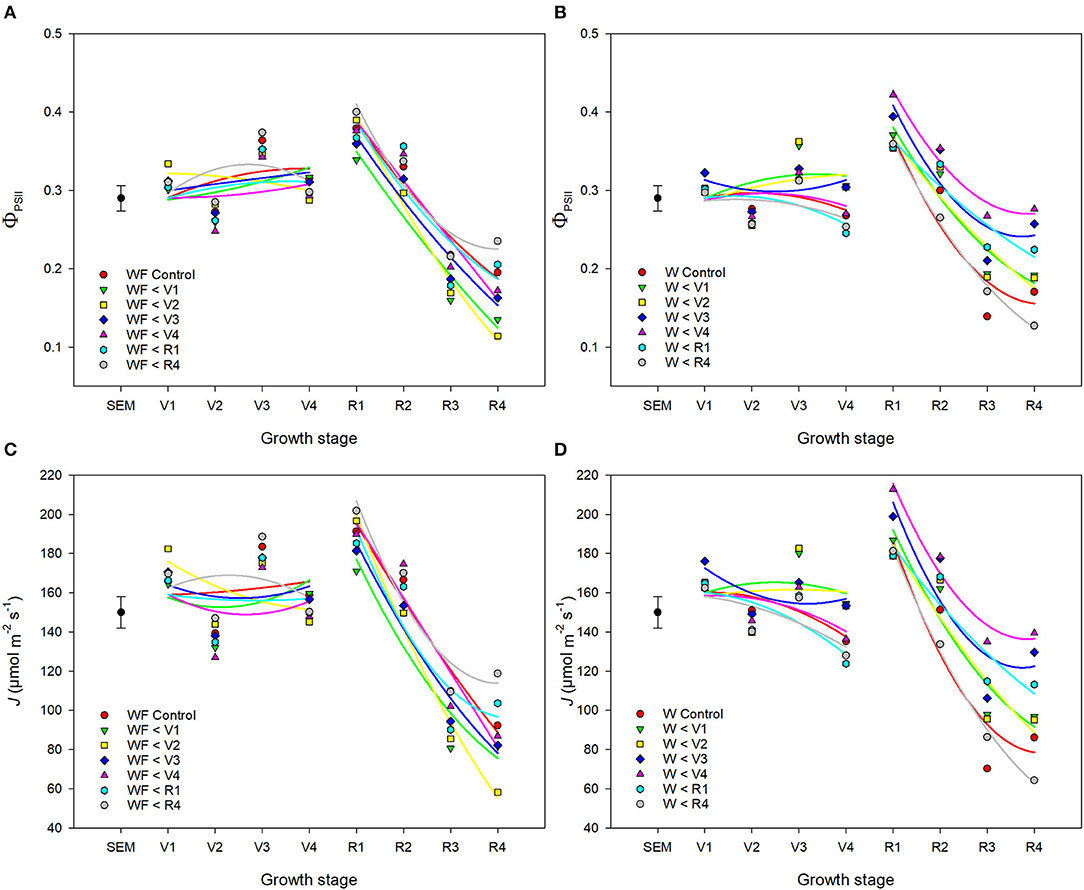
Figure 7. Impact of increasing duration of weed-free (WF) (A,C) and weedy (W) (B,D) conditions on chlorophyll fluorescence parameters ΦPSII (A,B) and J (C,D) of common bean throughout the growing season. Regression lines for each treatment were partitioned between vegetative and reproductive stages. Data represent least square means of 4 replications per treatment across 8 growth stages (n = 896). Grand mean ± SEM is included for reference.
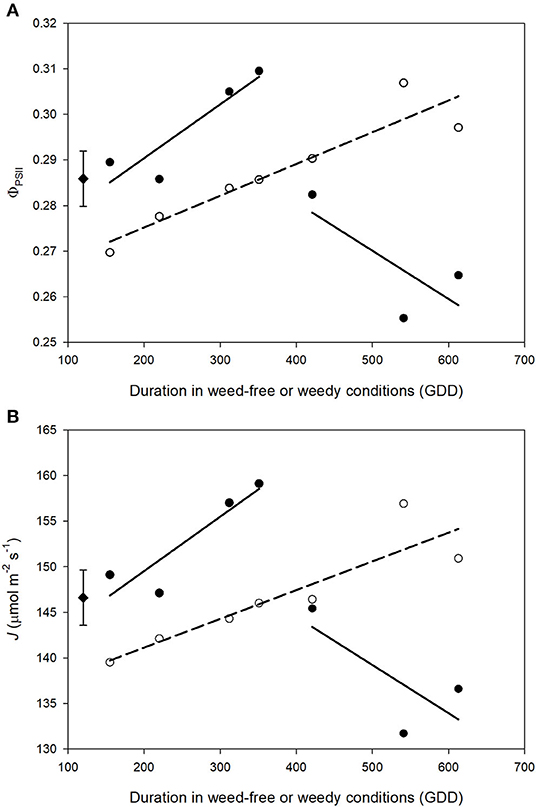
Figure 8. Impact of increasing duration of weed-free (∘) and weedy (•) conditions on photosynthetic efficiency of PSII (ΦPSII) (A) and electron transport rate (J) (B). Regression lines for the weedy series was partitioned between vegetative and reproductive stages. Data represent least square means of 4 replications per treatment throughout the growing season (n = 896). Grand mean (♦) ± SEM is included for reference.
Duration of Weed Competition Impacts Rate of Apparent Rubisco Activity (Vc, max)
Vc, max and Jmax increased during vegetative growth and declined rapidly following the transition to reproductive stages (Figures 9A,B). Overall, no treatment differences were found between weed-free and weedy treatments in Vc, max (p = 0.960) or Jmax (p = 0.900). A significant interaction, however, was found between treatment and time for both parameters (p < 0.001 and p = 0.001 for Vc, max and Jmax, respectively). During vegetative growth, Vc, max increased in the weed-free (from 76.5 to 155.4, μmol m−2 s−1) and weedy series (from 105.2 to 134.1 μmol m−2 s−1). The rate of increase during vegetative growth was 0.51 and 0.25 GDD−1 for weed-free and weedy treatments, respectively. This was followed by a rapid decline to 93.3 and 81.2 at a rate of −1.10 and −1.23 GDD−1 for the weed-free and weedy treatments, respectively. Jmax followed a similar trend to Vc, max throughout the season (Figure 9B). In the weedy treatment, Jmax increased steadily during vegetative growth (0.09 GDD−1) and rapidly declined upon transitioning to reproductive stages (−0.57 GDD−1). In contrast, in the weed-free treatment, Jmax increased rapidly during vegetative growth (0.44 GDD−1) but declined at a similar rate to the weedy treatment (−0.44 GDD−1) upon transition to reproductive growth. Together, these data suggest that the rate of increase in activity of Rubisco and maximum rate of electron transport is greater under weed-free than weedy conditions.
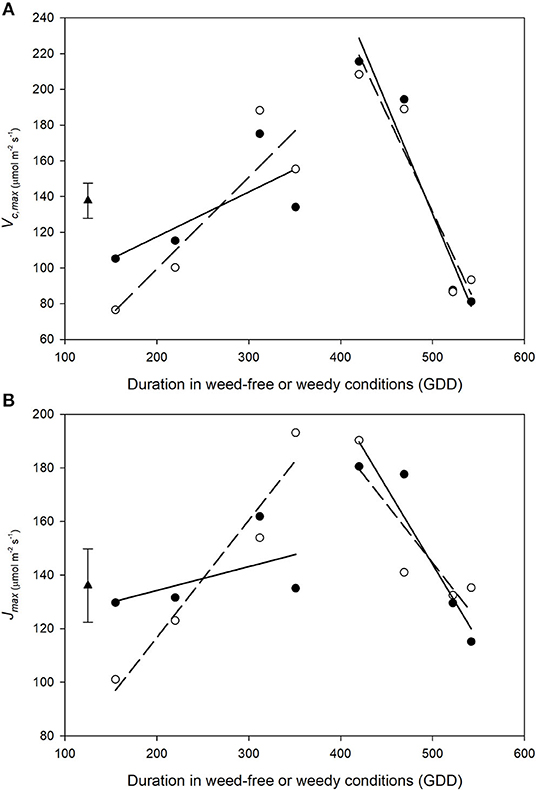
Figure 9. Impact of weed-free (∘, - - -) and weedy (•, –) conditions on common bean Vc, max (A) and Jmax (B) throughout the growing season. Data represent least square means of 4 replications per treatment throughout the growing season (n = 64). Grand mean ± SEM is included for reference. Regression lines were partitioned between vegetative and reproductive growth stages and are as follows: WF vegetative Vc, max= 0.51χ + −3.37; WF reproductive Vc, max= −1.10χ + 679.14; W vegetative Vc, max= 0.25χ + 67.36; W reproductive Vc, max= −1.23χ + 745.23; WF vegetative Jmax = 0.44χ + 29.17; WF reproductive Jmax = −0.44χ + 363.42; W vegetative Jmax = 0.09χ + 116.46; W reproductive Jmax = −0.57χ + 429.93, where χ represents duration of weed-free or weedy conditions. Grand mean (♦) ± SEM is included for reference.
Discussion
CPWC Is Indispensable for Maintenance of Yield Potential
The weed addition and weed removal series (Table 1) afforded us an opportunity to examine whether CPWC correlates with common bean yield. We found that a CPWC from 185 to 280 GDD prevented >5% yield loss (Figure 2A). This CPWC corresponded to a period from 21 to 29 days between V1 and V3 growth stage. This is in agreement with previously reported CPWC studies in North American common bean production, which found the CPWC from V2 to R1 (Woolley et al., 1993) or until 6 weeks after planting (Burnside et al., 1998). In the weedy treatments, yield loss was more likely due to a decrease in seeds per plant (Figure 2B). In addition, declines in TSW and seed protein content by increasing seeds per plant (Figure 2C) were suggestive of a trade-off between seed number and seed quality. Weed presence during the CPWC has been shown to cause a similar decrease in soybean seeds per plant but it did not compromise seed quality (Green-Tracewicz et al., 2012). The common bean cultivar used in this study has an indeterminate growth habit and a similar trade-off between seed yield and protein content has been observed in indeterminate soybean varieties (Wilcox and Guodong, 1997). The negative correlation of yield with oil and seed protein content supports a relationship between seed quantity and quality (Figure 3 and Table 2) such that, in response to neighboring weeds, seed yield is maintained at the expense of seed quality.
Resource limitation during weed-crop interaction is a major yield reducing factor. Our results strongly suggest that yield loss due to prolonged weed presence at the vegetative stages of common bean was not a consequence of resource limitation and rather a consequence of neighboring weed signals as previously hypothesized (Rajcan et al., 2004). Three pieces of evidence support this conclusion. First, the internode elongation response of common bean to neighboring weeds was related to the duration of weed presence (Figure 1D). Internode elongation can be induced by canopy light signals such as low R/Fr (Casal, 2013) and plant volatiles (Pierik and de Wit, 2014) prior to direct competition for light. Indeed, no differences in incoming light quantity, quality, and interception were found between treatments throughout our experiments suggesting internode elongation may be related to signals derived from neighboring weeds rather than light competition. Second, minimal precipitation from 12 to 46 DAP (V1 to R1) and ≈150 mm of rain throughout the growing season prevented water deficit during vegetative and reproductive stages, which are known in bean as the least and most sensitive stages to drought stress, respectively (Manjeru et al., 1995; Pimentel et al., 1999). In addition, plant response to drought typically involves an increase in WUE and a decrease in gs, whereas in our experiments WUE was lower and gs was higher in plots with the longer durations of weed competition (Figure 6). Third, analysis of soil and plant tissue nutrients at the end of season revealed no differences between environments or treatments (Supplementary Table 2). As a legume, common bean acquires nitrogen mainly through symbiotic relationship with Rhizobium bacteria and nitrogen addition in earlier studies had limited impact on common bean yield resulting in yields comparable to Rhizobium-inoculated beans (Robinson, 1983). In addition, no obvious symptomology of nutrient stress was observed within our experimental plots throughout the season. Currently, we cannot rule out the possibility of plant volatiles or allelopathic compounds influencing the CPWC. These lines of evidence, however, suggest that signals emanating from neighboring weeds such as low R/Fr light may play important roles in the CPWC in common bean.
Our results show that two photosynthetic efficiency parameters ΦPSII and J correlate with yield (Table 2). Considering that yield potential is a product of solar radiation, crop solar interception, photosynthetic-biomass conversion efficiency, and harvest index (Long et al., 2015), these results suggest that ΦPSII and J may be critical yield determining parameters (Figure 3). Interestingly, An, despite its correlations with ΦPSII and J, did not correlate with overall yield (Table 2). This is consistent with numerous reports (reviewed by Evans, 1998) and may be attributed to variability in canopy architecture, which may affect light interception in addition to photosynthetic efficiency (Long et al., 2006). Although light interception did not differ between weed-free and weedy bean canopies (Figure 1), the possibility of alterations in canopy level photosynthesis by changes in plant architecture cannot be ruled out.
Weed Presence Impairs CO2 Assimilation (An)
The notion that neighboring weed signals impact An and photosynthetic efficiency of crop plants is supported by decreases in common bean An, ΦPSII and J in our weed addition series (Figures 4–8 and Table 3). This is consistent with the impact of weeds on An in soybean and maize (Reynolds et al., 2007; Gong et al., 2015). Similar to our study, decreases in An in previous reports were not due to weed-induced limitations in light capture or interception but rather to physiological limitations imposed by competing individuals. Both stomatal and non-stomatal processes can impose limitations on An. Although Ci and gs (two important parameters for assessing stomatal limitation) were correlated (Table 2), they responded to weed presence in opposing directions throughout the season (Figures 4, 5). Stomatal limitations appear to have minimal impact on photosynthetic rate except under conditions of extreme drought (Tang et al., 2002). Despite minimal precipitation from 12 to 46 DAP (Figure 1A), no differences in gs were observed during this time (Figures 4E,F). These results are consistent with a study of soybean cultivars to intra- and inter-specific competition, where the reduction in An was attributed to non-stomatal limitations (Gong et al., 2015). Therefore, the opposing effects of Ci and gs and declines in An suggest that reduced An in response to neighboring weeds is not a consequence of stomatal limitation.
Interestingly, we found that ΦPSII increased with longer duration of weed presence throughout the vegetative stages of common bean and declined rapidly, when weed competition extended to reproductive phases (Figure 8), while An declined (Figure 5). In the absence of a decrease in PPFD, Fr light has been shown to increase ΦPSII, An, and overall photosynthetic capacity in soybean (Yang et al., 2020). Similarly, the addition of Fr light to shorter wavelengths increased photosynthetic efficiency across diverse taxa (Zhen and Bugbee, 2020). This has been attributed to Fr light aiding to balance excitation energy between the photosystems. The opposing effect of Fr light on ΦPSII and An may be related to impairment of the Calvin cycle and electron transport components (Krahmer et al., 2018). Vc, max and Jmax significantly differed between weed-free and weedy treatments throughout the growing season and the slope relating duration of weed-free/weedy conditions to these parameters during the vegetative stages of common bean is dramatically higher in the weed-free series than weedy (Figure 9). As such, the apparent activity of Rubisco increases at a faster rate through the growing season in common bean experiencing weed-free conditions compared to weedy conditions suggesting a possible biochemical limitation. Therefore, while excitation energy may be more efficiently distributed by weed presence, biochemical limitations through a reduction in the rate of Rubisco carboxylation persists.
The Legacy Effect of Competition
To the best of our knowledge, no study has investigated photosynthetic recovery of common bean following a series of weed removal treatments throughout the growing season. We found that the presence of neighboring weeds throughout vegetative growth of common bean (W, W < R1, W < R4, WF < V1, and WF < V2) led to declines in An and photosynthetic efficiency that persisted through reproductive stages. This occurred despite weeds no longer being present (Table 1). As weed presence extended to reproductive stages and past the CPWC, photosynthesis recovery was no longer possible. Weed removal prior to reproductive growth resulted in recovery of An (Figure 5). This may have been a result of increased gs compensating for reduced Ci and further suggests that early responses to neighboring weeds may produce a legacy effect on common bean development. It has been hypothesized that weed presence during the CPWC may alter epigenetic markers in crop plants (Horvath et al., 2006). This hypothesis is supported by changes in expression of chromosome condensation family proteins in maize in response to weed presence (Horvath et al., 2018). An intriguing hypothesis is that weed presence perceived as low R/Fr light during the CPWC induces the SAR, which leads to epigenetic changes that influence expression of photosynthesis-related genes even when weeds are removed. Such a response has been observed in maize (Horvath et al., 2018). The consistent reduction of An following weed removal beyond the CPWC lends support to this hypothesis. An alternative explanation is that low R/Fr reduces photosynthetic efficiency through imbalanced excitation of two photosystems and generation of reactive oxygen species (Chow et al., 1990). Reactive oxygen species are known to impair CO2 assimilation (Foyer and Shigeoka, 2011) and exposure to low R/Fr light during early growth stages of soybean (McKenzie-Gopsill et al., 2019) and Arabidopsis (Page et al., 2017) increases singlet oxygen (1O2) generation and reduces An. The concurrent declines in An, ΦPSII and J as well as the restriction on Vc, max could be evidence of oxidative stress due to an imbalance in energy distribution between the photosystems from reflected Fr light. Several studies have demonstrated Fr light-mediated improvements to photosynthetic capacity, when Fr light is supplied during vegetative growth (Park and Runkle, 2017; Zhen and van Iersel, 2017; Yang et al., 2020). If, however, neighboring weeds reflecting Fr light increase ROS production in common bean during vegetative growth, the conclusion of the CPWC and transition to reproductive growth may be a tipping point following which ROS start to directly impact photosynthetic activity. The continued increase in An and ΦPSII and rapid increase in Vc, max with increasing duration of weed-free periods contrasted the declines observed with increasing duration of weedy periods. The latter may indicate long-term photoinhibition and an inability to photoacclimate. A failure to photoacclimate following a transition from shade to full light has been previously observed in sugar maple (Acer saccharum Marsh.) and similarly attributed to long-term photoinhibition (Naidu and DeLucia, 1997).
Conclusion
Our results indicate that the presence of neighboring weeds throughout the vegetative stages of common bean induces the SAR and impacts subsequent performance causing irrecoverable reductions in CO2 assimilation, photosynthetic efficiency, and yield. The limitations on photosynthesis are attributed to biochemical limitation on the Calvin cycle. These reductions are preventable if common bean is maintained weed-free during vegetative growth stages throughout the CPWC. More importantly, reductions in photosynthetic efficiency and gas exchange during vegetative growth stages correlated with yield. This correlation not only highlights the prominent role of CPWC in maintaining yield potential but also indicates a legacy effect of neighboring weeds on common bean performance. This legacy effect may be an integral mechanism of yield loss in crop plants due to early-season weed competition. Future efforts to reduce the impact of weeds on crop yield should focus on improvements to photosynthetic efficiency and Calvin cycle capacity.
Data Availability Statement
The raw data supporting the conclusions of this article will be made available by the authors, without undue reservation.
Author Contributions
AM-G conceptualized and conducted the experiment. AM-G and SF conducted data analysis. AM-G and SA wrote and revised the manuscript. CS provided editorial support. All authors contributed to the article and approved the submitted version.
Conflict of Interest
The authors declare that the research was conducted in the absence of any commercial or financial relationships that could be construed as a potential conflict of interest.
Acknowledgments
The authors wish to thank the financial support of Agriculture and Agri-Food Canada start-up funds to AM-G and the Canada First Research Excellence Fund to CS. In addition, the authors wish to thank the technical support of Ashley Nicolle MacDonald, the Charlottetown weeds crew and Harrington farm staff.
Supplementary Material
The Supplementary Material for this article can be found online at: https://www.frontiersin.org/articles/10.3389/fagro.2020.593570/full#supplementary-material
Supplementary Figure 1. Response of common bean An to increasing Ci using the traditional A/Ci method (∘) and the rapid A/Ci response (RACir) method (•). Presented data are from representative sample.
Supplementary Table 1. Comparison of parameter estimates for the traditional A/Ci and rapid A/Ci response curves (RACir) of common bean.
References
Ballaré, C. L. (1999). Keeping up with the neighbours: phytochrome sensing and other signalling mechanisms. Trends Plant Sci. 4, 97–102. doi: 10.1016/S1360-1385(99)01383-7
Barreiro, R., Guiamet, J. J., Beltrano, J., and Montaldi, E. R. (1992). Regulation of the photosynthetic capacity of primary bean leaves by the red: far-red ratio and photosynthetic photon flux density of incident light. Physiol. Plantarum 85, 97–101. doi: 10.1111/j.1399-3054.1992.tb05269.x
Boccalandro, H. E., Rugnone, M. L., Moreno, J. E., Ploschuk, E. L., Serna, L., Yanovsky, M. J., et al. (2009). Phytochrome B enhances photosynthesis at the expense of water-use efficiency in Arabidopsis. Plant Physiol. 150, 1083–1092. doi: 10.1104/pp.109.135509
Burnside, O. C., Wiens, M. J., Holder, B. J., Weisbere, S., Ristau, E. A., Johnson, M. M., et al. (1998). Critical periods for weed control in dry beans (Phaseolus vulgaris). Weed Sci. 46, 301–306. doi: 10.1017/S0043174500089451
Buti, S., Hayes, S., and Pierik, R. (2020). The bHLH network underlying plant shade-avoidance. Physiol. Plantarum 169, 312–324. doi: 10.1111/ppl.13074
Casal, J. J. (2013). Canopy light signals and crop yield in sickness and in health. ISRN Agron. 2013:650439. doi: 10.1155/2013/650439
Chow, W. S., Melis, A., and Anderson, J. M. (1990). Adjustments of photosystem stoichiometry in chloroplasts improve the quantum efficiency of photosynthesis. Proc. Natl. Acad. Sci. U.S.A. 87, 7502–7506. doi: 10.1073/pnas.87.19.7502
Dubois, J. J. B., Fiscus, E. L., Booker, F. L., Flowers, M. D., and Reid, C. D. (2007). Optimizing the statistical estimation of the parameters of the Farquhar-von Caemmerer-Berry model of photosynthesis. New Phytol. 176, 402–414. doi: 10.1111/j.1469-8137.2007.02182.x
Eskins, K., and Duysen, M. (1984). Chloroplast structure in normal and pigment-deficient soybeans grown in continuous red or far-red light. Physiol. Plantarum 61, 351–356. doi: 10.1111/j.1399-3054.1984.tb06339.x
Evans, L. T. (1998). “Greater crop production: whence and whither?” in Feeding a World Population of More than Eight Billion People – A challenge to Science, eds J. C. Waterlow, D. G. Armstrong, L. Fowdenand, and R. Riley (Toronto, ON: Oxford University Press), 88–97. doi: 10.1093/oso/9780195113129.003.0013
Fickett, N. D., Boerboom, C. M., and Stoltenberg, D. E. (2013a). Predicted corn yield loss due to weed competition prior to postemergence herbicide application on Wisconsin farms. Weed Technol. 27, 54–62. doi: 10.1614/WT-D-12-00097.1
Fickett, N. D., Boerboom, C. M., and Stoltenberg, D. E. (2013b). Soybean yield loss potential associated with early-season weed competition across 64 site-years. Weed Sci. 61, 500–507. doi: 10.1614/WS-D-12-00164.1
Fox, A. R., Barberini, M. L., Ploschuk, E. L., Muschietti, J. P., and Mazzella, M. A. (2015). A proteome map of a quadruple photoreceptor mutant sustains its severe photosynthetic deficient phenotype. J. Plant Physiol. 185, 13–23. doi: 10.1016/j.jplph.2015.07.004
Foyer, C. H., and Shigeoka, S. (2011). Understanding oxidative stress and antioxidant functions to enhance photosynthesis. Plant Physiol. 155, 93–100. doi: 10.1104/pp.110.166181
Franklin, K. A., and Whitelam, G. C. (2005). Phytochromes and shade-avoidance responses in plants. Ann. Bot. 96, 169–175. doi: 10.1093/aob/mci165
Fraser, D. P., Hayes, S., and Franklin, K. A. (2016). Photoreceptor crosstalk in shade avoidance. Curr. Opin. Plant Biol. 33, 1–7. doi: 10.1016/j.pbi.2016.03.008
Gong, W. Z., Jiang, C. D., Wu, Y. S., Chen, H. H., Liu, W. Y., and Yang, W. Y. (2015). Tolerance vs. avoidance: two strategies of soybean (Glycine max) seedlings in response to shade in intercropping. Photosynthetica 53, 259–268. doi: 10.1007/s11099-015-0103-8
Graham, D., Grieve, A. M., and Smillie, R. M. (1968). Phytochrome as the primary photoregulator of the synthesis of Calvin cycle enzymes in etiolated pea seedlings. Nature 218, 89–90. doi: 10.1038/218089a0
Green-Tracewicz, E., Page, E. R., and Swanton, C. J. (2012). Light quality and the critical period for weed control in soybean. Weed Sci. 60, 86–91. doi: 10.1614/WS-D-11-00072.1
Horvath, D. P., Bruggeman, S., Moriles-Miller, J., Anderson, J. V., Dogramaci, M., Scheffler, B. E., et al. (2018). Weed presence altered biotic stress and light signaling in maize even when weeds were removed early in the critical weed-free period. Plant Direct. 4:e00057. doi: 10.1002/pld3.57
Horvath, D. P., Gulden, R., and Clay, S. A. (2006). Microarray analysis of late-season velvetleaf (Abutilon theophrasti) effect on corn. Weed Sci. 54, 983–994. doi: 10.1614/WS-06-103R.1
Hu, W., Franklin, K. A., Sharrock, R. A., Jones, M. A., Harmer, S. L., and Lagarias, J. C. (2013). Unanticipated regulatory roles for Arabidopsis phytochromes revealed by null mutant analysis. Proc. Natl. Acad. Sci. U.S.A. 110, 1542–1547. doi: 10.1073/pnas.1221738110
Iqbal, J., and Wright, D. (1999). Effects of weed competition on flag leaf photosynthesis and grain yield of spring wheat. J. Agr. Sci. 132, 23–30. doi: 10.1017/S0021859698006066
Kalaitzoglou, P., van Ieperen, W., Harbinson, J., van der Meer, M., Martinakos, S., Weerheim, K., et al. (2019). Effects of continuous or end-of-day far-red light on tomato plant growth, morphology, light absorption, and fruit production. Front. Plant Sci. 10:322. doi: 10.3389/fpls.2019.00322
Kasperbauer, M. J. (1987). Far-red light reflection from green leaves and effects on phytochrome-mediated assimilate partitioning under field conditions. Plant Physiol. 85, 350–354. doi: 10.1104/pp.85.2.350
Kasperbauer, M. J., and Peaslee, D. E. (1973). Morphology and photosynthetic efficiency of tobacco leaves that received end-of-day red and far red light during development. Plant Physiol. 52, 440–442. doi: 10.1104/pp.52.5.440
Kharshiing, E., and Sinha, S. P. (2016). Deficiency in phytochrome A alters photosynthetic activity, leaf starch metabolism and shoot biomass production in tomato. J. Photochem. Photobio. B. 165, 157–162. doi: 10.1016/j.jphotobiol.2016.10.026
Klem, K., Gargallo-Garriga, A., Rattanapichai, W., Oravec, M., Holub, P., Veselá, B., et al. (2019). Distinct morphological, physiological, and biochemical responses to light quality in barley leaves and roots. Front. Plant Sci. 10:1026. doi: 10.3389/fpls.2019.01026
Krahmer, J., Ganpudi, A., Abbas, A., Romanowski, A., and Halliday, K. J. (2018). Phytochrome, carbon sensing, metabolism, and plant growth plasticity. Plant Physiol. 176, 1039–1048. doi: 10.1104/pp.17.01437
Liu, J., Zhang, F., Zhou, J., Chen, F., Wang, B., and Xie, X. (2012). Phytochrome B control of total leaf area and stomatal density affects drought tolerance in rice. Plant Mol. Biol. 78, 289–300. doi: 10.1007/s11103-011-9860-3
Long, S. P., Marshall-Colon, A., and Zhu, X. G. (2015). Meeting the global food demand of the future by engineering crop photosynthesis and yield potential. Cell 161, 56–66. doi: 10.1016/j.cell.2015.03.019
Long, S. P., Zhu, X. G., Naidu, S. L., and Ort, D. R. (2006). Can improvement in photosynthesis increase crop yields?. Plant Cell Environ. 29, 315–330. doi: 10.1111/j.1365-3040.2005.01493.x
Manjeru, P., Madonzi, T., Makeredza, B., Nciizah, A., and Sithole, M. (1995). Effects of water stress at different growth stages on yield and yield components of common bean (Phaseolus vulgaris). Afr. Crop Sci. Conf. Proc. 8, 299–303.
Markham, M. Y., and Stoltenberg, D. E. (2010). Corn morphology, mass, and grain yield as affected by early-season red: far-red light environments. Crop Sci. 50, 273–280. doi: 10.2135/cropsci2008.10.0614
McKenzie-Gopsill, A. G., Amirsadeghi, S., Earl, H. J., Jones, A. M. P., Lukens, L., Lee, E., et al. (2019). Early physiological and biochemical responses of soyabean to neighbouring weeds under resource-independent competition. Weed Res. 59, 288–299. doi: 10.1111/wre.12365
Naidu, S. L., and DeLucia, E. H. (1997). Acclimation of shade-developed leaves on saplings exposed to late-season canopy gaps. Tree Physiol. 17, 367–376. doi: 10.1093/treephys/17.6.367
Ögren, E., and Evans, J.R. (1993). Photosynthetic light-response curves. Planta 189, 182–190. doi: 10.1007/BF00195075
Page, E. R., Tollenaar, M., Lee, E. A., Lukens, L., and Swanton, C. J. (2009). Does the shade avoidance response contribute to the critical period for weed control in maize (Zea mays)? Weed Res. 49, 563–571.
Page, E. R., Tollenaar, M., Lee, E. A., Lukens, L., and Swanton, C. J. (2010). Shade avoidance: an integral component of crop-weed competition. Weed Res. 50, 281–288. doi: 10.1111/j.1365-3180.2010.00781.x
Page, M. T., McCormac, A. C., Smith, A. G., and Terry, M. J. (2017). Singlet oxygen initiates a plastid signal controlling photosynthetic gene expression. New Phytol. 213, 1168–1180. doi: 10.1111/nph.14223
Park, Y., and Runkle, E. S. (2017). Far-red radiation promotes growth of seedlings by increasing leaf expansion and whole-plant net assimilation. Environ. Exp. Bot. 136, 41–49. doi: 10.1016/j.envexpbot.2016.12.013
Pierik, R., and de Wit, M. (2014). Shade avoidance: phytochrome signalling and other aboveground neighbour detection cues. J. Exp. Bot. 65, 2815–2824. doi: 10.1093/jxb/ert389
Pimentel, C., Hebert, G., and da Silva, J. V. (1999). Effects of drought on O2 evolution and stomatal conductance of beans at the pollination stage. Environ. Exp. Bot. 42, 155–162. doi: 10.1016/S0098-8472(99)00030-1
Quail, P. H. (1991). Phytochrome: A light-activated molecular switch that regulates plant gene expression. Annu. Rev. Genet. 25, 389–409. doi: 10.1146/annurev.ge.25.120191.002133
Rajcan, I., Chandler, K. J., and Swanton, C. J. (2004). Red-far-red ratio of reflected light: a hypothesis of why early-season weed control is important in corn. Weed Sci. 52, 774–778.
Rajcan, I., and Swanton, C. J. (2001). Understanding maize-weed competition: resource competition, light quality and the whole plant. Field Crop. Res. 71, 139–150. doi: 10.1016/S0378-4290(01)00159-9
Reynolds, P. E., Simpson, J. A., Thevathasan, N. V., and Gordon, A. M. (2007). Effects of tree competition on corn and soybean photosynthesis, growth, and yield in a temperate tree-based agroforestry intercropping system in southern Ontario, Canada. Ecol. Eng. 29, 362–371. doi: 10.1016/j.ecoleng.2006.09.024
Robinson, R. G. (1983). Yield and composition of field bean and adzuki bean in response to irrigation, compost, and nitrogen. Agron. J. 75, 31–35. doi: 10.2134/agronj1983.00021962007500010008x
Schopfer, P. (1977). Phytochrome control of enzymes. Ann. Rev. Plant Physiol. 28, 223–252. doi: 10.1146/annurev.pp.28.060177.001255
Smith, H. (1982). Light quality, photoperception, and plant strategy. Ann. Rev. Plant Physiol. 33, 481–518. doi: 10.1146/annurev.pp.33.060182.002405
Stinziano, J. R., Morgan, P. B., Lynch, D. J., Saathoff, A. J., McDermitt, D. K., and Hanson, D. T. (2017). The rapid A-Ci response: photosynthesis in the phenomic era. Plant Cell Environ. 40, 1256–1262. doi: 10.1111/pce.12911
Swanton, C. J., and Valente, T. (2018). “Key issues and challenges of integrated weed management,” in Integrated Weed Management for Sustainable Agriculture, ed R. Zimdahl (Burleigh Dodds Science Publishing Limited), 69–82. doi: 10.19103/AS.2017.0025.04
Tang, A. C., Kawamitsu, Y., Kanechi, M., and Boyer, J. S. (2002). Photosynthetic oxygen evolution at low water potential in leaf discs lacking an epidermis. Ann. Bot. 89, 861–870. doi: 10.1093/aob/mcf081
Van Acker, R. C., Swanton, C. J., and Weise, S. F. (1993). The critical period of weed control in soybean [Glycine max (L.) Merr.]. Weed Sci. 41, 194–200. doi: 10.1017/S0043174500076050
Warrington, I. J., Rook, D. A., Morgan, D. C., and Turnbull, H. L. (1989). The influence of simulated shadelight and daylight on growth, development and photosynthesis of Pinus radiata, Agathis australis and Dacrydium cupressinum. Plant Cell Environ. 12, 343–356. doi: 10.1111/j.1365-3040.1989.tb01951.x
Wilcox, J. R., and Guodong, Z. (1997). Relationships between seed yield and seed protein in determinate and indeterminate soybean populations. Crop Sci. 37, 361–364. doi: 10.2135/cropsci1997.0011183X003700020009x
Woolley, B. L., Michaels, T. E., Hall, M. R., and Swanton, C. J. (1993). The critical period of weed control in white bean (Phaseolus vulgaris). Weed Sci. 41, 180–184. doi: 10.1017/S0043174500076037
Yang, D., Seaton, D. D., Krahmer, J., and Halliday, K. J. (2016). Photoreceptor effects on plant biomass, resource allocation, and metabolic state. Proc. Natl. Acad. Sci. U.S.A. 113, 7667–7672. doi: 10.1073/pnas.1601309113
Yang, F., Liu, Q., Cheng, Y., Feng, L., Wu, X., Fan, Y., et al. (2020). Low red/far-red ratio as a signal promotes carbon assimilation of soybean seedlings by increasing the photosynthetic capacity. BMC Plant Biol. 20, 148. doi: 10.1186/s12870-020-02352-0
Zhen, S., and Bugbee, B. (2020). Far-red photons have equivalent efficiency to traditional photosynthetic photons: implications for redefining photosynthetically active radiation. Plant Cell Environ. 43, 1259–1272. doi: 10.1111/pce.13730
Keywords: Calvin cycle, common bean (Phaseolus vulgaris L.), critical period for weed control, far-red light, photosynthesis, photosynthetic efficiency, shade avoidance response
Citation: McKenzie-Gopsill AG, Amirsadeghi S, Fillmore S and Swanton CJ (2020) Duration of Weed Presence Influences the Recovery of Photosynthetic Efficiency and Yield in Common Bean (Phaseolus vulgaris L.). Front. Agron. 2:593570. doi: 10.3389/fagro.2020.593570
Received: 11 August 2020; Accepted: 12 November 2020;
Published: 02 December 2020.
Edited by:
Avishek Datta, Asian Institute of Technology, ThailandReviewed by:
Simerjeet Kaur, Punjab Agricultural University, IndiaHayat Ullah, Asian Institute of Technology, Thailand
Copyright © 2020 McKenzie-Gopsill, Amirsadeghi, Fillmore and Swanton. This is an open-access article distributed under the terms of the Creative Commons Attribution License (CC BY). The use, distribution or reproduction in other forums is permitted, provided the original author(s) and the copyright owner(s) are credited and that the original publication in this journal is cited, in accordance with accepted academic practice. No use, distribution or reproduction is permitted which does not comply with these terms.
*Correspondence: Andrew G. McKenzie-Gopsill, YW5kcmV3Lm1ja2VuemllLWdvcHNpbGxAY2FuYWRhLmNh