 Gurjinder S. Baath
 K. Colton Flynn2
 Vijaya Gopal Kakani
 Brian K. Northup
- 1Department of Plant and Soil Sciences, Oklahoma State University, Stillwater, OK, United States
- 2United States Department of Agriculture-Agricultural Research Service (USDA-ARS) Grassland Soil and Water Research Laboratory, Temple, TX, United States
- 3United States Department of Agriculture-Agricultural Research Service (USDA-ARS), Southeast Area, Stoneville, MS, United States
- 4United States Department of Agriculture-Agricultural Research Service (USDA-ARS), Grazinglands Research Laboratory, El Reno, OK, United States
Finger millet (Eleusine coracana Gaertn L.) is an important grain crop for small farmers in many countries. Reliable estimates of crop parameters, such as crop growth and nitrogen (N) content, through remote sensing techniques can improve in-season management of finger millet. This study investigated the relationships of hyperspectral reflectance with canopy height, green canopy cover, leaf area index (LAI), and N concentrations of finger millet using an optimal waveband selection procedure with partial least square regression (PLSR). Predictive performance of 13 vegetation indices (VIs) computed from the original hyperspectral data as well as synthesized Landsat-8 and Sentinel-2 data were evaluated and compared for estimating various crop parameters with simple linear regression (SLR) and multilinear regression (MLR) models. The optimal wavebands determined by PLSR were mostly concentrated within 1,000–1,100 nm for both LAI and dry biomass but were scattered for other canopy parameters. The SLR statistics resulted in the simple ratio pigment index (SRPI) and red/green index (RGI) performing best when predicting LAI (R2v = 0.53–0.59) and canopy cover (R2v = 0.72–0.76). The blue/green index (BGI1) was strongly related to canopy height (R2v = 0.65–0.78), dry biomass (R2v = 0.42–0.49), and N concentration (R2v = 0.70–0.83) of finger millet, regardless of spectral resolutions. The MLR approach, using four maximum VIs as input variables, improved the prediction accuracy of N concentration by 14% compared to both SLR and waveband selection methods. VIs computed from synthesized Landsat-8 and Sentinel-2 satellite data resulted in similar or greater prediction accuracy than hyperspectral data for various canopy parameters of finger millet, indicating publicly accessible multispectral data could serve as alternative to hyperspectral data for improved crop management decisions via precision agriculture.
Introduction
Finger millet is an annual grass that serves as an essential cereal crop in several drought-prone areas globally. It is extensively cultivated in Asia (India, Nepal, Myanmar, China, Sri Lanka, and Japan), and Africa (Kenya, Uganda, Ethiopia, Zaire, Tanzania, Somalia, and Rwanda) (Upadhyaya et al., 2010). The nutritious finger millet grain helps prevent malnutrition and is an important component of diets for breastfeeding mothers, growing children, and patients (Singh and Raghuvanshi, 2012). Furthermore, the biomass of finger millet is used as forage for livestock in many Asian and African countries (Sumathi et al., 2005).
Finger millet has been receiving increased attention as a forage resource in the southern United States (US) due to its high nutritive value. Research conducted in the Southern High Plains reported that the nutrient concentrations of its forage were higher than forage of corn and sorghum. Moreover, it can be mixed with corn and sorghum to improve the overall quality of silage for dairy cattle (Gowda et al., 2015). Finger millet could also serve as an alternative to perennial pastures of bermudagrass [Cyanodon dactylon (L.) Pers.] and old world bluestems (Bothriochloa spp.), to fill declines in forage quality during late-summers in the Southern Great Plains (Baath et al., 2018a,b). Extensive research has focused on developing strategies for agronomic management, including optimum rates of nitrogen (N) application to sustain forage production and quality of finger millet in the southern US.
Estimation and monitoring of biophysical and biochemical characteristics are essential for agronomic research and forage management of crops, including finger millet. Biophysical parameters such as plant height, leaf area index (LAI), green canopy cover, and biomass are important indicators of plant growth, foliage density, canopy interception, and crop productivity, respectively (Thenkabail et al., 2000). In contrast, N concentrations in plant biomass represent an estimate of forage quality and any stress associated with photosynthetic activity of the parent plant (Feng et al., 2008). Although the traditional approaches of measuring biophysical attributes or plant N are reliable, they are time-consuming, laborious, and do not provide real-time N status of crops (Foster et al., 2017). In comparison, remote sensing techniques have potential to provide real-time, non-destructive estimates of different biophysical or biochemical attributes in many crops (Thenkabail et al., 2000; Nguyen and Lee, 2006). Remote sensing can also capture seasonal variations, which are often missed in traditional techniques due to limitations associated with the time and human resources (Hatfield and Prueger, 2010). While many diverse applications of remote sensing have been developed for major crops (Bégué et al., 2018), there are very few reports of such studies for finger millet (Dayananda et al., 2019).
Hyperspectral reflectance has been established as a valuable alternative to traditional methods of remote sensing. Hyperspectral remote sensing provides many contiguous narrow bands (<10 nm) of information related to biophysical and biochemical characteristics, which are usually missed by broadband multispectral reflectance due to low spectral resolution (Sahoo et al., 2015). Past research showed the potential of hyperspectral reflectance in estimating many biophysical parameters, involving plant height (Yue et al., 2017), leaf area index (LAI; Zhao et al., 2007a), canopy cover (Muharam et al., 2015), biomass (Foster et al., 2017), and plant N (Zhao et al., 2005). Therefore, the technique could be useful in monitoring the growth parameters and plant N status of finger millet and defining responses to different application rates of fertilizers (Jain et al., 2007).
Though hyperspectral imaging can provide more comprehensive analyses of the attributes of the canopy of finger millet, the high-dimensional data captured by hyperspectral sensors are challenging for conventional analytical techniques. Such data are affected by relatively large volumes, require Big Data analytics, have storage problems, and include redundant data/wavelengths (Becker et al., 2005). One possible solution is to reduce the dimensions of captured hyperspectral data by extracting optimal bands of interest for specific crop parameters (Wang et al., 2008). The partial least square regression (PLSR), an extension of multiple linear regression, is one of the most efficient methods used to extract relevant information from the large dimensional hyperspectral data and generate reliable models for predicting crop characteristics (Nguyen and Lee, 2006; Li et al., 2014). As hyperspectral data often consist of highly collinear wavebands, the use of PLSR is assumed more appropriate than other statistical methods since it avoids model overfitting.
Hyperspectral analysis is not the only option for remote sensing of canopy characteristics. In contrast to the complicated selection procedure for wavebands in hyperspectral analyses, the approach of spectral vegetation indices (VIs) has been widely utilized for many crops due to its simplicity and straightforward analytics (Fang and Liang, 2008). VIs are commonly-used numerical computations derived from specific narrow bands of the electromagnetic spectrum, primarily the visible and near-infrared regions (Viña et al., 2011). Many VIs can be developed from hyperspectral data and correlated individually to different canopy parameters (Hatfield and Prueger, 2010). Simple ratio (SR) and Normalized Difference Vegetation Index (NDVI) are the most commonly used for estimating various canopy characteristics (Zhao et al., 2007b; Hatfield et al., 2019); however, other VIs such as Triangular Vegetation Index (TVI) performed better at predicting LAI for soybean (Glycine max), maize (Zea mays), and wheat (Triticum aestivum) (Jiang et al., 2008). Likewise, indices that involve red-edge wavelengths were found to be more robust at predicting canopy N in wheat than normalized or simple ratio indices (Cammarano et al., 2014). The suitability of VIs varies for specific applications, growth stages and crop species (Thenkabail et al., 2002), and hence some caution is needed when considering VIs for practical applications in finger millet. Also, a combination of different VIs could further enhance the prediction accuracy of crop parameters (Tong et al., 2019), but the approach is not yet well-established. As such, the multilinear regression (MLR) models could prove effective at selecting multiple non-correlated VIs to develop significant correlations with various canopy parameters.
Spectroradiometer equipment involves a high monetary cost, which limits its availability to small farmers and crop consultants. New multispectral sensors, including Sentinel-2 and Landsat-8, that accompanied improvements in spectral and spatial resolution, could serve as useful platforms for precision agriculture-based applications (Flynn et al., 2020). Since the applicability of VIs could also differ depending on the spectral resolution and instrument used (Xue and Su, 2017), it is important to evaluate whether VIs developed from hyperspectral data can successfully translate to the multispectral bands captured by Sentinel-2 or Landsat-8 for the estimation of crop parameters of finger millet.
The main objectives of this study were to: (i) investigate the relationships of hyperspectral reflectance with biophysical characteristics and N status of finger millet using the PLSR optimal waveband selection procedure, and (ii) evaluate capabilities of VIs developed from the original hyperspectral data and those derived from synthesized Landsat-8 and Sentinel-2 data for estimating various crop parameters through simple linear regression (SLR) and multilinear regression (MLR) models. Finally, an overall comparison of prediction accuracies obtained using different methods was performed to define their capacity as a remote sensing tool in agronomic research and forage management of finger millet. We hypothesized that the optimal waveband selection procedure and VI based models developed using hyperspectral and multispectral band resolutions would result in similar prediction accuracy for various canopy parameters of finger millet.
Materials and Methods
Experimental Setup
The experiment was conducted at the United States Department of Agriculture-Agricultural Research Service (USDA-ARS) Grazinglands Research Laboratory (35°34′N, 98°02′ W, elevation 409 m above mean sea level), near El Reno, Oklahoma, US. The experimental field soil type was described as Brewer silty clay loams with a pH of 6.9, slope of 0–1%, water permeability ranging between 0.2 and 1.5 cm h−1, and rarely flooded (USDA-NRCS, 1999). Finger millet cv. PI302662 was planted 2-cm deep at 38-cm row spacing using a Monosem planter (Monosem, Kansas City, KS) on 16 June 2018. Inter-plant spacing was adjusted to achieve 15 seeds m−1 row length. About 50 mm of irrigation water was applied with a sprinkler system at planting to assure good emergence. Five nitrogen treatments of 0, 30, 60, 90 and 120 Kg N ha−1 were arranged in a randomized complete block design with four replicated plots per treatment. Nitrogen treatments were top-dressed in two equal split doses at 10 and 50 days after planting (DAP), using dry urea (46-0-0) fertilizer. The site received a total of 235 mm of rainfall during the growing season of finger millet and encountered a mean air temperature of 19 °C during the experiment (Figure 1).
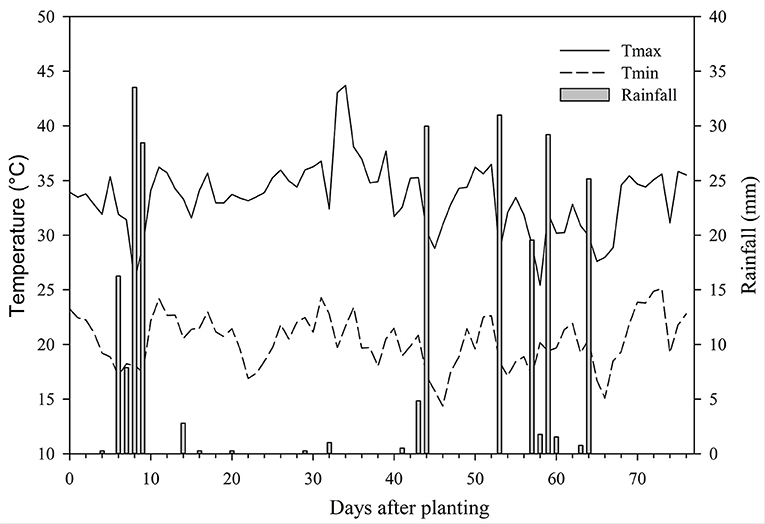
Figure 1. Daily maximum (Tmax) and minimum (Tmin) temperatures and rainfall encountered during the summer growing season of 2018 at El Reno, Oklahoma, USA.
Crop Characteristics and Hyperspectral Reflectance
Biophysical and reflectance data were collected simultaneously at 38, 46, 52, and 76 days after planting (DAP). The spectral data were measured with a spectroradiometer [FieldSpec Pro FR: Analytical Spectral Devices (ASD), Boulder, CO, USA] by choosing a random location within each plot. The reflectance measurement of the spectroradiometer used ranges between 350 and 2500 nm, comprising a spectral interval of 1.4 and 2.0 nm from 350 to 1,000 and 1,000 to 2,500 nm, respectively. Spectral data were collected from 1.2 m above ground with a 25-degree cone of acceptance, generating a 0.53 m diameter footprint for each sample. The LAI values were collected using a plant canopy analyzer (LAI-2200C, LI-COR Inc., Lincoln, Nebraska, USA), canopy cover was collected using the Canopeo app (Patrignani and Ochsner, 2015), and canopy height were observed at the same location within the plot. Sampled areas were then harvested to 5.0 cm aboveground from 0.5 m row lengths. Biomass samples were oven-dried at 60°C to constant weight, and dry weights were determined to define aboveground biomass. Each biomass sample was ground to 2-mm in a Wiley mill, and total N content was determined using an auto-analyzer (Model Vario Macro, Elementar Americas, Inc., Mt. Laurel, NJ, USA). The measured crop characteristics are summarized in Table 1.
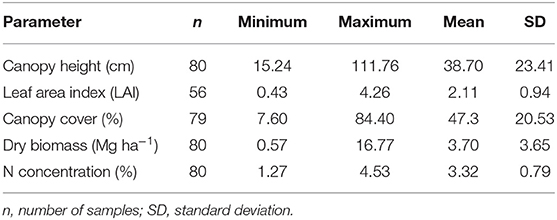
Table 1. Descriptive statistics of the measured parameters for the finger millet.
Spectral Preprocessing
Three spectral measurements were averaged to obtain a single spectral curve for each location/sample point before preprocessing. The resulting spectral curves were subjected to the Savitzky-Golay smoothing method to reduce spectral noise (Savitzky and Golay, 1964). Further, wavelength centered bands were created based on the average value derived from a set of 5 nm wavelengths (Kawamura et al., 2008, 2018); for instance, a band centered at 450 nm was averaged from wavelength reflectance values observed from 448 to 452 nm. The procedure for creating centered bands aids in reducing the noise of data and removes wavelengths considered to be similar. Bands ranging between 1,290 and 1,495, 1,705 and 2,045, and 2,355 and 2,500 nm were removed due to atmospheric moisture absorption noise, while 350–395 and 1005–1015 were removed to avoid overlapping noise within the two sensors of the spectroradiometer. The spectral preprocessing resulted in a total of 277 spectral wavebands ranging from 400 to 2,350 nm.
The 5 nm bands matching Landsat-8 (L8) and Sentinel-2 (S2) bands were synthesized using hyperspectral (Hy) data. Bandwidths used for both L8 and S2 are presented in Table 2. The reflectance values for Hy bands within a given bandwidth were added together and divided by number of wavebands to calculate each of L8 and S2 bands.

Table 2. Convolved hyperspectral wavelengths (nm) to match Landsat-8 OLI (L8) and Sentinel-2 MSI (S2) bands (B).
Data Analyses
The canopy reflectance data collected over four sensing dates for finger millet grown under five nitrogen treatments were analyzed as a randomized block design using PROC MIXED procedure in SAS 9.4 (SAS Institute Inc., Cary, NC, USA). Nitrogen treatment and spectral wavelength served as fixed effects within the analysis of variance (ANOVA) model, while block was considered as a random element and individual plots were treated as a subject. Sensing dates were taken as repeated elements, and compound symmetry covariance structures were used to take covariance and auto-correlation into account. All possible three-way and two-way interactions among nitrogen treatment, sensing date and wavebands were accounted for within the final model.
Partial Least Square Regression (PLSR) and Optimal Waveband Selection
The PLSR technique projects both dependent and independent variables into a new higher dimensional space to develop a linear regression model. It generates latent variables, also known as score vectors, to capture the variability related to the dependent variable(s). Technically, PLSR develops a model by deriving X-scores from latent variables to predict Y-scores (Baath et al., 2020). A redundancy analysis on the X- and Y-scores brings directionality in the factor space to obtain the most accurate prediction (Wu and Yu, 2016). While applying PLSR on spectral data, the number of latent variables (NLV) should not exceed the number of independent variables as it can lead to overfitting (Kawamura et al., 2008).
The waveband selection is a modified PLSR method generally used for spectroscopic analyses. The selection process involves reducing the number of wavebands to the most relevant bands based on plant/crop characteristics before carrying out the regression. The method resembles step-wise regression as it eliminates the least important wavebands. PLSR assigns a weighed regression coefficient (βw) to each independent variable based on its contribution to the model. The waveband selection starts with all 277 wavebands and removes the waveband with the least contribution to the model. This removal process is repeated with 276 wavebands and continues until it is reduced to one waveband. After every iteration, the predictive ability is assessed for each set of wavebands by computing the root mean squared error (RMSE), and the PLSR model resulting in the lowest RMSE determines the optimal wavebands and the number of wavebands to be used.
Spectral Indices and Linear Regression Models
Original Hy, and synthesized L8 and S2 bands were used to compute 13 vegetation indices (Table 3). The relationships between each index and measured parameters were best-fit with the simple linear regression (SLR) models. In addition, multilinear regression (MLR) models were developed for each of Hy, L8 and S2 datasets using the stepwise regression and Akaike information criterion (AIC) approach (Zhang, 2016). The MLR approach is based on a primary hypothesis that a subset of VIs is more predictive than others for tested canopy parameters. It starts with no VI in the regression model and then keeps on adding the most statistically significant VIs (with the lowest p-value) at every step. The process stops at the point when the regression model shows no improvement on adding more VIs (Fritz and Berger, 2015). A multicollinearity analysis of datasets was conducted based on the Variance Inflation Factor (VIF) calculated using the ‘car' package in R (Fox et al., 2012), and predictors with a VIF > 5 were not included in the regression models. The maximum number of VIs (nvmax) selected by the MLR models were limited to four using the ‘caret' package in R (Kuhn, 2008).

Table 3. Formulas of vegetation indices computed for hyperspectral (Hy) data and synthesized Landsat-8 OLI (L8) and Sentinel-2 MSI (S2) data [derived from Zarco-Tejada et al. (2005) and le Maire et al. (2004)].
The predictive capabilities for the PLSR based waveband selection method, and SLR and MLR models developed using VIs were evaluated using a bootstrapping procedure. The procedure involves dividing the data into two random subsets: calibration (75%) and validation (25%), with 1,000 replacements (Efron, 1979). The prediction accuracy of models was compared using the resulting coefficient of determination (R2v) and root mean squared error (RMSEv) values for the validation.
Results
Significant three-way interaction (P < 0.0001) among nitrogen treatment, sensing date and waveband was noticed for canopy reflectance spectra. The responses of various spectrum regions changed across five nitrogen treatments on different sampling dates (Figures 2A–D). Although there were differences in intensity, reflectance showed a typical increase in the NIR region (>700 nm) with increasing nitrogen fertilizer level at all sampling dates, except some relatively mixed responses observed at 52 DAP.
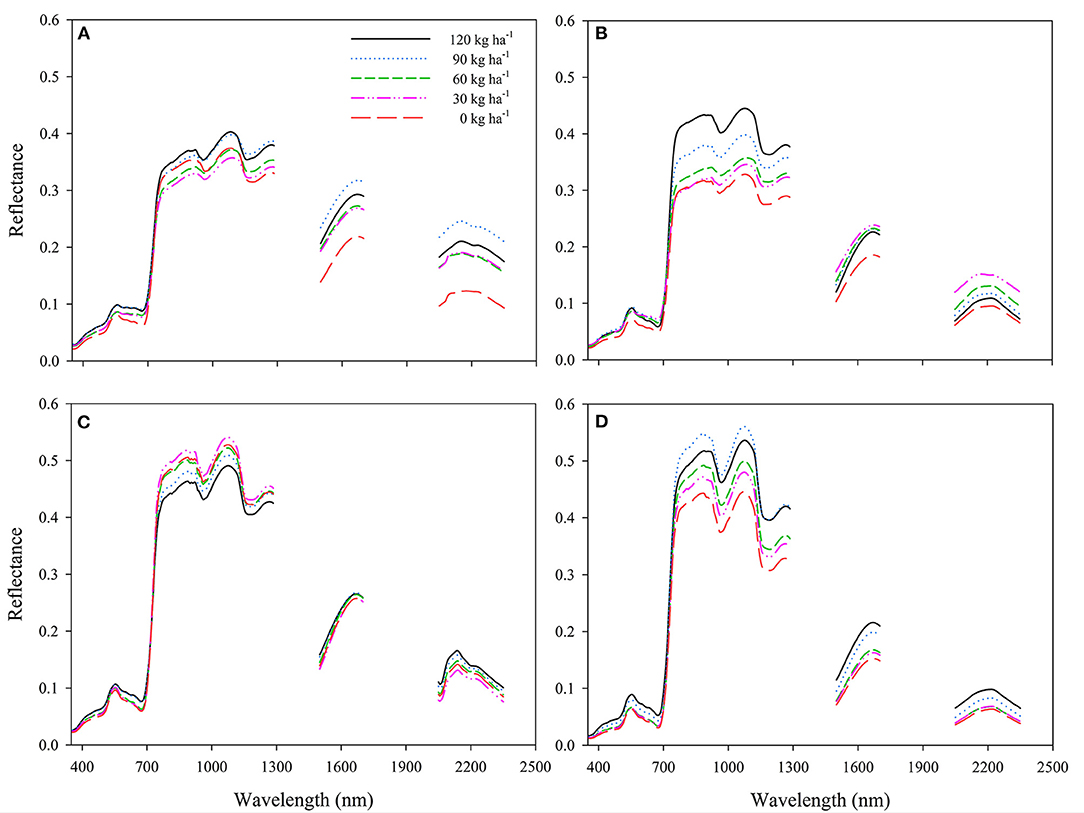
Figure 2. Mean canopy reflectance of finger millet under five nitrogen fertilizer rates when sampled at (A) 38, (B) 46, (C) 52, and (D) 76 days after planting.
Each of the crop parameters showed a wide range and high standard deviation among observed values (Table 1), which represents the variability caused by different N rates applied and age of plant materials at sampling dates during the growing season. Datasets of canopy height, dry biomass, and N concentration include 80 values each, while there was one missing value for canopy cover data. Also, LAI measurements were not recorded at final sampling (76 DAP), and four values were identified as outliers; hence a total of 56 values were used for LAI analyses.
Waveband Selection Approach
Among parameters, the best prediction accuracy was observed for canopy height (R2v = 0.86), followed by canopy cover (R2v = 0.81), with the waveband selection approach (Figures 3A,C). In contrast, R2v for dry biomass and plant N concentration were 0.71 and 0.77, respectively (Figures 3D,E), and the lowest R2v (0.55) among measured canopy parameters of finger millet was noted for LAI (Figure 3B).
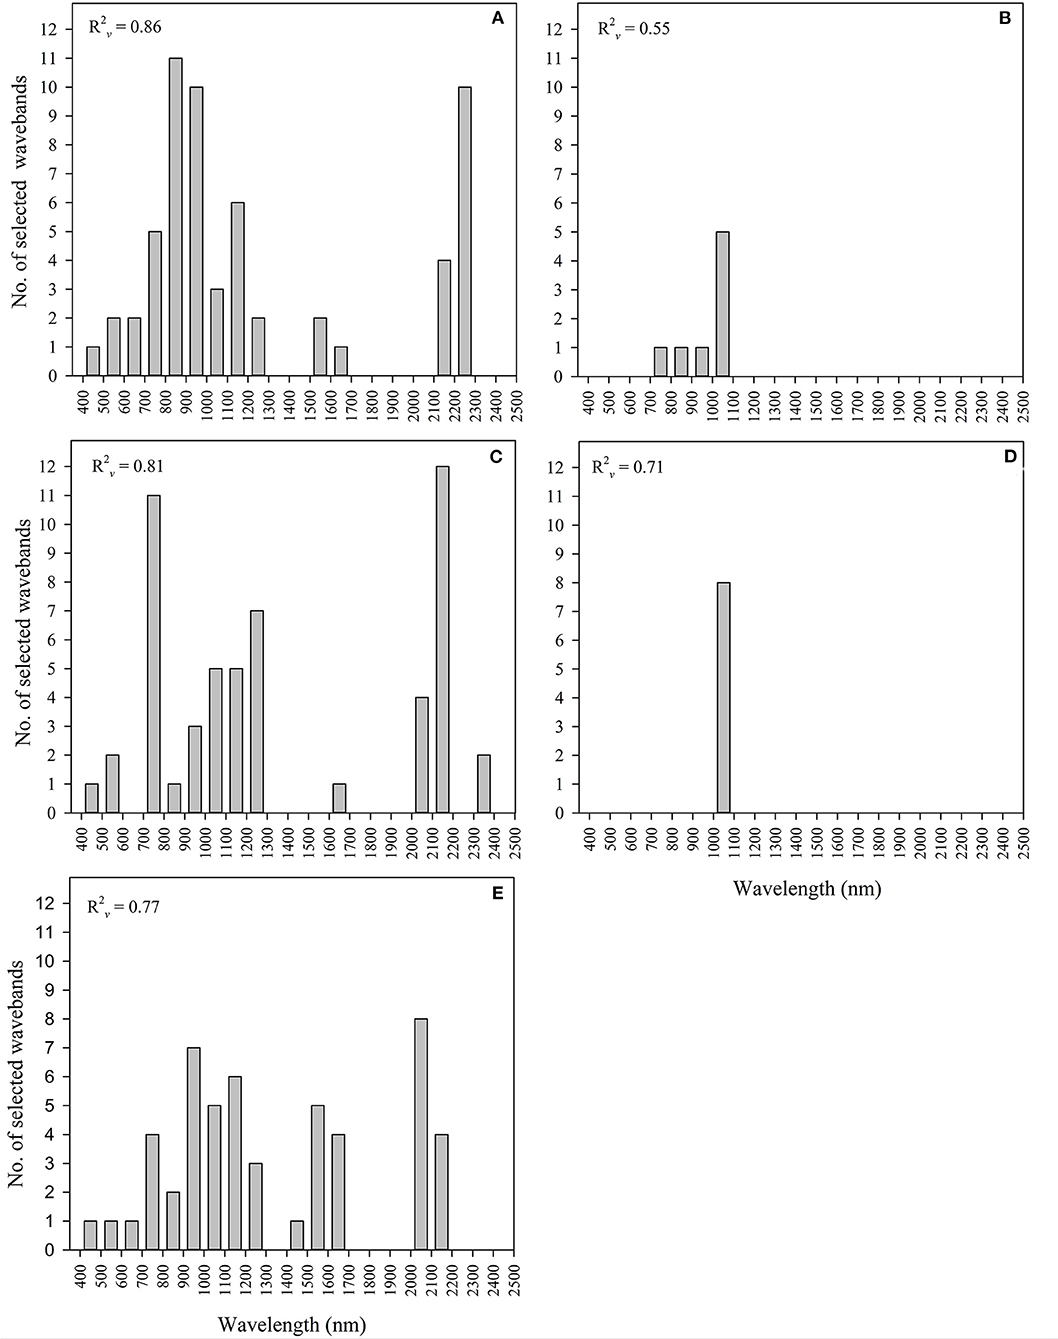
Figure 3. Frequency of optimal wavebands selected across 350-2500 nm spectral wavelength for (A) canopy height, (B) leaf area index (LAI), (C) canopy cover, (D) dry biomass and (E) N concentration of finger millet, using the partial least square regression (PLSR) based procedure for waveband selection.
It should be noted that the results for dry biomass and LAI were based on only eight spectral bands, with the most optimal bands positioned within the electromagnetic wavelength range of 1,000–1,100 nm. In contrast, plant N concentration, canopy cover and canopy height used a relatively higher number of spectral wavebands (52–59), with ~ 25, 29, and 44% of selected spectral bands, respectively, within the near-infrared region (NIR; 700–1000 nm).
Vegetation Indices (VIs)
VIs computed using Hyperspectral (Hy) data, synthesized Landsat-8 (L8), and Sentinel-2 (S2) data showed variable linear relationships with canopy height (Table 4). Within each of Hy, L8, and S2 indices, the simple pigment blue/green index (BGI1) performed best at predicting canopy height through SLR models, with an R2v of 0.78 for L8_ BGI1, and R2v of 0.65 and 0.66 obtained for Hy_ BGI1 and L8_ BGI1, respectively. In contrast, blue red index (BRI1) was the least accurate at estimating canopy height of finger millet, irrespective of tested spectral resolutions.
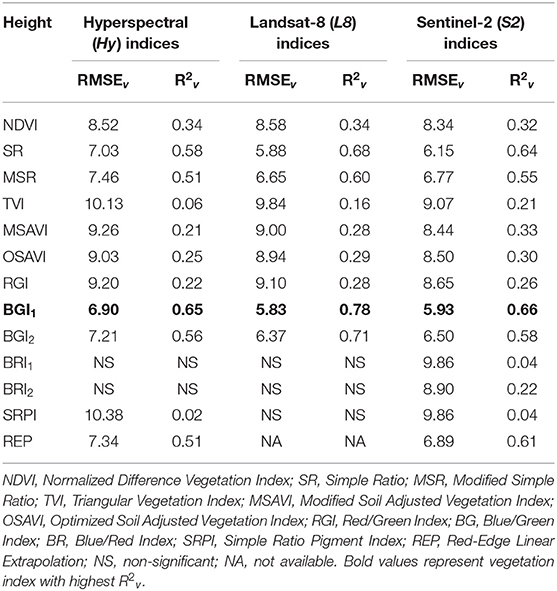
Table 4. Validation statistics (RMSEv and R2v) of simple linear regression models of Hyperspectral (Hy) indices, and synthesized Landsat-8 (L8) and Sentinel-2 (S2) indices for canopy height of finger millet.
The MLR model resulted in greater prediction accuracy of canopy height than SLR models in each of three categories of VIs (Hy, L8, and S2; Table 5). The MLR model, comprised of two VIs, resulted in comparable R2v of 0.83-0.84 for Hy and L8 indices, while R2v of 0.86 was obtained with an additional VI used in the model for S2 data (Table 5).

Table 5. Validation statistics (RMSEv and R2v) of multilinear regression models of Hyperspectral (Hy) indices, and synthesized Landsat-8 (L8) and Sentinel-2 (S2) indices obtained for canopy height, canopy cover, dry biomass and nitrogen (N) concentration of finger millet.
Red/Green index (RGI), another simple pigment index, outperformed the other indices for canopy cover estimations within each category (Table 6). Hy, L8 and S2 data resulted in a comparable range of R2v (0.72–0.76) values for the linear relationships between RGI and canopy cover. Besides RGI, all VIs calculated with Hy and L8 data performed reasonably well at predicting canopy cover with R2v ≥ 0.50 for SLR models, except L8_BGI1 (Table 6). For S2 data, five out of 13 indices resulted in R2v < 0.50, with S2_BGI1 performing as the least accurate (R2v = 0.30).
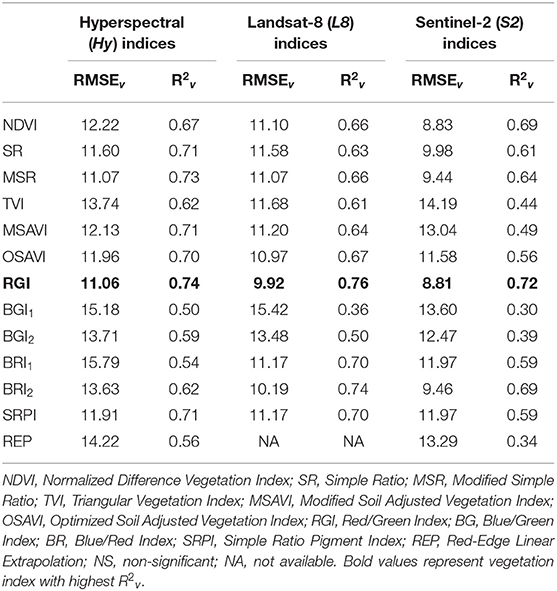
Table 6. Validation statistics (RMSEv and R2v) of simple linear regression models of Hyperspectral (Hy) indices, and synthesized Landsat-8 (L8) and Sentinel-2 (S2) indices obtained for canopy cover of finger millet.
Unlike canopy height, the resulting MLR models for canopy cover were consistently based on the same two VIs (SR and RGI; Table 5). Although MLR performed better (R2v = 0.75-0.78) than SLR models at predicting canopy cover for each of three datasets, observed statistics (R2v and RMSEv) were not largely different.
The SLR model of simple ratio pigment index (SRPI) performed consistently (R2v = 0.53–0.59) at estimating LAI, with L8_SRPI performing best (R2v = 0.59) among Hy, L8 and S2 indices (Table 7). Apart from SRPI, the predictive accuracy of BRI2 was also relatively better (R2v = 0.52–0.57) than the remaining indices. Besides, SR, MSR, and RGI indices developed comparable linear relationships with LAI and their R2v ranged between 0.43 and 0.51, regardless of spectral resolutions. However, in contrast to canopy height and canopy cover, MLR models did not result in any significant combination of VIs that could outperform the SLR model for LAI prediction accuracies with either of three datasets.
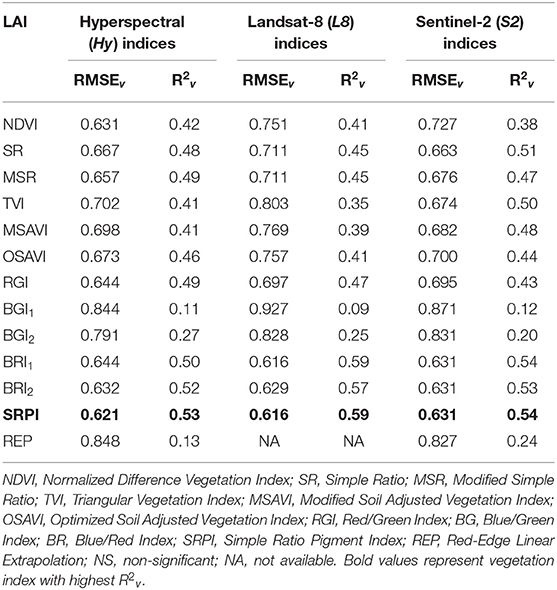
Table 7. Validation statistics (RMSEv and R2v) of simple linear regression models of Hyperspectral (Hy) indices, and synthesized Landsat-8 (L8) and Sentinel-2 (S2) indices obtained for leaf area index (LAI) of finger millet.
Among the VIs, none of them resulted in a consistently best linear relationship with dry biomass for each of Hy, L8, and S2 datasets (Table 8). Among Hy indices, the best linear relationship of dry biomass was observed with red-edge linear extrapolation (REP) index (R2v = 0.48), while BGI1performed with an R2v of 0.46 and 0.49 among L8 and S2 indices, respectively (Table 8). Other than BGI1, SR showed a consistent prediction accuracy, with R2v ranging between 0.40 and 0.46, compared to remaining VIs in all three categories. In contrast, linear relationships of dry biomass with BRI1, BRI2 and SRPI were least significant (R2cv = 0.02–0.20) among VIs.
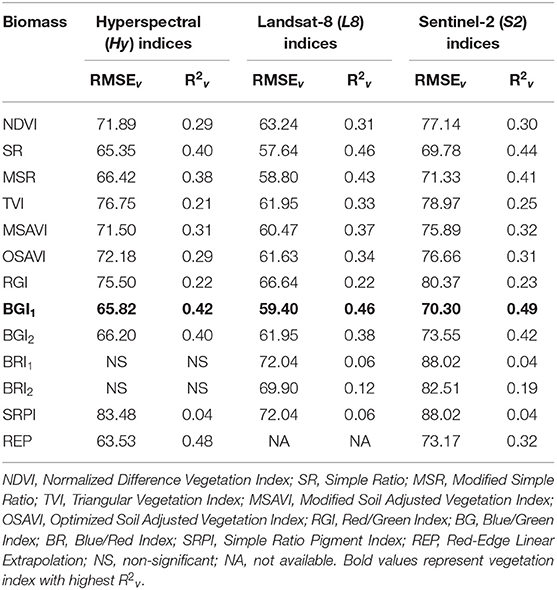
Table 8. Validation statistics (RMSEv and R2v) of simple linear regression models of Hyperspectral (Hy) indices, and synthesized Landsat-8 (L8) and Sentinel-2 (S2) indices obtained for dry biomass of finger millet.
The MLR model improved the prediction accuracy of dry biomass for all three datasets (Table 5). Among MLR models developed for dry biomass, best performance (R2v = 0.55) was observed with L8 indices, accompanied by S2 (R2v = 0.52) and L8 (R2v = 0.50) indices.
Among VIs, the best predictive accuracy for N concentration was obtained with BGI1within each of Hy, L8, and S2 indices (Table 9). The greatest R2v of 0.83 was observed for Hy_BGI1, followed by S2_BGI1 (R2v = 0.80). Whereas, L8_BGI1 had a relatively lower R2v of 0.70 for N concentration, which was otherwise higher than the remaining L8 indices. As observed for canopy height and dry biomass, the least effective SLR models for estimating N concentration were observed with BRI1, BRI2, and SRPI indices.

Table 9. Validation statistics (RMSEv and R2v) of simple linear regression models of Hyperspectral (Hy) indices, and synthesized Landsat-8 (L8) and Sentinel-2 (S2) indices obtained for N concentration of finger millet.
MLR models, comprising two VIs, improved prediction accuracies of N concentration compared to SLR models within each category (Table 5), though little difference was observed for performance given by Hy indices. The best MLR model performance (R2v = 0.90) was noticed for S2 data, followed by Hy and S2 data (R2v = 0.83–0.88).
Discussion
Though not generally grown in large-scale commercial settings, finger millet is still an essential cereal crop in many drought-prone areas around the world. Therefore, the ability to estimate different parameters of crop canopies of finger millet through remote sensing could be important for improving in-season management. Remote sensing applications have not been widely applied to finger millet, and this study showed that relationships between hyperspectral reflectance and different canopy parameters using the PLSR based procedure for selecting wavebands have value. Further, given the cost of spectroradiometers, the complexity of the approach used in waveband selection, and the production of finger millet by mostly small farmers in developing countries, indicates simpler methods based on VIs derived from Hy, L8 and S2 datasets may also have great value.
Canopy height is an important parameter characterizing plant growth, and it is often required as input for determining energy balance components using remote sensing data (Hunsaker et al., 2003). The predictive accuracy of canopy height by VIs remained lower through SLR approach in this study. Similarly, Payero et al. (2004) reported lower prediction accuracy for plant height of a grass (Festuca arundinacea) using the linear function of 11 similar VIs. Whereas, the predictive performance was significantly improved using MLR models based on VIs calculated from Hy, L8, and S2 data, even when compared to the waveband selection procedure (Figure 4), which suggests a strong potential for height estimations of finger millet with this approach. The unavailable REP index for L8 data could explain a slightly lower prediction accuracy of the L8-multilinear model compared to other MLR models developed for canopy height. Nonetheless, it appeared that MLR models allowed the use of effective information of different VIs, and hence improved the prediction accuracy of canopy height in finger millet.
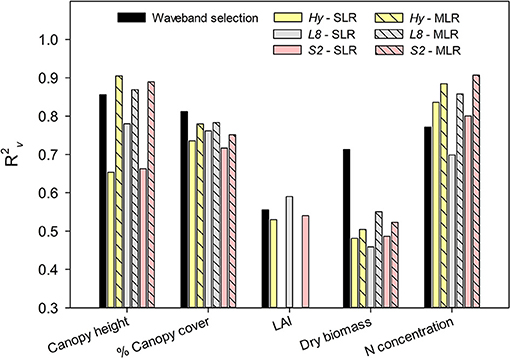
Figure 4. Comparison of predictive performance (R2v) given by waveband selection procedure, and Hyperspectral (Hy) indices and synthesized Landsat-8 (L8) and Sentinel-2 (S2) indices with simple linear regression (SLR) and multilinear regression (MLR) models, for estimation of different canopy parameters of finger millet. Within each group, SLR models with the best statistics were selected for comparison.
The predictive performance of canopy cover estimations by MLR was comparable (R2v = 0.75–0.78) to the best SLR model obtained for the Hy, L8 and S2 datasets, though PLSR based waveband selection resulted in a slightly greater prediction accuracy (Figure 4). These findings suggest that estimations of green canopy cover could be directly achieved with sufficient accuracy in finger millet using RGI. Likewise, the green cover was reported as highly correlated with RGI in another grasslands study (Cundill et al., 2015). Canopy cover estimation involves sensing healthy green grass, dry grass (litter), and bare soil. If the proportion of litter and bare soil is greater, the reflectance in red region increases more than in the green region and vice versa (Asner, 1998). Therefore, the combination of green cover, litter and bare soil can be better assessed by VIS such as RGI since it accounts for both red and green regions. It is important to emphasize that prediction accuracy for detecting green cover remained similar across VIs, regardless of bandwidths associated with different instruments. This is in agreement with previous studies (Broge and Leblanc, 2001; Zhao et al., 2007b), which suggested that narrow-band and broad-band indices could result in similar performance for some parameters, like canopy cover, depending on the optimum waveband positions.
The prediction accuracy of LAI obtained in this study was lower than the other canopy parameters, which could be due to fewer data points (56 vs. 80) available for calibration and validation of LAI models. It is generally argued that narrow-band indices result in better estimation of important canopy parameters such as LAI (Sahoo et al., 2015; Din et al., 2017). However, broad-band indices computed from both L8 and S2 outperformed the narrower bands of Hy indices in this study. The better performance of S2 and L8 indices could be explained by the reduction in surrounding environmental noise with aggregated bands, which otherwise exist within the original narrow-band hyperspectral data (Kawamura et al., 2005; Flynn et al., 2020). Further, the predictive performance of SRPI in estimating LAI exceeded the most commonly used VIs, involving NDVI (Tan et al., 2020), REP (Dong et al., 2019), SR (Nguy-Robertson et al., 2012), or modified soil-adjusted vegetation index (MSAVI; Din et al., 2017). These findings supported that LAI-VI relationships are not universal but crop-specific (Kang et al., 2016; Dong et al., 2020).
Another interesting finding observed from PLSR waveband selection was that both LAI and dry biomass of finger millet were strongly related to the spectral bands within the electromagnetic range of 1,000–1,100 nm. Since all VIs were derived from spectral bands ranging between 400 and 900 nm, it explains the lower prediction performance observed with both SLR and MLR models of all VIs, especially in the case of dry biomass estimations, compared to the standard PLSR based waveband selection approach. The optimal wavebands determined for finger millet biomass were 686, 694, and 774–814 nm were reported in earlier research in India by Dayananda et al. (2019), using a hyperspectral sensor with the spectral range of 450–998 nm. However, our findings suggest it is essential to focus on the spectral range of 1,000–1,100 nm to improve the prediction accuracy of biomass in future precision agriculture research related to finger millet.
In agreement with results of this study, Tong et al. (2019) also observed an improvement in the predictive performance of aboveground biomass using MLR methods on VIs. Therefore, such VI-multilinear algorithms should also be encouraged for improved estimation of pasture biomass with hyperspectral or multispectral instruments in other crops.
The PLSR waveband selection revealed that several hyperspectral regions between 400 and 2,200 nm were important for predicting nitrogen content in finger millet. Similar findings were reported in other studies estimating nitrogen from hyperspectral data (Caporaso et al., 2018; Flynn et al., 2020). While it was also noted that equal or better predictive accuracy for N concentration in finger millet could be achieved using the SLR approach involving VIs, potentially avoiding the complexity related to PLSR waveband selection procedure. Based on R2v and RMSEv values obtained for simple linear relationships between VIs and N concentration, simple pigment indices (BGI1) derived from blue and green spectral bands, irrespective of band widths, resulted in more accurate estimations of plant N concentration than other traditional VIs, such as NDVI and SR (Zhu et al., 2008; Zhao et al., 2018). Simple pigment indices were also good predictors of biochemical components in another cereal crop known as tef (Eragrostis tef ; Flynn et al., 2020).
Although blue bands are less commonly adopted for detecting nutritional quality, the combination of blue and green bands through BGI have been found more useful than BRI in retrieving chlorophyll contents in barley (Hordeum vulgare) and vineyard (Vitis vinifera) (Zarco-Tejada et al., 2005; Aasen et al., 2015). Similarly, Hansen and Schjoerring (2003) found only visible wavelengths, particularly the combination of blue and green bands, as strongly correlated to N concentrations. Moreover, BGI was earlier reported best at predicting N concentration in wheat (Prey and Schmidhalter, 2019). Results also suggested that the application of MLR models could further enhance the N prediction accuracy for Hy, L8 and S2 datasets by 14%, and hence the approach has a major significance for precision agriculture.
Conclusion and Implications
Hyperspectral reflectance data could be effectively utilized to estimate canopy parameters for rapid and improved in-season management decisions of finger millet. In the case of SLR models, the best prediction accuracies were observed with simple pigment indices for all of the tested crop parameters in this study. BGI1 performed best for canopy height, dry biomass, and N concentration, while RGI and SRPI were found strongly related to canopy cover and LAI of finger millet, respectively. Also, results showed that the application of MLR approach on VIs could provide a predictive performance better than the methods, involving SLR models and PLSR waveband selection procedure, for the estimation of canopy height and N concentration in finger millet. Whereas, dry biomass of finger millet was estimated with greater accuracy using waveband selection procedure than approaches involving VIs, owing to optimal spectral bands positioned within the electromagnetic range of 1,000–1,100 nm.
This study demonstrated that VIs derived from hyperspectral data could be translated to multispectral bands of Landsat-8 and Sentinel-2 satellite data with similar (or greater) prediction accuracy for canopy parameters of finger millet. Hence, there is a great potential of utilizing such readily accessible sources of satellite data for developing methods of precision agriculture related to finger millet, especially in the developing countries where the crop is mostly cultivated. Future research needs to be focused on evaluating the effectiveness of VIs developed from Landsat-8 and Sentinel-2 data at predicting nutritive value of forage, and grain yields, of finger millet across environmental gradients.
Data Availability Statement
The original contributions presented in the study are included in the article/supplementary material, further inquiries can be directed to the corresponding author/s.
Author Contributions
All authors listed have made a substantial, direct and intellectual contribution to the work, and approved it for publication.
Funding
Authors would like to acknowledge Cooperative Agreement with USDA-ARS Grazinglands Research Laboratory and Oklahoma Agriculture Experiment Station Hatch project OKL03132 for funding this research.
Disclaimer
The U.S. Department of Agriculture (USDA) prohibits discrimination in all its programs and activities on the basis of race, color, national origin, age, disability, and where applicable, sex, marital status, familial status, parental status, religion, sexual orientation, genetic information, political beliefs, reprisal, or because all or part of an individual's income is derived from any public assistance program. (Not all prohibited bases apply to all programs.) Persons with disabilities who require alternative means for communication of program information (Braille, large print, audiotape, etc.) should contact USDA's TARGET Center at (202) 720-2600 (voice and TDD). To file a complaint of discrimination, write to USDA, Director, Office of Civil Rights, 1400 Independence Avenue, S.W., Washington, D.C. 20250-9410, or call (800) 795-3272 (voice) or (202) 720-6382 (TDD). USDA is an equal opportunity provider and employer.
Conflict of Interest
The authors declare that the research was conducted in the absence of any commercial or financial relationships that could be construed as a potential conflict of interest.
Acknowledgments
Authors would like to thank Jay Prater for planting the crop and ARS technicians, Kory Bollinger, Jeff Weik, and Cindy Coy, for their assistance in managing experimental sites, collecting, processing, and analyzing samples.
References
Aasen, H., Burkart, A., Bolten, A., and Bareth, G. (2015). Generating 3D hyperspectral information with lightweight UAV snapshot cameras for vegetation monitoring: from camera calibration to quality assurance. ISPRS J. Photogramm. Remote Sens. 108, 245–259. doi: 10.1016/j.isprsjprs.2015.08.002
Asner, G. P. (1998). Biophysical and biochemical sources of variability in canopy reflectance. Remote Sens. Environ. 64, 234–253. doi: 10.1016/S0034-4257(98)00014-5
Baath, G., Northup, B., Gowda, P., Rocateli, A., and Turner, K. (2018a). Adaptability and forage characterization of finger millet accessions in US Southern great plains. Agronomy 8:177. doi: 10.3390/agronomy8090177
Baath, G. S., Baath, H. K., Gowda, P. H., Thomas, J. P., Northup, B. K., Rao, S. C., et al. (2020). Predicting forage quality of warm-season legumes by near infrared spectroscopy coupled with machine learning techniques. Sensors 20:867. doi: 10.3390/s20030867
Baath, G. S., Northup, B. K., Rocateli, A. C., Gowda, P. H., and Neel, J. P. (2018b). Forage potential of summer annual grain legumes in the southern great plains. Agronomy J. 110, 2198–2210. doi: 10.2134/agronj2017.12.0726
Becker, B. L., Lusch, D. P., and Qi, J. (2005). Identifying optimal spectral bands from in situ measurements of Great Lakes coastal wetlands using second-derivative analysis. Remote Sens. Environ. 97, 238–248. doi: 10.1016/j.rse.2005.04.020
Bégué, A., Arvor, D., Bellon, B., Betbeder, J., De Abelleyra, D., Pd Ferraz, R., et al. (2018). Remote sensing and cropping practices: a review. Remote Sens. 10:99. doi: 10.3390/rs10010099
Broge, N. H., and Leblanc, E. (2001). Comparing prediction power and stability of broadband and hyperspectral vegetation indices for estimation of green leaf area index and canopy chlorophyll density. Remote Sens. Environ. 76, 156–172. doi: 10.1016/S0034-4257(00)00197-8
Cammarano, D., Fitzgerald, G. J., Casa, R., and Basso, B. (2014). Assessing the robustness of vegetation indices to estimate wheat N in Mediterranean environments. Remote Sens. 6, 2827–2844. doi: 10.3390/rs6042827
Caporaso, N., Whitworth, M. B., and Fisk, I. D. (2018). Protein content prediction in single wheat kernels using hyperspectral imaging. Food Chem. 240, 32–42. doi: 10.1016/j.foodchem.2017.07.048
Chen, J. (1996). Evaluation of vegetation indices and modified simple ratio for boreal applications. Can. J. Remote Sens. 22, 229–242. doi: 10.1080/07038992.1996.10855178
Cho, M. A., and Skidimore, A. K. (2006). A new technique for extracting the red edge position from hyperspectral data: the linear extrapolation method. Remote Sens. Environ. 101, 181–193. doi: 10.1016/j.rse.2005.12.011
Cundill, S. L., Van Der Werff, H., and Van Der Meijde, M. (2015). Adjusting spectral indices for spectral response function differences of very high spatial resolution sensors simulated from field spectra. Sensors 15, 6221–6240. doi: 10.3390/s150306221
Dayananda, S., Astor, T., Wijesingha, J., Thimappa, S. C., Chowdappa, H. D., Nidamanuri, R. R., et al. (2019). Multi-temporal monsoon crop biomass estimation using hyperspectral imaging. Remote Sens. 11:1771. doi: 10.3390/rs11151771
Din, M., Zheng, W., Rashid, M., Wang, S., and Shi, Z. (2017). Evaluating hyperspectral vegetation indices for leaf area index estimation of Oryza sativa L. at diverse phenological stages. Front. Plant Sci. 8:820. doi: 10.3389/fpls.2017.00820
Dong, T., Liu, J., Qian, B., He, L., Liu, J., Wang, R., et al. (2020). Estimating crop biomass using leaf area index derived from Landsat 8 and Sentinel-2 data. ISPRS J. Photogramm. Remote Sens. 168, 236–250. doi: 10.1016/j.isprsjprs.2020.08.003
Dong, T., Liu, J., Shang, J., Qian, B., Ma, B., Kovacs, J. M., et al. (2019). Assessment of red-edge vegetation indices for crop leaf area index estimation. Remote Sens. Environ. 222, 133–143. doi: 10.1016/j.rse.2018.12.032
Efron, B. (1979). Bootstrap methods: another look at the jackknife. Ann. Stat. 7, 1–26. doi: 10.1214/aos/1176344552
Fang, H., and Liang, S. (2008). “Leaf area index models” in Encyclopedia of Ecology, eds S. E. Jørgensen, and B. D. Fath (Amsterdam: Elsevier), 2139–2148. doi: 10.1016/B978-008045405-4.00190-7
Feng, W., Yao, X., Zhu, Y., Tian, Y., and Cao, W. (2008). Monitoring leaf nitrogen status with hyperspectral reflectance in wheat. Eur. J. Agron. 28, 394–404. doi: 10.1016/j.eja.2007.11.005
Flynn, K. C., Frazier, A. E., and Admas, S. (2020). Performance of chlorophyll prediction indices for Eragrostis tef at Sentinel-2 MSI and Landsat-8 OLI spectral resolutions. Precis. Agric. 21, 1057–1071. doi: 10.1007/s11119-020-09708-4
Foster, A., Kakani, V., and Mosali, J. (2017). Estimation of bioenergy crop yield and N status by hyperspectral canopy reflectance and partial least square regression. Precis. Agric. 18, 192–209. doi: 10.1007/s11119-016-9455-8
Fox, J., Weisberg, S., Adler, D., Bates, D., Baud-Bovy, G., Ellison, S., et al (2012). Package “car.” Vienna: R Foundation for Statistical Computing. Available online at: https://cran.microsoft.com/snapshot/2017-06-17/web/packages/car/car.pdf (accessed September 03, 2020).
Fritz, M., and Berger, P. D. (2015). Chapter 10 - can you relate in multiple ways? Multiple linear regression and stepwise regression. Improving the User Experience Through Practical Data Analytics. Boston, MA: Morgan Kaufmann. p. 239–269. doi: 10.1016/B978-0-12-800635-1.00010-0
Gowda, P. H., Prasad, P. V., Angadi, S. V., Rangappa, U. M., and Wagle, P. (2015). Finger millet: an alternative crop for the southern high plains. Am. J. Plant Sci. 6:2686. doi: 10.4236/ajps.2015.616270
Hansen, P. M., and Schjoerring, J. K. (2003). Reflectance measurement of canopy biomass and nitrogen status in wheat crops using normalized difference vegetation indices and partial least squares regression. Remote Sens. Environ. 86, 542–553. doi: 10.1016/S0034-4257(03)00131-7
Hatfield, J. L., and Prueger, J. H. (2010). Value of using different vegetative indices to quantify agricultural crop characteristics at different growth stages under varying management practices. Remote Sens. 2, 562–578. doi: 10.3390/rs2020562
Hatfield, J. L., Prueger, J. H., Sauer, T. J., Dold, C., O'Brien, P., and Wacha, K. (2019). Applications of vegetative indices from remote sensing to agriculture: past and future. Inventions. 4:71. doi: 10.3390/inventions4040071
Hunsaker, D. J., Pinter, P. J. Jr, Barnes, E. M., and Kimball, B. A. (2003). Estimating cotton evapotranspiration crop coefficientswith a multispectral vegetation index. Irrigation Sci. 22, 95–104. doi: 10.1007/s00271-003-0074-6
Jain, N., Ray, S. S., Singh, J., and Panigrahy, S. (2007). Use of hyperspectral data to assess the effects of different nitrogen applications on a potato crop. Precis. Agric. 8, 225–239. doi: 10.1007/s11119-007-9042-0
Jiang, Z., Huete, A. R., Didan, K., and Miura, T. (2008). Development of a two-band enhanced vegetation index without a blue band. Remote Sens. Environ. 112, 3833–3845. doi: 10.1016/j.rse.2008.06.006
Jordan, C. F. (1969). Derivation of leaf area index from quality of light on the forest floor. Ecology 50, 663–666. doi: 10.2307/1936256
Kang, Y., Özdogan, M., Zipper, S. C., Román, M. O., Walker, J., Hong, S. Y., et al. (2016). How universal is the relationship between remotely sensed vegetation indices and crop leaf area index? A global assessment. Remote Sens. 8:597. doi: 10.3390/rs8070597
Kawamura, K., Akiyama, T., Yokota, H.-O., Tsutsumi, M., Yasuda, T., Watanabe, O., et al. (2005). Quantifying grazing intensities using geographic information systems and satellite remote sensing in the Xilingol steppe region, Inner Mongolia, China. Agric. Ecosys. Environ. 107, 83–93. doi: 10.1016/j.agee.2004.09.008
Kawamura, K., Ikeura, H., Phongchanmaixay, S., and Khanthavong, P. (2018). Canopy hyperspectral sensing of paddy fields at the booting stage and PLSL regression can assess grain yield. Remote Sens. 10:1249. doi: 10.3390/rs10081249
Kawamura, K., Watanabe, N., Sakanoue, S., and Inoue, Y. (2008). Estimating forage biomass and quality in a mixed sown pasture based on partial least squares regression with waveband selection. Grassl. Sci. 54, 131–145. doi: 10.1111/j.1744-697X.2008.00116.x
Kuhn, M. (2008). Building predictive models in R using the caret package. J. Stat. Softw. 28, 1–26. doi: 10.18637/jss.v028.i05
le Maire, G., Francois, C., and Dufrene, E. (2004). Toward universal broad leaf chlorophyll indices using PROSPECT simulated database and hyperspectral reflectance measurements. Remote Sens. Environ. 89, 1–28. doi: 10.1016/j.rse.2003.09.004
Li, F., Mistele, B., Hu, Y., Chen, X., and Schmidhalter, U. (2014). Reflectance estimation of canopy nitrogen content in winter wheat using optimised hyperspectral spectral indices and partial least squares regression. Eur. J. Agron. 52, 198–209. doi: 10.1016/j.eja.2013.09.006
Muharam, F., Maas, S., Bronson, K., and Delahunty, T. (2015). Estimating cotton nitrogen nutrition status using leaf greenness and ground cover information. Remote Sens. 7, 7007–7028. doi: 10.3390/rs70607007
Nguyen, H. T., and Lee, B.-W. (2006). Assessment of rice leaf growth and nitrogen status by hyperspectral canopy reflectance and partial least square regression. Eur. J. Agron. 24, 349–356. doi: 10.1016/j.eja.2006.01.001
Nguy-Robertson, A., Gitelson, A., Peng, Y., Viña, A., Arkebauer, T., and Rundquist, D. (2012). Green leaf area index estimation in maize and soybean: combining vegetation indices to achieve maximal sensitivity. Agronomy J. 104, 1336–1347. doi: 10.2134/agronj2012.0065
Patrignani, A., and Ochsner, T. E. (2015). Canopeo: a powerful new tool for measuring fractional green canopy cover. Agronomy J. 107, 2312–2320. doi: 10.2134/agronj15.0150
Payero, J. O., Neale, C. M. U., and Wright, J. L. (2004). Comparison of eleven vegetation indices for estimating plant height of alfalfa and grass. Appl. Eng. Agric. 20:385. doi: 10.13031/2013.16057
Peñuelas, J., Baret, F., and Filella, I. (1995). Semi-empirical indices to asses carotenoids/chlorophyll a ration from leaf spectral reflectance. Photosynthetica. 31, 221–230.
Prey, L., and Schmidhalter, U. (2019). Temporal and spectral optimization of vegetation indices for estimating grain nitrogen uptake and late-seasonal nitrogen traits in wheat. Sensors 19:4640. doi: 10.3390/s19214640
Qi, J., Chehbouni, A., Huete, A. R., Kerr, Y. H., and Sorooshian, S. (1994). A modified soil adjusted vegetation index (MSAVI). Remote Sens. Environ. 48, 119–126. doi: 10.1016/0034-4257(94)90134-1
Rondeaux, G., Steven, M., and Baret, F. (1996). Optimization of soil-adjusted vegetation indices. Remote Sens. Environ. 55, 95–107. doi: 10.1016/0034-4257(95)00186-7
Rouse, J. W., Haas, R. H., Schell, J. A., Deering, D. W., and Harlan, J. C. (1974). Monitoring the vernal advancements and retrogradation of natural vegetation (NASA/GSFC final report). Greenbelt, MD: NASA/GSFC. p. 371.
Sahoo, R. N., Ray, S., and Manjunath, K. (2015). Hyperspectral remote sensing of agriculture. Curr. Sci. 108, 848–859. Available online at: https://www.jstor.org/stable/24216514
Savitzky, A., and Golay, M. J. E. (1964). Smoothing and differentiation of data by simplified least squares procedures. Anal. Chem. 36, 1627–1639. doi: 10.1021/ac60214a047
Singh, P., and Raghuvanshi, R. S. (2012). Finger millet for food and nutritional security. Afr. J. Food Sci. 6, 77–84. doi: 10.5897/AJFSX10.010
Sumathi, P., Joel, A. J., and Muralidharan, V. (2005). Combining ability and heterosis for grain yield and its component traits in finger millet under irrigated conditions. Int. Sorghum Millets Newslett. 46, 92–95. Available online at: http://oar.icrisat.org/1192/ (accessed September 03, 2020).
Tan, C. W., Zhang, P. P., Zhou, X. X., Wang, Z. X., Xu, Z. Q., Mao, W., et al. (2020). Quantitative monitoring of leaf area index in wheat of different plant types by integrating NDVI and Beer-Lambert law. Sci. Rep. 10:929. doi: 10.1038/s41598-020-57750-z
Thenkabail, P. S., Smith, R. B., and De Pauw, E. (2000). Hyperspectral vegetation indices and their relationships with agricultural crop characteristics. Remote Sens. Environ. 71, 158–182. doi: 10.1016/S0034-4257(99)00067-X
Thenkabail, P. S., Smith, R. B., and De Pauw, E. (2002). Evaluation of narrowband and broadband vegetation indices for determining optimal hyperspectral wavebands for agricultural crop characterization. Photogramm. Eng. Remote Sensing. 68, 607–622.
Tong, X., Duan, L., Liu, T., and Singh, V. P. (2019). Combined use of in situ hyperspectral vegetation indices for estimating pasture biomass at peak productive period for harvest decision. Precis. Agric. 20, 477–495. doi: 10.1007/s11119-018-9592-3
Upadhyaya, H., Sarma, N., Ravishankar, C., Albrecht, T., Narasimhudu, Y., Singh, S., et al. (2010). Developing a mini-core collection in finger millet using multilocation data. Crop Sci. 50, 1924–1931. doi: 10.2135/cropsci.2009.11.0689
USDA-NRCS (1999). Soil survey of Canadian County, Oklahoma, supplement manuscript. Available online at: https://www.nrcs.usda.gov/Internet/FSE_MANUSCRIPTS/oklahoma/OK017/0/Canadian_OK.pdf (accessed September 03, 2020).
Viña, A., Gitelson, A. A., Nguy-Robertson, A. L., and Peng, Y. (2011). Comparison of different vegetation indices for the remote assessment of green leaf area index of crops. Remote Sens. Environ. 115, 3468–3478. doi: 10.1016/j.rse.2011.08.010
Wang, F. M., Huang, J. F., and Wang, X. Z. (2008). Identification of optimal hyperspectral bands for estimation of rice biophysical parameters. J. Integr. Plant Biol. 50, 291–299. doi: 10.1111/j.1744-7909.2007.00619.x
Wu, Z., and Yu, L. (2016). Seasonal prediction of the East Asian summer monsoon with a partial-least square model. Clim. Dyn. 46, 3067–3078. doi: 10.1007/s00382-015-2753-4
Xue, J., and Su, B. (2017). Significant remote sensing vegetation indices: a review of developments and applications. J. Sens. 1353691. doi: 10.1155/2017/1353691
Yue, J., Yang, G., Li, C., Li, Z., Wang, Y., Feng, H., et al. (2017). Estimation of winter wheat above-ground biomass using unmanned aerial vehicle-based snapshot hyperspectral sensor and crop height improved models. Remote Sens. 9:708. doi: 10.3390/rs9070708
Zarco-Tejada, P. J., Berjón, A., López-Lozano, R., Miller, J. R., Martín, P., Cachorro, V., et al. (2005). Assessing vineyard condition with hyperspectral indices: leaf and canopy reflectance simulation in a row-structured discontinuous canopy. Remote Sens. Environ. 99, 271–287. doi: 10.1016/j.rse.2005.09.002
Zhang, Z. (2016). Variable selection with stepwise and best subset approaches. Ann. Transl. Med. 4:136. doi: 10.21037/atm.2016.03.35
Zhao, B., Duan, A., Ata-Ul-Karim, S. T., Liu, Z., Chen, Z., Gong, Z., et al. (2018). Exploring new spectral bands and vegetation indices for estimating nitrogen nutrition index of summer maize. Eur. J. Agron. 93, 113–125. doi: 10.1016/j.eja.2017.12.006
Zhao, D., Huang, L., Li, J., and Qi, J. (2007b). A comparative analysis of broadband and narrowband derived vegetation indices in predicting LAI and CCD of a cotton canopy. ISPRS J. Photogramm. Remote Sens. 62, 25–33. doi: 10.1016/j.isprsjprs.2007.01.003
Zhao, D., Reddy, K. R., Kakani, V. G., Read, J. J., and Koti, S. (2007a). Canopy reflectance in cotton for growth assessment and lint yield prediction. Eur. J. Agron. 26, 335–344. doi: 10.1016/j.eja.2006.12.001
Zhao, D., Reddy, K. R., Kakani, V. G., and Reddy, V. (2005). Nitrogen deficiency effects on plant growth, leaf photosynthesis, and hyperspectral reflectance properties of sorghum. Eur. J. Agron. 22, 391–403. doi: 10.1016/j.eja.2004.06.005
Keywords: waveband selection, vegetation indices, remote sensing, landsat- 8, sentinel-2, Eleusine coracana
Citation: Baath GS, Flynn KC, Gowda PH, Kakani VG and Northup BK (2021) Detecting Biophysical Characteristics and Nitrogen Status of Finger Millet at Hyperspectral and Multispectral Resolutions. Front. Agron. 2:604598. doi: 10.3389/fagro.2020.604598
Received: 09 September 2020; Accepted: 22 December 2020;
Published: 20 January 2021.
Edited by:
Andrews Opoku, Kwame Nkrumah University of Science and Technology, GhanaReviewed by:
Anket Sharma, Zhejiang Agriculture and Forestry University, ChinaYaosheng Wang, Chinese Academy of Agricultural Sciences, China
Copyright © 2021 Baath, Flynn, Gowda, Kakani and Northup. This is an open-access article distributed under the terms of the Creative Commons Attribution License (CC BY). The use, distribution or reproduction in other forums is permitted, provided the original author(s) and the copyright owner(s) are credited and that the original publication in this journal is cited, in accordance with accepted academic practice. No use, distribution or reproduction is permitted which does not comply with these terms.
*Correspondence: Gurjinder S. Baath, Z2JhYXRoQG9rc3RhdGUuZWR1