 Zhongyun Huang
 Jorge Andres Rodriguez2
 Ana L. Caicedo
- 1Department of Biology, University of Massachusetts, Amherst, MA, United States
- 2Departamento de Agronomía, Universidad Nacional de Colombia, Bogotá, Colombia
Weedy rice (Oryza spp.) has successfully adapted to invasion of cultivated rice (O. sativa L.) fields by being a strong competitor from the early vegetative growth stages to crop harvest. While seed shattering and seed dormancy have been shown to contribute to competitiveness at the reproductive stage, much less is known about the traits that could contribute to weedy rice adaptation at the vegetative stage. We examined several growth and physiological traits in five different weedy rice lineages with different ancestral origins, and found that no single vegetative phenotype characterizes all weedy rice. Divergence in growth and physiological traits between weedy rice groups and their putative cultivated ancestors has been limited, suggesting that altered vegetative traits have not been a common path to weed adaptation. There is a lack of convergence in patterns of gene expression in two independent weedy rice lineages, suggesting that there are few shared genetic mechanisms in the evolution of vegetative traits. We conclude that it must not be assumed that all weedy rice groups necessarily have altered vegetative growth or physiological mechanisms compared to their ancestors, that facilitate their invasion of crop fields.
Introduction
Agricultural weeds are plants adapted to infest crop fields and reduce agricultural production. The adverse effect of agricultural weeds stems from their competitiveness, which decreases crop yields. Competitiveness refers to the ability of an organism to reduce the fitness of another organism through its presence. A plant can be competitive by having an efficient reproductive strategy, capturing or using resources more efficiently (Radosevich et al., 1997), by having improved tolerance to abiotic stress (Nadir et al., 2017), or by having improved resistance to local pathogens and/or herbivores (Jia and Gealy, 2018). Understanding how competitiveness evolves is important for understanding how noxious agricultural weeds can be curtailed.
Weedy rice (Oryza spp.), a type of weed that infests cultivated rice (O. sativa) fields throughout the world, is a strong competitor of cultivated rice from the early vegetative growth stage to harvest. Competition between weedy rice and cultivars leads to severe rice yield losses (Caton et al., 2003), a serious concern in a crop that serves as the primary calorie source for more than one-third of the world's population (Bhullar and Gruissem, 2013). For example, in Malaysia, 74% of cultivated rice yield can be lost due to infestations of weedy rice (Karim et al., 2004). In the US, weedy rice infestations lead to estimated annual economic losses of over $45 million (Estorninos et al., 2005; Gealy and Yan, 2012). In China, infestations of as few as eight local weedy rice plants per square meter have the capacity to reduce yields of the rice cultivar “Nanjing 44” by almost two-thirds (Xu et al., 2018), although the impact of weedy rice on yield depends, among other factors, on the cultivar it infests (Ottis et al., 2005; Shivrain et al., 2009).
The two most well-studied weedy traits enhancing weedy rice competitiveness occur at the reproductive stage, and are seed shattering and seed dormancy. Seed shattering enables weedy rice seeds to escape the crop harvest and disperse in the field (Fischer et al., 1995; Li et al., 2006), while seed dormancy, and, in particular, mixtures of weedy rice types in fields with varying levels of dormancy, promote persistence of viable weed seeds in the soil through variable periods of time (Gu et al., 2005; Tseng et al., 2013). In contrast, mechanisms contributing to competitiveness at the vegetative growth stage have not been as fully studied in weedy rice, though some traits have been suggested to facilitate weed success. Weedy rice has been reported to grow taller and produce more tillers than cultivated crops in some world areas (Shivrain et al., 2010), and a field competition study in Arkansas in the US suggests that taller weedy rice stature is correlated with stronger negative impact on cultivar performance (Estorninos et al., 2005). There are also studies suggesting that some weedy rice lines may have more efficient nitrogen assimilation than cultivated rice under low nitrogen treatments (Sales et al., 2008), and that nitrogen applications under competition can lead to greater shoot biomass gain in some weedy rice lines compared to cultivated rice (Chauhan and Johnson, 2011). Based on studies such as these, weedy rice in general has been hypothesized to accumulate more nitrogen and to respond to higher nitrogen content better than cultivated rice (Burgos et al., 2006).
Although there is no established list of traits that determines the degree of competitiveness at the vegetative growth stage in weedy rice plants, previous research has shown that several traits in cultivated rice are associated with greater success in the field. For example, hybrid rice varieties in Brazil have higher photosynthetic capacity in terms of sub-stomatal CO2 content, photosynthetic rate and CO2 consumed, which results in higher dry mass accumulation compared to inbred cultivars (Concenco et al., 2011); hybrid varieties in the US have also been documented to produce more tillers and achieve canopy coverage faster, affecting their competitiveness favorably (Ottis et al., 2005). Chlorophyll and carbohydrate (CHOs) content are also often included among the traits affecting cultivated rice competitiveness (He et al., 2006). Because chlorophyll contains nitrogen, its content is a good indicator of nitrogen supply, and assessing chlorophyll content by measuring leaf color has long been used as a non-invasive criteria to determine the health and stress level of plants (Adhikari et al., 1999; Richardson, 2002). CHOs, transported as soluble sugars, and stored as starch constitute the main sources of energy supply and can have an impact on plant vitality (Zhang et al., 2012). Starch content in source leaves, and sucrose content in sink organs have been shown to be important markers of early vigor, defined as biomass accumulation ability during vegetative growth (Rebolledo et al., 2012). Percentage of total nitrogen in leaf tissue is considered a common marker for crop competitiveness. Many agronomic traits (i.e., crop growth rate, leaf area index, plant height, tiller number, spikelets per panicle, grain filling) and physiological processes (i.e., photosynthesis and respiration, nitrogen and carbon metabolism) are negatively affected under nitrogen-deficient conditions (Novoa and Loomis, 1981), and thus high nitrogen content in leaves is considered a sign of overall vitality.
Understanding the bases of weedy rice competitiveness is important not only for curtailing this noxious agricultural weed, but also because some weed competitive traits could be beneficial if transferred to crops. A complicating aspect of weedy rice studies is the independent evolution of multiple weedy rice populations around the world from diverse genetic backgrounds (Reagon et al., 2010; Huang et al., 2017; Vigueira et al., 2019). For example, in the US, two genetically differentiated weedy rice populations, the SH (straw hulled) and the BHA (black-hulled awned), have evolved from the indica and aus rice cultivar groups, respectively (Reagon et al., 2010). In South Asia, the wild ancestor of cultivated rice (Oryza rufipogon/nivara), together with aus and indica cultivars contribute to weedy rice origins, giving rise to wild-like, aus-like, and indica-like weedy rice (Huang et al., 2017). More populations along with other ancestries have been detected in other areas including Southeast Asia, Northeast Asia, China, Europe, Colombia and other parts of South America (Cao et al., 2006; Song et al., 2014; Qiu et al., 2017, 2020; Hoyos et al., 2019; Vigueira et al., 2019). While the reproductive competitiveness traits of seed shattering and seed dormancy have been found in most, if not all, populations of weedy rice worldwide, regardless of ancestral genetic background (Ziska et al., 2015), the shared prevalence of vegetative growth and physiological traits that could enhance competitiveness in independently evolved weed groups and the extent to which weedy rice has diverged from its ancestors for these traits is unknown.
To address this knowledge gap, we have assembled a panel of weedy rice from two geographic areas, the US and South Asia (SA), with three different ancestries, aus, indica and wild rice (O. rufipogon/O. nivara). We have examined various growth-related traits at the vegetative stage and gene expression patterns of these weeds, and, when possible, compared these to representatives of the ancestral groups of each weedy population to determine the degree of change during weed evolution. We note that our trait selection is not exhaustive and that our conclusions are limited to the growth conditions of our study. However, within this framework, we attempt to answer the following three questions: (1) For what traits do weedy rice groups differ from related cultivated rice groups at the vegetative growth stage? (2) What vegetative traits are common to weedy rice groups from different ancestral backgrounds? and (3) What genes are associated with and could mediate patterns of weedy vegetative traits?
Materials and Methods
Rice Plant Growth Conditions
We selected a panel of 14 accessions (genotypes) that included four US weedy rice [two each from the SH and BHA populations as identified by Reagon et al. (2010)], six South Asian weedy rice with aus, indica and wild rice ancestry (O. rufipogon/O. nivara) as identified by Huang et al. (2017), and two each of aus and indica cultivars (Supplementary Table 1). Three plants were grown for each accession in growth chamber conditions in a randomized block design, with an 11 h day length, day temperature of 30°C and night temperature of 27°C. Seeds were sown in 4″ × 4″ × 10″ pots (Treepots, Hummert International Missouri, USA). Rice Cornell mix soil (1 1/2 bales peat, 2 bags medium to course vermiculite, 5 lbs lime and 1 lb 30 z Peter's Unimix Plus III) was used as the starting soil with nitrogen content of 0.9%. A total of 0.26 g granule triple superphosphate (0-45-0) was applied to each plant at the day of sowing. Plants were fertilized weekly with a diluted content for a total of 0.049 g potassium chloride (0-0-62) and 0.03 g iron (Sprint 330) per plant before harvest. 0.337 g of total urea (converted to 150 kg N ha−1 content) per plant was applied with half of the amount at 15 days after emergence (DAE) and the other half at 37 DAE.
Plant Growth and Physiological Trait Measurements
For all plants, height, and chlorophyll status were measured at 10, 15, 20, 37, and 45 days after emergence (DAE), to capture aspects of plant growth before and after nitrogen application; however, measurements at different stages were highly correlated, so we proceeded only with the measurements at 45 DAE. Height was measured from soil surface to the tip of the longest leaf. SPAD value (Soil and Plant Analyzer Development) was used as an indicator of chlorophyll status, and was measured with the atLEAF+ chlorophyll meter Ver 1.0 (FT Green LLC, Wilmington, DE, USA) on a fully expanded healthy leaf from the main stem. To quantify the major growth period during the vegetative stage, the growth rate measured as centimeters of growth per day calculated between 15 DAE and 45 DAE (Supplementary Table 2).
Vegetative growth, defined as the phases from germination to panicle initiation, are the first phases of rice development. These developmental phases are usually marked as V stages. With V1 defined as when the first complete leaf pushes through the prophyll and forms a collar, and stages starting from V2 defined as the collar formation on leaf n on the main stem (Moldenhauer and Slaton, 2001). In this study, we recorded vegetative development rate as the days from emergence to different V stages. We recorded V1 and V8 as the initial and final vegetative development rate (Supplementary Table 2).
All plants were harvested at 55 DAE. Upon harvest, the second youngest fully expanded leaf on the main stem was cut fresh for chlorophyll content measurement, and the second youngest fully expanded leaf on a side tiller was collected for soluble and storage carbohydrate content measurements. The rest of the above ground plant tissue was collected and dried in an 80°C oven and dry biomass was measured 7 days after drying. One gram of ground dried plant tissue from each plant was sent to the University of Massachusetts soil and plant tissue testing laboratory for total nitrogen percentage test with catalytic combustion method (Pt/Al2O3) (Supplementary Table 2). Total nitrogen percentage in leaf tissue shows the amount of nitrogen in all formats including, ammonia, organic and reduced nitrogen, nitrates and nitrites (Ranker, 1925), remaining in plants.
Chlorophyll content was measured according to the protocol described by Inskeep and Bloom (Inskeep and Bloom, 1985), by immersing weighed fresh leaf tissue in DMF for 24 h at 4°C in dark, and then measuring A664.5 and A657 with a spectrophotometer (Supplementary Table 2). Soluble carbohydrates were extracted by immersing ~25 mg of dried and ground leaf tissue into 2 ml of water, followed by overnight shaking in an 80°C incubator. D-glucose, D-fructose and sucrose contents in supernatant were measured by Sucrose/D-Glucose/D-Fructose kit (catalog# 10716260035) (R-Biopharm AG, Darmstadt, Germany) (Supplementary Table 2). Starch was extracted by immersing ~50 mg dried and ground leaf tissue into HCl (8M) and DMSO, incubating the mixture at 60°C for 60 min, adding 5 ml redistilled water, and then adjusting the pH value of the liquid to 4 or 5 with NaOH (5M). Starch content in the supernatant was measured by Starch kit (catalog# 10207748035) (R-Biopharm AG, Darmstadt, Germany) (Supplementary Table 2).
Photosynthesis Measurements
Photosynthesis (CO2 update, μmol m−2 s−1) was measured on two different days, 47 and 55 days after sowing, before any destructive sampling for other analysis. Plants measured were in development stages ranging from V8 to V10 (a few plants had already reached flowering and the vegetative growth had terminated). An infrared gas exchange analyzer (LiCor 6400; LiCor Inc., Lincoln, NE) was used for measurements. Photosynthesis (A), transpiration rate (E) and stomatal conductance (gs) were measured simultaneously (Long and Bernacchi, 2003). Measurements with a relative humidity of over 55%, and stomatal conductance between 0.30 and 0.65 were considered effective. We used a 2 cm wide attachment chamber, and completely covered chamber space with the second and fourth youngest leaves on the main stem.
Phenotypic Data Analysis
We included the following physiological traits in the linear mixed model analysis: glucose, fructose, sucrose, total sugar, starch, SPAD at 45 DAE, chlorophyll concentration, height at 45 DAE, growth rate, V1, V8, dry biomass, total nitrogen percentage and photosynthesis rate. We performed linear mixed model fit of maximum likelihood (lmerMod) with the formula “trait ~ ancestry_group + Oryza_type_group + (1 | genotype)” with the “lme4” package in R (R Core Team, 2014). When assessing fixed effects of group combinations in terms of each trait, we looked at the t-values against the baseline. t-values in linear mixed models are the standardized parameters [ß/SE(ß)] (Gałecki and Burzykowski, 2013).
We also performed pairwise comparisons between weeds and their crop ancestors. Due to the small sample size within each weed and ancestor group, the measurements for traits do not follow normal distribution. We thus performed Wilcoxon rank sum test to determine the significance of differences for weed-cultivar pairs. We made the following four weed-crop pairs, one for US SH weeds with indica ancestry (rr01, rr09) vs. indica cultivars (sin11, sin31), one for US BHA weeds with aus ancestry (rr05, rr20) vs. aus cultivars (sau71, sau76), one for South Asian indica ancestry weeds (arr29, arr74) vs. indica cultivars (sin11, sin31), and the last one for South Asian aus ancestry weeds (arr38, arr54) vs. aus cultivars (sau71, sau76).
RNA Extraction and Library Preparation
Due to the limitation of leaf tissue available in the physiology panel, we re-planted a subset of the panel using the same growth chamber conditions and nutrition treatment on July, 1st, 2015, and harvested the third and fourth fully expanded leaf from the top at 55 DAE for RNA-seq sampling. We picked four accessions to re-plant with three replicates each, including one indica cultivar (sin11), one US weed with indica ancestry that belongs to the group SH (rr09), one aus cultivar (sau76) and one US weed with aus ancestry that belongs to the group BHA (rr20). Collected leaf tissue was frozen at −80°C and ground with mortar and pestles. A Qiagen RNeasy Plant Mini Kit (Valencia, CA) was used to extract RNA. A Bioanalyzer 2100 (Agilent Technologies, Inc.) was used to qualify and quantify RNA samples. Only RNA samples with RNA Integrity Number (RIN) > 7.5 were used for library preparation. Libraries (a total of 12) were constructed with NEBNext mRNA Library Prep Master Mix Set for Illumina kit (New England BioLabs Inc.). Total RNA was fragmented into smaller pieces, and then synthesized into the first and second strand of cDNA with reverse transcriptase and random primers. NEBNext singleplex Oligos for Illumina as indexes of each library were added during the preparation (New England BioLabs Inc.). A Qubit fluorometer and Qubit dsDNA BR (broad-range) Assay Kit (Thermo Fisher Scientific, MA, USA) were used to quantify cDNA library. High quality cDNA libraries were normalized with 0.1 × TE to 4 nM content before sequencing.
Next Generation Sequencing and RNA-seq Data Analysis
We used two Illumina NextSeq500 Mid Output Kits (150 cycles) for pair-end sequencing of six libraries on each flowcell in the Genome Resource Lab at the University of Massachusetts Amherst. The quality of raw sequencing reads was investigated with FastQC program (http://www.bioinformatics.babraham.ac.uk/projects/fastqc/). For sequences of samples with low per base sequence quality, FASTQ Groomer in Galaxy (https://usegalaxy.org/) was used to convert FASTQ files to FASTSANGER files and Trimmomatic in Galaxy was used to trim both forward and reverse sequences. Sequences of all samples were then concatenated with Galaxy.
We used the Tuxedo method (Trapnell et al., 2012) in the CyVerse Discovery Environment (http://www.cyverse.org/discovery-environment) for RNA-seq data analysis. Reads were mapped to the rice reference genome MSU7 (http://rice.plantbiology.msu.edu) with TopHat version 2.0.9 (Trapnell et al., 2009) with the reference genome annotation file using minimum intron length as 30, mate-pair inner distance as 100 and other settings as default. The aligned reads were assembled and transcript expression was quantified using FPKM (Fragments Per Kilobase of transcript per Million fragments mapped) by Cufflinks2 version 2.0.2 (Trapnell et al., 2010). We obtained a rice reference genome annotation file in gtf format from MSU7 (http://rice.plantbiology.msu.edu/annotation_pseudo_current.shtml), and a rice rRNA mask file in gff3 format from RAP-DB (http://rapdb.dna.affrc.go.jp/download/irgsp1.html). The rRNA mask file was then converted to gtf format using the gffread tool in Galaxy. Cuffmerge was used to create one gtf file of each sample from the three replicates. We then used Cuffdiff2 to detect differential expression of the four following sets of comparisons: (i) sin11 vs. rr09 (indica vs. SH weed), (ii) sau76 vs. rr20 (aus vs. BHA weed), (iii) sin11 vs. sau76 (indica vs. aus) and (iv) rr09 vs. rr20 (SH weed vs. BHA weed). We used two housekeeping genes, UBQ5 (LOC_Os01g22490) and eEF-1α (LOC_Os03g08020), which have been shown to be the most stably expressed across rice genotypes, phases of development and different environment conditions, for normalization of expression data among genotypes (Jain et al., 2006). Transcripts and genes in the Cuffdiff2 results with FDR <0.01 and abs(log2 FC)>1 were considered to be significantly differentially expressed and considered for further analysis. For each set of comparisons, we also considered as differentially expressed for genes that are not expressed in one genotype, but expressed with >1 FPKM in the other genotype.
In this project, we only take into consideration of transcripts and isoforms already annotated by the MSU7 (http://rice.plantbiology.msu.edu/) database. We focused on differential expression tests from the Cuffdiff2 outputs which test difference in the summed FPKM of transcripts sharing the same gene IDs.
GOterm Analysis and GOSlim Retrieval
We performed gene ontology (GO) term enrichment with agriGO (Du et al., 2010), using the Oryza sativa MSU7.1 non-TE genome as background. Significance was evaluated using a hypergeometric statistical test, with a Hochberg FDR multiple correction and a significant cutoff of 0.05; the minimum number of mapping entries was set to two. We used the Rice Genome Annotation Project database (http://rice.plantbiology.msu.edu/) for putative function and GOSlim (Harris et al., 2004) assignments retrieval for each gene of interest.
Analyzing Metabolic Pathways of Differentially Expressed Genes With MapMan
We used MapMan (version 3.5.1) (http://MapMan.gabipd.org), a software developed to annotate plant-specific biological processes, to analyze expression data at the pathway level. Oryza MSU7 annotation was used as the reference mapping file. Fold change data from the four comparisons, sin11 (indica) vs. rr09 (SH), sau76 (aus) vs. rr20 (BHA), rr09 (SH) vs. rr20 (BHA), and sin11 (indica) vs. sau76 (aus) were used for MapMan. For genes that expressed in only one genotype, we arbitrarily assigned 15 or−15 as log2(fold_change). We used a Benjamini Hochberg correction of multiple comparisons for the Wilcoxon rank sum test report of bins of interest.
Results
Vegetative Growth Differences Among Ancestry and Oryza-Type Groups
We selected a panel of 14 accessions (genotypes) that included four US weedy rice (two each from the SH and BHA populations, which have indica and aus ancestry, respectively), six South Asian weedy rice with aus (two), indica (two) and wild rice (two) ancestry as identified by Huang et al. (2017), and two each of aus and indica cultivars (Supplementary Table 1). Accessions were selected to be genetically representative of their respective groups based on prior studies (Reagon et al., 2010; Huang et al., 2017). Wild rice was not grown as part of the panel due to the lack of sufficient available seeds and greater uncertainty about the wild subpopulation giving rise to these South Asian wild-like weeds (Huang et al., 2017). Each of the chosen weed groups represents an independent evolutionary origin. Three replicates were grown per accession in a growth chamber in a randomized block design, and with standard nitrogen application (see methods) that would mimic the optimal nitrogen condition found in crop fields. Multiple growth and physiological traits were measured at several developmental timepoints as shown in Figure 1 for all samples (Supplementary Tables 2, 3). Chosen traits represent either plant growth or development parameters, or traits that have been associated with increased competitiveness in weedy or cultivated rice, as detailed in our introduction.
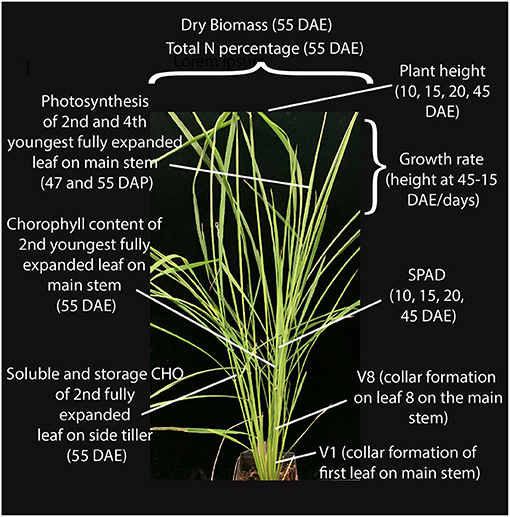
Figure 1. Growth and physiological traits measured at different stages of vegetative growth in weedy rice.
We first determined that single traits measured at multiple time points (10, 15, 20, 37, and 45 days after emergence) presented the same trends across genotypes (Supplementary Table 2). Thus, for plant height, growth rate, and Soil and Plant Analyzer Development (SPAD) index we proceeded only with measurements from 45 days after emergence (DAE). We applied linear mixed modeling to estimate the variances for the two fixed effect grouping factors: ancestry, which could be aus, indica, or wild, and Oryza-type, which could be either cultivated rice, US weedy rice, or SA weedy rice (Table 1, Supplementary Table 1). Since there are no cultivars with wild ancestry, and no US weeds with wild ancestry, two cells of the 3 × 3 table were considered empty (Table 1). The genotypes within each cell were considered random draws from the collection of all possible genotypes in that category, and hence random effects. Aus was set as the baseline to compare with indica and wild rice for the ancestry grouping, and cultivar as a baseline for Oryza-type (Tables 1, 2). We considered t-values > 2 or smaller than−2 as significant (Table 2) (Luke, 2017).
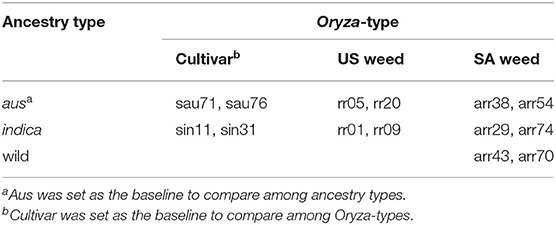
Table 1. Oryza genotypes included in the study and their ancestry and Oryza-type groupings.
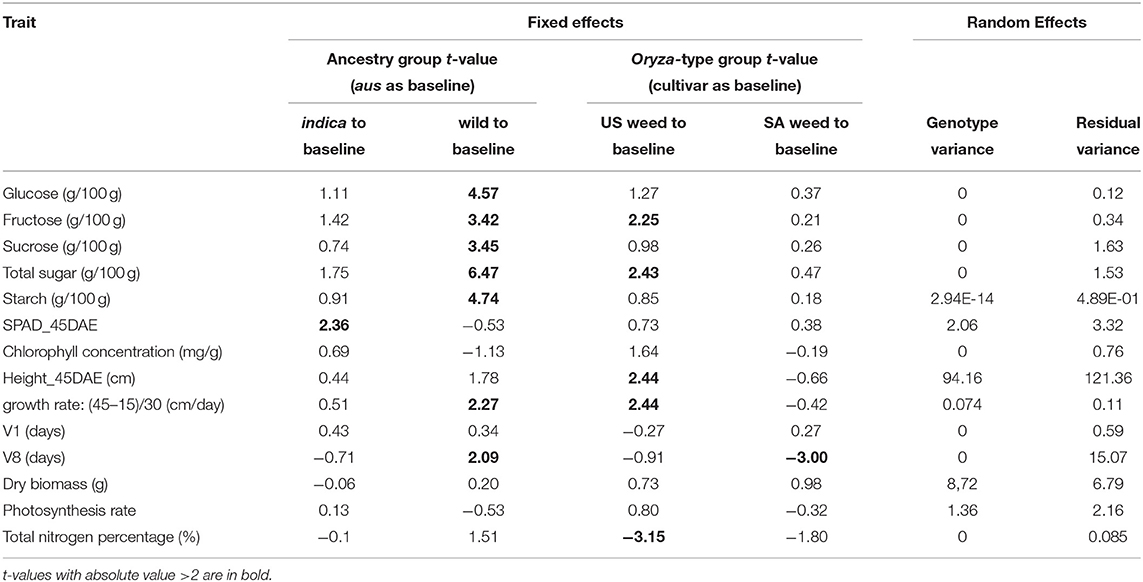
Table 2. Linear mixed model analysis for genotypes from different ancestry and Oryza groups.
For the five carbohydrate (CHO) content traits examined (glucose, fructose, sucrose, total soluble sugar and starch), the wild ancestry group had significantly higher content than the aus baseline (Table 2, Figure 2), while no differences were observed between indica and aus ancestry. Additionally, the US weed Oryza-type group showed significantly higher fructose and total soluble sugar content than the cultivar baseline (Table 2, Figure 2). In contrast, few differences were observed between groups for the two leaf chlorophyll related traits examined, in either of the grouping criteria. The single exception was the indica ancestry group, which displayed significantly higher SPAD at 45 days after emergence (DAE) than the aus baseline (Table 2, Figure 2). We found no correlation between SPAD results and those for chlorophyll or nitrogen content. US weeds had significantly less total nitrogen in leaves than the cultivar baseline (Table 2, Figure 2), though there is a general trend for both weed groups to contain less total N in leaves.
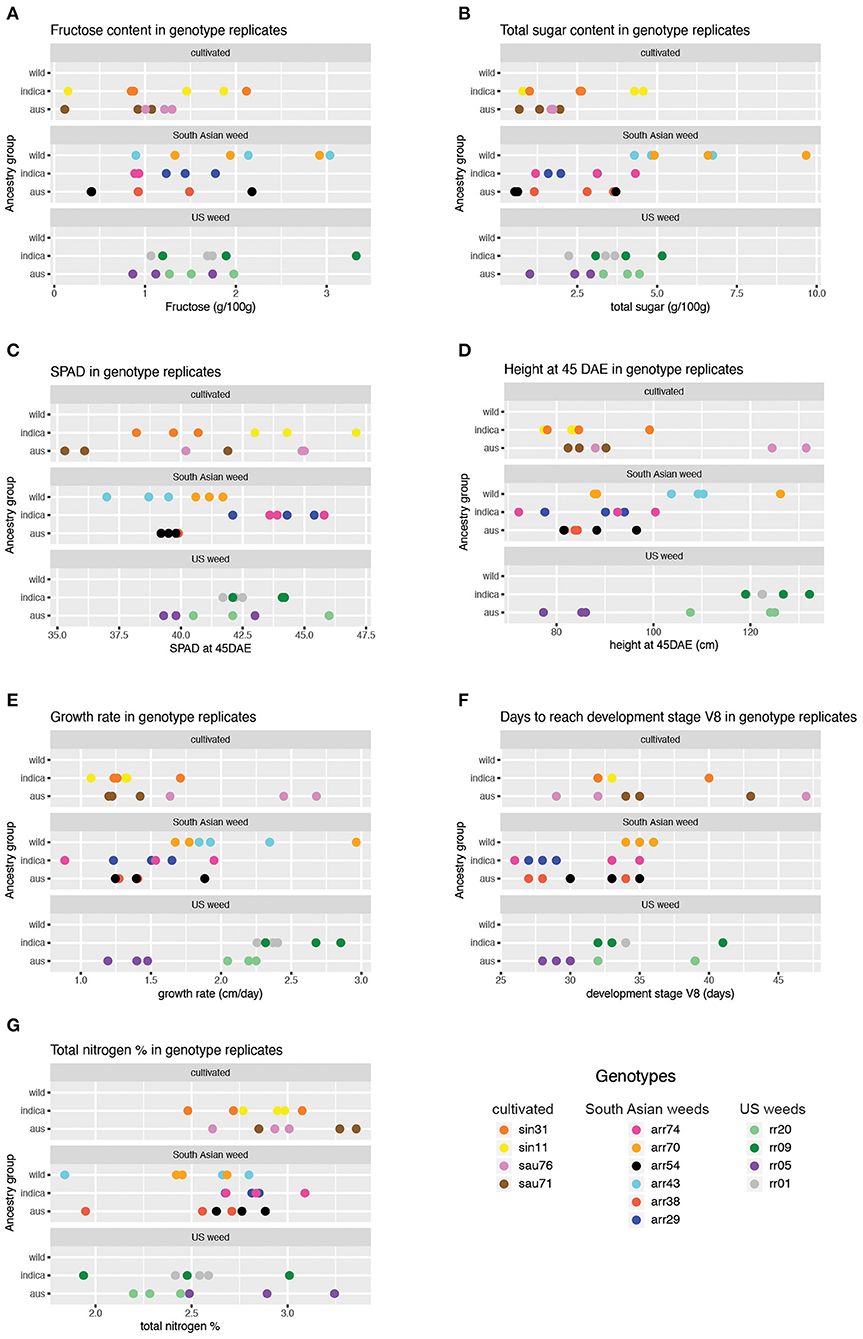
Figure 2. Trait values obtained across genotypes and replicates for phenotypes showing significant results in the mixed model analysis (Table 2). Results for only two of the five sugar traits are shown, given similar results across sugar traits for the wild ancestry group. (A) Fructose content across genotype replicates. (B) Total sugar content across genotype replicates. (C) SPAD at 45 DAE across genotype replicates. (D) Height at 45 DAE across genotype replicates (E). Growth rate across genotype replicates. (F) Days to reach V8 stage across genotype replicates. (G) Total nitrogen percentage across genotype replicates.
A few more differences between groups were evident for growth and developmental traits. Height at 45 DAE and growth rate were both significantly higher in the US weed group than the cultivar baseline, suggesting that weeds in this group grow more and faster during the vegetative stage than their cultivated relatives (Table 2, Figure 2). Additionally, growth rate was higher in the wild ancestry group than the aus baseline. Developmental rate differed among some groups, with plants with wild ancestry taking a longer time to reach the V8 stage (i.e., once collar formation on leaf 8 of the main stem has occurred) than the aus baseline, and South Asian weeds reaching V8 more quickly than cultivars (Table 2, Figure 2), although this latter trend seems to be driven by South Asian weeds with a domesticated background (Figure 2, Supplementary Table 2).
As a general trend we found that for ancestry group, wild ancestry accessions consistently performed better than the baseline in multiple traits including soluble and storage sugars and growth rate, suggesting that plants with wild ancestry tend to have a more optimal usage of the same amount of nutrients during the vegetative growth stage. On the other hand, for Oryza-type group, although US weeds seem to have less above-ground nitrogen than cultivars, they had higher levels of some sugars, were taller than cultivars at 45 DAE, and grew faster. These results suggest that US weeds can reach the same level of plant vigor with less nitrogen allocated to above ground tissues and thus may have higher nitrogen use efficiency (Table 2, Figure 2).
Comparative Transcriptomics of Weed and Crop Vegetative Tissue
We performed RNA sequencing on leaf tissue at the vegetative growth stage of a subset of our panel, including three replicates of one aus (sau76) and one indica (sin11) cultivar, as well as one US SH (rr09) weed and one US BHA (rr20) weed, to identify differentially expressed transcripts between weeds and ancestors that could account for growth trait differences. US weeds showed the most altered trait values compared to cultivars, so RNA-seq was limited to these weeds and their putative ancestors (Supplementary Tables 2, 4).
Total reads from the 12 libraries ranged from 13.3 million to 42.2 million with an average of 30.2 million (Supplementary Table 5). TopHat read alignments ranged from 79 to 96% (Supplementary Table 5). A comparison of expression levels of two major housekeeping genes (UBQ5 and eEF-1α) (Jain et al., 2006) across the four accessions showed high FPKM values with no significant expression differences between samples (Supplementary Table 6), thus, we did not carry out normalization between samples.
We identified differentially expressed (DE) transcripts between each weed and their crop ancestor (BHA weed vs. aus, SH weed vs. indica), between cultivars (aus vs. indica) and between weeds with different ancestries (BHA vs. SH) (Table 3), including transcripts that lacked expression. Fewer transcripts were differentially expressed in the two weed-crop comparisons than in the weed-weed and crop-crop comparisons (Table 3; Supplementary Tables 7–10), consistent with the genetic background shared between weed and crop ancestors in each pair. A total of 73 DE transcripts were shared between the two weed-crop comparisons (Supplementary Table 11); however, 42 of these DE transcripts were shared among all four comparisons (Supplementary Table 12), and, of the remaining 31, none was exclusively to just the two weed-crop comparisons.
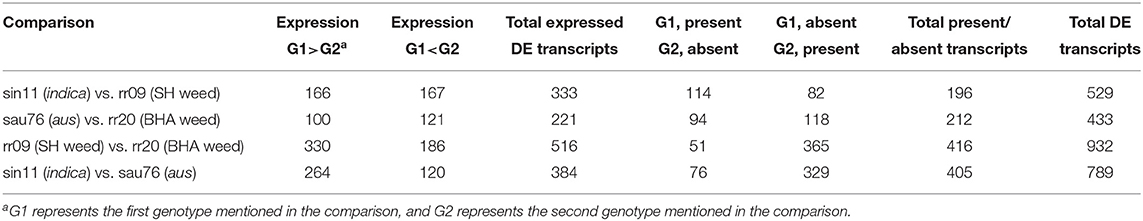
Table 3. Summary of differentially expressed (DE) transcripts for the four RNA-seq comparisons.
We performed gene ontology (GO) term enrichment analysis with agriGO (Du et al., 2010) for DE transcripts in all comparisons (Supplementary Table 13). Both weed-crop comparisons have a very limited number of biological processes (BP) terms significantly enriched (P < 0.05 with FDR correction) in DE transcripts, with the very high level terms “cellular process,” “photosynthesis,” and “metabolic process” shared between the two comparisons. However, no enriched terms were specific to weed-crop comparisons, with all these terms also appearing as enriched in either weed-weed or crop-crop comparisons (Supplementary Table 13).
We also looked at GO terms significantly enriched among DE transcripts that were shared across both weed-crop comparisons, and found much fewer but similar terms to those observed in individual comparisons and in transcripts that were DE in all four comparisons, with “cellular process,” “response to abiotic stimulus,” and “secondary metabolic process” dominating (Supplementary Table 13). We thus conclude that gene expression divergence between weedy rice and their cultivated ancestors occurs for the same general types of biological processes that are likely to change during general lineage divergence, regardless of whether diverging groups have a weedy, or cultivated status.
Metabolism Pathway Analysis of Differentially Expressed Genes
We used MapMan (Thimm et al., 2004) to attain a better understanding of the plant-specific functions of genes significantly differentially expressed between weeds and their crop ancestors, and to determine if any of these genes could explain the growth trait differences we had observed among groups. We also performed MapMan analysis on weed-weed and crop-crop comparisons to better understand the differences among same Oryza-type accessions. Since MapMan only recognizes gene IDs for MSU v7 genome (http://rice.plantbiology.msu.edu/) in the mapping file, we prepared input files with significant expression differences (as identified above) for each gene instead of each transcript. The total number of DE genes underscored, again, the greater expression similarity between weeds and their crop ancestors than between cultivars or weeds from different lineages, with 267 DE genes between SH and indica, 181 DE genes between BHA and aus, 412 DE genes between SH and BHA, and 327 DE genes between indica and aus.
In the SH vs. indica weed-crop comparison, the 267 DE genes mapped to 217 different pathway bins, with some genes mapping to multiple bins and some bins representing child categories of others, so that around 26 higher order pathway categories were represented (Supplementary Table 14; excluding the “not assigned” bins, which in all comparisons constituted the largest category). No bin was significantly overrepresented in this or other comparisons, but together they provide a view of the types of pathways for which gene expression differs in weed-crop, crop-crop, and weed-weed comparisons. As expected, due to the lower number of DE genes, fewer bins were mapped in the BHA weed vs. aus crop comparison (Supplementary Table 14; 154 total bins; 22 higher order pathway categories). Both the weed-weed (245 bins; 25 higher order pathway categories) and the crop-crop (232 bins; 25 higher order pathway categories) comparisons had genes mapping to a greater number of pathway bins, but all comparisons had similar number of higher order pathway categories (Figure 3, Supplementary Table 14). Focusing on these higher level pathway categories, it is apparent that most of the mapped bins appear in all four comparisons, and there are no pathways for which gene expression differences are exclusive solely to weed-crop comparisons (Figure 3).
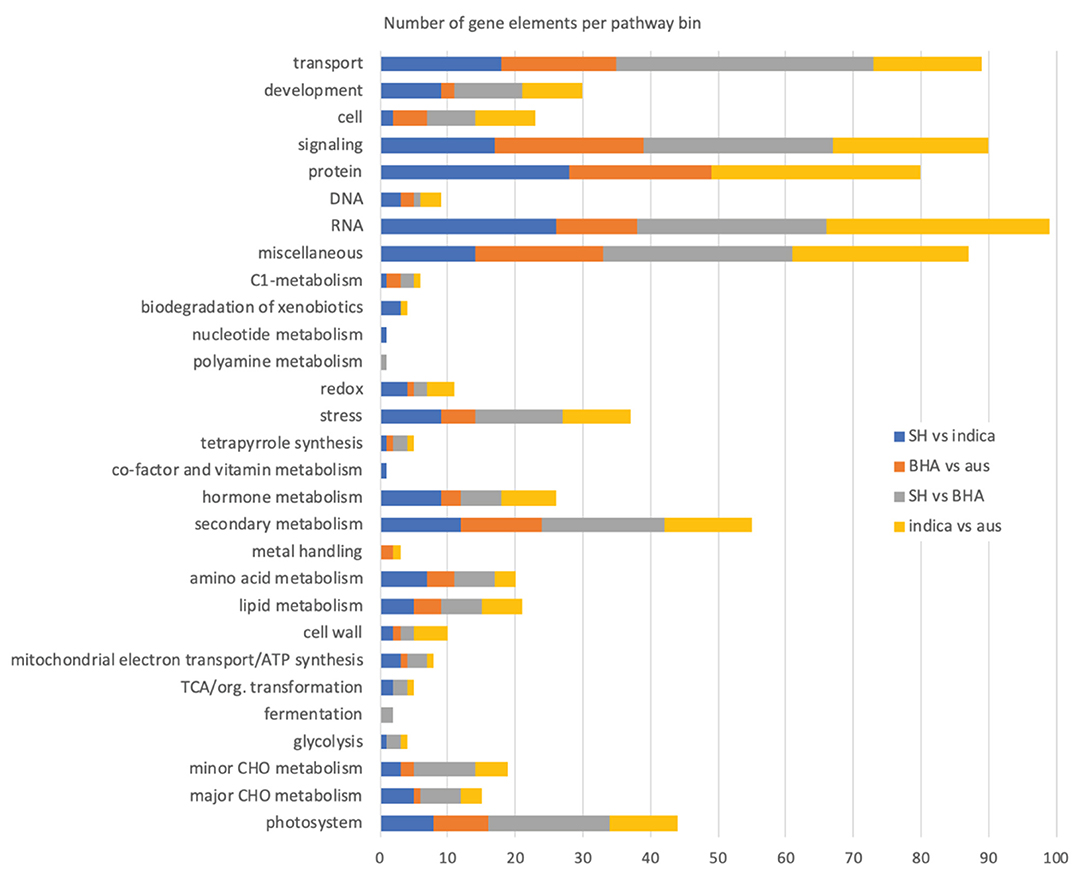
Figure 3. Number of genes mapping to higher order MapMan plant pathway bins in the various weed-crop, crop-crop, and weed-weed comparisons. The “not assigned” pathway category, in all cases the largest category of mapped genes, is not included in the plot.
Despite a lack of exclusivity, we specifically compared the MapMan results of the two weed-crop comparisons to discover pathways or related genes possibly important for weed evolution from crop ancestors. For both weed-crop comparisons, pathways representing a large number of DE genes corresponded to transport, signaling, protein (primarily protein synthesis, degradation, and posttranslational modification), RNA (primarily RNA processing and regulation of transcription), and secondary metabolism (primarily phenlypropanoids and lignin, flavonoids, and isoprenoids) (Supplementary Table 14 and Figure 3). However, the individual DE genes within each of these shared higher level pathway categories generally differed between the two weed-crop comparisons (Supplementary Tables 14, 15). The shared pathway category with the largest number of shared DE genes between the two weed-crop comparisons corresponded to secondary metabolism (Supplementary Table 15). However, for shared DE genes in any category there were no consistent trends in whether genes in weeds or crops were expressed more highly. For example, for the two shared DE genes mapping to photosynthesis pathways (LOC_Os04g59440 and LOC_Os12g19470), both were expressed at higher levels in the SH weed compared to the crop ancestor, but at lower levels in the BHA weed than its crop ancestor (Supplementary Table 15). We conclude that there is no evidence for an expression “syndrome” typical of weedy rice in comparison to its crop ancestors, or, if this exists, it involves the expression of only limited genes.
Associations Between Gene Expression and Phenotypic Differentiation
In our vegetative trait measurements for weedy and cultivated rice, we observed that US weedy rice has lower total nitrogen content than cultivars, higher fructose and total sugar content than cultivars, and faster growth rate and taller height than cultivars (Supplementary Table 2; Supplementary Table 3). We examined our list of differentially expressed transcripts and genes, the MapMan pathways they mapped to, and presumed functions based on literature searches, to identify candidates that could be responsible for the phenotypic differences we observed. Although we acknowledge the potential of annotation bias affecting our identification of interesting loci, we feel it would be remiss to not explore our dataset for potential candidates.
Beginning with nitrogen accumulation, we noted two N-response genes (LOC_Os01g48960 and LOC_Os04g56400) detected in the rr20 (aus-like weed) vs. sau76 (aus) and rr09 (indica-like weed) vs. sin11 (indica) comparisons (Table 4). These two genes fall in the MapMan bins of N-metabolism, ammonia metabolism, glutamate synthase (12.2.1) and glutamine synthase (12.2.2), respectively. They are part of conserved cross-species N-regulated network modules (Obertello et al., 2015). Both of the identified genes, which have higher expression in the weeds, have been implicated in ammonium assimilation and found to be sensitive to N treatments (Obertello et al., 2015) and could play a role in how much N uptake there is in weedy plants.
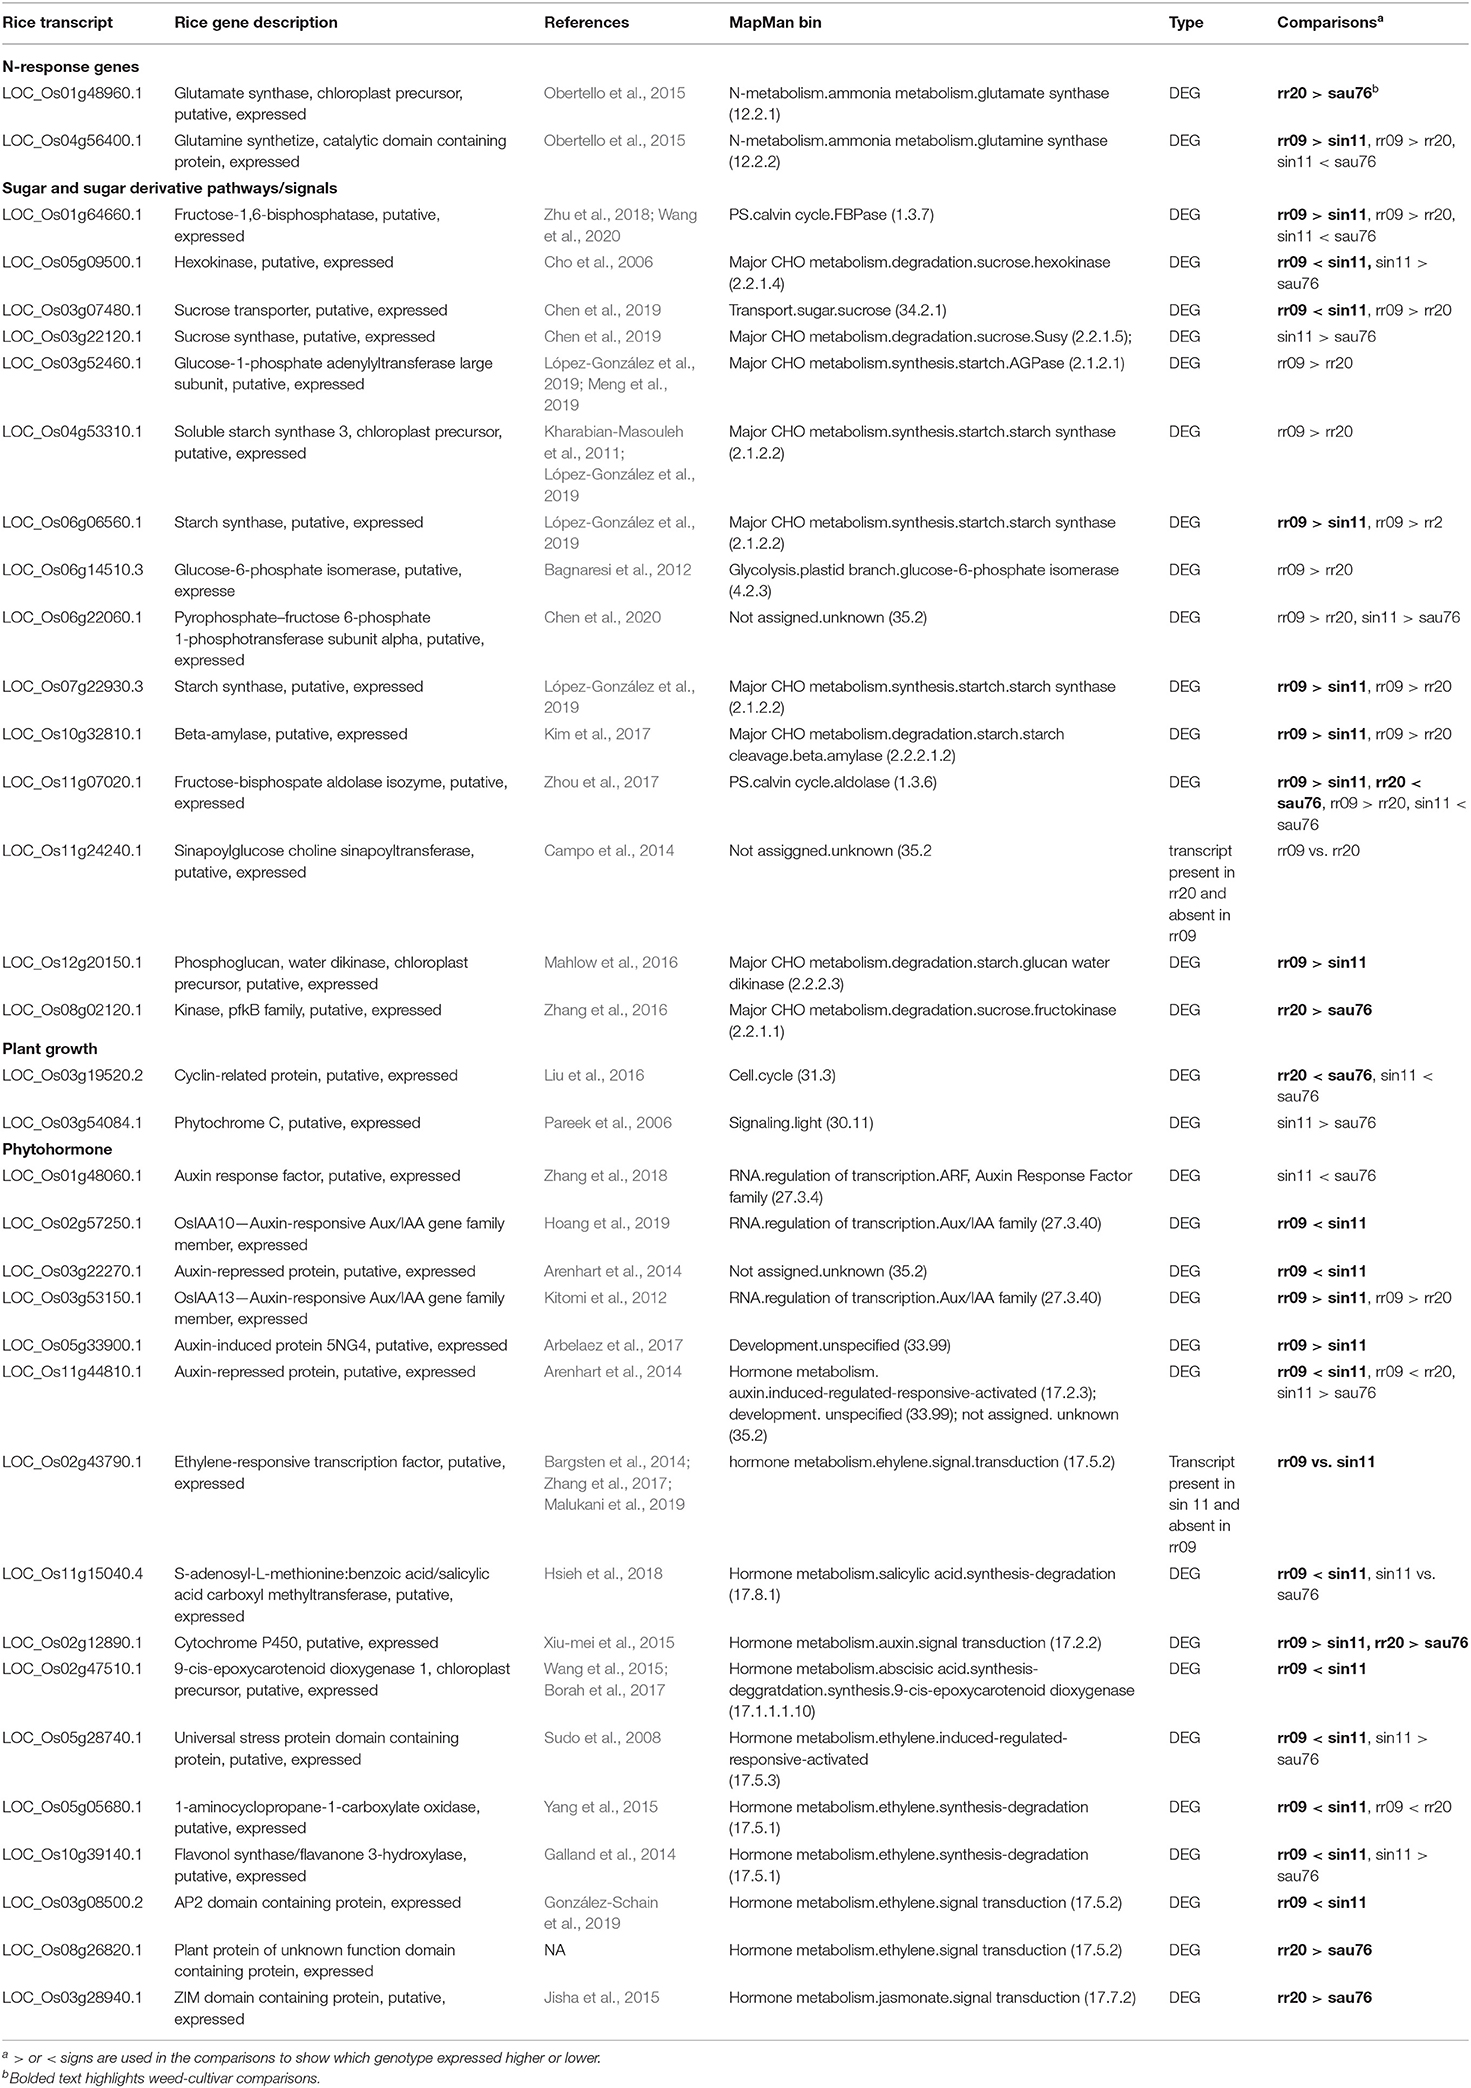
Table 4. Oryza differentially expressed genes with potential associations with the observed phenotypic differentiation.
Multiple sugar and sugar derivative pathways related genes were detected as DE in the two weed-crop comparisons (Table 4), many of these falling within the major and minor CHO metabolism MapMan pathway bins (Supplementary Table 15). The gene, LOC_Os01g64660 (Zhu et al., 2018; Wang et al., 2020), annotated as fructose-1,6-bisphosphatase, could be related to the higher level of fructose in leaf tissue in SH weeds when compared to indica cultivars (Table 2). Several DE genes were also implicated in metabolism of sugar and sugar derivatives (Supplementary Table 15); these include the sucrose hexokinase (LOC_Os05g09500) (Cho et al., 2006), expressed at lower levels in the SH weed than the crop (Table 4, Supplementary Table 15), two starch synthase genes (LOC_Os07g22930 and LOC_Os06g06560) (López-González et al., 2019) expressed more highly in the SH weeds (Table 4, Supplementary Table 15), a starch cleavage gene (LOC_Os10g32810) (Kim et al., 2017) and starch glucan water dikinase gene (LOC_Os12g20150) (Mahlow et al., 2016), expressed more highly in the SH weed (Table 4, Supplementary Tables 14, 15). In contrast, fewer genes obviously involved in sugar metabolism were differentially expressed in the BHA-aus weed-crop comparison (Supplementary Table 15), with only one (LOC_Os08g02120) (Zhang et al., 2016), a sucrose fructokinase, differentially expressed in the whole sucrose-starch pathway (Table 4), even though total sugar and fructose levels in leaves were also highly differentiated in this weed-crop pair.
In our set of samples, faster growth rate and greater height in weeds seemed primarily driven by SH in comparison to indica crops (Figures 1, 2, Supplementary Table 2), and height maybe driven in part by the occurrence of semi-dwarf indica cultivars, of which sin11 is likely one. Determining the type of loci likely to affect growth rate is less straightforward, but phytohormones, including auxin and ethylene, can trigger phytochrome-interacting factors (PIFs) (Leivar and Quail, 2011), which in turn regulate plant growth (Liu et al., 2011; Stewart et al., 2011), making phytohormone-related genes good candidates. Our literature searches implicated several phytohormone genes differentially expressed in SH vs. indica (Table 4), including five auxin related genes (LOC_Os02g57250, LOC_Os03g22270, LOC_Os03g53150, LOC_Os05g33900 and LOC_Os11g44810) (Kitomi et al., 2012; Arenhart et al., 2014; Arbelaez et al., 2017; Hoang et al., 2019), one ethylene gene (LOC_Os02g43790) (Bargsten et al., 2014; Zhang et al., 2017; Malukani et al., 2019), and one salicylic acid gene (LOC_Os11g15040) (Hsieh et al., 2018). Several other DE phytohormone genes were found assigned to the hormone metabolism MapMan bin (Table 4, Supplementary Table 15), including LOC_Os02g12890, a cytochrome P450 gene related to auxin signal transduction (Xiu-mei et al., 2015), LOC_Os02g47510, a gene related to abscisic acid (Wang et al., 2015; Borah et al., 2017) and ethylene related genes (LOC_Os05g28740, LOC_Os05g05680, LOC_Os10g39140 and LOC_Os03g08500) (Sudo et al., 2008; Galland et al., 2014; Yang et al., 2015; González-Schain et al., 2019). We detected fewer growth-related DE genes in the BHA-aus comparison (Table 4, Supplementary Table 15), but note a cyclin related protein gene (LOC_Os03g19520) (Liu et al., 2016), which has been implicated in abaxial-side leaf development, and two hormone metabolism genes (LOC_Os08g26820 and LOC_Os03g28940) (Jisha et al., 2015).
Discussion
Weedy Rice Lineages Have Not Evolved a Single Vegetative Weed Phenotype
Weeds compete for space and nutrients starting early in their vegetative growth stages. Such vegetative competitiveness can be manifested through various traits such as fast growth, increased biomass, better nutrient uptake, and more efficient metabolism. Although weedy rice is often described as being more competitive than cultivated rice, to our knowledge no studies have investigated how weedy rice lineages from different and known genetic backgrounds compare amongst themselves and how they compare with their crop ancestors in terms of vegetative traits that could enhance competitiveness. In an effort to determine how traits at the vegetative stage and possible underlying genes differ between cultivated rice and its related noxious weed, we characterized a panel of weedy and cultivated Oryza from different geographic regions and ancestry (Figure 1). We found much variation among weedy rice groups in how their vegetative traits compared to non-weedy groups, indicating that there is no single vegetative phenotype that characterizes weedy rice.
This variation in traits is evident at various levels. For example, despite some overlap in ancestry, South Asian and US weeds do not show similar trends in vegetative traits when compared to aus and indica cultivars (Table 2 and Figure 2). Additionally, weedy lineages within each world region also show divergence in some traits. For example, US weedy rice grows taller and has a higher growth rate in the vegetative stages we characterized than cultivars we examined (Table 2), however, this trend seems to be driven primarily by SH weeds at this stage (Figure 2). US weeds also contain more fructose and total sugars in leaves, a trend also likely driven by SH weeds (Figure 2). Interestingly, these enhanced growth traits in US weeds occur even while containing less total nitrogen in above ground tissue than cultivars (Table 2, Figure 2), which could indicate more nitrogen use efficiency. Unlike US weeds, SA weeds taken as a whole do not seem to perform differently from cultivars in measured traits, except for a somewhat faster developmental time that seems specific to cultivar-derived weeds (Table 2, Figure 3, Supplementary Table 3). It is possible that the more hand-intensive farming practices in South Asia could select for weedy rice that is less distinguishable from the crop. Overall, however, no single measured trait stands out as indicative of all weedy groups, suggesting that none of the traits we studied are essential for the origin and evolution of all weedy rice lineages.
Although greater nitrogen accumulation has been previously proposed to be a characteristic of weedy rice (Burgos et al., 2006; Sales et al., 2008), our study shows that there is no nitrogen-related phenotype that characterizes all weedy rice in our panel. Nitrogen content differed significantly only between US weeds and cultivars, and, in this case, there was evidence for lesser rather than greater accumulation in weeds (Table 2, Figure 2). Nitrogen accumulation in plants may differ under direct competition conditions (Chauhan and Johnson, 2011), which our plants were not subjected to, or when nitrogen is scarce (Burgos et al., 2006), which may account for different reports of nitrogen content in weedy rice. However, we urge caution in assuming that more efficient nitrogen assimilation is a hallmark adaptive trait in weedy rice, and recommend that this trait needs to be evaluated in each independently evolved weedy rice group. More remarkable than total nitrogen content is the high growth rate exhibited by US weedy rice, despite lower N accumulation.
Among the weedy lineages we studied, weedy rice with primarily wild ancestry is the rarest, having only been detected in South Asia so far (Huang et al., 2017), though wild contributions to weedy rice via hybridization have been detected elsewhere (Vigueira et al., 2019). However, this type of weedy rice was striking in its high levels of CHOs (glucose, fructose, sucrose and starch) in leaf tissue (Table 2) compared to other groups. High fructose and total sugars were also evident for the SH group of US weeds. As CHOs are the major sources of energy supply, high levels could be indicative of higher early vigor in weeds (Zhang et al., 2012). For example, high levels of soluble sugars in corn stalks have been correlated to plant vitality (Mortimore and Ward 1964). In both of these weed groups, the higher CHO content co-occurs with faster growth rate. Various other studies also have reported that sugar levels are a determinant of vegetative growth levels (Deprost et al., 2007; Smeekens et al., 2010; Robaglia et al., 2012), such as longer leaf phenotypes (Hakata et al., 2012), and sugar metabolizing enzymes and sugar transporters have been discovered to interconnect with plant growth (Tiessen and Padilla-Chacon, 2012). Sugar availability in leaf tissue is also a major sensor to regulate cell divisions, a necessary process in plant growth (Osuna et al., 2007; Usadel et al., 2008). Thus, the high levels of sugars in wild-like weeds may represent a near-unique vegetative advantage in this group.
Faster plant growth has long been considered as an important factor of plant competitiveness (Lastdrager et al., 2014), since when competing for scarce resources including nutrients and light, faster growth is beneficial. The fact that this trait was not a universal feature of weedy groups in our study is thus surprising. Likewise, photosynthesis-related traits (SPAD, chlorophyll and photosynthetic rate), thought to enhance growth, did not seem remarkable across weedy rice lineages in this study.
Some important caveats of our study include the small number of genotypes characterized per Oryza and ancestry group, which was due to growth chamber size limitations and the extreme labor-intensiveness of the traits collected. While we worked with accessions typical of their populations based on genetic assessment, more robust conclusions would be obtained with a greater number of samples. Additionally, it should be noted that we focused primarily on traits in weeds and how they compare to their ancestral cultivar lineages, rather than performance under field conditions. Some traits and gene expression patterns could change under field conditions affected by the presence of biotic or abiotic stresses, or under direct competition conditions due to changes in resource distribution. Additionally, under field conditions, weeds and crops will be growing closely, giving rise to possible interactions via allelopathy or rhizospheric microorganisms. It should also be noted that the exact cultivar weedy rice will compete with can vary widely from field to field. SA weeds should most often directly compete with aus and indica cultivars. However, US weeds are most likely to compete with tropical japonica cultivars, a completely different evolutionary lineage, as this is the main group grown in the US. How vegetative traits in SH and BHA weeds compare to tropical japonica is not examined here, but our results suggest that, for most traits we studied, divergence in weeds from ancestral cultivars has been minimal.
Differentially Expressed Genes Between Weedy Rice and Cultivated Ancestors Differ Among Weedy Lineages
The genetic changes that make the transition from cultivated rice, which is under constant human selective pressure, to weedy rice are key to understanding the repeated evolution of this noxious weed. We thus examined patterns of gene expression in US weeds and their cultivated ancestors, and searched for convergence that could possibly indicate common genetic mechanisms in the evolution of weed vegetative competitiveness. Our consistent results showing less expression differences in weed-crop pairs compared to crop-crop or weed-weed pairs indicate that the gene expression divergence needed to evolve from a cultivated plant to an agricultural weed is not as great as that occurring between Oryza accessions of historically diverged lineages. This is evident in the numbers of differentially expressed transcripts (Supplementary Tables 7–10), the number of significantly enriched biological process GO terms (Supplementary Table 13) and overall functional bins with DE genes (Supplementary Table 14). The aus and indica lineages are thought to have diverged 12,000 years ago (Civán et al., 2015; Choi et al., 2017), while weed-crop divergence for both SH and BHA occurred after the establishment of agriculture (Reagon et al., 2010; Li et al., 2017), thus gene expression differentiation among our Oryza pairs seems more highly correlated with time of divergence rather than whether plants have a cultivated or weedy status, suggesting that only modest genetic changes are necessary for weed adaptation.
Despite the modest number of DE genes between weeds and crop ancestors, we searched for genes that could be involved in sugar assimilation, growth, and nitrogen accumulation—the traits we found to show the greatest differentiation between US weedy rice and crops. Different nitrogen related genes showing differential expression were found in each weed-crop comparison (Table 4), but these nevertheless provide candidates that may account for the one physiological trait showing convergence between SH and BHA weeds.
Among the several DE genes possibly correlated with sugar-mediated plant growth regulation were genes related to the synthesis of fructose, sucrose, and starch (Table 4; Supplementary Table 15). Consistent with observed phenotypic values, most sugar pathway genes were differentially expressed between the SH weed and indica, suggesting that changes in sugar metabolism may be primarily implicated in the adaptation of the SH weedy group.
Despite the inherent difficulties in defining genes that are involved in a complex trait like growth rate and plant height, we found several phytohormone and growth-related candidate genes that differ between US weeds and crops (Table 4). As for sugars, gene expression differences were more common for SH weedy rice and indica, which, along with the observed phenotypic differentiation between these groups, leads us to suggest that more evolutionary change has occurred in the transition to weediness in SH than it has in BHA. This is curious, given that SH is thought to have a more recent origin than the BHA weed group (Reagon et al., 2010). It is possible that indica cultivars harbor phenotypes that are less adaptive for weedy rice, thus requiring greater evolutionary change in weed-adaptive traits. A similar explanation has been proposed for the evolution of shattering in US weed groups, with SH weedy rice showing less phenotypic overlap in this trait with indica cultivars, compared to BHA weedy rice and aus cultivars (Thurber et al., 2010, 2013).
Conclusions
The adaptation of agricultural weeds to crop fields has been thought to comprise many traits that could enhance competitiveness of weedy plants, collectively sometimes considered a “weed syndrome” (Vigueira et al., 2013). The remarkable recurrent evolution of weedy rice around the world (Ziska et al., 2015, Huang et al., 2017) offers a unique opportunity to determine which traits contribute consistently to weedy rice adaptation. Our finding of no overlap in various growth and physiological traits, nor in gene expression patterns, among independently evolved weedy rice lineages suggests that the vegetative traits we studied here may not be as universally crucial to weedy rice success. This is in contrast to the reproductive traits of seed shattering and seed dormancy, which have been found to occur in most populations of weedy rice around the world (Ziska et al., 2015). We caution that the presence of a single strategy for vegetative growth should not a priori be assumed for weedy rice. To better understand the circumstances that lead to the evolution of weedy groups, we encourage careful characterization to ascertain the adaptive traits comprising the weedy syndrome in each separate weedy rice lineage, as well as further expansion of such weedy rice comparative studies to other environmental conditions, including direct competition.
Data Availability Statement
Raw reads of the RNAseq data from this article can be found in the NCBI SRA under Bioproject ID PRJNA699874. The names of the repository/repositories and accession number(s) can be found at: https://www.ncbi.nlm.nih.gov/, SAMN17813093; https://www.ncbi.nlm.nih.gov/, SAMN17813094; https://www.ncbi.nlm.nih.gov/, SAMN17813095; https://www.ncbi.nlm.nih.gov/, SAMN17813096.
Author Contributions
ZH and JR conducted the experiments. ZH and RM performed data analysis. ZH and ALC designed the study and wrote the paper. All authors contributed to the article and approved the submitted version.
Funding
This work was supported by a grant from the US National Science Foundation Plant Genome Research Program (IOS-1032023) to AC, K. Olsen, and Y. Jia.
Conflict of Interest
The authors declare that the research was conducted in the absence of any commercial or financial relationships that could be construed as a potential conflict of interest.
Acknowledgments
The authors thank the University of Massachusetts greenhouse staff, C. Kramer and S. Perera for plant care support. We also thank X. Li for the rice photo in Figure 1.
Supplementary Material
The Supplementary Material for this article can be found online at: https://www.frontiersin.org/articles/10.3389/fagro.2021.601414/full#supplementary-material
References
Adhikari, C., Bronson, K. F., Panuallah, G. M., Regmi, A. P., Saha, P. K., Dobermann, A., et al. (1999). On-farm soil N supply and N nutrition in the rice–wheat system of Nepal and Bangladesh. Field Crops Res. 64, 273–286. doi: 10.1016/S0378-4290(99)00063-5
Arbelaez, J. D., Maron, L. G., Jobe, T. O., Piñeros, M. A., Famoso, A. N., Rebelo, A. R., et al. (2017). Aluminum Resistance Transcription Factor 1 (ART1) contributes to natural variation in aluminum resistance in diverse genetic backgrounds of rice (O. sativa). Plant Direct 1:e00014. doi: 10.1002/pld3.14
Arenhart, R. A., Bai, Y., Oliveira, L. F. V., de Neto, L. B., Schunemann, M., Maraschin, F., et al. (2014). new insights into aluminum tolerance in rice: the ASR5 protein binds the STAR1 promoter and other aluminum-responsive genes. Mol. Plant 7, 709–721. doi: 10.1093/mp/sst160
Bagnaresi, P., Biselli, C., Orrù, L, Urso, S., Crispino, L., Abbruscato, P., et al. (2012). Comparative transcriptome profiling of the early response to Magnaporthe oryzae in durable resistant vs susceptible rice (Oryza sativa L.) genotypes. PLoS ONE. 7:e51609. doi: 10.1371/journal.pone.0051609
Bargsten, J. W., Nap, J.-P., Sanchez-Perez, G. F., and van Dijk, A. D. (2014). Prioritization of candidate genes in QTL regions based on associations between traits and biological processes. BMC Plant Biol. 14:330. doi: 10.1186/s12870-014-0330-3
Bhullar, N. K., and Gruissem, W. (2013). Nutritional enhancement of rice for human health: The contribution of biotechnology. Biotechnol. Adv. 31, 50–57. doi: 10.1016/j.biotechadv.2012.02.001
Borah, P., Sharma, E., Kaur, A., Chandel, G., Mohapatra, T., Kapoor, S., et al. (2017). Analysis of drought-responsive signalling network in two contrasting rice cultivars using transcriptome-based approach. Sci. Rep. 7:42131. doi: 10.1038/srep42131
Burgos, N. R., Norman, R. J., Gealy, D. R., and Black, H. (2006). Competitive N uptake between rice and weedy rice. Field Crops Res. 99, 96–105. doi: 10.1016/j.fcr.2006.03.009
Campo, S., Baldrich, P., Messeguer, J., Lalanne, E., Coca, M., and San Segundo, B. (2014). Overexpression of a calcium-dependent protein kinase confers salt and drought tolerance in rice by preventing membrane lipid peroxidation. Plant Physiol. 165, 688–704. doi: 10.1104/pp.113.230268
Cao, Q., Lu, B.-R., Xia, H., Rong, J., Sala, F., Spada, A., et al. (2006). Genetic diversity and origin of weedy rice (Oryza sativa f. spontanea) populations found in North-eastern China revealed by simple sequence repeat (SSR) markers. Ann. Bot. 98, 1241–1252. doi: 10.1093/aob/mcl210
Caton, B. P., Cope, A. E., and Mortimer, M. (2003). Growth traits of diverse rice cultivars under severe competition: implications for screening for competitiveness. Field Crops Res. 83, 157–172. doi: 10.1016/S0378-4290(03)00072-8
Chauhan, B. S., and Johnson, D. E. (2011). Competitive interactions between weedy rice and cultivated rice as a function of added nitrogen and the level of competition. Weed Biol. Manag. 11, 202–209. doi: 10.1111/j.1445-6664.2011.00421.x
Chen, C., He, B., Liu, X., Ma, X., Liu, Y., Yao, H. Y., et al. (2020). Pyrophosphate-fructose 6-phosphate 1-phosphotransferase (PFP1) regulates starch biosynthesis and seed development via heterotetramer formation in rice (Oryza sativa L.). Plant Biotechnol. J. 18, 83–95. doi: 10.1111/pbi.13173
Chen, Z., Qin, C., Wang, M., Liao, F., Liao, Q., Liu, X., et al. (2019). Ethylene-mediated improvement in sucrose accumulation in ripening sugarcane involves increased sink strength. BMC Plant Biol. 19:285. doi: 10.1186/s12870-019-1882-z
Cho, J.-I., Ryoo, N., Ko, S., Lee, S.-K., Lee, J., Jung, K.-H., et al. (2006). Structure, expression, and functional analysis of the hexokinase gene family in rice (Oryza sativa L.). Planta 224, 598–611. doi: 10.1007/s00425-006-0251-y
Choi, J. Y., Platts, A. E., Fuller, D. Q., Hsing, Y.-I., Wing, R. A., and Purugganan, M. D. (2017). The rice paradox: Multiple origins but single domestication in Asian rice. Mol. Biol. Evol. 34:969–979. doi: 10.1093/molbev/msx049
Civán, P., Craig, H., Cox, C. J., and Brown, T. A. (2015). Three geographically separate domestications of Asian rice. Nat. Plants 1:15164. doi: 10.1038/nplants.2015.164
Concenco, G., Aspiazu, I., Galon, L., Ferreira, E. A., and Freitas, M. (2011). Photosynthetic characteristics of hybrid and conventional rice plants as a function of plant competition. Planta Daninha 29, 803–809. doi: 10.1590/S0100-83582011000400010
Deprost, D., Yao, L., Sormani, R., Moreau, M., Leterreux, G., Nicola ï, M., et al. (2007). The Arabidopsis TOR kinase links plant growth, yield, stress resistance and mRNA translation. EMBO Rep. 8, 864–870. doi: 10.1038/sj.embor.7401043
Du, Z., Zhou, X., Ling, Y., Zhang, Z., and Su, Z. (2010). agriGO: a GO analysis toolkit for the agricultural community. Nucleic Acids Res. 38, W64–W70. doi: 10.1093/nar/gkq310
Estorninos, L. E., Gealy, D. R., Gbur, E. E., Talbert, R. E., and McClelland, M. R. (2005). Rice and red rice interference. II. rice response to population densities of three red rice (Oryza sativa) ecotypes. Weed Sci. 53, 683–689. doi: 10.1614/WS-04-040R1.1
Fischer, A., Chatel, M., Ramirez, H., Lozano, J., and Guimaraes, E. (1995). Components of early competition between upland rice (Oryza sativa L.) and Brachiaria brizantha (Hochst. ex A.Rich) Stapf. Int. J. Pest Manag. 41, 100–103. doi: 10.1080/09670879509371931
Gałecki, A., and Burzykowski, T. (2013). “Linear mixed-effects model,” in Linear Mixed-Effects Models Using R: A Step-by-Step Approach, eds A. Gałecki and T. Burzykowski (New York, NY: Springer). doi: 10.1007/978-1-4614-3900-4_13
Galland, M., Boutet-Mercey, S., Lounifi, I., Godin, B., Balzergue, S., Grandjean, O., et al. (2014). Compartmentation and dynamics of flavone metabolism in dry and germinated rice seeds. Plant Cell Physiol. 55, 1646–1659. doi: 10.1093/pcp/pcu095
Gealy, D. R., and Yan, W. (2012). Weed Suppression Potential of ‘Rondo’ and Other Indica Rice Germplasm Lines. Weed Technol. 26, 517–524. doi: 10.1614/WT-D-11-00141.1
González-Schain, N., Roig-Villanova, I., and Kater, M. M. (2019). Early cold stress responses in post-meiotic anthers from tolerant and sensitive rice cultivars. Rice N. Y. N 12, 94–94. doi: 10.1186/s12284-019-0350-6
Gu, X. Y., Kianian, S. F., Hareland, G. A., Hoffer, B. L., and Foley, M. E. (2005). Genetic analysis of adaptive syndromes interrelated with seed dormancy in weedy rice (Oryza sativa). Theor. Appl. Genet. 110, 1108–1118. doi: 10.1007/s00122-005-1939-2
Hakata, M., Kuroda, M., Ohsumi, A., Hirose, T., Nakamura, H., Muramatsu, M., et al. (2012). Overexpression of a rice TIFY gene increases grain size through enhanced accumulation of carbohydrates in the stem. Biosci. Biotechnol. Biochem. 76, 2129–2134. doi: 10.1271/bbb.120545
Harris, M. A., Clark, J., Ireland, A., Lomax, J., Ashburner, M., Foulger, R., et al. (2004). The gene ontology (GO) database and informatics resource. Nucleic Acids Res. 32, D258–D261. doi: 10.1093/nar/gkh036
He, H., Zhiting, X., Minjing, L., Shuanglian, X, Shenglan, L., and Obono Mba, F. (2006). Effect of cadmium and herbicides on the growth, chlorophyll and soluble sugar content in rice seedlings. Wuhan Univ. J. Nat. Sci. 11, 742–748. doi: 10.1007/BF02836701
Hoang, G. T., Van Dinh, L., Nguyen, T. T., Ta, N. K., Gathignol, F., Mai, C. D., et al. (2019). Genome-wide association study of a panel of vietnamese rice landraces reveals new QTLs for tolerance to water deficit during the vegetative phase. Rice 12:4. doi: 10.1186/s12284-018-0258-6
Hoyos, V., Plaza, G., and Caicedo, A. L. (2019). Characterization of the phenotypic variability in Colombian weedy rice (Oryza spp.). Weed Sci. 67, 441–452. doi: 10.1017/wsc.2019.18
Hsieh, P.-H., Kan, C.-C., Wu, H.-Y., Yang, H.-C., and Hsieh, M.-H. (2018). Early molecular events associated with nitrogen deficiency in rice seedling roots. Sci. Rep. 8:12207. doi: 10.1038/s41598-018-30632-1
Huang, Z., Young, N. D., Reagon, M., Hyma, K. E., Olsen, K. M., Jia, Y., et al. (2017). All roads lead to weediness: patterns of genomic divergence reveal extensive recurrent weedy rice origins from South Asian Oryza. Mol. Ecol. 26, 3151–3167. doi: 10.1111/mec.14120
Inskeep, W. P., and Bloom, P. R. (1985). Extinction coefficients of chlorophyll a and b in N,N-Dimethylformamide and 80% acetone. Plant Physiol. 77, 483–485. doi: 10.1104/pp.77.2.483
Jain, M., Nijhawan, A., Tyagi, A. K., and Khurana, J. P. (2006). Validation of housekeeping genes as internal control for studying gene expression in rice by quantitative real-time PCR. Biochem. Biophys. Res. Commun. 345, 646–651. doi: 10.1016/j.bbrc.2006.04.140
Jia, Y., and Gealy, D. (2018). ScienceDirect Weedy red rice has novel sources of resistance to biotic stress. Crop J. 6:443–450. doi: 10.1016/j.cj.2018.07.001
Jisha, V., Dampanaboina, L., Vadassery, J., Mithöfer, A., Kappara, S., and Ramanan, R. (2015). Overexpression of an AP2/ERF Type transcription factor OsEREBP1 confers biotic and abiotic stress tolerance in rice. PLoS ONE 10:e0127831. doi: 10.1371/journal.pone.0127831
Karim, R. S. M., Man, A. B., and Sahid, I. B. (2004). Weed problems and their management in rice fields of Malaysia: an overview. Weed Biol. Manag. 4, 177–186. doi: 10.1111/j.1445-6664.2004.00136.x
Kharabian-Masouleh, A., Waters, D. L., Reinke, R. F., and Henry, R. J. (2011). Discovery of polymorphisms in starch-related genes in rice germplasm by amplification of pooled DNA and deeply parallel sequencing. Plant Biotechnol. J. 9, 1074–1085. doi: 10.1111/j.1467-7652.2011.00629.x
Kim, S.-W., Lee, S.-K., Jeong, H.-J., An, G., Jeon, J.-S., and Jung, K.-H. (2017). Crosstalk between diurnal rhythm and water stress reveals an altered primary carbon flux into soluble sugars in drought-treated rice leaves. Sci. Rep. 7:8214. doi: 10.1038/s41598-017-08473-1
Kitomi, Y., Inahashi, H., Takehisa, H., Sato, Y., and Inukai, Y. (2012). OsIAA13-mediated auxin signaling is involved in lateral root initiation in rice. Plant Sci. Int. J. Exp. Plant Biol. 190, 116–122. doi: 10.1016/j.plantsci.2012.04.005
Lastdrager, J., Hanson, J., and Smeekens, S. (2014). Sugar signals and the control of plant growth and development. J. Exp. Bot. 65, 799–807. doi: 10.1093/jxb/ert474
Leivar, P., and Quail, P. H. (2011). PIFs: pivotal components in a cellular signaling hub. Trends Plant Sci. 16, 19–28. doi: 10.1016/j.tplants.2010.08.003
Li, C., Zhou, A., and Sang, T. (2006). Rice domestication by reducing shattering. Science 311, 1936–1939. doi: 10.1126/science.1123604
Li, L.-F., Li, Y.-L., Jia, Y., Caicedo, A. L., and Olsen, K. M. (2017). Signatures of adaptation in the weedy rice genome. Nat. Genet. 49, 811–814. doi: 10.1038/ng.3825
Liu, X., Li, M., Liu, K., Tang, D., Sun, M., Li, Y., et al. (2016). Semi-Rolled Leaf2 modulates rice leaf rolling by regulating abaxial side cell differentiation. J. Exp. Bot. 67, 2139–2150. doi: 10.1093/jxb/erw029
Liu, Z., Zhang, Y., Liu, R., Hao, H., Wang, Z., and Bi, Y. (2011). Phytochrome interacting factors (PIFs) are essential regulators for sucrose-induced hypocotyl elongation in Arabidopsis. J. Plant Physiol. 168, 1771–1779. doi: 10.1016/j.jplph.2011.04.009
Long, S. P., and Bernacchi, C. J. (2003). Gas exchange measurements, what can they tell us about the underlying limitations to photosynthesis? Procedures and sources of error. J. Exp. Bot. 54, 2393–2401. doi: 10.1093/jxb/erg262
López-González, C., Juárez-Colunga, S., Morales-Elías, N. C., and Tiessen, A. (2019). Exploring regulatory networks in plants: transcription factors of starch metabolism. PeerJ 7:e6841. doi: 10.7717/peerj.6841
Luke, S. G. (2017). Evaluating significance in linear mixed-effects models in R. Behav. Res. Methods 49, 1494–1502. doi: 10.3758/s13428-016-0809-y
Mahlow, S., Orzechowski, S., and Fettke, J. (2016). Starch phosphorylation: insights and perspectives. Cell. Mol. Life Sci. CMLS 73, 2753–2764. doi: 10.1007/s00018-016-2248-4
Malukani, K. K., Ranjan, A., Jyothi, H. S., Patel, H. K., and Sonti, R. V. (2019). Dual activities of receptor-like kinase OsWAKL21.2 induce immune responses. Plant Physiol. 183, 1345–1363. doi: 10.1104/pp.19.01579
Meng, D., Liang, A., Wei, X., and You, C. (2019). Enzymatic characterization of a thermostable phosphatase from Thermomicrobium roseum and its application for biosynthesis of fructose from maltodextrin. Appl. Microbiol. Biotechnol. 103, 6129–6139. doi: 10.1007/s00253-019-09917-6
Moldenhauer, K., and Slaton, N. (2001). “Rice growth and development,” in Rice Production Handbook (Little Rock, AR: Coop. Ext. Service, University of Arkansas), 7–14.
Nadir, S., Xiong, H.-B., Zhu, Q., Zhang, X.-L., Xu, H.-Y., Li, J., et al. (2017). Weedy rice in sustainable rice production. a review. Agron. Sustain. Dev. 37:46. doi: 10.1007/s13593-017-0456-4
Novoa, R., and Loomis, R. S. (1981). Nitrogen and plant production. Plant Soil 58, 177–204. doi: 10.1007/BF02180053
Obertello, M., Shrivastava, S., Katari, M. S., and Coruzzi, G. M. (2015). Cross-species network analysis uncovers conserved nitrogen-regulated network modules in rice. Plant Physiol. 168, 1830–1843. doi: 10.1104/pp.114.255877
Osuna, D., Usadel, B., Morcuende, R., Gibon, Y., Bläsing, O. E., Höhne, M., et al. (2007). Temporal responses of transcripts, enzyme activities and metabolites after adding sucrose to carbon-deprived Arabidopsis seedlings. Plant J. Cell Mol. Biol. 49, 463–491. doi: 10.1111/j.1365-313X.2006.02979.x
Ottis, B. V., Smith, K. L., Scott, R. C., and Talbert, R. E. (2005). Rice yield and quality as affected by cultivar and red rice (Oryza sativa) density. Weed Sci. 53, 499–504. doi: 10.1614/WS-04-154R
Pareek, A., Singh, A., Kumar, M., Kushwaha, H. R., Lynn, A. M., and Singla-Pareek, S. L. (2006). Whole-genome analysis of Oryza sativa reveals similar architecture of two-component signaling machinery with Arabidopsis. Plant Physiol. 142, 380–397. doi: 10.1104/pp.106.086371
Qiu, J., Jia, L., Wu, D., Weng, X., Chen, L., Sun, J., et al. (2020). Diverse genetic mechanisms underlie worldwide convergent rice feralization. Genome Biol. 21:70. doi: 10.1186/s13059-020-01980-x
Qiu, J., Zhou, Y., Mao, L., Ye, C., Wang, W., Zhang, J., et al. (2017). Genomic variation associated with local adaptation of weedy rice during de-domestication. Nat. Commun. 8:15323. doi: 10.1038/ncomms15323
R Core Team (2014). R: A Language and Environment for Statistical Computing. Vienna: R Foundation for Statistical Computing.
Radosevich, S. R., Holt, J. S., and Ghersa, C. (1997). Weed Ecology: Implications for Management. New York, NY: John Wiley & Sons.
Ranker, E. R. (1925). Determination of total nitrogen in plants and plant solutions: a comparison of methods with modifications. Ann. Mo. Bot. Gard. 12, 367–380. doi: 10.2307/2394062
Reagon, M., Thurber, C. S., Gross, B. L., Olsen, K. M., Jia, Y., and Caicedo, A. L. (2010). Genomic patterns of nucleotide diversity in divergent populations of U.S. weedy rice. BMC Evol. Biol. 10:180. doi: 10.1186/1471-2148-10-180
Rebolledo, M. C., Dingkuhn, M., Clément-Vidal, A., Rouan, L., and Luquet, D. (2012). Phenomics of rice early vigour and drought response: are sugar related and morphogenetic traits relevant? Rice. 5:22. doi: 10.1186/1939-8433-5-22
Richardson, A. D., Duigan, S. P., and Berlyn, G. P. (2002), An evaluation of noninvasive methods to estimate foliar chlorophyll content. New Phytol. 153, 185–194. doi: 10.1046/j.0028-646X.2001.00289.x
Robaglia, C., Thomas, M., and Meyer, C. (2012). Sensing nutrient and energy status by SnRK1 and TOR kinases. Curr. Opin. Plant Biol. 15, 301–307. doi: 10.1016/j.pbi.2012.01.012
Sales, M. A., Shivrain, V. K., Burgos, N. R., and Kuk, Y. I. (2008). Amino acid substitutions in the acetolactate synthase gene of red rice (Oryza sativa) confer resistance to imazethapyr. Weed Sci. 56, 485–489. doi: 10.1614/WS-07-165.1
Shivrain, V. K., Burgos, N. R., Gealy, D. R., Smith, K. L., Scott, R. C., Mauromoustakos, A., et al. (2009). Red rice (Oryza sativa) emergence characteristics and influence on rice yield at different planting dates. Weed Sci. 57, 94–102. doi: 10.1614/WS-08-112.1
Shivrain, V. K., Burgos, N. R., Scott, R. C., Gbur, E. E., Estorninos, L. E., and McClelland, M. R. (2010). Diversity of weedy red rice (Oryza sativa L.) in Arkansas, U.S.A. in relation to weed management. Crop Prot. 29, 721–730. doi: 10.1016/j.cropro.2010.02.010
Smeekens, S., Ma, J., Hanson, J., and Rolland, F. (2010). Sugar signals and molecular networks controlling plant growth. Curr. Opin. Plant Biol. 13, 274–279. doi: 10.1016/j.pbi.2009.12.002
Song, B.-K., Chuah, T.-S., Tam, S. M., and Olsen, K. M. (2014). Malaysian weedy rice shows its true stripes: wild Oryza and elite rice cultivars shape agricultural weed evolution in Southeast Asia. Mol. Ecol. 23, 5003–5017. doi: 10.1111/mec.12922
Stewart, J. L., Maloof, J. N., and Nemhauser, J. L. (2011). PIF genes mediate the effect of sucrose on seedling growth dynamics. PLoS ONE 6:e19894. doi: 10.1371/journal.pone.0019894
Sudo, E., Itouga, M., Yoshida-Hatanaka, K., Ono, Y., and Sakakibara, H. (2008). Gene expression and sensitivity in response to copper stress in rice leaves. J. Exp. Bot. 59, 3465–3474. doi: 10.1093/jxb/ern196
Thimm, O., Bläsing, O., Gibon, Y., Nagel, A., Meyer, S., Krüger, P., et al. (2004). mapman: a user-driven tool to display genomics data sets onto diagrams of metabolic pathways and other biological processes. Plant J. 37, 914–939. doi: 10.1111/j.1365-313X.2004.02016.x
Thurber, C. S., Jia, M. H., Jia, Y., and Caicedo, A. L. (2013). Similar traits, different genes? Examining convergent evolution in related weedy rice populations. Mol. Ecol. 22, 685–698. doi: 10.1111/mec.12147
Thurber, C. S., Reagon, M., Gross, B. L., Olsen, K. M., Jia, Y., and Caicedo, A. L. (2010). Molecular evolution of shattering loci in U.S. weedy rice. Mol. Ecol. 19, 3271–3284. doi: 10.1111/j.1365-294X.2010.04708.x
Tiessen, A., and Padilla-Chacon, D. (2012). Subcellular compartmentation of sugar signaling: links among carbon cellular status, route of sucrolysis, sink-source allocation, and metabolic partitioning. Front. Plant Sci. 3:306. doi: 10.3389/fpls.2012.00306
Trapnell, C., Pachter, L., and Salzberg, S. L. (2009). TopHat: discovering splice junctions with RNA-Seq. Bioinformatics 25, 1105–1111. doi: 10.1093/bioinformatics/btp120
Trapnell, C., Roberts, A., Goff, L., Pertea, G., Kim, D., Kelley, D. R., et al. (2012). Differential gene and transcript expression analysis of RNA-seq experiments with TopHat and Cufflinks. Nat. Protoc. 7, 562–578. doi: 10.1038/nprot.2012.016
Trapnell, C., Williams, B., Pertea, G., et al. (2010). Transcript assembly and quantification by RNA-Seq reveals unannotated transcripts and isoform switching during cell differentiation. Nat. Biotechnol. 28, 511–515. doi: 10.1038/nbt.1621
Tseng, T. M., Burgos, N. R., Shivrain, V. K., Alcober, E. A., and Mauromoustakos, A. (2013). Inter- and intrapopulation variation in dormancy of Oryza sativa (weedy red rice) and allelic variation in dormancy-linked loci. Weed Res. 53, 440–451. doi: 10.1111/wre.12044
Usadel, B., Bläsing, O. E., Gibon, Y., Retzlaff, K., Höhne, M., Günther, M., et al. (2008). Global transcript levels respond to small changes of the carbon status during progressive exhaustion of carbohydrates in arabidopsis rosettes. Plant Physiol. 146, 1834–1861. doi: 10.1104/pp.107.115592
Vigueira, C. C., Olsen, K. M., and Caicedo, A. L. (2013). The red queen in the corn: agricultural weeds as models of rapid adaptive evolution. Heredity (Edinb). 110, 303–311. doi: 10.1038/hdy.2012.104
Vigueira, C. C., Qi, X., Song, B.-K., Li, L.-F., Caicedo, A. L., Jia, Y., et al. (2019). Call of the wild rice: Oryza rufipogon shapes weedy rice evolution in Southeast Asia. Evol. Appl. 12, 93–104. doi: 10.1111/eva.12581
Wang, F., Ning, D., Chen, Y., Dang, C., Han, N.-S., Liu, Y., et al. (2015). Comparing gene expression profiles between bt and non-bt rice in response to brown planthopper infestation. Front. Plant Sci. 6:1181. doi: 10.3389/fpls.2015.01181
Wang, G., Li, H., Wang, K., Yang, J., Duan, M., Zhang, J., et al. (2020). Regulation of gene expression involved in the remobilization of rice straw carbon reserves results from moderate soil drying during grain filling. Plant J. 101, 604–618. doi: 10.1111/tpj.14565
Xiu-mei, W., Yue-yang, L., Ling, L., Chang-wei, G., Hai-peng, W., Xiao-xi, H., et al. (2015). Identification and cloning of tillering-related genes OsMAX1 in rice. Rice Sci. 22, 255–263. doi: 10.1016/j.rsci.2015.06.001
Xu, X. M., Li, G., Su, Y., and Wang, X. L. (2018). Effect of weedy rice at different densities on photosynthetic characteristics and yield of cultivated rice. Photosynthetica 56, 520–526. doi: 10.1007/s11099-017-0707-2
Yang, S., Hao, D., Song, Z., Yang, G., Wang, L., and Su, Y. (2015). RNA-Seq analysis of differentially expressed genes in rice under varied nitrogen supplies. Gene 555, 305–317. doi: 10.1016/j.gene.2014.11.021
Zhang, F., Zhou, Y., Zhang, M., Luo, X., and Xie, J. (2017). Effects of drought stress on global gene expression profile in leaf and root samples of dongxiang wild rice (Oryza rufipogon). Biosci. Rep. 37:BSR20160509. doi: 10.1042/BSR20160509
Zhang, K., Song, Q., Wei, Q., Wang, C., Zhang, L., Xu, W., et al. (2016). Down-regulation of OsSPX1 caused semi-male sterility, resulting in reduction of grain yield in rice. Plant Biotechnol. J. 14, 1661–1672. doi: 10.1111/pbi.12527
Zhang, N., Yu, H., Yu, H., Cai, Y., Huang, L., Xu, C., et al. (2018). A core regulatory pathway controlling rice tiller angle mediated by the LAZY1-dependent asymmetric distribution of auxin. Plant Cell 30, 1461–1475. doi: 10.1105/tpc.18.00063
Zhang, Z., Qiang, L. I. U., Hai-xing, S., Xiang-min, R., and Ismail, A. M. (2012). Responses of different rice (Oryza sativa L.) genotypes to salt stress and relation to carbohydrate metabolism and chlorophyll content. Afr. J. Agric. Res. 7, 19–27. doi: 10.5897/AJAR11.834
Zhou, S., Jiang, W., Long, F., Cheng, S., Yang, W., Zhao, Y., et al. (2017). Rice homeodomain protein WOX11 recruits a histone acetyltransferase complex to establish programs of cell proliferation of crown root meristem. Plant Cell 29, 1088–1104. doi: 10.1105/tpc.16.00908
Zhu, X., Shen, W., Huang, J., Zhang, T., Zhang, X., Cui, Y., et al. (2018). Mutation of the OsSAC1 gene, which encodes an endoplasmic reticulum protein with an unknown function, causes sugar accumulation in rice leaves. Plant Cell Physiol. 59, 487–499. doi: 10.1093/pcp/pcx203
Keywords: red rice, convergent evolution, parallel evolution, weediness traits, RNA-Seq, Oryza groups
Citation: Huang Z, Rodriguez JA, Matsuo R and Caicedo AL (2021) Assessing Physiological and Genetic Evidence for Evolution of Shared Weedy Rice Traits at the Vegetative Growth Stage. Front. Agron. 3:601414. doi: 10.3389/fagro.2021.601414
Received: 31 August 2020; Accepted: 22 April 2021;
Published: 24 May 2021.
Edited by:
Lauren M. Lazaro, Louisiana State University Agricultural Center, United StatesReviewed by:
Nilda Roma Burgos, University of Arkansas, United StatesBhagirath Singh Chauhan, The University of Queensland, Australia
Copyright © 2021 Huang, Rodriguez, Matsuo and Caicedo. This is an open-access article distributed under the terms of the Creative Commons Attribution License (CC BY). The use, distribution or reproduction in other forums is permitted, provided the original author(s) and the copyright owner(s) are credited and that the original publication in this journal is cited, in accordance with accepted academic practice. No use, distribution or reproduction is permitted which does not comply with these terms.
*Correspondence: Ana L. Caicedo, Y2FpY2Vkb0BiaW8udW1hc3MuZWR1