 Stéphane Cordeau1
 Sandra Wayman2
 Quirine M. Ketterings3Chris J. Pelzer2
 Amir Sadeghpour4
 Matthew R. Ryan2*
- 1Agroécologie, AgroSup Dijon, INRAE, Univ. Bourgogne, Univ. Bourgogne Franche-Comté, Dijon, France
- 2Section of Soil and Crop Sciences, Cornell University, Ithaca, NY, United States
- 3Department of Animal Science, Cornell University, Ithaca, NY, United States
- 4Department of Plant, Soil and Agricultural Systems, Southern Illinois University, Carbondale, IL, United States
Weed communities can be influenced by nutrient availability, nutrient form (e. g., ammonium vs. nitrate), amendment timing, amendment type (e.g., organic vs. inorganic), and by immigration of seeds during amendment applications. The objective of this research was to compare the long-term effect of different fertility treatments in a corn (Zea mays L.)-alfalfa (Medicago sativa L.) rotation on taxonomic and functional structure and composition of weed communities by analyzing the soil weed seedbank. After 14 years of a long-term experiment in Aurora, NY, United States, soils were sampled in five fertility treatments for corn years in the rotation: liquid dairy manure, semi-composted separated dairy solids; or inorganic nitrogen (N) as starter fertilizer with either no sidedress N, a low rate or a high rate of inorganic N as sidedress fertilizer. Soil was collected in early spring 2015 and a greenhouse weed seed germination bioassay was used to quantify the germinable soil weed seedbank. Total weed seedbank density, species richness, and evenness did not vary by treatment. However, fertility treatments modified the ecological niche represented by 20 environmental descriptors, which filtered the weed community creating distinct functional group assemblages. A trait-based analysis revealed that nitrophilic dicotyledons preferring alkaline soil were associated with high concentrations of inorganic N fertilizer, whereas highly specialist monocotyledons preferring high amounts of light were associated with low concentrations of inorganic N fertilizer. Because fertility treatments affected weed community composition but not seed bank density and richness, results encourage the development of holistic management strategies that adopt coherent weed management and crop fertilization.
Introduction
Weeds are a major constraint to crop production (Adeux et al., 2019b). Concerns about herbicide resistance, environmental impacts, and human health effects associated with standard weed management strategies (e.g., herbicide use and soil tillage) have prompted renewed interest in ecological weed management (Liebman et al., 1997; Mortensen et al., 2000; Petit et al., 2018; Maclaren et al., 2020). A central theme in ecological weed management is using ecological knowledge to develop strategies to prevent weed problems rather than focusing narrowly on control tactics that aim to terminate emerged weeds. Community assembly theory has been proposed as a strategy for understanding and predicting weed species response to management practices (Booth and Swanton, 2002; Gaba et al., 2017; Smith and Mortensen, 2017). Environmental filters such as crop type, crop sequence (Fried et al., 2008; Mahaut et al., 2019), soil disturbance, and disturbance timing (Cordeau et al., 2017c) have been explored previously; however, limited information is available about the role of long-term nutrient management on weed community assembly in agroecosystems. Understanding the effects of different nutrient management strategies on weed community assembly can contribute to ecological weed management and reduce reliance on soil tillage and herbicides.
Nutrient management practices can affect weed communities both directly through seed immigration and indirectly by altering competitive abilities. Weed seeds can immigrate to crop fields through manure application and increase the weed seedbank density and species diversity (Pleasant and Schlather, 1994). In some cases, new difficult-to-control weeds can be introduced with applications of manure. Composting manure has been shown to reduce weed seed viability and thus immigration into crop fields, but results vary with weed species, the temperature in the compost, and the duration of exposure (Larney and Blackshaw, 2003). Fertilization may also indirectly affect the weed community through resource modification by altering competition intensity from crops (i.e., crop: weed competition) and among different weed species (i.e., weed: weed competition). Depending on the crop, weed species, and soil conditions, N fertilizer can either give weeds a competitive advantage or disadvantage (Di Tomaso, 1995). Nitrogen is an essential plant nutrient that is known to impact plant community assembly, and previous research has documented that certain weed species (e.g., Amaranthus retroflexus, Persicaria lapathifolia, Echinochloa crus-galli) are more responsive to N than other species (Blackshaw and Brandt, 2008; Moreau et al., 2014). Phosphorus (P) and potassium (K) are also known to differentially impact weed species (Hoveland et al., 1976). For example, Tilman et al. (1999) suggested that Taraxacum officinale could be managed in lawns by reducing K fertilizer applications because it has high K requirements and is a poorer competitor than grasses.
Community assembly theory states that evaluating functional traits rather than species can provide important insights and lead to a more mechanistic understanding of plant community dynamics (Booth and Swanton, 2002). According to community assembly theory, abiotic and biotic factors, such as management practices and competition, act as filters preventing species with some traits while allowing species with other traits to exist in a community (Ryan et al., 2010). Fields with high concentrations of soil nutrients can select for weed species that favor high fertility, likewise fields that have low concentrations of soil nutrients tend to favor weeds that better tolerate low-fertility conditions (Tilman et al., 1999; Ryan et al., 2010). In addition, in low inorganic fertilizer conditions, weed communities often harbor fewer specialist species, i.e., with a higher ecological niche (Fried et al., 2010).
Assessing the soil seedbank is particularly relevant when studying the long-term effect of farming practices (Mahé et al., 2021). Soil weed seedbanks are the source of not only emerged weeds, but also weeds that establish at later times (Mirsky et al., 2010; Cordeau et al., 2017d). Soil weed seedbanks also carry legacy from past practices and can be considered as the “memory” of a weed community (Cavers, 1995; Buhler et al., 1997). The weed seedbank thus can provide greater insight into the effect of long-term weed management practices as there is typically more variation among emerged weeds than in the seedbank (Légère and Samson, 2004).
The objective of this research was to compare the effects of dairy manure and inorganic fertilizer on the soil weed seedbank in a long-term corn-alfalfa rotation experiment. We hypothesized that (1) weed seedbank density and weed species density are greater in the organic manure treatments (both liquid dairy manure and composted dairy solids) compared with the inorganic fertilizer treatments due to seed immigration, and (2) fertilizer type (liquid dairy manure vs. composted dairy solids vs. inorganic N fertilizer) shapes the soil ecological niche through modifications of soil parameters and nutrient concentrations, thus acting as weed community filters.
Materials and Methods
Experimental Design and Treatments
This study was conducted within a field experiment initiated in 2001 in Aurora, NY, USA (42.73° N, 76.65° W). The soil type is a tile-drained Lima silt loam (a fine-loamy, mixed, active, mesic Oxyaquic Hapludalf), with pH of 7.5, organic matter of 35 g kg−1, N, P, and K, content of 21, 5.1, and 47 mg kg−1, respectively. It was classified, at the start of the experiment, as high in soil test P (Ketterings et al., 2003a) and medium in soil test K (Ketterings et al., 2003c). The experimental area had no manure applications for several decades and was under continuous corn production before 2001.
The field experiment was initiated in 2001 as a randomized complete block design with five fertility treatments and five replicates, cultivated in continuous silage corn for 5 years, rotated to alfalfa in April of 2006 for a period of 5 years, followed by corn grain from 2011 to 2015. We did not fertilize grain corn (because it was after 5 years of alfalfa) but corn was planted in 2011. Treatments were based on annual spring applications of semi-composted dairy solids, liquid dairy manure, and inorganic N fertilizer. The rates of dairy solids and liquid dairy manure were based on expected N needs of the crop [see details for rates used in 2001–2006 in Sadeghpour et al. (2016)]. Seedbed preparation took place a minimum of 5 days after solid manure had been applied, to ensure loss of any inorganic N in the solids (Ketterings et al., 2003b). All plots received 22 kg ha−1 N in the starter band. The inorganic N sidedress applications took place when corn was at the V6 growth stage and applied in the form of urea ammonium nitrate. These treatments are hereafter referred to as: (1) Orgliquid (159 kL ha−1 liquid dairy manure); (2) Orgsolids (90 Mg ha−1 separated semi-composted dairy solids); (3) InorgN0 (no sidedress N); (4) InorgN1 (168 kg N ha−1 sidedress N); and (5) InorgN2 (280 kg N ha−1 sidedress N). No additional manure, compost or sidedress N was added in 2006–2010 when alfalfa was grown, or in 2011, the 1st year of corn after alfalfa. Rates of manure and dairy solids during the grain corn years from 2012 to 2015 were consistent with those in the earlier years and are documented in Sadeghpour et al. (2017). No data on micronutrients in manure were collected.
Soil Sampling and Soil Parameters
On April 28, 2015 a total of 30 randomly spaced soil cores (1.6 cm diameter) to 20 cm depth (maximum depth of tillage) were collected in each replicate of the five treatments to quantify the soil weed seedbank. The 30 soil cores were pooled and soil bulk density and percent moisture were determined using the pooled cores for each treatment replicate. Eleven soil parameters (Table 1) were determined at the University of Maine Analytical Laboratory and Maine Soil Testing Service (Orono, ME) from the soil sampled at seedbank collection. Seven soil parameters (Table 1) were determined from previous sampling events in 2014 and processed at Brookside Laboratories, Inc. (New Bremen, OH).
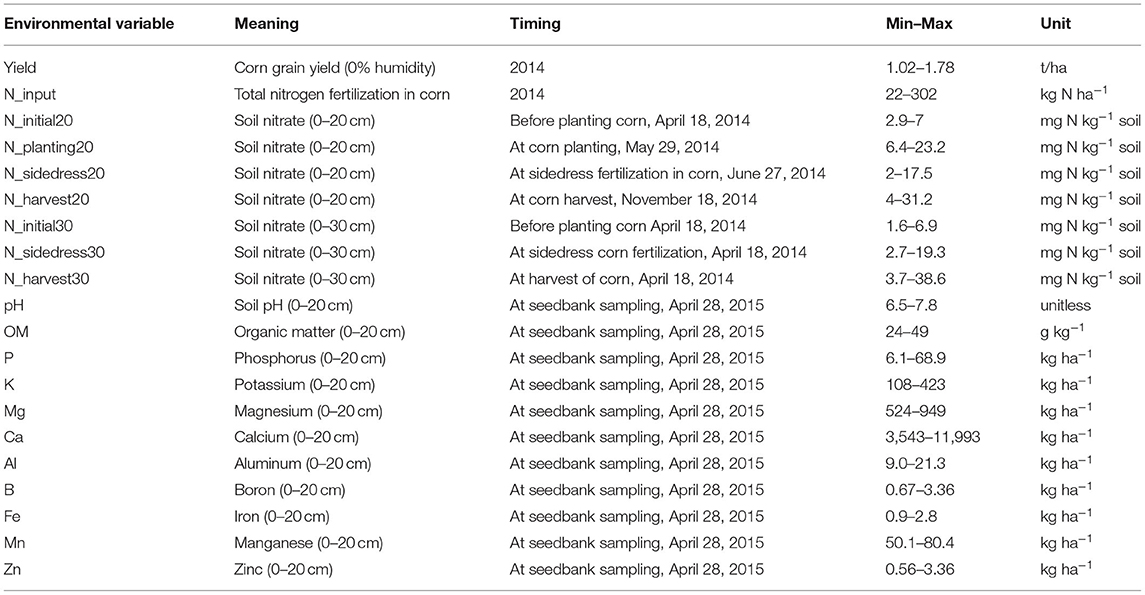
Table 1. Definitions, timings of sampling and ranges of values for environmental parameters.
Weed Seedbank Assessment
The soil weed seedbank was quantified using a greenhouse emergence bioassay. A subsample of 1 kg of thoroughly mixed field soil was placed on top of 1–2 cm of vermiculite in a plastic tray (25 × 25 cm) and watered routinely in a greenhouse. The soil was spread in the tray to ensure a maximum of 1–2 cm of soil thickness to avoid non-emergence of germinated seeds (Mahé et al., 2021). Weed seedlings were identified to species, counted, and removed. After emergence ceased, the soil was allowed to dry for 1 month, homogenized, and the process was repeated for a second weed germination flush. Alternating dry and wet spells can cause seed envelopes to crack and initiate seed germination (Cordeau et al., 2018). A third and final flush occurred after soil flats had been stored in a cooler at 5°C for 3 months, because low temperature can break seed dormancy (i.e., stratification) (Baskin and Baskin, 1985). Emergence counts by species from the three flushes were pooled. The number of emerged seedlings was standardized to per kg dry weight soil using soil bulk density and gravimetric soil moisture.
Data Analysis
Total Abundance, Species Richness and Evenness
Weed species richness (S) and Pielou's evenness (J) were computed per plot with the “vegan” package (Oksanen, 2019) using R software. Evenness was computed as J = H/ln(S), where H is the Shannon-Weiner diversity index. Evenness is typically represented on a scale ranging from near 0, which indicates low evenness or high single-species dominance, to 1, which indicates equal abundance of all species or maximum evenness (Alatalo, 1981). Evenness was considered as 0 when only 1 species occurred. To test for differences in weed community structure among the different fertility treatments, weed species richness, total abundance, and evenness were modeled with a linear mixed model using the “lme4” package (Bates et al., 2015). The fertility treatment (5 levels) was considered a fixed effect, with block as a random effect. Type II Wald F tests were calculated for the three models using “Anova” in the “car” package (Fox and Weisberg, 2018).
Weed Community Composition
Associations between fertility treatments and weed seedbank community composition were assessed with a principal coordinates analysis (PCoA, a metric multidimensional scaling method), with a Bray-Curtis distance metric using the “vegan” package (Oksanen, 2019). Six species observed once were deleted from the dataset for PCoA (i.e., Stellaria media, Senecio vulgaris, Lamium amplexicaule, Eragrostis spp., Chenopodium glaucum, and Atriplex patula). The significance of fertility treatment was tested with a permutation-based multivariate analysis of variance, i.e., PERMANOVA (Anderson, 2001), using the “Adonis” function of the “FactoMineR” package (Husson et al., 2010). The analysis was conducted on the matrix of Bray-Curtis distance coefficients, and P-values were based on 999 permutations. The effect of fertility treatments on homogeneity of weed seedbank composition was assessed with the Betadisper function of the “FactoMineR” package. Betadisper is a multivariate analog of Levene's test for homogeneity of variances and computes non-Euclidean distances between objects (in our case, plots) and group centroids (fertility treatments), and tests for mean differences. A greater distance between dots and their fertility treatment centroid indicates greater heterogeneity (i.e., variance) in weed communities between plots belonging to the same fertility treatment. Fertility treatments with a high degree of filtering were expected to show homogeneity in weed communities.
Effect of Fertility Treatments on Soil Parameters
A matrix of the environmental variables (corn yield, soil N application and measurements, and soil parameters) by plots was submitted to a principal component analysis (PCA) using the package “FactoMineR.” The significance of fertility treatments in shaping environmental variables was tested with a permutation-based multivariate analysis of variance (PERMANOVA with 999 permutations, using the “Adonis” function in the “vegan” package) using the matrix of Euclidean distances.
Relative Importance of Environmental Parameters on Weed Assembly
First, we used Mantel tests (“vegdist” function in the “vegan” package) to test for correlations among weed communities and environmental parameters in each of the 25 plots (Mantel, 1967). Correlation significance was assessed using permutation tests with 1,000 permutations. The entire data set (25 plots, 22 weed species described by their abundance, 20 explanatory variables) was subjected to canonical correspondence analysis (CCA) as implemented in the “vegan” package. All explanatory variables were continuous (Table 1). The ecological gradient length was assessed by a detrended correspondence analysis (DCA) performed on the overall plot-by-species dataset (Legendre and Legendre, 2012), dividing the first axis into 26 segments. The ecological gradient length was 4.8 standard deviation units, justifying the use of CCA, which assumes unimodal responses. Following the methodology of Cordeau et al. (2017b), net effects of the 20 explanatory variables (Table 1) on weed communities were calculated after partitioning out the effect shared with the other explanatory variables. The net effect of each particular variable was tested with a partial CCA (pCCA), proposed by Rao (1969), with a single explanatory variable and the other 20 variables used as covariates. The significance of the model was tested using a permutation based ANOVA (N = 999 permutations). The ratio of a particular eigenvalue to the sum of all eigenvalues (total inertia) was used as a measure of the proportion of variation (i.e., inertia) explained by each explanatory variable (Borcard et al., 1992).
Selection of Species Traits
Weed species traits were described using six descriptors that were extracted from online trait databases (Table 2). The six descriptors were: (1) cotyledon type (monocot vs. dicot) (Gaba et al., 2017); (2) specialization degree (generalist or specialist) (Fried et al., 2010); (3) Ellenberg-L (higher L values represent stronger affinity for light) (Bartelheimer and Poschlod, 2016); (4) Ellenberg-R (low and high R values represent affinity for acidic and alkaline soils, respectively) (Bartelheimer and Poschlod, 2016); (5) Ellenberg-N (low and high N values describe species growing on low-N and high-N soils, respectively) (Bartelheimer and Poschlod, 2016); and (6) seed weight (four categories for the mass of the seed in mg) (Gaba et al., 2017). Ellenberg values are simple ordinal classifications of plants according to the position of their realized ecological niche along an environmental gradient.
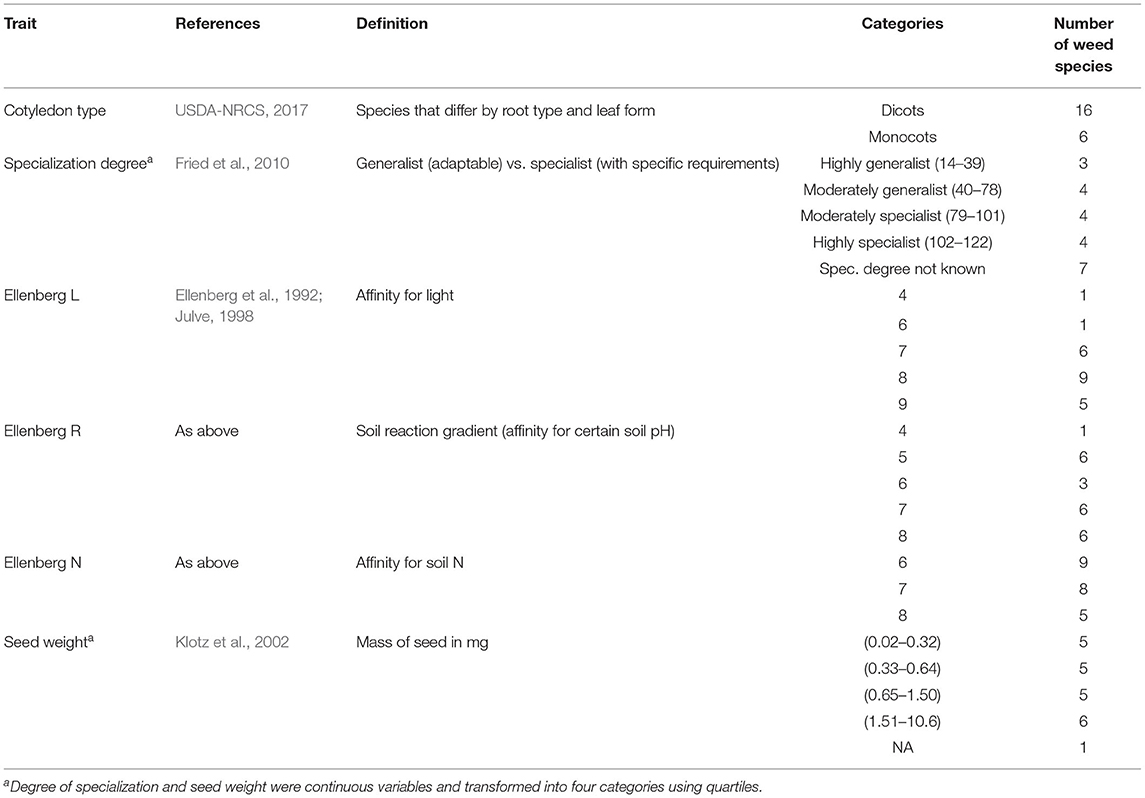
Table 2. Biological descriptors of weed species used for the functional grouping and count of weed species falling into each category.
Grouping Species Into Functional Groups
Weed species were organized into functional groups following the methodology of Cordeau et al. (2017a) and Fried et al. (2009). A functional group is a set of species with common plant traits that behave in a similar way. First, a species-by-trait matrix was created to characterize the 22 weed species using the six biological descriptors (Table 2). Second, a multiple correspondence analysis (MCA) of this species-by-trait matrix was formed, using the “ade4” package (Dray and Dufour, 2007). The MCA is a data analysis technique for nominal categorical data, used to detect and represent underlying structures in data like a species-by-trait matrix. MCA places species in a multidimensional space with coordinates on each axis of the multidimensional space. The Euclidean distance between species in the multidimensional space represents the distance between species in terms of trait values representing their ecology. The closer the species are to each other in the multidimensional space, the more similar they are in terms of trait values. Third, the matrix of Euclidean distances between species was used to conduct a Ward hierarchical ascendant classification (HAC; i.e., cluster analysis). The HAC produced a dendrogram, which is a tree diagram frequently used to illustrate the arrangement of clusters produced by hierarchical clustering. Examination of the dendrogram allowed us to identify clear and non-redundant functional groups. Fisher's exact tests, performed with the “catdes” function (Husson et al., 2010) of the “FactoMineR” package, were used to classify those traits and their categories significantly associated with each functional group. The “catdes” function also provided “v.test values” that indicated trait categories that were overrepresented (v.test values > 0) in each functional group. Pearson's Chi-squared tests for count data were run on a contingency table for fertility treatment by abundance of each functional group, controlling for the abundance of weed species, to determine if the relative proportion of functional groups differed by fertility treatments.
Results
Weed Species Abundance, Richness and Evenness
The total abundance of weed species ranged from 3 to 30 seedlings kg−1 of soil. A total of 22 weed species recorded across the whole experiment: Chenopodium album (Common lambsquarters, 100% of frequency of occurrence), Taraxacum officinale (Dandelion, 90.9%), Digitaria sanguinalis (Large crabgrass, 59.1%), Oxalis sp. (Woodsorrels, 59.1%), Solanum sp. (Nightshades, 50%), Panicum dichotomiflorum (Fall panicum, 36.4%), Amaranthus sp. (Pigweeds, 27.3%), Plantago major (Broadleaf plantain, 27.3%), Setaria pumila (Yellow foxtail, 27.3%), Abutilon grandifolium (Hairy Indian mallow, 27.3%), Hibiscus trionum (Venice mallow, 27.3%), Veronica persica (Persian speedwell, 13.6%), Ambrosia artemisiifolia (Common ragweed, 9.1%), Juncus tenuis (Path rush, 9.1%), Panicum capillare (Witchgrass, 9.1%), Trifolium hybridium (Alsike clover, 9.1%), Atriplex patula (Spear saltbush, 4.5%), Chenopodium glaucum (Oakleaf goosefoot, 4.5%), Eragrostis sp. (Lovegrasses, 4.5%), Lamium amplexicaule (Henbit, 4.5%), Senecio vulgaris (Common groundsel, 4.5%), Stellaria media (Common chickweed, 4.5%). Total abundance by treatment ranged from 10.1 ± 6.5 (OrgLiquid) to 15.4 ± 5.1 (InorgN2) individuals kg−1 soil (mean ± standard deviation). Species richness (S) by treatment ranged from 4.6 ± 0.9 (Org.Liquid) to 6.2 ± 2.4 (Org.Solids). Species evenness (J) by treatment ranged from 0.80 ± 0.10 (InorgN2) to 0.94 ± 0.03 (Org.Solids). No significant differences existed among fertility treatments for total abundance (F = 0.77, Df = 4, P = 0.56), species richness (F = 0.95, Df = 4, P = 0.46), or evenness (F = 2.29, Df = 4, P = 0.10).
Weed Communities Affected by Fertility Treatment
The first five axis of the PCoA explained 72.4% of the total inertia (Figure 1). Fertility treatments largely overlapped but significantly affected weed community assembly (PERMANOVA, F = 1.57, Df = 4, P = 0.04, R2 = 0.23). Although treatment InorgN2 (the highest rate of inorganic N application) seemed to express a less heterogenous weed community than other treatments (i.e., smaller 95% confidence ellipse, Figure 1), no differences in variance were found among treatments (Betadisper multivariate homogeneity of variance, F = 2.18, Df = 4, P = 0.10).
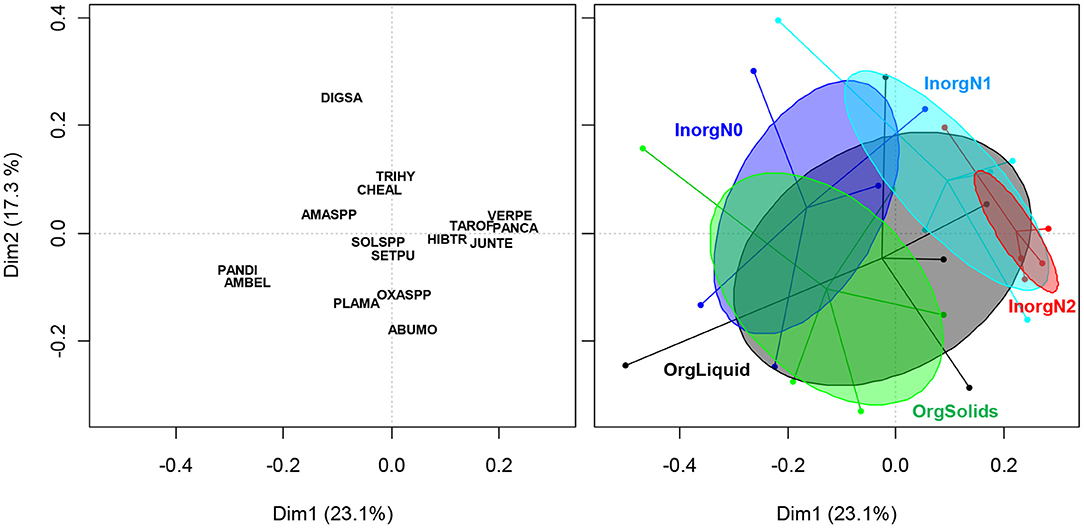
Figure 1. Principal coordinate analysis (PCoA) with a Bray-Curtis distance metric of the weed seedbank community (n = 25 plots) under five different fertility treatments (right panel). Ellipses represent the 95% confidence interval. Species names (left panel) are coded with EPPO codes (https://gd.eppo.int/).
Effect of Environmental Parameters on Weed Communities
The first five axes of the PCA explained 85% of the overall environmental variability (Table 1, Figure 2). Axis 1 (explaining 31% of the variability) separated organic from inorganic treatments and was positively correlated with pH, organic matter, P and K concentrations, and concentrations of other minor elements (e.g., B, Zn, Mg). Axis 2 (18%) separated the low inorganic N treatment (InorgN0) from the high inorganic N treatments (InorgN1 and InorgN2) and was correlated with corn yield, total N input, and soil nitrate at corn harvest. Fertility treatments significantly influenced the ecological niches that were described by the environmental variables (PERMANOVA, F = 10.6, Df = 4, P = 0.001, R2 = 0.68) without affecting the variance within treatments (Betadisper multivariate homogeneity of variance, F = 0.26, Df = 4, P = 0.90).
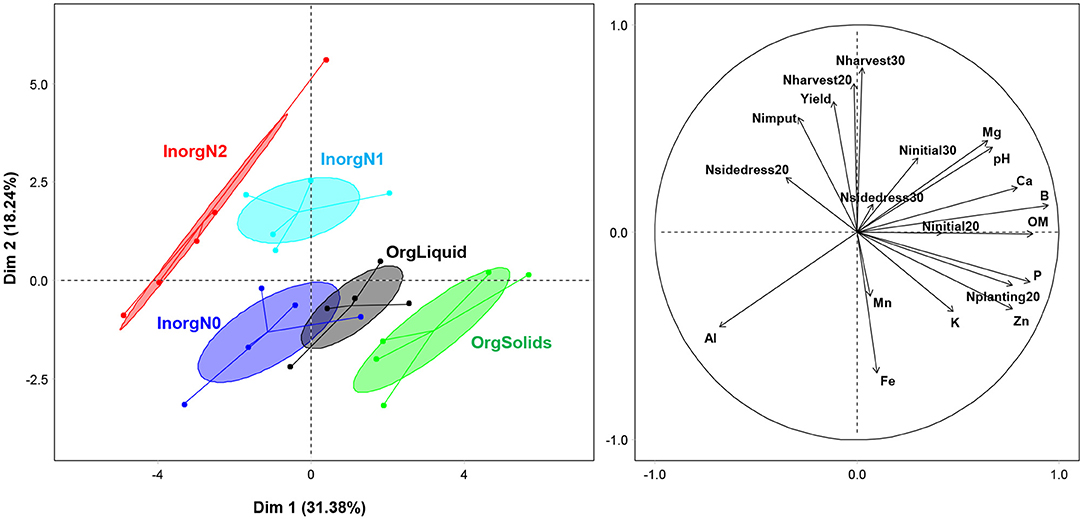
Figure 2. Principal component analysis (PCA) of environmental variables (right panel, see Table 1 for detailed description) of each fertility treatment (left panel, dots are plots, n = 25).
The influence of fertility treatments on environmental parameters filtered weed communities. We observed a positive correlation between the distance matrices of weed communities and environmental variables (Mantel test, r = 0.19, P = 0.04), indicating that treatments with similar environmental parameters showed similar weed communities (composition and relative abundance).
The results of the CCA and pCCA weighted the relative importance of environmental parameters on weed assembly. The first five axis of the CCA explained 62% of the total inertia (Figure 3). The most complete model including all the environmental parameters (Table 1) explained 87% of the variation in weed communities (F = 1.34, Df = 20, P < 0.05). Individual parameters that offered the highest degree of explanation after partitioning out the effect of the other variables were the variables “total N input” and “calcium.” Total N input explained 7% of the variability in weed community (P = 0.03) and calcium explained 8% (P = 0.01).
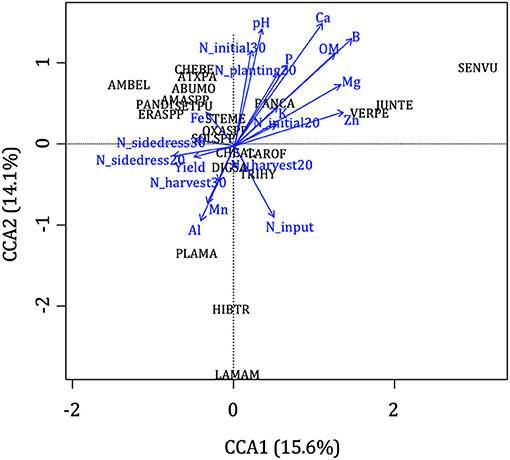
Figure 3. Effect of environmental variables (in blue, see Table 1 for a detailed description) on weed species (black, named by their EPPO codes, https://gd.eppo.int/) assessed by canonical correspondence analysis (CCA). Arrows indicate the direction and magnitude of responses.
Different Compositions of Functional Groups Among Fertility Treatments
Fertility treatments may have filtered certain species in similar ways because of the similarity of the species' traits and biological characteristics. Here, we grouped species into functional groups and revealed changes in their relative abundances. The first five axes of the MCA (Figure 4) accounted for 63% of the total trait variation. The first axis (18% of the variation) separated dicot from monocot species (left-to right, Figure 4, left panels), generalists (large ecological niche) from specialists (reduced ecological niche) and more nitrophilic from less nitrophilic species (Ellenberg N values). The second axis (13% of the variation) separated large- from small-seeded species (bottom-to-top, Figure 4, left panels). Hierarchical Cluster Analysis (HAC) identified two clear and non-redundant functional groups (Figure 4, right panel). All traits, except seed weight (χ2 = 6.2, df = 3, P = 0.10), contributed to the grouping (Cotyledon type: Pearson's χ2 = 7.1, df = 1, P = 0.007; Specialization Degree: χ2 = 10.8, df = 3, P = 0.01; Ellenberg N: χ2 = 8.2, df = 2, P = 0.02; Ellenberg L: χ2 = 10.6, df = 4, P = 0.03; Ellenberg R: χ2 = 15.9, df = 4, P = 0.003).
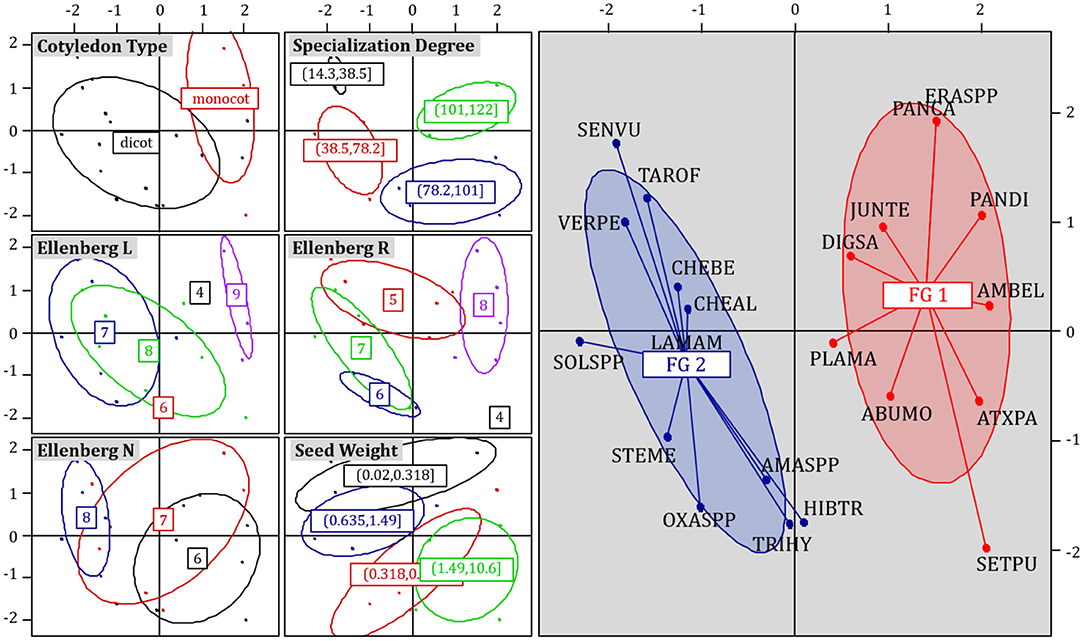
Figure 4. Multiple correspondence analysis (MCA) ordination (axis 1: 18.1%; axis 2: 12.5%) of the weed species-by-trait matrix (Table 2). All seven ordination plots represent the same ordination solution. Weed species points are colored by different trait categories (see Table 2 for category divisions). Ellipses show the 95% confidence interval (when no ellipse is visible, only one species belongs to this category). Trait category labels in the center of ellipses show the centroid of all species belonging to that trait category. The right panel shows weed species grouped into functional groups (FG 1 and FG 2). Species names are EPPO codes (https://gd.eppo.int/).
Figure 5 presents trait descriptors of each functional group. Functional group 1 consisted of 10 weed species, among which were five monocot species (e.g., Panicum capillare), and five dicot species (e.g., Ambrosia artemisiifolia). Functional group 1 included species with highly specific requirements (highly specialist), those with lower affinity for soil N (Ellenberg N), species with higher affinity for light (Ellenberg L), and those preferring more alkaline and calcareous soils (Ellenberg R). Functional group 2 consisted of 11 weed species, comprised exclusively of dicot species (e.g., Senecio vulgaris, Veronica peregrina). Functional group 2 included species with higher affinity for soil N (Ellenberg N), and those preferring moderately alkaline and calcareous conditions (Ellenberg R).
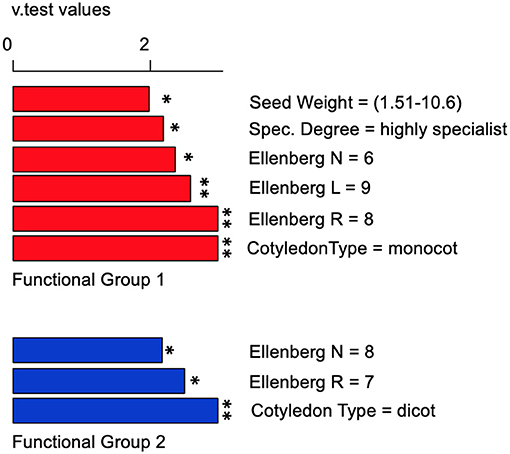
Figure 5. Bars indicate the descriptor category within each trait that contributed to functional groups 1 (red) and 2 (blue). Fisher's exact tests were used to compare the allocation of the descriptor categories (see Table 2) within the functional groups (*P < 0.05; **P < 0.01). V.test values > 0 indicate an overrepresented category in the functional group. The “catdes” function of the “FactoMineR” package (Husson et al., 2010) provided v.test values (unitless).
No significant difference in the relative abundance of functional groups was found between organic treatments (i.e., liquid dairy manure and composted separated dairy solids) (Figure 6). This is congruent with the overlap of weed communities observed in the taxonomic analysis (PCoA, Figure 1). However, a significant difference was found among the three inorganic fertility treatments (Figure 6). The treatment with 280 kg N ha−1 of sidedressed urea ammonium nitrate (InorgN2), had a higher proportion of species belonging to functional group 2 (i.e., nitrophilic dicots) than did the other inorganic treatments. In contrast, the relative proportion of functional group 1 (i.e., highly specialist monocots and dicots) in the InorgN2 treatment decreased as the level of N fertility increased.
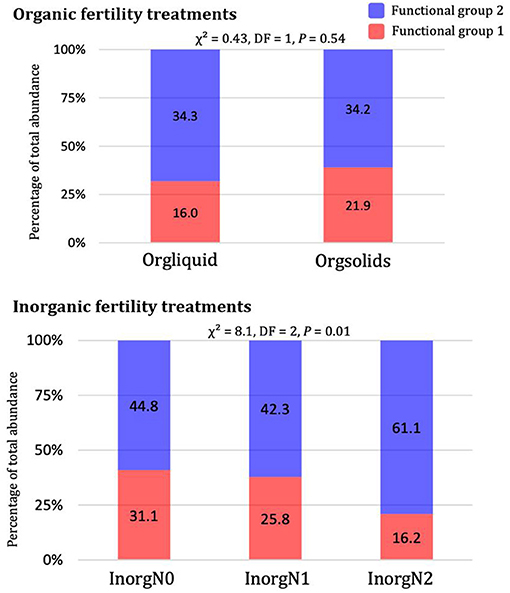
Figure 6. Relative abundance of functional groups 1 (red) and 2 (blue) within organic fertility treatments (top) and inorganic fertility treatments (bottom). Chi-square tests on contingency tables of functional groups by fertility treatments are displayed above each graph. Values in the bars are total density of the species belonging to each functional group in each fertility treatment.
Discussion
The aim of this work was to compare the long-term effects of organic and inorganic fertilizers on weed seedbank communities through the analysis of their composition and structure. Overall, fertility treatments differentiated the ecological niches through modification of environmental parameters. Fertility treatments did not affect seedbank density, richness or evenness (refuting our first hypothesis) but shaped taxonomic and functional composition of weed communities (supporting our second hypothesis).
No Modification of Community Structure by Fertility Treatment
Our first hypothesis, that weed seedbank density and weed species richness are greater in the organic compared to the inorganic fertility treatments because of immigration of seeds, was not supported by our results. We can postulate that composting manure before application decreased the number of viable seeds (Larney and Blackshaw, 2003). Although studies agree that time and temperature requirements for thermal death vary considerably among species, temperatures of 50°C (Dahlquist et al., 2007) and sometimes less for certain species [i.e., 39°C (Larney and Blackshaw, 2003)] are lethal. Liquid dairy manure was not a source of seed immigration, because there was no increase in total weed density (Stevenson et al., 1997). Furthermore, because there were no differences in species richness among treatments (Stevenson et al., 1997), neither liquid nor composted manure introduced seeds not belonging to species already present in the site. Seed composition of the manure depends highly on the weediness of the fields where cattle graze or hay is harvested (Cudney et al., 1992; Pleasant and Schlather, 1994). Surprisingly, no significant differences existed in evenness among treatments, which is in contradiction with some studies [e.g., (Tang et al., 2014)]. This result indicates there were no major introductions of species that became dominant, which supports previous work showing that organic amendments have little influence on the soil seedbank (Pleasant and Schlather, 1994; Mccloskey et al., 1996; Stevenson et al., 1997).
Taxonomic Composition Shaped by Fertility Treatment
Our results showed that the ecological niche differed by fertility treatment, supporting our second hypothesis. The positive correlation between distance matrices of weed communities and environmental variables confirmed that treatments with similar environmental parameters showed similar weed communities in composition and relative abundance. This correlation supports our hypothesis that management decisions related to fertility management (source, rates, etc.), repeatedly applied for years, can act as a filter on the weed community, as recently shown by Jiang et al. (2018) in winter wheat (Triticum aestivum L.).
We found that fertility treatments implemented during the corn years in the rotation affected taxonomic composition, which is congruent with previous results of Pyšek and Lepš (1991) who investigated the effect of type and amount of fertilizer in barley. For instance, the relative abundance of Taraxacum officinale may have been affected by fertility treatment (Tilman et al., 1999). However, our results did not show that treatments with high fertility homogenized the weed community by reducing the ecological niche. Thus, (i) continuous corn production before the start of the corn-alfalfa rotation experiment in 2001 favored species adapted to high fertility levels, as demonstrated by previous research (Fried et al., 2020); and (ii) since the start of the experiment, high weed diversity did not emerge in the low fertility treatment (InorgN0) as previous studies would suggest (Storkey et al., 2010). An alternative explanation is that herbicide weed management during the experiment might have kept new species from establishing or present species from dominating the community (Adeux et al., 2019a; Cordeau et al., 2020).
Disentangling the Effect of Environmental Parameters on Weed Communities
Of the 20 parameters used to describe the ecological niche in the analysis, only total N applied and calcium concentrations were significant in shaping weed communities after partialling out the effect of the other parameters. Calcium acts as a nutrient filler, to maintain balance among nutrients in the soil and occupy space on the soil adsorption complex which otherwise would be taken up by acid elements (i.e., H+ protons). In our experiment, calcium concentration is correlated with soil pH as shown by many previous studies [e.g., (Goto, 1985)] and might have selected for species preferring alkaline and calcareous soils (Fried et al., 2012) despite the relatively narrow range of pH in our experiment (i.e., 6.5–7.8). It has to be noticed that Ellenberg's values are discrete values but refer to qualitative descriptors of the plant species.
Some studies showed that these values cannot be directly related to particular values of soil parameters, because intraspecific variation in plant functional traits can be large (Zelený and Schaffers, 2012). However, they are widely used as they fairly indicate the range of these soil parameters (Wamelink et al., 2002). Total N input might have directly affected weed community, i.e., the amount of N available each year might have repeatedly favored nitrophilous species while filtering oligotrophic species (Pyšek and Lepš, 1991). Total N input might also have indirectly affected the weed community, by increasing corn growth (Sadeghpour et al., 2016) and strengthening crop: weed competition for light (Pyšek and Lepš, 1991; Yin et al., 2006), especially after corn canopy closure. Canopy height has often been considered a reliable proxy to assess competitive ability for light resources (Seavers and Wright, 1999; Norsworthy and Oliveira, 2004) under the theory of competitive hierarchies, where competitive outcome is determined by having better fitness of a specific trait (Funk and Wolf, 2016).
Although not significant, soil P and K concentrations explained 5 and 4%, respectively, of the variability in weed community assembly. Tang et al. (2014) showed that weed community assembly was influenced by nutrients in the order of P>N>K in winter wheat. With corn, Vengris et al. (1955) showed that relative plant nutrient uptake differed between weedy and weed-free plots, i.e., corn grown with weeds compared to corn alone took up only 47% as much K, 58% as much N, 63% as much as P, and 67% as much calcium. Vengris et al. (1955) also showed that some of the dominant weeds of our study (i.e., Chenopodium album, Digitaria sanguinalis) were between 20 and 57% more competitive for N and K than was corn, whereas all weeds were less competitive than corn for P. Our results from the pCCA analysis support that N remains the major nutrient driving weed community assembly, whether directly or indirectly.
Fertility Treatments Affect Functional Profiles
The trait-based approach provides important insights and leads to a more mechanistic understanding of the filtering effects of fertility treatments on weed communities (Booth and Swanton, 2002). Our results highlight that organic fertility treatments had few filtering effects on weed communities, probably because the nutrients were released slowly from the manure and did not directly affect weeds (Pleasant and Schlather, 1994; Mccloskey et al., 1996; Stevenson et al., 1997). In contrast to the findings in the organic fertility plots, high levels of inorganic fertility reflect the direct and long-term effects of increasing the proportion of nitrophilic species, supporting our second hypothesis. Our findings support the trait syndrome observed by Storkey et al. (2010) in the Broadbalk long-term experiment. Increasing the level of inorganic fertilizer reduces the ecological niche and selects against specialists and/or rare species (Fried et al., 2010). Specialist nitrophilic weeds may represent a threat of high weed:crop interference. The threat of interference may particularly be the case in less N-demanding crops such as wheat or alfalfa, because nitrophilic weeds (such as Chenopodium glaucum (Oakleaf goosefoot) and Solanum sp. (Nightshades) in our experiment) have been shown to respond to high soil N by producing large amounts of aboveground biomass, and then outcompeting crops for light (Moreau et al., 2013, 2014). In addition, according to the competitive hierarchy theory, over the long-term, nitrophilic weeds may dominate the community and thus represent a threat for preserving weed diversity that has been shown to mitigate yield loss (Adeux et al., 2019b).
Conclusions
The analysis of the effect of long-term fertility treatments on weed seedbank communities, comparing liquid dairy manure and semi-composted dairy solids to three levels of inorganic fertilizers (including a zero-N sidedress control), revealed no differences in total weed abundance, weed species richness, or weed species evenness. The ecological niches defined by 20 environmental variables differed among fertility treatments and acted as filters for weed communities, described in both the taxonomic and functional perspectives. The trait-based approach showed that species belonging to the functional group of nitrophilic dicots were more abundant with higher levels of inorganic N. These results encourage the development of holistic management strategies that optimize nutrient management for ecological weed management in order to reduce weed interference in the crop while meeting crop's nutrient requirements and building soil health.
Data Availability Statement
The data that support the findings of this study are available from the corresponding author upon request.
Author Contributions
MR and QK designed the study and funded the research. SW, CP, and AS collected the data. SC analyzed the data. MR, QK, SW, AS, and SC were involved in the interpretation of the results, contributed to writing the original version of the manuscript, and improving subsequent versions. All authors contributed to the article and approved the submitted version.
Funding
The collaboration with SC (INRAE) was initiated during his visiting stay at Cornell University, funded by INRAE and the INRAE department Environnement et Agronomie. Funding for the study was provided by the United States Department of Agriculture National Institute of Food and Agriculture, Hatch Project 2016-17-252. Greg Godwin, Laura Campos, and Brian Caldwell helped with sample collection. This article is dedicated to the memory of Charles L. Mohler (Department of Crop and Soil Sciences, Cornell University), an outstanding weed ecologist, engaged in field experiments during his whole career, developing integrated weed management, options for organic growers, etc.
Conflict of Interest
The authors declare that the research was conducted in the absence of any commercial or financial relationships that could be construed as a potential conflict of interest.
References
Adeux, G., Munier-Jolain, N., Meunier, D., Farcy, P., Carlesi, S., Barberi, P., et al. (2019a). Diversified grain-based cropping systems provide long-term weed control while limiting herbicide use and yield losses. Agronomy Sustain. Dev. 39:42. doi: 10.1007/s13593-019-0587-x
Adeux, G., Vieren, E., Carlesi, S., Bàrberi, P., Munier-Jolain, N., and Cordeau, S. (2019b). Mitigating crop yield losses through weed diversity. Nat. Sustain. 2, 1018–1026. doi: 10.1038/s41893-019-0415-y
Alatalo, R. V. (1981). Problems in the measurement of evenness in ecology. Oikos 37, 199–204. doi: 10.2307/3544465
Anderson, M. J. (2001). A new method for non-parametric multivariate analysis of variance. Aust. Ecol. 26, 32–46. doi: 10.1111/j.1442-9993.2001.01070.pp.x
Bartelheimer, M., and Poschlod, P. (2016). Functional characterizations of Ellenberg indicator values – a review on ecophysiological determinants. Funct. Ecol. 30, 506–516. doi: 10.1111/1365-2435.12531
Baskin, J. M., and Baskin, C. C. (1985). The annual dormancy cycle in buried weed seeds: a continuum. BioScience 35, 492–498. doi: 10.2307/1309817
Bates, D., Mächler, M., Bolker, B., and Walker, S. (2015). Fitting linear mixed-effects models using {lme4}. J. Statist. Softw. 67, 1–48. doi: 10.18637/jss.v067.i01
Blackshaw, R. E., and Brandt, R. N. (2008). Nitrogen fertilizer rate effects on weed competitiveness is species dependent. Weed Sci. 56, 743–747. doi: 10.1614/WS-08-065.1
Booth, B. D., and Swanton, C. J. (2002). Assembly theory applied to weed communities. Weed Sci. 50, 2–13. doi: 10.1614/0043-1745(2002)050[0002:AIATAT]2.0.CO;2
Borcard, D., Legendre, P., and Drapeau, P. (1992). Partialling out the spatial component of ecological variation. Ecology 73, 1045–1055. doi: 10.2307/1940179
Buhler, D. D., Hartzler, R. G., and Forcella, F. (1997). Implications of weed seedbank dynamics to weed management. Weed Sci. 45, 329–336. doi: 10.1017/S0043174500092948
Cavers, P. B. (1995). Seed banks: memory in soil. Canad. J. Soil Sci. 75, 11–13. doi: 10.4141/cjss95-003
Cordeau, S., Baudron, A., and Adeux, G. (2020). Is tillage a suitable option for weed management in conservation agriculture? Agronomy 10:1746. doi: 10.3390/agronomy10111746
Cordeau, S., Ryan, M. R., Bohan, D. A., Reboud, X., and Chauvel, B. (2017a). Which traits allow weed species to persist in grass margin strips? Weed Sci. 65, 381–394. doi: 10.1017/wsc.2016.39
Cordeau, S., Smith, R. G., Gallandt, E. R., Brown, B., Salon, P., Ditommaso, A., et al. (2017b). Disentangling the effects of tillage timing and weather on weed community assembly. Agriculture 7:66. doi: 10.3390/agriculture7080066
Cordeau, S., Smith, R. G., Gallandt, E. R., Brown, B., Salon, P., Ditommaso, A., et al. (2017c). How do weeds differ in their response to the timing of tillage? A study of 61 species across the Northeastern United States. Ann. Appl. Biol. 171, 340–352. doi: 10.1111/aab.12377
Cordeau, S., Smith, R. G., Gallandt, E. R., Brown, B., Salon, P., Ditommaso, A., et al. (2017d). Timing of tillage as a driver of weed communities. Weed Sci. 65, 504–514. doi: 10.1017/wsc.2017.26
Cordeau, S., Wayman, S., Reibel, C., Strbik, F., Chauvel, B., and Guillemin, J. P. (2018). Effects of drought on weed emergence and growth vary with seed burial depth and presence of a cover crop. Weed Biol. Manage. 18, 12–25. doi: 10.1111/wbm.12136
Cudney, D., Wright, S., Shultz, T., and Reints, J. (1992). Weed seed in dairy manure depends on collection site. CA. Agri. 46, 31–32. doi: 10.3733/ca.v046n03p31
Dahlquist, R. M., Prather, T. S., and Stapleton, J. J. (2007). Time and temperature requirements for weed seed thermal death. Weed Sci. 55, 619–625. doi: 10.1614/WS-04-178.1
Di Tomaso, J. M. (1995). Approaches for improving crop competitiveness through the manipulation of fertilization strategies. Weed Sci. 43, 491–497. doi: 10.1017/S0043174500081522
Dray, S., and Dufour, A. B. (2007). The ade4 package: implementing the duality diagram for ecologists. J. Statist. Softw. 22, 1–20. doi: 10.18637/jss.v022.i04
Ellenberg, H., Weber, H., Düll, R., Wirth, W., and Paulissen, D. (1992). Zeigerwerte von Pflanzen in mitteleuropa. Scrip. Geobotan. 18, 1–248.
Fox, J., and Weisberg, S. (2018). An R Companion to Applied Regression. Thousand Oaks, CA: Sage publications.
Fried, G., Chauvel, B., Munoz, F., and Reboud, X. (2020). Which traits make weeds more successful in maize crops? Insights from a three-decade monitoring in France. Plants 9:40. doi: 10.3390/plants9010040
Fried, G., Chauvel, B., and Reboud, X. (2009). A functional analysis of large-scale temporal shifts from 1970 to 2000 in weed assemblages of sunflower crops in France. J. Vegetat. Sci. 20, 49–58. doi: 10.1111/j.1654-1103.2009.05284.x
Fried, G., Kazakou, E., and Gaba, S. (2012). Trajectories of weed communities explained by traits associated with species' response to management practices. Agri. Ecosyst. Environ. 158, 147–155. doi: 10.1016/j.agee.2012.06.005
Fried, G., Norton, L. R., and Reboud, X. (2008). Environmental and management factors determining weed species composition and diversity in France. Agri. Ecosyst. Environ. 128, 68–76. doi: 10.1016/j.agee.2008.05.003
Fried, G., Petit, S., and Reboud, X. (2010). A specialist-generalist classification of the arable flora and its response to changes in agricultural practices. BMC Ecol. 10:20. doi: 10.1186/1472-6785-10-20
Funk, J. L., and Wolf, A. A. (2016). Testing the trait-based community framework: Do functional traits predict competitive outcomes? Ecology 97, 2206–2211. doi: 10.1002/ecy.1484
Gaba, S., Perronne, R., Fried, G., Gardarin, A., Bretagnolle, F., Biju-Duval, L., et al. (2017). Response and effect traits of arable weeds in agro-ecosystems: a review of current knowledge. Weed Res. 57, 123–147. doi: 10.1111/wre.12245
Goto, K. (1985). Relationships between soil pH, available calcium and prevalence of potato scab. Soil Sci. Plant Nutr. 31, 411–418. doi: 10.1080/00380768.1985.10557448
Hoveland, C., Buchanan, G., and Harris, M. (1976). Response of weeds to soil phosphorus and potassium. Weed Sci. 194–201. doi: 10.1017/S0043174500065747
Husson, F., Josse, J., and Le, S. J. M. (2010). FactoMineR: Multivariate Exploratory Data Analysis and Data Mining with R. Available online at: http://CRAN.R-project.org/package=FactoMineR (accessed August 20, 2017).
Jiang, M., Liu, T., Huang, N., Shen, X., Shen, M., and Dai, Q. (2018). Effect of long-term fertilisation on the weed community of a winter wheat field. Sci. Rep. 8, 1–7. doi: 10.1038/s41598-018-22389-4
Julve, P. (1998). Baseflor. Index Botanique, Ecologique et Chorologique de la Flore de France. Available online at: http://perso.wanadoo.fr/philippe.julve/catminat.htm (accessed August 20, 2017).
Ketterings, Q. M., Czymmek, K. J., and Klausner, S. D. (2003a). Phosphorus Guidelines for Field crops in New York. Second Release. Department of Crop and Soil Sciences Extension Series E03-15. Ithaca, NY: Cornell University.
Ketterings, Q. M., Klausner, S. D., and Czymmek, K. J. (2003b). Nitrogen Guidelines for Field Crops in New York. Second Release. Department of Crop and Soil Extension Series E03-16. Ithaca, NY: Cornell University.
Ketterings, Q. M., Klausner, S. D., and Czymmek, K. J. (2003c). Potassium Guidelines for Field Crops in New York. Second Release. Dept. Crop and Soil Sciences Extension Series E03-14. Ithaca, NY: Cornell University.
Klotz, S., Kühn, I., Durka, W., and Hrsg. (2002). BIOLFLOR - Eine Datenbank zu biologisch-ökologischen Merkmalen der Gefäßpflanzen in Deutschland. Schriftenreihe für Vegetationskunde 38 - Bonn: Bundesamt für Naturschutz.
Larney, F. J., and Blackshaw, R. E. (2003). Weed seed viability in composted beef cattle feedlot manure. J. Environ. Qual. 32, 1105–1113. doi: 10.2134/jeq2003.1105
Légère, A., and Samson, N. (2004). Tillage and weed management effects on weeds in barley–red clover cropping systems. Weed Sci. 52, 881–885. doi: 10.1614/WS-04-011R
Liebman, M., Gallandt, E. R., and Jackson, L. (1997). Many little hammers: ecological management of crop-weed interactions. Ecol. Agri. 1, 291–343. doi: 10.1016/B978-012378260-1/50010-5
Maclaren, C., Storkey, J., Menegat, A., Metcalfe, H., and Dehnen-Schmutz, K. (2020). An ecological future for weed science to sustain crop production and the environment. a review. Agronomy Sustain. Dev. 40, 1–29. doi: 10.1007/s13593-020-00631-6
Mahaut, L., Gaba, S., and Fried, G. (2019). A functional diversity approach of crop sequences reveals that weed diversity and abundance show different responses to environmental variability. J. Appl. Ecol. 56, 1400–1409. doi: 10.1111/1365-2664.13389
Mahé, I., Cordeau, S., Bohan, D. A., Derrouch, D., Dessaint, F., Millot, D., et al. (2021). Soil seedbank: Old methods for new challenges in agroecology? Ann. Appl. Biol. 178, 23–38. doi: 10.1111/aab.12619
Mantel, N. (1967). The detection of disease clustering and a generalized regression approach. Cancer Res. 27, 209–220.
Mccloskey, M., Firbank, L. G., Watkinson, A. R., and Webb, D. J. (1996). The dynamics of experimental arable weed communities under different management practices. J. Veget. Sci. 7, 799–808. doi: 10.2307/3236458
Mirsky, S. B., Gallandt, E. R., Mortensen, D. A., Curran, W. S., and Shumway, D. L. (2010). Reducing the germinable weed seedbank with soil disturbance and cover crops. Weed Res. 50, 341–352. doi: 10.1111/j.1365-3180.2010.00792.x
Moreau, D., Busset, H., Matejicek, A., and Munier-Jolain, N. (2014). The ecophysiological determinants of nitrophily in annual weed species. Weed Res. 54, 335–346. doi: 10.1111/wre.12090
Moreau, D., Milard, G., and Munier-Jolain, N. (2013). A plant nitrophily index based on plant leaf area response to soil nitrogen availability. Agronomy Sustain. Dev. 33, 809–815. doi: 10.1007/s13593-013-0145-x
Mortensen, D. A., Bastiaans, L., and Sattin, M. (2000). The role of ecology in the development of weed management systems: an outlook. Weed Res. 40, 49–62. doi: 10.1046/j.1365-3180.2000.00174.x
Norsworthy, J. K., and Oliveira, M. J. (2004). Comparison of the critical period for weed control in wide-and narrow-row corn. Weed Sci. 52, 802–807. doi: 10.1614/WS-03-165R
Oksanen, J. (2019). vegan: Community Ecology Package (R package Version 2.5-5). Available online at: https://CRAN.R-project.org/package=vegan (accessed December 01, 2020).
Petit, S., Cordeau, S., Chauvel, B., Bohan, D., Guillemin, J.-P., and Steinberg, C. (2018). Biodiversity-based options for arable weed management. a review. Agronomy Sustain. Dev. 38:48. doi: 10.1007/s13593-018-0525-3
Pleasant, J. M., and Schlather, K. J. (1994). Incidence of weed seed in cow (Bos sp.) manure and its importance as a weed source for cropland. Weed Technol. 8, 304–310. doi: 10.1017/S0890037X00038823
Pyšek, P., and Lepš, J. (1991). Response of a weed community to nitrogen fertilization: a multivariate analysis. J. Veget. Sci. 2, 237–244. doi: 10.2307/3235956
Rao, B. R. (1969). Partial canonical correlations. Trabajos Estadist. Investigación Oper. 20, 211–219. doi: 10.1007/BF03028532
Ryan, M. R., Smith, R. G., Mirsky, S. B., Mortensen, D. A., and Seidel, R. (2010). Management filters and species traits: weed community assembly in long-term organic and conventional systems. Weed Sci. 58, 265–277. doi: 10.1614/WS-D-09-00054.1
Sadeghpour, A., Ketterings, Q. M., Godwin, G. S., and Czymmek, K. J. (2016). Nitrogen- vs. phosphorus-based manure and compost management of corn. Agron. J. 108, 185–195. doi: 10.2134/agronj2015.0218
Sadeghpour, A., Ketterings, Q. M., Godwin, G. S., Czymmek, K. J., and Vermeylen, F. (2017). Agro-environmental consequences of shifting from nitrogen- to phosphorus-based manure management of corn. Soil Sci. Soc. Am. J. 81, 1127–1138. doi: 10.2136/sssaj2016.03.0417
Seavers, G., and Wright, K. (1999). Crop canopy development and structure influence weed suppression. Weed Res. 39, 319–328. doi: 10.1046/j.1365-3180.1999.00148.x
Smith, R. G., and Mortensen, D. A. (2017). “A disturbance-based framework for understanding weed community assembly in agroecosystems: challenges and opportunities for agroecological weed management,” in Agroecological Practices for Sustainable Agriculture, ed A. Wezel (London: World Scientific), doi: 10.1142/9781786343062_0005
Stevenson, F. C., Legere, A., Simard, R. R., Angers, D. A., Pageau, D., and Lafond, J. (1997). Weed species diversity in spring barley varies with crop rotation and tillage, but not with nutrient source. Weed Sci. 45, 798–806. doi: 10.1017/S0043174500088998
Storkey, J., Moss, S. R., and Cussans, J. W. (2010). Using assembly theory to explain changes in a weed flora in response to agricultural intensification. Weed Sci. 58, 39–46. doi: 10.1614/WS-09-096.1
Tang, L., Wan, K., Cheng, C., Li, R., Wang, D., Pan, J., et al. (2014). Effect of fertilization patterns on the assemblage of weed communities in an upland winter wheat field. J. Plant Ecol. 7, 39–50. doi: 10.1093/jpe/rtt018
Tilman, E. A., Tilman, D., Crawley, M. J., and Johnston, A. (1999). Biological weed control via nutrient competition: potassium limitation of dandelions. Ecol. App. 9, 103–111. doi: 10.1890/1051-0761(1999)009[0103:BWCVNC]2.0.CO;2
USDA-NRCS (2017). Fact Sheets and Plant Guides is a Partnership of the National Plant Data Team and the Plant Materials Program. Available online at: https://plants.usda.gov/java/factSheet (accessed August 20, 2017).
Vengris, J., Colby, W. G., and Drake, M. (1955). Plant nutrient competition between weeds and corn. Agron. J. 47, 213–216. doi: 10.2134/agronj1955.00021962004700050005x
Wamelink, G., Joosten, V., Van Dobben, H., and Berendse, F. (2002). Validity of Ellenberg indicator values judged from physico-chemical field measurements. J. Veget. Sci. 13, 269–278. doi: 10.1111/j.1654-1103.2002.tb02047.x
Yin, L., Cai, Z., and Zhong, W. (2006). Changes in weed community diversity of maize crops due to long-term fertilization. Crop Protection 25, 910–914. doi: 10.1016/j.cropro.2005.11.013
Keywords: agroecology, community assembly, fertilization, functional traits, seedbank
Citation: Cordeau S, Wayman S, Ketterings QM, Pelzer CJ, Sadeghpour A and Ryan MR (2021) Long-Term Soil Nutrient Management Affects Taxonomic and Functional Weed Community Composition and Structure. Front. Agron. 3:636179. doi: 10.3389/fagro.2021.636179
Received: 01 December 2020; Accepted: 13 April 2021;
Published: 10 May 2021.
Edited by:
Lauren M. Lazaro, Louisiana State University Agricultural Center, United StatesReviewed by:
Simerjeet Kaur, Punjab Agricultural University, IndiaEsmaeil Rezaei-Chiyaneh, Urmia University, Iran
Copyright © 2021 Cordeau, Wayman, Ketterings, Pelzer, Sadeghpour and Ryan. This is an open-access article distributed under the terms of the Creative Commons Attribution License (CC BY). The use, distribution or reproduction in other forums is permitted, provided the original author(s) and the copyright owner(s) are credited and that the original publication in this journal is cited, in accordance with accepted academic practice. No use, distribution or reproduction is permitted which does not comply with these terms.
*Correspondence: Matthew R. Ryan, bXJ5YW5AY29ybmVsbC5lZHU=