 John T. Sanders1
 Eric A. L. Jones1Aiden Minter1
 Robert Austin1Gary T. Roberson2Robert J. Richardson1Wesley J. Everman1*
- 1Department of Crop and Soil Sciences, North Carolina State University, Raleigh, NC, United States
- 2Department of Biological and Agricultural Engineering, North Carolina State University, Raleigh, NC, United States
Italian ryegrass [Lolium perenne L. ssp. multiflorum (Lam.) Husnot] is one of the most challenging weeds for winter wheat (Triticum aestivum L.) growers to manage. Italian ryegrass has evolved resistance to the majority of the herbicides labeled for use in wheat and the competitive ability of the species makes it a significant factor driving winter wheat production practices around the world. Previous research has utilized remotely sensed spectral imagery to detect Italian ryegrass in winter wheat to aid weed control decisions. Two studies from 2016 to 2017 were initiated with the intent of identifying the spectral reflectance properties of Italian ryegrass and winter wheat using an unmanned aerial vehicle (UAV) equipped with a 5-band multispectral sensor. Image analysis was conducted to determine the potential for species discrimination throughout the growing season. Supervised classification of the imagery was used to evaluate the ability of the UAV platform for further discrimination between Italian ryegrass and winter wheat. Species differentiation proved to be possible, however the data was not able to be referenced across dates. Due to light variability, the reflectance values changed to such a degree that unsupervised classifications were not possible using a database of values from previous flights. Supervised classification of the multispectral image resulted in >70% classification accuracy between the species. However, near infrared light consistently differed enough for accurate classification between Italian ryegrass and winter wheat across different weed densities, flight altitudes, and imaging dates. On a single field basis, species differentiation was successful and resulted in classified maps of Italian ryegrass and winter wheat. This study also analyzed the exact accuracy of the species differentiation based on the quality and uniformity of light conditions and growth stage of plants.
Introduction
Wheat (Triticum aestivum L.) is a staple crop grown worldwide (Gupta et al., 2008). Farmers around the globe produce over 708 million tons of wheat per year (United States Department of Agriculture, 2014). The United States produces ~54 million tons of wheat per year, of which 1.2 million tons are produced in North Carolina (United States Department of Agriculture, 2019). As in many agronomic crop systems, an effective weed management program plays an important role in a successful wheat growing season. Italian ryegrass [Lolium perenne L. ssp. multiflorum (Lam.) Husnot] is a prominent weed in winter wheat produced globally (Trusler et al., 2007; Ichihara et al., 2009; Scursoni et al., 2012). Appleby et al. (1976) found that yield losses due to Italian ryegrass infestations can reduce wheat yield up to 60% relative to weed density in the Pacific Northwest United States. Further research on the yield implications of Italian ryegrass infestations found that every 10 plants meter2−1 can decrease yield by 4.2% in the Southeast United States (Liebl and Worsham, 1987); if not controlled, Italian ryegrass can decimate a wheat crop yield (Hashem et al., 1998). Italian ryegrass is becoming increasingly difficult to manage due to the evolution of herbicide resistance. This species has evolved resistance to all herbicides labeled in winter wheat (Grey and Bridges, 2003; Hoskins et al., 2005; Grey et al., 2012; Heap, 2021).
Alternative approaches to weed management such as more precise, site specific practices may reduce the selection pressure on herbicides due to the fact that weeds do not grow uniformly in any crop field, rather they tend to proliferate and colonize in patches due to the nature of seed dispersal (Cardina et al., 1997; Christensen et al., 2008). Traditionally, herbicide applications are applied to the entire field at the same application rate regardless of the presence or absence of weeds within that field (Johnson et al., 1995). Due to the already limited options for effective chemical control of Italian ryegrass and the potential for the evolution of additional herbicide resistance(s), site specific weed management strategies have become necessary to reduce the amount of selection pressure exerted on weed populations (Lopez-Granados, 2010; Evans et al., 2014; Heap, 2021). In addition, utilization of easy-to-use tools which would allow for the efficient scouting of fields to identify patches of weeds within a crop will facilitate the process (Medlin et al., 2000; Lopez-Granados, 2010; Hunter et al., 2020). Previous research has demonstrated that remote sensing was successful in identifying grass weeds, specifically Lolium spp., grown in monoculture or within a winter wheat crop (López-Granados et al., 2006; Lim et al., 2015).
In monoculture settings, biomass and leaf area index (LAI) estimations have been made for Italian ryegrass detection using 3-band imagery with wavelengths centered on 550, 650, and 890 nm with good accuracy (Lim et al., 2015). Additionally, color digital imagery has been shown to be useful for monitoring Italian ryegrass growth stage progression in similar settings. Fan et al. (2016) noted that in 3-band RGB color imagery, excess reflectance within the green wavelengths provided the best parameter for growth stage estimation of Italian ryegrass. In settings where Italian ryegrass was studied as a weed in crop systems, Huang et al. (2016) identified 14 wavebands within the ranges of 400–500 nm, 650–690 nm, 730–740 nm, and 800–900 nm useful for classifying Italian ryegrass. Additionally, a trend was discovered whereby classification accuracy of Italian ryegrass from spectral signatures within these ranges increased over time. A possible explanation for this phenomenon was the fact that plant growth throughout the season made the plants easier to identify.
Since remotely sensed imagery has proven useful in agronomic weed detection (Medlin et al., 2000; Basinger et al., 2020), it may be possible to utilize unmanned aerial vehicles (UAVs) equipped with sensors to rapidly scout winter wheat fields to identify areas where Italian ryegrass is present. Unmanned aerial vehicles afford many benefits compared to traditional means of acquiring aerial imagery compared to airplanes and satellites, due to their low cost, ease of use, and high spatial and temporal resolution (Zhang and Kovacs, 2012). Imagery acquired from these UAV platforms combined with image analysis tools may be able to provide a decision aid tool to farmers that would reduce the total amount of herbicide being applied onto their fields, reduce fuel and labor costs, and provide sound environmental stewardship. The objectives of this research were to determine the accuracy of supervised classification and spectral reflectance for Italian ryegrass and winter wheat detection, if the spectral reflectance of Italian ryegrass was influenced by its density and if those densities could be accurately identified through time and across different flight altitudes.
Materials and Methods
Two field experiments were performed to study the temporal, spatial, and weed density effects on the spectral reflectance of winter wheat and Italian ryegrass plants in mixed stands. Studies were established at the Piedmont Research Station in Salisbury, North Carolina (35.70 N, −80.62 W) in 2016 and 2017. Planting was done in late October of the respective year with a 3 m wide grain drill without tillage. Glyphosate was applied to the field in both years prior to planting with a tractor-mounted sprayer. Winter wheat was seeded at a rate of 72 seeds meter−1, with a 19 cm row spacing. The soil of the field is a Lloyd clay loam (fine, kaolinitic, thermic Rhodic Kanhapludult). The experimental design was a randomized complete block with four replications; plots were 4.5 × 9.1 m. Pyroxasulfone (very-long-chain fatty acid-inhibiting herbicide; herbicide group 15) was applied to the plots at 0, 35, 70, and 105 g ai ha−1 to provide densities ranging from 0 to >90 plants m−1 of natural infestation of Italian ryegrass within the field. The herbicide application was made using a CO2-pressurized backpack sprayer calibrated to a pressure of 207 kPa, delivering 140 L ha−1 with TeeJet flat fan XR11002 nozzles (TeeJet Technologies Inc., Wheaton, IL 60187) immediately after the planting of winter wheat.
UAV and Sensor Platforms
A UAV (ATI AgBot; Aerial Technology International, Wilsonville, OR 97070) equipped with a multispectral sensor (RedEdge 5-band multispectral camera; MicaSense, Seattle, WA 98103) was flown on several dates and at two different altitudes (15 and 45 m) to acquire imagery from the experiment sites. The sensor acquires imagery from 20, 20, 10, 40, and 10 nm wide spectral bands centered on wavelengths of 475, 560, 668, 840, and 717 nm, respectively. These portions of the electromagnetic spectrum correspond to blue (Band 1), green (Band 2), red (Band 3), near infrared (Band 4), and red edge (Band 5) light. The multispectral sensor has a focal length of 5.5 mm, a horizontal field of view of 47.2° and an image resolution of 1280 × 960 pixels. Ground spatial resolution for the multispectral sensor is 8.2 cm per pixel at 120 m altitude above ground level (AGL). The spatial resolution is proportional, thus the resolution becomes 1.0 and 3.1 cm per pixel at 15 and 45 m, respectively.
Image Acquisition and Processing
Imagery was acquired on February 14, 2016; March 9, 2016; February 14, 2017, and March 9, 2017. The separation of ~1 month was used to determine if there were temporal differences between the imagery. These dates were selected to represent ~120 and 150 days after wheat planting. The dates were also selected due to the fact plants were <5 cm in size and too small to accurately distinguish between them in earlier image acquisition timings. Winter wheat was ~15 cm in height (tillering) and approaching canopy closure on the March and February imagery dates across years, respectively. Italian ryegrass was 10 cm in height (beginning to form tillers) and 15 cm in height (flowering) on the March and February imagery dates across years, respectively. Further, these two imagery dates represent a timing when management practices should be implemented and as a mapping tool to identify troublesome areas to conduct targeted management. Due to lack of rainfall following planting, crop emergence did not occur at Salisbury until late December 2016. Imagery was obtained at altitudes of 15 m AGL on each date. An effort was made to only capture imagery on clear, cloudless days at approximately solar noon. The multispectral sensor was calibrated via a calibrated reflectance panel before and after every flight to ensure radiometric integrity during processing. Raw multispectral imagery from each location and each altitude were mosaicked using MicaSense ATLAS (MicaSense, Seattle, WA 98103), resulting in a georeferenced Tagged Image File Format image (GeoTIFF).
Image Analysis and Statistical Procedures
Individually mosaicked multispectral imagery was subject to spectral analysis and image classification with ERDAS Imagine 2013 (Hexagon Geospatial US, Norcross, GA 30092) to determine the spectral properties of Italian ryegrass and winter wheat individually. Imagery acquired at both dates were analyzed to study the effect on the reflectance properties of different densities of Italian ryegrass in winter wheat. Three methods of data collection were used to compare the accuracy of each: Red Green Blue (RGB; Bands 1–3), multispectral (Bands 1–5), and filtered multispectral. Red Green Blue data was used from the multispectral sensor to replicate an RGB sensor. The multispectral data was filtered to determine if detection accuracy could increase identification success of individual plants. The filtered data was made by merging every four pixels into one pixel, in an effort to reduce the noise and identify the individual plants more precisely. Saturation of colors was also increased by 70% to highlight the reflectance differences. A subset image was taken within both of the experimental plots that represented multiple densities of Italian ryegrass in the wheat to perform the filter modifications. For the multispectral and filtered method, the bands were overlaid in 5, 4, 3 order for 2016 and 2, 3, 5 for 2017. The most effective order was different due to the variability of lighting and growth stage. On this filtered imagery, a maximum likelihood supervised classification was used to measure the accuracy of all three tested methods. Thirteen area of interest (AOI) polygons were used to train the classification system for each method. The AOIs varied in size, drawn around individual pixel clusters that represented the winter wheat, Italian ryegrass, and soil. The AOI polygons were generally uniform and covered at least 200 pixels and encompassed several crop rows and row middles. An accuracy assessment tool was used in ERDAS Imagine for each classification. Fifty test points were used throughout the image to test the accuracy of the classification for each method after the classification was executed.
Utilizing the unfiltered multispectral imagery, a 2-class maximum likelihood supervised classification intended to separate wheat and Italian ryegrass was performed on the multispectral imagery. To perform this classification, 15 training samples each representing wheat and Italian ryegrass in addition to 5 training samples meant to isolate soil were selected, although soil pixels were not analyzed for accuracy. Using these training signatures, a maximum likelihood classification was then performed. Using the “Accuracy Assessment” tool in ERDAS Imagine 2013, an accuracy assessment utilizing 100 test points was performed on each classified image to determine the user's accuracy, producer's accuracy, and overall classification accuracy with respect to each species. User's accuracy is the proportion of the map accuracy from the point of view of a map user (i.e., the software), producer's accuracy is the proportion of the map accuracy from the point of view of the map maker (i.e., the authors), and overall accuracy is the proportion of reference sites mapped correctly. Finally, the kappa statistic (K), a measure of agreement between the reference image and the classifier, was computed for each classification.
Additionally, a 6-class maximum likelihood supervised classification was performed on only the unfiltered multispectral imagery obtained from 15 m altitude using the imagery from the same dates as the two-class system. The 15 m altitude was selected to circumvent down force and airwash caused by the UAV and any effect it may have on the plant canopies. This classification scheme was to test if wheat and Italian ryegrass at various densities could be distinguished. In this classification, the first replication was used to acquire training samples, while the other three replications were used as the test classifications. From within the first replication, 7 training samples were taken per species per plot and used to perform a supervised classification on the remaining three replications of the study. Once classified, accuracy of the classification was evaluated using 60 test points that were randomly generated throughout the classified image and an accuracy assessment was performed in a matter identical to that of the species based 2-class supervised classification. Any test point falling within a control plot with a weed density of zero m2 in any of the three test replications was excluded from the accuracy assessment. By re-randomizing these test points, an effort was made to minimize the number of test points falling within these control plots. As with the species-based classification, an overall classification accuracy and K statistic was obtained for each class representing a specific species and weed density combination.
Three reflectance measurements were taken within each AOI polygons using the Spectral Profile tool in ERDAS Imagine for a total of 15 samples per plot. For imagery from the 45 m altitude, a 3 × 3-pixel neighborhood was used for each of these samples, which represented a ground area of 0.015 m2 per sample. This neighborhood size was increased to a 12 × 12-pixel neighborhood for imagery acquired from 15 m as to maintain the same ground sampling area across the imagery. These samples contained average values of spectral reflectance as digital numbers (DN) for each band for the pixel neighborhood that included and surrounded the initial target pixel. Additionally, the 15 samples were averaged to indicate reflectance across all five bands and this average reflectance value was used in the analysis. The result was that for each weed density, 540 and 8640 pixels for imagery from altitudes of 45 and 15 m respectively were used to characterize the reflectance patterns of the densities. In each treatment, regardless of pixel count and imagery altitude, the total area of the samples represent a ground sampling area of 0.9 m2. Foody et al. (2006) discusses a commonly used 30p heuristic for sample size determination when analyzing pixels for image analysis while in Foody and Mathur (2006), classification accuracy is revealed to be practically unaffected by pixel sample sizes smaller than the common 30p standard. The sample sizes used for analysis in this study exceed those put forth by the 30p standard, which would dictate at least 150 pixels be used for analysis. The mean spectral reflectance for these pixel neighborhoods according to all five bands were subjected to analysis of variance using the MIXED procedure in SAS 9.4 (SAS Institute Inc., Cary, NC) and means were separated using Tukey's Honest Significant Distance (HSD) (α = 0.10). Prior to analysis, spectral reflectance data were square root transformed to improve normality and reduce skewness of the raw data. Weed density, date, altitude (nested within date), and band were considered fixed effects. Replication was considered a random effect. Analysis was performed across bands because preliminary analysis showed an overwhelming effect of band on spectral reflectance. Weed density counts within a 1 m2 sampling area collected at every image acquisition date was used in the analysis so as to accurately represent the influence of weed density on spectral reflectance values.
Methods for Species Discrimination Between Italian Ryegrass and Winter Wheat
Acquired imagery was used to examine the spectral reflectance properties of wheat and Italian ryegrass separately. Three samples of each species were taken from each plot in the image and averaged to record reflectance across all bands using the Spectral Profile tool ERDAS Image. This procedure provided spectral reflectance measurements as a DN for 48 individual pixels per species for every image. Unlike in the density based spectral reflectance measurements, individual pixel measurements were favored for this analysis to maintain the integrity of the sample and to eliminate any effect of spectral mixing that may have occurred due to the two species growing in proximity to each other. The effect of spectral mixing would skew the reflectance value for the pixel taking toward a composite response proportional to the constituent features contained within that pixel. Species spectral reflectance data were subjected to an analysis of variance using the PROC MIXED procedure in SAS 9.4, means were separated using Tukey's HSD (α = 0.10). Weed density, date, altitude (nested within date), and species were considered fixed effects. Replication was considered a random effect. Field-collected density counts of Italian ryegrass were used to combine different densities into four groups such that a density value of 1, 2, 3, or 4 was assigned to plots that had Italian ryegrass densities of 0–30, 31–60, 61–90, and 90+ plants m−2 to simplify the analysis. These densities were achieved applying pyroxasulfone as previously described.
Results and Discussion
Supervised Classification for Italian Ryegrass and Winter Wheat Discrimination
The accuracy of species detection across years and imagery dates, from least to most accurate, was RGB, unfiltered multispectral, then filtered multispectral (Figures 1, 2). The accuracy for the classification methods accuracies were <30% (RGB), 91% (unfiltered multispectral), and 96% (filtered multispectral) for the February imagery timing in 2016 (Figure 1). The accuracy of the RGB classification did not change at the March imagery date. The unfiltered multispectral decreased to 67% and the filtered multispectral classification increased to 96% (Figure 1). The classification method accuracies in 2017 followed a similar trend; however the classification accuracy achieved by the RGB classification was significantly higher (Figure 2). The RGB classification remained stagnant (February: 70%; March 68%), the unfiltered multispectral classification accuracy decreased over time (February: 87%; March: 76%), and the filtered multispectral classification accuracy increased over time (February: 83%; March 99%) (Figure 2). The RGB classification method does not achieve high accuracy with few training points compared to the unfiltered- and filtered multispectral classification. The unfiltered multispectral classification method achieves higher accuracy early in the season, whereas the filtered multispectral classification method higher accuracy later in the season.
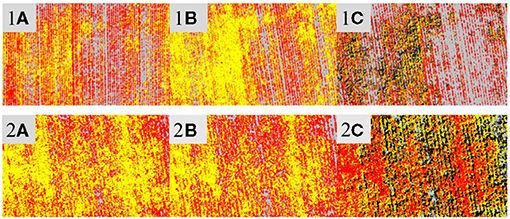
Figure 1. Supervised classification method (A: red-blue-green [RGB]; B: unfiltered multispectral; C: filtered multispectral) to distinguish between Italian ryegrass (yellow) from winter wheat (red) across imagery dates (1: February; 2: March) in 2016. Supervised classification was conducted with imagery acquired with an unmanned aerial vehicle equipped with a multispectral sensor. Red-blue-green classification accuracy did not change across imagery dates (<30%). Unfiltered multispectral classification accuracy decreased across imagery dates (February: 91%; March: 67%). Filtered multispectral classification increased across imagery dates (February: 94%; March: 96%).
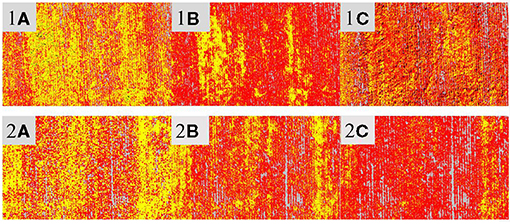
Figure 2. Supervised classification method (A: red-blue-green [RGB]; B: unfiltered multispectral; C. filtered multispectral) to distinguish between Italian ryegrass (yellow) from winter wheat (red) across imagery dates (1: February; 2: March) in 2017. Supervised classification was conducted with imagery acquired with an unmanned aerial vehicle equipped with a multispectral sensor. Red-blue-green classification accuracy did not change across imagery dates (February: 70%; March: 68%). Unfiltered multispectral classification accuracy decreased across imagery dates (February: 87%; March: 76%). Filtered multispectral classification increased across imagery dates (February: 83%; March: 99%).
The two-class supervised classification to discriminate between Italian ryegrass and wheat ranged from 52 to 78% accuracy (Table 1). Classification of the imagery ranged from 64–78% across species. Classification accuracy of the imagery from February 14 demonstrated an increase in accuracy between the species being observed with increasing altitude. At the 15 m altitude, observed overall accuracy was 67% (Kc = 0.34) but increased to 78% (Kc = 0.56) in the 45 m imagery. The imagery from March 9 did not display a clear effect of altitude on overall classification accuracy. The classification of 15 m imagery resulted in accuracy of 64% (Kc = 0.28) being observed, while accuracy decreased to 70% (Kc = 0.40) in the 45 m imagery. Across both studies, the effect of imaging date or altitude did not appear to influence the overall classification of species in a predictable fashion. Instead, classification accuracy is reliant on the status of inherent conditions specific to each image. Regardless, the results from these studies show that success can be achieved when using multispectral imagery to discriminate between Italian ryegrass and wheat in a two-class system. The classification accuracies of these studies are slightly lower than those observed in previous work involving weed detection in wheat, potentially due to the phenotypic similarities that exist between the species (López-Granados et al., 2006; Lim et al., 2015).
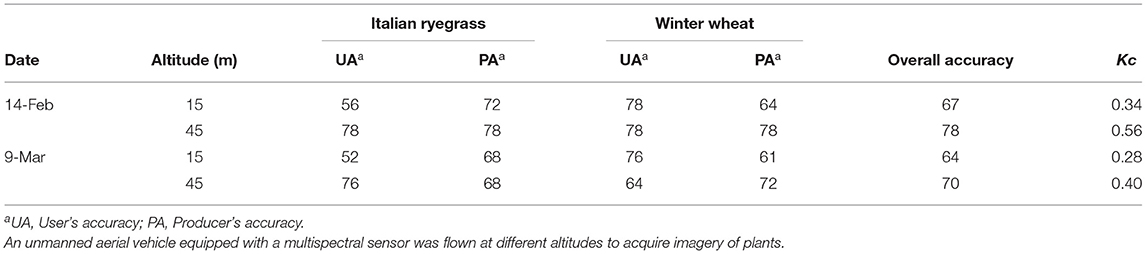
Table 1. Summary of the 2-class supervised classification of discriminating between Italian ryegrass and winter wheat at different dates.
Previous work in utilizing aerial imagery was successful in discriminating between broadleaf weeds (Diplotaxus spp. and Sinapis spp.) and winter wheat. Aerial color and infrared imagery were utilized by de Castro et al. (2012) to detect these weed species growing in winter wheat fields with 64-99.9% accuracy. Furthermore, using satellite-borne multispectral imagery, de Castro et al. (2013) were able to classify imagery with 91% overall accuracy using a maximum likelihood classifier meant to delineate winter wheat and broadleaf weed species. Eddy et al. (2013) utilized 7 bands of a large hyperspectral dataset to classify redroot pigweed (Amaranthus retroflexus L.) and wild oats (Avena fatua) from spring wheat. An overall accuracy of 94% was achieved in discriminating between redroot pigweed and wheat, but accuracy did decrease to 88% in the classification systems meant to discriminate between wild oat and wheat. Previous research would suggest that classification success in wheat systems relies more on inherent spectral and morphological differences between the species rather than imaging conditions.
The six-class classification system was less successful than the two-class system at both locations of the study (Table 2). Classification accuracy for the February 14, 2017 imagery was 31.1% (Kc = 0.18) but did increase in the later season imagery from March 9, 2017 to 45.5% (Kc = 0.34) (Table 2). As was observed with the two-class system, there is not substantial evidence that the imaging dates used for these studies significantly influenced overall classification accuracy in the six-class system (Tables 2, 3).
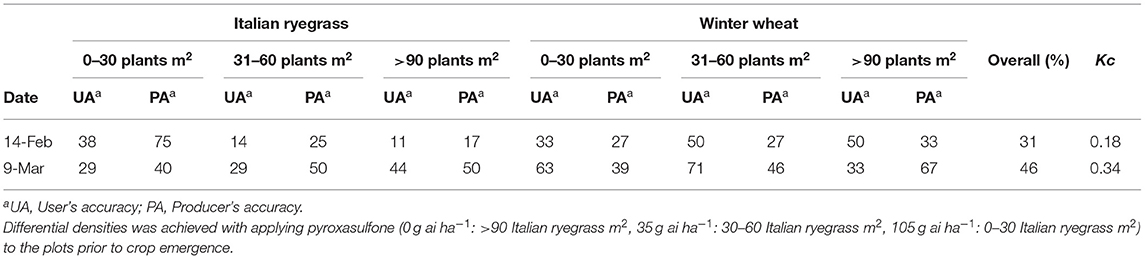
Table 2. Summary of the 6-class supervised classification of discriminating between Italian ryegrass and winter wheat under different densities of each species with an unmanned aerial vehicle equipped with a multispectral sensor to acquire imagery flown at 15 m.
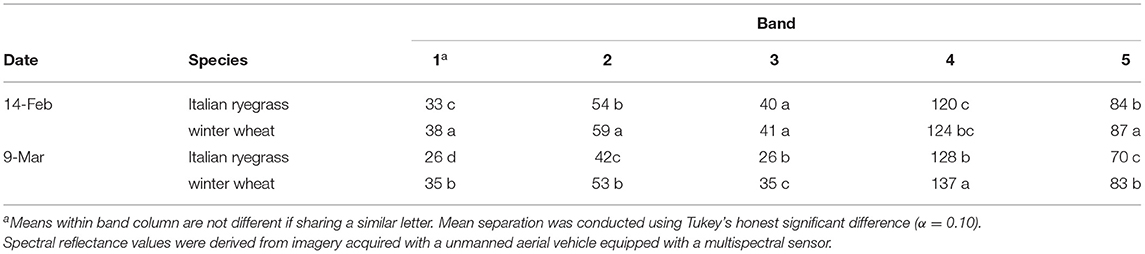
Table 3. Spectral reflectance values within distinct bands of Italian ryegrass and winter wheat across imaging dates.
The introduction of a weed density component into training sample selection for image classification decreased the accuracy of Italian ryegrass and winter wheat discrimination (Table 2). Gray et al. (2009) achieved widely variable results when adding a weed density component to classifications to discriminate between various weed species from soybean (Glycine max L.). Depending on the weed species and density present, accuracies ranging from 8 to 79% were achieved using a density-based classification scheme while accuracies of above 88% were consistently achieved for three-class systems meant to discriminate between soybean, soil and a particular weed species (Gray et al., 2009). The negative effect on detection accuracy with the inclusion of weed density could be exacerbated by the phenotypic similarities between Italian ryegrass and winter wheat. Accurate spectral characterization of the respective species via hyperspectral remote sensing may enhance the understanding of these two species. Such work may provide the basis for prospective classification methodologies to create more refined and more accurate maps of Italian ryegrass infestations.
Spectral Reflectance Patterns of Italian Ryegrass and Winter Wheat
A two-way interaction involving date and species was significant in all bands (Table 3). Additionally, an interaction was found to be present between weed density and plant species for bands 1 and 3. An interaction between altitude and species for bands 3 and 4 was found as well (Table 3). On the February 14, 2017 imaging date, reflectance values were significantly different between Italian ryegrass and winter wheat for every band except bands 3 and 4 (Table 3). However, on the March 9, 2017 imaging date, reflectance values of the two species were statistically separable for every band (Table 3). This result provides evidence of the temporal effect on the spectral reflectance of the two species which could influence detection accuracy. The spectral reflectance of Italian ryegrass was less than winter wheat at both imaging dates and across bands 1, 2, 3, and 5. Italian ryegrass reflectance within band 4 increased between February 14 and March 9. Across every imaging date, band 4 reflectance was the most intense.
The interaction between weed density and species for bands 1 and 3 suggests some degree of spectral mixing is occurring. Reflectance within band 1 for Italian ryegrass decreased when weed density increased (Table 4). The spectral reflectance pattern of wheat remained about the same regardless of the surrounding weed densities (Table 4). The two species did remain spectrally distinct from one another at every weed density within band 1 (Table 4). Reflectance from within band 3 was different between the two species at the weed densities >30 plants m−2 (Table 4). Reflectance of the individual species themselves within band 3 remained unchanged as weed density increased, countering the trend observed through reflectance in band 1.
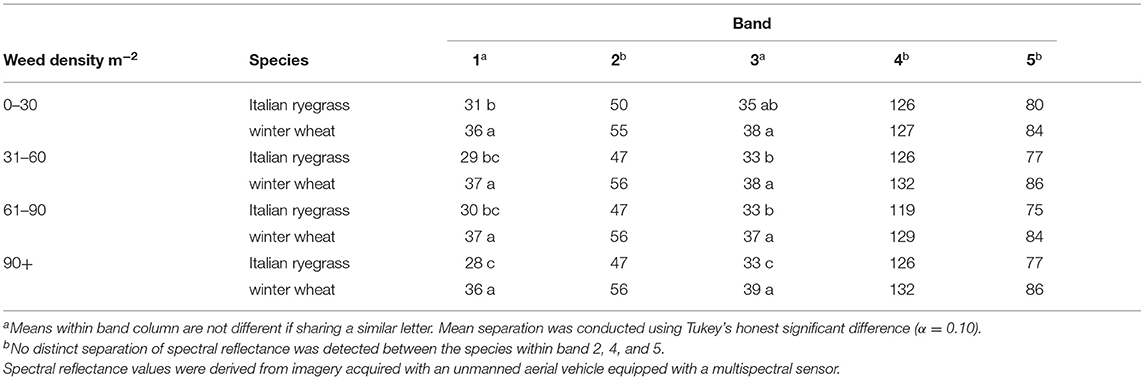
Table 4. Spectral reflectance values within distinct bands of Italian ryegrass and winter wheat across different surrounding weed densities (Italian ryegrass).
On February 14, there was a significant effect of altitude on reflectance within band 3, characterized by a decrease in reflectance with increasing altitude for Italian ryegrass and an increase in winter wheat reflectance with altitude (Table 5). By the March 9 imaging date, any effects of altitude on reflectance disappeared as reflectance was inseparable for both species between every altitude. Spectral differences were significant between the two species in band 3 at every date and altitude, indicating the ability to consistently discriminate utilizing this band. Band 4 reflectance appears to demonstrate the effects of altitude on spectral reflectance in a more distinct matter than band 3, in that differences in reflectance between Italian ryegrass and winter wheat were only significant at certain altitudes on certain imaging dates. Largely, the effect of altitude on imagery acquisition did not influence reflectance of either (Table 5).
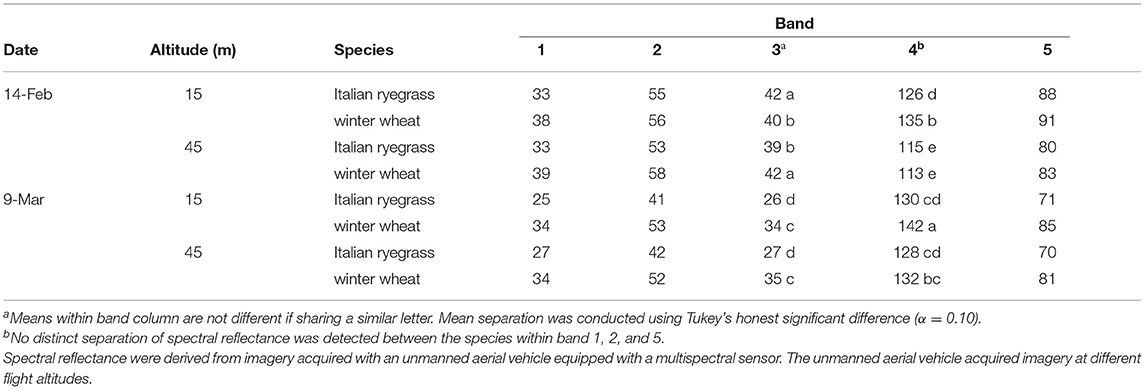
Table 5. Spectral reflectance values within distinct bands of Italian ryegrass and winter wheat across imaging dates and flight altitudes.
The two species differing in reflectance in every band provides significant evidence that the species are readily detectable with contemporary remote sensing technologies. López-Granados et al. (2006) observed clear discrimination between ryegrass (Lolium rigidum Gaud.) and wheat using reflectance within the ranges of 400-900 nm. The spectral range that was used by López-Granados et al. (2006) encompasses the range incorporated in this research; which is also useful for delineating Italian ryegrass and winter wheat. Lim et al. (2015) demonstrated identifying Italian ryegrass in wheat using three-band imagery centered on wavelengths of 550, 650, and 890 nm. The findings of Lim et al. (2015) corroborate the findings of these studies, as these wavebands correspond roughly to bands 2, 3, and 4 that were used in this research. In the multispectral sensor used in this research, these bands have centers of 560, 668, and 840 nm, respectively, and the image analyses provided similar results. Regardless of altitude or image date, reflectance was always found to be the most intense in band 4, and that reflectance within this band increased significantly as the season progressed. This result is expected, as near infrared light has been used previously as an indicator of vegetative health (Thorp and Tian, 2004). Band 4 has a center of 840 nm and is located within the near infrared range of the electromagnetic spectrum, and the increase in reflectance observed within this band across dates is likely due to plant growth.
Spectral Reflectance Patterns of Italian Ryegrass Population Densities
Date and altitude were found to influence spectral reflectance as a function of weed density while weed density itself was found to be largely insignificant within all bands except one (Table 6). There was an overwhelming effect of band on the mean spectral reflectance values for the pixel neighborhoods in preliminary analyses making band specific analyses desirable. Date had a more significant influence on the pixel neighborhood mean reflectance values compared to altitude and no interactions were present (Table 6). Spectral reflectance within bands 1 and 3 decreased later in the season while reflectance in band 5 increased, while reflectance in band 4 increased from the March to February imagery (Table 6). Reflectance values within band 2 declined in mid-season imagery but increased to mimic early season reflectance levels late in the season. Contrary to the other bands, reflectance in band 4 increased throughout the season. All weed densities were indistinguishable from one another at every band (Table 6). Within band 4, however, only weed densities of between 0 and 30 plants m−2 were distinguishable from the highest density consisting of weed populations of 31–40 plants m−2, with higher weed densities conferring decreased levels of spectral reflectance in this band.
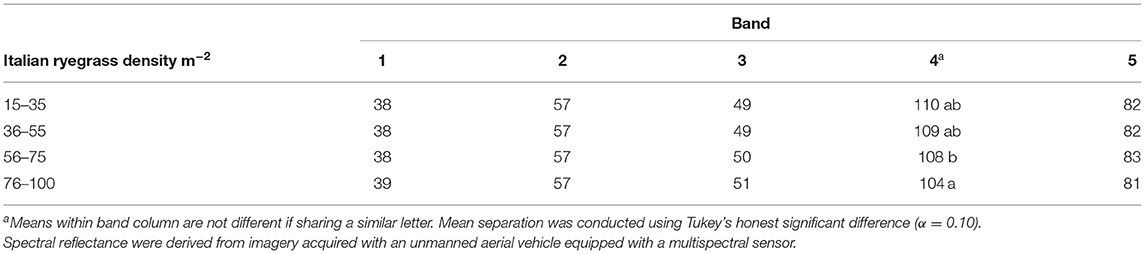
Table 6. Spectral reflectance of Italian ryegrass grown in different densities (plants m−2) across imagery dates and altitudes.
Band 4 was the only band in which Italian ryegrass weed density was a significant factor influencing spectral reflectance (Table 6). Spectral reflectance differed significantly for weed densities of 56–75 plants m−2 and 76–100 plants m−2 in band 4. While density was found to be a non-significant factor within band 2, reflectance differed within this band for weed densities of 15–35 m−2 and 76–100 plants m−2. Spectral reflectance within band 4 exceeded reflectance in any other band at every date and altitude. Additionally, every band was unable to separate the different Italian ryegrass densities except band 4, which has a center at 840 nm and lies within the near infrared region of the electromagnetic spectrum This finding is consistent with the results of Huang et al. (2016) which found wavelengths within the near infrared region between 800 and 900 nm particularly useful for Italian ryegrass detection. This also coincides with findings from other studies, which have found that weed detection and separation between crop species and weed species is enhanced within this portion of the electromagnetic spectrum (Menges et al., 1985; López-Granados et al., 2006; Shapira et al., 2013).
The results indicate that the spectral reflectance of plots containing mixed stands of wheat and various densities of Italian ryegrass differ most with respect to date, suggesting that temporal conditions affect the spectral reflectance of mixed stands of the species. This result is unsurprising, as conditions can vary substantially on a day to day basis, and vary even more substantially over a period of several months. Factors such as sun angle and weather conditions specific to a particular day as well as changes in spectral responses derived from the growth of both crop and weed species throughout the season could all alter the spectral properties of Italian ryegrass weed densities. The latter point is of particular interest, given that early in the season the role of soil on spectral reflectance is more pronounced than later in the season where gaps between plants gradually fill with vegetative material. Soil and plant spectra have been found to interact in a non-additive and nonlinear fashion to produce a cumulative spectral response, lending support to the temporal influence on spectral reflectance patterns (Thorp and Tian, 2004). Further work will be needed to substantiate these hypotheses involving field conditions and to explore more classification methods or techniques that may be able to accurately classify Italian ryegrass from wheat regardless of these ephemeral conditions that may influence plant spectra.
The findings with respect to band 4 are of particular interest. Thorp and Tian (2004) report that near infrared (near IR) light between 700 and 850 nm (band 4) is a good indicator of the relative health of vegetation. The observed increase in reflectance in band 4, which has a 40 nm bandwidth centered on 840 nm, is likely to be a consequence of an increase in vegetative mass that occurred as both Italian ryegrass and winter wheat grew throughout the season. In addition, band 4 is the only band where weed density was a significant factor influencing overall spectral reflectance. These findings, which suggest that band 4 is particularly useful for discriminating between the spectral reflectance values of different weed densities, lend support to the idea that sensors could be designed and optimized to detect discrete densities of weed plants.
Supervised classification is an expedited analysis; only giving qualitative results of the imagery (i.e., is it species A or is it species B). Although supervised classification is a basic analysis it still has value as it is a means to rapidly identify weeds in the field, so it is important to evaluate its utility for our most basic objective to discriminate between crop and weed. Since the supervised classification was relatively accurate, the spectral reflectance data explained why the classifier performed how it did. If there are a lot of spectral similarities between the crop and weed in most of the bands, it can introduce confusion into the classification algorithm and reduce accuracy. Thus, by pinpointing regions of the electromagnetic spectrum where larger separations exist between crop and weed we can enhance future classification endeavors and quantitatively determine to what extent crop/weeds differ in the reflectance.
In conclusion, this research has shown that species level discrimination is possible between wheat and Italian ryegrass throughout (and across) the growing season and across various flight altitudes. Supervised classification of filtered- and unfiltered multispectral imagery provided >70% accuracy in species classification. While spectral reflectance was highly variable across the factors in the experiment, the ability for band 4 (near IR) to consistently differ between the two species is promising. The light reflectance from band 4 (near IR) to confer information about plant vigor and biomass was reinforced and the utility of this wavelength for conferring information about weed density was discovered. Species is a significant factor influencing spectral reflectance and spectral reflectance values differ between the two species within every band. These results suggest that Italian ryegrass and winter wheat are spectrally distinct; thus can be discriminated between each other with remote sensing. The relatively high accuracy of detecting Italian ryegrass in winter wheat (>70%) derived from the multispectral and filtered multispectral supervised classification could be coupled with reflectance indices from band 4 to further improve classification accuracy. Furthermore, the distinction between the species manifests as markedly weaker reflectance by Italian ryegrass as compared to winter wheat. The date at which imagery was acquired proved to influence of the reflectance values of the two species. Band 4 (near IR) reflectance is consistently the most intense regardless of temporal or environmental factors observed in this study. Thus, future research should focus on utilizing narrower bands within the near IR wavelength (700-850 nm) for more precise classification of Italian ryegrass within winter wheat. What is less clear is the influence of time in the growing season on spectral reflectance in other wavebands and whether or not different wavebands may be of use earlier or later in the season. Additional research will also be needed to more precisely define the influence of weed population density on spectral mixing that may influence spectral reflectance at the species level and to join this information with image resolution dependent phenomena which may be influencing reflectance values within the imagery.
Data Availability Statement
The raw data supporting the conclusions of this article will be made available by the authors, without undue reservation.
Author Contributions
JS conducted research, analysis, and manuscript writing. EJ and AM conducted analysis, manuscript writing, and revision. RA, GR, RR, and WE oversas research, research conceptualization, analysis, manuscript writing, and revision. All authors contributed to the article and approved the submitted version.
Funding
Funding was provided by The Small Grains Grower Association of North Carolina.
Conflict of Interest
The authors declare that the research was conducted in the absence of any commercial or financial relationships that could be construed as a potential conflict of interest.
References
Appleby, A., Olson, P., and Colbert, D. (1976). Winter wheat yield reduction from interference by Italian ryegrass. Agron. J. 68, 463–466. doi: 10.2134/agronj1976.00021962006800030007x
Basinger, N. T., Jennings, K. M., Hestir, E. L., Monks, D. W., Jordan, D. L., and Everman, W. J. (2020). Phenology affects differentiation of crop and weed species using hyperspectral remote sensing. Weed Technol. 34, 897–908. doi: 10.1017/wet.2020.92
Cardina, J., Johnson, G. A., and Sparrow, D. H. (1997). The nature and consequence of weed spatial distribution. Weed Sci. 45, 364–373. doi: 10.1017/S0043174500092997
Christensen, S., SØgaard, H. T., Kudsk P NØrremark, M., Lund, I., Nadimi, E. S., and JØrgensen, R. (2008). Site-specific weed control technologies. Weed Res. 49, 233–241. doi: 10.1111/j.1365-3180.2009.00696.x
de Castro, A. I., Jurado-Exposito, M., Pena-Barragan, J. M., and Lopez-Granados, F. (2012). Airborne multi-spectral imagery for mapping cruciferous weeds in cereal and legume crops. Precis. Agric. 13, 302–321. doi: 10.1007/s11119-011-9247-0
de Castro, A. I., Lopez-Granados, F., and Jurado-Exposito, M. (2013). Broad-scale cruciferous weed patch classification in winter wheat using QuickBird imagery for in-season site-specific control. Precis. Agric. 14, 392–413. doi: 10.1007/s11119-013-9304-y
Eddy, P. R., Smith, A. M., Hill, B. D., Peddle, D. R., Coburn, C. A., and Blackshaw, R. E. (2013). Weed and crop discrimination using hyperspectral image data and reduced bandsets. Can. J. Remote Sens. 39, 481–490. doi: 10.5589/m14-001
Evans, J. A., Tranel, P. J., Hager, A. G., Schutte, B., Wu, C., Chatham, L. A., and Davis, A. S. (2014). Managing the evolution of herbicide resistance. Pest Manag. Sci. 72, 74–80. doi: 10.1002/ps.4009
Fan, X., Kawamura, K., Lim, J., Yoshitoshi, R., Yuba, N., Lee, H., Kurokawa, Y., and Tsumiyama, Y. (2016). Spring growth stage detection in italian ryegrass field using a ground-based camera system. Grassl. Sci. 62, 188–193. doi: 10.1111/grs.12122
Foody, G. M., and Mathur, A. (2006). The use of small training sets containing mixed pixels for accurate hard image classification: training on mixed spectral responses for classification by a SVM. Remote Sens. Environ. 103, 179–189. doi: 10.1016/j.rse.2006.04.001
Foody, G. M., Mathur, A., Sanchez-Hernandez, C., and Boyd, D. S. (2006). Training set size requirements for the classification of a specific class. Remote Sens. Environ. 104, 1–14. doi: 10.1016/j.rse.2006.03.004
Gray, C. J., Shaw, D. R., and Bruce, L. M. (2009). Utility of hyperspectral reflectance for differentiating soybean (Glycine max) and six weed species. Weed Technol. 23, 108–119. doi: 10.1614/WT-07-117.1
Grey, T. L., and Bridges, D. C. (2003). Alternatives to diclofop for the control of Italian ryegrass (Lolium multiflorum) in winter wheat (Triticum aestivum). Weed Technol. 17, 219–223. doi: 10.1614/0890-037X(2003)017[0219:ATDFTC]2.0.CO;2
Grey, T. L., Cutts, G. S., Sosnoskie, L., and Culpepper, A. S. (2012). Italian ryegrass (Lolium perenne) control and winter wheat response to POST herbicides. Weed Technol. 26, 644–648. doi: 10.1614/WT-D-12-00046.1
Gupta, P. K., Mir, R. R., Mohan, A., and Kumar, J. (2008). Wheat genomics: present status and future prospects. Int. J. Plant Genom. 2008:896451. doi: 10.1155/2008/896451
Hashem, A., Radosevich, S. R., and Roush, M. L. (1998). Effect of proximity factors on competition between winter wheat (Triticum aestivum) and Italian ryegrass (Lolium multiflorum). Weed Sci. 46, 181–190. doi: 10.1017/S0043174500090391
Heap, I. (2021). International survey of herbicide resistant weeds. Available online at: http://weedscience.org/in.asp (Accessed March 8, 2021).
Hoskins, A., Young, B. G., Krausz, R. F., and Russin, J. S. (2005). Control of Italian ryegrass (Lolium multiflorum) in winter wheat. Weed Technol. 19, 261–265. doi: 10.1614/WT-03-118R3
Huang, Y., Lee, M. A., Thomson, S. J., and Reddy, K. N. (2016). Ground-based hyperspectral remote sensing for weed management in crop production. Int. J. Agric. Biol. Eng. 9, 98–109. doi: 10.3965/j.ijabe.20160902.2137
Hunter, J. E., Gannon, T. W., Richardson, R. J., Yelverton, F. H., and Leon, R. G. (2020). Integration of remote-weed mapping and an autonomous spraying unmanned aerial vehicle for site-specific weed management. Pest Manag. Sci. 76, 1386–1392. doi: 10.1002/ps.5651
Ichihara, M., Yamashita, M., Sawada, H., Kida, Y., and Asai, M. (2009). Influence of after-ripening environments on the germination characteristics and seed fate of Italian ryegrass (Lolium multiflorum). Weed Biol. Manag. 9, 217–224. doi: 10.1111/j.1445-6664.2009.00342.x
Johnson, G. A., Mortensen, D. A., and Martin, A. R. (1995). A simulation of herbicide use based on weed spatial distribution. Weed Res. 35, 197–205. doi: 10.1111/j.1365-3180.1995.tb02033.x
Liebl, R., and Worsham, A. D. (1987). Interference of Italian ryegrass (Lolium multiflorum) in wheat (Triticum aestivum). Weed Sci. 35, 819–823. doi: 10.1017/S0043174500079406
Lim, J., Kawamura, K., Lee, H., Yoshitoshi, R., Kurokawa, Y., Tsumiyama, Y., and Watanabe, N. (2015). Evaluating a hand-held crop-measuring device for estimating the herbage biomass, leaf area index and crude protein content in an italian ryegrass field. Grassl. Sci. 61, 101–108. doi: 10.1111/grs.12083
Lopez-Granados, F. (2010). Weed detection for site-specific weed management: mapping and real-time approaches. Weed Res. 51, 1–11. doi: 10.1111/j.1365-3180.2010.00829.x
López-Granados, F., Jurado-Expósito, M., Peña-Barragán, J. M., and García-Torres, L. (2006). Using remote sensing for identification of late-season grass weed patches in wheat. Weed Sci. 54, 346–353. doi: 10.1614/WS-05-54.2.346
Medlin, C. R., Shaw, D. R., Gerard, P. D., and LaMastus, F. (2000). Using remote sensing to detect weed infestations in Glycine max. Weed Sci. 48, 393–398. doi: 10.1614/0043-1745(2000)048[0393:URSTDW]2.0.CO;2
Menges, R. M., Nixon, P. R., and Richardson, A. J. (1985). Light reflectance and remote sensing of weeds in agronomic and horticultural crops. Weed Sci. 33, 569–581. doi: 10.1017/S0043174500082862
Scursoni, J. A., Palmano, M., De Notta, A., and Delfino, D. (2012). Italian ryegrass (Lolium multiflorum Lam.) density and N fertilization on wheat (Triticum aestivum L.) yield in Argentina. Crop Prot. 32:36–40. doi: 10.1016/j.cropro.2011.11.002
Shapira, U., Herrmann, I., Karnieli, A., and Bonfil, D. J. (2013). Field spectroscopy for weed detection in wheat and chickpea fields. Int. J. Remote Sens. 34:6094–6108. doi: 10.1080/01431161.2013.793860
Thorp, K. R., and Tian, L. F. (2004). A review on remote sensing of weeds in agriculture. Precision Agric. 5:477–508. doi: 10.1007/s11119-004-5321-1
Trusler, C. S., Peeper, T. F., and Stone, A. E. (2007). Italian ryegrass (Lolium multiflorum) management options in winter wheat in Oklahoma. Weed Technol. 21:151–158. doi: 10.1614/WT-06-038.1
United States Department of Agriculture (2014). Wheat: Planted Acreage, Harvest Acreage, Production, Yield and Farm Price. Available online at: http://www.ers.usda.gov/dataproducts/wheat-data.aspx#25184
United States Department of Agriculture (2019). State Agricultural Overview: North Carolina. Available online at: https://www.nass.usda.gov/Quick_Stats/Ag_Overview/stateOverview.php?state=NORTH%20CAROLINA
Keywords: remote sensing—GIS, species discrimination, unmanned aerial vehicle, weed management, spectral reflectance
Citation: Sanders JT, Jones EAL, Minter A, Austin R, Roberson GT, Richardson RJ and Everman WJ (2021) Remote Sensing for Italian Ryegrass [Lolium perenne L. ssp. multiflorum (Lam.) Husnot] Detection in Winter Wheat (Triticum aestivum L.). Front. Agron. 3:687112. doi: 10.3389/fagro.2021.687112
Received: 29 March 2021; Accepted: 16 June 2021;
Published: 15 July 2021.
Edited by:
Ujjwal Bhattacharya, Indian Statistical Institute, IndiaReviewed by:
Simerjeet Kaur, Punjab Agricultural University, IndiaYanbo Huang, United States Department of Agriculture (USDA), United States
Copyright © 2021 Sanders, Jones, Minter, Austin, Roberson, Richardson and Everman. This is an open-access article distributed under the terms of the Creative Commons Attribution License (CC BY). The use, distribution or reproduction in other forums is permitted, provided the original author(s) and the copyright owner(s) are credited and that the original publication in this journal is cited, in accordance with accepted academic practice. No use, distribution or reproduction is permitted which does not comply with these terms.
*Correspondence: Wesley J. Everman, V2VzbGV5X0V2ZXJtYW5AbmNzdS5lZHU=