 Silvia Panozzo
 Maurizio Sattin
- Institute for Sustainable Plant Protection (IPSP)—CNR, AGRIPOLIS, Legnaro, Italy
Sorghum halepense (L.) Pers. is a troublesome weed of maize which reproduces through seeds and rhizomes. Resistance to ACCase-inhibiting herbicides due to a target-site mutation Ile-Asn in position 2041 of the ACCase gene was confirmed in several populations in Italy. The presence of fitness costs related to the allelic variant Ile2041Asn has never been investigated in ACCase-resistant S. halepense. Three growth analyses pot experiments were performed starting from rhizome buds (Exp1 and Exp3) or seed (Exp2). Plant development was monitored throughout the life cycle through destructive samplings. The mutation responsible for resistance to ACCase inhibitors was detected in all plants included in the experiments using a Cleaved Amplified Polymorphic Sequence method. Classical growth analysis was performed for the multiple sampling experiments (Exp1 and Exp2) and allometric relationships were calculated for the different dry weight plant parts in all experiments. Allometric relationships showed that susceptible (S) and ACCase resistant (R) biotypes allocated biomass differently in the reproductive structures: S populations allocated on average 30% more biomass in the panicles, whereas R populations allocated 12% more biomass to rhizomes than S populations. This was more evident when the experiments started from rhizomes buds. Reproductive allocation and reproductive effort were higher in S biotypes and R biotypes, respectively. The higher production of rhizomes and the lower production of seeds of the R biotype can significantly impact the evolution of herbicide resistance under continuous application of herbicides with the same mode of action. A medium-long term resistance management strategy which implements appropriate soil tillage and crop rotation taking into account the different reproductive attitude of biotypes S and R should be devised.
Introduction
Fitness is a phenotypic response resulting from the combination of evolved life-history traits and is significantly influenced by environmental (Frenkel et al., 2017) and genetic variations (Vila-Aiub et al., 2015; Cousens and Fournier-Level, 2018). When herbicides are present, evolved herbicide resistance alleles are expected to endow a fitness advantage over the wild allele. However, it is argued that resistance alleles will have pleiotropic fitness costs, i.e., the so-called resistance cost, when the ability of a weed to survive and/or reproduce in the absence of the herbicide selective pressure is decreased (Vila-Aiub et al., 2011). More generally, mutations that confer resistance to xenobiotics are often thought to carry an associated fitness cost in the absence of the selection pressure (Coustau et al., 2000). From an evolutionary perspective, a plant fitness cost associated with evolved herbicide resistance is seen as an “adaptation cost” to the herbicide (Vila-Aiub et al., 2011). The generalization of this concept has been challenged by studies demonstrating that herbicide resistance is not consistently associated with reduced fitness. Fitness costs related to herbicide resistance-endowing mutations are not universal and therefore must be assessed on a case-by-case basis (Baucom, 2019). The phenotypic expression of “resistance costs” depends on weed species, type of mutation, genetic background, dominance of the fitness cost and environmental conditions (Roux et al., 2004; Vila-Aiub, 2019).
The main goal of a fitness cost analysis is to determine the penalties associated with a given allele (Murphy and Tranel, 2019). There are many studies quantifying the fitness costs associated with herbicide resistance alleles, reflecting their importance in determining the evolutionary dynamics of resistance (Darmency et al., 2015). Several have reported lack of (or variation in) fitness costs among different genetic backgrounds (Menchari et al., 2008; Vila-Aiub et al., 2009; Délye et al., 2013). Several factors should be considered to evaluate the effective fitness costs associated to herbicide resistance. In particular, the control of genetic background is essential to unequivocally ascribe fitness penalties to those genes that endow resistance (Paris et al., 2008; Darmency et al., 2015). By controlling the genetic background, the genetic variability between resistant and susceptible genotypes is restricted, so that only the effect of the allelic substitution at the resistance locus on plant fitness traits is assessed (Vila-Aiub et al., 2011). The definition of plant fitness as “the relative number of offspring contributing to next generations by one phenotype in comparison with another” (Primack and Kang, 1989) has led to many fitness studies that compared seed production between herbicide resistant and susceptible individuals (Menchari et al., 2008). However, the amount of seeds produced is not the only criterion to evaluate fitness costs, especially when “agronomic” fitness, rather than biological fitness is being evaluated (Parks et al., 1996; Vila-Aiub et al., 2005) and when species that reproduce not only via seeds are considered (Arriola and Ellstrand, 1997). A better understanding of the cost/benefit trade-offs of resistant and susceptible alleles is important for predicting the evolutionary dynamics of herbicide resistance (Neve et al., 2003) and devising strategies that allow fitness costs to be manipulated to result in selection against resistance alleles (Keshtkar et al., 2019).
Previous studies assessed the pleiotropic effects of the most common Acetyl-CoA Carboxylase (ACCase) allelic variations (i.e., Ile1781Leu, Ile2041Asn, and Asp2078Gly) that confer resistance to herbicides in Lolium rigidum Gaudin (Vila-Aiub et al., 2015), Alopecurus myosuroides Huds. (Menchari et al., 2008; Darmency et al., 2015), Setaria viridis (L.) Beauv. (Wang et al., 2010), Avena sterilis L. (Papapanagiotou et al., 2015), and Hordeum glaucum Steud. (Shergill et al., 2016). In many cases it was reported that resistant biotypes had no reduction in fitness. Regarding the Ile2041Asn, no adverse pleiotropic effects were found on vegetative and reproductive plant traits in either A. myosuroides (Menchari et al., 2008) or A. sterilis (Papapanagiotou et al., 2015). Conversely, a fitness cost associated with the same mutation was highlighted in H. glaucum (Shergill et al., 2016).
Several populations of S. halepense resistant to ACCase-inhibiting herbicides have been reported in northern Italy (GIRE, 2021) and have infested summer dicot crops, mainly soybean and tomato. Molecular analysis confirmed that in all resistant populations a single amino acid substitution Ile2041Asn had occurred in the ACCase gene (Scarabel et al., 2014). Sorghum halepense (L.) Pers. (johnsongrass) is an invasive, tetraploid, C4, predominantly self-pollinated, geophyte weed of Mediterranean summer crops (Warwick and Black, 1983).
There is a paucity of information about possible fitness penalties related to Ile2041Asn ACCase resistance-endowing mutation in S. halepense. These studies are important to develop alternative and integrated management strategies which fit the biology as well as the evolutionary adaptation of the weeds in order to decrease the use of chemical control and the consequent selection of resistant biotypes. Therefore, the aim of this study was to identify possible fitness costs associated to the Ile2041Asn mutation in the ACCase gene using a “multiple populations” approach (Tardif et al., 2006; Vila-Aiub et al., 2011).
Materials and Methods
Plant Material
Four resistant (R) populations of S. halepense selected in different areas of northern Italy and three susceptible (S) populations (two collected in northern Italy and one from Hungary) were included in the experiments (Table 1). Previous research revealed that S populations were totally controlled by the recommended field rate of both aryloxyphenoxypropionate (FOP) and cyclohexanedione (DIM) families of the ACCase inhibitors, whereas the R populations survived the application of high rates of FOP herbicides, but showed a slight loss of susceptibility to DIMs herbicides (Scarabel et al., 2014). Populations were sampled from fields at least 10 km apart and each sample included seeds from 20 mature plants. Seeds were then cleaned, air-dried, and stored at room temperature.
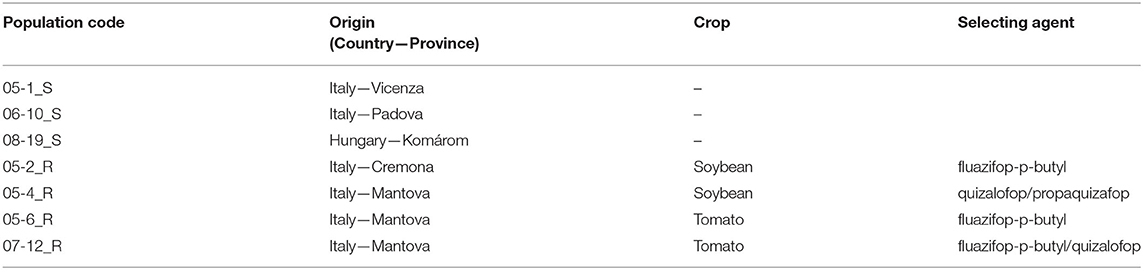
Table 1. Details of populations investigated in the growth analysis experiments.
Molecular analyses confirmed that plants of the R populations analyzed carried an insensitive ACCase target enzyme due to an Ile-to-Asn substitution at codon 2041 (Scarabel et al., 2014).
Growth Analysis Pot Experiments
Three growth analysis outdoor pot experiments (hereinafter called Exp1, Exp2 and Exp3), were conducted in a semi-controlled environment in 3 consecutive years: pots with a single plant of S. halepense were placed under an anti-hail net and a drip irrigation system was set up to maintain each pot at or near field capacity. Each pot was covered with a cone of non-woven fabric (open at the top) just before plant flowering to collect the seeds. Each experiment had specific characteristics because the protocol was adapted year by year based on the results obtained the year before. Rhizome buds were used as starting material in Exp1 and Exp3, whereas seeds were used in Exp2; this implies that different numbers have been used in the different experiments to have adequate statistical units (i.e., less plants when they originated from rhizome buds because they can be considered as clones, more plants when they originated from seeds because they are different genetic units), for more details see the following sections. In Exp1 and Exp2 phenological observations as well as destructive samplings were periodically performed during the life cycle, whereas in Exp3 only the final destructive sampling was done. Therefore, growth analysis was performed only for Exp1 and Exp2, whereas data of Exp3 were compared with data collected at the last sampling of Exp1 and Exp2. The last sampling of the three experiments was done at the end of September, which mimics the soybean harvest time in Italy.
Molecular Analyses: CAPS 2041 on ACCase Gene
For each experiment, when plants reached the three-four leaf stage, a small young leaf (about 100 mg) of each plant of both R and S populations included in the experiment was sampled and gDNA was extracted using CTAB method (Doyle and Doyle, 1987) to be analyzed through a CAPS method (Cleaved Amplified Polymorphic Sequence) (Kaundun and Windass, 2006) modified for the detection of mutation 2041 in Scarabel et al. (2014). The CAPS method allows presence/absence of the mutation 2041 to be detected (amino acid position corresponds to ACCase coding sequence of A. myosuroides [Genbank AC: AJ 310767]) analyzing the result of a PCR amplification with specific primers, SORG-For-2027 and SORG-2-REV (Scarabel et al., 2014), on an agarose gel followed by digestion with the endonuclease EcoRI. For the detailed protocol see Scarabel et al. (2014).
In Exp1 and Exp3 the starting material for each population was rhizome buds, that produced genetic clones of the original plant which were used as replicates. Therefore, only gDNA from the four mother plants for each population included in the experiment was extracted and analyzed through CAPS. Both experiments included 28 plants: 12 from susceptible populations (4 plants for three S populations), and 16 from resistant populations (4 plants for four R populations). In Exp2, the 42 plants included in the last sampling were analyzed with CAPS method (i.e., 6 plants per population): 18 from susceptible populations (6 plants for each of the 3 S populations) and 24 from resistant populations (6 plants for each of the 4 R populations).
Exp1
At the beginning of May, seeds of both susceptible and resistant populations were chemically scarified in concentrated sulfuric acid (96 %) for 5 min, thoroughly rinsed and placed in plastic boxes containing peat; boxes were put in a germination cabinet at 25/15°C for 6 days and then 20 seedling were transplanted in pots containing a standard potting mix (60% silty loam soil, 15% sand, 15% perlite, and 10% peat). At 2–3 leaf stage (about 10 days after transplanting) plants of S populations were transplanted in big pots (30 L) (one plant per pot), whereas plants of R populations were treated with the ACCase inhibitor fluazifop-p-butyl (250 g a.i. L−1) following the protocol reported by Panozzo et al. (2015). The herbicide was applied using a precision bench sprayer delivering 300 L ha−1, at a pressure of 215 kPa, and a speed of 0.75 m s−1, using a boom equipped with three flat-fan (extended range) hydraulic nozzles (TeeJet®, 11002). Four weeks after treatment, survivors (i.e., resistant individuals) were then transplanted into 30 L pots. For both S and R selected plants, at the end of September, shoots were removed and pots containing the substrate with roots and rhizomes were left to overwinter outdoors. In the following spring, rhizomes were extracted from pots, cut into segments containing one bud and put into pots filled with a silty-loam soil. Four plants were considered for each population. For each plant, three rhizome buds (i.e., three clones) were planted in 30 L pots (one clone per pot), regularly watered throughout the growing season to keep the soil at or near field capacity and fertilized as needed with Nitrofosca (15-9-15 N-P-K).
Plant development was monitored throughout the life cycle. A classical growth analysis approach (Hunt, 1990; Hunt et al., 2002) was followed through five destructive samplings (approximately 30 days apart) at temperature sums (°C) of 58, 263, 555, 955 and 1530 (temperature sum 0 was set when 50% seedling emergence was recorded). Temperature sum was calculated as cumulative sum of Growing Degree Days calculated for each experimental day with the following equation:
where Tmax and Tmin are the daily maximum and minimum temperatures, respectively, and Tbase is the base temperature, estimated to be 11.8°C for S. halepense (Masin et al., 2010).
At each sampling time, based on the development stage of johnsongrass plants, plant height, number of tillers and panicles per plant were recorded. The aboveground part of plants was divided into main stems and tillers, panicles and seeds, and belowground part was washed from soil and divided into rhizomes and roots. The plant material was oven dried for 36 h at 105°C and then weighed.
Classical growth analysis was performed, calculating mean indexes between consecutive samplings and coupling plants randomly within each population. Relative Growth Rate (RGR) was calculated as follows:
where RGR1−2 is the mean relative growth rate between t1 and t2 expressed in terms of GDD and lnW2 and lnW1 are the natural logarithm of the plant weight at time t2 and t1, respectively.
Data collected in the last samplings of Exp1 and Exp2 and in the unique sampling of Exp3, where used for the calculation of allometric relationships and therefore evaluate the changes in the biomass allocation in different plant organs. The following indexes were considered: percentage of the different plant parts on the total dry weight; ratio between root and rhizome dry weight and ratio between rhizome and panicle dry weight; Root Shoot Ratio, which was calculated as the ratio between dry weight of the belowground (rhizomes + roots) and aboveground part of the plants and thus will be called Root Shoot Ratio system (RSRs); the Reproductive Allocation (RA), defined as the proportion of total biomass devoted to reproductive structures, was calculated as the ratio between panicles dry weight and total aboveground dry weight; the Reproductive Effort (RE), which refers to the investment in reproduction, i.e., the proportion of total biomass invested in all reproductive organs (panicles and rhizomes in our case study), was calculated as the ratio between dry weight of rhizomes plus panicles and total dry weight (above + belowground dry weight in our case study) (Reekie and Bazzaz, 2000; Weiner, 2004).
Exp 2
In early spring, seeds of S. halepense were chemically scarified in concentrated sulphuric acid (96%) and placed in 14 cm diameter pots containing silty-loam soil (85%) and perlite (15%). Pots were placed in a greenhouse where the temperature ranged between 14/19 and 24/37°C night/day, respectively. To ensure that all plants included in the growth analysis experiment were resistant, at 2–3 leaf stage seedlings of the resistant populations were sprayed with fluazifop-p-butyl at 375 g a.i. L−1. Susceptible populations were not sprayed. The herbicide was applied as described in Exp1 section. Pots were transferred outdoors and, 2 weeks after treatment, resistant plants at a very similar growth stage (about 10–12 leaf stage) were transplanted into pots of different size based on the timetable of the samplings (the same was done for susceptible populations), which were watered daily and fertilized as needed with Nitrofosca (15-9-15 N-P-K). Six plants for each population were harvested at each of the four samplings (~30 days apart) at temperature sums (°C) of 454, 957, 1260 and 1395 (temperature sum 0 was set when 50% emergences were recorded). Depending on plant growth stage, several characteristics were recorded: plant height, no. of tillers and panicles per plant, leaf area was measured using an area meter Licor Model 3100 and dry weight was determined for different plant parts divided in stems, leaves (dried and green), panicles and seeds for the aboveground part and in roots and rhizomes for the belowground part. Plant material was oven dried for 36 h at 105°C and weighed. At the last sampling, seeds were separated from rachis to evaluate the real seed production and a linear regression analysis was performed using the software Statistica® 7 to evaluate the correlation between the two variables. Classical growth analysis was performed as in Exp1. Furthermore, indexes including leaf area, NAR (Net Assimilation Rate), LAR (Leaf Area Ratio), SLA (Specific Leaf Area) and LWR (Leaf Weight Ratio), were calculated as follows:
where NAR1−2 is the mean net assimilation rate between t1 and t2 expressed in terms of GDD, W2 and W1 are the plant weights at time t2 and t1, lnLA2 and lnLA1 are the natural logarithms of the plant leaf area at time t2 and t1, LA2 and LA1 are the plant leaf area at time t2 and t1;
where LAR1−2 is the arithmetic mean of the ratios between leaf area and total dry weight of the plant at time t1 and t2 expressed in terms of GDD;
where SLA1−2 is the arithmetic mean of the ratios between leaf area and dry weight of the leaves at time t1 and t2 expressed in terms of GDD;
where LWR1−2 is the arithmetic mean of the ratios between dry weight of leaves and total dry weight per plant at time t1 and t2 expressed in terms of GDD. Allometric relationship were calculated as in Exp1.
Exp 3
Rhizomes produced by survivors from the herbicide treatment in Exp2 were used as starting material. Two replicates of four plants per population (two bud fragments per plant) were considered.
Rhizomes fragments were transplanted in 30 L pots filled with silty-loam soil (85%) and perlite (15%) in late spring, watered daily and fertilized as needed with Nitrofosca (15-9-15 N-P-K). A unique sampling was performed at the end of September at temperature sum 1395°C. Plant height was measured, no. of tillers and panicles per plant were counted and dry weight was determined for different plant parts: stems, leaves and panicles for the aboveground part, roots, and rhizomes for the belowground part. The plant material was oven dried for 36 h at 105°C and weighed. Allometric relationships were calculated as in the other two experiments and results were compared.
Statistical Analyses
Data from the last sampling of Exp1 and Exp2 and from the unique sampling of Exp3 were analyzed through ANOVA and Fisher LSD test (P < 0.05) for the main traits to evaluate biomass allocation and allometric relationships, considering clones (Exp1 and Exp3) and plants, populations, and resistance status (S and R) as variables. The software Statistica® 7 was used. For all other samplings standard errors were calculated for each mean value.
Results
CAPS 2041 on ACCase Gene
The homozygous wild type plants with 2041-Ile allele showed two bands of 190 and 170 bp, whereas mutant plants with at least one 2041 mutated allele displayed one undigested band of 360 bp. For this research, it was enough to detect the presence of the mutation 2041 and CAPS analysis confirmed its presence in all plants of R populations: all 16 plants analyzed in Exp1, 24 in Exp2 and 16 in Exp3 had the undigested band at 360 bp indicating that at least a mutated allele 2041-Asn was present. Whereas, all the 12 (Exp1) plus 24 (Exp2) plus 12 (Exp3) plants analyzed for the susceptible populations showed the digested band at 190 bp indicating that non-mutated alleles were presents in the ACCase gene of plants belonging to susceptible populations.
Biomass Allocation
No significant differences intra populations (i.e., among clones in Exp1 and Exp3, or plants in all experiments) were detected through ANOVA, as well as no significant differences were found among populations, therefore data of single populations are not presented and only mean data grouping populations with the same resistance status (i.e., S or R) are reported.
No differences in total weight between S and R ACCase populations were recorded in Exp1 (Figure 1A). However, R populations produced more belowground biomass, whereas S populations allocated more biomass in the aboveground plant parts, especially in panicles. In Exp2 (Figure 1B), only for panicle dry weight in the last sampling a significant difference between S and R were detected. In the unique sampling of Exp3 (Table 2) results are in keeping with Exp1, although differences are not as marked as in Exp1, which may be related to the different starting material used in the experiments. In all experiments differences between S and R biotypes were also recorded for panicle numbers (Figure 2).
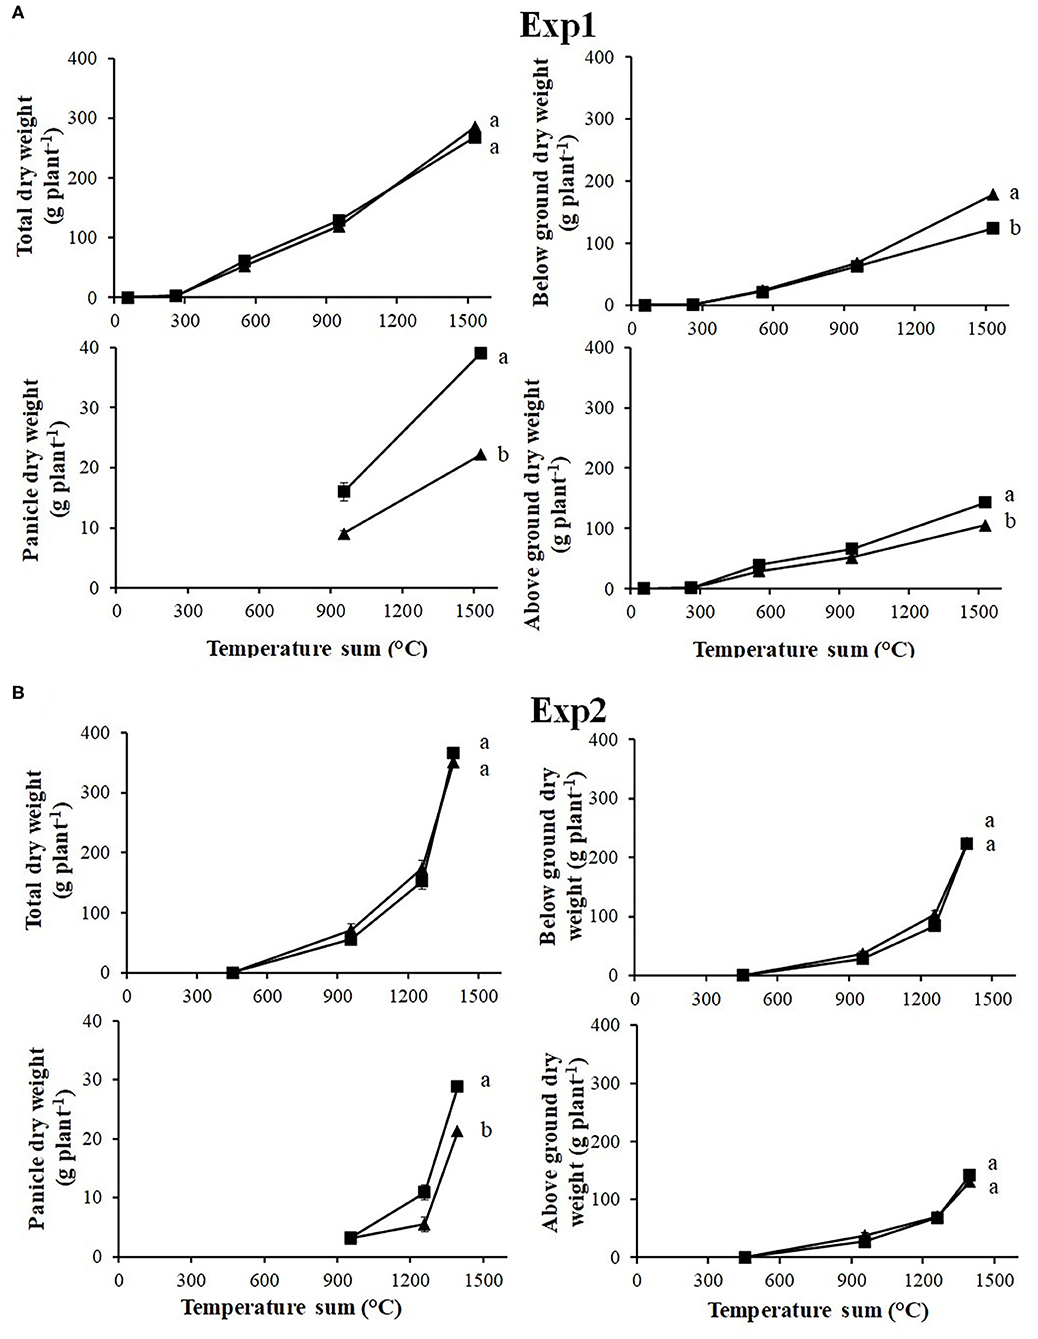
Figure 1. Evolution of total dry weigh and dry weight of the different plant parts during the life cycle recorded for (A) Exp1 and (B) Exp2. Resistance status: S (■) and R (▴). Vertical bars represent standard errors. Different letters indicate significant differences (P ≤ 0.05) according to Fisher's LSD test.
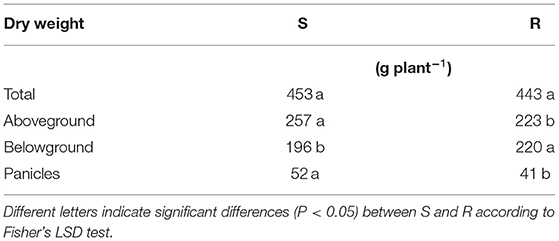
Table 2. Total dry weight and dry weight of different plant parts (aboveground, belowground and panicles) of Exp3 in relation to the resistance status: susceptible (S) and resistant (R) to ACCase inhibitors.
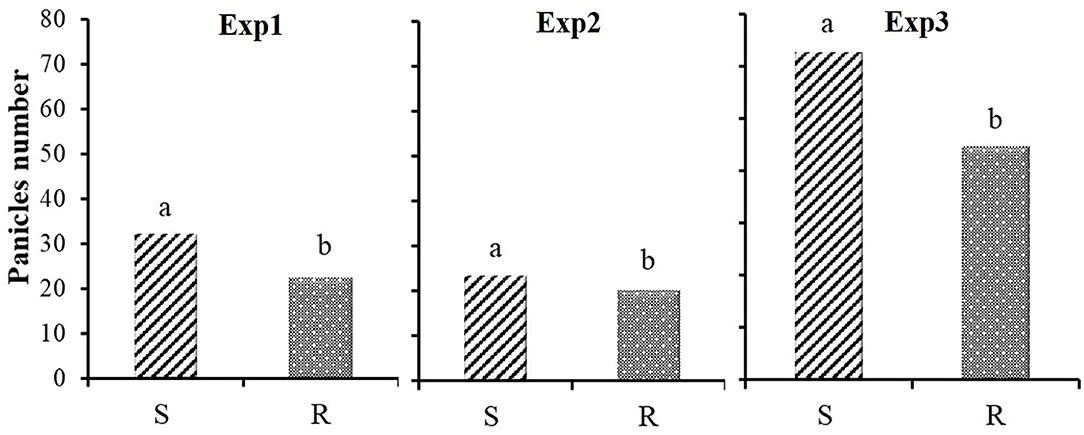
Figure 2. Number of panicles registered at the final harvest for plants S  and R
and R  in the three experiments. Different letters indicate significant differences (P ≤ 0.05) separated by Fisher's LSD test.
S. halepense matures seeds over quite a long period and in practice it is difficult to determine the real seed production. Therefore, in all experiments panicles weight was measured but, at the last sampling of Exp2, seeds were separated from rachis and the weight of both determined. The two variables proved to be highly correlated (R2 = 0.96) (Figure 3) and therefore, it was plausible to use panicle dry weight to evaluate the plant reproductive effort.
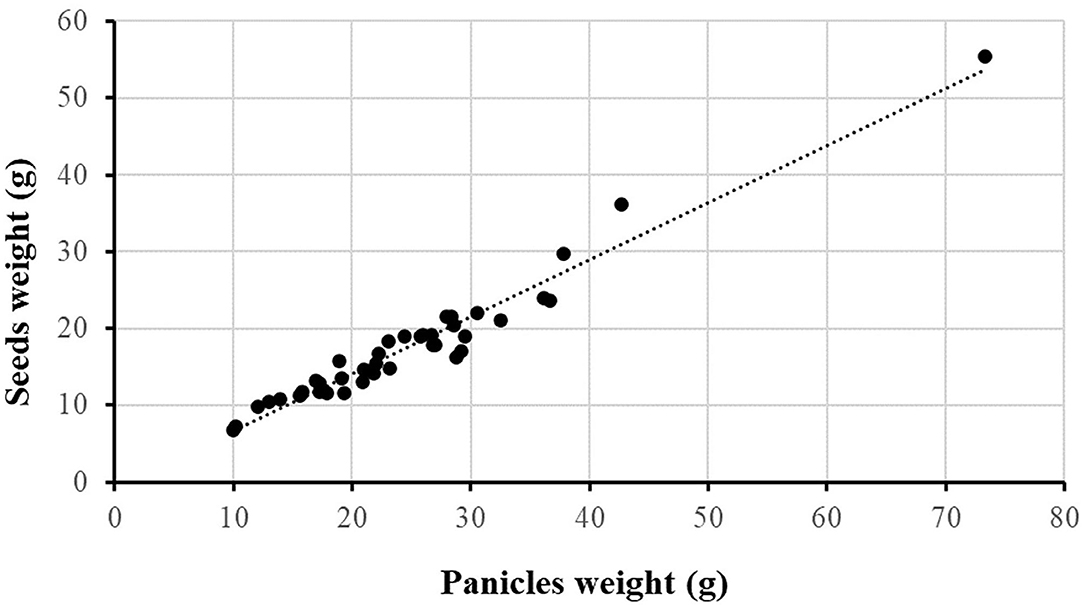
Figure 3. Correlation between panicles and seeds dry weight evaluated with data collected in the last sampling of Exp2. Dashed line represents the linear regression of the data.
Classical Growth Analysis, Exp1 and Exp2
In both experiments, R and S populations showed a few minor differences in terms of AGR (data not shown) and RGR calculated on the whole plant (Figure 4): at the beginning of Exp1 the R populations grew faster than S with a relative growth rate higher of about 25%, 10.1 and 7.5 g g−1°C−1, respectively (Figure 4). However the S populations grew slightly faster in the second period (11.3 g g−1°C−1), whereas R populations maintained the same trend (10.2 g g−1°C−1). By the end of the growing season, the two biotypes produced similar quantities of biomass (Figure 1).
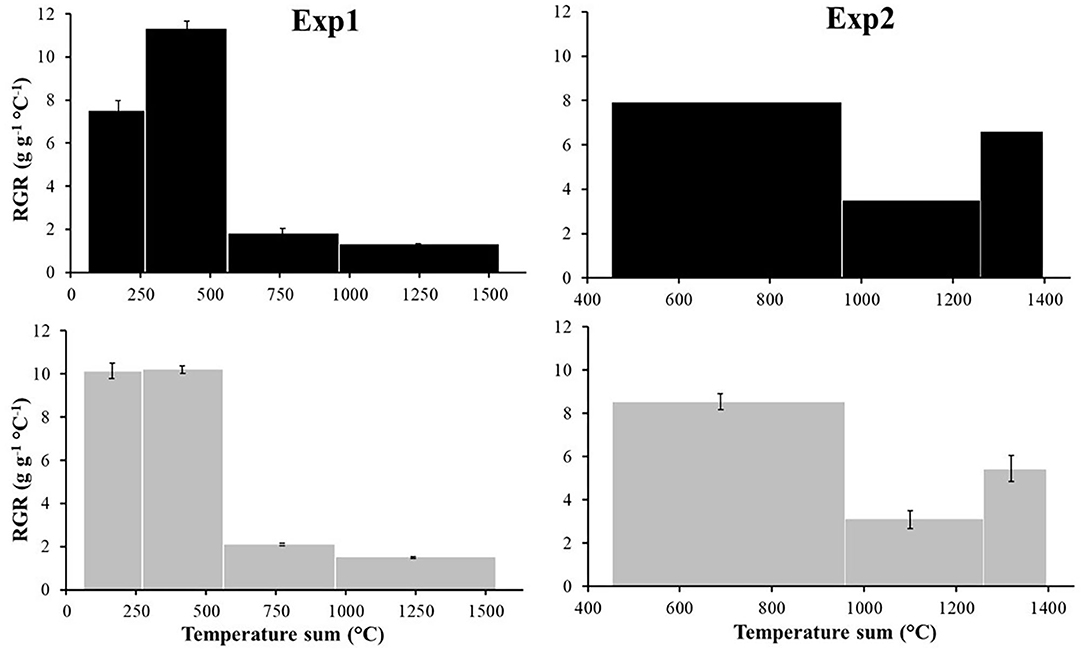
Figure 4. Relative Growth Rate (RGR) [g g−1°C−1] of Exp1 and Exp2 according to the resistance status, S (■) and R (▴). Vertical bars represent standard errors.
Leaf area recorded in Exp2 did not show any significant differences among biotypes during the whole life cycle (data not shown) and so the indexes related to leaf area also did not show significant differences (Table 3). It seems that S populations had significantly thinner leaves than R populations (>SLA index in all the periods analyzed), which transmitted more light, indicating a higher ability to accumulate resources useful for plant development, whereas no substantial differences were observed in the index that describes the leafiness of plants (LAR index). The LWR was higher for R biotype, indicating a higher investment of these plants in the leaf apparatus, fundamental for photosynthesis.
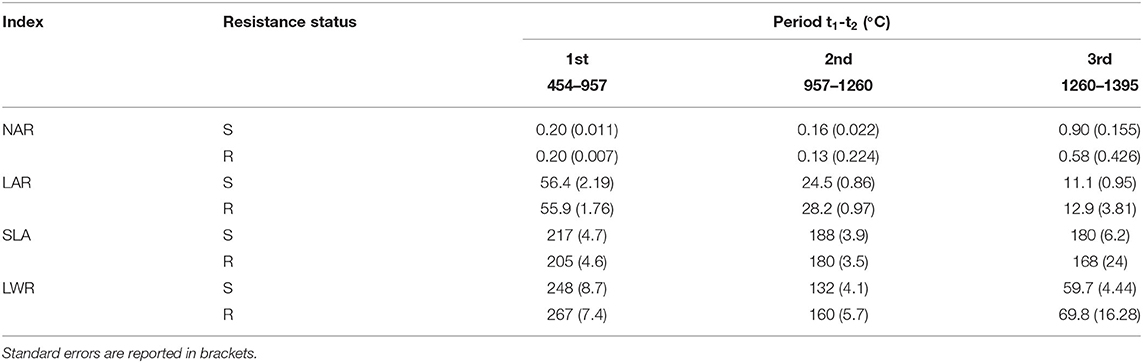
Table 3. Net assimilation rate (NAR) [g cm−2°C−1], leaf area ratio (LAR) [cm2 g−1], specific leaf area (SLA) [cm2 g−1] and leaf weight ratio (LWR) [g g−1] recorded in Exp2 in relation to the resistance status, S and R.
Allometric Ratios
Ratios between dry weight of different plant parts and total dry weight showed that S and R populations had a significantly different pattern of biomass allocation between above-ground and belowground plant parts, with more biomass allocated belowground for R populations (see also Figure 1A). This is due to a significantly higher biomass allocation to rhizomes: the percentage of rhizomes dry weight was higher for the resistant biotype, whereas the percentage of roots dry weight was not significantly different for the two biotypes (Figure 5). Results were consistent between Exp1 and Exp3 when rhizomes were used as starting material, whereas no significant differences between S and R were found in belowground biomass allocation in Exp2 (when the starting material was seed) (Figure 1B). In this experiment the biomass allocated to roots for R populations was higher than for S populations, whereas biomass allocated to rhizomes was similar (Figure 5).
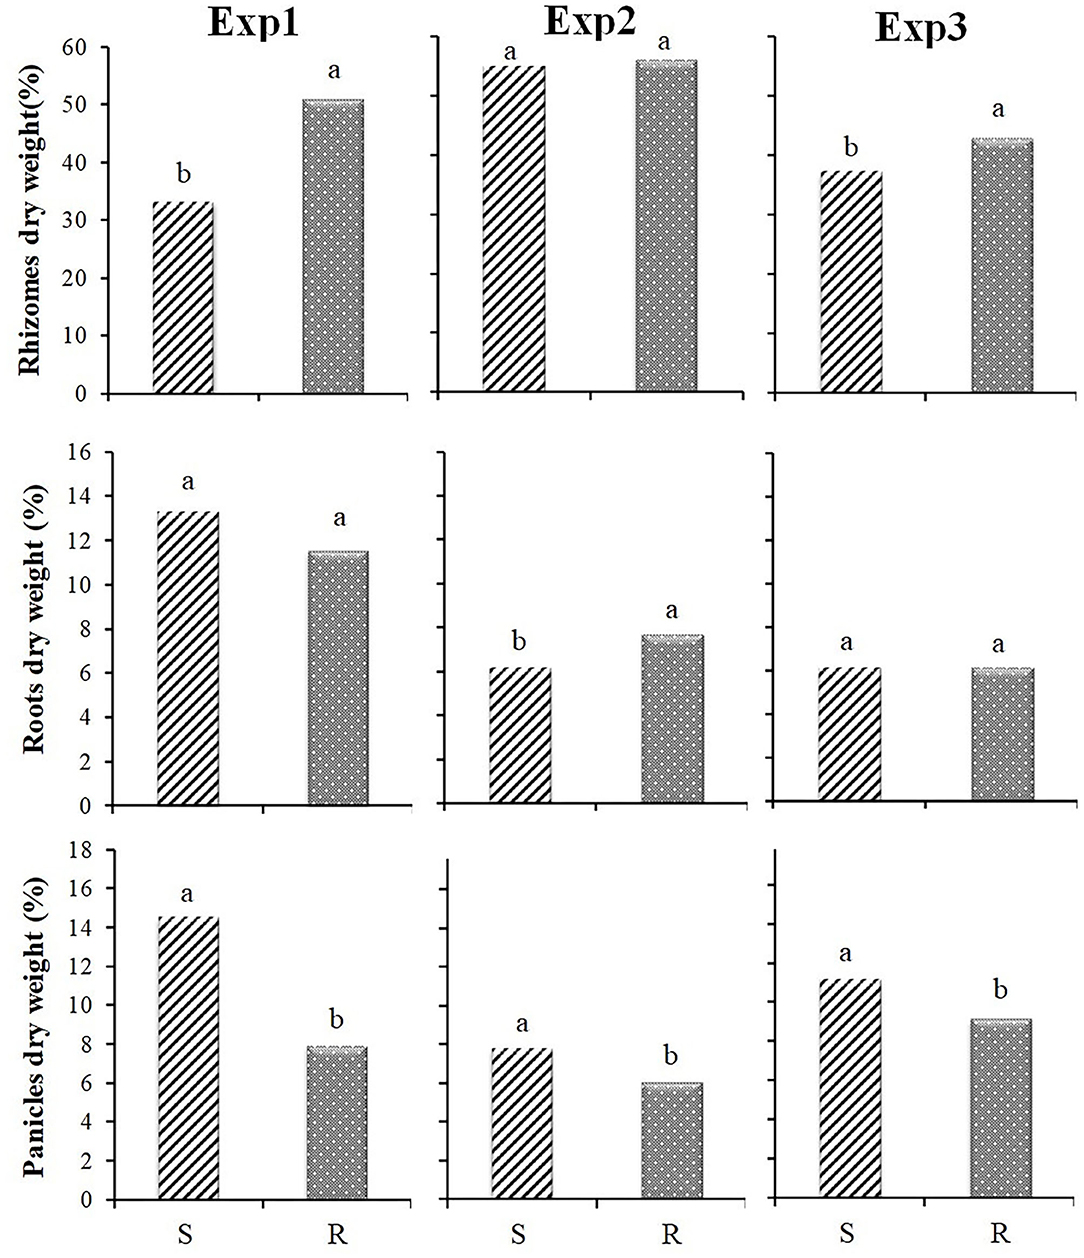
Figure 5. Percentage of biomass allocated to different plant parts at the final harvest by plants S and R in relation to the total biomass for the three experiments: rhizomes, roots and panicles. Different letters indicate significant differences (P ≤ 0.05) separated by Fisher's LSD test.
Significant differences between S and R biotypes were also recorded for panicles number (Figure 2), and consequently biomass allocated in panicles clearly showed that S populations proportionally allocated more biomass than R populations in this plant part, without regard to the starting material (Figure 5).
As mentioned above, the results of Exp1 and Exp3 growth analyses, when plants grew from rhizomes, were consistent, showing a different and complementary development of rhizomes and roots in R and S populations, especially when the ratio between dry weight of rhizomes and roots was considered (Figure 6). The rhizomes/panicles weight ratio showed a significant difference between S and R biotypes in all experiments (Figure 6). This is mainly due to the significantly lower panicle production of the R populations in all the experiments: S populations showed values about 45, 25 and 20% higher in Exp1, Exp2 and Exp3, respectively (Figure 5).
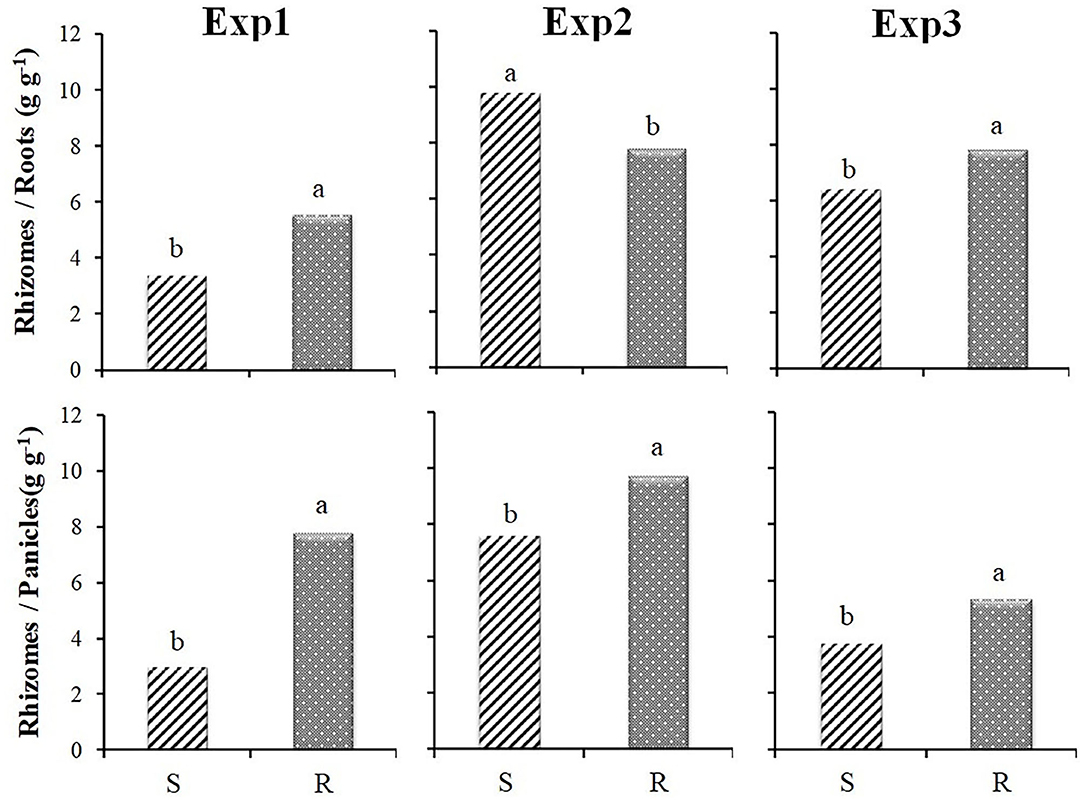
Figure 6. Ratio between rhizome and root dry weight and between rhizome and panicle dry weight for the three experiments in relation to the resistance status (S and R ). Different letters indicate significant differences (P ≤ 0.05) according to Fisher's LSD test.
The results of Exp2, when plants grew from seeds, partly confirmed the results of the other experiments, although the differences were less evident. However, the rhizome/root weight ratio showed different behavior (Figure 6), being significantly higher for S populations due to the higher root production of the R populations (Figure 5).
The Root Shoot Ratio system (RSRs) was calculated considering the complex of roots and rhizomes. It showed significant differences between S and ACCase resistant biotypes in all three experiments (Figure 7), with higher values for R populations.
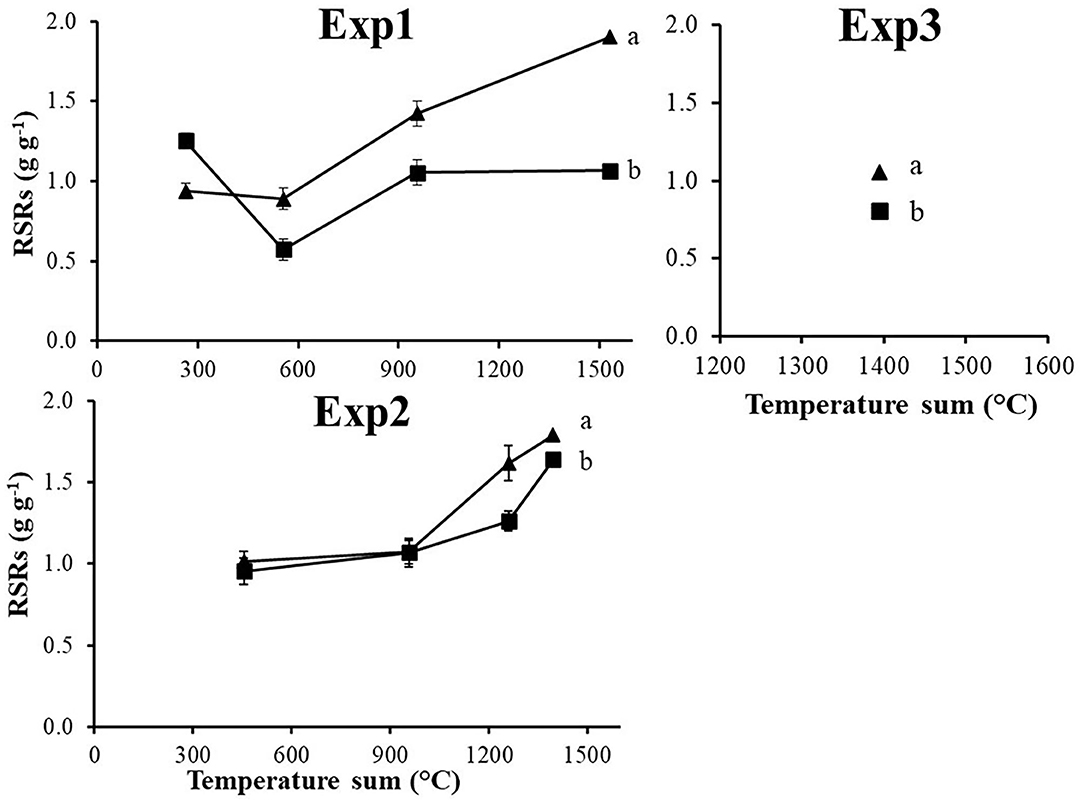
Figure 7. Root shoot ratio system (RSRs) calculated for the three experiments in relation to the resistance status: S (■) and R (▴). Vertical bars represent standard errors. Different letters indicate significant differences (P ≤ 0.05) according to Fisher's LSD test.
RA and RE were calculated for all samplings where reproductive structures were present (from temperature sum of 955°C in Exp1 and 957°C in Exp2) and in the unique sampling of Exp3. In Exp1 and Exp2 the evolution over time of RA and RE was linear for both biotypes (data not shown). RE was influenced by the starting material and reflects the significantly higher quantity of rhizomes produced by the R biotype. In the last sampling of Exp1 and in the unique sampling of Exp3 it was higher for the R biotype and no differences between the two biotypes were found in the last sampling of Exp2 (Figure 8).
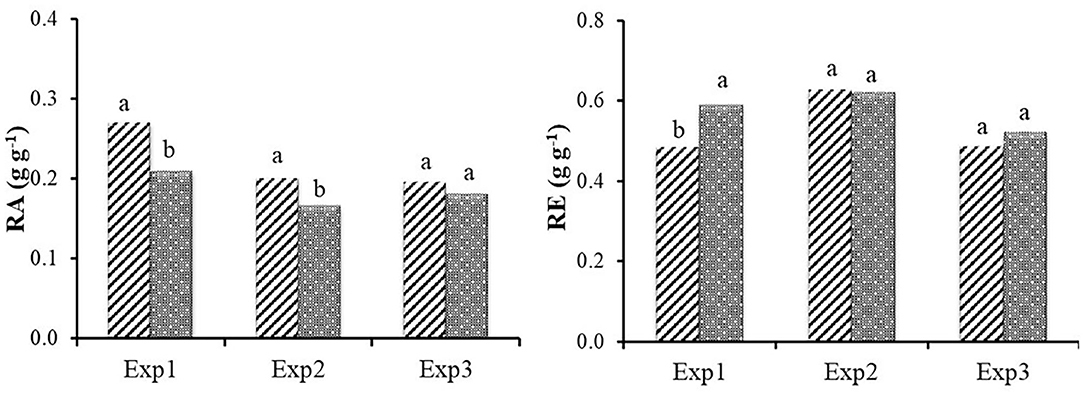
Figure 8. Reproductive allocation (RA) and Reproductive effort (RE) at the final harvest for the three experiments in relation to the resistance status (S and R ). Different letters indicate significant differences (P < 0.05) according to Fisher's LSD test.
Discussion
The importance of knowing the genetic background of the plant material used in a fitness cost study has been stated in many publications (Paris et al., 2008; Darmency et al., 2015; Vila-Aiub, 2019). The experimental design used in this research, i.e., comparison of multiple field-collected R and S populations, provides adequate statistical power to account for the effect of differences in genetic background: it assumes that a statistically significant difference in mean trait values between R and S populations is likely caused by pleiotropic effects of the resistance gene (Vila-Aiub et al., 2011). This is the second report of a fitness cost associated with the mutation Asn-2041 in weeds (Shergill et al., 2016), whereas a couple of previous studies did not show any adverse pleiotropic effects (Menchari et al., 2008; Papapanagiotou et al., 2015).
The classical growth analysis approach was of limited value to detect any difference in growth at whole plant level between the two biotypes. The different pattern of biomass allocation between R and S biotypes may reflect different plant strategies which have a significant impact on plant reproduction and therefore on resistance evolution under FOP herbicides selection pressure and in relation to various agronomic practices such as soil cultivation.
Such allocation strategies are often considered to be genetically determined, i.e., species- or genotype-specific (Weiner, 2004).
In the absence of selection pressure exerted by an ACCase herbicide, the S and R biotypes produced the same absolute quantity of biomass, but it was distributed differently. The R biotype allocated a higher proportion of biomass belowground, due to its higher investment in rhizomes, while it showed a significantly lower panicle (and therefore seed) production. Results were more evident and consistent when the same starting material was used, i.e., in Exp1 and Exp3, where plants grew from rhizome buds. It is worth stressing that experiments were conducted outdoors and therefore, as observed in other studies (Darmency et al., 2015), expression of fitness costs may differ according to different climatic conditions across the years.
When an ACCase herbicide will be applied in the field, the fitness cost highlighted in absence of the herbicide may become an advantage for the resistant biotype.
ACCase inhibitors are post-emergence herbicides absorbed by the leaves and then translocated to roots and rhizomes (Chandrasena and Sagar, 1984), so that the only plants to die are the susceptible ones, germinated from seeds or rhizomes, which have emerged before the spraying. Plants originated from rhizomes are more vigorous and competitive (Lolas and Coble, 1980), and under the selection pressure of FOP herbicides the R biotype is therefore favored. The early diffusion process of FOP-resistant S. halepense is driven by the spread of “resistant” rhizomes that will likely form patches of resistant plants, especially in minimum tillage conditions. The preferential reproduction through rhizomes of R plants could be a compensatory evolution process, i.e., a mechanism which counterbalances the negative pleiotropic effects on development and reproduction that are conferred by the “resistant” allele. One possible explanation for this hypothesis is the selection of modifier genes that would directly act to restore the function impaired by the resistance allele (Darmency et al., 2015). Except FOPs in dicot crops, only a few herbicides control S. halepense originated from rhizomes in post-emergence, i.e. sulfonylureas (acetolactate synthase (ALS)–inhibiting herbicides) in cereal crops, and non-chemical control methods are only partially effective (McWhorter, 1989). Many pre-emergence herbicides control johnsongrass seedlings, but they are less effective against ramets (McWhorter, 1989).
A medium-long term resistance management strategy based on the integration of chemical and agronomic tools (e.g., to limit or avoid conservation tillage and implement crop rotation with different crop life cycles such as winter and summer crops) should be implemented to prevent or delay the spread of resistant S. halepense and its propensity to evolve resistance to the chemicals most used for its control. In fact, cases of S. halepense resistant to other SoA (i.e., ALS inhibitors and EPSP synthase inhibitors) have already been found (Scarabel et al., 2017; Vazquez-Garcia et al., 2020; Heap, 2021). Fitness costs detected in this research may be exploited to elaborate management strategies which manipulate the attitude of S and R ACCase biotypes to reproduce preferentially through seeds and rhizomes, respectively.
Conclusion
The study of the relative fitness of two biotype, susceptible and ACCase inhibitors resistant for a point mutation in position 2041 of the ACCase gene, may help to understand the evolution of the resistance. It appears that the resistant biotype has evolved a compensatory mechanism which privileges vegetative reproduction to the detriment of seed. The preferred reproduction by rhizomes can have an impact on the resistance management: plants of the R biotype originated from seeds will be controlled by pre-emergence herbicides, whereas those originated from rhizomes will not be controlled neither by post-emergence (due to resistance) nor by pre-emergence herbicides (due to the lack of herbicide efficacy against ramets). This substantially complicates the management of this weed species in summer dicot crops because there are not alternative herbicides available in the market to control S. halepense. The early detection of the patches of resistant rhizomes as well as the implementation of alternative weed control methods which take into account the different reproductive attitude of S and R biotypes should be priorities in a resistance management strategy.
Data Availability Statement
The original contributions presented in the study are included in the article, further inquiries can be directed to the corresponding author.
Author Contributions
SP and MS planned and designed the research. SP performed experiments and analyzed data. SP and MS wrote the manuscript. Both authors contributed to the article and approved the submitted version.
Funding
This research was supported by the National Research Council of Italy.
Conflict of Interest
The authors declare that the research was conducted in the absence of any commercial or financial relationships that could be construed as a potential conflict of interest.
Publisher's Note
All claims expressed in this article are solely those of the authors and do not necessarily represent those of their affiliated organizations, or those of the publisher, the editors and the reviewers. Any product that may be evaluated in this article, or claim that may be made by its manufacturer, is not guaranteed or endorsed by the publisher.
Acknowledgments
The authors are grateful to Alison Garside for revising the English text.
References
Arriola, P., and Ellstrand, N. (1997). Fitness of interspecific hybrids in the genus Sorghum: persistence of crop genes in wild populations. Ecol. Appl. 7, 512–518. doi: 10.1890/1051-0761(1997)007[0512:FOIHIT]2.0.CO;2
Baucom, R. S. (2019). Evolutionary and ecological insights from herbicide-resistant weeds: what have we learned about plant adaptation, and what is left to uncover? New Phytol. 223, 68–82. doi: 10.1111/nph.15723
Chandrasena, J. P. N. R., and Sagar, G. R. (1984). Effects of fluazifop-butyl on shoot growth and rhizome huds of Elymus repens (L.) Gould. Weed Res. 24, 297–303. doi: 10.1111/j.1365-3180.1984.tb01567.x
Cousens, R. D., and Fournier-Level, A. (2018). Herbicide resistance costs: what are we actually measuring and why? Pest Manag. Sci. 74, 1539–1546. doi: 10.1002/ps.4819
Coustau, C., Chevillon, C., and Ffrench-Constant, R. (2000). Resistance to xenobiotics and parasites: can we count the cost? Trends Ecol. Evol. 15, 378–383. doi: 10.1016/S0169-5347(00)01929-7
Darmency, H., Menchari, Y., Le Corre, V., and Délye, C. (2015). Fitness cost due to herbicide resistance may trigger genetic background evolution. Evolution 69, 271–278. doi: 10.1111/evo.12531
Délye, C., Menchari, Y., Michel, S., Cadet, É., and Le Corre, V. (2013). A new insight into arable weed adaptive evolution: mutations endowing herbicide resistance also affect germination dynamics and seedling emergence. Ann. Bot. 111, 681–691. doi: 10.1093/aob/mct018
Frenkel, E., Matzrafi, M., Rubin, B., and Peleg, Z. (2017). Effects of environmental conditions on the fitness penalty in herbicide resistant Brachypodium hybridum. Front. Plant Sci. 8:94. doi: 10.3389/fpls.2017.00094
GIRE (2021). Gruppo Italiano Resistenza Erbicidi. Available online at: www.resistenzaerbicidi.it (accessed March 16, 2021).
Heap, I. M. (2021). The International Survey of Herbicide Resistant Weeds. Available online at: http://weedscience.org/ (accessed May 3, 2021).
Hunt, R. (1990). Basic Growth Analysis: Plant Growth Analysis for Beginners. London: Unwin Hyman. doi: 10.1007/978-94-010-9117-6
Hunt, R., Causton, D. R., Shipley, B., and Askew, A. P. (2002). A modern tool for classical plant growth analysis. Ann. Bot. 90, 485–488. doi: 10.1093/aob/mcf214
Kaundun, S. S., and Windass, J. D. (2006). Derived cleaved amplified polymorphic sequence, a simple method to detect a key point mutation conferring acetyl CoA carboxylase inhibitor herbicide resistance in grass weeds. Weed Res. 46, 34–39. doi: 10.1111/j.1365-3180.2006.00487.x
Keshtkar, E., Abdolshahi, R., Sasanfar, H., Zand, E., Beffa, R., Dayan, F. E., et al. (2019). Assessing fitness costs from a herbicide-resistance management perspective: a review and insight. Weed Sci. 67, 137–148. doi: 10.1017/wsc.2018.63
Lolas, P. C., and Coble, H. D. (1980). Johnsongrass (Sorghum halepense) growth characteristics as related to rhizome length. Weed Res. 20, 205–210. doi: 10.1111/j.1365-3180.1980.tb00070.x
Masin, R., Loddo, D., Benvenuti, S., Zuin, M. C., Macchia, M., Masin, R., et al. (2010). Estimation of temperature and water potential thresholds for the main weed species in maize in central-northern Italy. Weed Sci. 58, 216–222. doi: 10.1614/WS-D-09-00066.1
Menchari, Y., Chauvel, B., Darmency, H., and Délye, C. (2008). Fitness costs associated with three mutant acetyl-coenzyme A carboxylase alleles endowing herbicide resistance in black-grass Alopecurus myosuroides. J. Appl. Ecol. 45, 939–947. doi: 10.1111/j.1365-2664.2008.01462.x
Murphy, B. P., and Tranel, P. J. (2019). Target-site mutations conferring herbicide resistance. Plants 8:382. doi: 10.3390/plants8100382
Neve, P., Diggle, A. J., Smith, F. P., and Powles, S. B. (2003). Simulating evolution of glyphosate resistance in Lolium rigidum I: population biology of a rare resistance trait. Weed Res. 43, 404–417. doi: 10.1046/j.0043-1737.2003.00358.x
Panozzo, S., Scarabel, L., Collavo, A., and Sattin, M. (2015). Protocols for robust herbicide resistance testing in different weed species. J. Vis. Exp. 101, 1–10. doi: 10.3791/52923
Papapanagiotou, A. P., Paresidou, M. I., Kaloumenos, N. S., and Eleftherohorinos, I. G. (2015). ACCase mutations in Avena sterilis populations and their impact on plant fitness. Pestic. Biochem. Physiol. 123, 40–48. doi: 10.1016/j.pestbp.2015.01.017
Paris, M., Roux, F., Bérard, a, and Reboud, X. (2008). The effects of the genetic background on herbicide resistance fitness cost and its associated dominance in Arabidopsis thaliana. Heredity 101, 499–506. doi: 10.1038/hdy.2008.92
Parks, R. J., Curran, W. S., Roth, G. W., Hartwig, N. L., and Calvin, D. D. (1996). Herbicide susceptibility and biological fitness of triazine-resistant and susceptible common lambsquarters (Chenopodium album). Weed Sci. 44, 517–522. doi: 10.1017/S0043174500094273
Primack, R. B., and Kang, H. (1989). Measuring fitness and natural selection in wild plant populations. Annu. Rev. Ecol. Syst. 20, 367–396. doi: 10.1146/annurev.es.20.110189.002055
Reekie, E. G., and Bazzaz, F. A. (2000). “Reproductive allocation in plants,” in Seeds: The Ecology of Regeneration in Plant Communities, ed. U. M. Fenner (New York: University of Southampton, CABI Publishing), 1–30.
Roux, F., Gasquez, J., and Reboud, X. (2004). The dominance of the herbicide resistance cost in several Arabidopsis thaliana mutant lines. Genetics 166, 449–460. doi: 10.1534/genetics.166.1.449
Scarabel, L., Milani, A., Panozzo, S., and Rasori, A. (2017). Suitable reference genes for accurate gene expression analysis in Papaver rhoeas under 2,4-D herbicide stress. Pestic. Biochem. Physiol. doi: 10.1016/j.pestbp.2017.09.008
Scarabel, L., Panozzo, S., Savoia, W., and Sattin, M. (2014). Target-Site ACCase-resistant johnsongrass (Sorghum halepense) selected in summer dicot crops. Weed Technol. 28, 307–315. doi: 10.1614/WT-D-13-00137.1
Shergill, L. S., Boutsalis, P., Preston, C., and Gill, G. S. (2016). Fitness costs associated with 1781 and 2041 ACCase-mutant alleles conferring resistance to herbicides in Hordeum glaucum Steud. Crop Prot. 87, 60–67. doi: 10.1016/j.cropro.2016.04.025
Tardif, F. J., Rajcan, I., and Costea, M. (2006). A mutation in the herbicide target site acetohydroxyacid synthase produces morphological and structural alterations and reduces fitness in Amaranthus powellii. New Phytol. 169, 251–264. doi: 10.1111/j.1469-8137.2005.01596.x
Vazquez-Garcia, J. G., Palma-Bautista, C., Rojano-Delgado, A. M., De Prado, R., and Menendez, J. (2020). The first case of glyphosate resistance in johnsongrass (Sorghum halepense (L.) pers.) in Europe. Plants 9, 1–11. doi: 10.3390/plants9030313
Vila-Aiub, M. M. (2019). Fitness of herbicide-resistant weeds: current knowledge and implications for management. Plants 8, 1–11. doi: 10.3390/plants8110469
Vila-Aiub, M. M., Neve, P., and Powles, S. B. (2005). Resistance cost of a cytochrome P450 herbicide metabolism mechanism but not an ACCase target site mutation in a multiple resistant Lolium rigidum population. New Phytol. 167, 787–796. doi: 10.1111/j.1469-8137.2005.01465.x
Vila-Aiub, M. M., Neve, P., and Powles, S. B. (2009). Fitness costs associated with evolved herbicide resistance genes in plants. New Phytol. 184, 751–767. doi: 10.1111/j.1469-8137.2009.03055.x
Vila-Aiub, M. M., Neve, P., and Roux, F. (2011). A unified approach to the estimation and interpretation of resistance costs in plants. Heredity 107, 386–394. doi: 10.1038/hdy.2011.29
Vila-Aiub, M. M., Yu, Q., Han, H., and Powles, S. B. (2015). Effect of herbicide resistance endowing Ile-1781-Leu and Asp-2078-Gly ACCase gene mutations on ACCase kinetics and growth traits in Lolium rigidum. J. Exp. Bot. 66, 4711–4718. doi: 10.1093/jxb/erv248
Wang, T., Picard, J. C., Tian, X., and Darmency, H. (2010). A herbicide-resistant ACCase 1781 Setaria mutant shows higher fitness than wild type. Heredity 105, 394–400. doi: 10.1038/hdy.2009.183
Warwick, S. I., and Black, D. (1983). The biology of Canadian weeds. 61. Sorghum halepense (L.) Pers. Can. J. Plant Sci. 63, 997–1014. doi: 10.4141/cjps83-125
Keywords: ACCase inhibitors, fitness costs, herbicide resistance, Ile2041Asn, johnsongrass, weed growth
Citation: Panozzo S and Sattin M (2021) Fitness Costs Associated to an Ile2041Asn Mutation in the Geophyte Sorghum halepense Resistant to ACCase-Inhibiting Herbicides. Front. Agron. 3:711840. doi: 10.3389/fagro.2021.711840
Received: 19 May 2021; Accepted: 26 July 2021;
Published: 16 August 2021.
Edited by:
Rodrigo Werle, University of Wisconsin-Madison, United StatesReviewed by:
Panagiotis Kanatas, University of Patras, GreeceMaxwel Coura Oliveira, University of Wisconsin-Madison, United States
Copyright © 2021 Panozzo and Sattin. This is an open-access article distributed under the terms of the Creative Commons Attribution License (CC BY). The use, distribution or reproduction in other forums is permitted, provided the original author(s) and the copyright owner(s) are credited and that the original publication in this journal is cited, in accordance with accepted academic practice. No use, distribution or reproduction is permitted which does not comply with these terms.
*Correspondence: Silvia Panozzo, c2lsdmlhLnBhbm96em9AY25yLml0