 Rafael de Souza Nunes1*
 Djalma Martinhão Gomes de Sousa1†Wenceslau J. Goedert2
 Luiz Eduardo Zancanaro de Oliveira2*
 Thamires Dutra Pinheiro2
- 1Embrapa Cerrados, Brasília, Brazil
- 2Faculty of Agronomy and Veterinary Medicine, University of Brasília, Brasília, Brazil
We investigated labile P and roots distribution in the soil profile and their effect on phosphorus uptake and soybean and corn yield under different tillage systems and phosphate fertilization managements. In a long-term experiment fertilized with triple superphosphate (TSP) or reactive phosphate rock (RPR), where the fertilizer was band-applied in the crop row or broadcasted under conventional tillage (CT) or no-tillage (NT), we evaluated labile P (Bray-1) and root density distribution in depth, and crop yield, biomass production and P uptake by soybean (16th crop) and corn (17th crop). The soil disturbance in CT promoted more homogeneous soil P distribution while in NT there was a strong gradient in depth, with nutrient accumulation in the fertilizer application zone. In general, the average content of P in the 0–20 cm layer was similar for the two soil management systems and for the two application methods, but higher for TSP in relation to RPR. Root distribution of soybeans in NT and corn in both tillage systems showed a strong relationship with soil P distribution. The production of biomass, P uptake and grain yield of soybean in CT was influenced by phosphate fertilization management and generally presented lower performance than in NT, what did not occur for corn possibly due to a better P uptake efficiency compared to that of soybean. Greater stratification on the distribution of soil P and soybean and corn roots in NT did not represent any limitation on the nutrient uptake and yield of these crops, not even in the extreme case where the fertilizer was continuously broadcast on the soil surface. The influence of soil tillage management and phosphate fertilization was more evident in soybeans than corn.
Introduction
Despite the adoption of no-tillage (NT) in Brazilian grain production mainly due to cost reduction and tillage erosion minimization (Bolliger et al., 2006), several benefits have been attributed to this management system as compared to conventional tillage (CT), such as the accumulation of organic matter (Nunes et al., 2011a; Figueiredo et al., 2013), lower soil temperatures and moisture retention in surface layers (Costa et al., 2003; Martorano et al., 2009), better soil structure (Bertol et al., 2004), increased microbial activity (Mendes et al., 2003; Lopes et al., 2018) and diversity (Souza et al., 2012) and better nutrient dynamics (Santos and Tomm, 2003), resulting in a new soil fertility dynamics (Nicolodi et al., 2008). Its adoption has grown gradually, reaching about 33 million ha in the 2017/18 growing season (FEBRAPDP, 2021), or 63% of the cultivated area with grains in the country.
The maintenance of fertilizers and lime in the surface layers associated with cycling of nutrients by crops provides a concentration gradient of nutrients in the soil profile under NT (De Maria et al., 1999; Santos and Tomm, 2003; Calegari et al., 2013). This is especially true for P, a nutrient that presents low mobility in soil (Barber, 1995) and very low natural availability in the oxidic soils of the Brazilian Cerrado bioma (Sousa and Lobato, 2004). The intensity of this effect depends on the management of phosphorus fertilization. The application of phosphate fertilizer in rows reduces its contact with the soil, resulting in a smaller fertilized area but with higher availability compared to broadcast application, and less intense gradient in depth (Nunes et al., 2011b). On the other hand, the use of high solubility phosphate fertilizer sources in acidic tropical soils with high P adsorption capacity allows for rapid conversion of P to less available forms to plants and possibly could have its efficiency decreased over time (Prochnow et al., 2004), in contrary to what would occur with the use of reactive natural sources, which promote gradual solubilization of phosphorus, limiting specific adsorption by clays (Novais et al., 2007) and could allow for greater fertilizer efficiency (Sousa et al., 2010; Oliveira et al., 2019).
For proper soil P absorption, growth and crop productivity in the long-term, P availability must be associated with the presence of roots that are able to absorb it, since the contact between both occurs by diffusion (Barber, 1995). Although roots present high plasticity (Hodge et al., 2009; Mulia et al., 2010) responding physiologically and morphologically to nutrients availability distribution in soil (Robinson, 1996; Cahill et al., 2010), a high P concentration into a small volume should be avoided because of the possible deleterious effects on the apical meristem of the roots (Barber, 1995). In addition, absorption is dependent not only on P concentration but also on soil fertilized volume (Anghinoni, 1992; Klepker and Anghinoni, 1993), so higher volumes of fertilized soil may be necessary in some circumstances.
In systems with adequate soil fertility, differences in yields of crops with broadcast or banded fertilization are not usually observed (Pavinato and Ceretta, 2004; Guareschi et al., 2008; Nunes et al., 2011b). Thus, the choice of the best strategy may be based on other factors such as operational cost (Matos et al., 2006). On the other hand, the use of natural reactive sources may restrict yields compared to soluble sources (Oliveira Junior et al., 2008; Frandoloso et al., 2010), especially when labile P concentration is limited (Oliveira et al., 2020a). The early application of this source as a corrective soil P level fertilization has been recommended in order to overcome limitations of solubilization rate in NT (Oliveira et al., 2020a). Nonetheless, improved crop yields in NT compared to conventional tillage (CT) (Mcgregor et al., 2006; Nunes et al., 2011a) may be associated with better P nutrition in tropical soils (Nunes et al., 2011b; Oliveira et al., 2019).
Thus, it is expected that different soil management systems and phosphate fertilization may influence P access by the plant and ultimately nutrient absorption and yield of crops, since P is an important growth modulator. The aim of this study was to evaluate the effect of tillage system and soil phosphate fertilization during a 17-yr period in the vertical distribution of P and soybeans and corn roots, and how this distribution affects P uptake and yields of these crops. The hypothesis are that: (1) both NT and broadcast P fertilizer application promote a deleterious effect on root development in depth due to reduced P availability below 10 cm; (2) greater P stratification in the soil profile compromises P uptake and consequently crop yields.
Materials and Methods
Description of the Experimental Area
The study was performed in the experimental area of Embrapa Cerrados Agricultural Research Center, located at 15°35′30″S and 47°42′00″W, in the center of the Cerrado region plateau, in Distrito Federal, Brazil. The regional climate is classified as Cwa according to the Köppen classification, consisting of a typical savanna climate with a mean annual rainfall of 1,570 mm and two well-defined seasons: dry (from May to September) and rainy (from October to April). Maximum and minimum average temperatures are 26.4 and 15.9°C, respectively.
The original vegetation is the Cerrado. The soil is classified as a Rhodic Haplustox (Soil Survey Staff, 2010) or Rhodic Ferralsol (IUSS Working Group WRB, 2006). It is a typically permeable very clayey (64% clay) poor nutrient soil derived from basalt that presents high concentrations of free iron oxide (>5% Fe), no strong texture contrast between A and B horizons and very low extractable Bray-1 P (1.0 mg kg−1 in the 0–20 cm layer) by the time the experiment was set up in September 1994. Other soil characteristics are described in Table 1.
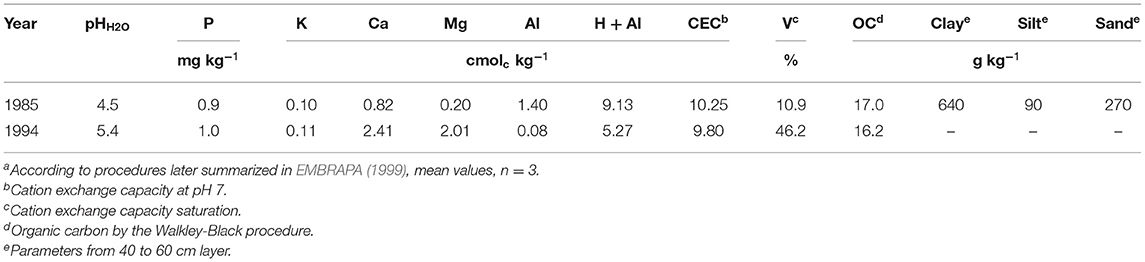
Table 1. Soil chemical analysisa of the 0–20 cm layer in two moments prior to the experiment establishment, before and after liming, as in Nunes et al. (2020).
Experimental Design and Crop Management
Before the first crop, lime was applied and incorporated in order to raise the cation exchange capacity saturation (V) to 50 %, as were gypsum, potassium, sulfur and micronutrients, according to standard recommendations for the region made by Sousa and Lobato (2004), but no corrective fertilization with P was applied. Soil pH, although amended for adequate plant growth, was still low enough for RPR reaction in the soil before the first crop (Table 1). During the cultivations, annual maintenance fertilizations were carried out with 67 kg ha−1 of K (as potassium chloride), 30 kg ha−1 of S (gypsum), and for corn 30 kg ha−1 of N (urea) in the sowing furrows and 60 kg ha−1 of N as topdressing, according to Sousa and Lobato (2004). Lime was reapplied after the 6th and the 15th crops in order to maintain V close to 50% based on soil samples taken from the 0–20 cm soil layer. Annual P fertilization was applied at 35 kg P ha−1 rate, and the P source and method of application varied with each treatment.
The experiment was cultivated with just a main crop (soybeans or corn) per year (in the rainy season), and also with a cover crop in the dry season after the 9th crop (Table 2). Soybean (Glycine max) was grown during the first 9 years using a 0.5 m row spacing, while corn (Zea mays) was grown in the 10th and 11th years (0.8 m row spacing). Afterwards, it was cultivated a rotation between soybeans and corn, up until the 17th and last crop (corn). Soybeans and corn received supplemental sprinkler irrigation during drought periods in the rainy season (a common phenomenon in the region). Irrigation was defined based on tensiometers installed 20 cm deep in the plots. Pearl millet (Pennisetum glaucum) at a 0.20 m row spacing was sown after soybean or corn harvest as cover crop in the winter after the 9th and following crops and received supplementary irrigation for development without water limitation. It was cut at the beginning of physiological maturation and fertilized since the 14th year with 45 kg ha−1 of N (urea) aiming at higher biomass production.
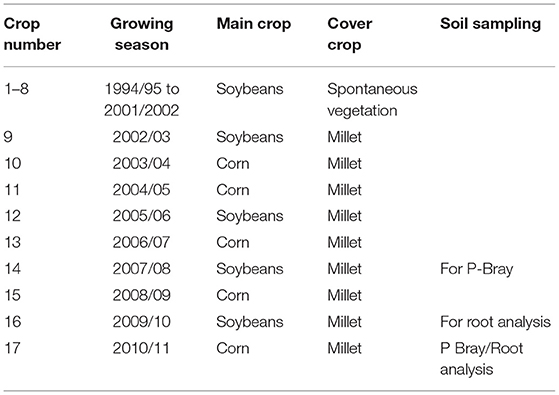
Table 2. Crop sequences and sampling moments in the experimental area.
We used eight treatments involving soil management and phosphate fertilization: CT (consisting of plowing up to 20 cm deep with a disk plow and harrowing before planting the summer crop) or NT, fertilized with reactive phosphate rock of Gafsa (RPR) or triple superphosphate (TSP), band-applied at the sowing row (R) or broadcast on the soil surface (B), at a dose of 35 kg ha−1 yr−1 of total P. In CT, broadcast treatments received P fertilizer before soil tillage, allowing for homogenization on the arable layer. Fertilizer application in the crop row in the correspondent treatments happened at the moment of sowing for both soil tillage systems. RPR contained 12.3% of total P, of which 44 % were soluble in a solution of citric acid 2%. TSP contained 20.8% of total P, of which 92 % were soluble in a solution of citric acid 2%.
The experimental design consisted of randomized blocks with split plots with soil management systems (CT and NT) in the plots (16 m × 8 m) and P sources (RPR and TSP) and application modes (R and B) in the sub-plots (8 m × 4 m), randomly distributed within each of them, with three replications. The useable harvest area was 15 m2 for soybeans and 12 m2 for corn, located in the central portion of the sub-plots. At the end of the soybean and corn cycles, harvesting was done manually.
Soil Sampling and Analysis
Soil sampling was carried out in two moments, the first taking place after the 14th main crop (soybean) and the second after the 17th crop (corn). Both soil samplings collected four soil layers: 0–2.5, 2.5–5, 5–10, and 10–20 cm. For broadcast fertilization treatments 20 sub-samples were taken for each composite sample, having been collected randomly within the useable area of the plots. For row fertilization treatments each sample was formed by directed sub-samples obtained as follows: 6 locations were selected within each plot and in each location equidistant sub-samples perpendicular to the crop rows and within two inter-rows were collected, one being in the middle of the row. For soybean, 5 sub-samples per location were collected while for corn there were 7 sub-samples collected in each plot location, due to the wider spacing of this crop. Once collected, the samples were air dried, grinded, sieved at 1 mm in order to improve soil homogeneity and analyzed for labile P by the Bray-1 method (Bray and Kurtz, 1945). This method was chosen due to the expectation to better represent soil P lability where RPR was applied, once the commonly method used in Brazil, Mehlich-1, can overestimate P availability in these circumstances, due to its acidic characteristic. The 0–5 cm layer P contents were obtained by averaging the contents of the two first layers.
Roots and Plant Tissues Sampling and Analysis
For root analysis, other soil samples were collected at soybean flowering in the 16th crop and at the following (17th) crop (corn) flowering, using an auger hole of 10 cm in diameter, at depths 0–5, 5–10, and 10–20 cm in two sites (row and inter-row). Each sample was composed of two sub-samples and the sample collected in the inter-row was taken at a quarter of the crop's row spacing (12.5 cm for soybeans and 20 cm for corn). The samples were placed in plastic bags and the roots separated from a known volume of soil by washing and screening in a 0.5 mm mesh sieve, followed by manual scavenging of crop residues in a tray with water and new screening in 0.5 mm mesh sieve. The roots of corn with diameter larger than 2 mm were discarded. After these procedures, an amount of roots was separated and stored in 30% solution of ethyl alcohol at 4°C for later determination of root surface area. The remaining roots were oven-dried to determine dry weight.
The amount of roots kept in alcoholic solution was colored with Gentian violet B (methylrosaline chloride) 5 g L−1, air-dried and scanned. Root surface area was determined using digital images obtained by computer software SIARCS® 3.0 (Jorge et al., 1996), using on average 0.1 g and 0.3 g of soybeans and corn roots dry matter, respectively. After these procedures, the roots were oven-dried to determine dry matter. The root data used in this paper involves the average values obtained for rows and inter-rows.
At the same time as the root evaluation, sampling was conducted to evaluate P uptake by soybean and corn by collecting six plants per plot, clipped at the soil surface, and determining the oven-dry matter yield of shoots (DMYS) and P content (EMBRAPA, 1999), allowing for the calculation of P uptake by shoots (PUS). P utilization efficiency was determined (PUE = DMYS2/PUS) as proposed by Siddiqi and Glass (1981) while P acquisition efficiency was calculated (PAE = PUS/root surface density at 0–20 cm) adapting the concept proposed by Elliott and Läuchli (1985).
Statistical Analyses
For analysis of variance of available P and root surface density, the following model was used:
For dry matter yield of shoots, P uptake of shoots, P acquisition efficiency, P uptake efficiency and grain yield, the following model was used:
where: μ = overall experimental average; B = block (i = 1, 2, 3); T = soil tillage system (j = 1, 2); S = phosphate source (k = 1, 2); M = application method (l = 1, 2); D = depth (m = 1, 2, 3) and error = experimental error.
Analysis of variance was performed according with the SAS MIXED procedure and when it was significant the least-significant test (LSD) (P < 0.05) was applied for means comparisons. In the analysis of the relative contribution of the different layers to total 0–20 cm means, and also in the evaluation of different soil P uptake parameters and grain yields, the SLICE option in the SAS software (SAS Institute, 2009) was used to compare agronomic means of interest, i.e., the two different levels of the factor tillage in each fertilizer management combination, and the four phosphate fertilization management strategies inside a given soil tillage.
The phosphorus P content and root density were modeled using sums of squares multivariate regression tree models (De'ath, 2002), as described by Mendes et al. (2012) and considering depth, tillage, source of fertilizer and application method as categorical explanatory variables. Also, regression analysis was performed via linear regression according to SAS GLM procedure.
Results
Soil Bray-1 P Vertical Distribution
The different phosphate fertilizer managements changed P contents down to 10 cm for NT and 20 cm for CT, at both evaluated moments (Figure 1). The interaction between all three factors of the experiment and soil layer was significant in both years (P = 0.0038 after 14 crops and P = 0.0106 after 17 crops). In CT, when P source was TSP, row fertilization showed similar or higher P content than broadcast fertilization on all layers at both periods, except for the 10–20 cm layer evaluated after the 14th crop. In NT, when the source was TSP, row fertilization provided lower P content than those observed for broadcast fertilization in the 0–5 cm layer, while the opposite took place in the 5–10 cm layer. When the source was RPR for the two tillage systems and in the two moments there was no difference between the application modes, except for the 0–5 cm layer in NT after 17 crops when broadcast fertilization resulted in higher P content than in row fertilization. In addition, when TSP was used, increased P contents in NT compared to CT generally occurred at 0–5 cm for broadcast application and at 5–10 cm for row application. At 10–20 cm there was higher P content in CT for all phosphate fertilization managements.
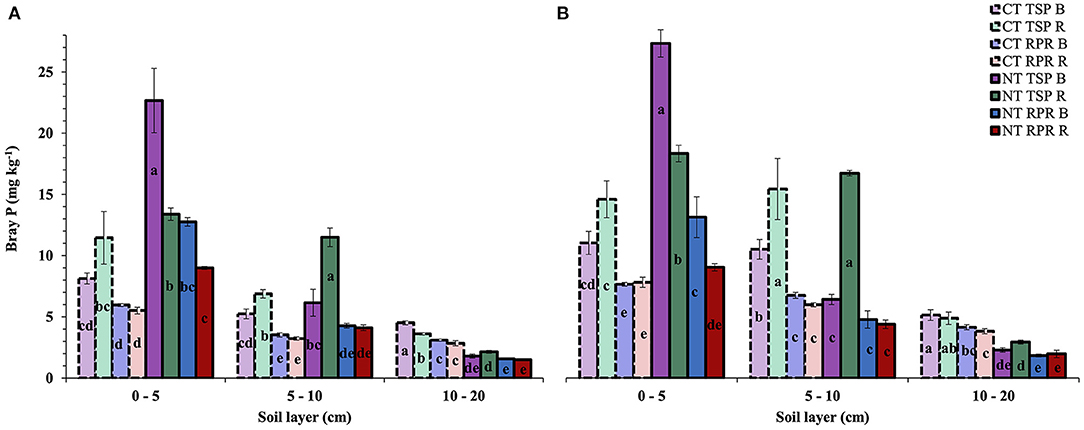
Figure 1. Phosphorus availability (Bray-1) in three layers of a very clayey Oxisol under different soil tillage systems and phosphate fertilization management after 14 years/crops (A) and 17 years/crops (B) of crops. Letters compare treatments in the same soil layer according to the LSD test (P < 0.05). NT, no tillage; CT, conventional tillage; TSP, triple superphosphate; RPR, reactive phosphate rock; B, broadcast; R, row.
According to Oliveira et al. (2019), Bray-1 critical levels in the 0–10 cm layer should be interpreted considering the fertilizer source used in the area: for TSP, Bray-1 contents sufficient for 90% and 80% relative yield potential are 17.7 and 13.5 mg kg−1, respectively. When RPR was used, these reference values are 9.3 and 7.4 mg kg−1, respectively. After the 14th crop, only broadcast treatments in NT presented yield potential above 80% according to this interpretation, based on 0–10 cm means. After 17 crops, the only RPR treatment with P Bray contents above 7.4 mg kg−1 was that under broadcast fertilization under NT. On the other hand, all TSP treatments in this evaluation moment presented contents above 13.5 mg kg−1 in the 0–10 cm layer, except CT under broadcast application.
The relative participation of each layer in P availability in the 0–20 cm soil profile is shown in Table 3, where a more homogeneous distribution was observed in CT, while in NT there was strong gradient in depth, with the exception of TSP band-applied at the crop row. In NT, for broadcast fertilization of both sources, over 60% of the P was located in the first 5 cm, while in the row fertilization, especially with TSP, there was more balanced distribution down to 10 cm deep, with significant participation of the 5–10 cm layer, where P fertilizer was applied.
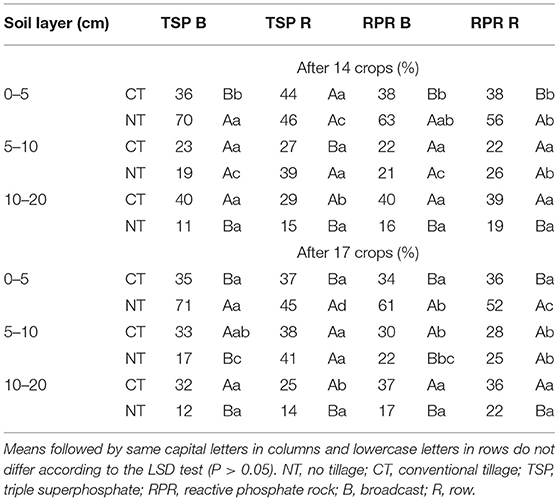
Table 3. Relative distribution (%) of soil P availability (Bray-1) in three layers of a very clayey Oxisol under different soil tillage systems and phosphate fertilization management after 14 and 17 crops/years of cultivation.
Soil P availability was lower in CT and in RPR treatments on the 0–20 cm layer average after 14 crops (Figure 2A). After 17 crops, there were interactions between fertilizer source and mode of application, and between tillage system and P source (Figure 2B). In all cases, the lower Bray P-values were observed with the use of RPR. With TSP, labile P reached 9.6 mg kg−1 under band application and were lower at 8.3 mg kg−1 under band application. Where RPR was used, no difference between fertilizer placement were observed. Considering the interaction tillage system—P source, availability was especially high when TSP was used in NT (Figure 2B).
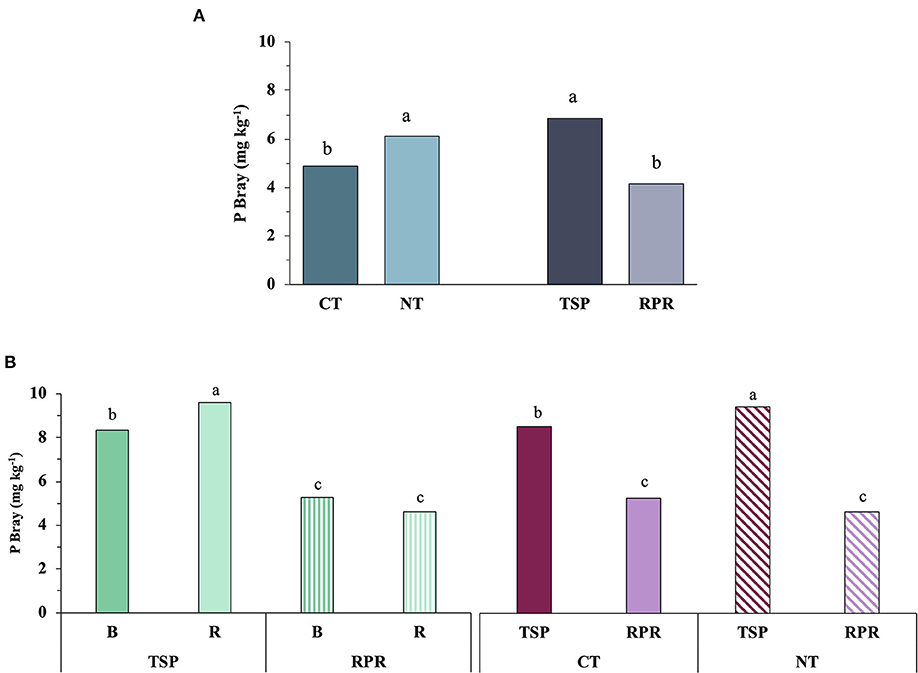
Figure 2. Soil P availability (Bray-1) in the 0–20 cm layer in a very clayey Oxisol under different soil tillage systems and phosphate fertilization managements after 14 years/crops (A) and 17 years/crops (B) of cultivation. Letters compare levels within a factor in (A) and within 2-factor interactions in (B) according to the LSD test (P < 0.05). NT, no tillage; CT, conventional tillage; TSP, triple superphosphate; RPR, reactive phosphate rock; B, broadcast; R, row.
Crops' Roots Vertical Distribution
Root distribution of soybean and corn at 0–20 cm, assessed by surface density (cm2 of roots cm−3 soil), even after P accumulation during 16 or 17 years of cultivation was still influenced by tillage systems and soil phosphate fertilization (Figure 3A). This influence was observed down to 10 cm deep in NT and 20 cm deep in CT, for both evaluated crops.
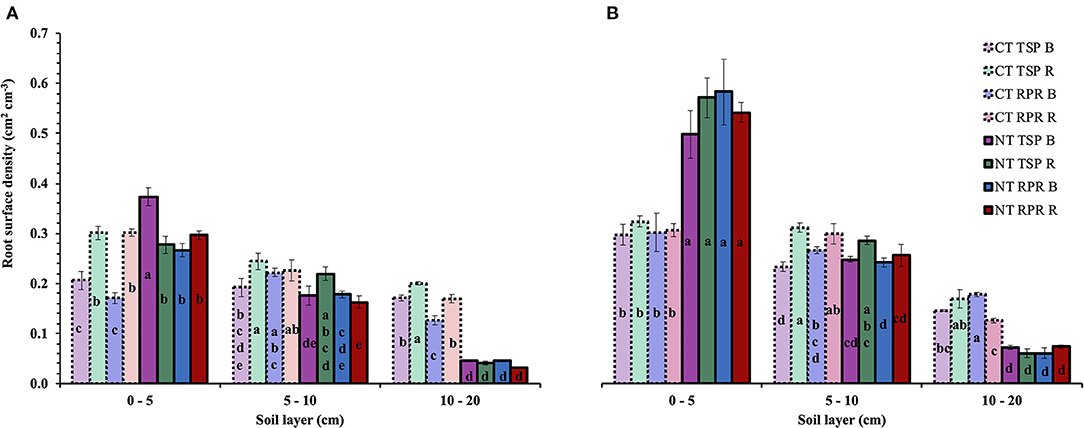
Figure 3. Surface density of soybean (A) and corn (B) roots in three layers of a very clayey Oxisol under different soil tillage systems and phosphate fertilization management. Letters compare treatments in the same soil layer according to the LSD test (P < 0.05). NT, no tillage; CT, conventional tillage; TSP, triple superphosphate; RPR, reactive phosphate rock; B, broadcast; R, row.
In CT, the surface density of soybean roots was higher with fertilizer application in the row compared to broadcast application for all layers and in the two sources, except for the layer of 5–10 cm with RPR. Moreover, in CT, for the same application mode, we observed similar root density of soybean in both P sources down to 10 cm deep and greater density in the 10–20 cm layer with TSP. In NT, when the source was the TSP, row fertilization provided lower roots surface density of soybean than those observed for broadcast fertilization in the 0–5 cm layer, the opposite occurring for the 5–10 cm layer, following the trend noticed in P distribution. Also in NT, differences in roots surface density of soybean for application modes were not observed when the source used was RPR. Furthermore, there was a greater density of soybean roots with TSP in relation to RPR at 0–5 cm for broadcast application and 5–10 cm for row application (Figure 3A).
The surface density of corn roots showed minor changes due to phosphate fertilization management while tillage systems had the greatest effects (Figure 3B). In CT, in the 5–10 cm layer, row application resulted in higher surface density of roots than broadcast application for TSP, while in the 10–20 cm layer, the broadcast application results in higher surface density of roots than row application for RPR. In NT, minor significant differences were observed in the 5–10 cm layer only.
NT provided higher soybeans and corn root surface densities only in the 0–5 cm layer, but while for corn it occurred in all treatments, in soybeans this was less evident. On the other hand, there was a higher root density of soybean and corn in the 10–20 cm layer in CT when compared to NT.
There was relatively homogeneous distribution of the surface density of soybean and corn roots in the 0–20 cm layer in CT and strong gradient in depth in NT, even with band-applied phosphate fertilization on the crop rows (Table 4). In NT between 48 and 61% of soybean and corn roots were located within first 5 cm depth, whereas in CT this value was between 26 and 37%.
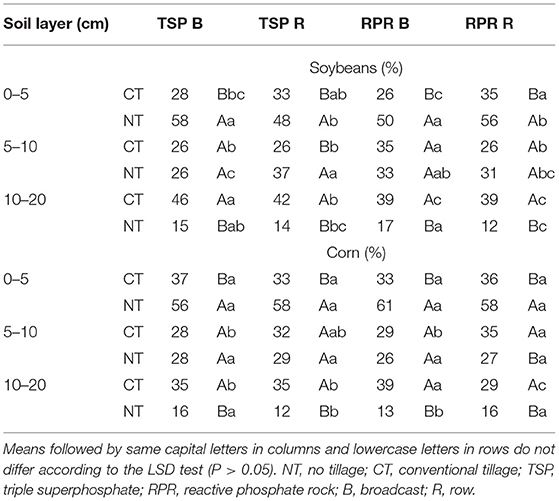
Table 4. Relative distribution (%) of the surface density of soybeans and corn roots in each of the three layers of a very clayey Oxisol under different soil tillage systems and phosphate fertilization management.
Evaluating the 0–20 cm layer average, soybeans under TSP fertilization developed 0.18 cm2 roots cm−3 soil while under RPR a lower 0.16 cm2 roots cm−3 surface density (Figure 4A). CT generally showed higher soybeans roots density than NT fertilization managements as well, while CT row fertilizer banding application improved root density in relation to broadcast application. The surface density of corn roots was similar for both CT and NT, with minor differences according to phosphate fertilization managements (Figure 4B).
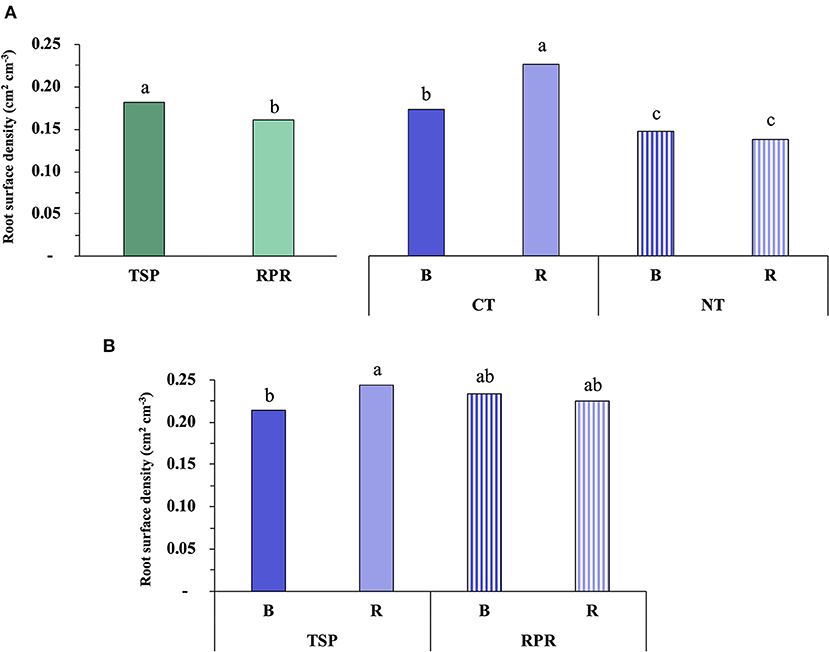
Figure 4. Surface density of soybean (A) and corn (B) roots in the 0–20 cm layer of a very clayey Oxisol under different soil tillage systems and phosphate fertilization managements. Letters compare levels of P source factor in (A) (green) and within 2-factor interactions in the remaining plots according to the LSD test (P < 0.05). NT, no tillage; CT, conventional tillage; TSP, triple superphosphate; RPR, reactive phosphate rock; B, broadcast; R, row.
Integrating Soil P and Roots Distribution
In general, crops roots distribution followed the same trend observed for soil P availability. However, it was observed that while in the NT soil P availability influenced the distribution of soybean and corn roots (Figure 5B), in CT this only occurred for corn (Figure 5A).
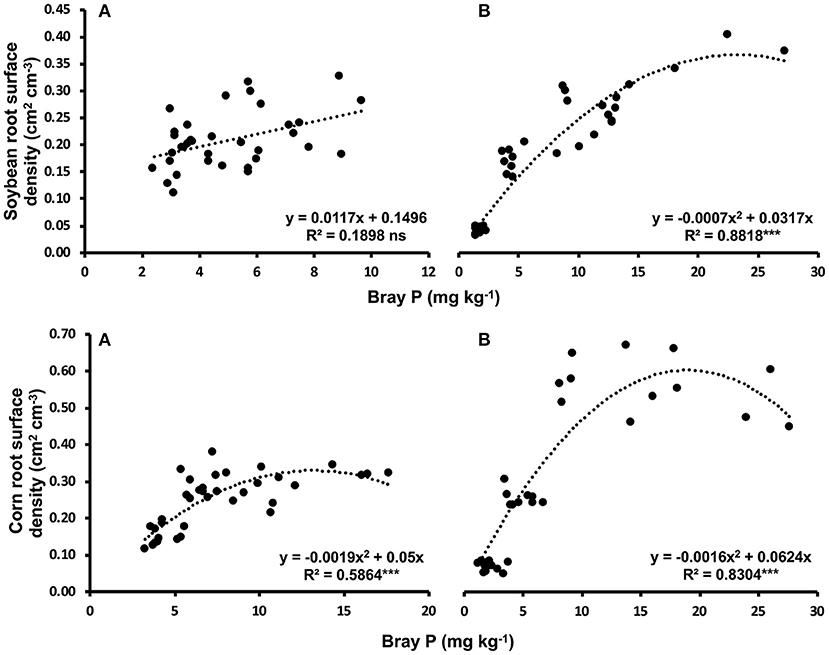
Figure 5. Relationship between soil P availability (Bray-1) and soybean and corn roots surface density in a very clayey Oxisol under conventional tillage (A) and no-tillage (B). Points represents different combinations between fertilizer sources (TSP or RPR), application modes (row or broadcast) and soil layers (0–5, 5–10, and 10–20 cm), with three replicates (n = 36). ***Significant at 0.1% according to the F test.
One way to integrate all this information and evaluate the weight of each factor studied on the variability of the data is employing the technique of tree modeling (Figure 6). The selected tree model explained 96% of the total data variability of available P and roots surface density of soybean and corn and resulted in 18 groups, represented by terminal nodes, involving all the categorical explanatory variables (tillage system, fertilizer source, application mode and depth). The depth of the evaluations and the soil tillage systems were the most important factors, accounting respectively for 56.1 and 18.4% of the model's explanation, while P source and application mode showed less important roles (15.4 and 10.1%, respectively).
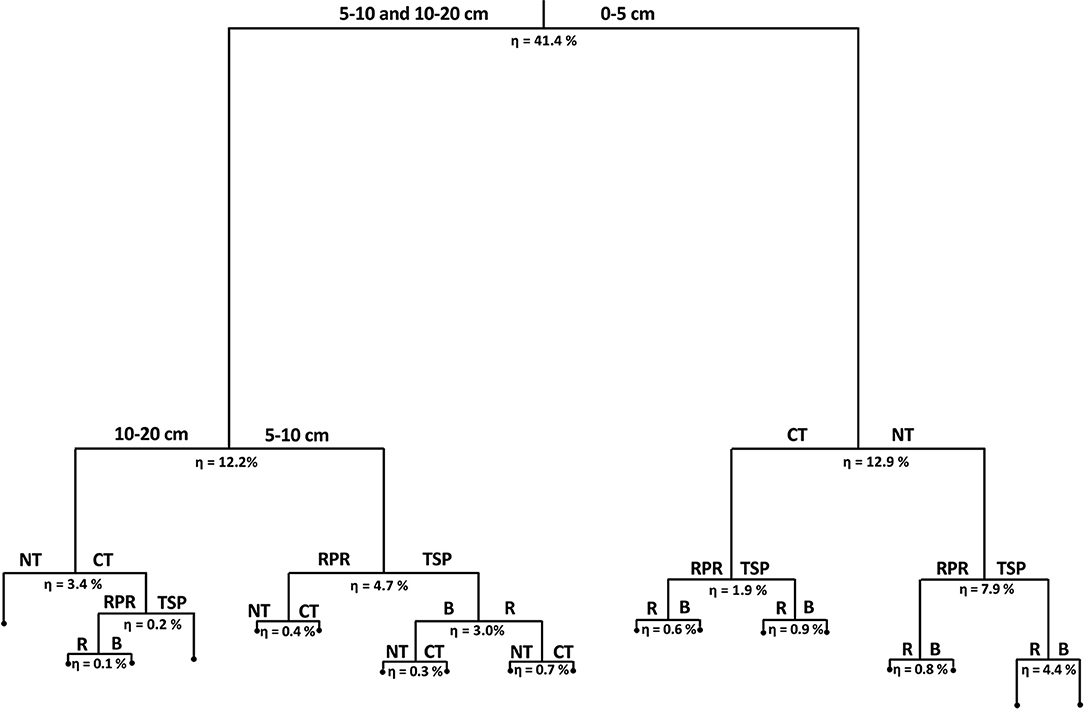
Figure 6. Tree model for soil P availability and surface density of soybean and corn roots at different sampling layers (0–5 cm, 5–10, and 10–20 cm), soil tillage system (conventional tillage—CT and no-tillage—NT), source of phosphorus (triple superphosphate—TSP and reactive phosphate rock—RPR) and application modes (broadcast—B and row—R). η indicates the percent fraction of the total variability explained by each branch.
The first branch resulted in the separation of the 0–5 cm layer from the deeper ones and the fraction of the total variability explained (η) by this branch was 41.4%. Then there was separation of 5–10 cm and 10–20 cm depths, with 12.2% of the data variability explained by this branch. Within the 0–5 cm and 10–20 cm layers, roots and soil P were primarily sensitive to the soil tillage system (η = 12.9% and 3.4%, respectively). In addition, at a depth of 0–5 cm, the NT phosphate source influences more than the application mode (η = 7.9% and 5.2%, respectively), while at a depth of 10–20 cm there is no influence of phosphate fertilizer management. In CT the source of fertilizer had more influence over the mode of application, both in the 0–5 cm layer (η = 1.9% for source and 1.5% for mode) and in the 10–20 cm (η = 0.2% for source and 0.1% for mode). At the depth of 5–10 cm the soil tillage systems showed the least influential factor (η = 1.4%), while the phosphate source and application mode were best explanatory factors (η = 4.7 and 3.0%, respectively).
P Uptake by Roots and Yield Response
In CT, the oven-dry matter yield of shoots (DMYS) and P uptake by shoots (PUS) of soybean were similar for the two application modes when the source was the RPR (Table 5). On the other hand, fertilization with TSP in the furrow row allowed for higher DMYS and PUS of soybean when compared to broadcast application. In NT, although there were no differences between the different phosphate managements for DMYS and PUS of soybean, these attributes were, respectively, on average 30 and 39% higher in NT compared to CT.
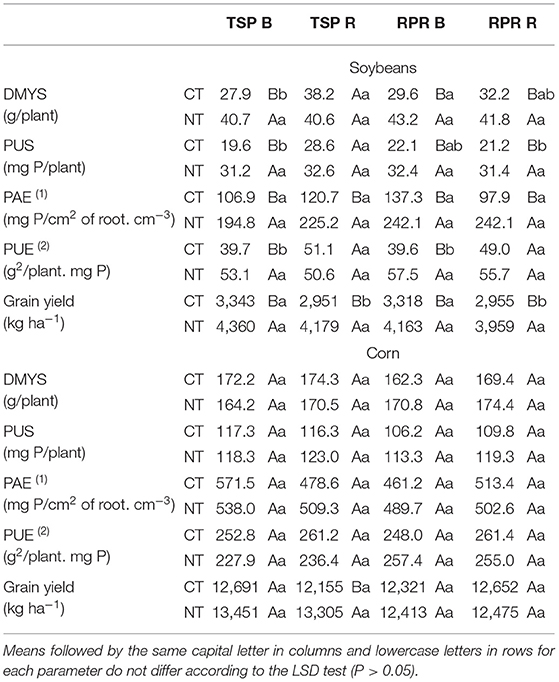
Table 5. Dry matter yield of shoot (DMYS), P uptake of shoot (PUS), P acquisition efficiency (PAE), P utilization efficiency (PUE) and grain yield of soybean (16th cultivation) and corn (17th cultivation) in a very clayey Oxisol under conventional tillage (CT) or no-tillage (NT), receiving 35 kg P ha yr−1 as triple superphosphate (TSP) or reactive phosphate rock (RPR), with broadcast (B) or row (R) application.
There were no differences in the P acquisition efficiency (PAE) of soybeans between the different fertilization managements under CT or NT (Table 5). However, PAE of soybean was on average 95% higher in NT. The PUE of soybeans, which corresponds to the capacity of converting the P uptake in biomass was higher with the application of the fertilizer in the row as compared to the broadcast application, for both P sources under CT (Table 5). PUE was similar between both systems when fertilizer was band-applied at the crop row. However, when the fertilizer was applied broadcast at the surface, NT had higher PUE as compared to CT, for the two P sources.
Although the application of phosphate fertilizer in the furrow row under CT has provided greater PUS by soybean, which was evaluated at the time of flowering, at the crop maturation it was broadcast application that provided higher grain yields (Table 5). On the other hand, under NT soybean yield followed the same trend observed for the PUS with no response from the fertilizer management. Moreover, greater PUS in NT also resulted in higher soybean yield when compared to CT.
Unlike what happened to soybeans, the corn crop showed no differences in DMYS, PUS, PAE and PUE in the comparison between the phosphate fertilizer managements or between soil tillage systems (Table 5). Grain yield was only different in TSP row application, where NT produced 9.5% more grains (Table 5).
Discussion
Distribution of P and Roots in the Soil
While in NT fertilized soil, unreacted particles of fertilizer and crop residues are maintained in the application/deposition soil layer, in CT these materials are annually mixed, resulting in greater contact with the soil and favoring solubilization, adsorption and P mineralization reactions (Oliveira et al., 2019). Likewise, broadcast application of phosphate fertilizer provides greater surface contact with the soil when compared to the sowing furrow application, but that varies according to soil management system and fertilizer source.
In CT, the fertilizer broadcast applied is incorporated in the soil before planting, thus resulting, at first, in a distribution of available P which contrasted highly with that of the row application, which occurs at the time of planting (Figure 1). However, this difference is not cumulative, since annual plowing tends to equalize the effect of fertilization carried out in previous years. By reacting with a smaller soil volume when compared to broadcast treatment, the row application of TSP resulted in increased P content (Figure 1). However, this same reasoning does not fit with RPR fertilization once this is a low solubility source, which requires more time and surface contact with the soil to react and solubilize (Novais et al., 2007).
In NT, since there is no soil mixing, the differences between broadcast and row applications may occur more intensely in the fertilizer application layers (0–5 cm for broadcast and 5–10 cm for row application) and tend to increase with time due to the buildup that occurs every year. It was also in these layers that NT presented a higher P availability compared to CT (Figure 1), where fertilized soil and fertilizer particles are revolved 20 cm deep, reducing P availability in specific layers but reaching deeper layers in relation to NT (Figure 1).
Soil mixing in CT also resulted in a more homogeneous P distribution in the profile, whereas there was a strong gradient in depth in the NT, effect well-described in the literature (De Maria et al., 1999; Santos and Tomm, 2003; Motomiya et al., 2004; Oliveira et al., 2020b), and which was intensified by the broadcast application (Table 3). In NT with broadcast fertilization, P content at the 0–5 cm layer was the result of surface fertilization and nutrient cycling by crops residues and abundant roots through time (Santos and Tomm, 2003). In this same management system, P distributions under 5 cm deep can be considered as a result of the redistribution in the soil by the effect of the decomposition of absorbed P by the roots (Franchini et al., 2004), organic anions leaching (Pavinato et al., 2008), and by the annual opening up of furrows to sow crops.
Despite the differences in P distribution, Bray-1 P average content in the 0–20 cm profile was relatively close between both tillage systems, especially after all 17 crops, when contents were influenced mainly by the interaction between P source and mode of application or tillage (Figure 2B). Within the same soil tillage system, TSP gained P availability in relation to RPR, a probable reflection of the greater solubility of TSP. The effect of modes of application indicated higher labile P levels on row application only when TSP was used, what might be a reflection of reduced soil-fertilizer contact in this application method. There were no significant differences between modes of application when RPR was used, what is probably related to the reduced ability of the Bray-1 solution to access rock phosphate derived P (Oliveira et al., 2019) and thus quantify differences between other factors of the experiment. Nonetheless, values were slightly higher under broadcast in this case, what might be related to increased RPR dissolution under broadcast application due to soil-fertilizer contact. Santos et al. (2008) though, observed equivalent average labile P contents between different P fertilizer application methods.
Since root growth is stimulated by the presence of P (Barber, 1995), in general, root distribution (Figure 3) followed the same trend as that of P contents (Figure 1), being strongly influenced by soil tillage systems and phosphate fertilizer management systems (Holanda et al., 1998; Costa et al., 2010). Thus, the higher density of roots in fertilizer application layer (0–5 cm for broadcast application and 5–10 cm for application in the furrow row), mainly with water soluble source (Figure 3), was probably the result of higher P contents (Figure 1). According to Robinson (1996), roots respond structurally to the distribution and availability of nutrients in the soil, stimulating growth where nutrients are more readily available.
Despite the effect of soil mixing in soil structure encouraging vertical roots growth in CT (Figure 3) (Ball-coelho et al., 1998), the increased presence of P in depth when compared to NT (Table 3) may also have influenced the abundant root growth below 10 cm deep (Table 4), as also observed by Qin et al. (2006). A strong gradient of roots surface density in depth was observed in NT, which was only slightly reduced by the row application of fertilizer (Table 4), similarly to the effects of P source placement on Bray-1 P distribution. These results resemble those observed by Costa et al. (2009) after 18 years of cultivation on a Rhodic Paleudult under NT, when about 50 % of the corn roots density was located in the topsoil, regardless of the application mode of phosphate fertilizer. Ball-coelho et al. (1998), when observing the surface concentration of corn roots in NT, suggests that broadcast application of fertilizer containing highly mobile nutrients and subject to leaching, such as nitrogen, is more efficient than row application. Likewise, the surface distribution of corn and soybean roots in this study indicates that in NT, crops can benefit from broadcast application of fertilizers containing low mobility nutrient, such as P, due to greater fertilized soil volume in contact with a large portion of the total roots surface area in the first few centimeters of soil. It should be noted, however, that our experiment received supplementary irrigation during drought periods. Although Hansel et al. (2017) have observed that yields under broadcast P fertilization in NT were more resilient to water deficit than under NT band-application, more studies are needed to evaluate how water deficit may influence the distribution of roots of crops growing under different tillage systems and fertilizer managements.
On the average of the evaluated soil profile, tillage and phosphate fertilization management systems influenced differently soybean and corn roots surface density. The lower soybean root density in NT when compared to that of CT for all fertilizer managements (Figure 4A) demonstrated that the limited root growth below 10 cm in the NT was not compensated by increased root growth in the surface layer, while for corn there was this compensation (Figure 3B), with no significant effect of tillage on corn root surface density in the 0–20 cm layer, only P source and placement (Figure 4B). Thus, unlike what was observed by Ball-coelho et al. (1998), NT did not present greater total roots density in the profile. Nevertheless, the relationship between the distribution of available P and roots in soil was higher in NT than CT, especially for soybeans (Figure 5), indicating that NT provided more favorable conditions for P absorption by this crop. While in NT layers the higher P concentrations were also those with the highest soybean and corn roots concentration, in the CT this did not occur for soybeans. Possibly this influenced the lower yield of shoot, P uptake, P acquisition and utilization efficiency and thus lower grain soybean yield in CT when compared to that of NT (Table 5) since P is a limiting nutrient of productivity in the Cerrado soils (Nunes et al., 2011a; Oliveira et al., 2020a).
The main influence of soil tillage system at the 0–5 and 10–20 cm depths (Figure 6) occurs because the greatest contrast between them occurs in these layers, since in the NT, P and hence the roots, are kept at the 0–5 cm depth while in the CT, P is revolved down to the 10–20 cm layer (Table 3), stimulating root growth in this layer (Table 4). In turn, at all depths, the phosphate source had greater influence over the application mode (Figure 6), indicating that in established systems, nutrient cycling caused by roots and shoots of plants (Santos and Tomm, 2003) tends to minimize differences promoted by the application mode.
Tillage and Fertilizer Management Implications on P Uptake and Yield
The high stratification of P (Table 3) and roots (Table 4) in the soil under NT, especially with fertilizer broadcast applied, did not represent restrictions for P uptake and yields of soybean and corn. In this system there was no effect of fertilization management (Table 5) on these properties. Systems established under NT, with adequate fertility, usually do not show differences between soybeans and corn yields with broadcast or row P application (Pavinato and Ceretta, 2004; Bergamin et al., 2008; Guareschi et al., 2008; Sousa et al., 2010; Nunes et al., 2011b) so that the choice of the best strategy may be based on other factors such as the operating costs (Matos et al., 2006) or the necessity for short planting windows.
When comparing P sources, Richart et al. (2006) and Nunes et al. (2011b) also observed similar yields using soluble or natural reactive phosphate sources, although many other papers have reported lower grain yields with phosphate rocks (Oliveira Junior et al., 2008; Fontoura et al., 2010; Frandoloso et al., 2010) so that the early application of this source has been recommended in order to overcome solubilization rate limitations in NT (Sousa et al., 2010; Oliveira et al., 2020a). However, these studies reporting low RPR efficiency were performed in shorter time periods than in the present research, what is a relevant factor in the study of slow solubilization fertilizer sources.
In CT soybeans showed higher DMYS and PUS with the application of phosphate fertilizer in the row, which was the fertilization management that promoted greater P content (Figure 2) and root growth (Figure 4) in the soil. However, despite the best performance of row application until flowering, the period in which these evaluations were made, the grain yield of soybeans was higher with fertilizer broadcast application, indicating that some fertilizer management effects later influenced the behavior of this crop.
Besides influenced by fertilizer management under CT, soybean performance in this tillage system was well below that observed in NT, both in DMYS and grain yield (Table 5). This seems to be related to the synchronism between P and soybean root distribution existing in NT, but which does not occur in CT (Figure 5), resulting in higher PAE and soybean yield in NT. An evidence of this is the significant correlation between the PAE and grain yield of soybeans (r = 0.68, p < 0.01, n = 24). Although in the initial years NT did not provide yield gains compared to CT (Schwab et al., 2006), over time soybean yields are frequently higher in NT (Mcgregor et al., 2006; Sousa et al., 2010; Nunes et al., 2011b).
The corn crop, in turn, suffered no influence of P management in CT, and presented performance similar to that observed in NT for almost all fertilization management systems, suggesting that soil tillage promoted a limiting condition for P absorption and grain yield of soybean, but which was circumvented by corn. This was possibly due to the P and roots distribution synchrony observed in corn under CT (Figure 5). In addition to its more favorable root distribution for P absorption, it is known that corn presents several absorption kinetic parameters for P with comparative advantage to that of soybean (Barber, 1995), allowing it to satisfactorily absorb P under conditions that would be limiting to this crop. As a result, corn had much higher PAE than that in soybean, with values about 4.5 times higher in the CT and 2.3 times higher in NT (Table 5). Consequently, while soybean showed considerable gains in productivity in NT (25–42%), corn yields were similar between both systems and when gains did occur they were lower (9%).
Conclusions
Adequate P uptake, growth and grain yield of crops in the long-term depend on the adoption of management systems that promote bioavailability of P in soil and its access by plant roots. While in NT there is strong gradient in depth, with P accumulation in the fertilizer application zone (0–5 cm for broadcast application and 5–10 cm for row application), soil disturbance in CT provided a more homogeneous P profile distribution, with relatively high concentrations below 10 cm deep. Despite differences in distribution, in general the average P content in the 0–20 cm profile was similar for the two soil management systems and for the two application modes, while the TSP provided greater Bray-1 P contents in relation to RPR. P availability and root density of soybeans and corn were influenced to a greater extent by the soil management system, followed by the source and mode of application of phosphate fertilizer. Root distribution of soybeans and corn showed a strong relationship with P distribution, except for soybeans under CT. Consequently, biomass production, P uptake and grain yield of soybeans in CT, in addition to being influenced by P fertilizer management systems, showed lower performance than in NT, which did not occur for corn possibly due to the greater P acquisition efficiency of this crop compared to that of soybeans. The greater stratification of P and roots in soil under NT did not represent any limitation on nutrient uptake and yield of these crops, even with broadcast P application.
Data Availability Statement
The raw data supporting the conclusions of this article will be made available by the authors, without undue reservation.
Author Contributions
RN: original draft, laboratorial analysis, and data interpretation. DS: experimental design elaboration and laboratorial analyses. WG: conceptualization and reviewing. LO: statistical analysis and reviewing. TP: data interpretation. All authors contributed to the article and approved the submitted version.
Conflict of Interest
The authors declare that the research was conducted in the absence of any commercial or financial relationships that could be construed as a potential conflict of interest.
Publisher's Note
All claims expressed in this article are solely those of the authors and do not necessarily represent those of their affiliated organizations, or those of the publisher, the editors and the reviewers. Any product that may be evaluated in this article, or claim that may be made by its manufacturer, is not guaranteed or endorsed by the publisher.
Acknowledgments
This research was supported by Embrapa Cerrados. RN, LO, and TP acknowledge financial assistance by Coordenação de Aperfeiçoamento de Pessoal de Nível Superior - Brasil (CAPES) - Finance Code 001.
Abbreviations
CT, conventional tillage; NT, no-tillage; TSP, triple superphosphate; RPR, reactive phosphate rock; B, broadcast application; R, planting row application; DMYS, Dry matter yield of shoot; PUS, P uptake of shoot; PAE, P acquisition efficiency; PUE, P utilization efficiency.
References
Anghinoni, I. (1992). Uso de fósforo pelo milho afetado pela fração de solo fertilizada com fosfato solúvel. Rev. Bras. Ciênc. Solo. 16, 349–353.
Ball-coelho, B. R., Roy, R. C., and Swanton, C. J. (1998). Tillage alters corn root distribution in coarse-textured soil. Soil Till Res. 45, 237–249. doi: 10.1016/S0167-1987(97)00086-X
Barber, S. A. (1995). Soil Nutrient Bioavailability: A Mechanistic Approach. New York, NY: John Wiley and Sons.
Bergamin, A. C., Schlindwein, J. A., Venturoso, L. R., Valadão Júnior, D. D., Caron, B. O., and Schmidt, D. (2008). Respostas de duas cultivares de soja à adubação a lanço e em sulco, no município de Rolim de Moura/Ro. Rev. Ciênc. Agrár. 50, 155–166. Available online at: https://periodicos.ufra.edu.br/index.php/ajaes/article/view/167/75
Bertol, I., Albuquerque, J. A., Leite, D., Amaral, A. J., and Zoldan Junior, W. A. (2004). Propriedades físicas do solo sob preparo convencional e semeadura direta em rotação e sucessão de culturas, comparadas às do campo nativo. Rev. Bras. Ciênc. Solo. 28, 155–163. doi: 10.1590/S0100-06832004000100015
Bolliger, A., Magid, J., Amado, T. J. C., Neto, F. S., Ribeiro, M. F. S., Calegari, A., et al. (2006). Taking stock of the Brazilian “Zero-Till Revolution”: a review of landmark research and farmers' practice. Adv. Agron. 91, 47–110. doi: 10.1016/S0065-2113(06)91002-5
Bray, R. H., and Kurtz, L. T. (1945). Determination of total, organic and available forms of phosphorus in soils. Soil Sci. 59, 39–45. doi: 10.1097/00010694-194501000-00006
Cahill, J. F. Jr., McNickle GG, Haag, J. J., Lamb, E. G., Nyanumba, S. M., and Clair, C. C. S. (2010). Plants integrate information about nutrients and neighbors. Science 328, 1657. doi: 10.1126/science.1189736
Calegari, A., Tiecher, T., Hargrove, W. L., Ralish, R., Tessier, D., Tourdonnet, d. e., et al. (2013). DR (2013). Long-term effect of different soil management systems and winter crops on soil acidity and vertical distribution of nutrients in a Brazilian Oxisol. Soil Til. Res. 133, 32–39. doi: 10.1016/j.still.05.009.
Costa, F. S., Albuquerque, J. A., Bayer, C., Fontoura, S. M. V., and Wobeto, C. (2003). Propriedades físicas de um Latossolo Bruno afetadas pelos sistemas de plantio direto e preparo convencional. Rev. Bras. Ciênc Solo. 27, 527–535. doi: 10.1590/S0100-06832003000300014
Costa, S. E. V. G. A., de Souza, E. D., Anghinoni, I., Flores, J. P. C., Cao, E. G., and Holzschuh, M. J. (2009). Phosphorus and root distribution and corn growth related to long-term tillage systems and fertilizer placement. Rev. Bras. Ciênc. Solo. 33, 1237–1247. doi: 10.1590/S0100-06832009000500017
Costa, S. E. V. G. A., de Souza, E. D., Anghinoni, I., Flores, J. P. C., Vieira, F. C. B., Martin, A. P., et al. (2010). Patterns in phosphorus and corn root distribution and yield in long-term tillage systems with fertilizer application. Soil Til. Res. 109, 41–49 doi: 10.1016/j.still.04.003.
De Maria, I, C., Nnabude, P. C., and Castro, O. M. (1999). Long-term tillage and crop rotation effects on soil chemical properties of a Rholic Ferrasol in southern Brazil. Soil Till Res 51, 71–79. doi: 10.1016/S0167-1987(99)00025-2
De'ath, G. (2002). Multivariate regression trees: a new technique for modeling species-environment relationships. Ecology 83, 1105–1117. doi: 10.1890/0012-9658(2002)083[1105:MRTANT]2.0.CO;2
Elliott, G. C., and Läuchli, A. (1985). Phosphorus efficiency and phosphate-iron interactions in maize. Agron J. 77, 399–403. doi: 10.2134/agronj1985.00021962007700030011x
EMBRAPA (1999). Manual de Análises Químicas de Solos, Plantas e Fertilizantes. Brasília: EMBRAPA Comunicação para Transferência de Tecnologia.
FEBRAPDP. (2021). Evolução da área Cultivada no Sistema de Plantio Direto na Palha - Brasil. Federação Brasileira de Plantio Direto na Palha. Available online at: http://www.febrapdp.com.br (accessed July 6, 2021).
Figueiredo, C. C., Resck, D. V. S., Carneiro, M. A. C., Ramos, M. L. G., and S.á, J. C. M. (2013). Stratification ratio of organic matter pools influenced by management systems in a weathered Oxisol from a tropical agro-ecoregion in Brazil. Soil Res. 51, 133–141. doi: 10.1071/SR12186
Fontoura, S. M. V., Vieira, R. C. B., Bayer, C., Ernani, P. R., and Moraes, R. P. (2010). Eficiência técnica de fertilizantes fosfatados em latossolo sob plantio direto. Rev. Bras. Ciênc. Solo. 34, 1907–1914. doi: 10.1590/S0100-06832010000600015
Franchini, J. C., Pavan, M. A., and Miyazawa, M. (2004). Redistribution of phosphorus in soil through cover crop roots. Brazil. Arch. Biol. Tech. 47, 381–386. doi: 10.1590/S1516-89132004000300007
Frandoloso, J. F., Lana, M. C., Fontaniva, S., and Czycza, R. V. (2010). Eficiência de adubos fosfatados associados ao enxofre elementar na cultura do milho. Rev. Ceres 57, 686–694. doi: 10.1590/S0034-737X2010000500019
Guareschi, R. F., Gazolla, P. R., Souchie, E. L., and Rocha, A. C. (2008). Adubação fosfatada e potássica na semeadura e a lanço antecipada na cultura da soja cultivada em solo de Cerrado. Semina Ciênc. Agrár. 29, 769–774. doi: 10.5433/1679-0359.2008v29n4p769
Hansel, F. D., Amado, T. J. C., Diaz, D. A. R., Rosso, L. H. M., Nicoloso, F. T., and Schorr, M. (2017). Phosphorus fertilizer placement and tillage affect soybean root growth and drought tolerance. Agron. J.109, 2936–2944. doi: 10.2134/agronj04.0202.
Hodge, A., Berta, G., Doussan, C., Merchan, F., and Crespi, M. (2009). Plant root growth, architecture and function. Plant Soil 321, 153–187. doi: 10.1007/s11104-009-9929-9
Holanda, F. S. R., Mengel, D. B., Paula, M. B., Carvaho, J. G., and Bertoni, J. C. (1998). Influence of crop rotations and tillage systems on phosphorus and potassium stratification and root distribution in the soil profile. Comm. Soil Sci. Plant Anal. 29, 2383–2394. doi: 10.1080/00103629809370118
IUSS Working Group WRB (2006). World Reference Base for Soil Resources 2006. World Soil Resources Reports N(103). Rome: FAO.
Jorge, L. A. C., Ralisch, R., Abi-Saab, O. J. G., Medina, C. C., Guimarães, M. F., Neves, C. S. V. J., et al. (1996). “Aquisicão de imagens de raízes,” In: Recomendacões Práticas Para Aquisição de Imagens Digitais Através do SIARCS, ed L. A. C. Jorge (São Carlos: EMBRAPA-CNPDIA (Circular técnica 1)), 2–28
Klepker, D., and Anghinoni, I. (1993). Phosphate uptake and corn root distribution as affected by fertilizer placement and soil tillage. Agronomy 1, 111–115.
Lopes, A. A. C., de Sousa, D. M. G., dos Reis junior, F. B, Figueiredo, C. C, Malaquias, J. V, Souza, L. M., et al. (2018). Temporal variation aand critical limits of microbial indicators in oxisols in the Cerrado, Brazil. Geoderma Reg. 12, 72–82. doi: 10.1016/j.geodrs.01.003.
Martorano, L. G., Bergamaschi, H., Dalmago, G. A., Faria, R. T., Mielniczuk, J., and Comiran, F. (2009). Indicadores da condição hídrica do solo com soja em plantio direto e preparo convencional. Rev. Bras. Eng. Agríc. Ambient 13, 397–405. doi: 10.1590/S1415-43662009000400005
Matos, M. A., Salvi, J. V., and Milan, M. (2006). Pontualidade na operação de semeadura e a antecipação da adubação e suas influências na receita líquida da cultura da soja. Eng. Agríc. 26, 493–501. doi: 10.1590/S0100-69162006000200018
Mcgregor, K. C., Cullum, R. F., Mutchler, C. K., and Johnson, J. R. (2006). Long-Term No-Till and Conventional-Till Soybean Yields. Mississippi Agricultural and Forestry Experiment Station Research Report (Holly Springs, NC). Bulletin No. 1146, 14.p. (Holly Springs)
Mendes, I. C., Fernandes, M. F., Chaer, G. M., Reis Junior, F. B., and dos (2012). Biological functioning of Brazilian cerrado soils under different vegetation types. Plant Soil 359, 183–195. doi: 10.1007/s11104-012-1195-6
Mendes, I. C., Souza, L. V., Resck, D. V. S., and Gomes, A. C. (2003). Propriedades biológicas em agregados de um Latossolo Vermelho-escuro sob plantio convencional e direto no Cerrado. Rev. Bras. Ciênc. Solo. 27, 435–443. doi: 10.1590/S0100-06832003000300005
Motomiya, W. R., Fabrício, A. C., Marchetti, M. E., Gonçalves, M. C., Robaina, A. D., and Novelino, J. E. (2004). Métodos de aplicação de fosfato na soja em plantio direto. Pesq. Agropec. Bras. 39, 307–312. doi: 10.1590/S0100-204X2004000400002
Mulia, R., Dupraz, C., and van Noordwijk, M. (2010). Reconciling root plasticity and architectural ground rules in tree root growth models with voxel automata. Plant Soil 337, 77–92. doi: 10.1007/s11104-010-0502-3
Nicolodi, M., Gianello, C., Anghinoni, I., Marré, J., and Mielniczuk, J. (2008). Insuficiência do conceito mineralista para expressar a fertilidade do solo percebida pelas plantas cultivadas no sistema plantio direto. Rev. Bras. Ciênc. Solo. 32, 2735–2744. doi: 10.1590/S0100-06832008000700017
Novais, R. F., Smyth, T. J., and Nunes, F. N. (2007). “Fósforo,” in. Fertilidade do Solo, 1st Edn, eds R. F. Novais, V. V. H. Alvarez, N. F. Barros, R. L. F. Fontes, R. B. Cantarutti, and J. C. L. Neves (Viçosa: SBCS), 471–550.
Nunes, R. S., Lopes, A. A. C., Sousa, D. M. G., and Mendes, I. C. (2011a). Sistemas de manejo e os estoques de carbono e nitrogênio em latossolo de Cerrado com a sucessão soja-milho. Rev. Bras. Ciênc. Solo. 35, 1407–1419. doi: 10.1590/S0100-06832011000400035
Nunes, R. S., Sousa, D. M. G., Goedert, W. J., Oliveira, L. E. Z., Pavinato, O. S., and Pinheiro, T. D. (2020). Distribution of soil phosphorus fractions as a function of long-term soil tillage and phosphate fertilization management. Front. Earth Sci. 8:350. doi: 10.3389/feart.2020.00350
Nunes, R. S., Sousa, D. M. G., Goedert, W. J., and Vivaldi, L. (2011b). Distribuição de fósforo no solo em razão do sistema de cultivo e manejo da adubação fosfatada. Rev. Bras. Ciênc. Solo. 35, 877–888. doi: 10.1590/S0100-06832011000300022
Oliveira Junior, A., Prochnow, L. I., and Klepker, D. (2008). Eficiência agronômica de fosfato natural reativo na cultura da soja. Pesq. Agropec. Bras. 43, 623–631. doi: 10.1590/S0100-204X2008000500010
Oliveira, L. E. Z., de Sousa, D. M. G., Figueiredo, C. C., Nunes, R. S., and Malaquias, J. V. (2020a). Long-term phosphate fertilization strategies evaluation in a Brazilian Oxisol. Agron. J. 112, 4303–4320. doi: 10.1002/agj2.20324
Oliveira, L. E. Z., Nunes, R. S., de Sousa, D. M. G., and Figueiredo, C. C. (2020b). Dynamics of residual phosphorus forms under different tillage systems in a Brazilian Oxisol. Geoderma 367:114254. doi: 10.1016/j.geoderma.2020.114254
Oliveira, L. E. Z., Nunes, R. S., Sousa, D. M. G., Busato, J. G., and Figueiredo, C. C. (2019). Response of maize to diferente soil residual phosphorus conditions. Agron. J. 111, 1–10. doi: 10.2134/agronj11.0710.
Pavinato, P. S., and Ceretta, C. A. (2004). Fósforo e potássio na sucessão trigo/milho: épocas e formas de aplicação. Ciênc. Rural 34, 1779–1784. doi: 10.1590/S0103-84782004000600017
Pavinato, P. S., Merlin, A., and Rosolem, C. A. (2008). Organic compounds from plant extracts and their effect on soil phosphorus availability. Pesq. Agropec. Bras. 43, 1379–1388. doi: 10.1590/S0100-204X2008001000017
Prochnow, L. I., Alcarde, J. C., and Chien, S. H. (2004). “Eficiência agronômica dos fosfatos totalmente acidulados,” in: Fósforo na Agricultura Brasileira, 1st Edn, eds T. Yamada, S. R. A. Abdalla (Piracicaba: Potafos), 605–663.
Qin, R., Stamp, P., and Richner, W. (2006). Impact of tillage on maize rooting in a Cambisol and Luvisol in Switzerland. Soil Til. Res. 85, 50–61 doi: 10.1016/j.still.12.003.
Richart, A., Lana, M. C., Schulz, L. R., Bertoni, J. C., and Braccini, A. L. (2006). Disponibilidade de fósforo e enxofre para a cultura da soja na presença de fosfato natural reativo, superfosfato triplo e enxofre elementar. Rev. Bras. Ciênc. Solo. 30, 695–705. doi: 10.1590/S0100-06832006000400010
Robinson, D. (1996). Variation, co-ordination and compensation in root systems in relation to soil variability. Plant Soil 187, 57–66. doi: 10.1007/BF00011657
Santos, H. P., and Tomm, G. O. (2003). Disponibilidade de nutrientes e teor de matéria orgânica em função de sistemas de cultivo e de manejo de solo. Ciênc. Rural 33, 477–486. doi: 10.1590/S0103-84782003000300013
Santos, J. Z. L., Furtini Neto, A. E., Resende, A. V., Curi, N., Carneiro, L. F., and Costa, S. E. V. G. A. (2008). Frações de fósforo em solo adubado com fosfatos em diferentes modos de aplicação e cultivado com milho. Rev. Bras. Ciênc. Solo. 32, 705–714. doi: 10.1590/S0100-06832008000200025
Schwab, G. J., Whitney, D. A., Kilgore, G. L., and Sweeney, D. W. (2006). Tillage and phosphorus management effects on crop production in soils with phosphorus stratification. Agron J. 98, 430–435. doi: 10.2134/agronj2005.0050
Siddiqi, M. Y., and Glass, A. D. (1981). Utilization index: a modified approach to the estimation and comparison of nutrient utilization efficiency in plants. J. Plant Nutr. 4, 289–302. doi: 10.1080/01904168109362919
Soil Survey Staff (2010). Keys to Soil Taxonomy, 11th Edn. Washington, DC: United States Department of Agriculture, Natural Resources Conservation Service.
Sousa, D. M. G., and Lobato, E. (2004). Cerrado: Correção do Solo e Adubação. Brasília: Embrapa Informação Tecnológica.
Sousa, D. M. G., Rein, T. A., Goedert, W. J., Lobato, E., and Nunes, R. S. (2010). “Fósforo,” in Boas Práticas Para Uso Eficiente de Fertilizantes: Volume 2, Nutrientes, 1st Edn, eds L. I. Prochnow, V. Casarin, S. R. Stipp (Piracicaba: INPI – Brasil), 67–132.
Keywords: root, no-tillage agriculture, soluble phosphate, reactive phosphate rock, broadcast application, band application, conventional tillage
Citation: Nunes RS, Sousa DMG, Goedert WJ, Oliveira LEZ and Pinheiro TD (2021) Crops' Yield and Roots Response to Soil Phosphorus Distribution Resulting From Long-Term Soil and Phosphate Fertilization Management Strategies. Front. Agron. 3:757100. doi: 10.3389/fagro.2021.757100
Received: 11 August 2021; Accepted: 03 December 2021;
Published: 24 December 2021.
Edited by:
Paulo Sergio Pavinato, University of São Paulo, BrazilReviewed by:
Frederico Costa Beber Vieira, Federal University of Pampa, BrazilCarlos Antonio Costa Do Nascimento, University of São Paulo, Brazil
Copyright © 2021 Nunes, Sousa, Goedert, de Oliveira and Pinheiro. This is an open-access article distributed under the terms of the Creative Commons Attribution License (CC BY). The use, distribution or reproduction in other forums is permitted, provided the original author(s) and the copyright owner(s) are credited and that the original publication in this journal is cited, in accordance with accepted academic practice. No use, distribution or reproduction is permitted which does not comply with these terms.
*Correspondence: Rafael de Souza Nunes, cmFmYWVsLm51bmVzQGVtYnJhcGEuYnI=; Luiz Eduardo Zancanaro de Oliveira, bHVpenphbm9saUBnbWFpbC5jb20=
†Deceased