 Marte Nikolaisen
 Jonathan Hillier
 Pete Smith
 Dali Nayak1
- 1Institute of Biological and Environmental Science, School of Biological Sciences, University of Aberdeen, Aberdeen, Scotland, United Kingdom
- 2Global Academy of Agriculture and Food Security, University of Edinburgh, Midlothian, Scotland, United Kingdom
Rice is a staple food for more than three billion people and accounts for up to 11% of the global methane (CH4) emissions from anthropogenic sources. With increasing populations, particularly in less developed countries where rice is a major cereal crop, production continues to increase to meet demand. Implementing site-specific mitigation measures to reduce greenhouse gas emissions from rice is important to minimise climate change. Measuring greenhouse gases is costly and time-consuming; therefore, many farmers, supply chains, and scientists rely on greenhouse gas accounting tools or internationally acceptable methodologies (e.g., Intergovernmental Panel on Climate Change) to estimate emissions and explore mitigation options. In this paper, existing empirical models that are widely used have been evaluated against measured CH4 emission data. CH4 emission data and management information were collected from 70 peer-reviewed scientific papers. Model input variables such as soil organic carbon (SOC), pH, water management during crop season and pre-season, and organic amendment application were collected and used for estimation of CH4 emission. The performance of the models was evaluated by comparing the predicted emission values against measured emissions with the result showing that the models capture the impact of different management on emissions, but either under- or overestimate the emission value, and therefore are unable to capture the magnitude of emissions. Estimated emission values are much lower than observed for most of the rice-producing countries, with R correlation coefficient values varying from −0.49 to 0.87 across the models. In conclusion, current models are adequate for predicting emission trends and the directional effects of management, but are not adequate for estimating the magnitude of emissions. The existing models do not consider key site-specific variables such as soil texture, planting method, cultivar type, or growing season, which all influence emissions, and thus, the models lack sensitivity to key site variables to reliably predict emissions.
Introduction
Rice is produced in all continents of the world except Antarctica and is a major cereal crop for almost half of the world’s population, accounting for up to two-thirds of the daily calories for nearly three billion people (Khush, 2005; Mosleh et al., 2015; Wang et al., 2017). It has been predicted that the production must increase by 8–10 million tonnes per year (Seck et al., 2012) and by as much as 40% by 2040 to meet demands from rapid population increases in countries where rice is a staple food (OECD/FAO, 2011). With this comes challenges, such as sourcing land for rice cultivation, water availability, and production efficiency in the form of increasing yields, minimising water usage, and reducing greenhouse gas (GHG) emissions. Rice production is considered a potent source of anthropogenic GHGs, accounting for 6%–11% of the global methane (CH4) emissions from anthropogenic sources (Smith et al., 2021), and thus, there are concerns that increased production will lead to higher emissions. GHG calculators, derived from process-based or empirical models, are often used for estimating emissions and to determine suitable mitigation options both at the field and country scale, since GHG emissions are difficult, costly, and time-consuming to measure. Many different models for estimating CH4 emissions exist; however, the majority are too regionally specific to work across different continents or lack the ability to provide adequate mitigation options by only considering a handful of variables that influence these emissions (Hillier et al., 2011; Clift et al., 2014). Estimation of CH4 emissions from rice paddies has improved greatly recently, but there is still room for improvement to estimate emissions for all rice-producing countries accurately. Wang et al. (2018) state that the discrepancies in magnitude between different studies are high but improving and that bottom-up or inventory approaches had a lower range than the top-down approach when it came to estimating emissions and thus were better for country-scale emissions, based on a global empirical model.
The Intergovernmental Panel on Climate Change (IPCC) classified emission estimation methods into three types: tier 1, 2, or 3. Tier 1 methods use a standard equation with a default emission factor (EF). Tier 2 methods use the same standard equation with country/region-specific EFs. Tier 3 methods are any methods more complex than tier 2. Tier 1 methods typically require fewer input variables and lower precision than tier 3 methods. Most rice-producing countries are at present using either the tier 1 or tier 2 methods to estimate CH4 emissions for their national GHG inventory reports (Yan et al., 2009; Wang et al., 2018). Using tier 1 methods to estimate emissions instead of using tier 2 methods, which are EFs based on observed country/region-specific data, can lead to inaccurate estimates and raises questions about the applicability of default EFs proposed by the IPCC, particularly for those countries that have different climatic or management conditions than the global mean (Lokupitiya and Paustian, 2006; Albanito et al., 2017). Here, we evaluate the empirical model of Wang et al. (2018) and its predecessor, Yan et al. (2005), which was created using data collected from Asian (and predominantly Chinese) rice fields only. The newer (Wang et al., 2018) model uses the same principles, variables, and data collection process but also includes data collected from Europe, North America, and South America. We also evaluate the IPCC, 2019 and 2006 models, which have been derived from these two models and use baseline default EFs and scaling factors (SFs) in which SFs are used to adjust the EFs, allowing the user to take account of various conditions that may be known such as organic amendment, cropping, and water practices (Tirol-Padre et al., 2017). In contrast to Wang et al. (2018) and Yan et al. (2005), the IPCC methods do not consider the impact of soil organic carbon (SOC), pH value, or agroecological zones. The IPCC methods are classified as tier 1 methods, which means they require country-specific EF and/or SF and are often used in national GHG inventory reports, while the other two models are classified as tier 3 methods, which encourage the use of process-based or empirical models that can assess rice cultivation over time and thus are driven by more detailed, high-resolution data . The aim of this study is to assess the four models on their performance at the regional and country scale with the use of collected field data, with the objective of determining if the models are sensitive enough to accurately predict emissions for both temperate and tropical rice regions and, if not, what are the limitations of the current models.
Materials and methods
Data collection
Field data of CH4 emissions from rice pre-2021 were collected from peer-review papers through a comprehensive literature search. Google Scholar, Scopus, and ISI-Web of Science were searched for the following keywords in various combinations: “Rice”, “Paddy”, “Methane”, “CH4”, “emission”, “greenhouse gas”, “GHG”, and each rice-producing country based on FAOSTAT (FAO [Food and Agricultural Organization of the United Nations], 2019). Only original data that directly measured CH4 emissions from fields were included; studies that involved use of greenhouses, laboratories, pots, or computer modelling in the data collection process were excluded. For a paper to be deemed suitable, it needed to contain data and information for certain key variables listed in Wang et al. (2018), and the paper itself was not used in the development of the Wang et al. (2018) or Yan et al. (2005) model and recorded in their database. A total of 113 publications comprising 972 measurements fit the quality criteria for the IPCC models, and 111 publications comprising 954 measurements met the criteria for the Wang and Yan models. The new database contains records of observed CH4 emissions from all rice-growing continents in the world with the exception of Oceania (Figure 1). For each individual study, a range of data were collected with the data collection methodology and content being based on Wang et al. (2018) and included CH4 emission, crop duration, water regime during and before rice-growing season, organic amendment timing, type and amount, SOC, and pH, with variables being grouped into classes as described in Table 1 of Wang et al. (2018). Experiments that used alternate wetting and drying would therefore be classified as multiple drainage, and winter flooding in pre-season was classified as long drainage. Biochar application was included as straw off season, and in cases where the amount of organic material in straw and manure was expressed in wet weight and dry weight, respectively, they were converted so that all organic amendment from straw and manure was recorded as dry weight and wet weight, respectively. If SOC was expressed as organic matter, it was converted with the use of the Bemmelen index value of 0.58 in a similar manner to Wang et al. (2018). Emissions were converted and expressed as amount of carbon per hectare per day (CH4-C kg ha−1 day−1). In cases where emission values were not expressed in papers, but in figures, a web plot digitizer was used to extract the value (https://automeris.io/WebPlotDigitizer/). Asian rice paddies were classified into agroecological zones 1–3 and 5–8 according to the FAO zoning system (IRRI, 2002), while the European, South American, and North American fields were grouped as per Wang et al. (2018).
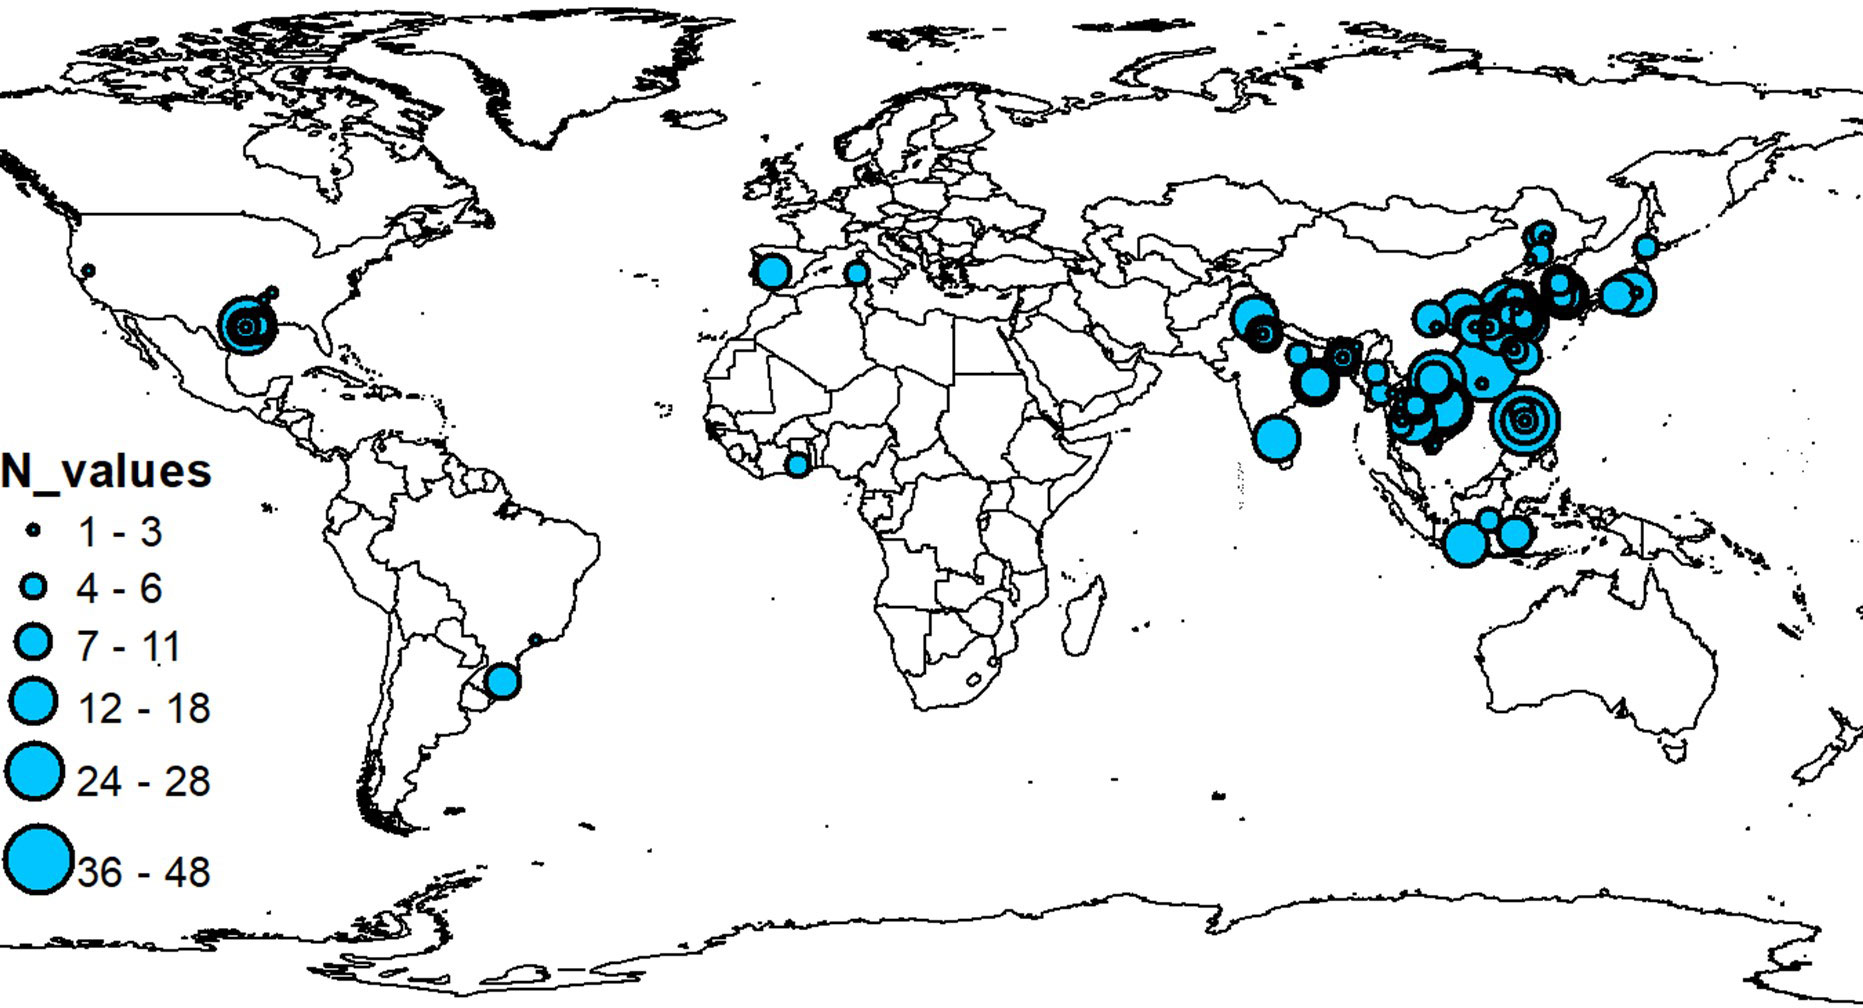
Figure 1 Site experiment locations of collected data from peer-reviews used for evaluating the existing empirical CH4 models with N values representing number of observations.
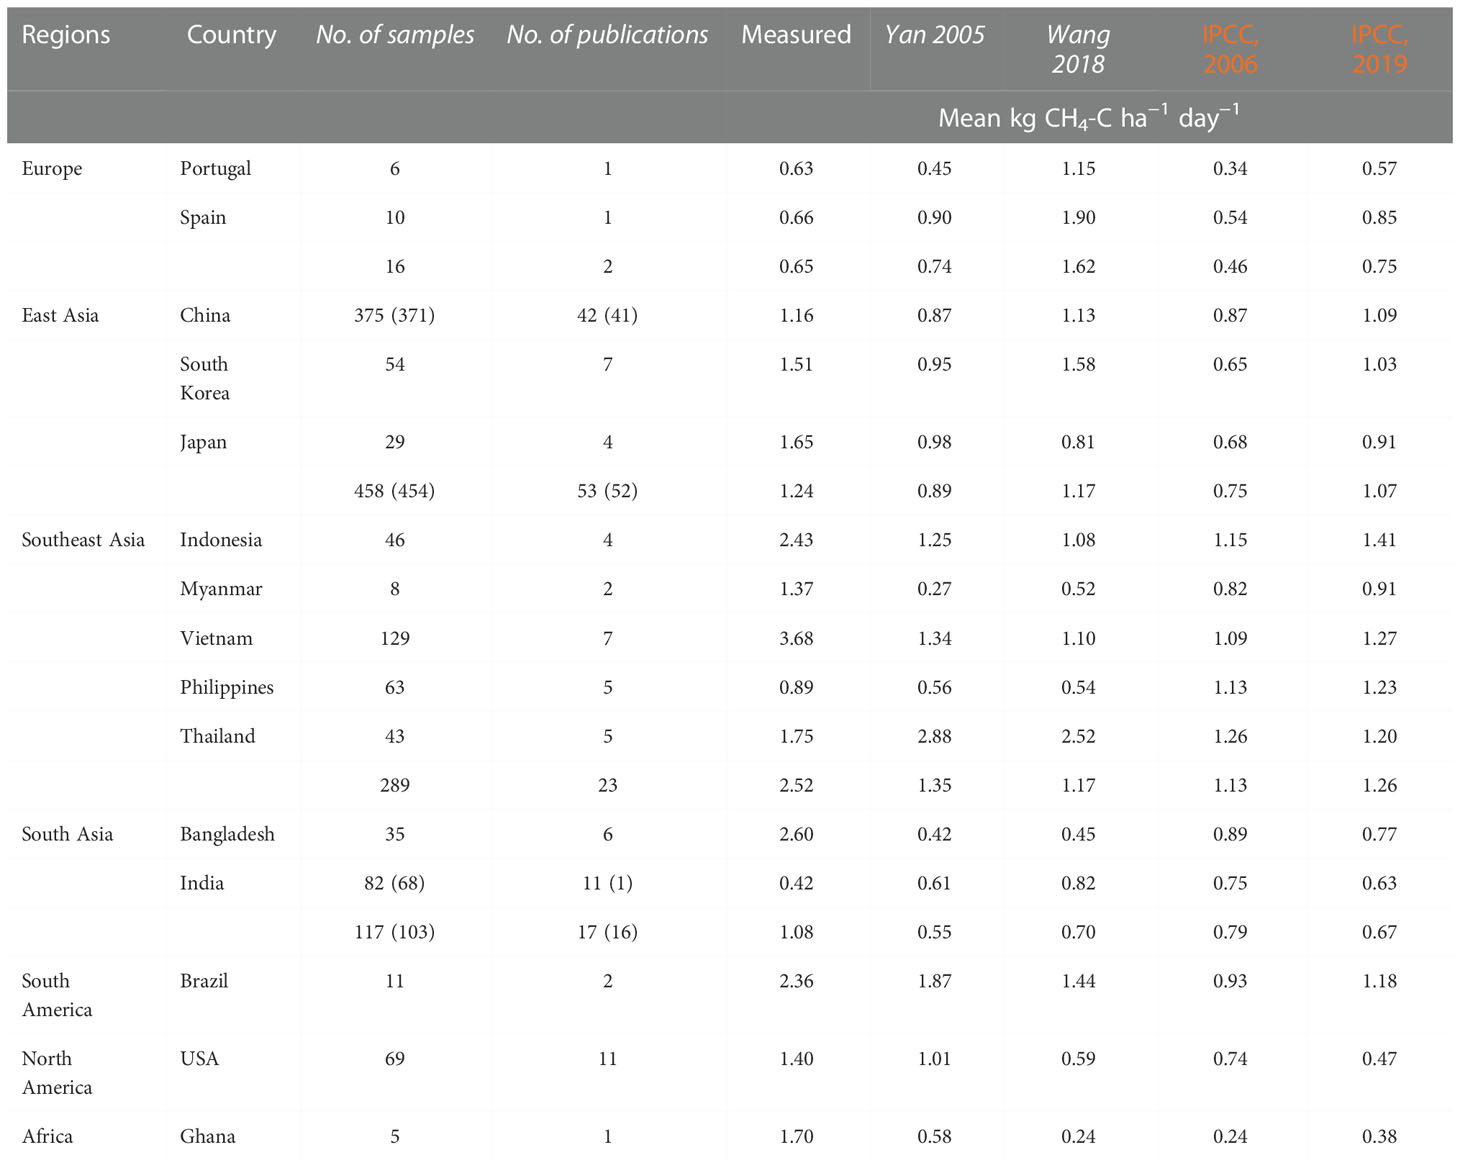
Table 1 List of regions, countries, and number of data points evaluated.
Method and evaluation approach
Observed CH4 emissions were compared against modelled emissions from four different approaches: Yan et al. (2005); IPCC (2006) EF, Wang et al. (2018), and IPCC (2019) EF models. With the use of statistics in MS Excel, and a statistical model evaluation package (ModEval; Smith and Smith, 2007), data were evaluated to check for significant association between the observed and simulated fluxes for each of the four models, and whether the models were over- or underestimating the data (using M, the mean difference). The sample correlation coefficients (R) and linear regression plots were used to compare the relationship between the observed and modelled values. Further statistical analysis was done in which the significance of R and M was tested using the F-test (p = 0.05) and the Student’s two-tailed t-test (critical at 2.5%). The modelled and measured datasets were then compared against each other to determine the total mean difference between the datasets by calculating the root mean square error (RMSE). The IPCC (2019) model also has an additional pre-season water regime class: Non-flooded pre-season >365 days; beside this, the classes for all parameters are the same. A detailed summary of the SF and EF for the two IPCC models can be found in the supplementary documents (S1) and varies according to different regions and/or management practices. These EF and SF values along with the statistical models below have been used for our evaluation and as input variables for our analysis.
where
EFi = Daily emission factor (kg CH4 day−1 ha−1).
EFa = Baseline emission factor for continuous flooding, short drainage pre-season without organic amendment.
EFb = Scaling factor accounting for differences in regions for baseline emission factor (continuous flooding, short drainage pre-season without organic amendment).
SFp = Scaling factor accounting for the difference in water regime during pre-season.
SFw = Scaling factor accounting for the difference in water regime during growing season.
SFo = Scaling factor accounting for the difference in organic amendment application.
For the IPCC models, the daily CH4 emission factors are calculated based on the region to which each country belongs, the water regime before and during rice cultivation, and the type and amount of organic amendment applied; a scaling and emission factor summary can be seen in S1. The Yan et al. (2005) and Wang et al. (2018) model also consider soil organic carbon (SOC), pH, and agroecological zone:
where
Ln(flux) = Average CH4 flux (kg CH4-C ha−1 day−1) during growing season
Constant + a x ln(SOC) = Soil organic carbon (a is the effect of SOC)
pHh = The effect of pH in which h is for each individual class.
PWi = Effect of pre-season water regime (i is for each individual class)
WTj/WRj = Effect of water regime during growing period (j is for each individual class)
CLk/AEZk = The effect of climate/agroecological zones (AEZ)
OMl x ln (1 + AOMl) = OM is the effect of added organic material while AOM is the effect of the amount applied (l is for each individual class/amount t/ha−1)
Results
Evaluation of existing CH4 models
The four existing CH4 models for rice paddies were evaluated using independent data, i.e., the data from peer-reviewed papers that were not used in the development of these models. Evaluation was done for all global regions except Oceania, with Asia divided into South, Southeast, and East in a similar manner to that used in Wang et al. (2018). Comparison between measured and simulated data was performed at both region and country scale (Table 1). European rice paddies had the lowest mean measured emission rate at 0.65 kg CH4-C ha−1 day−1 while Southeast Asian fields had the highest at 2.52 kg CH4-C ha−1 day−1. At the country level, Portugal had the lowest mean measured emission while Vietnam had the highest at 0.63 and 3.68 kg CH4-C ha−1 day−1, respectively. For the four modelling approaches, the tier 3 models (Yan and Wang) estimated lowest mean emission for Myanmar and Bangladesh at 0.27 and 0.42 kg CH4-C ha−1 day−1 for the Yan model and 0.52 and 0.45 kg CH4-C ha−1 day−1 for the Wang model, respectively, with the highest predicted emission being recorded for Thailand at 2.88 kg CH4-C ha−1 day−1 for the Yan model and 2.52 kg CH4-C ha−1 day−1 for the Wang model. Regional predicted emission rates were the highest for South America for both models and the lowest for South Asia for the Yan model and Africa for the Wang model. The two tier 1 models (IPCC) mean that predicted emission rates were, at the country scale, the lowest for Ghana at 0.24 and 0.38 kg CH4-C ha−1 day−1 and the highest for Thailand at 1.85 for the IPCC, 2006 model and for Indonesia at 1.41 kg CH4-C ha−1 day−1 for the 2019 model. Due to the high estimates for Thailand and Indonesia, both models recorded Southeast Asia to have the highest mean regional estimates followed by South America at 1.13 and 0.93 kg CH4-C ha−1 day−1 for IPCC, 2006 and 1.26 and 1.18 CH4-C ha−1 day−1 for IPCC, 2019, respectively, while the regions with the lowest estimated emissions were Africa at 0.24 CH4-C ha−1 day−1 for IPCC, 2006 and 0.38 CH4-C ha−1 day−1 for IPCC, 2019 (Table 1).
Linear correlation analysis combined with use of ModEval was carried out to assess model performance at the global, country, and regional scale. The linear correlation plots represent the association between the simulated and measured values in which the figures’ R2 value represent the percentage variation in y, which is explained by the x variables. R2 is the square of the sample correlation coefficient (r), which is the degree of relationship between the observed and measured emissions while the slope and y-intercept reflect the models’ performance where the lower the slope value, the more the model underestimates the higher measured emissions while the higher the y-intercept value, the more the models overestimate the lower measured emission and vice versa. Assessing the performance of the tier 1 and tier 3 methods globally (Figure 2) shows that all four methods underestimate the higher emissions while overestimating the lower emissions with the tier 1 methods having less outliers than the tier 3 methods. For the tier 3 methods, Yan performs slightly better than the Wang model with R correlation coefficients of 0.17 compared to 0.12 for Wang (n = 947, p< 0.001) (S3). This is supported by the linear regression plots in which the Wang method underestimates the higher emissions and overestimates the lower emissions more than the Yan method with a slope of 0.068 and a y-intercept of 0.97 for Wang and 0.10 and 0.88 for Yan, respectively. For the tier 1 methods, the newer IPCC, 2019 overestimates the outliers more than the older IPCC, 2006 model but performs better across the value range and, as such, is the better model with R correlation coefficients of 0.25 for IPCC, 2019 compared to 0.21 for IPCC, 2006 (n = 965, p< 0.001). Both models underestimate the higher values above 3 kg CH4-C ha−1 day−1, which is supported by the low slope values of 0.07 and 0.09 for IPCC, 2006 and IPCC, 2019, respectively.
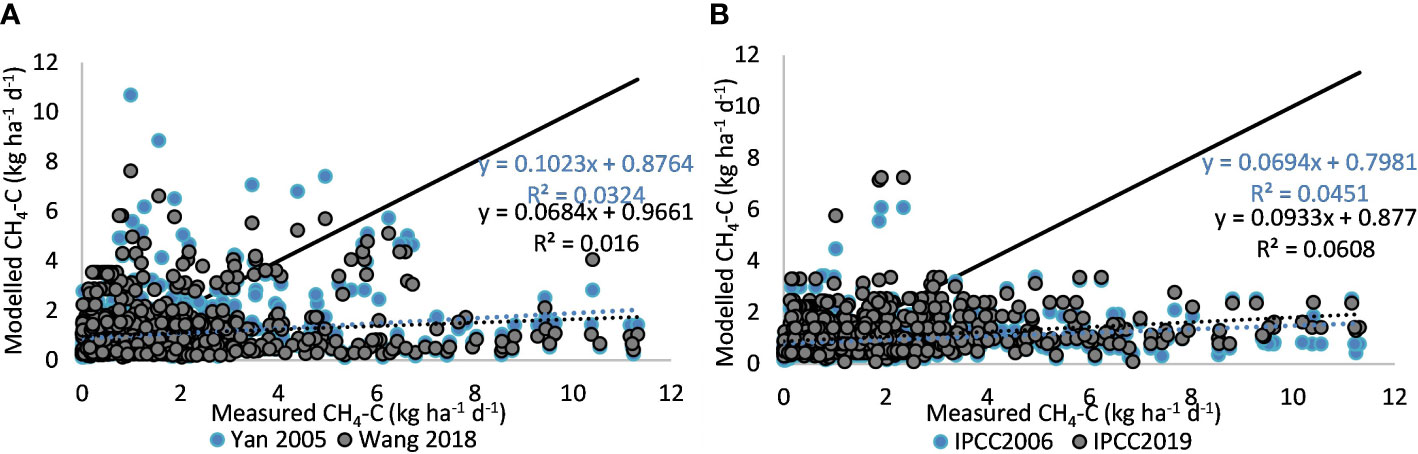
Figure 2 Comparison of modelled against observed emission for the four empirical models: (A) Tier 3 Yan and Wang models, (B) IPCC, 2006 and 2019 models (solid line indicates 1:1).
Tropical countries in Southeast Asia
Data were collected from five countries within Southeast Asia: Indonesia, Myanmar, Vietnam, Philippines, and Thailand. Statistical analysis of model performance shows that all models underestimate emissions in this region with a significant association being observed for the two tier 1 models (n = 289, p< 0.001) with an R correlation of 0.18 for IPCC, 2006 and 0.22 for IPCC, 2019. Looking further into model estimates, there is a trend that the lower emissions are overestimated, while the higher emissions are underestimated, which is supported by the figures’ slope and y-intercept values (Figure 3). Evaluation of model performance for each individual country supports this, with models underestimating for all except Thailand (S2) and with statistical analysis showing a wide range in R correlation coefficients across the countries with all models having a significant association for both Thailand (n = 43, p< 0.001) and Philippines (n = 63, p< 0.001), while the Yan model has a significant association for Myanmar (n = 8, p< 0.001) and Vietnam (n = 129, p< 0.001). IPCC, 2006 shows a significant association for Indonesia (n = 46, p< 0.001), IPCC, 2019 shows a significant association for Indonesia and Vietnam, while Wang shows a significant association for Myanmar (S3). Looking at the RMSE for the models, they are all high, ranging between 92.15% for Wang et al. (2018) for Myanmar and 188.93% for Yan et al. (2005) for Thailand (S3). The statistical analysis indicates that the models can capture the emission trend, but not the magnitude of emissions for all but Vietnam in which the IPCC, 2019 model is the only model showing a positive R correlation coefficient (S3).
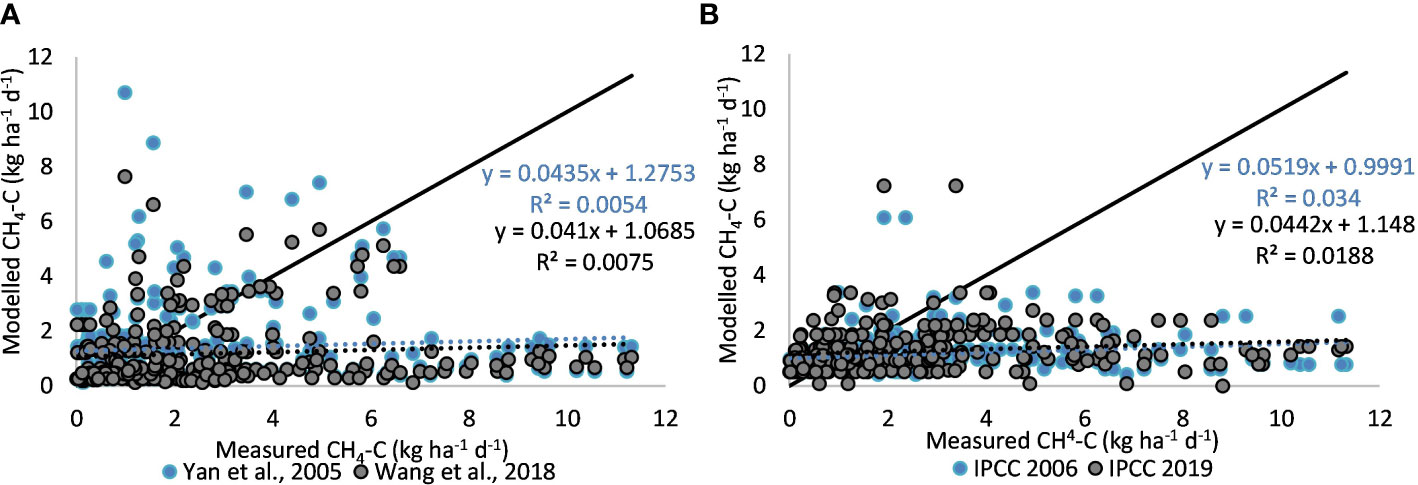
Figure 3 Modelled and observed CH4 emission for Southeast Asia: (A) Yan and Wang tier 3 models, (B) IPCC tier 1 models (solid line indicates 1:1). Sample size n = 289.
Tropical countries in South Asia
The models also underestimate emissions for South Asia, particularly for the higher measured emissions, while for some of the lower measured emissions, they estimate well (Figure 4). However, statistical analysis shows a non-significant association for all models except IPCC, 2019 (n = 117, R = 0.26, p< 0.001) with a negative R correlation coefficient (S3). As previously mentioned, the existing Wang model classified countries into regions to produce regional as well as country-specific EFs. For South Asia, Bangladesh and Indian EFs were estimated to be similar at the country scale. Looking at the mean emissions for these countries in Table 1, we can see that there is a significant difference in measured emission at the country scale. When evaluating the models, we can also see a difference in how they perform for each of these countries, with models significantly underestimating emissions for Bangladesh, while for India, which has lower measured mean emissions, the models overestimate the lower emission values while underestimating the higher emission values (Figure 5). This is supported by statistical analysis, which shows higher R correlation coefficients for India than Bangladesh across the models and a lower mean difference (S3). However, high relative error and RMSE (S3) of the models indicate that the models are not performing well for either country. Negative R correlations for the Yan, IPCC, 2006, and Wang models for Bangladesh also shows that the models do not capture the trend or the magnitude of the emissions, while the models capture the trend for the Indian data, but not the magnitude.
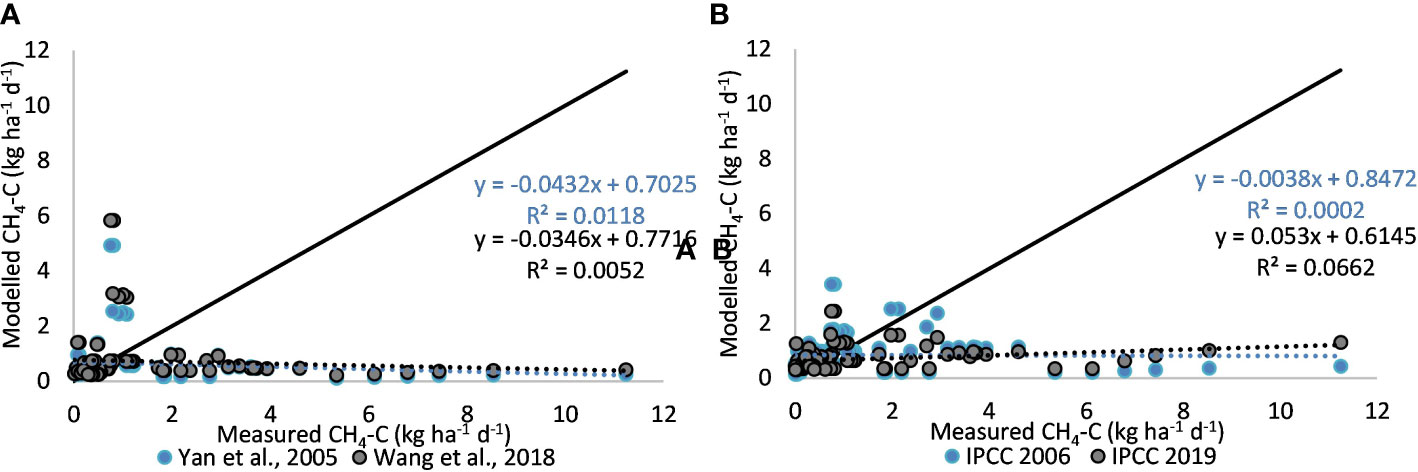
Figure 4 Modelled and observed CH4 emission for South Asia: (A) Yan and Wang tier 3 models, (B) IPCC tier 1 models (solid line indicates 1:1). Sample size n = 103 for tier 3 models and 117 for tier 1 models.
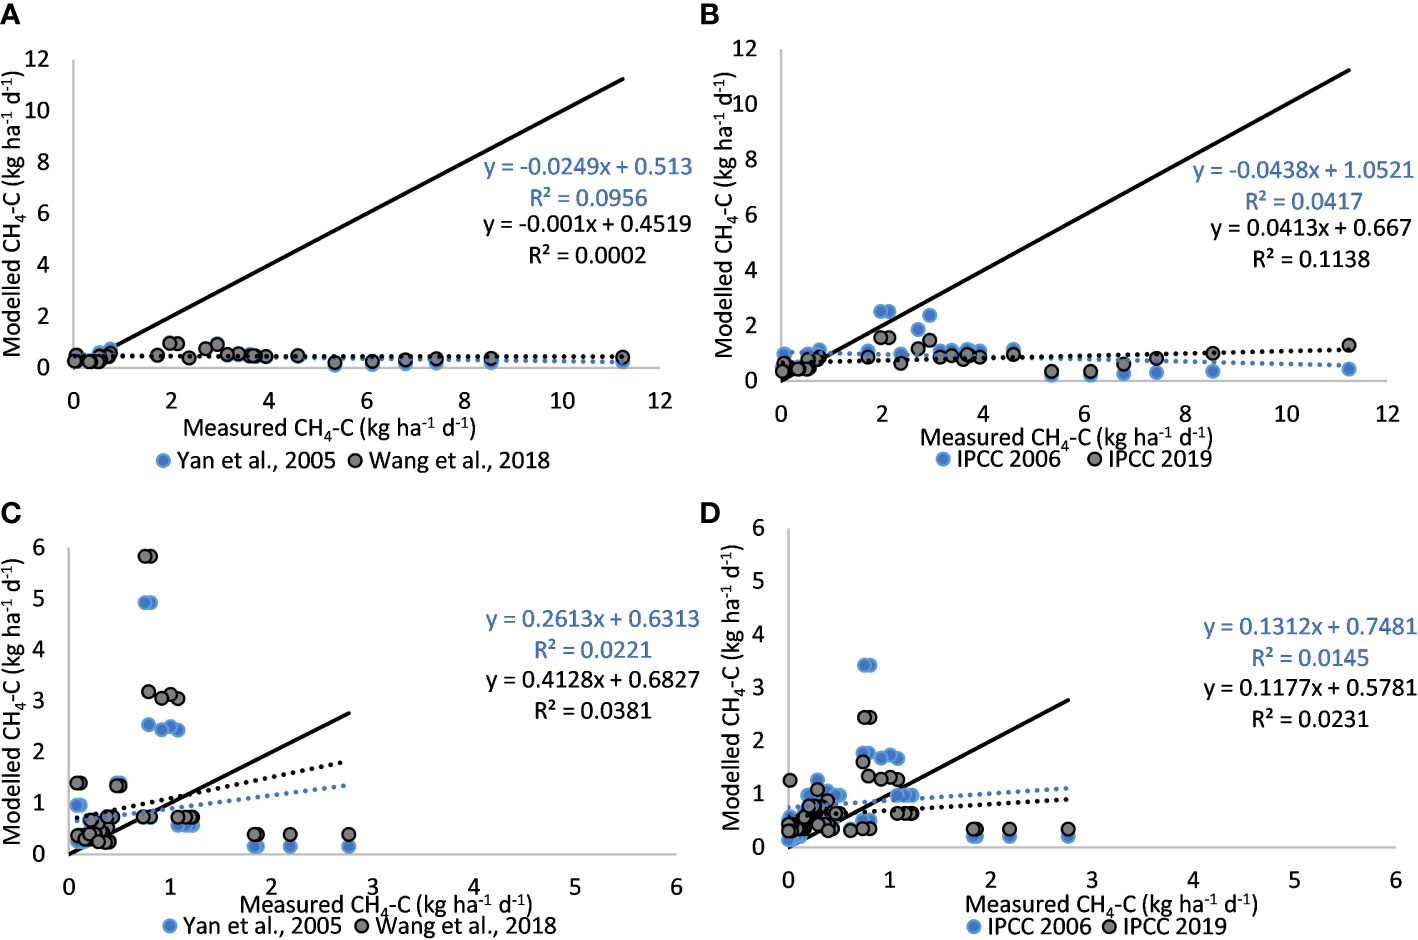
Figure 5 Modelled and observed CH4 emission for Bangladesh (A, B) and India (C, D) with Yan and Wang tier 3 models in a and c and IPCC tier 1 models in b and d (solid line indicates 1:1). Sample size n = 35 for Bangladesh and India, n = 82 for tier 1 models and 68 for tier 3 models.
Tropical and temperate regions in East Asia
East Asia consists of both temperate and tropical rice regions; however, regional EFs have been estimated for all countries across the variability in management and climatic conditions. At the regional scale, the models significantly underestimate emissions for the higher measured emissions and overestimate some of the lower measured emissions, but perform well overall at the lower emission range (Figure 6). If China is separated from Japan and South Korea (S2), a similar trend for the higher emissions can be seen; however, when looking at the countries individually, model performance shows more outliers at the lower emission range for China and South Korea compared to Japan and thus in some instance also overestimate the lower emissions for East Asian countries. Measured emission shows a significant association with modelled value for all models for China (n = 371, p< 0.001) and Japan (n = 29, p< 0.001), while for South Korea, only the IPCC models have a significant association (n = 54, p< 0.001) (S3). The models do capture the trend for Japan and China, with R correlation varying from 0.15 to 0.76; however, for South Korea, the older Yan model does not capture the trend with a negative R correlation of −0.11 and, as such, the newer models work best for South Korea. The RMSE of the models ranges from 61.43% to 148% and relative error is between −4.59 and 58.51 across the countries and models, respectively (S3).
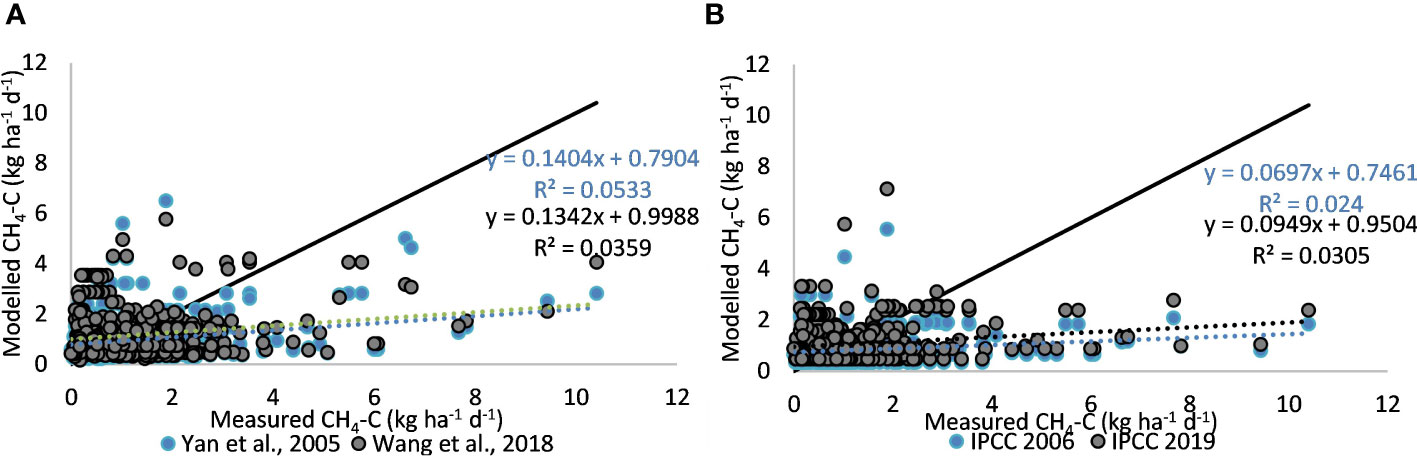
Figure 6 Modelled and observed CH4 emission for East Asia: (A) Yan and Wang tier 3 models, (B) IPCC tier 1 models (solid line indicates 1:1). Sample number = 459 for tier 1 and 455 for tier 3 methods.
Tropical countries of South America and Africa
Model performance for tropical regions in Africa and South America also shows underestimation of emissions (Figure 7) with the tier 1 models performing less well than the tier 3 models for emission values above 2 kg CH4-C ha−1 day−1; however, both the Yan and Wang model overestimate the lower measured emissions. African data have not been included before as there are limited publications on rice paddies in Africa. Here, the two IPCC models and Wang’s model capture the lower emissions well, while Yan’s model overestimates them. The higher emissions are also underestimated here and, as such, the most recent models perform best for Africa. Further statistical analysis shows a non-significant association between the measured and estimated emissions for both Africa and South America with R correlation coefficients of 0.32–0.37 for Brazil (n = 11, p > 0.001) and −0.47–0.49 (n = 5, p > 0.001) for Ghana across all models. RMSE ranges from 47.92% to 74.67% for Brazil and 75.16% to 103.41% for Ghana with mean differences and relative error being low for both regions (S3).
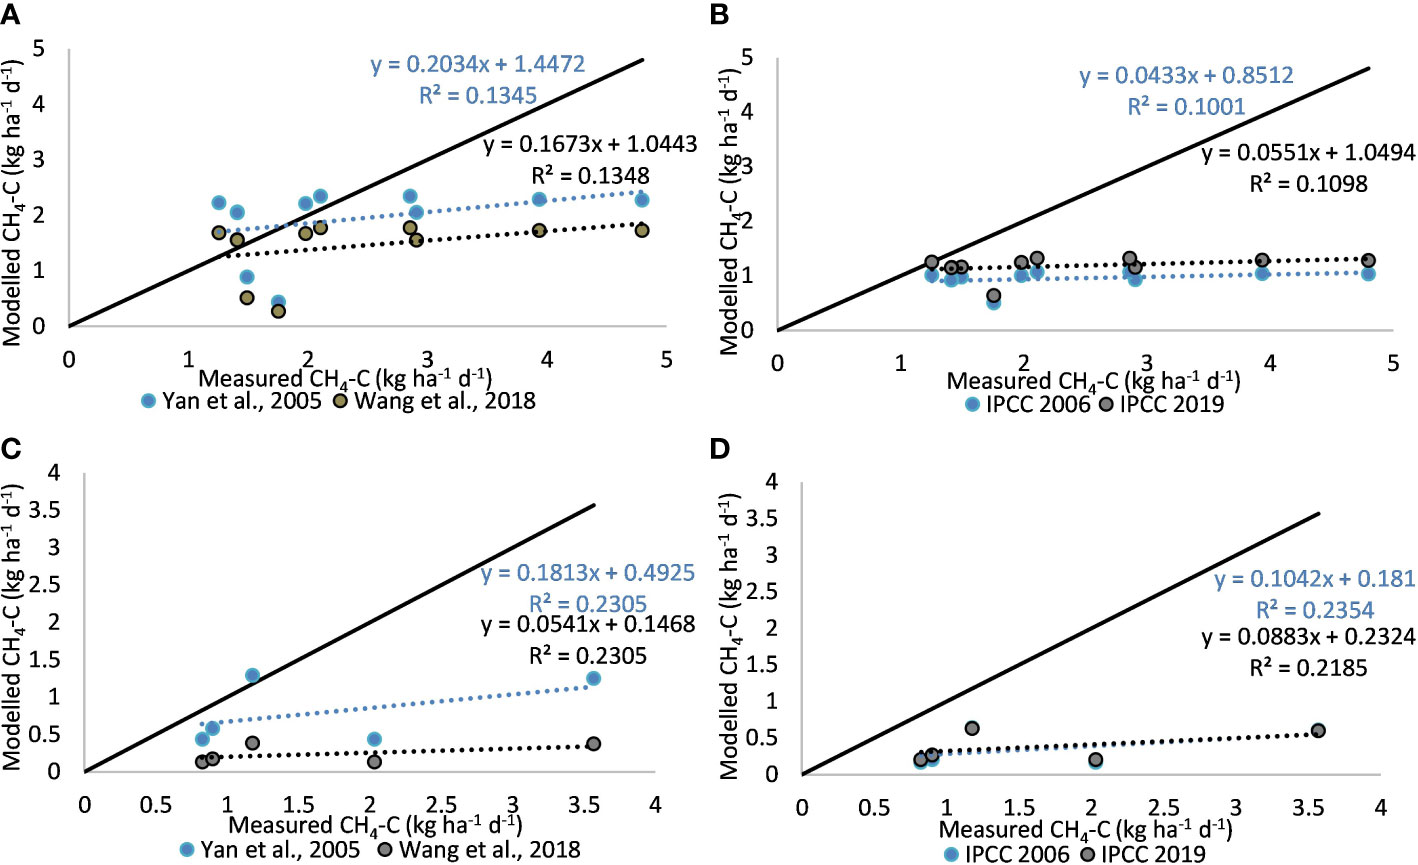
Figure 7 Modelled and observed CH4 emission for the tropical regions outside of Asia. Brazil (A, B) and Ghana (C, D) with Yan and Wang tier 3 models in (A–C) and IPCC tier 1 models in (B–D) (solid line indicates 1:1). Sample number = 5 for Ghana and 11 for Brazil.
Temperate regions of Europe and North America
For the temperate regions of USA and the Mediterranean countries of Europe, the models behave slightly differently (Figure 8). For the USA, there are some outliers in the data for the higher measured emissions and for Yan’s model. The models perform very similarly overall but underestimate most measured emissions over 1 kg CH4-C ha−1 day−1; the R correlation coefficient range between 0.39 and 0.40 for the IPCC, 2006 and IPCC, 2019 models and between 0.20 and 0.21 for the Yan and Wang models with RMSE, mean difference, and relative error being the lowest for the Yan model and the highest for the IPCC, 2006 model (S3). For European rice paddies, results show that the models perform quite differently than for the other rice regions by overestimating the emission values. The two IPCC models also overestimate lower emissions by estimating similar values for most plots. When looking at the two European countries separately, however (S2), we can see that all models beside Wang slightly underestimate emissions for Portugal, while for Spain, the tier 3 models significantly overestimate emissions. However, sample numbers are low with little variation in management and environmental conditions and, as such, the R correlation coefficient could only be calculated for Spain at 0.72 for Yan, Wang, and IPCC, 2006 and 0.75 for IPCC, 2019, while RMSE, mean difference, and relative error were low for Portugal; they were more variable for Spain with an RMSE range from 115.84% to 1220.40%, a mean difference between 0.04 for the Wang model and 0.31 for IPCC, 2006, and relative error ranging from −186.84 for IPCC, 2019 to 19.34 for IPCC, 2006 (S3).
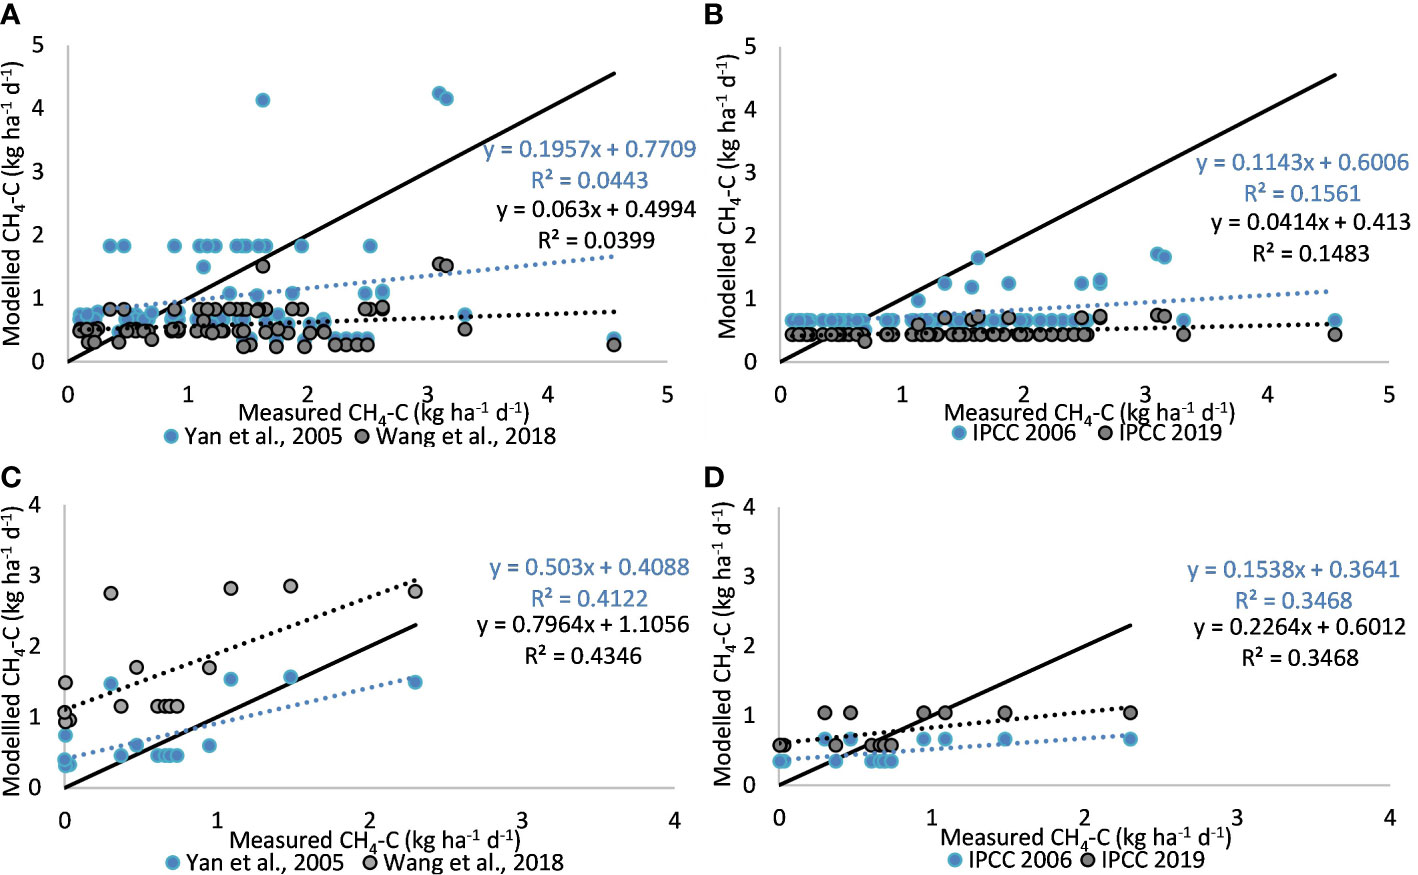
Figure 8 Modelled and observed emissions for the temperate regions of USA (A, B) and Europe (C, D) with Yan and Wang tier 3 models in (A, C) and IPCC tier 1 models in (B, D) (solid line indicates 1:1). Sample number = 16 for Europe and 69 for USA.
Discussion
Model comparison and performance
This study compared simulated CH4 emissions from four empirical models and evaluated their individual performance against measured data collated from independent peer-reviewed publications. Two of the models represent tier 1 methods, while the other two are tier 3 methods. Evaluation was done for CH4 emission data from all rice-growing regions of the world except Oceania. Although it is challenging to accurately predict emissions from rice paddies due to the complex relationships and the many drivers that affect emissions, the four empirical models captured the trend, producing similar spatial patterns at the regional scale. However, the models struggle to simulate emissions above 3 kg CH4-C ha−1 day−1 and, as such, fail to capture the higher measured emissions, indicating that the models lack some sensitivity to predict the magnitude of emissions at both the country and regional scale with the more recent models of Wang and IPCC, 2019 only showing minor improvements compared to the older Yan and IPCC, 2006 models.
Model inputs (management and environmental factors)
Management and environmental conditions are known to have a significant impact on emissions and will differ between the regions and climatic zones with CH4 emission from rice being strongly linked to organic amendments, water regime, rice ecology, and soil conditions (Yan et al., 2009; Wang et al., 2018). Studying model outliers in more detail shows the sensitivity of the applied methodologies to management practices. For instance, the highest observed emission for Bangladesh was related to studies that contained organic amendment application —with the highest recorded emission of 11.24 kg CH4-C ha−1 day−1 having an application rate of 50 t/ha compost (Hossen et al., 2015), while for China, the outliers were related to either low measured emissions for plots with high application rate of manure (Yang and Chang, 2001) or high observed emissions where no organic amendment was used (Li et al., 2013), causing the models to under- or overestimate emissions. Similar to China, the four highest measured emissions for India (Datta and Adhya, 2014) had no organic amendment application, being significantly higher than the mean average of India at 1.66 compared to 0.28 kg CH4-C ha−1 day−1 (when Datta and Adhya, 2014 is excluded) and as such were underestimated by the models, while the other outliers were caused by the model overestimating emissions due to low measured emissions from plots with organic amendment application (Oo et al., 2018). Organic amendment application impact on model performance supports the statistical findings of Yan et al. (2005) and Wang et al. (2018), which showed organic amendments to be the main variable controlling the CH4 emissions.
Three out of 10 publications collected for India contained plots with applied organic amendment; however, Oo et al. (2018) is the only paper out of the three located in agroecological zone 2 and, as such, has a warmer climate where double rice cropping systems during wet and dry season influence the pre-season water conditions, while the other two publications, Bhatia et al. (2005) and Singh et al. (1997), are located in agroecological zones 5 and 6 where fields commonly uses a rice-upland crop rotation with long drainage in pre-season. A similar pattern can be seen for the region of East Asia in which Japan and South Korea are located in temperate climate with long pre-season drainage and single rice crop rotation combined with upland crops while China contains areas of both double rice, rice-upland, and rice-fallow rotation. Like the regions of East Asia, Europe, North America, and South America paddies also have long drained pre-season with rice-fallow or rice-upland crop as well as areas with winter flooded pre-seasons (Adviento-Borbe and Linquist, 2016; Martínez-Eixarch et al., 2021). The variation in rotation cycles, crop duration, and pre-season water management shows the importance of calculating emission factors and evaluating model behavior at the country scale with comparison of the models at the global, regional, and country scale showing that countries within the same regions have different management and also significantly different measured emissions as clearly seen for the South Asian countries of India and Bangladesh with Bangladesh having the second highest measured mean emissions at 2.61 and India the lowest at 0.42 kg CH4-C ha−1 day−1 (Table 1).
Data availability impact on model performance
Another factor to consider is data used for model development and the models might not perform well if data from those regions were not included during the model development, which could be due to data unavailability at the time of data collation. For instance, Vietnam and Bangladesh were for the first time included in the Wang model with model development for Bangladesh being based on five measurement points within one publication, all of which had an organic amendment application of 2 t/ha (Ali et al., 2014), while we were able to collect 35 measurement points from six papers that had an organic application range between 0 and 50 t/ha. We have also significantly increased the amount of data for Vietnam collecting 129 data points from seven papers compared to Wang’s 14 from two studies, while Myanmar, Ghana, and Portugal are three new countries included in our database. Low sample number or lack of data inclusion from a country during model development can influence the model’s ability to estimate emissions accurately, creating limitations on spatial coverage as well as reducing the model performance (Albanito et al., 2017; Wang et al., 2018), while the use of fewer variables, such as in the tier 1 methods, can improve model performance where data available for collection are limited as variables accounting for environmental and geographical differences are left out.
Beside the inclusion of new countries such as Vietnam and Bangladesh in the Wang et al. (2018) model, Wang’s model is, to our knowledge, the first empirical CH4 model for rice ecosystems that considers rice cultivated in temperate regions and, as such, includes data from countries such as USA, Italy, and Spain, as well as the tropical regions of Brazil and Uruguay. However, compared to tropical regions, Asian rice regions’ sample numbers are low. With the Wang model being built on the older Yan et al. (2005) model and relying on the same variables as its predecessor, the model’s performance on predicting CH4 emission from rice regions outside Asia will be highly affected by the high amount of data collected from Asian rice fields with temperate data being underrepresented and based on management common in Asian rice regions. These models will therefore not consider the variability in management and environmental conditions between tropical and temperate regions. As such, we found that in order to complete model evaluation, many assumptions had to be made in order to fit the data from these regions with winter flooding being classified as long drainage and alternate wetting and drying as multiple drainage. Biochar application was also not included as an option of organic amendment application and was therefore classified as straw off season.
Model limitations
Having to adjust management practices to fit into the classes available within the models can lead to the models over- or underestimating emissions; creating outliers while limiting classes for each variable can lead to models predicting the same emissions value for all plots when publications record the same environmental and management conditions across all plots such as for Portugal in which the models estimated the same emissions across all the points, slightly underestimating the data for all except Wang’s model (Pereira et al., 2013). This can be seen particularly well for Thailand in which the outliers are caused by high predicted emissions compared to low measured emission from a paper that experiment ed on biochar (Thammasom et al., 2016). Classifying biochar as straw off season may cause an overestimation of emissions from the tier 3 models with the Thammasom et al. (2016) study showing that incorporation of biochar emitted less CH4 compared to straw applied off season, which relates to the amendments having different decomposition rates indicating that biochar should be considered a separate class of organic amendment in future model developments. Similarly, for winter flooding, both tier 3 models overestimate emissions from Spain (Fangueiro et al., 2016). This is further supported by the model evaluation for American paddies with outliers being related to Californian rice fields that are winter flooded. Californian rice production differs from the rest of America by having different soil and management conditions and, as such, winter flooding, while the other regions of Texas, Arkansas, and Louisiana have long drained pre-seasons. To reflect this variability and improve model performance, it would be beneficial to add winter flooding as a separate pre-season class in the future.
Inclusion of additional parameters might improve model performance by not only further distinguishing particularly temperate regions from tropical regions but also distinguishing the temperate regions in Asia from those in Europe and North America. Planting method could, for instance, be a useful parameter to include with Asian rice paddies mainly being transplanted while European and American fields are commonly direct dry or wet seeded. Dry seeding has been shown to decrease overall emissions (Pathak et al., 2013) and, as such, planting method would be a useful variable to include to predict emissions more accurately for non-Asian temperate regions. Discrepancies in model performance could also relate to other environmental conditions such as pH or soil texture with studies having shown that sandier soils emit more CH4 than clayey soils (Baldock and Skjemstad, 2000) and thus the high emission from the Indian study (Datta and Adhya, 2014), in which soils contain 52.50% sand, may be related to the combination of management and soil conditions. Inclusion of soil texture as a parameter could potentially reduce the under estimation for these data points and others. Both tier 3 models include pH as a continuous variable, but grouped in classes of 0.5, and as such, each plots’ pH value had to be grouped. Particularly for European paddies, this caused the Yan model to overestimate emissions when fields were continuously flooded with pH between 5 and 5.5, but Wang’s updated pH factors significantly improved estimates, making the Wang model perform better for these regions. The performance of non-Asian rice regions could further be improved by updating to a global climate classification system, with the existing system using Asian agroecological zones causing the newer Wang model to overestimate emissions for both Spain and Portugal while the Yan model underestimated emissions. Excluding the agroecological zones from Wang’s calculation drastically decreased emissions for these countries, leading to Wang’s model having lower estimated emissions than Yan for Spain. This shows the complexity in estimation of CH4 emission from rice and how climate is linked to management practices and that the variability in these affects the model’s ability to accurately predict emissions.
Summary
Evaluation of model performance shows that the models lack sensitivity to certain key variables, making it challenging to accurately predict GHG emissions and to validate the current models for rice grown particularly in temperate rice regions, for which management and environmental conditions differ from tropical regions. Inclusion of key variables such as planting method, soil texture, and crop rotation as well as additional pre-season and on-season water management practices like winter flooding and alternate wetting and drying would be beneficial for more accurate CH4 emission estimation. In addition, our findings show that grouping countries into regions can have a significant impact on emission factor estimates if using IPCC methodology for national inventory reports with mean measured emissions at the country scale significantly differing between countries. Prediction of country-scale emission factors, which are currently calculated using short drainage in pre-season, continuous flooding during crop growth, and no organic amendment could also benefit from further update to better reflect the difference in environmental conditions and management practices between temperate and tropical regions accounting for particularly long drainage in pre-season. Drought, heat, flooding, and diseases related to climate change are the major concerns for rice growers now and in the future, as more producers are shifting from conventional to climate smart practices involving reduction in water usage, use of improved form of organic fertilizer, biochar, etc. Net zero emissions are on the agenda and, as such, having accurate tools that can aid in reducing these emissions is becoming even more important. It is therefore crucial to create tools for the future that allow users to include these climate smart technologies while considering the global variation in management and climate.
Data availability statement
The original contributions presented in the study are included in the article/Supplementary Material. Further inquiries can be directed to the corresponding author.
Author contributions
MN co-designed the research, collected the dataset, and drafted the manuscript. MN with advice from DN performed the statistical analysis. JH, PS, and DN advised on the study design, reviewed drafts, and approved the final manuscript.
Funding
This work was funded by Climate Change, Agriculture and Food Security (CCAFS), Kellogg’s, the Cool Farm Alliance (CFA), and the University of Aberdeen.
Acknowledgments
We are grateful for our funders and for those authors whose publications on greenhouse gas emissions from rice paddies have made this work possible. Special thanks to the experts and stakeholders who have guided us in the right direction when needed given the COVID pandemic restrictions, making project engagement between those involved limited to online engagement.
Conflict of interest
The authors declare that the research was conducted in the absence of any commercial or financial relationships that could be construed as a potential conflict of interest.
The authors declare that this study received funding from Kellogg. The funder was not involved in the study design, collection, analysis, interpretation of data, the writing of this article, or the decision to submit it for publication.
Publisher’s note
All claims expressed in this article are solely those of the authors and do not necessarily represent those of their affiliated organizations, or those of the publisher, the editors and the reviewers. Any product that may be evaluated in this article, or claim that may be made by its manufacturer, is not guaranteed or endorsed by the publisher.
Supplementary material
The Supplementary Material for this article can be found online at: https://www.frontiersin.org/articles/10.3389/fagro.2022.1058649/full#supplementary-material
References
Adviento-Borbe M. A., Linquist B. (2016). Assessing fertilizer n placement on CH4 and N2O emissions in irrgated rice systems. Geoderma 266, 46–45. doi: 10.1016/j.geoderma.2015.11.034
Albanito F., Lebender U., Cornulier T., Sapkota T. B., Brentrup F., Stirling C., et al. (2017). Direct nitrous oxide emissions from tropical and Sub-tropical agricultural systems – a review and modelling of emission factors. Sci. Rep. 7, 44235. doi: 10.1038/srep44235
Ali M. A., Sattar M. A., Islam M. N., Inubushi K. (2014). Integrated effects of organic, inorganic and biological amendments on methane emission, soil quality and rice productivity in irrigated paddy ecosystem of Bangladesh: field study of two consecutive rice growing seasons. Plant Soil 378, 239–252. doi: 10.1007/s11104-014-2023-y
Baldock J. A., Skjemstad J. O. (2000). Role of the soil matrix and minerals in protecting natural organic materials against biological attack. Organic Geochem 31, 697–710. doi: 10.1016/S0146-6380(00)00049-8
Bhatia A., Pathak H., Jain N., Singh P. K., Singh A. K. (2005). Global warming potenital of manure amended soils under rice-wheat system in the Indo-Gangetic plains. Atmospheric Environ. 39, 6976–6984. doi: 10.1016/j.atmosenv.2005.07.052
Clift R., Keller E., King H., Lee J., Mila-i-Canals L. (2014). “Challenges of scale and specificity in greenhouse gas calculators,” in Proceedings of the 9th International Conference on Life Cycle Assessment in the Agri-Food Sector (LCA Food 2014). (Vashon, USA: American Centre for Life Cycl Assessment), 241–247.
Datta A., Adhya T. K. (2014). Effects of organic nitrification inhibitors on methane and nitrous oxide emission from tropical rice paddy. Atmopsheric Environ. 92, 533–545. doi: 10.1016/j.atmosenv.2014.04.009
Fangueiro D., Becerra D., Álbarrán A., Sanchez-Llerema. J., Rato-Nunes J., López-Piñeiro A. (2016). Effect of tillage and water management on GHG emissions from Mediterranean rice growing ecosystems. Atmopheric Environ. 150, 303–312. doi: 10.1016/j.atmosenv.2016.11.020
FAO [Food and Agricultural Organization of the United Nations] (2019) FAOSTAT. Available at: http://www.fao.org/faostat/en/#data/GR/visualize (Accessed 13/07/2022).
Hillier J., Walter C., Malin D., Garcia-Suarez T., Mila-i-Canals L., Smith P. (2011). A farm-focused calculator for emissions from crop and livestock production. Environ. Model. Software Elsevier 26, 1070–1078. doi: 10.1016/j.envsoft.2011.03.014
Hossen S., Islam N., Alam R., Baten A. (2015). Effects of different rates of compost application on methane emission and crop yield in Aman rice. J. Agric. Natural Resour. Sci. 2, 530–536.
IPCC. (2006). IPCC 2006 revised God parcice guidelines for greenhouse gas inventories. Intergovernmental panel on climae change (IPCC) (Tokyo, Japan: Institute for global Environmental Strategies). Available at: http://www.ipcc-nggip.iges.or.jp/public/2006gl/vol4.html (Accessed 11 April 2022).
IPCC. (2019). IPCC 2019 refinement to the 2006 IPCC guidelines for national greenhouse gas inventories. Intergovernmental panel on climae change (IPCC) (Tokyo, Japan: Institute for global Environmental Strategies). Available at: https://www.ipcc-nggip.iges.or.jp/public/2019rf/index.html (Accessed 11 April 2022).
IRRI. (2002). Rice almanac: Source book for the most important economic activity on earth. 3rd ed. Eds. Maclean J. L., Dawe D. C., Hardy B., Hettel G. P. (Wallingford, UK: CABI Publishing).
Khush G. (2005). What it will take to feed 50 billion rice consumers in 2030. Plant Mol. Biol. 59, 1–6. doi: 10.1007/s11103-005-2159-5
Li C., Zhang Z., Guo L., Cai M., Cao C. (2013). Emissions of CH4 and CO2 from double rice cropping systems under varying tillage and seeding methods. Atmospheric Environ. 80, 438–444. doi: 10.1016/j.atmosenv.2013.08.027
Lokupitiya E., Paustian K. (2006). Agricultural soil greenhouse gas emissions: a review of national inventory method. J. Environ. Qual. 35, 1413–1427. doi: 10.2134/jeq2005.0157
Martı́nez-Eixarch M., Alcaraz C., Viñas M., Noguerol J., Aranda X., Prenafeta-Boldú F.-X., et al. (2021). The main drivers of methane emissions differ in the growing and flooded fallow seasons in Mediterranean rice fields. Plant Soil 460, 211–227. doi: 10.1007/s11104-020-04809-5
Mosleh M. K., Hassan Q. K., Chowdhury E. H. (2015). Application of remote sensors in mapping rice area and forecasting its production: A review. Sensors 15, 769–791. doi: 10.3390/s150100769
Oo A. Z., Sudo S., Inubushi K., Mano M., Yamamoto A., Ono K., et al. (2018). Methane and nitrous oxide emissions from conventional and modified rice cultivation systems in South India. Agriculture Ecosyst. Environ. 252, 148–158. doi: 10.1016/j.agee.2017.10.014
OECD/FAO (2011). OECD-FAO Agricultural Outlook 2011 (Paris: OECD Publishing). Available at: https://doi.org/10.1787/agr_outlook-2011-en.
Pathak H., Sankhyan S., Dubey D. S., Bhatia A., Jain N. (2013). Dry direct-seeding of rice for mitigating greenhouse gas emission: field experimentation and simulation. Paddy Water Environ. 11, 593–601. doi: 10.1007/s10333-012-0352-0
Pereira J., Figueiredo N., Goufo P., Carneiro J., Morais R., Carranca C., et al. (2013). Effects of elevated temperature and atmospheric carbon dioxide concentration on the emissions of methane and nitrous oxide from Portuguese flooded rice fields. Atmospheric Environ. 80, 464–471. doi: 10.1016/j.atmosenv.2013.08.045
Rohatgi A. (2021) WebPlotDigitizer version 4.5. Available at: https://automeris.io/WebPlotDigitizer/ (Accessed 11 April 2022).
Seck P., Diagne A., Mohanty S., Wopereis M. (2012). Crops that feed the world 7: Rice. Food Secur. 4, 7–24. doi: 10.1007/s12571-012-0168-1
Singh J. S., Raghubanshi A. S., Reddy V. S., Singh S., Kashyap A. K. (1997). Methane flux from irrigated paddy and dryland rice fields, and from seasonally dry tropical forest and savanna soils of India. Soil Biol. Biochem. 30, 135–139. doi: 10.1016/S0038-0717(97)00112-0
Smith P., Reay D., Smith J. U. (2021). Agricultural methane emissions and the potential for mitigation. Philos. Trans. R. Society A 379, 20200451. doi: 10.1098/rsta.2020.0451
Thammasom N., Vityakon P., Lawongsa P., Saenjan P. (2016). Biochar and rice straw have different effects on soil productivity, greenhouse gas emission and carbon sequestration in Northeast Thailand paddy soil. Agric. Natural Resour. 50, 192–198. doi: 10.1016/j.anres.2016.01.003
Tirol-Padre A., Minamikawa K., Tokida T., Wassmann R., Yagi K. (2017). Site-specific feasibility of alternate wetting and drying as a greenhouse gas mitigation option in irrigated rice fields in southeast Asia: a synthesis. Soil Sci. Plant Nutr. 64, 2–13. doi: 10.1080/00380768.2017.1409602
Wang J., Akiyama H., Yagi K., Yan X. (2018). Controlling variables and emission factors of methane from global rice fields. Atmospheric Chem. Phys. 18, 10419–10431. doi: 10.5194/acp-18-10419-2018
Wang C., Lai D. Y.F., Sardans J., Wang W., Zeng C., Peñuelas J. (2017). Factors related with CH4 and N2O emissions from a paddy field: Clues for management implications. PloS One 12, 1–23. doi: 10.1371/journal.pone.0169254
Yan X., Akiyama H., Yagi K., Akimoto H. (2009). Global estimations of the inventory and mitigation potential of methane emissions from rice cultivation conducted using the 2006 intergovernmental panel on climate change guidelines. Global Biogeochem Cycles 23. doi: 10.1029/2008GB003299
Yang S., Chang H. (2001). Effect of green manure amendment and flooding on methane emission from paddy fields. Chemosphere – Global Change Sci. 3, 41–49. doi: 10.1016/S1465-9972(00)00032-5
Keywords: rice, methane, greenhouse gas emission, IPCC (intergovernmental panel on climate change), modelling
Citation: Nikolaisen M, Hillier J, Smith P and Nayak D (2023) Modelling CH4 emission from rice ecosystem: A comparison between existing empirical models. Front. Agron. 4:1058649. doi: 10.3389/fagro.2022.1058649
Received: 30 September 2022; Accepted: 30 November 2022;
Published: 10 January 2023.
Edited by:
Margarita Ruiz-Ramos, Polytechnic University of Madrid, SpainReviewed by:
Avijit Ghosh, Indian Grassland and Fodder Research Institute (ICAR), IndiaJinyang Wang, Nanjing Agricultural University, China
Copyright © 2023 Nikolaisen, Hillier, Smith and Nayak. This is an open-access article distributed under the terms of the Creative Commons Attribution License (CC BY). The use, distribution or reproduction in other forums is permitted, provided the original author(s) and the copyright owner(s) are credited and that the original publication in this journal is cited, in accordance with accepted academic practice. No use, distribution or reproduction is permitted which does not comply with these terms.
*Correspondence: Marte Nikolaisen, cjAybW4xOEBhYmRuLmFjLnVr