 Vijesh V. Krishna1*
 Alwin Keil2
 Meha Jain3Weiqi Zhou3
 Monish Jose1
 Subash Surendran-Padmaja1,4,5
 Luis Barba-Escoto6 Balwinder-Singh7
 M. L. Jat7
 Olaf Erenstein8
- 1International Maize and Wheat Improvement Center (CIMMYT), Hyderabad, India
- 2Unique Land Use GmbH, Freiburg, Germany
- 3School for Environment and Sustainability, University of Michigan, Ann Arbor, MI, United States
- 4Center for Development Research (ZEF), University of Bonn, Bonn, Germany
- 5Indian Council of Agricultural Research (ICAR)-National Institute of Agricultural Economics and Policy Research, New Delhi, India
- 6Conservation Ecology Group, Groningen Institute for Evolutionary Life Sciences, University of Groningen, Groningen, Netherlands
- 7International Maize and Wheat Improvement Center (CIMMYT), Kathmandu, Nepal
- 8International Maize and Wheat Improvement Center (CIMMYT), Texcoco, Mexico
Rice and wheat production in the intensive, irrigated farming systems of the Indo-Gangetic Plains (IGP) is associated with significant negative environmental and health externalities. Conservation Agriculture (CA) has the potential to curb some of these externalities while enhancing farm income. However, farmer adoption of CA remains modest in the Indian IGP. The present study focuses on the constraints to adopting the major CA component, zero tillage (ZT). We examine whether ZT wheat is feasible for smallholders and the potential of technology targeting to realize faster and wider diffusion. Econometric models and machine learning algorithms were used to analyze remote sensing data and farm household data collected from the Indian states of Punjab and Bihar, two contrasting agrarian economies of the IGP. While farmer adoption was low among smallholders (owning <2 ha of land), the on-farm effects of ZT on variable cost reduction and yield and profit enhancement for smallholders are comparable to large farmers. We estimate the economic potential of technology targeting using an equilibrium displacement model. In the relatively developed state of Punjab, technology targeting based on landholding size does not appear to add substantive economic benefits. In Bihar, a less prosperous state with a dominance of smallholders in the population, technology targeting could markedly enhance economic surplus and reduce rural poverty.
Introduction
The Green Revolution increased the productivity of rice-wheat systems of the Indo-Gangetic Plains (IGP) of South Asia and helped the countries attain self-sufficiency in food grain production. However, the intensified crop management practices have led to a depletion of the natural resource base (Gupta and Seth, 2007; Benbi, 2018). Furthermore, the limited turn-around time between rice harvest and sowing of the next crop (wheat) and mechanized rice harvesting pose a critical challenge for farmers to sustainably handle the surplus rice residues, especially in the Northwestern IGP (Lohan et al., 2018; Sarkar et al., 2018). Because only a few economically viable residue-management alternatives are readily available, a majority of the 2.5 million rice farmers burn an estimated 23 million metric tons of rice stubble before sowing wheat (NAAS, 2017). The residue burning and resultant air pollution have received significant media and research attention in the recent past (Shyamsundar et al., 2019; Keil et al., 2021). Residue burning causes the emission of short-lived climate pollutants, including methane and black carbon (Sarkar et al., 2018). The air quality deterioration due to stubble burning has a significant adverse effect on human pulmonary functions (Agarwal et al., 2012; Balwinder-Singh et al., 2020). Residue burning also reduces the farming-system productivity in the long run by reducing soil microbial activity and depleting soil organic carbon (Thakur et al., 2021).
One promising approach to curb rice residue burning and enhance the profitability and sustainability of the farming system is the promotion of Conservation Agriculture (CA). Defined as an eco-friendly farming practice that combines minimum soil disturbance, soil cover maintenance, and crop species diversification (FAO, 2016), CA contributes to enhancing water and nutrient use efficiency and sustaining system productivity (Jat et al., 2020; Kumara et al., 2020). Several on-farm trials and farm surveys have noted the existence of private benefits of CA. Wheat sown into rice residues results in yields equal to or higher than conventional tillage at a lower cost, without burning the residue (Krishna and Veettil, 2014; Keil et al., 2020, 2021). Due to the private benefits, the mitigation cost of reducing Greenhouse Gas (GHG) emissions could be negative with CA adoption (Sapkota et al., 2015, 2019), presenting a unique win-win situation. Against the documented superiority of the technology in both the public and private spheres, it remains surprising that diffusion of CA remained relatively modest in South Asian rice-wheat systems (Bhargava et al., 2017).
The socio-economic evaluations of CA/ZT technologies are relevant in the South Asian context due to three factors. First, the partial and intermittent adoption of CA components is common in South Asia. Farmers often adopt one or two of the three complementary CA management practices, viz. direct seeding with minimum mechanical disturbance of soil (ZT), maintenance of soil cover (often with residues of previous crops), and crop rotation or diversification (e.g., cereal-legume rotation). Intermittent adoption is also common (e.g., no-tillage wheat in winter, followed by puddled rice in monsoon) (Krishna and Veettil, 2014). Second, despite the proven private and public benefits, ZT wheat diffusion remains relatively slow in South Asia (Bhargava et al., 2017; Kumara et al., 2019, 2020). Estimates show that more than 80% of the global CA area is in just five countries—the United States, Brazil, Argentina, Canada, and Australia—while the area share of the developing world has remained low (Kassam et al., 2014). No study has systematically reviewed the reasons for the modest farmer adoption of the CA technologies in South Asia. Third, the CA/ZT technologies gradually evolve in India, necessitating a constant evaluation of the technology performance in the farmers' field. The Second-Generation Direct Seeders (SGDS), such as the Happy Seeder, alongside a superior straw management system, were recently developed to rectify the limitations of the conventional (first-generation) ZT seed drill and facilitate wheat sowing even under heavy stubble conditions. Farmer adoption of SGDS could completely avoid the need for rice residue burning, making the farming system more profitable and sustainable by reducing the per-unit cost of production and curtailing the negative environmental externalities (Sidhu et al., 2015; Keil et al., 2021).
The present study examines the diffusion process of CA, and particularly the ZT component, in Indian wheat and explores the potential for targeted dissemination of the technology. The early studies on ZT adoption in India date back to the mid-2000s, the scope of which was limited by small sample sizes and narrowly defined geographies and farming systems. Most of the initial data available were from the districts of Haryana, where the diffusion of the ZT wheat technology was initiated. In 2003–04, ZT wheat technology was estimated to be used by one-third of wheat-growing households and one-quarter of wheat area in Haryana's basmati-wheat systems (Erenstein, 2010). A subsequent village survey with more representative regional sampling across Haryana and Indian Punjab estimated an average ZT adoption rate as 10% of the wheat area (Erenstein, 2011). Another earlier review highlighted the regional disparity in ZT adoption in India: higher adoption in the Northwestern IGP states of Haryana and Punjab and low adoption in the Eastern states of Bihar and Uttar Pradesh (Erenstein and Laxmi, 2008). A study around intervention clusters reported ZT wheat adoption of 25% in the Northwestern IGP and only 2% in the Eastern IGP (Singh et al., 2012). A more recent, large household survey also found adoption concentrated in the Northwestern IGP with about 10% of sample farmers adopting ZT partially or fully, as compared to 1% in the Western and Central districts of Uttar Pradesh and 0.3% in the Eastern districts of Uttar Pradesh and Bihar (Bhargava et al., 2017). In sum, the adoption estimates reported in the literature vary widely, influenced by focus area, survey methods, and time of the study. However, they all highlight geographic heterogeneity and relative stagnation of overall ZT adoption across the rice-wheat systems of the IGP.
The present study is conducted in two Indian States—Punjab and Bihar—that embody the vast heterogeneities present in the IGP. We found that the Punjab farmers have a larger landholding size and better access to input and output markets than their Bihar counterparts. The mechanization rate is high, awareness and adoption of CA practices better, and income poverty low in Punjab. Our analysis is guided by the conventional wisdom that the small parcel size impedes the diffusion of sustainable intensification technologies, including the CA practices (Jones-Garcia and Krishna, 2021). Marginal and small farmers often lag in the technology diffusion process due to several factors, such as lack of information, credit constraints, and risk aversion, among others. Taking the diffusion process of ZT wheat in focus, the study attempts to answer the following questions: (1) How important is landholding size in determining ZT adoption? (2) Is ZT a feasible technology option for smallholders? (3) Should the R&D institutions invest in technology targeting? We use data from household surveys and satellite imagery to answer these questions, to better understand the structural barriers to the diffusion of CA and other resource-conserving farming technologies in South Asia.
Methods
Using farm household survey and remote sensing datasets from the IGP and employing econometric models and machine learning algorithms, the relationship between different socio-economic characteristics of farm-households and ZT adoption is estimated. Furthermore, the potential effect of technology targeting based on landholding size—the single most important predictor of ZT adoption in the IGP as per the literature—is calculated with the help of equilibrium displacement models and shifts in the cumulative consumption functions derived from the secondary datasets. A concise summary of the data sources and analysis is provided in Table 1.
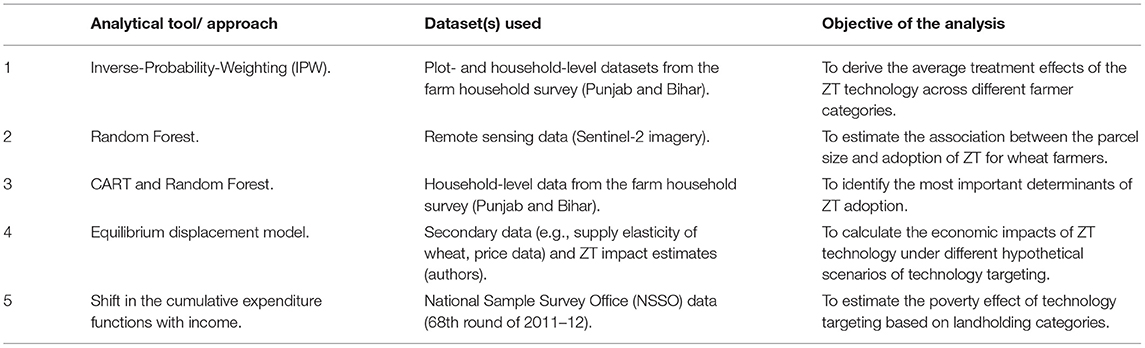
Table 1. Analytical overview.
Study Area
The primary data were obtained from wheat farmers of the Bihar and Punjab states of India. Bhargava et al. (2017) show significant differences between these two states concerning literacy rate, per capita income, land area under irrigation, cultivated land under the rice-wheat system, etc. Punjab is more developed and has more productive and commercial farming systems than Bihar. A farming household of Punjab operates at 1.95 ha, whereas a Bihar household at only 0.50 ha on average. The regional heterogeneities within the IGP are detailed by Erenstein and Thorpe (2011).
There is a marked yield gap (achievable yield under ideal management practices minus actual yield in farmers' fields) to bridge in Bihar (>40%). On the other hand, the yield gap is absent or small (<10%) in most districts of Punjab. Figure 1 provides an overview of the study area and the district-wise yield gaps, which is important for designing and disseminating resource-conserving technologies. Jose and Krishna (2021) observed a high spatial heterogeneity concerning land productivity and the cost of wheat cultivation between Northwestern states and Northeastern states of the IGP. Farmers in the Northwestern states (e.g., Punjab) heavily invest in wheat to gain higher yields. In other words, both productivity and cost of cultivation, especially the fixed costs, were high in Punjab wheat production. Net returns from wheat cultivation were also higher in Punjab (about Rs. 30,000 per ha or US$ 442 as in 2016/17) than in Bihar (about Rs. 15,000 per ha). There are also significant differences in the CA diffusion pattern. Bhargava et al. (2017) showed that 81% of farmers of Punjab were aware of CA, with 16% adoption. In Bihar, with only 3% of farmers aware of the technology, the CA adoption rate was near-zero.
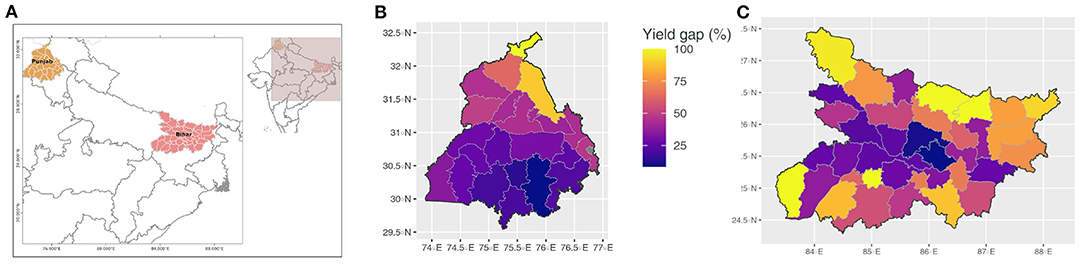
Figure 1. Location and wheat yield gap in the study areas. (A) Study area location; (B) Wheat yield gap in Punjab; (C) Wheat yield gap in Bihar. Data sources: Agro-climatically attainable yields, developed by the International Institute for Applied Systems Analysis (IIASA) and the Food and Agriculture Organization of the United Nations (FAO) using the Agro-Ecological Zones (AEZ) methodology, were obtained from http://www.gaez.iiasa.ac.at/. In this figure, the baseline results of climate and agro-climatic analysis (based on mean climatic data for the period 1961–1990 and data from individual historical years of 1901 to 2009) from the Global Agro-Ecological Zoning (GAEZ) models were used in this process to generate data. The GAEZ models are updated frequently, and the present study used the latest available version of the model. Individual district-wise mean values for all management regimes were obtained from respective potential yield images, using zonal statistics in QGIS. The other data sources include area and production statistics, Ministry of Agriculture and Farmers Welfare, Government of India, www.aps.dac.gov.in/APY/Public_Report1.aspx, and District maps for India (https://wiki.openstreetmap.org/wiki/Districts_in_India).
Household Surveys
In Bihar, the farm-household survey was conducted in six districts (Buxar, Bhojpur Vaishali, Samastipur, Begusarai, and Lakhisarai), where the project “Cereal Systems Initiative for South Asia” (CSISA; www.csisa.org) had been active in scaling out various sustainable intensification practices, including ZT wheat. The data were collected from 40 villages, selected randomly from a list of 87 villages where at least 10 ZT adopters were present, as per the CSISA project documents. A random sample of 1,000 wheat-growing households was developed from a village census. The heads of these households were the respondents in the first round of surveys in 2013. The second round of the survey was conducted among the same households after 3 years, in 2016. The sample attrition was 4%, for which out-migration of farm households was the main reason. The survey questionnaire was meant to elicit information on farming practices, technology adoption, asset status, socio-economic characteristics of the households, and informal information networks. The details of data collection are available in Keil et al. (2015, 2019), and the summary statistics are in Supplementary Material S1(a).
In Punjab, the districts with more than 70% of the net sown area under coarse rice varieties during the Kharif (monsoon) season (July to October) of 2017 were purposively selected. Because the study primarily focused on the residue burning practice, the selected districts were divided into “high residue burning” and “low residue burning” categories. Two districts were purposively chosen in each category such that they were geographically located close to each other: Ludhiana and Sangrur districts in the high residue burning group, and Patiala and Fatehgarh Sahib in the low residue burning category. A list of villages where at least one person had purchased an SGDS machine was populated from the selected districts for sampling study villages. From it, 16 villages were selected per district using a probability proportionate to village size approach. Village census was conducted, and farm households were selected after stratifying the village population based on the technology use. The details of sampling are provided in Keil et al. (2021) and the summary statistics in Supplementary Material S1(b).
Estimating the Farm-Level Effects of CA in Wheat
To explain the differential adoption of the CA practice (ZT wheat) across farmer groups, we estimated the effects of the technology adoption on wheat productivity, cost of production, and profitability. If the impact is heterogenous, it could explain the differences in acceptability of the technology, at least partly. Inverse-Probability-Weighting (IPW) approach was used to derive the average “treatment” effects, in which the inverse of the propensity score was used as weights in calculating the average value of the outcome variable (Wooldridge, 2007). When the predicted probability of adoption of ZT is low, lower weights are provided, and a high predicted probability of adoption receives a higher weight (Rahman et al., 2018). While the IPW potentially controls for most of the observed heterogeneity, there could be several unobserved farm household attributes (e.g., managerial skills of the farmers) that may be correlated with both technology adoption and the outcome variables, making observed adoption endogenous (Kubitza and Krishna, 2020). While the endogeneity bias could be addressed by incorporating instrumental variables in the adoption model, suitable instrumental variables were not readily available for the current analysis. In other words, we could only partly correct the selection bias following the IPW approach.
Satellite Detection of Adoption of CA
To understand the relationship between landholding size and CA adoption, we estimated the correlation between the parcel size and adoption of ZT for wheat farmers with the help of remote sensing data. We used a ZT adoption map generated using Sentinel-2 satellite imagery at a 10 m spatial resolution. We then selected 31 villages from Punjab at random, out of those for which we had field data from previous research. For each selected village, we chose a 1 × 1 km area in the village and digitized all the farm field boundaries within the area. The data were digitized in ArcGIS Pro using visual interpretation of field boundaries as seen in the high-resolution base map. We confirmed that these field boundaries were accurate by overlaying our digitized polygons onto high-resolution imagery in Google Earth Pro. To identify whether each field used ZT or conventional tillage, we overlaid the ZT adoption map on these farm boundaries and assigned each polygon to ZT or conventional tillage based on the majority class within each polygon. We used these data to compare the field size of farms that practice ZT vs. conventional tillage.
Determinants of ZT Adoption by Wheat Farmers
To guide the adoption analysis, a concise review of literature on the determinants of ZT adoption by farmers was conducted, which is provided in Supplementary Material S2. Using the primary data collected through farm-households surveys, we constructed a Classification and Regression Tree (CART) and a Random Forest to capture the most important determinants of adoption, separately for each state. The output variable was farmer adoption of ZT, and the input variables consisted of the socio-economic status of households and soil characteristics. Here, the adoption of ZT technology is defined as the voluntary practice of crop residue retention with no-till during the most recent winter (Rabi) season by wheat-growing households in at least one of the wheat plots they managed. In both study areas, the adopters were oversampled to facilitate the impact assessment, and hence the adoption figures cannot be considered representative of the population.
Data were partitioned into training and test data sets (75/25%, respectively). The Random Forests were fitted using the package caret (Kuhn, 2008) in R (R Core Team, 2019) and the CART trees using the package rpart (Therneau and Atkinson, 2019). The most important variables were determined for each model fitted. Mean Decrease in Accuracy (MDA) was used to determine the importance of predictor variables included in various Random Forest models.
Estimation of the Impact of ZT Targeting
We estimate the economic impacts of ZT technology under different hypothetical scenarios of technology targeting, employing an equilibrium displacement model under the partial equilibrium framework. The approach has long been used in evaluating commodity-related technological progress in agriculture for economic impact assessments (Alston et al., 1995). The economic benefits of an intervention are estimated based on a parallel downward shift in the supply curve of the commodity. The economic benefits from the per-unit cost are estimated separately for each state and farmer group, within a framework for the small-open economy adapted for ex-post impact evaluation (Masters et al., 1996). The economic surplus attributed to ZT wheat adoption (ESz) is estimated using the equation:
where P0 and Q0 are the annual average market price of wheat and total wheat grain production of the country for a given year, respectively. We used the wheat Minimum Support Price (MSP), fixed by the Indian government for 2018 (Rs. 16.25 or US$ 0.24 per kg grain), and estimated the surplus values for the present analysis. The shift in supply function due to the per-unit cost reduction from ZT wheat is shown by Kz, and ε is the price elasticity of supply of wheat. We derived the ε value from the literature. Meena et al. (2010) reported the supply elasticity of wheat in Western India as 0.38, whereas Kumar et al. (2010) estimated it as 0.21 for the whole of India. Another study calculated the supply elasticity of wheat as 0.17 in the short-run and 0.36 in the long-run during the post-reform period in India (Mythili, 2008). For the present study, we take the value of 0.22, following Kumar et al. (2016), because the authors used time series and cross-sectional datasets that are nationally representative for the estimation, and the publication was peer-reviewed. Based on the assumed supply elasticity, the shift in the supply function due to ZT adoption is calculated as follows.
where and are the average proportional changes in yield and variable costs per ha, respectively, which are associated with the ZT adoption in wheat. These values are obtained from the IPW estimates. The rate of adoption of the technology is Az, which along with and could change across farmer groups. We estimate the ES for a single year (2020), and the effect of targeting is calculated as the difference in economic surplus estimates under three hypothetical scenarios of ZT adoption. Scenario (Sc.) I is close to the reality regarding the relative share of adopters among large and small farmers (20% adoption in large farmer area and 10% adoption in smallholder area). It may result from a complete lack of targeting in the diffusion process. In Sc. II, we assume that the adoption rate is equal (15%) across the two groups. In Sc. III, with better targeting strategies, adoption could be higher in smallholder area (20%) than among large farmer area (10%).
In addition to the economic surplus generation, we also estimate the poverty effect of technology targeting based on landholding categories. The number and share of operational holdings in Punjab and Bihar are shown in Supplementary Materials S3. The cumulative expenditure functions of marginal and small farmers (<2 ha landholding; hitherto indicated as “smallholder”) and medium and large farmers (≥2 ha landholding; hitherto “large farmers”) of Punjab and Bihar are estimated from the National Sample Survey Office (NSSO) data (68th round of 2011–12). The dataset contained information from two surveys (a) Household consumption expenditure survey and (b) Employment unemployment survey of households in India. Both the surveys are nationally representative, with a sample size of about 200 thousand households. To calculate the share of farm-households living below poverty, we rely on the poverty line estimated by the Tendulkar Committee at Rs. 1,054 for Punjab and Rs. 778 for Bihar. We calculated the poverty rate among smallholders and large farmers using sampling weights.
To find the potential effect of ZT technology targeting on poverty reduction, we estimated the possible increase in the per capita annual income from the adoption of ZT wheat for 2018 (per ha profitability of ZT wheat derived from the IPW estimates, multiplied by the average wheat area per household). From this figure, monthly per capita annual increases in income from technology adoption were calculated, deflated using the Consumer Price Index for rural areas at the 2011–12 base prices. Next, we classified the rural farm-households as poor and non-poor and estimated the share of the poor. The percentage share of farmers who could escape poverty after obtaining additional income equivalent to the ZT effect was calculated for each landholding category in Punjab and Bihar. Assuming a uniform distribution of the poor within each landholding category, the cumulative distribution function of MPCE (pre- and post-ZT adoption) of small and large farmers used for this calculation is shown in Supplementary Materials S4.
Results
Adoption of ZT by Smallholders and Large Farmers
The adoption rates estimated from the Punjab and Bihar surveys are presented in Table 2. The overall adoption of ZT was 45% in the sample villages of Punjab in 2017–18, and the adoption was higher among large farmers (50%) than smallholders (35%). In Bihar, 33% of sample farmers were found following ZT wheat in 2012–13 as revealed in the first round of the survey, and 42% in 2015–16 as per the second round. While the ZT adoption increased among smallholders (28–36%) and large farmers (58–64%), the gap in adoption between these groups persisted.
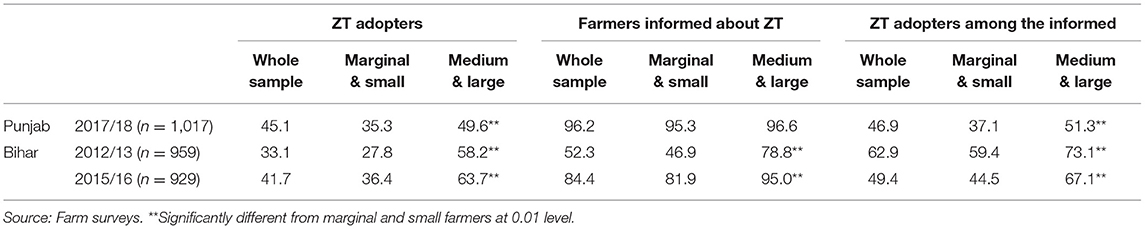
Table 2. ZT adoption (% share of households) among sample wheat farmers in Punjab and Bihar.
We reassessed the adoption rates conditional on information availability. In the Punjab sample, the awareness of CA practices was high (96%), and the difference between the two farmer groups was negligible. On the other hand, the large farmers of Bihar were more aware of the practice than smallholders. For example, in the 2013-round survey, about 79% of large farmers but only 47% of smallholders were informed about the technology. In the second round of surveys (2016-round), unsurprisingly, the awareness gap between large and smallholders narrowed. When the adoption rates were assessed among the informed ones, we found that the large/small farmer divide persisted in both states. In Punjab, the adoption rate among the informed was 37% among smallholders and 51% among large farmers. A similar pattern was observed in Bihar. The 2016-round survey showed that the ZT adoption rate was 67% among informed large farmers and 45% among informed smallholders.
The descriptive statistics show that adopters and non-adopters differ significantly concerning landholding size and other socioeconomic variables in both Punjab and Bihar (cf. Supplementary Materials S1). We used CART to develop a predictive algorithm for adoption and a Random Forest to determine the importance of each variable in classifying the data. To avoid over-fitting, the model is pruned using optimal complexity parameter. The outputs are shown in Figure 2 (Punjab) and Figure 3 (Bihar). In Punjab data, the optional tree for ZT adoption had 15 terminal nodes (Figure 2A). The root node (Node 0) is the “market access” variable, and it is one of the most important predictors of ZT adoption (Figure 2B). Initially, the sample is divided into two, based on whether or not the nearest input market is ≥7.5 km away from the household. For 35% of sample households, the input market is classified as distant at this cut-off point, and the probability of ZT adoption was high among them compared to the rest (by 22 percentage points). The root node is a parent node with two children nodes. Node 1 contains the data related to farmers who are close to the market (<7.5 km), and Node 2 has the data of relatively remote farmers from the market (≥7.5 km). At the second hierarchy level at Node 1, the data are further split based on the land area under cultivation (ha), a variable strongly correlated with landholding size. The splitting criterion was whether the total cultivated area was below 1.7 ha or not. The sample of farmers living close to the market (<7.5 km) and cultivating a net area of ≥1.7 ha under cultivation is split at a third level of hierarchy based on rotavator ownership (Node 3). For farmers cultivating in <18 ha, the rotavator ownership is associated with the non-adoption of ZT technology. On the other hand, for very large farmers (cultivating in ≥18 ha), rotavator ownership is associated with increased ZT adoption. The MDA plot of Punjab data, given in Figure 2B, shows the sum of the decrease in model accuracy if that variable is dropped from the model. One could see that market access, land area under cultivation, and tractor ownership were the three most important prediction variables of ZT adoption in Punjab.
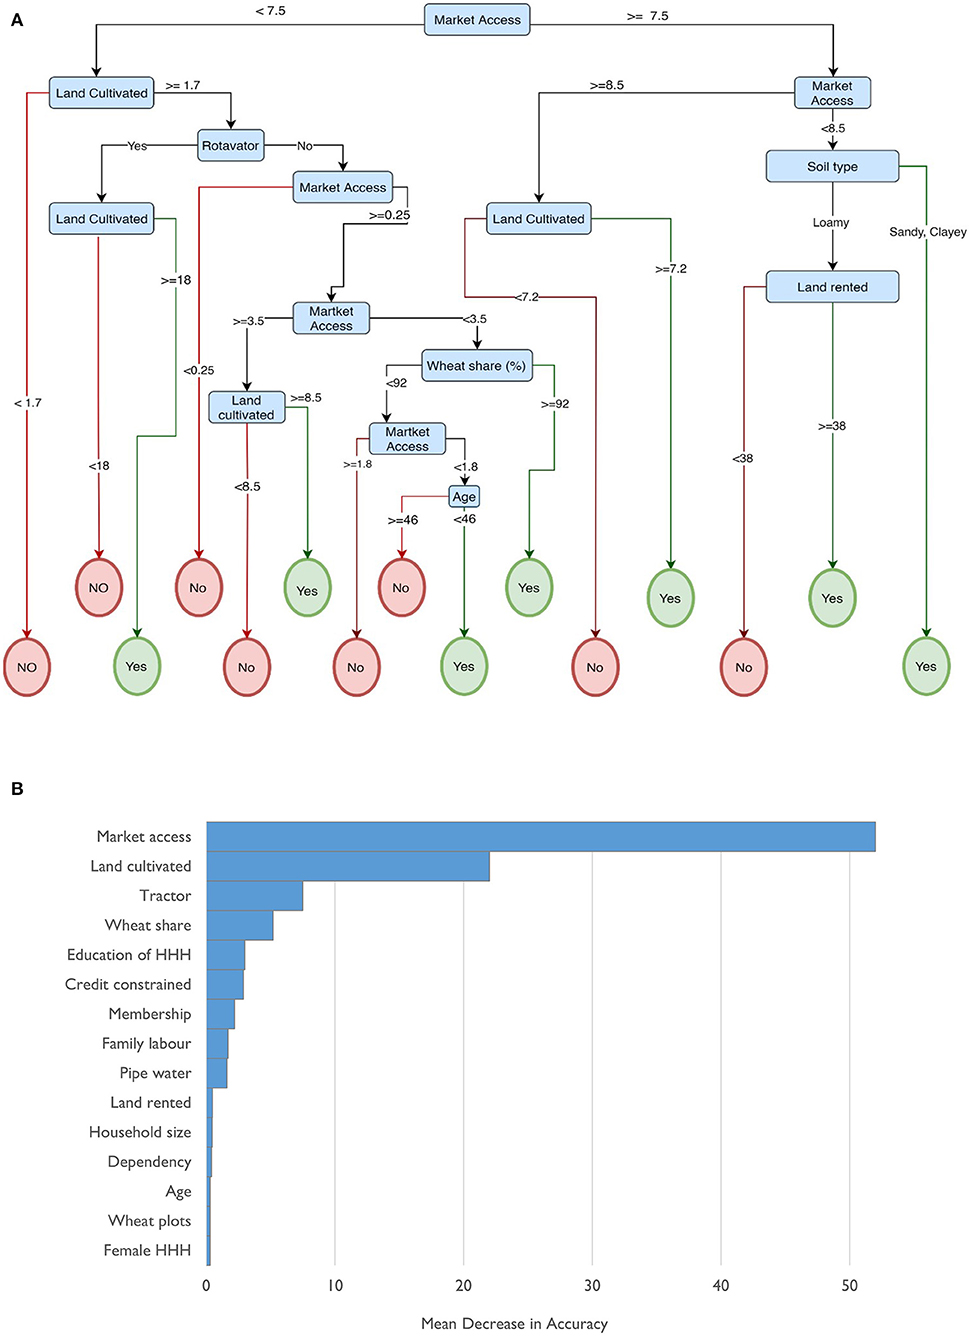
Figure 2. (A) Correlation and Regression Trees (CART) on Farmer Adoption of Zero Tillage in Punjab. The variables are defined, and summary statistics provided in Supplementary Materials S1(a). (B) Importance of predictor variables in the Random Forest Models on ZT adoption in Punjab. The variables are defined in Supplementary Materials S1(a).
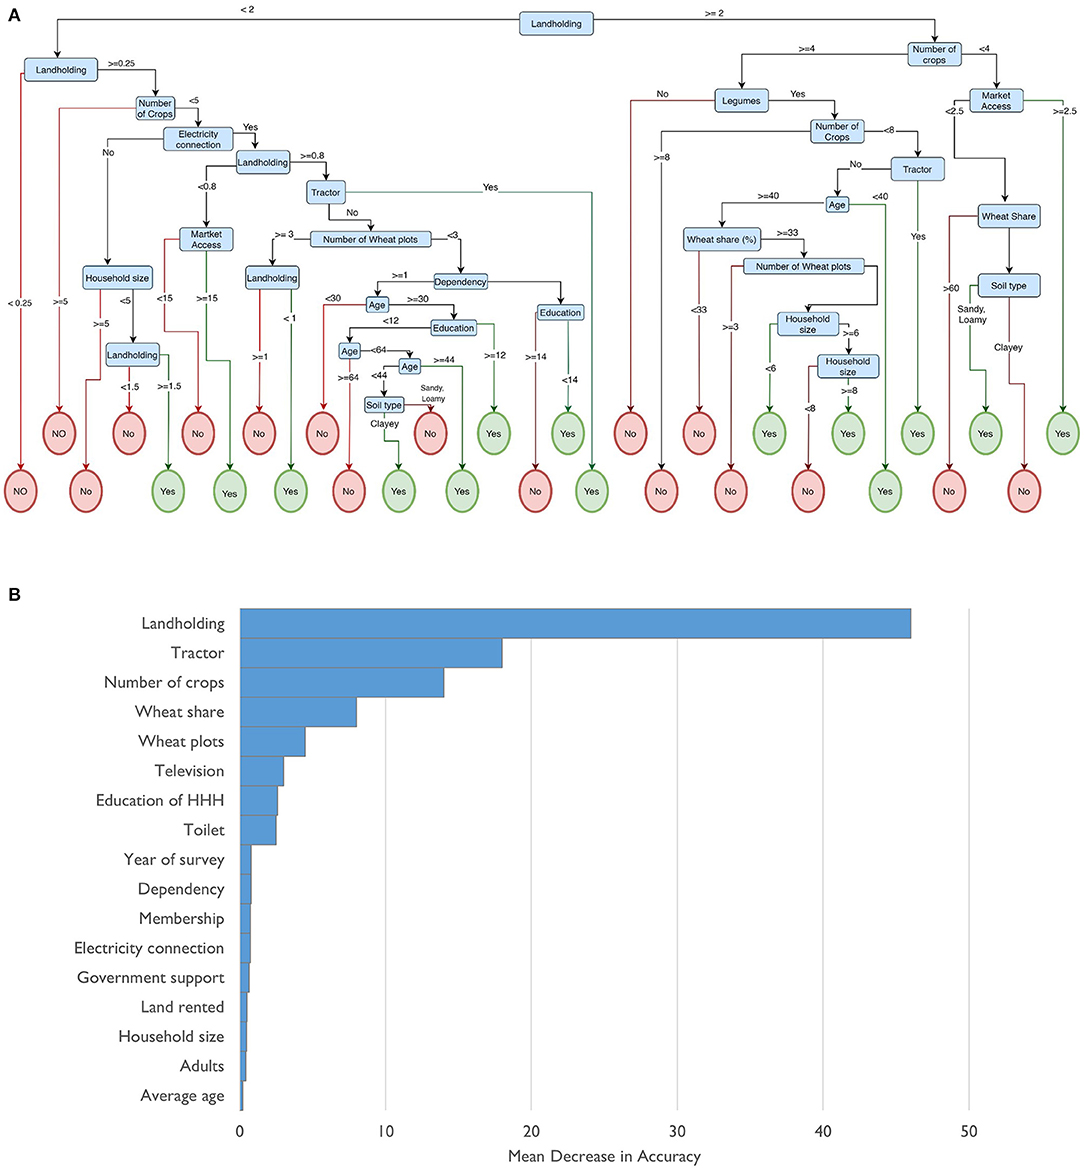
Figure 3. (A) CART on Farmer Adoption of Zero Tillage in Bihar. The variables are defined, and summary statistics provided in Supplementary Materials S1(b). (B) Importance of predictor variables in the Random Forest Models on ZT adoption in Bihar. The variables are defined in Supplementary Materials S1(b).
The CART framework of ZT adoption in Bihar is more complex than in Punjab, and the optional tree for ZT adoption has 31 terminal nodes (Figure 3A). While explaining the tree is not easy, there are some easily observable patterns. The root node here is the variable “Landholding,” which is split exactly based on the official definition of smallholders (<2 and ≥2 ha). At the second level of hierarchy for smallholders (at Node 1), the division is again based on landholding size (at 0.25 ha), which leads to a leaf node of non-adoption when the landholding size is <0.25 ha. For large farmers (≥2 ha of landholding), the second level of hierarchy (Node 2) is with respect to the variable number of crops per year (<4 crops or others). At Node 3 for smallholders, the data are also split based on the number of crops (<5 crops or others). Landholding and related variables also appear in nodes after the third hierarchy level. Unsurprisingly, landholding size emerged in the MDA analysis as the most important predictor variable of ZT adoption in Bihar, followed by tractor ownership and the number of crops cultivated on-farm (Figure 3B).
Economics of ZT for Smallholders
We estimated the effect of ZT adoption on different outcome variables at the plot level, using sample survey data and treatment-effect models, and the key findings are presented in Figures 4A–D and Supplementary Materials S5. Significant regional differences are observed in the effect of ZT practice in wheat. In Punjab, the adopters realized a significant reduction in both paid-out variable cost (−7%) and total (paid-out and imputed) variable cost (−8%). Modest increases were realized with ZT adoption in grain yield (+2%) and profit (+4% with the paid-out cost alone, and +5% with the imputed costs in addition). In Bihar, the cost reduction was insignificant, but yield enhancement was higher in magnitude (+15%) than in Punjab. As a result of this yield increment, the profit over paid-out cost was higher for adopters (+29% over non-adopters). The ZT effect on profits with paid-out and the imputed cost was even higher (+38%). In absolute terms also, ZT wheat was generating higher profits in Bihar (US$ 78 per ha over paid-out costs alone) as compared to Punjab (US$ 43 per ha). In both Bihar and Punjab, we could notice no significant difference in the ZT effect between smallholders and large farmers. In other words, the data analysis provides no evidence that the lower adoption rate among smallholders is due to the inferior technology performance on-farm.
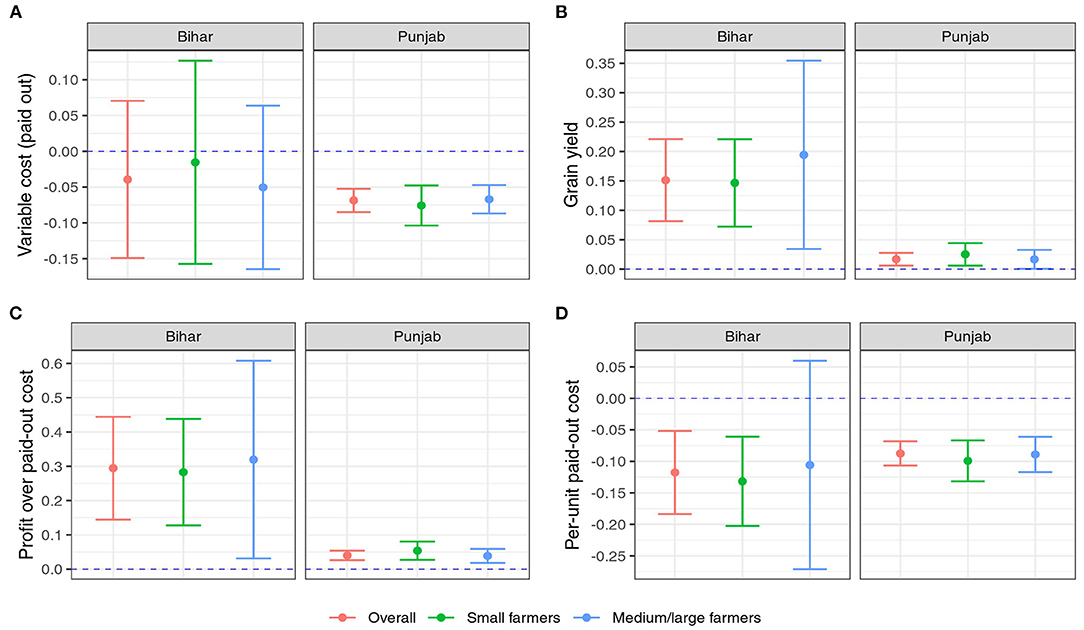
Figure 4. Plot level economic effects (%) of ZT adoption by wheat farmers in Punjab and Bihar. Figures show percentage change over non-adopters. The absolute effects are provided in Supplementary Materials S5.
To understand the effect of plot size on ZT adoption, we compared the difference in the density distribution of plots with and without ZT wheat in Punjab using remote sensing data (Figure 5). Similar data are unavailable from Bihar due to the difficulties faced in crop identification. We found no statistically significant difference in the mean plot size under conventional tillage and ZT wheat in Punjab. However, when the plot size is < 0.25 ha, there is a lower adoption of ZT, possibly due to difficulty maneuvering the seed drill. However, only a small share of plots is below 0.25 ha in Punjab.
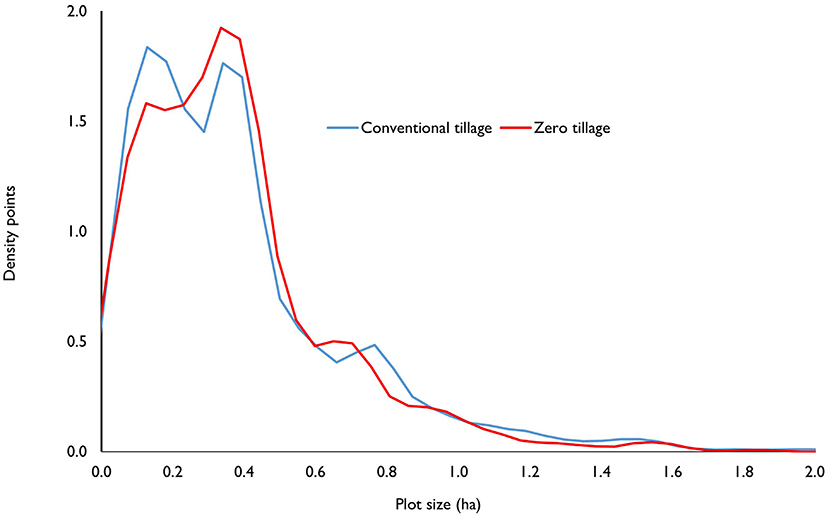
Figure 5. Plot size and use of conventional and zero tillage in Punjab. Source: Remote sensing data (n = 5,973). The difference in plot size under conservation tillage and zero tillage is statistically insignificant (p > 0.10).
Potential Impacts of ZT Targeting
In this sub-section, we focused on the difference in the potential economic surplus arising from the difference in the ZT area among smallholders and large farmers. In Sc. II and III, the aggregate number of smallholder adopters is higher than that of large farmer-adopters. More wheat area will be under ZT under Sc.1 (0.67 million ha per annum) in large farmer-dominated Punjab systems than under Sc. III (0.39 million ha). On the other hand, in Bihar, due to a higher share of smallholders in the farming community, the area under ZT will be more under Sc. III (0.37 million) than under Sc. I (0.26 million). The economic surplus estimates associated with these scenarios are provided in Table 3.
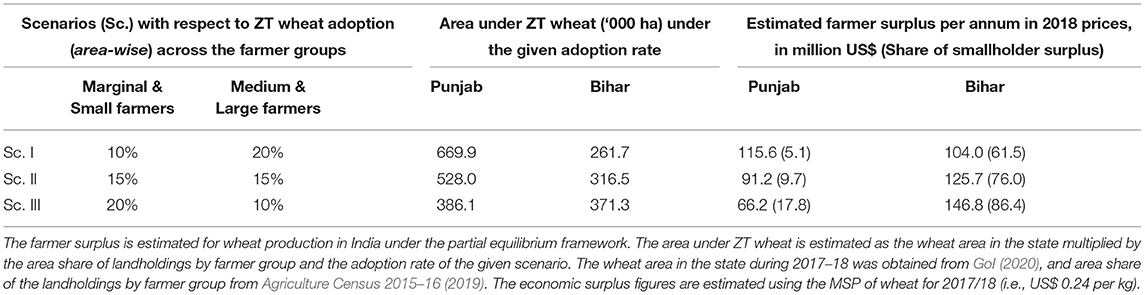
Table 3. Farmer surplus under different technology targeting scenarios for ZT wheat, India.
Following the impact estimates (cf. Figure 4), we assume that the yield enhancement and cost reduction potential of ZT will be the same for smallholders and large farmers. Therefore, the variation in economic surplus values between scenarios corresponds to the changes in the ZT area in both states. In Punjab, the aggregate economic surplus generated under Sc.1 is US$116 million (in 2018 prices), of which smallholders contribute about 5%. Under Sc. III, the surplus is low at US$66 million, although the share of smallholders is high (18%). In Bihar, both economic surplus and smallholder contribution increase when adoption increases among smallholders. Here, the aggregate economic surplus generated under Sc. I is US$104 million, of which 62% is from smallholders. Under Sc. III, both the surplus (US$147 million) and the smallholder share (86%) are higher (Table 3).
We also estimated the reduction in rural poverty among wheat farmers with the income increases equivalent to the profit increase from ZT adoption (Table 4). Due to the larger cultivated area under wheat, the absolute crop income increase from ZT adoption would naturally be higher among large farmers (Rs. 17.3 thousand in Bihar and Rs. 20.5 thousand in Punjab) than smallholders (Rs. 3.3 thousand in Bihar and Rs. 9.9 thousand in Punjab). However, poverty is more prevalent among smallholders than large farmers. The poverty rates estimated from the two NSSO surveys—Employment/Unemployment Survey and Consumption Survey—differ slightly. According to the Consumption Survey, the poverty rate is 35% among smallholders and 23% among large farmers in Bihar. According to Employment/Unemployment Survey, these values are 29 and 23%, respectively. In Punjab, the poverty rate is low; about 13% of smallholders and 4% of large farmers were poor, according to Employment/Unemployment Survey (7 and 1%, respectively according to the Consumption Survey).
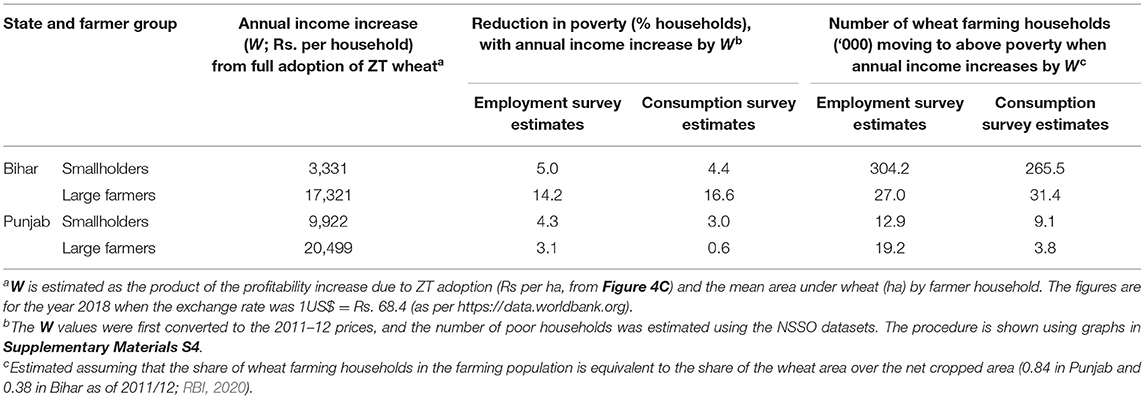
Table 4. Poverty reduction potential of ZT wheat under different targeting scenarios in India.
With an increase in the annual income equivalent to the farm-profit increment from ZT adoption, about 4–5% of smallholders could escape poverty in Bihar, which corresponds to 266–304 thousand farm households. While a higher percentage of poverty reduction is estimated for large farmers (14–17%), the number of households escaping poverty would be lower (27–31 thousand). It is because the large-sized landholdings are less in number (0.5 million) than smallholdings (16 million) in the state (cf. Supplementary Materials S3), presenting a strong case for technology targeting based on landholding size in Bihar agriculture. On the other hand, the poverty reduction potential of ZT adoption is low in Punjab, as the state is economically more prosperous. The poverty reduction among smallholders from income increase from ZT adoption would be only 3–4% (9–13 thousand wheat farming households). Therefore, the poverty reduction potential of the technology would be small in percentage terms (0.6–3%) among large farmers of Punjab. The number of households leaving poverty would be between 4 thousand (according to the NSSO Consumption Survey) and 19 thousand (according to the NSSO Employment/ Unemployment Survey).
Discussion
ZT wheat is a highly promising technology on paper; only a few other innovations have comparable potential to generate environmental services while being financially lucrative. Ideally, wheat farmers should voluntarily adopt the technology to raise their farm profitability, while governments provide the necessary institutional support to maximize social welfare (e.g., by reducing residue burning and rural poverty). However, even after 15 years of its introduction in the IGP, ZT has not attained the popularity that it deserves. Bhargava et al. (2017) indicated that the 10% adoption of ZT wheat estimated for the Northwestern IGP was the highest in India. The present study found that smallholder farmers are less aware of the ZT technology and more reluctant to adopt it than large farmers. Surprisingly, the low adoption occurs not because of an absence of private benefits on smallholder farms but despite it. The slow adoption of CA practices in the presence of economic incentives is found puzzling in other studies also (Coventry et al., 2015; Farooq and Siddique, 2015). However, there is an increased awareness of the benefits of CA technologies with the state and central governments when some emergencies and challenges arise—like crop residue burning and associated high air pollution or COVID-19-mediated labor shortage in regions like Punjab. On the other hand, a longer-term strategy for popularizing the CA practices among Indian farmers is yet to emerge.
Our study indicated that one of the first steps toward inclusive dissemination of ZT is the development of efficient service provision of ZT seed drills and compatible tractors. Owning a direct seeder and a high-power tractor for operating it in the field would not make economic sense for most farmers, particularly smallholders. Naturally, most smallholder farmers access the machinery component of the technology through custom-hiring (Keil et al., 2016). The provision of ZT drill services could be biased against smallholder farmers and farmers with small, fragmented plots due to higher transaction costs per unit of land. In the study area, landholding size is strongly and positively correlated with plot size, especially among smallholders. The problem of constrained service provision is prevalent not only in Bihar but also in some regions where mechanization is prevalent, like Punjab. Several Punjab farmers opined that the scarcity of high-power tractors required for the SGDS is a major constraint to the adoption of ZT. In this connection, the R&D institutions may devise monetary or non-monetary incentives to provide machinery services for smallholders, the exact nature of which could be context-dependent and subject to further socioeconomic research. Alongside targeting innovation to smallholders through encouraging the service providers to cater to the needs of smallholders (both SGDS and compatible tractors), financial incentives in the form of subsidy on custom hiring charges, information campaigns focusing on the economic and environmental benefits of CA technologies can have a crucial role in popularizing the ZT technology in Indian wheat.
There could be an additional dimension of technology adoption with social groups and networks. Farmers tend to interact with other farmers of similar landholding category, with a minor “upward orientation” in self-reported peers and those from their own social stratum or caste (Keil et al., 2019). The study also found that the ZT adoption behavior of their network members had highly significant effects on farmer adoption across all landholding categories. In Punjab also, social networks seem to play a more important role when it comes to the ZT adoption decision (Keil et al., 2021). Since most service providers of ZT drills belong to non-marginalized castes and a large share of smallholders is from the marginalized castes (Keil et al., 2016), the chances of developing a close social network between service providers and smallholders are low. The lack of social networks of smallholders with early adopters (who also belong to non-marginalized castes) and service providers poses a serious concern in India as the formal extension network is weak (Farooq and Siddique, 2015; Krishna et al., 2019). One may argue that the scale bias of service provision may reduce over time with the number of service providers increasing in a region, as competition prompts them to be less selective (Keil et al., 2019). However, the success of the ZT technology depends on the timely availability of the machinery in the initial phase of diffusion itself. Therefore, inclusive business models that facilitate service coordination through farmer cooperatives or lead farmers of the village may help service provision on a “first-come-first-served” basis. Farmer groups and cooperatives could also invest in ZT machinery to mitigate capital constraints and organize campaigns to reduce information bias. Furthermore, more scale-appropriate machinery could be developed and deployed by the R&D agencies. For example, for a locally adapted machine for ZT adoption in small wheat plots, Power Tiller Operated Seeders (PTOS), single-pass shallow-tillage seed, and fertilizer drills have become popular in the reduced-tillage regime of the eastern IGP (Akter et al., 2021).
Finally, our study pointed out that CA technology targeting based on landholding size is highly context-dependent. While it could benefit Bihar farmers, we have seen no significant reduction in rural poverty from targeting the smallholders in Punjab. On the other hand, targeting the smallholders might even lead to a reduction in the aggregate economic benefits in the latter region. However, we are not ruling out the need for technology targeting. It might be warranted concerning other socioeconomic factors, such as gender or caste. More research is required to estimate the effects of social targeting of CA technologies.
Conclusion
The findings of the present study can be summarized as follows. The ZT technology has significant economic potential in the rice-wheat systems of the IGP. However, the awareness creation and dissemination processes are biased against smallholders. The inadequacies at the information provision and capacity development fronts, absence of institutional incentives for targeting the poor in the agricultural R&D system, and the scale bias of the service providers against the smallholders are identified as the major constraints for ZT wheat diffusion in the study area. Our analysis points out that the R&D efforts to rectify these bottlenecks and facilitate inclusive technology dissemination possess a high potential for poverty alleviation, particularly in eastern India.
Against this context, socioeconomic research studies could contribute significantly by creating awareness of biases in the dissemination framework and showcasing the economic potential for a socially responsive scaling out process. Unfortunately, constrained by its adherence to the conventional empirical framework, adoption research often fails to capture the complex and dynamic technological changes in agricultural systems (Krishna et al., 2020). Even 15 years after the first adoption study published on CA in South Asia, a knowledge gap exists to frame an efficient, effective, and equitable pathway toward an increased CA coverage in South Asian agriculture. Focusing on a single crop or commodity, these studies forgo the system approach. Emphasizing the short-term private costs and benefits, they overlook the longer-term and public effects of the technology. Farmers' apprehensions and perceived risks of CA components are hardly evaluated against reality. Socio-economic research may also reduce the emphasis on answering the question “are farmers ready for the technology?” and may start asking, “is the innovation system ready for the farmer?”. A modified adoption framework, guided by a sound Theory of Change based on regional level enabling and constraining factors, is necessary to generate data that would facilitate wide technology dissemination.
Data Availability Statement
The raw data supporting the conclusions of this article will be made available by the authors, without undue reservation.
Ethics Statement
The studies involving human participants were reviewed and approved by CIMMYT IREC. The Ethics Committee waived the requirement of written informed consent for participation.
Author Contributions
VK designed the study, estimated the technology effects, and wrote and revised the manuscript. AK provided the farm-household survey dataset (Punjab and Bihar). MJa and WZ provided and analyzed the remote sensing datasets and drafted the methodology section on satellite detection of farmer adoption. MJo and SS-P provided inputs for the statistical analysis of the farm-household survey and secondary datasets. LB-E estimated the random forest models. B-S, MLJ, and OE provided insights on the observed patterns. All authors contributed to the discussion and revision of the drafts and approved the submitted version of the manuscript.
Funding
The manuscript was designed and developed as part of the research project, “Impact of a Second-Generation Conservation Agriculture Technology (Happy Seeder) on Crop Residue Burning and Air Quality in Northwestern Indo-Gangetic Plains”, which was funded by the Standing Panel on Impact Assessment (SPIA). The datasets were collected as part of different research projects managed by the International Maize and Wheat Improvement Center (CIMMYT), New Delhi. In Punjab, the data collection was co-funded by the CGIAR Research Program on Wheat Agri-Food Systems (CRP WHEAT), the Nature Conservancy (TNC), and the Indian Council of Agricultural Research (ICAR). The data collection in Bihar was co-funded by the Bill & Melinda Gates Foundation (grant numbers OPP1052535 and OPP1133205) and USAID (grant number BFS-G-11-00002) through the Cereal Systems Initiative for South Asia (CSISA).
Author Disclaimer
Any opinions, findings, conclusions, or recommendations expressed in this publication are those of the authors and do not necessarily reflect the view of the funding agencies or institutions.
Conflict of Interest
AK is currently employed by Unique Land Use GmbH.
The remaining authors declare that the research was conducted in the absence of any commercial or financial relationships that could be construed as a potential conflict of interest.
Publisher's Note
All claims expressed in this article are solely those of the authors and do not necessarily represent those of their affiliated organizations, or those of the publisher, the editors and the reviewers. Any product that may be evaluated in this article, or claim that may be made by its manufacturer, is not guaranteed or endorsed by the publisher.
Acknowledgments
We gratefully acknowledge the willingness of the sample farmers to participate in the survey, the two reviewers and the journal editor for their valuable suggestions, and Sreejith Aravindakshan for the technical support.
Supplementary Material
The Supplementary Material for this article can be found online at: https://www.frontiersin.org/articles/10.3389/fagro.2022.772732/full#supplementary-material
References
Agarwal, R., Awasthi, A., Singh, N., Gupta, P. K., and Mittal, S. K. (2012). Effects of exposure to rice-crop residue burning smoke on pulmonary functions and oxygen saturation level of human beings in Patiala (India). Sci. Total Environ. 429, 161–166. doi: 10.1016/j.scitotenv.2012.03.074
Agriculture Census 2015–16 (2019). Phase I: All India Report on Number and Area of Operational Holdings. New Delhi: Agriculture Census Division, Department of Agriculture, Co-Operation & Farmers Welfare, Ministry of Agriculture & Farmers Welfare, Government of India.
Akter, S., Gathala, M. K., Timsina, J., Islam, S., Rahman, M., Hassan, M. K., et al. (2021). Adoption of conservation agriculture-based tillage practices in the rice-maize systems in Bangladesh. World Dev. Perspect. 21, 100297. doi: 10.1016/j.wdp.2021.100297
Alston, J. M., Norton, G. W., and Pardey, P. G. (1995). Science Under Scarcity: Principles and Practice for Agricultural Research Evaluation and Priority Setting. Ithaca, NY: Cornell University Press.
Balwinder-Singh, Shirsath, P. B., Jat, M. L., McDonald, A. J., Srivastava, A. K., Craufurd, P., et al. (2020). Agricultural labor, COVID-19, and potential implications for food security and air quality in the breadbasket of India. Agric. Syst. 185, 102954. doi: 10.1016/j.agsy.2020.102954
Benbi, D. K. (2018). Carbon footprint and agricultural sustainability nexus in an intensively cultivated region of Indo-Gangetic Plains. Sci. Total Environ. 644, 611–623. doi: 10.1016/j.scitotenv.2018.07.018
Bhargava, A., Boudot, C., Butler, A., Chom,é, G., Gupta, K., Singh, R., et al. (2017). Conservation Agriculture: Documenting Adoption Across the Gangetic Plains of India. Chennai: IFMR LEAD and CGIAR Independent Science and Partnership Council.
Coventry, D. R., Poswal, R. S., Yadav, A., Riar, A. S., Zhou, Y., Kumar, A., et al. (2015). A comparison of farming practices and performance for wheat production in Haryana, India. Agric. Syst. 137, 139–153. doi: 10.1016/j.agsy.2015.04.003
Erenstein, O. (2010). Triangulating technology diffusion indicators: zero tillage wheat in south Asia's irrigated plains. Exp. Agric. 46, 293–308. doi: 10.1017/S0014479710000037
Erenstein, O. (2011). Cropping systems and crop residue management in the Trans-Gangetic Plains: issues and challenges for conservation agriculture from village surveys. Agric. Syst. 104, 54–62. doi: 10.1016/j.agsy.2010.09.005
Erenstein, O., and Laxmi, V. (2008). Zero tillage impacts in India's rice–wheat systems: a review. Soil Till. Res. 100, 1–14. doi: 10.1016/j.still.2008.05.001
Erenstein, O., and Thorpe, W. (2011). Livelihoods and agro-ecological gradients: a meso-level analysis in the Indo-Gangetic Plains, India. Agric. Syst. 104, 42–53. doi: 10.1016/j.agsy.2010.09.004
FAO (2016). Save and Grow in Practice: Maize, Rice and Wheat. Rome: Food and Agriculture Organization of the United Nations (FAO).
Farooq, M., and Siddique, K. H. M. (2015). Conservation agriculture: concepts, brief history, and impacts on agricultural systems, in Conservation Agriculture, eds M. Farooq, and K. H. M. Siddique (Cham: Springer International Publishing), 3–17.
GoI (2020). Agricultural Statistics at a Glance - 2019. New Delhi: Ministry of Agriculture and Farmers Welfare, Government of India.
Gupta, R., and Seth, A. (2007). A review of resource conserving technologies for sustainable management of the rice–wheat cropping systems of the Indo-Gangetic plains (IGP). Crop Prot. 26, 436–447. doi: 10.1016/j.cropro.2006.04.030
Jat, M. L., Chakraborty, D., Ladha, J. K., Rana, D. S., Gathala, M. K., McDonald, A., et al. (2020). Conservation agriculture for sustainable intensification in South Asia. Nat. Sustain. 3, 336–343. doi: 10.1038/s41893-020-0500-2
Jones-Garcia, E., and Krishna, V. V. (2021). Farmer adoption of sustainable intensification technologies in the maize systems of the Global South: a review. Agron. Sustain. Dev. 41:8. doi: 10.1007/s13593-020-00658-9
Jose, M., and Krishna, V. V. (2021). Whither Indian wheat? Productivity plateau, spatial heterogeneity, and R&D targeting. Rev. Agrar. Stud. 11, 22–47. doi: 10.25003/RAS.11.1.0003
Kassam, A., Derpsch, R., and Friedrich, T. (2014). Global achievements in soil and water conservation: the case of Conservation Agriculture. Int. Soil Water Conserv. Res. 2, 5–13. doi: 10.1016/S2095-6339(15)30009-5
Keil, A., D'souza, A., and McDonald, A. J. (2015). Zero-tillage as a pathway for sustainable wheat intensification in the Eastern Indo-Gangetic Plains: does it work in farmers' fields? Food Sec. 7, 983–1001. doi: 10.1007/s12571-015-0492-3
Keil, A., D'souza, A., and McDonald, A. J. (2016). Growing the service economy for sustainable wheat intensification in the Eastern Indo-Gangetic Plains: Lessons from custom hiring services for zero-tillage. Food Sec. 8, 1011–1028. doi: 10.1007/s12571-016-0611-9
Keil, A., Krishnapriya, P. P., Mitra, A., Jat, M. L., Sidhu, H. S., Krishna, V. V., et al. (2021). Changing agricultural stubble burning practices in the Indo-Gangetic Plains: is the Happy Seeder a profitable alternative? Int. J. Agric. Sustain. 19, 128–151. doi: 10.1080/14735903.2020.1834277
Keil, A., Mitra, A., McDonald, A., and Malik, R. K. (2020). Zero-tillage wheat provides stable yield and economic benefits under diverse growing season climates in the Eastern Indo-Gangetic Plains. Int. J. Agric. Sustain. 18, 567–593. doi: 10.1080/14735903.2020.1794490
Keil, A., Mitra, A., Srivastava, A. K., and McDonald, A. (2019). Social inclusion increases with time for zero-tillage wheat in the Eastern Indo-Gangetic Plains. World Dev. 123, 104582. doi: 10.1016/j.worlddev.2019.06.006
Krishna, V. V., Aravalath, L. M., and Vikraman, S. (2019). Does caste determine farmer access to quality information? PLoS ONE 14, e0210721. doi: 10.1371/journal.pone.0210721
Krishna, V. V., and Veettil, P. C. (2014). Productivity and efficiency impacts of conservation tillage in Northwest Indo-Gangetic Plains. Agric. Syst. 127, 126–138. doi: 10.1016/j.agsy.2014.02.004
Krishna, V. V., Yigezu, Y. A., Karimov, A. A., and Erenstein, O. (2020). Assessing technological change in agri-food systems of the Global South: a review of adoption-impact studies in wheat. Outlook Agric. 49, 89–98. doi: 10.1177/0030727020930728
Kubitza, C., and Krishna, V. V. (2020). Instrumental variables and the claim of causality: evidence from impact studies in maize systems. Global Food Sec. 26, 100383. doi: 10.1016/j.gfs.2020.100383
Kuhn, M. (2008). Building predictive models in R using the caret package. J. Stat. Softw. 28, 1–26. doi: 10.18637/jss.v028.i05
Kumar, P., Joshi, P. K., and Mittal, S. (2016). Demand vs supply of food in India-futuristic projection. Proc. Ind. Natl. Sci. Acad. 82, 1579–1586. doi: 10.16943/ptinsa/2016/48889
Kumar, P., Shinoj, P., Raju, S. S., Kumar, A., Rich, K. M., and Msangi, S. (2010). Factor demand, output supply elasticities and supply projections for major crops of India. Agric. Econ. Res. Rev. 23, 1–14. doi: 10.22004/ag.econ.92090
Kumara, K. T. M., Kandpal, A., and Pal, S. (2019). Determinants and impacts of conservation agriculture in South Asia: a meta-analysis of the evidences. Ind. J. Agric. Econ. 74, 311–320. Available online at: https://www.cabdirect.org/cabdirect/abstract/20203412179
Kumara, K. T. M., Kandpal, A., and Pal, S. (2020). A meta-analysis of economic and environmental benefits of conservation agriculture in South Asia. J. Environ. Manage. 269, 110773. doi: 10.1016/j.jenvman.2020.110773
Lohan, S. K., Jat, H. S., Yadav, A. K., Sidhu, H. S., Jat, M. L., Choudhary, M., et al. (2018). Burning issues of paddy residue management in north-west states of India. Renew. Sustain. Energy Rev. 81, 693–706. doi: 10.1016/j.rser.2017.08.057
Masters, W. A., Coulibaly, B., Sanogo, D., Sidib,é, M., and Williams, A. (1996). The Economic Impact of Agricultural Research: A Practical Guide. West Lafayette, IN: Department of Agricultural Economics, Purdue University.
Meena, P. C., Kumar, P., and Reddy, G. P. (2010). Factor demand and output supply of wheat in Western India. Ind. J. Agric. Econ. 65, 739–746.
Mythili, G. (2008). Acreage and Yield Response for Major Crops in the Pre- and Post-reform Periods in India: A Dynamic Panel Data Approach: GIDR – ERS/ USDA Project Report, “Agricultural Markets and Policy”. Mumbai: Indira Gandhi Institute of Development Research.
NAAS (2017). Innovative Viable Solution to Rice Residue Burning in Rice-Wheat Cropping System Through Concurrent Use of Super Straw Management System-Fitted Combines and Turbo Happy Seeder. Policy Brief No. 2. New Delhi: National Academy of Agricultural Sciences.
R Core Team (2019). R: A Language and Environment for Statistical Computing. Vienna: R Foundation for Statistical Computing.
Rahman, M. S., Norton, G. W., and Rashid, M. H.-A. (2018). Economic impacts of integrated pest management on vegetables production in Bangladesh. Crop Prot. 113, 6–14. doi: 10.1016/j.cropro.2018.07.004
Sapkota, T. B., Jat, M. L., Aryal, J. P., Jat, R. K., and Khatri-Chhetri, A. (2015). Climate change adaptation, Greenhouse Gas mitigation and economic profitability of conservation agriculture: some examples from cereal systems of Indo-Gangetic Plains. J. Integr. Agric. 14, 1524–1533. doi: 10.1016/S2095-3119(15)61093-0
Sapkota, T. B., Vetter, S. H., Jat, M. L., Sirohi, S., Shirsath, P. B., Singh, R., et al. (2019). Cost-effective opportunities for climate change mitigation in Indian agriculture. Sci. Total Environ. 655, 1342–1354. doi: 10.1016/j.scitotenv.2018.11.225
Sarkar, S., Singh, R. P., and Chauhan, A. (2018). Crop residue burning in northern India: increasing threat to greater India. J. Geophys. Res. Atmos. 123, 6920–6934. doi: 10.1029/2018JD028428
Shyamsundar, P., Springer, N. P., Tallis, H., Polasky, S., Jat, M. L., Sidhu, H. S., et al. (2019). Fields on fire: alternatives to crop residue burning in India. Science. 365, 536–538. doi: 10.1126/science.aaw4085
Sidhu, H. S., Singh, M., Singh, Y., Blackwell, J., Lohan, S. K., Humphreys, E., et al. (2015). Development and evaluation of the Turbo Happy Seeder for sowing wheat into heavy rice residues in NW India. Field Crops Res. 184, 201–212. doi: 10.1016/j.fcr.2015.07.025
Singh, R., Erenstein, O., Saharawat, Y. S., Chaudhary, N., and Jat, M. L. (2012). Adoption analysis of resource-conserving technologies in rice (Oryza sativa)-wheat (Triticum aestivum) cropping system of South Asia. Ind. J. Agric. Sci. 82, 405–409.
Thakur, J. K., Mandal, A., Manna, M. C., Jayaraman, S., and Patra, A. K. (2021). Impact of residue burning on soil biological properties, in Conservation Agriculture: A Sustainable Approach for Soil Health and Food Security, eds J. Somasundaram, R. C. Dalal, A. K. Patra, and S. K. Chaudhari (Singapore: Springer Singapore), 379–389.
Therneau, T., and Atkinson, B. (2019). rpart: Recursive Partitioning and Regression Trees. R package version 4.1-15. Available online at: https://CRAN.R-project.org/package=rpart (accessed 06 May, 2021).
Keywords: zero tillage, inclusion, smallholders, economic impact, decision-tree, remote sensing, farm-household survey
Citation: Krishna VV, Keil A, Jain M, Zhou W, Jose M, Surendran-Padmaja S, Barba-Escoto L, Balwinder-Singh, Jat ML and Erenstein O (2022) Conservation Agriculture Benefits Indian Farmers, but Technology Targeting Needed for Greater Impacts. Front. Agron. 4:772732. doi: 10.3389/fagro.2022.772732
Received: 08 September 2021; Accepted: 07 March 2022;
Published: 30 March 2022.
Edited by:
Eric Scopel, CIRAD, Agroecology and Sustainable Intensification of Annual Crops (AIDA) Research Unit, FranceReviewed by:
Stefano Carlesi, Sant'Anna School of Advanced Studies, ItalyFernando Campos Mendonça, University of São Paulo, Brazil
Copyright © 2022 Krishna, Keil, Jain, Zhou, Jose, Surendran-Padmaja, Barba-Escoto, Balwinder-Singh, Jat and Erenstein. This is an open-access article distributed under the terms of the Creative Commons Attribution License (CC BY). The use, distribution or reproduction in other forums is permitted, provided the original author(s) and the copyright owner(s) are credited and that the original publication in this journal is cited, in accordance with accepted academic practice. No use, distribution or reproduction is permitted which does not comply with these terms.
*Correspondence: Vijesh V. Krishna, di5rcmlzaG5hQGNnaWFyLm9yZw==