 Ana Saballos1
 Alvaro Soler-Garzón2
 Matthew Brooks1
 John Patrick Hart3
 Alexander Edward Lipka4
 Philip Miklas2
 Ronald Edward Peachey5
 Patrick J. Tranel4
 Martin M. Williams II1*
- 1Global Change and Photosynthesis Research Unit, United States Department of Agriculture–Agricultural Research Service, Urbana, IL, United States
- 2Grain Legume Research Unit, United States Department of Agriculture–Agricultural Research Service, Prosser, WA, United States
- 3Tropical Agriculture Research Station, United States Department of Agriculture-Agricultural Research Service, Mayaguez, Puerto Rico
- 4Department of Crop Sciences, University of Illinois, Urbana, IL, United States
- 5Horticulture Department, Oregon State University, Corvallis, OR, United States
The availability of effective weed management tools against waterhemp (Amaranthus tuberculatus) is crucial to maintain profitable production of snap bean (Phaseolus vulgaris L.). Preemergence herbicides enable the crop to gain a size advantage over the weed, but the few preemergence herbicides registered in snap bean have poor control of waterhemp. Sulfentrazone, a protoporphyrinogen oxidase (PPO) -inhibiting herbicide, provides significant control of waterhemp and other problematic weeds. However, crop tolerance to the herbicide is poorly known. To quantify snap bean tolerance to sulfentrazone and investigate the underlying tolerance mechanism(s), a genome-wide association mapping study was conducted using field-collected data on a snap bean diversity panel. Response to a preemergence application of sulfentrazone was measured using plant population density and shoot biomass variables. High levels of crop tolerance were found in several entries including Bush Romano 71, Navarro, and Flamata. Snap bean tolerance to sulfentrazone is associated with multiple genomic regions, indicating the trait is likely a non-target site resistance (NTSR). Seed size is partially responsible for the tolerance, thus the genetic factors conditioning sulfentrazone tolerance are likely a combination of those driven indirectly by seed size/weight and those acting directly on the metabolism of the herbicide or ameliorating its damage. In this study, several cytochrome P450 and ABC transporter genes were localized in associated genomic regions. Alleles conditioning snap bean tolerance to sulfentrazone identified in the diversity panel shed light on herbicide metabolism and could be used in snap bean improvement.
Introduction
Weed contamination of the packed product in mechanically harvested snap bean (Phaseolus vulgaris) is a major challenge for snap bean producers. This is exacerbated when waterhemp (Amaranthus tuberculatus) is present, as the easily broken stem pieces are difficult to distinguish from the snap bean pods. Waterhemp is the most common and troublesome weed in North American crop production systems (Van and Wychen, 2016) due to its high fecundity, discontinuous emergence pattern, rapid growth rate, and resistance to multiple herbicide modes of action. Unlike major crops such as soybean (Glycine max (L.) Merr.), transgenic herbicide resistance is not available for snap bean production and chemistries suitable for use on snap bean are limited. Expanding availability and use of herbicides from different modes of action allows herbicide rotation to improve weed control and delay herbicide resistance in weed populations (Gage et al., 2019).
Sulfentrazone effectively controls waterhemp and multiple other broadleaf weeds (United Phosphorous, 2017). Sulfentrazone is available for use in grain soybean and conditionally labeled for dry pea, cowpeas, and lima beans; however, it is not labeled for use in snap bean. One hurdle to registering an herbicide on a new crop is the unknown level of crop tolerance to the proposed herbicide. The extent of naturally occurring tolerance to sulfentrazone in snap bean cultivars and its genetic basis are unknown.
Sulfentrazone belongs to the group of protoporphyrinogen oxidase (PPO)-inhibiting herbicides (Dayan and Duke, 2010). Protoporphyrinogen IX oxidase (EC 1.3.3.4) is an oxygen-dependent enzyme essential for the biosynthesis of chlorophyll, catalyzing the oxidation of protoporphyrinogen IX to protoporphyrin IX (Poulson and Polglase, 1975). When PPO is inhibited, its substrate is exported to the cytoplasm, where it is oxidized into protoporphyrin IX. In the presence of light, protoporphyrin IX produces reactive oxygen species (ROS). Accumulation of ROS results in the degradation of lipids and proteins, loss of chlorophyll and carotenoids, and disruption of cell membranes (Maurya, 2020; Nagano, 1999).
Plants exhibit tolerance to herbicides through several mechanisms. They can be broadly divided into Target-Site and Non-Target-Site resistance (TSR and NTSR, respectively). Target site resistance results from mutations in genes encoding the protein targets, which changes the binding of the herbicides to the target protein or from increased gene number or expression (Gaines et al., 2020). Target site resistance to PPO inhibitors has been reported in a at least five plant species (Patzoldt et al., 2006; Lee et al., 2008; Rousonelos et al., 2012; Giacomini et al., 2017; Bi et al., 2020; Mendes et al., 2020). There are two isoforms of PPO encoded by two nuclear genes targeted by PPO inhibitors, plastid PPO1 and mitochondrial PPO2 (Lermontova et al., 1997). Most reported target site mutations conferring tolerance to PPO inhibitors are in PPO2 (Patzoldt et al., 2006; Dayan et al., 2017; Giacomini et al., 2017; Rangani et al., 2019), with only one reported instance of target site mutation in PPO1 (Bi et al., 2020).
Non-target-site resistance to herbicides results from altering one or more physiological processes, including absorption, translocation, sequestration, and metabolism. These processes provide defense against a wide range of xenobiotic compounds. Metabolic tolerance to xenobiotics can be mediated by detoxification of the molecule and by amelioration of its effects in the cell. The current model for xenobiotic detoxification involves detection and signaling, transformation and transport, and compartmentalization (Edwards et al., 2011; Cavé-Radet et al., 2020). Genes involved in metabolism of xenobiotics (the “xenome”) also function in multiple biopathways of naturally occurring secondary compounds.
Sulfentrazone-induced ROS production results in oxidative stress. The oxidative stress phenomenon accompanies nearly all stresses in plants (Demidchik, 2015); therefore, plants have developed mechanisms to sense and ameliorate it. Networks linking respiration, photosynthesis, plant hormones, antioxidant enzymes, antioxidant compounds and chaperone proteins protect the cells against oxidation (Lee et al., 2000; Yamauchi et al., 2012; Luhua et al., 2013; Sah et al., 2016; Mahmood and Dunwell, 2020; Maurya, 2020; Dumanović et al., 2021). Those same mechanisms may play a role in tolerance to sulfentrazone.
The mechanisms of NTSR are more complex to decipher than TSR and can impart cross-resistance to herbicides with different modes of action (Jugulam and Shyam, 2019). Tolerance to PPO inhibitors in different plant species due to NTSR has been reported (Jugulam and Shyam, 2019). Rapid metabolism of the herbicide and differential tolerance to peroxidative stress are postulated to be the basis of the tolerance to sulfentrazone exhibited by soybean cultivars (Dayan et al., 1997; Hulting et al., 2001). Understanding the mechanisms and genetic basis of NTSR is essential for both the management of the evolution of weed herbicide resistance (Délye, 2012) and to assist the breeding of crops with tolerance to specific herbicides.
One successful approach to study traits without a known genetic structure is the genome-wide association study (GWAS). This approach involves scanning the genome of a species to identify markers with peak statistical associations with one or more traits of interest. (Manolio, 2010). In general, a GWAS is capable of identifying genomic regions that are likely to contain loci of moderate- to large effect (Lipka et al., 2015; Delfini et al., 2021).
In this study, we used a snap bean diversity panel combined with a GWAS approach to investigate the genetic basis of sulfentrazone tolerance. We hypothesize that the response of snap bean to sulfentrazone is genetically controlled. The objectives were to 1) determine the extent to which sulfentrazone tolerance exists in snap bean, 2) dissect the genetic architecture of sulfentrazone tolerance, and 3) identify genomic regions associated with snap bean tolerance to sulfentrazone.
Materials and Methods
Germplasm
A subset of the SNap bean Association Panel (SNAP) comprising 277 genotypes was used in this study (Hart et al., 2015). The panel represents the diversity of snap beans grown in the US over the last century, including bush and pole growth habits, fresh and processing markets, numerous pod sieve classes, and variations of several other traits (Supplemental Table 1).
The original SNAP population was genotyped using Genotyping by Sequencing (GBS) at the Cornell University Institute of Biotechnology Genomic Diversity Facility. Barcode of raw Illumina sequence reads was trimmed off and aligned to the reference Andean G19833 Phaseolus vulgaris v2.1 genome sequence (https://phytozome-next.jgi.doe.gov/info/Pvulgaris_v2_1) using Bowtie2 v2.4.1 (Langmead and Salzberg, 2012). The alignments in BAM format were sorted by SAMtools v1.9 (Li et al., 2009).
SNP discovery and genotype calling were conducted using NGSEP v3.3.0 (Next Generation Sequencing Experience Platform) pipeline (Perea et al., 2016) with G19833 Phaseolus vulgaris v2.1 as the reference genome (Schmutz et al., 2014). Maximum base quality score was set to 30, and the quality minimum was set to 40 for reporting a variant. All SNP markers detected with less than 50% missing values and a minor allele frequency (MAF) of at least 0.05 were retained to perform imputation with ImputeVCF module into NGSEP, which is a reimplementation of the Hidden Markov Model (HMM) implemented in the package fastPHASE (Scheet and Stephens, 2006). Annotation of variants was performed using the command Annotate by NGSEP. A total of 20,619 SNP was included in the analysis.
Field Experiment
A field experiment was conducted at the University of Illinois Vegetable Crop Farm near Urbana, IL, in 2019 and 2020. A different field was used each year. The soil was a Flanagan silt loam (fine, smectitic, mesic Aquic Argiudolls) averaging 3.5% organic matter and a pH of 5.9. The preceding crop was soybean. Two passes of a field cultivator equipped with rolling baskets were used to prepare the seedbed. Experiments were planted on June 27 and June 18 in 2019 and 2020, respectively.
The experimental design was a strip plot with three blocks (replications). Each block consisted of vertical strips of an herbicide treatment factor and horizontal strips of a genotype treatment factor (horizontal strips orthogonal to vertical strips). Herbicide treatment plots received one of two levels within 24 hours after planting: sulfentrazone at 860 g a.i. ha-1 or a nontreated control. The sulfentrazone rate, a two times recommended use rate in soybean for soil at the location, was chosen to represent an overlap of the highest possible practical rate for maximum weed control. Moreover, preliminary dose-response trials identified sulfentrazone at 860 g a.i. ha-1 would discriminate between sulfentrazone tolerant and susceptible genotypes (M. Williams, personal observation).
Genotype treatment plots consisted of single rows (76-cm spacing) of individual genotypes transecting both herbicide treatment strips. Each genotype by herbicide subplot was 2.4 m in length planted with 30 seeds to a depth of 2.5 cm.
Because the weather forecast on the day of herbicide application in 2020 indicated no rain was expected for the next ten days, 1.3 cm of water was applied with an overhead sprinkler irrigation system to incorporate the herbicide. At the time of crop emergence, an additional 0.6 cm of water was applied to loosen the soil and avoid seedling mortality from soil crusting.
Greenhouse Experiment
We used the phenotypic data from both years to select genotypes with contrasting response to sulfentrazone, and for which sufficient remnant seed was available. Navarro (highly tolerant) and Goldmine (sensitive) were selected. Seeds were separated using screens to obtain bulks of the largest and smallest 25% for each genotype. This procedure created four seed categories through combination of genotype and seed size class: Goldmine Extra-Small (GS), Goldmine Extra-large (GL), Navarro Extra-Small (NS) and Navarro Extra-Large (NL). We determined the average 100-seed weight for each category by taking four random samples of 100 seeds from the bulks. The screen sizes and average 100-seed weight of each of the categories are shown in Supplemental Table 2.
Seeds were germinated on moist paper towels for 5 days at 27°C before planting. Only seeds with an emerged radicle between 5 to 10 mm were used. Seeds were sown in 22cm x 22cm x 5cm (Length x Width x Height) flats filled with a soil:sand:perlite:Berger BM2 gemination mix in proportions 1:1:1:3. An eight-seed row of each seed category was planted per flat. The order of the seeds categories within each flat was randomized. After planting, flats were watered to soil saturation and drained by gravity. Herbicide treatments were applied one day after planting.
Treatments consisted of sulfentrazone applications at rates of 0, 430, 860, 1,720 and 3440 g a.i. ha-1 (i.e. 0, 1, 2, 4, 8X the recommended dose for soybean). Applications were made using a compressed air research sprayer (DeVries Manufacturing, Hollandale, MN) fitted with a TeeJet 80 015 EVS nozzle (TeeJet Technologies, Wheaton, IL) calibrated to deliver 185 L ha−1 at 275 kPa. Four flats were assigned to each treatment. Following application, plants were placed on greenhouse benches in four blocks, with each treatment present in a block in a randomized order. Thus, the design was a randomized complete block with four replications.
Greenhouse conditions were maintained at 28/22°C Day/night with a 16:8 h photoperiod. Natural sunlight was supplemented with mercury halide lamps to provide 800 µmol m−2 s−1 photon flux at the plant canopy. Flats were watered manually as needed.
Data Collection
Field Experiment
Prior to planting, seed weight (Seed Wt) was taken from a random sample of 100 seeds per genotype. The 100-seed weight of seed lots of both years were averaged to represent the seed weight of each genotype. The 100-seed weight was used as a proxy measurement of seed size (e.g. Giles, 1990; Roy et al., 1996; Navarro et al., 2018).
Three measures of snap bean response to sulfentrazone were determined three weeks after planting. Seedlings were counted to determine plant density (PD). This measure reflects a combination of germination and seedling establishment. At the same time, individual plant shoot biomass was determined. Three plants were randomly selected from each subplot and cut at the soil surface. Shoots were dried until constant weight to determine biomass plant-1 (BP). This measure gives an estimate of seedling growth. Since sulfentrazone appeared to affect both the emergence and growth of the crop, a cumulative measure of snap bean response was determined. Snap bean total plant biomass m-2 (TPB) was calculated by multiplying the number of plants per m2 in the plot by biomass plant-1. Traits measured in treated plots are indicated by the subscript ‘sulfen’ (e.g., PDsulfen), while those measured in control plots are indicated by subscript ‘control’ (e.g., PDcontrol). The level of tolerance of the genotypes to sulfentrazone was calculated from the above measures by expressing the values of the traits in the treated plots as percentage of the values in the control plots (e.g., Traitsulfen/Traitcontrol). Tolerance traits were named PDperc, BPperc and TPBperc.
Daily rainfall and temperature were obtained from a weather station located within 1 km of the experiments (Illinois State Water Survey, Champaign, IL). Growing degree days (GDD) were calculated using a base temperature of 7 C.
Greenhouse Experiment
Assessment of plant response in the greenhouse experiment was completed two weeks after planting. Plant density (PD) was measured by counting the number of emerged seedlings of each treatment. All seedlings were cut at the soil surface for each treatment and dried at 60°C. Average dry biomass per plant (BP) was obtained by dividing the total dry biomass of seedlings by the number of seedlings. The relative response of PD and PB (PDperc and BPperc, respectively) to sulfentrazone treatments was calculated by dividing the PD or BP value of each treatment by the control (PD or BP value at 0X dose) within each block.
Data Analysis
Field Experiment
Plant density, BP, and TPB were analyzed by ANOVA using the aov() function in R studio using the following model:
where Yijlk is the trait value of the plot in the kth block in the lth year, with the ith genotype for the jth treatment. µ is the overall mean of the experiment, Gi is the main effect of the ith genotype, Tj is main effect of the jth treatment, Yl is the main effect of the lth year, (GY)il is the interaction effect between the ith genotype and the lth year, B(Y)k(l) is the effect of the kth block nested within the lth year and εijlk in the error term associated with plot in the kth block in the lth year with the ith genotype that received the jth treatment. All effects were declared significant at α=0.05.
Broad-sense heritability for PD, BP and TPB was calculated as function of variance components, as described in Holland et al., 2002. Variance components were obtained by fitting a linear model with the lm() function using the model above. Chip-based heritability was automatically calculated by the program GAPIT (Lipka et al., 2012), as implemented in the HAPPI-GWAS package (Slaten et al., 2020). For traits PDperc, BPperc and TPBperc, variance components were obtained using the model:
Pearson correlation analysis between morphological crop characteristics and tolerance to sulfentrazone was conducted in SYSTAT 13 (SYSTAT Software Inc., San Jose, CA). Correlations were subjected to Bonferroni corrections to account for multiple testing (Neter et al., 1996). Pearson correlations between traits and across years were calculated using the procedures cor and Rcorr of package Hmisc (R studio). Data were visualized using the package Corrplot.
Greenhouse experiment
Analysis of variance was performed for PDper and BPperc using the following model:
where Yiwjk is the trait value of the row with the wth seed size class of the ith genotype, located in the kth block for the jth treatment dose. µ is the overall mean of the experiment, Gi is the main effect of the ith genotype, Sw is the main effect of the wth seed size level, Tj is the main effect of the jth year, (GS)iw is the interaction of the ith genotype and jth treatment, (GT)ij is the two way interaction effect between the ith genotype and the jth treatment, Bk is the main effect of the kth block and εiwjk is the random error term associated with the row in the kth block in the jth year with the wth seed size of the ith genotype.
Dose-response curves for each seed category were calculated using a Weibull model to fit the PDperc and BPperc values observed over the herbicide treatment levels. The model used was the four-parameter Weibull-1:
where y is the PD or BP as percentage of nontreated control at the x dose of the herbicide. The parameters c and d are the lower and upper horizontal asymptotes, respectively. The parameter b is proportional to the slope of the dose–response curve at the dose e, and parameter e is the inflection point of the dose–response curve.
Analyses were carried out in R studio. Function lm() was used to fit the linear model and Anova() function from the car package was used to calculate analysis of variance. As the data was balanced, Type II ANOVA was used. Function drm() of the package drc with the non-linear function W1.4 was used to calculate the dose-response curves (Ritz et al., 2015). Parameter c was fixed to 0. Effective doses to achieve 50% reduction for PDperc (lethal dose 50% = LD50) and BPperc (growth reduction 50% = RG50) were estimated from the dose-response curves using the function ED(). All effects were declared significant at α=0.05.
Data Preparation and GWAS Analysis
Normality of the data was assessed using the R rstatix package, Shapiro_test(). Box-Cox transformation was applied when necessary (Box and Cox, 1964). Lambda values for each trait were calculated using the function boxcox() of the MASS package (R studio). For traits with negative effect values, a constant was added to the data to allow for calculation of Lambda, and the transformation was applied to the raw values. Transformed datasets were used to calculate the best linear unbiased predictions (BLUPs) to reduce the environmental influence. BLUPs were determined for the tolerance traits using the function lmer() of the lme4 package, with genotype and block as random effects in the model for the individual year analysis, and genotype, year, genotype by year interaction and block within year as random effects for the join analysis. The conditional means of the genotypes was extracted using the function ranef () of the lm4 package.
The best linear unbiased predictions were used as input for HAPPI-GWAS and MrMLM programs. The degree of correlation with population structure varies according to the trait; therefore, forward model selection using the Bayesian information criterion (BIC) was used to determine the optimal number of principal components (PCAs) to include in the GWAS models for each trait. The optimal number of PCA for inclusion in the model was two PCA for BPcontrol (2020) and Seed Wt. For all other trait/year combinations, no PCA were included in the model. The analysis was run independently for each year, and jointly for both years.
As a correlation for seed weight and tolerance traits was observed in the field experiments, and the seed weight effect was confirmed in the greenhouse experiment, GWAS analysis was conducted with and without Seed Wt as covariate to detect tolerance-associated loci independent of the effect of Seed Wt.
The statistical model used in the GWAS was the unified mixed linear model (MLM; Yu et al., 2006), as implemented in HAPPI-GWAS, which was fitted at each SNP. The Benjamini and Hochberg (1995) procedure was used to control from multiple testing at a genome-wide false discovery rate of 5%. The kinship matrix was automatically calculated by GAPIT using the VanRaden method (VanRaden, 2008). The analysis was also performed using multi-locus random-SNP-effect models mrMLM, FASmrEMMA, pLARmEB, and pKWmEB from the MrMLM package (Zhang et al., 2020) to further validate the SNPs identified with the MLM model. Associations were considered significant if the FDR adjusted p-value was ≤ 0.1 for the MLM model, or by logarithm of the odds score of 3 for the MrMLM package. Description of the effects of significant SNPs were based on the results of the MLM model, with an indication as to whether the multi-locus random SNP-effect models also identified the SNP. While the determination of the significant SNPs was done with the transformed data, determination of the allelic effect was based on the raw data for ease of interpretation.
Haploblock Analysis
The extent of linkage disequilibrium surrounding the identified SNPs was determined using the option extractHaplotype (Barrett et al., 2004) in HAPPI-GWAS, with a window size of 1000kb. Input gene annotation file was downloaded from Phytozome 13 (Phaseolus vulgaris v2.1, DOE-JGI, and USDA-NIFA, http://phytozome.jgi.doe.gov/). Genes contained within haploblocks were identified with the searchGenes option.
Concordance With Previously Identified Genomic Regions
A literature search was conducted for QTL or GWAS studies for related traits to those of this study in P. vulgaris, G. max, M. truncatula, and other legumes. Traits included 100-seed weight, germination and seedling vigor traits under normal and stress conditions, biomass accumulation, and plant height. Genomic synteny and gene homology was used to compare the segments and genes from literature and the intervals identified in this study.
Candidate Genes Putative Function
The functional annotations of the genes present in the GWAS intervals were downloaded from the Phytozome 13 database using the Biomart tool (https://phytozome-next.jgi.doe.gov/biomart/martview/11d06b77024149363ecfbd4a86929773). Putative function, experimental evidence, and phenotype of mutants for the Arabidopsis homologs of the Phaseolus genes were obtain from the Tair database (Arabidopsis.org).
Results
Environmental Conditions
While growing degree days from planting to three weeks later were relatively similar across years, water supply was different. The experiment in 2020 had about 30% more water than in 2019 (Figure 1). These differences were most pronounced during crop emergence, 4 to 7 days after planting, driven by rainfall a few days after the irrigation event.
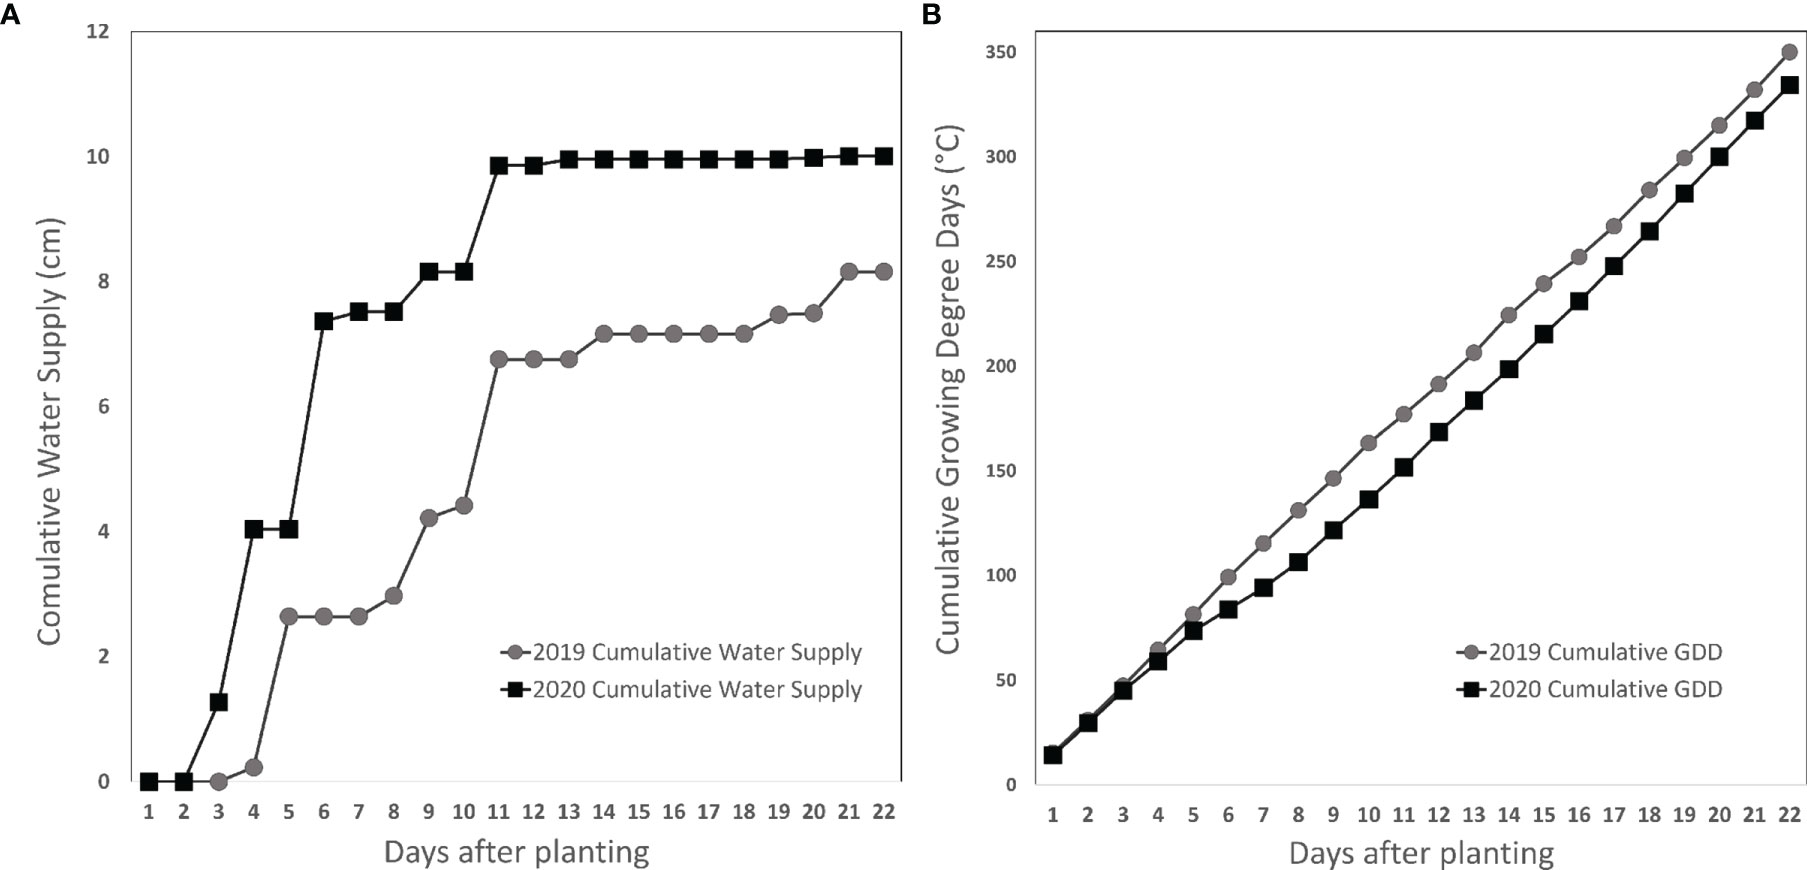
Figure 1 Cumulative water supply (rainfall + irrigation, (A) and growing degree days (B) three weeks after planting in 2019 and 2020 in a field trial near Urbana, IL. Circles markers: 2019. Square markers: 2020.
Distribution of Traits in the Association Panel
Phenotypic values were evaluated by year to analyze their distribution. Normality tests failed to reject the assumption of normality for Seed Wt. Traits PDcontrol, BPcontrol, and TPBcontrol presented slight deviations from the normal distribution in both years. Traits PDsulfen, BPsulfen, TPBsulfen, and their values relative to the nontreated control (PDperc, BPperc, and TPBperc) were skewed to the right, reflecting the sensitivity of most entries to sulfentrazone. For all traits, the values in 2020 were lower than those in 2019, suggesting that the 2020 environment was less favorable for crop growth. The greater water supply in 2020 likely contributed to greater herbicide bioavailability, compared to 2019. Analysis of variance confirmed the effect of genotype, treatment, and year. The effect of environment on the genotype response is evident in the significant genotype by year interactions (Table 1).
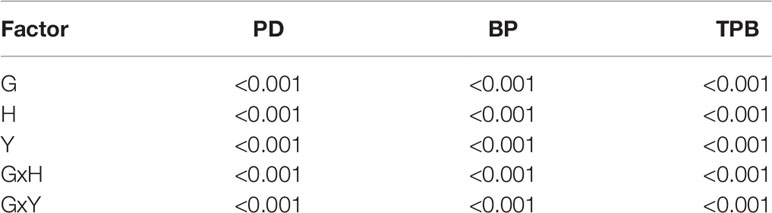
Table 1 Significance (P) of main effects of snap bean genotype (G) and herbicide treatment (H), year (Y) and their interaction (GxH) on crop response in the field experiment.
Correlation of Traits Across Years
Despite year-to-year variation, all traits were positively correlated across years (Figure 2). The strength of the relationship was higher for traits in the control (r = 0.97, 0,77, and 0.62 for Seed Wt, PDcontrol, and BPcontrol respectively), medium for traits that measured absolute values in the sulfentrazone treatment (r = 0.60, and 0.61 for PDsulfen and BPsulfen, respectively) and lower for relative measures of herbicide tolerance (r = 0.50 and 0.35 for PDperc and BPperc, respectively). It is possible that environment had a higher effect on herbicide tolerance traits than on other plant traits. Indeed, it is known that in soybean, the response of cultivars to sulfentrazone applied preemergence is influenced by soil moisture (Swantek et al., 1998). Wetter growing conditions may have increased injury in partially tolerant genotypes in 2020 compared to 2019, resulting in lower correlations between years.
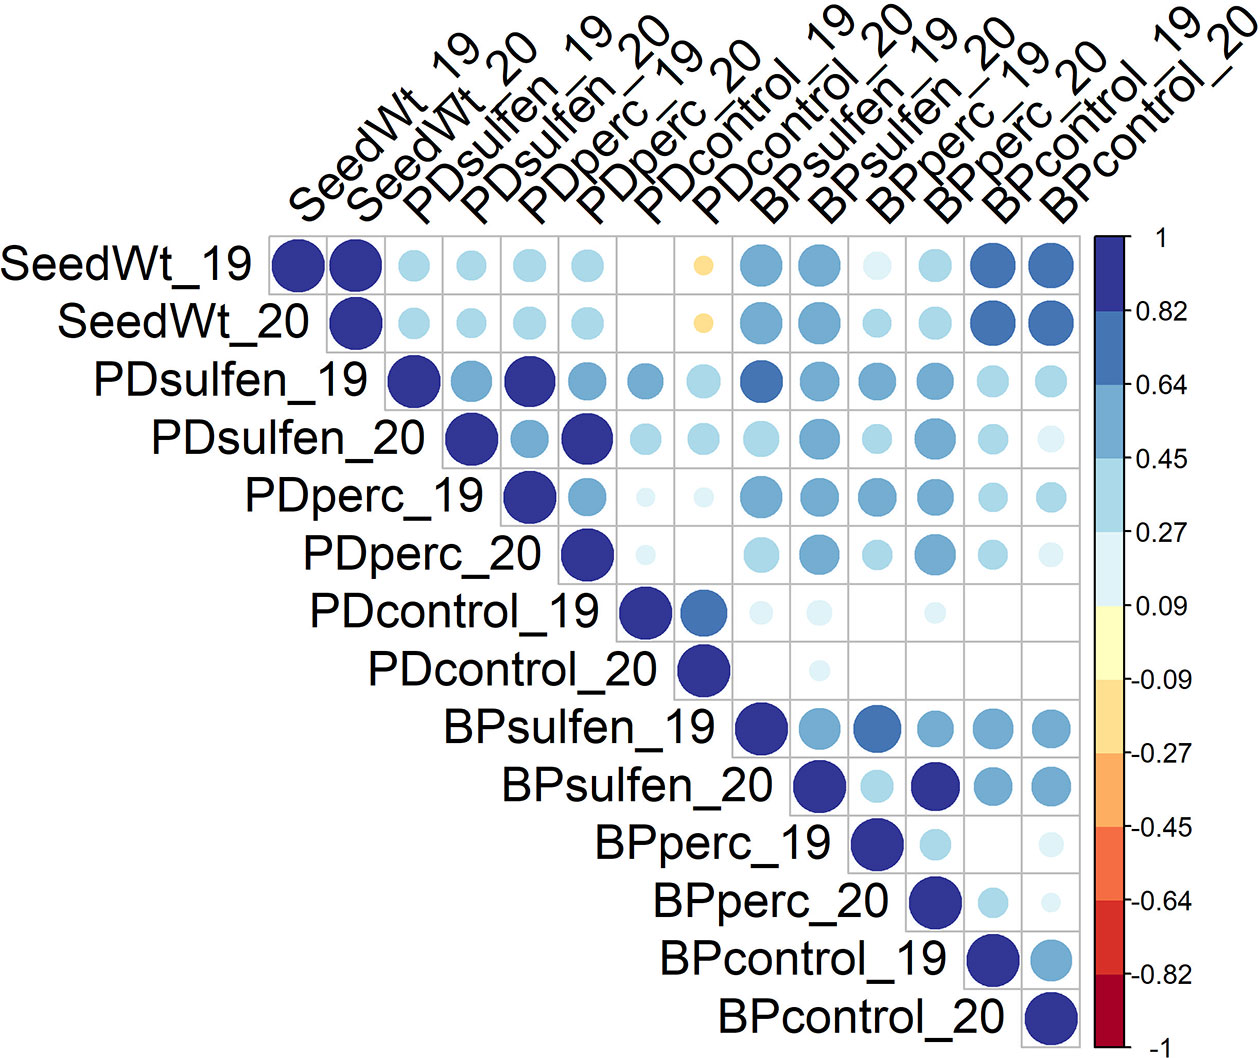
Figure 2 Correlations among traits across years. The color and size of the circle depict the strength of the relationship. Only correlations with p ≤0.05 are shown.
Correlation Among Traits
Morphological characteristics, apart from Seed Wt, were not correlated with tolerance to sulfentrazone (Supplemental Table 3). Seed Wt had a positive correlation with all PD and BP measures except for PDcontrol (Figure 2). The strength of the relationship was highest for BP related variables (r = 0.72 for BPcontrol, r=0.63 for BPsulfen, and r=0.33 for BPperc). PD variables had a correlation of r= 0.32 for PDsulfen and r=0.37 for PDperc. PD measures under herbicide treatment (PDsulfen and PDperc) and BP measures under herbicide treatment (BPsulfen and BPperc) were positively correlated in both years. In contrast, PDcontrol and BPcontrol were not significantly correlated with each other. This may suggest that genetic factors driving germination and growth in the control treatment are primarily independent from each other, while common genetic factors may influence germination and growth in the sulfentrazone treatment. Positive correlations between the traits in both the control and sulfentrazone treatment suggest seedling vigor contributes to sulfentrazone tolerance.
Response of Snap Bean Genotypes to Sulfentrazone
Genotypes exhibited varying degrees of sensitivity to sulfentrazone, with differences observed in both plant density and biomass. As such, some genotypes were considered highly tolerant, some had an intermediate response, and the majority were sensitive. The ten most tolerant and sensitive genotypes are shown in Tables 2, 3, respectively.
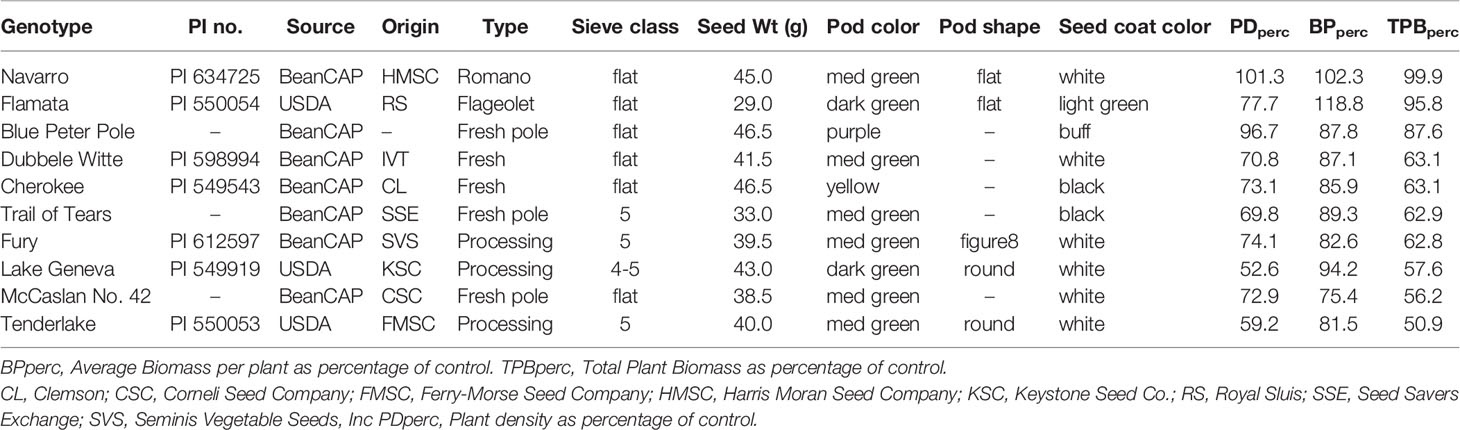
Table 2 List of snap bean genotypes in the SNAP diversity panel most tolerant to sulfentrazone.
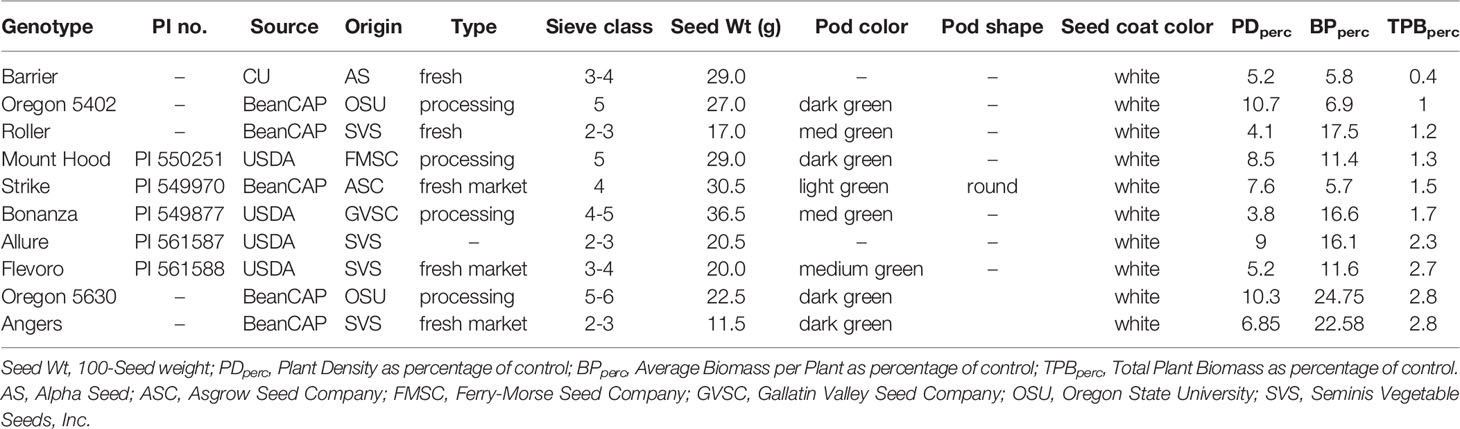
Table 3 List of snap bean genotypes in the SNAP diversity panel most sensitive to sulfentrazone.
Trait Heritability
The broad-based heritability and the portion of the phenotypic variation that can be explained by the genotyped genetic markers (chip-based heritability) of the traits is shown in Table 4. Broad based heritability was higher than the proportion explained by the significant markers for all traits, indicating incomplete identification of the genomic regions controlling the trait.
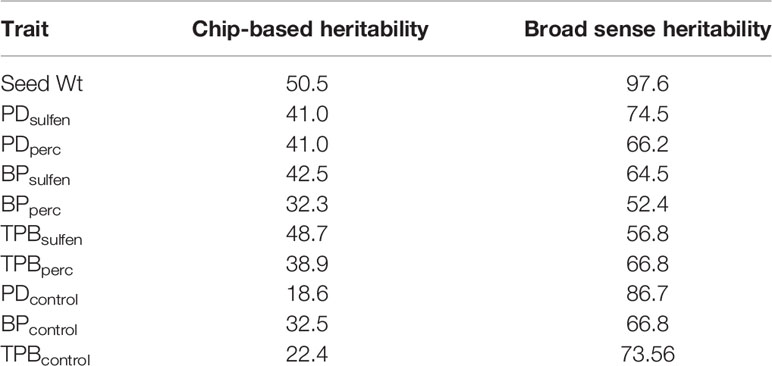
Table 4 Estimated heritability as percentage of total variability observed.
Greenhouse Experiments on the Effects of Seed Size and Genotype on Tolerance Traits
All main effects were statistically significant, indicating that at least for the tested genotypes, both seed size and genotypes influence the tolerance to sulfentrazone over a wide range of doses (Table 5).
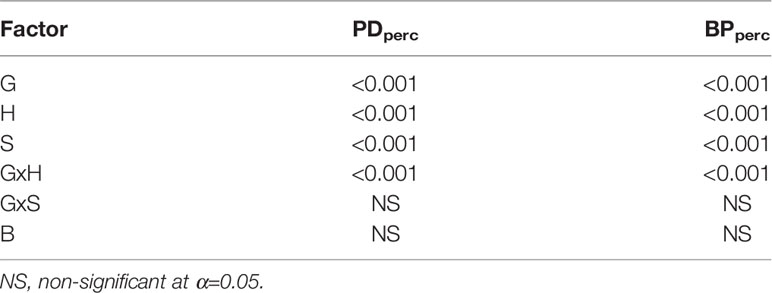
Table 5 Significance of main effects of snap bean genotype (G), seed size (S) and herbicide dose (H), Block (B) and their interactions on response variables for genotypes Goldmine and Navarro and extra-large and extra small seed size classes.
Dose-response was influenced by genotype and seed size (Figure 3). Genotype Navarro and seed size extra-large within genotype, were the least injured across a range of sulfentrazone doses. LD50 values were calculated to be 3,477 (NL), 2,997 (NS), 2,085 (GL) and 1,071 (GS) g sulfentrazone ha-1 (Supplemental Table 4). Calculated extra-large seed to extra-small seed (L/S) LD50 ratio for Goldmine was 1.95, indicating that for the genotype Goldmine, it requires double the dose of active ingredient to cause 50% mortality to the extra-large seed category compared to the extra-small. GR50 values were calculated to be 3,399 (NL), 3,066 (NS), 1079 (GL) and 709 (GS) g sulfentrazone ha-1 (Supplemental Table 4). Calculated L/S GR50 ratio for Goldmine was 1.52, indicating that for the genotype Goldmine, it requires 50% more active ingredient to cause 50% reduction in seedling growth for the extra-large seed compared to the extra-small. Calculated L/S ratio for LD50 and RG50 in the Navarro genotype the were 1.16 and 1.11 respectively, indication that for this genotype, the increases in seed size had a positive but small effect on increasing tolerance. These results indicate that at least for some genotypes, larger seeds have increased tolerance, reflected in the higher amount of active ingredient required to reach LD50 and GR50.
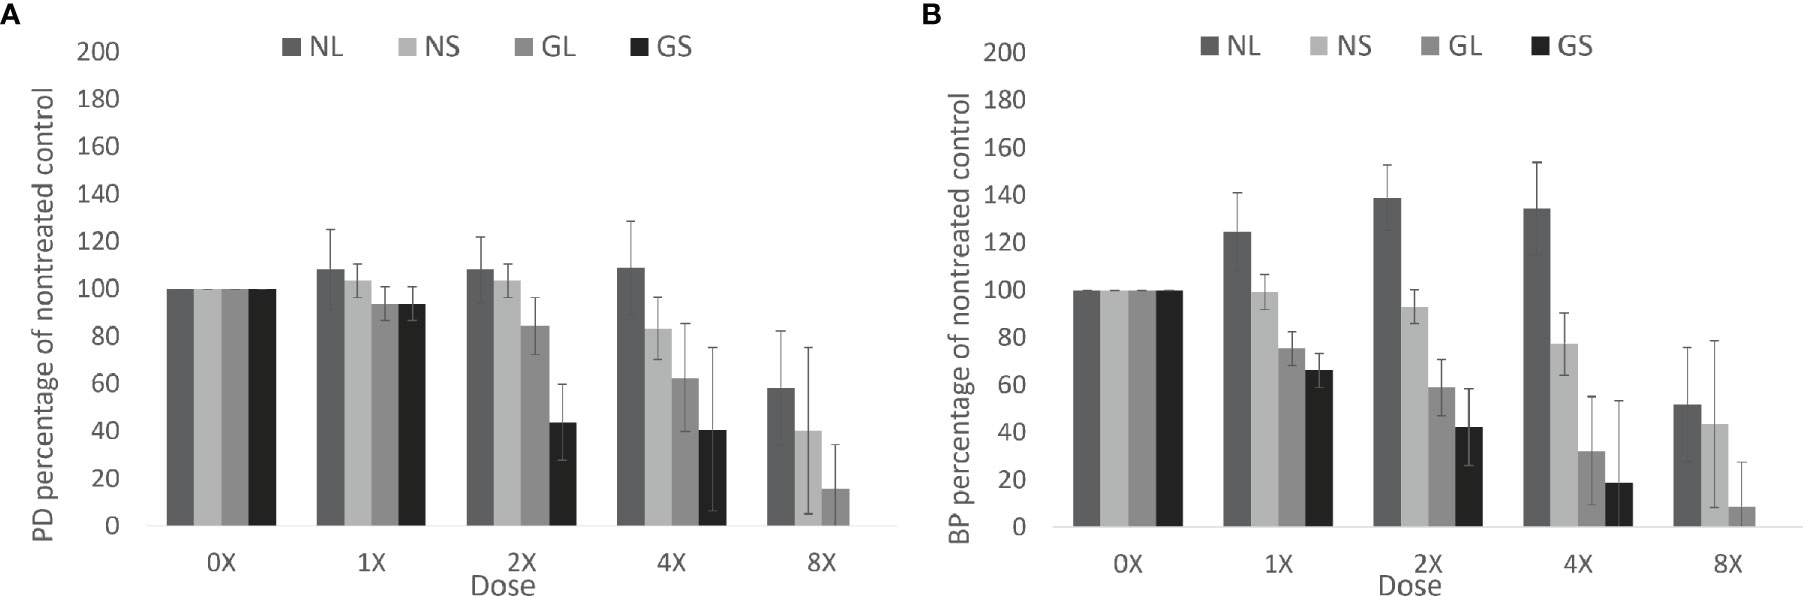
Figure 3 Effect of genotype and seed size on response of snap bean to sulfentrazone dose. (A) Plant density as a percentage of the nontreated control. (B) Dried biomass per plant as a percentage of the nontreated control. NL, Navarro seed class extra-large; NS, Navarro seed class extra-small; GL, Goldmine seed class extra-large; GS, Goldmine seed class extra-small. Error bars represent one standard deviation from the mean of the category and dose combination.
To determine if there were differences in the response between the two genotypes independently of seed weight, we compared the Goldmine extra-large and Navarro extra-small categories. These two seed categories have comparable 100-seed weight of 28.5g and 29.5g, respectively. The LD50 of NS was 2,999g and that of GL was 2,086g (NS/GL ratio of 1.44). The GR50 of NS was 3,066g and that of GL was 1,079 (NS/GL ratio of 2.84). Therefore, other genetic factors independent of seed weight effect also play a role in the tolerance to sulfentrazone.
Genome-Wide Association Studies
Seed Weight
After the GWAS analysis, we selected SNPs with the lowest non-adjusted p-value. SNPs identified in both years and selected by more than one model were used to propose candidate genes. We evaluated our approach using the trait Seed wt. Seed size is an important quality trait in snap bean breeding due to its influence on consumer preference and harvest window for immature pods (Myers and Baggett, 1999; Singh and Singh, 2015). In general, larger seed size is detrimental for pod quality. Seed weight is an important component of yield in crops and, as such, there are numerous studies on the genetics underlying the trait. We compared our results with the genomic regions identified in previous studies in common bean and soybean. We found 58 regions associated with Seed Wt. Of those, 24 are on or near regions and genes previously identified as involved in determining seed weight in other studies (Supplemental Table 6). For example, the MTA detected in Chr07: 5431629 spans a region near the cluster of genes that code for phaseolin seed storage proteins (Nodari et al., 1992; Koinange et al., 1996; Park et al., 2000). Phaseolin has been demonstrated to be associated with one-hundred seed weight, seed width, and seed length (Blair et al., 2009). Therefore, we believe our approach allows us to detect relevant genomic regions for the sulfentrazone tolerance traits studied.
Plant Density and Biomass Accumulation Under Control and Sulfentrazone Treatments
The GWAS analysis for the response traits not using seed weight as covariant resulted in multiple marker-trait associations (MTAs) (Supplemental Tables 7, 8), but the majority were not significant at the genome-wide false discovery rate of α = 0.1. We are reporting the SNPS significant with a non-adjusted p-value ≤0.005. As the haploblocks for each significant SNP were determined based on the linkage disequilibrium between itself and neighboring SNPs, only a representative SNP within a haploblock interval was selected to represent the genomic interval covered under the haploblock. Overlapping haploblock intervals were considered to belong to the same genomic region for the purpose of candidate gene search. Shaded regions represent SNPS that were selected based on occurrence in both years and identification under multiple models.
For plant density, there were a total of 150 MTAs with a non-adjusted p-value ≤0.005 (Supplemental Table 6). Seven, thirteen, and seven MTAs were detected independently in both years and in joint analysis for PDcontrol, PDsulfen, and PDperc, respectively. Sixteen MTAs were detected for both PDcontrol, and either or both PDsulfen and PDperc. On average, each representative marker explained 2.0 to 4.0% of the phenotypic variance (PV) determined as the difference in the R2 of the model with and without the SNP.
For BP, a total of 167 MTAs with a non-adjusted p-value ≤ 0.005 (Supplemental Table 7). Eight, four, and three MTAs were detected in both years independently and in joint analysis for BPcontrol, BPsulfen and BPperc, respectively. Twenty MTAs were associated with both BPcontrol, and both or either PDsulfen and PDperc. Two MTAs were associated with BP under all conditions. Each representative marker explained 1.5 to 3.4% of the PV.
Colocalized GWAS signals were identified between the measured traits (Supplemental Table 8). There were 41 MTAs that were associated with both PD and BP under at least one condition. For the traits measured under sulfentrazone treatment or as percentage of control, there were 35 colinear MTAs between PD and BP. Of those, 12 were also detected in either or both PD and BP under control conditions, with the remaining 23 detected only under sulfentrazone stress. Four MTAs were detected for PD and BP under control conditions, and PD under sulfentrazone stress. Two MTAs were detected in BP under control conditions and PD under sulfentrazone stress. For the MTAs detected in the control condition only, there was no collinearity between the regions associated with PDcontrol and BPcontrol.
We detected a positive correlation between Seed Wt and both PD and BP in the sulfentrazone treatment. In the control treatment, Seed Wt was negatively correlated with PD in 2020 and positively correlated with BP in both 2019 and 2020. Reflecting these phenotypic correlations, there are nine colinear MTAs between PDsulfen and/or PDperc, and Seed Wt, and 12 colinear MTAs between BPsulfen and/or BPperc and Seed Wt. Six MTAs were colinear for both PD and BP under at least one condition and Seed Wt. For the MTAs detected in the control only, there were no colinear MTAs between PD and Seed Wt, and seven MTAs between BP and Seed Wt (Supplemental Tables 6-8).
Chromosomes 1 and 4 contain most MTAs collinear between PD and BP traits. Four and 12 collinear MTAs are in chr:1 5474118-6732013 bp, and chr1:44327992—50793332 bp, respectively. Eight colinear MTAs are in Chr4: 1593169-3102077. The sulfentrazone tolerance MATs in regions chr:1 5474118-6732013 and Chr4: 1593169-3102077 were not associated with the Seed Wt trait, making them suitable to be used for breeding.
MTAs and Candidate Genes From Literature
We found multiple genomic regions associated with sulfentrazone tolerance, therefore, it is possible that multiple mechanisms contribute to the observed tolerance. Based on the findings that some genomic regions are associated with the traits under both the control and sulfentrazone treatment, general stress tolerance genes may be involved in the tolerance to sulfentrazone. We were interested in stresses that result in oxidative stress in the plant, such as drought, salinity, and flooding stresses. Several MTAs from this study were near genomic segments associated with multiple stresses (Supplemental Table 9). Such QTL hotspots for multiple stress resistances are also observed in other species (e.g., Abdel-Ghani et al., 2019).
The candidate genes for sulfentrazone tolerance under the TSR hypothesis are the genes encoding the PPO enzymes. The genomic location of those genes in the Phaseolus genome are Chr01: 33,098,528-33,103,479, and Chr07: 18,072,151-18,094,811 for PPO1 and PPO2, respectively. There were not polymorphic markers in the genic region of either gene. The closest SNPs upstream and downstream the genes were not detected as significant under the conditions of our analysis. The closest SNP significantly associated for PDsulfen in both years is 212,728 bases downstream PP1, and its interval does not span the PPO gene. There were no other consistently associated SNPs for sulfentrazone tolerance traits within 500K of either of the PPO genes’ position.
Proposed Candidate Genes for Sulfentrazone Tolerance Based on the Location of the GWAS Peaks Independently of Seed Weight
GWAS analysis was conducted using Seed Wt as covariant to identify regions that were associated with tolerance independently of seed weight (Supplemental Tables 10, 11). After filtering the MTA for regions that were significant for both PDperc and BPperc, four genomic regions were selected for further study (Supplemental Table 12). These regions are most likely to harbor genes influencing tolerance. Region Chr01: 5,474,118- 6,218,687 contains three significant SNPs that have an allelic change effect between 7.7 and 8.2 percentage points for PDperc and 9.1 and 11.5 percentage points for BPperc. Region Chr01: 50,593,075 – 50,793,332 contains three significant SNPs that have an allelic change effect between 3 and 8.3 percentage points for PDperc and 9.5 and 9.6 percentage points for BPperc. Region Chr04: 1,593,169 – 3,102,077 contains 11 significant SNPs that have an allelic change effect between 3.7 and 10.1 percentage points for PDperc and 5.3 and 10.7 percentage points for BPperc. Region Chr08: 52,620,196 – 53,099,410 contains one significant SNP that has an allelic change effect between 4.2 and 5.4 percentage points for PDperc and 5.5 and 6.7 percentage points for BPperc.We used the models for xenobiotic detoxification and oxidative stress tolerance from Edwards et al. (2011), (Cavé-Radet et al., 2020), and Rigon et al. (2020), and the putative functions and functional domains of the genes found in the intervals to identify genes with possible roles in the mechanisms of tolerance. Places in the sulfentrazone tolerance model in which the genes identified in the GWAS intervals may have a role is shown underlined in Figure 4. Gene names and putative function are shown in Supplemental Table 12. Further studies are needed to confirm their involvement in tolerance mechanisms and their specific roles.
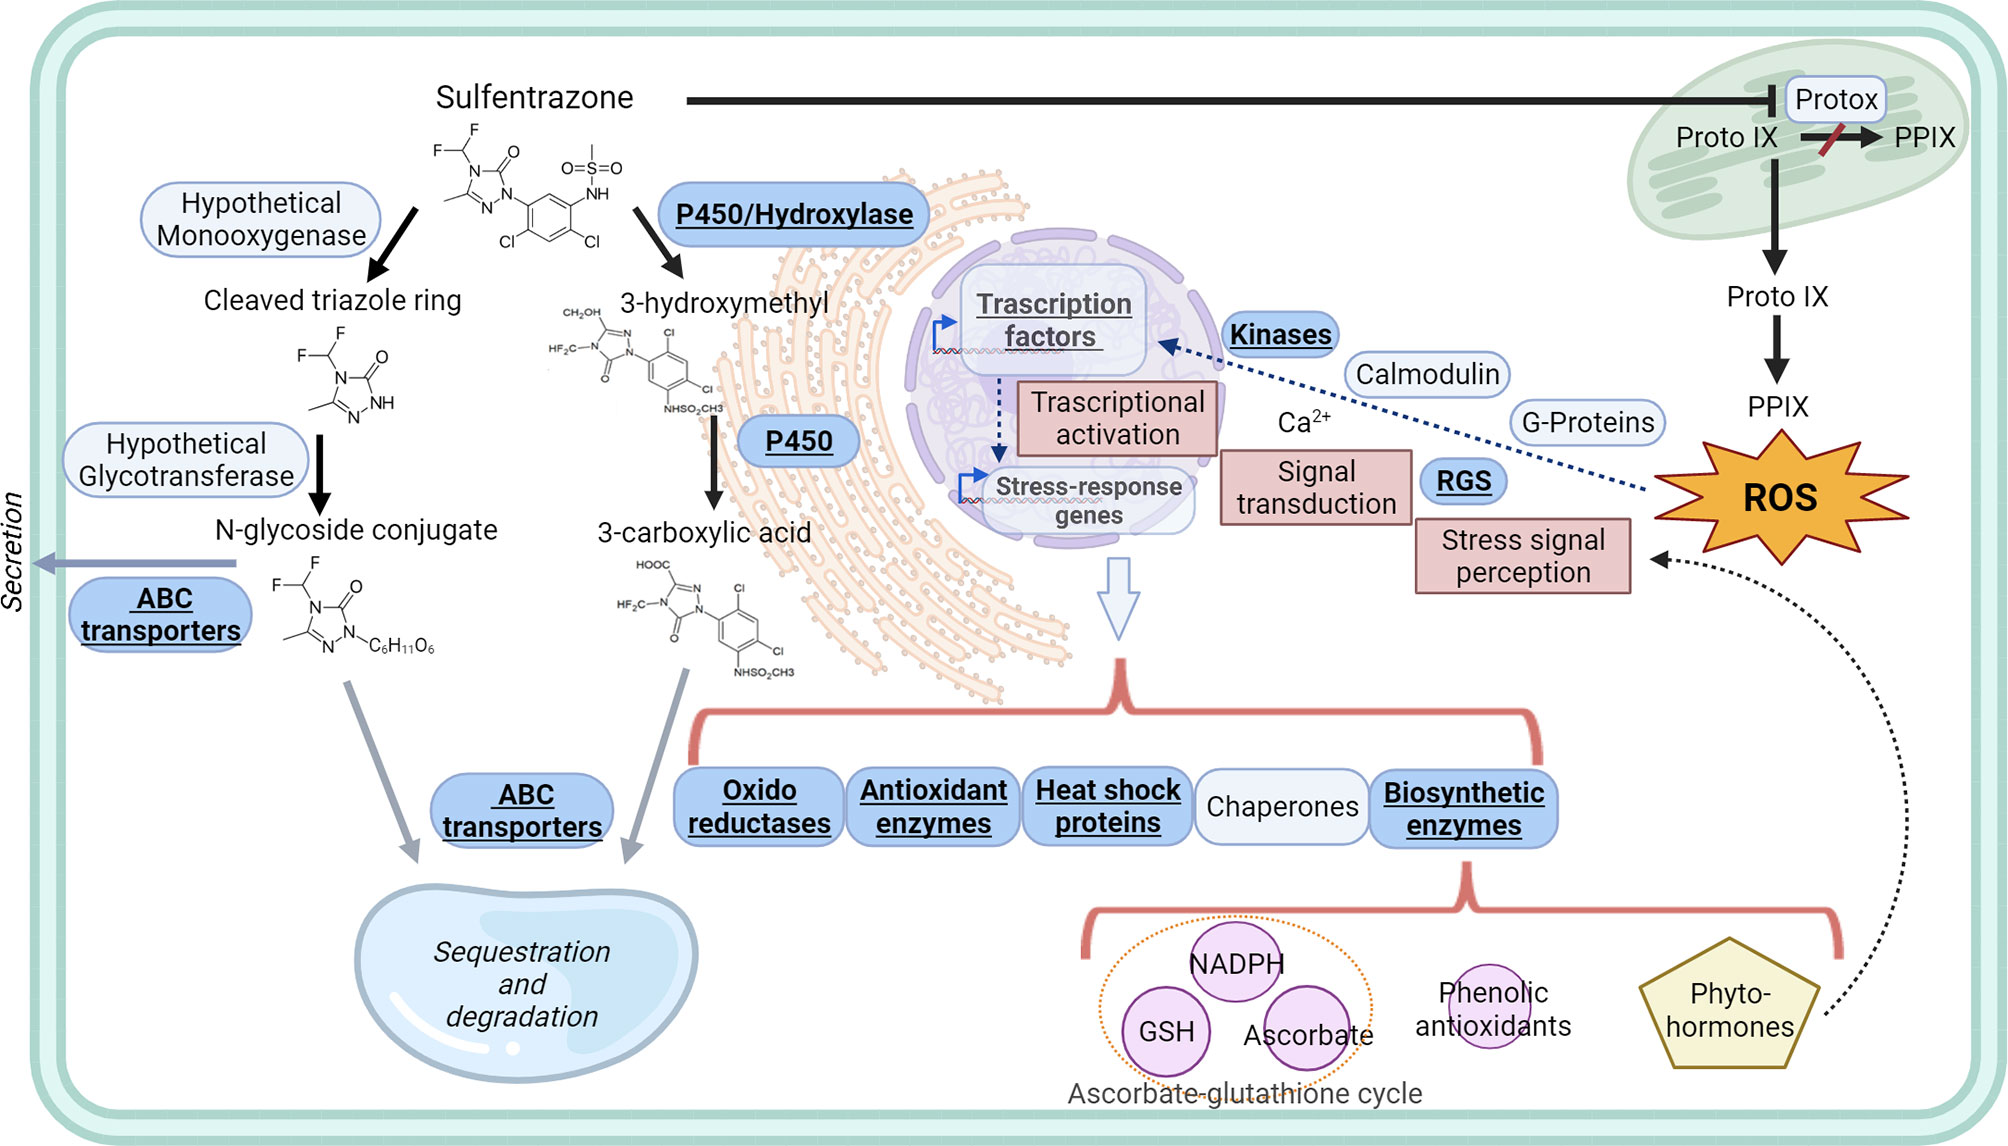
Figure 4 Tolerance to sulfentrazone is mediated by NTSR. Left side of the figure: Possible mechanisms and gene products involved in the transformation, transport, and sequestration of sulfentrazone and its metabolites. Solid black arrows show likely metabolic pathways of experimentally observed metabolites in plants. Grey solid arrows show excretion and sequestration of xenobiotics not yet experimentally confirmed for sulfentrazone. General mechanisms of plant response to oxidative stress is shown in the right side of the figure. Possible roles of the products of the genes identified in the GWAS analysis are shown within blue boxes in bold font. Sulfentrazone metabolic degradation information from Aizawa and Brown, 1999, and Dylan et al, 1997. General herbicide detoxification and sequestration information from Gaines et al., 2020; ABC transporter roles from Kang et al., 2011, Conte and Lloyd, 2011; Kyle and Vogt, 2017; and Li and Fengler, 2017. Xenobiotic detoxification models from Edwards et al., 2011 and Cavé-Radet et al., 2020. ROS response models and information from Urano et al., 2013; Demidchik, 2015; and Dumanović et al., 2021. ABC transporters, ATP-binding cassette transporters; GSH, Glutathione; NADPH, Nicotinamide adenine dinucleotide phosphate; P450, Cytochrome P450 enzyme; PPIX, Protoporphyrin IX; Proto IX, Protoporphyrinogen. IX, RGS, Regulator of G-protein; ROS, Reactive oxygen species.
Discussion
At a rate equivalent to a 2X use rate in soybean, sulfentrazone is injurious to snap bean. On average, sulfentrazone decreased plant density 55% and biomass per plant 39%, respectively, relative to the nontreated control. The extent of injury varied between years. Reductions of 42% and 26% for plant density and biomass per plant, respectively, were observed in 2019, compared to reductions of 64% and 48%, respectively, in 2020. This shows an environmental influence on crop injury. Previous studies in soybean found crop injury from sulfentrazone varies with environmental conditions, including soil moisture and temperature (Swantek et al., 1998; Taylor-Lovell et al., 2001). Wet soils may increase incidence of injury due to increased bioavailability of sulfentrazone. The increased injury we observed in 2020 compared to 2019 may be due to the higher soil moisture observed in 2020. Currently, sulfentrazone is not registered for use in snap bean. Prior to supporting an herbicide for a specialty crop, sufficient product performance and crop safety data are required (Kunkel et al., 2008). Our research demonstrates that tolerance to sulfentrazone exists in snap bean; however, this tolerance at 2X use rates for soybean is limited to a handful of cultivars. Although sulfentrazone is unlikely to be a viable herbicide for waterhemp control in snap bean in the near future, investigation of the genetic basis for this sulfentrazone tolerance contributes to the broader, mechanistic understanding of plant response to xenobiotics in the environment.
Snap bean tolerance to sulfentrazone is at least partially controlled by genetic factors. Tolerance was heritable and some snap bean entries were consistently tolerant to sulfentrazone. For five of the most tolerant entries, average total biomass reduction was less than 19%. Multigenic traits are strongly affected by the environment (Lynch and Walsh, 1998). It is possible that the tolerance observed is controlled by multiple genes, and the most tolerant genotypes represent the pyramiding of multiple tolerance alleles. Results of this study suggest that highly tolerant entries can protect against injury under varied environmental conditions. The genetic variability present in the snap bean panel can be used to further increase sulfentrazone tolerance.
Snap bean market classes are dictated mainly by pod shape and plant growth habits. We did not find a differential response to sulfentrazone due to pod characteristics, seed color, or plant growth habits. Therefore, market class is not a predictor of genotype tolerance to sulfentrazone in snap bean. In contrast, previous studies in dry bean have found differential response of market classes to several herbicides including flumioxazin and sulfentrazone (Urwin et al., 1996; Renner and Powell, 2002; Soltani et al., 2003; Soltani et al., 2004; Soltani et al., 2005; Wilson, 2005; Soltani et al., 2006; Hekmat et al., 2007). For dry bean, market class is determined by a combination of seed color, shape, and size. Larger-seeded cultivars are among the most tolerant in previous studies. This trend is evident in Viecelli et al. (2021), which determined that medium (25 to 40 g/100 seeds) to large seed size (>40 g/100 seeds) dry bean genotypes were more tolerant to sulfentrazone than smaller seed size classes.
In agreement with (Viecelli et al., 2021), seed weight was positively correlated with sulfentrazone tolerance in the panel. The link between seed weight/size and herbicide tolerance is observed in other species and herbicides. In ryegrass, seed weight was positively correlated with seedling vigor and survival to multiple postemergence herbicides (Maity et al., 2021). The mechanism underlying the correlation between seed weight and herbicide tolerance is not known. Seed size significantly impacts seedling emergence and establishment in multiple plant species and environmental conditions (Guillemin and Chauvel, 2011; Čanak et al., 2020). Generally, larger seed size results in more vigorous seedlings with increased capacity to adapt to stresses (Winn, 1988; Pluess et al., 2005; Ambika et al., 2014). Therefore, the correlation between seed size and herbicide tolerance may be related to seedling vigor. Larger seedlings may be able to withstand injury, allowing for herbicide metabolization and recovery. In this panel seed weight is confounded with genotype. We evaluated the effect of seed weight on the response to sulfentrazone by testing pools of viable seeds of contrasting sizes within the same genotype. For two genotypes, the larger seed class conferred greater sulfentrazone tolerance. However, seed size alone does not account sulfentrazone tolerance. Therefore, genetic factors conditioning sulfentrazone tolerance are likely a combination of those driven indirectly by seed size/weight and those acting directly on the metabolism of the herbicide or ameliorating its damage.
Herbicide tolerance through TSR often results in a fitness penalty for the plant (Vila-Aiub et al., 2009; Torres-García et al., 2015). In this study, tolerance to sulfentrazone was positively correlated with establishment and growth in the nontreated control. This suggests that general mechanisms, conferring seedling vigor and general abiotic stress tolerance, play a role in conferring tolerance to sulfentrazone. The scenario of general stress tolerance is more plausible under the hypothesis of NTSR. Enhanced metabolism would degrade the herbicide before it becomes lethal to the plant. Increased hormone levels may result in higher germination rates and seedling vigor, allowing more plants to escape herbicide toxicity. Such general stress tolerance mechanisms have been postulated for sulfentrazone tolerant populations of wild oat that showed cross-tolerance to several herbicides, despite no previous exposure to sulfentrazone (Mangin et al., 2016). Sulfentrazone is labeled in soybean and considered safe for preemergence application. The basis of soybean tolerance to sulfentrazone is due to rapid metabolism of the herbicide and increased ability to tolerate herbicide induced oxidative stress (Dayan et al., 1997)
Results of the GWAS analysis further strengthen the hypothesis of NTSR. Multiple genomic regions are associated with tolerance and none of them are colocalized with the PPO genes in snap bean. The observed phenotypic correlations are reflected in the detection of genomic regions associated with more than one trait. Absolute measures such as PDsulfen, BPsulfen, and TPBsulfen are expected to reflect both genetic factors related to the seedling establishment and growth in the control as well as genetic factors related to sulfentrazone tolerance. Many genomic intervals associated with PD and BP in the control are also associated with sulfentrazone tolerance, indicating that breeding for general germination and seedling vigor may also increase the tolerance to herbicides. In agreement with the hypothesis of general stress tolerance, we observed that many of the MTAs detected in the present study are concordant with MTAs previously reported for germination and plant development parameters under control and abiotic stress conditions. Therefore, selection for genomic regions that improve tolerance to sulfentrazone may also increase the ability to maximize germination and growth under non-stress conditions. MTAs for PDperc, BPperc, and TPBperc traits, which express the relative value of the trait over the value of the same genotype in the nontreated control plot, would reflect genetic factors more specifically related to the effects of sulfentrazone in the plant, such as genes influencing enhanced metabolic transformation and excretion or sequestration of the herbicides through oxidation, conjugation with glutathione (Dayan et al., 1998) and transport of conjugated herbicide or its metabolites s carried out by transmembrane transporters (Lu et al., 1997; Lu et al., 1998). The phytotoxicity of sulfentrazone is due to the creation of singlet oxygen by protoporphyrin IX in the cytoplasm. Multiple biological processes have been proposed as the underlying causes of tolerance to herbicides that create oxidative stress: activation of antioxidant enzymes through the salicylic and jasmonic acid pathways (Ananieva et al., 2002; Kaya and Doganlar, 2016) and elevated amount of non-enzymatic antioxidants such as tocopherols, carotenoid, glutathione, and ascorbate (Kusvuran et al., 2016).
In agreement with the models of xenobiotic detoxification and ROS tolerance, we identified multiple genes in the GWAS intervals with plausible roles in sulfentrazone detoxification, sequestration, and sensing and quenching of ROS. ABC transporter genes (Phvul.004G023066 and Phvul.004G023132), and P450 enzymes genes (Phvul.001G052100, gene cluster from Phvul.004G021100 to Phvul.004G022000, and Phvul.008G191000) are of immediate interest as previous research directly implicate the involvement of similar genes in sulfentrazone tolerance in soybean. However, several other genomic regions contribute to the overall tolerance. Further investigation of the genes in those regions will provide a better understanding of the xenome of Phaseolus.
While seed weight is a significant factor in sulfentrazone tolerance, this relationship is problematic from a snap bean breeding perspective. Consumer and industry preferences are for small-seeded cultivars, as they are linked with better pod shape and longer window of opportunity for harvest. In addition, increased seed weight has been linked to decrease in germination in large-seeded legumes species such as common bean and soybean (Moshtaghi-Khavaran et al., 2014; Kering and Zhang, 2015). Therefore, phenotypic selection for sulfentrazone tolerance may inadvertently select for undesirable traits related to increased seed weight. We observed colinear genomic intervals between seed weight and sulfentrazone tolerance traits. Some of the genes under the colinear genomic intervals may be genes related to seed weight. Knowledge of the position of these colinear intervals can aid in avoiding selection for those regions in snap bean breeding populations.
While environment had a significant effect on the expression of the tolerance traits, we found genomic locations that were consistently associated with the phenotype in both years, in both sign and amount of the effect. The SNAP panel can be used to mine favorable alleles for use in breeding programs. The results of this study provide insights into the genetic architecture underlying the observed tolerance to sulfentrazone and suggest possible candidate genes. Additional approaches will be necessary to identify individual genes and quantify individual gene action and interactions among genes.
Conclusions
Currently, sulfentrazone will not selectively control waterhemp in most snap bean genotypes. Sulfentrazone tolerance in snap bean is heavily influenced by the environment; nonetheless, some genotypes consistently display high tolerance. Based on the results of this study, sulfentrazone tolerance is multigenic and likely to be conferred by NTSR mechanisms. Moreover, multiple genomic regions are associated with sulfentrazone tolerance. Many of the regions are also associated with better performance under nontreated control conditions, indicating it is possible to select for tolerance to sulfentrazone and general germination and early growth. Selection for sulfentrazone tolerance may unintentionally result on the selection of large-seeded genotypes. Information on the SNPS associated with sulfentrazone tolerance yet no association with seed weight can help in marker assisted breeding efforts. Of special interest are regions Chr01: 5,474,118- 6,699,374, Chr01: 50,593,075- 50,793,332, Chr04: 1,593,169- 3,102,077, and Chr08: 52,620,196-53,099,410. These regions contain genes likely involved in oxidative stress tolerance and xenobiotic metabolism and transport.
Data Availability Statement
The raw data supporting the conclusions of this article will be made available by the authors, without undue reservation.
Author Contributions
AS led the overall study, performed data analyses, and wrote the first draft of the manuscript. AS-G contributed to genomic data collection, analyses, and interpretation. MB contributed to data collection, analyses, and interpretation. JH contributed expertise on the snap bean diversity panel and implications for crop improvement, Assembled, curated, and managed seed increase of the SnAP, constructed and sequenced SnAP GBS libraries/ generated genomic data. AL provided expertise on GWAS analysis and result interpretation. PM provided expertise on bean genetics and contributed to the interpretation of the results. RP contributed to the field experiment and provided expertise on herbicide use in snap bean. PT contributed expertise on NTS resistance, PPO-inhibitor herbicides, and implications to weed management. MW conceptualized the project and designed the field study All authors read, contributed to the manuscript revisions, and approved the final manuscript. All authors contributed to the article and approved the submitted version.
Funding
This research was funded by the USDA-Agricultural Research Service, Project number 5012-12220-010-000D, entitled ‘Resilience of Integrated Weed Management Systems to Climate Variability in Midwest Crop Production Systems’, and by an appointment to the Agricultural Research Service Research Participation Program administered by the Oak Ridge Institute for Science and Education through an interagency agreement between the U.S. Department of Energy (DOE) and the USDA.
Author Disclaimer
Any opinions, findings, conclusions, or recommendations expressed in this publication are those of the authors and do not necessarily reflect the view of USDOE or USDA. Mention of trade names or commercial products in this publication is solely for the purpose of providing specific information and does not imply recommendation or endorsement. Equal opportunity provider and employer.
Conflict of Interest
The authors declare that the research was conducted in the absence of any commercial or financial relationships that could be construed as a potential conflict of interest.
Publisher’s Note
All claims expressed in this article are solely those of the authors and do not necessarily represent those of their affiliated organizations, or those of the publisher, the editors and the reviewers. Any product that may be evaluated in this article, or claim that may be made by its manufacturer, is not guaranteed or endorsed by the publisher.
Acknowledgments
The authors appreciate Nicholas Hausman for managing the field experiment and numerous students for assisting with data collection; Felix Navarro, Tim Trump, Jen Trapp from Seneca Foods for providing increases of the diversity panel seed; and Jim Meyers from Oregon State University for insightful discussions on this research.
Supplementary Material
The Supplementary Material for this article can be found online at: https://www.frontiersin.org/articles/10.3389/fagro.2022.869770/full#supplementary-material
References
Abdel-Ghani A. H., Sharma R., Celestine W., Sidram D., Owais Saed J., Duwayri M. A., et al. (2019). Genome-Wide Association Mapping in a Diverse Spring Barley Collection Reveals the Presence of QTL Hotspots and Candidate Genes for Root and Shoot Architecture Traits at Seedling Stage. BMC Plant Biol. 19 (1), 1–19. doi: 10.1186/s12870-019-1828-5
Aizawa H., Brown H. M. (1999). “Metabolism and Degradation of Porphyrin Biosynthesis Inhibitor Herbicides,” in Peroxidizing Herbicides. Eds. Böger P., Ko W.. (New York: Springer-Verlag), 348–381. ISBN 978-3-642-58633-0
Ambika S., Manonmani V., Somasundar G. (2014). “Review on Effect of Seed Size on Seedling Vigour and Seed Yield”. Res. J. Seed. Sci. 7 (2), 31–38. doi: 10.3923/rjss.2014.31.38
Ananieva E. A., Alexieva V. S., Popova L. P. (2002). “Treatment With Salicylic Acid Decreases the Effects of Paraquat on Photosynthesis”. J. Plant Physiol. 159 (7), 685–693. doi: 10.1078/0176-1617-0706
Barrett J. C., Fry B., Maller J., Daly M. J. (2004). “Haploview: Analysis and Visualization of LD and Haplotype Maps”. Bioinformatics 21 (2), 263–265. doi: 10.1093/bioinformatics/bth457
Benjamini Y., Hochberg Y. (1995). Controlling the False Discovery Rate: A Practical and Powerful Approach to Multiple Testing. J. R. Stat. Soc. 57 (1), 289–300. doi: 10.1111/j.2517-6161.1995.tb02031.x
Bi Bo, Wang Q., Coleman J. J., Porri A., Peppers J. M., Patel J. D., et al. (2020). A Novel Mutation A212T in Chloroplast Protoporphyrinogen Oxidase (PPO1) Confers Resistance To PPO Inhibitor Oxadiazon Ineleusine Indica. Pest Manage. Sci. 76 (5), 1786–1794. doi: 10.1002/ps.5703
Blair M. W., Díaz L. M., Buendía H. F., Duque M. C. (2009). Genetic Diversity, Seed Size Associations and Population Structure of a Core Collection of Common Beans (Phaseolus Vulgaris L.). Theor. Appl. Genet. 119 (6), 955–972. doi: 10.1007/s00122-009-1064-8
Box G. E., Cox D. R. (1964). An Analysis of Transformations. J. R. Stat. Soc. B. (Methodological). 26 (2), 211–252. doi: 10.1111/j.2517-6161.1964.tb00553.x
Čanak P., Jeromela A. Marjanović, Vujošević B., Kiprovski B., Mitrović B., Alberghini B., et al. (2020). “Is Drought Stress Tolerance Affected By Biotypes and Seed Size in the Emerging Oilseed Crop Camelina”? Agronomy 10 (12), 1856. doi: 10.3390/agronomy10121856
Cavé-Radet A., Rabhi M., Gouttefangeas F., El Amrani A. (2020). “Do Specialized Cells Play a Major Role in Organic Xenobiotic Detoxification in Higher Plants? Front. Plant Sci. 11. doi: 10.3389/fpls.2020.01037
Dayan F. E., Armstrong B. M., Weete J. D. (1998). “Inhibitory Activity of Sulfentrazone and Its Metabolic Derivatives on Soybean (Glycine Max) Protoporphyrinogen Oxidase”. J. Agric. Food Chem. 46 (5), 2024–2029. doi: 10.1021/jf970988p
Dayan F. E., Barker A., Tranel P. J. (2017). “Origins and Structure of Chloroplastic and Mitochondrial Plant Protoporphyrinogen Oxidases: Implications for the Evolution of Herbicide Resistance”. Pest Manage. Sci. 74 (10), 2226–2234. doi: 10.1002/ps.4744
Dayan F. E., Duke S. O. (2010). “Chapter 81 - Protoporphyrinogen Oxidase-Inhibiting Herbicides”. In Hayes'. Handb. Pesticide. Toxicol. edited by Krieger R. Amsterdam: Academic Press, 1733–1751. doi: 10.1016/b978-0-12-374367-1.00081-1
Dayan F., Hancock H., Duke S. (1997). “Soybean (Glycine Max) Cultivar Differences in Response to Sulfentrazone”. Weed. Sci. 45 (5), 634–641.
Delfini J., Moda-Cirino Vânia., Neto Joséd. S., Zeffa D. M., Nogueira A. F., Ribeiro L. A., et al. (2021). “Genome-Wide Association Study Identifies Genomic Regions for Important Morpho-Agronomic Traits in Mesoamerican Common Bean”. Front. Plant Sci. 12. doi: 10.3389/fpls.2021.748829
Délye C. (2012). Unravelling the Genetic Bases of Non-Target-Site-Based Resistance (NTSR) to Herbicides: A Major Challenge for Weed Science in the Forthcoming Decade”. Pest Manage. Sci. 69 (2), 176–187. doi: 10.1002/ps.3318
Demidchik V. (2015). Mechanisms of Oxidative Stress in Plants: From Classical Chemistry to Cell Biology. Environ. Exp. Bot. 109, 212–285. doi: 10.1016/j.envexpbot.2014.06.021
Dumanović J., Nepovimova E., Natić M., Kuča K., Jaćević V. (2021). “The Significance of Reactive Oxygen Species and Antioxidant Defense System in Plants: A Concise Overview”. Front. Plant Sci. 11. doi: 10.3389/fpls.2020.552969
Edwards E., Dixon D., Cummins I., Brazier-Hicks M., Skipsey M. (2011). “Essay,” in Organic Xenobiotics and Plants: From Mode of Action to Ecophysiology, vol. 8 . Eds. Schröder P., Collins C. D. (Dordrecht, NL: Springer), 125–148. https://doi.org/10.1007/978-90-481-9852-8
Gage K. L., Krausz R. F., Walters A. S. (2019). “Emerging Challenges for Weed Management in Herbicide-Resistant Crops”. Agriculture 9 (8), 180. doi: 10.3390/agriculture9080180
Gaines T. A., Duke S. O., Morran S. R., Carlos A. G., Tranel P. J., Küpper A., et al. (2020). “Mechanisms of Evolved Herbicide Resistance”. J. Biol. Chem. 295 (30), 10307–10330. doi: 10.1074/jbc.rev120.013572
Giacomini D. A., Umphres A. M., Nie H., Mueller T. C., Steckel L. E., Young B. G., et al. (2017). “Two New PPX2 Mutations Associated With Resistance to PPO-Inhibiting Herbicides in Amaranthus Palmeri”. Pest Manage. Sci. 73 (8), 1559–1563. doi: 10.1002/ps.4581
Giles B. E. (1990). “The Effects of Variation in Seed Size on Growth and Reproduction in the Wild Barley Hordeum Vulgare Ssp. Spontaneum”. Heredity. 64 (2), 239–250. doi: 10.1038/hdy.1990.29
Guillemin J.-P., Chauvel B. (2011). “Effects of the Seed Weight and Burial Depth on the Seed Behavior of Common Ragweed (Ambrosia Artemisiifolia)”. Weed. Biol. Manage. 11 (4), 217–223. doi: 10.1111/j.1445-6664.2011.00423.x
Hart J. P., Griffiths P., Mazourek M., Porch T., Gore M. A., Myers J. “Genomic Insight Into the Breeding of Edible Podded Beans in a Snap Bean Association Panel (SnAP). Plant and Animal Genome Conference. San Diego, CA. January 10–14, 2015.
Hekmat S., Shropshire C., Soltani N., Sikkema P. H. (2007). “Responses of Dry Beans (Phaseolus Vulgaris L.) to Sulfentrazone”. Crop Prot. 26 (4), 525–529. doi: 10.1016/j.cropro.2006.05.002
Holland J. B., Nyquist W. E., Cervantes-Martínez C. T. (2002). “Estimating and Interpreting Heritability for Plant Breeding: An Update”. Plant Breed. Rev. 22 Janick J. Hoboken, (NJ: John Wiley & Sons), 9–108. doi: 10.1002/9780470650202.ch2
Hulting A. G., Wax L. M., Nelson R. L., Simmons F. W. (2001). “Soybean (Glycine Max (L.) Merr.) Cultivar Tolerance to Sulfentrazone”. Crop Prot. 20 (8), 679–683. doi: 10.1016/s0261-2194(01)00035-7
Jugulam M., Shyam C. (2019). Non-Target-Site Resistance to Herbicides: Recent Developments. Plants 8 (10), 417. doi: 10.3390/plants8100417
Kaya A., Doganlar Z. B. (2016). “Exogenous Jasmonic Acid Induces Stress Tolerance in Tobacco (Nicotiana Tabacum) Exposed TO Imazapic”. Ecotoxicol. Environ. Saf. 124, 470–479. doi: 10.1016/j.ecoenv.2015.11.026
Kering M. K., Zhang Bo. (2015). “Effect of Priming and Seed Size on Germination and Emergence of SIX Food-Type Soybean Varieties”. Int. J. Agron. 2015, 1–6. doi: 10.1155/2015/859212
Koinange E. M., Singh S. P., Gepts P. (1996). “Genetic Control of the Domestication Syndrome in Common Bean”. Crop Sci. 36 (4), 1037–1045. doi: 10.2135/cropsci1996.0011183x003600040037x
Kunkel D. L., Salzman F. P., Arsenovic M., Baron J. J., Braverman M. P., Holm R. E. (2008). “The Role of IR-4 in the Herbicide Registration Process for Specialty Food Crops”. Weed. Technol. 22 (2), 373–377. doi: 10.1614/wt-07-115.1
Kusvuran S., Kiran Sevinç, Ellialtioglu S. (2016). “Antioxidant Enzyme Activities and Abiotic Stress Tolerance Relationship in Vegetable Crops,” in Abiotic and Biotic Stress in Plants edited by Shanker A., Shanker C (London, UK: IntechOpen), 481–506.
Langmead B., Salzberg S. L. (2012). “Fast Gapped-Read Alignment With Bowtie 2”. Nat. Methods 9 (4), 357–359. doi: 10.1038/nmeth.1923
Lee R. M., Hager A. G., Tranel P. J. (2008). “Prevalence of a Novel Resistance Mechanism to PPO-Inhibiting Herbicides in Waterhemp (Amaranthus Tuberculatus)”. Weed. Sci. 56 (3), 371–375. doi: 10.1614/ws-07-194.1
Lee B.-H., Won S.-H., Lee H.-S., Miyao M., Chung W.-I., Kim I.-J., et al. (2000). “Expression of the Chloroplast-Localized Small Heat Shock Protein by Oxidative Stress in Rice”. Gene 245 (2), 283–290. doi: 10.1016/s0378-1119(00)00043-3
Lermontova I., Kruse E., Grimm B. (1997). “Cloning and Characterization of a Plastidal and a Mitochondrial Isoform of Tobacco Protoporphyrinogen IX Oxidase”. Proc. Natl. Acad. Sci. U.S.A. 94 (16), 8895–8900. doi: 10.1073/pnas.94.16.8895
Li H., Handsaker B., Wysoker A., Fennell T., Ruan J., Homer N., et al. (2009). “The Sequence Alignment/Map Format and SAMtools”. Bioinformatics 25 (16), 2078–2079. doi: 10.1093/bioinformatics/btp352
Lipka A. E., Kandianis C. B., Hudson M. E., Yu J., Drnevich J., Bradbury P. J., et al. (2015). “From Association to Prediction: Statistical Methods for the Dissection and Selection of Complex Traits in Plants”. Curr. Opin. Plant Biol. 24, 110–118. doi: 10.1016/j.pbi.2015.02.010
Lipka A. E., Alexander E., Tian F., Wang Q., Peiffer J., Li M., et al. (2012). “Gapit: Genome Association and Prediction Integrated Tool”. Bioinformatics 28 18, 2397–99. doi: 10.1093/bioinformatics/bts444
Luhua S., Hegie A., Suzuki N., Shulaev E., Luo X., Cenariu D., et al. (2013). “Linking Genes of Unknown Function With Abiotic Stress Responses by High-Throughput Phenotype Screening”. Physiologia. Plant. 148 (3), 322–333. doi: 10.1111/ppl.12013
Lu Y.-P., Li Z.-S., Drozdowicz Y. M., Hortensteiner S., Martinoia E., Rea P. A. (1998). “AtMRP2, And Arabidopsis Atp Binding Cassette Transporter Able to Transport Glutathione S-Conjugates and Chlorophyll Catabolites: Functional Comparisons With Atmrp1”. Plant Cell 10 (2), 267. doi: 10.2307/3870704
Lu Y.-P., Li Z.-S., Rea P. A. (1997). “AtMRP1 Gene of Arabidopsis Encodes A Glutathione S-Conjugate Pump: Isolation and Functional Definition of a Plant ATP-Binding Cassette Transporter Gene”. Proc. Natl. Acad. Sci. 94 (1), 8243–8248. doi: 10.1073/pnas.94.15.8243
Lynch M., Walsh B. (1998). Genetics and Analysis of Quantitative Traits (Sunderland, MA: Sinauer Associates).
Mahmood A. M., Dunwell J. M. (2020). “2-Oxoglutarate-Dependent Dioxygenases: A Renaissance in Attention for Ascorbic Acid in Plants”. PloS One 15 (12), 1–10. doi: 10.1371/journal.pone.0242833
Maity A., Singh V., Jessup R., Bagavathiannan M. (2021). “Seed Traits Correlate With Herbicide Resistance in Italian Ryegrass (Lolium Perenne Ssp. Multiflorum)”. Pest Manage. Sci. 77 (6), 2756–2765. doi: 10.1002/ps.6304
Mangin A. R., Hall L., Beckie H. (2016). “Triallate-Resistant Wild Oat (Avena Fatua L.): Unexpected Resistance to Pyroxasulfone and Sulfentrazone”. Can. J. Plant Sci. 97 (1), 20–25. doi: 10.1139/cjps-2016-0029
Manolio T. A. (2010). “Genomewide Association Studies and Assessment of the Risk of Disease”. New Engl. J. Med. 363 (2), 166–176. doi: 10.1056/nejmra0905980
Maurya A. K. (2020). “Oxidative Stress in Crop Plants,” in Agronomic Crops. Ed. Hasanuzzaman M. (Singapore: Springer), 349–380. doi: 10.1007/978-981-15-0025-1_18
Mendes R. R., Takano H. K., Adegas F. S., Oliveira R. S., Gaines T. A., Franck E.D. (2020). “Arg-128-Leu Target-Site Mutation in PPO2 Evolves in Wild Poinsettia (Euphorbia Heterophylla) With Cross-Resistance to PPO-Inhibiting Herbicides”. Weed. Sci. 68 (5), 437–444. doi: 10.1017/wsc.2020.42
Moshtaghi-Khavaran A., Khomari S., Zare N. (2014). “Soybean Seed Germination and Seedling Growth in Response to Deterioration and Priming: Effect of Seed Size”. Plant Breed. Seed. Sci. 70 (1), 55–67. doi: 10.1515/plass-2015-0013
Myers J., Baggett J. (1999). “Improvement of Snap Bean,” in Common Bean Improvement in the Twenty-First Century. Ed. Shree P.S. (Dordrecht: Kluwer Academic Publishers), 289–329.
Nagano E. (1999). “Herbicidal Efficacy of Protoporphyrinogen Oxidase Inhibitors.” Essay. In Peroxidizing Herbicides, edited by Bö P., Ko W. (New York: Springer-Verlag), 293–302. ISBN 978-3-642-58633-0
Navarro T., Oualidi J. El, Taleb M. S. (2018). “Relationship Between Seed Size and Related Functional Traits in North Saharan Acacia Woodlands”. Plant Ecol. Evol. 151 (1), 87–95. doi: 10.5091/plecevo.2018.1368
Neter J., Wasserman W., Nachtschiem C. J. (1996). “Applied Linear Statistical Models.”, 4th ed. Ed. Michael H.K. (Boston, MA: WCB/McGraw-Hill). ISBN 13: 9780256086010
Nodari R. O., Tsail S. M., Gilbertson R. L., Gepts P. (1992). “Towards an Integrated Linkage Map of Common Bean 2. Development of an RFLP-Based Linkage Map”. Theor. Appl. Genet. 85 (5), 513–520. doi: 10.1007/bf00220907
Park S. O., Coyne D. P., Jung G., Skroch P. W., Arnaud-Santana E., Steadman J. R., et al. (2000). “Mapping of QTL for Seed Size and Shape Traits in Common Bean”. J. Am. Soc. Hortic. Sci. 125 (4), 466–475. doi: 10.21273/jashs.125.4.466
Patzoldt W. L., Hager A. G., McCormick J. S., Tranel P. J. (2006). “A Codon Deletion Confers Resistance to Herbicides Inhibiting Protoporphyrinogen Oxidase”. Proc. Natl. Acad. Sci. 103 (33), 12329–12334. doi: 10.1073/pnas.0603137103
Perea C., de la Hoz J. F., Cruz D. F., Lobaton J. D., Izquierdo P., Quintero J. C., et al. (2016). “Bioinformatic Analysis of Genotype by Sequencing (GBS) Data With NGSEP”. BMC Genomics 17 (S5), 539–51. doi: 10.1186/s12864-016-2827-7
Pluess A. R., Schütz W., Stöcklin Jürg. (2005). “Seed Weight Increases With Altitude in the Swiss Alps Between Related Species But Not Among Populations of Individual Species”. Oecologia 144 (1), 55–61. doi: 10.1007/s00442-005-0047-y
Poulson R., Polglase W. J. (1975). “The Enzymic Conversion of Protoporphyrinogen IX to Protoporphyrin IX. Protoporphyrinogen Oxidase Activity in Mitochondrial Extracts of Saccharomyces Cerevisiae”. J. Biol. Chem. 250 (4), 1269–1274. doi: 10.1016/s0021-9258(19)41809-7
Rangani G., Salas-Perez R. A., Aponte R. A., Knapp M., Craig I. R., Mietzner T., et al. (2019). “A Novel Single-Site Mutation in the Catalytic Domain Of Protoporphyrinogen Oxidase IX (PPO) Confers Resistance TO PPO-Inhibiting Herbicides”. Front. Plant Sci. 10. doi: 10.3389/fpls.2019.00568
Renner K. A., Powell G. E. (2002). ““Dry Bean Response to Flumioxazin and Sulfentrazone,” in 57th Annual Meeting of the North Central Weed Science Society, vol. 57. (Champaign, Illinois: North Central Weed Sci. Soc.), 109. Available at: http://ncwss.org/proceed/2002/Proc2002/abstracts/109.pdf.
Rigon C. A., Gaines T. A., Küpper A., Dayan F. E. (2020). “Metabolism-Based Herbicide Resistance, the Major Threat Among the Non-Target Site Resistance Mechanisms”. Outlook. Pest Manage. 31 (4), 162–168. doi: 10.1564/v31_aug_04
Ritz C., Baty F., Streibig J. C., Gerhard D. (2015). “Dose-Response Analysis Using R”. PloS One 10 (12), 1–13. doi: 10.1371/journal.pone.0146021
Rousonelos S. L., Lee R. M., Moreira M. S., VanGessel M. J., Patrick J.T. (2012). “Characterization of a Common Ragweed (Ambrosia Artemisiifolia) Population Resistant to ALS- and PPO-Inhibiting Herbicides”. Weed. Sci. 60 (3), 335–344. doi: 10.1614/ws-d-11-00152.1
Roy S. K., Hamid A., Giashuddin Miah M., Hashem A. (1996). “Seed Size Variation and Its Effects on Germination and Seedling Vigour in Rice”. J. Agron. Crop Sci. 176 (2), 79–82. doi: 10.1111/j.1439-037x.1996.tb00449.x
Sah S. K., Reddy K. R., Li J. (2016). “Abscisic Acid and Abiotic Stress Tolerance in Crop Plants”. Front. Plant Sci. 7. doi: 10.3389/fpls.2016.00571
Scheet P., Stephens M. (2006). “A Fast and Flexible Statistical Model for Large-Scale Population Genotype Data: Applications to Inferring Missing Genotypes and Haplotypic Phase”. Am. J. Hum. Genet. 78 (4), 629–644. doi: 10.1086/502802
Schmutz J., McClean P. E., Mamidi S., Wu G.A., Cannon S. B., Grimwood J., et al. (2014). “A Reference Genome for Common Bean and Genome-Wide Analysis of Dual Domestications”. Nat. Genet. 46 (7), 707–713. doi: 10.1038/ng.3008
Singh B. K., Singh B. (2015). “Breeding Perspectives of Snap Bean (Phaseolus Vulgaris L.)”. Veget. Sci. 42 (1), 1–17.
Slaten ML, Yen OC, Vivek S, Lipka AE, Angelovici R (2020). “HAPPI GWAS: Holistic Analysis with Pre- and Post-Integration GWAS.” Bioinformatics 36 17 (1), 4655–4657. doi: 10.1093/bioinformatics/btaa589
Soltani N., Bowley S., Sikkema P. H. (2005). “Responses of Dry Beans to Flumioxazin”. Weed. Technol. 19 (2), 351–358. doi: 10.1614/wt-04-146r1
Soltani N., Shropshire C., Cowan T., Sikkema P. (2003). “Tolerance of Cranberry Beans (Phaseolus Vulgaris) to Soil Applications Of S-Metolachlor And Imazethapyr”. Can. J. Plant Sci. 83 (3), 645–648. doi: 10.4141/p03-006
Soltani N., Shropshire C., Cowan T., Sikkema P. (2004). “Tolerance of Black Beans (Phaseolus Vulgaris) to Soil Applications Of S-Metolachlor and Imazethapyr1”. Weed. Technol. 18 (1), 111–118. doi: 10.1614/wt-03-044r
Soltani N., Shropshire C., Sikkema P. H. (2006). “Responses of Various Market Classes of Dry Beans (Phaseolus Vulgaris L.) to Linuron”. Weed. Technol. 20 (1), 118–122. doi: 10.1614/wt-04-070r1.1
Swantek J. M., Sneller C. H., Lawrence R.O. (1998). “Evaluation of Soybean Injury From Sulfentrazone and Inheritance of Tolerance”. Weed. Sci. 46 (2), 271–277. doi: 10.1017/s0043174500090524
Taylor-Lovell S., Wax L. M., Nelson R. (2001). “Phytotoxic Response and Yield of Soybean (Glycine Max) Varieties Treated With Sulfentrazone or Flumioxazin”. Weed. Technol. 15 (1), 95–102. doi: 10.1614/0890-037X(2001)015[0095:PRAYOS]2.0.CO;2
Torres-García JesúsR., Uscanga-Mortera E., Trejo C., Conde-Martínez Víctor, Kohashi-Shibata J., Núñes-Farfán J., et al. (2015). Effect of Herbicide Resistance on Seed Physiology of Phalaris Minor (Littleseed Canarygrass). Botanical. Sci. 93. No. 3, 661. doi: 10.17129/botsci.81
United Phosphorous (2017). Shutdown: Product Label. King of Prussia, PA 19406. USA. Available at: https://www3.epa.gov/pesticides/chem_search/ppls/070506-00326-20171101.pdf
Urwin C. P., Wilson R. G., Mortensen D. A. (1996). “Response of Dry Edible Bean (Phaseolus Vulgaris) Cultivars to Four Herbicides”. Weed. Technol. 10 (3), 512–518. doi: 10.1017/s0890037x00040355
Van Wychen L., Lee R. (2016). 2016 Survey of the Most Common and Troublesome Weeds in Broadleaf Crops, Fruits & Vegetables in the United States and Canada (Weed Science Society of America). https://wssa.net/2016/04/wssa-survey-ranks-palmer-amaranth-as-the-most-troublesome-weed-in-the-u-s-galium-as-the-most-troublesome-in-canada/
VanRaden P. M. (2008). “Efficient Methods to Compute Genomic Predictions”. J. Dairy. Sci. 91 (11), 4414–4423. doi: 10.3168/jds.2007-0980
Viecelli M., Trezzi M. M., Galon L., Brandler D., Hatmann K. C., Pereira PatríciaB., et al. (2021). “Morphophysiological Characteristics of Brazilian Bean Genotypes Related With Sulfentrazone Tolerance”. J. Environ. Sci. Health. Part B 56, no. 8 (2021):706–721. doi: 10.1080/03601234.2021.1940659
Vila-Aiub M. M., Neve P., Powles S. B. (2009). “Fitness Costs Associated With Evolved Herbicide Resistance Alleles in Plants”. New Phytol. 184 (4), 751–767. doi: 10.1111/j.1469-8137.2009.03055.x
Wilson R. G. (2005). “Response of Dry Bean and Weeds to Fomesafen and Fomesafen Tank Mixtures1”. Weed. Technol. 19 (1), 201–206. doi: 10.1614/wt-04-166r
Winn A. A. (1988). “Ecological and Evolutionary Consequences of Seed Size in. Prunella. Vulgaris”. Ecol. 69 (5), 1537–1544. doi: 10.2307/1941651
Yamauchi Y., Hasegawa A., Mizutani M., Sugimoto Y. (2012). “Chloroplastic NADPH-Dependent Alkenal/One Oxidoreductase Contributes to the Detoxification of Reactive Carbonyls Produced Under Oxidative Stress”. FEBS Lett. 586 (8), 1208–1213. doi: 10.1016/j.febslet.2012.03.013
Yu J., Pressoir G., Briggs W. H., Bi I. V., Yamasaki M., Doebley J. F., et al. (2006). “A Unified Mixed-Model Method for Association Mapping That Accounts for Multiple Levels of Relatedness”. Nat. Genet. 38 (2), 203–208. doi: 10.1038/ng1702
Keywords: Phaseolus vulgaris, herbicide tolerance, abiotic stress resistance, xenobiotic detoxification, sulfentrazone, PPO-inhibiting herbicide, plant breeding
Citation: Saballos A, Soler-Garzón A, Brooks M, Hart JP, Lipka AE, Miklas P, Peachey RE, Tranel PJ and Williams MM II (2022) Multiple Genomic Regions Govern Tolerance to Sulfentrazone in Snap Bean (Phaseolus Vulgaris L.). Front. Agron. 4:869770. doi: 10.3389/fagro.2022.869770
Received: 05 February 2022; Accepted: 02 May 2022;
Published: 01 June 2022.
Edited by:
Mithila Jugulam, Kansas State University, United StatesReviewed by:
Simerjeet Kaur, Punjab Agricultural University, IndiaSanjay Singh Rathore, Indian Agricultural Research Institute (ICAR), India
Copyright © 2022 Saballos, Soler-Garzón, Brooks, Hart, Lipka, Miklas, Peachey, Tranel and Williams. This is an open-access article distributed under the terms of the Creative Commons Attribution License (CC BY). The use, distribution or reproduction in other forums is permitted, provided the original author(s) and the copyright owner(s) are credited and that the original publication in this journal is cited, in accordance with accepted academic practice. No use, distribution or reproduction is permitted which does not comply with these terms.
*Correspondence: Martin M. Williams II, bWFydGluLndpbGxpYW1zQHVzZGEuZ292