 Grace L. Wilson
 David J. Mulla
 Nicholas R. Jordan
 Jacob M. Jungers2
- 1Department of Soil, Water & Climate, University of Minnesota Twin Cities, St. Paul, MN, United States
- 2Department of Agronomy & Plant Genetics, University of Minnesota Twin Cities, St. Paul, MN, United States
- 3Great River Greening, St. Paul, MN, United States
Several newly released crop varieties, including the perennial intermediate wheatgrass (grain marketed as Kernza®), and the winter hardy oilseed crop camelina, have been developed to provide both economic return for farmers and reduced nutrient losses from agricultural fields. Though studies have indicated that these crops could reduce nitrate-nitrogen (N) leaching, little research has been done to determine their effectiveness in reducing nitrate-N loading to surface waters at a watershed scale, or in comparing their performance to more traditional perennial crops, such as alfalfa. In this study, nitrate-N losses were predicted using the Soil and Water Assessment Tool (SWAT) model for the Rogers Creek watershed located in south-central Minnesota, USA. Predicted looses of nitrate-N under three perennialized cropping systems were compared to losses given current cropping practices in a corn (Zea mays L.)-soybean (Glycine max L. Merr.) rotation. The perennialized systems included three separate crop rotations: intermediate wheatgrass (IWG) in rotation with soybean, alfalfa in rotation with corn, and winter camelina in rotation with soybean and winter rye. Model simulation of these rotations required creation of new crop files for IWG and winter camelina within SWAT. These new crop files were validated using measured yield, biomass, and nitrate-N data. Model results show that the IWG and alfalfa rotations were particularly effective at reducing nutrient and sediment losses from agricultural areas in the watershed, but smaller reductions were also achieved with the winter camelina rotation. From model predictions, achieving regional water-quality goals of a 30% reduction in nitrate-N load from fields in the watershed required converting approximately 25, 34, or 57% of current corn-soybean area to the alfalfa, IWG, or camelina rotations, respectively. Results of this study indicate that adoption of these crops could achieve regional water quality goals.
1 Introduction
Nutrients originating from intensively managed annual cropping systems in the United States Upper Midwest have been implicated in the impairment of both fresh and marine waters. Nitrate-nitrogen (N) from fertilizer applied to these systems can have detrimental effects to fresh water ecosystems (Camargo & Alonso, 2006), and has resulted in hypoxic environments in coastal marine systems (Committee on Environment and Natural Resources, 2010; David et al., 2010) and contamination of drinking water resources (Nolan & Hitt, 2006). Management practices which incorporate perennial rotations—or annual rotations that mimic a perennial system, such as those incorporating overwintering crops—have been shown to reduce losses of nutrients from agricultural fields (Asbjornsen et al., 2014; Randall et al., 1997; Strock et al., 2004; Wilson et al., 2014).
Alfalfa (Medicago sativa L.), is often grown as feed for livestock, and is a perennial crop that can provide economic return for growers (Russelle et al., 2007). Novel perennial crops, such as intermediate wheatgrass (IWG; Thinopyrum intermedium [Host] Barkworth & D.R. Dewey) have also been developed which have the potential to provide economic return for farmers (Law et al., 2022). Intermediate wheatgrass is a perennial cool-season grass that can be used both as a forage crop (Wagoner 1995) as well as a grain crop marketed as Kernza® (DeHaan et al., 2018). The first commercial variety of Kernza®, “MN-Clearwater,” was released in 2020 (Bajgain et al., 2020). Growing IWG specifically for use as a perennial grain crop has the potential to produce economically viable, food-grade grain while providing environmental benefits such as reductions in nitrate-N losses from fields to waters (Jungers et al., 2019). Winter camelina (Camelina sativa L) is a winter annual oilseed crop, shown to have good survival rates in Minnesota and whose seed can be harvested early enough during the growing season to allow production of a second grain crop (Gesch and Archer, 2013). Winter camelina produces an oil-and protein-rich grain and also provides certain benefits of winter cover crops, such as protection of soil from erosion, reductions in nutrient losses, and provision of habitat for wildlife. Unlike IWG, it is not perennial itself, but can be grown over winter and can help “perennialize” an annual cropping system. Though winter camelina is not a new crop, its potential as an oilseed crop that could be used to perennialize cropping systems has renewed interest in developing and releasing new varieties with improved seed and oil yield (Vollmann et al., 2007).
Alfalfa grown in rotation with corn has been shown to reduce nutrient losses from fields compared to corn (Zea mays L.) -soybean (Glycine max L. Merr.) rotations (Randall et al., 1997; Entz et al., 2001; Russelle et al., 2001). Likewise, studies have shown fields planted in IWG have reduced nitrate-N leaching compared to annual crop rotations (Culman et al., 2013; Jungers et al., 2019; Reilly et al., 2022). Results regarding the effectiveness of winter camelina in reducing nitrate-N losses are not as conclusive. While the results of Weyers et al. (2019) indicate that winter camelina has the potential to reduce nitrate-N losses due to increased N uptake by the plant in the spring, Emmett et al. (2022) found that winter camelina planted in rotation with corn did not reduce nitrate-N losses in water discharged from subsurface, tile drainage compared with a traditional corn-soybean rotation. Many of the crop lands in the US Upper Midwest utilize subsurface, tile drainage, but, with the exception of a few studies (such as Emmett et al., 2022) there has been little work in evaluating the effect of the novel forms of IWG and winter camelina on nitrate-N losses from tile drained fields. Additional research is needed to understand the effect of IWG grown as a perennial grain crop and winter camelina grown as an oilseed crop on water quality on a watershed scale, as well as how nutrient losses from these cropping systems compares to more traditional perennial crops such as alfalfa.
In this work, we simulated nitrate-N losses from farm fields planted in perennialized cropping systems compared to those planted in a corn -soybean rotation. Perennialized cropping systems included IWG (grown as a perennial grain crop), winter camelina, or alfalfa in rotation with common annual crops. The analysis simulated changes to cropland within the Rogers Creek Watershed located in south-central Minnesota, USA. The objectives were to: 1) compare nitrate-N loads from tile drained fields for novel and traditional perennialized cropping systems to annual systems, and 2) compare the effectiveness of each cropping system in reducing nitrate-N losses at a watershed scale when targeted to key areas on the landscape.
2 Methods
2.1 Rogers Creek watershed
The approximately 70 km2 (17,214 acre) Rogers Creek Watershed is located in Nicollet County in south-central Minnesota, USA, and is a tributary to the Minnesota River (Figure 1). The watershed is mostly flat, with approximately 79% of its area having slopes less than 2%. Row-crop agriculture planted in corn or soybean accounts for approximately 75% of the watershed area, while smaller areas are planted in a corn-alfalfa rotation (4%) or other row crops (4%; USDA National Agricultural Statistics Service Cropland Data Layer, 2019). The remainder of the watershed is composed of forest (5%), wetlands (4%), and medium or high-density urban areas (4%; USDA National Agricultural Statistics Service Cropland Data Layer.). The majority of the watershed has poorly drained clay-loam soils which utilize subsurface tile drainage, with soils having a C/D drainage class making up approximately 71% of the watershed area. The remainder of the soils are primarily drainage class C (16.5%), with a smaller amount having drainage class B or B/D (5.3%) and A (6.4%). These better drainage class soils are found primarily on the eastern boundary of the watershed near its outlet and constitute a public water supply well which is highly vulnerable to contamination from the overlying land. Average annual precipitation (30-year normal 1991-2020) for the watershed is 82.4 cm (32.4 in) and average annual temperature is 6.6°C (43.9°F; National Centers for Environmental Information, 2022).
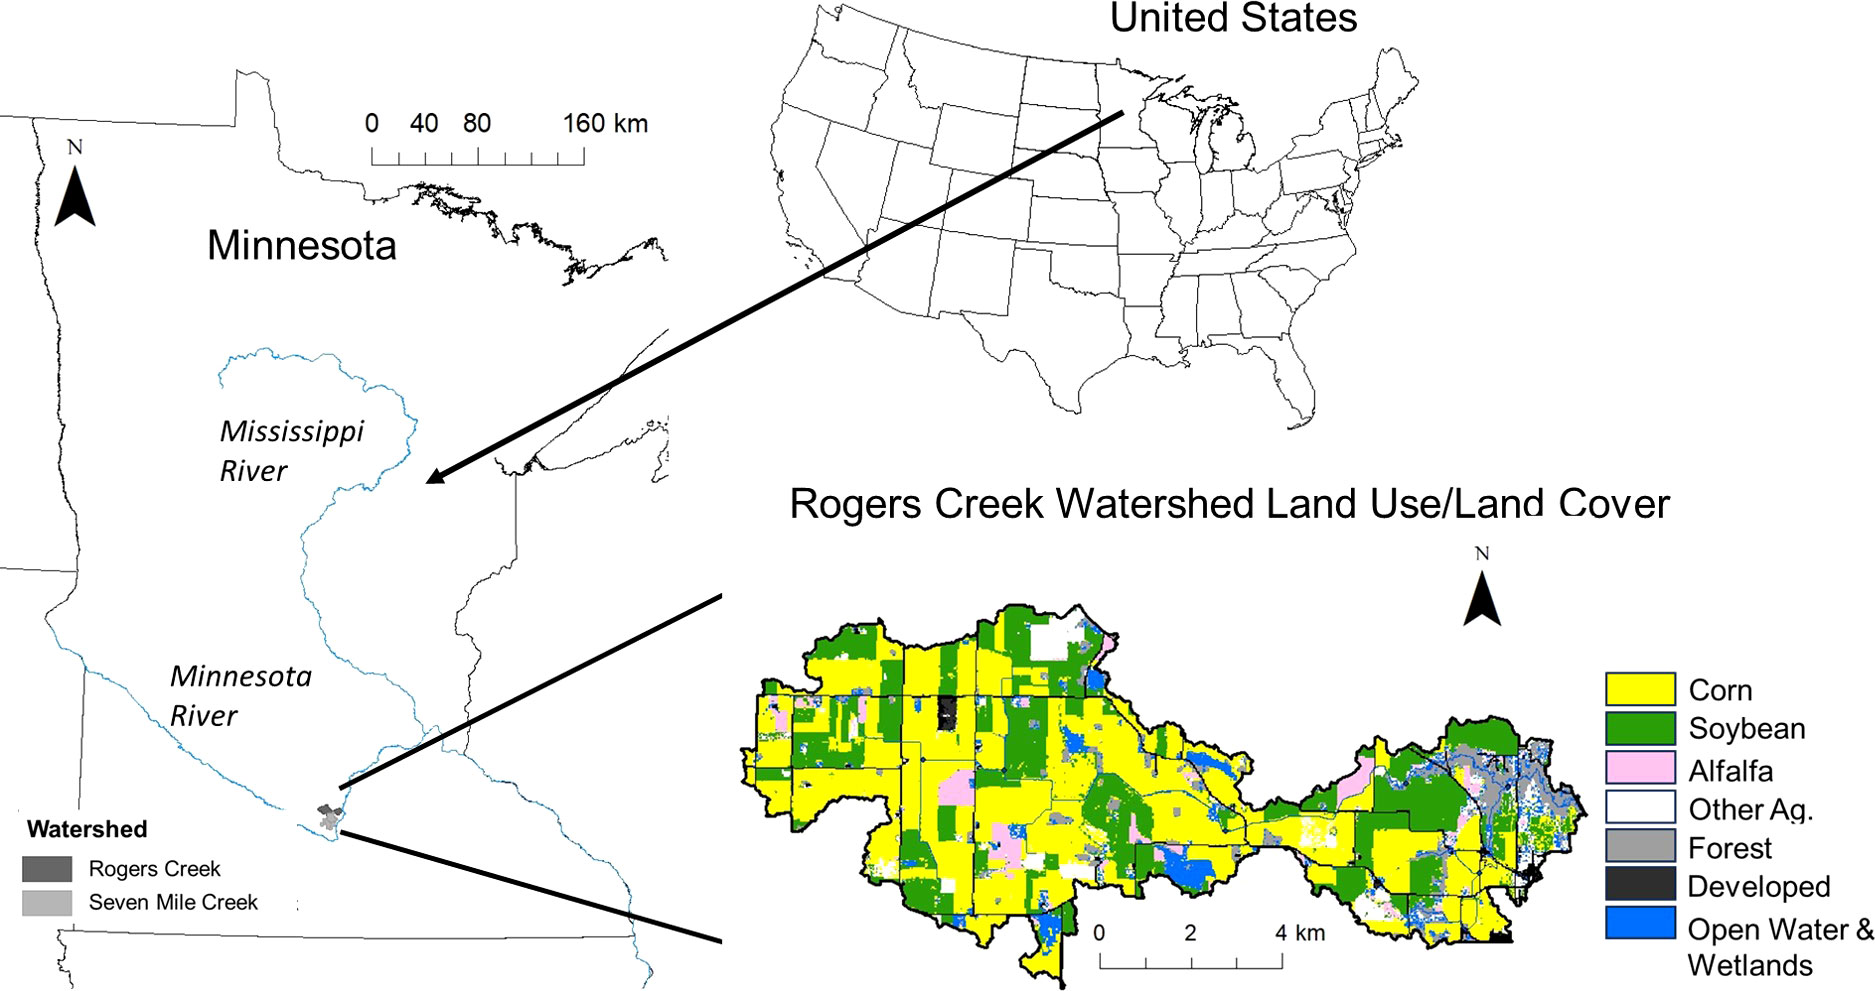
Figure 1 Rogers Creek watershed location and major land-use (from the 2019 CDL). The Seven Mile Creek watershed boundary (previous SWAT study) is shown on the southern boundary of the Rogers Creek Watershed.
2.2 SWAT model description and inputs
The Soil and Water Assessment Tool (SWAT) 2012 and ArcSWAT interface (ArcSWAT 2012.10.7.24) were used for simulating nitrate-N loads resulting from different crop rotations in the Rogers Creek Watershed. SWAT simulates the effects of alternative management practices on water resources and nonpoint-source pollution on a daily, continuous-time scale, utilizing both process- and empirically-based approaches (Arnold et al., 2012). SWAT characterizes the watershed based on spatial data including land cover, slope class, and soil properties. Unique combinations of these data (land cover, slope class, and soil properties) provide the functional unit of the SWAT model, the hydrologic responses unit (HRUs). These HRUs may or may not be spatially contiguous within the SWAT simulation. Daily climate data—including precipitation, temperature, relative humidity, wind speed, and solar radiation—is also used in model simulations.
This study utilized twenty years of weather data (years 2000-2019), using observed data closest to the watershed. Daily precipitation was obtained from the MN DNR (https://www.dnr.state.mn.us/climate/historical/daily-data.html) measured at a climate station 6 km east of the city of Mankato, or approximately 21 km from the south-east corner of the watershed boundary. Daily maximum and minimum temperatures, average daily relative humidity, and average daily wind speed were obtained from the Iowa Environmental Mesonet (https://mesonet.agron.iastate.edu), for the Mankato airport, located approximately 13 km from the south-east corner of the watershed. Measured solar radiation data was obtained from the nearest climate station measuring solar radiation, located at Waseca, MN, approximately 45 km from the watershed. Evapotranspiration (ET) was calculated within the SWAT model using the Penman-Monteith method (Wang et al., 2006).
The Rogers Creek SWAT model was created using land-use/land-cover data from the Cropland Data Layer (CDL) from 2019 (USDA National Agricultural Statistics Service Cropland Data Layer.). Land cover classes accounting for less than 1% of the watershed area were aggregated to reduce the number of functional units handled by the model. Soils data were obtained from the Digital Soil Survey Geographic (SSURGO) database, which contains soils data generally at a 1:12,000 scale (Soil Survey Staff et al., 2023). A 1-meter digital elevation model (DEM) file was used to delineate the watershed boundary, stream networks, and slopes (https://resources.gisdata.mn.gov/). This DEM file had undergone “hydro-enforcement,” a process which allows for appropriate draining of anthropogenically derived depressions (Gelder, 2015).
2.3 Baseline management scenario and model calibration
A baseline management scenario was developed in the model to represent current land-use and management practices in the Rogers Creek watershed. This baseline scenario assumed all land-use shown as corn or soybean in the 2019 CDL (Figure 1) was planted in a corn-soybean rotation. Previous work has shown that a 2-year corn-soybean rotation is the dominant row crop rotation in this region (Gowda et al., 2007). Land shown as soybean in the 2019 CDL started with soybean planted in year 1 of the corn-soybean rotation; land area shown as corn from the 2019 CDL were planted in corn in year 1. Tile drainage was assumed on corn and soybean acreages with slopes less than 2%. Soil management included spring cultivation and fall plowing with a chisel plow for both corn and soybean (Gowda et al., 2007). In the corn-soybean rotation, N fertilizer was applied in the fall after soybean harvest as anhydrous ammonia at a rate of 150 kg N ha-1. Phosphorus (P) fertilizer was applied as elemental P at the same time as nitrogen fertilizer at a rate of 25 kg P ha-1. Land-areas shown as alfalfa in the 2019 CDL were assumed to be in a 6-year alfalfa-corn rotation (4 years in alfalfa followed by 2 years in corn) in the baseline scenario. The alfalfa cropping system simulated with four years of alfalfa followed by 2 years in corn is the most common alfalfa rotation occurring in Minnesota (J. Coulter, personal communication). (A full description of the fertilizer and tillage management for the simulated alfalfa rotation is provided in the “alternative cropping systems” section).
The baseline scenario was run for the years 2000 through 2019, with a 2-year warmup period during which results were not used in order to eliminate model sensitivity to initialization values and allow environmental parameters to equilibrate. Model parameters were initially based on published values for a calibrated and validated SWAT model in the Seven Mile Creek watershed (Dalzell and Mulla, 2018). The Seven Mile Creek watershed borders Rogers Creek, with the northern end of Seven Mile Creek located adjacent to Rogers Creek (Figure 1), and is similar with regards to soils, land-use, and topography. Measured streamflow and water quality data are not available for the Rogers Creek watershed. As such, model parameters were calibrated to result in the lowest percent error between baseline scenario model predictions and calculated or literature reported values related to the watershed water-balance and nitrate-N loads. Literature values corresponded to water balance or nitrate-N loads in nearby watersheds with similar soils, topography, and cropping systems. The average annual predicted ET value was compared to a calculated ET for the watershed using a water balance approach. Average annual ET was calculated as the difference between annual average precipitation and runoff in the watershed region. Runoff was estimated using USGS stream gauge data (https://waterdata.usgs.gov/nwis/annual/), measured for the Minnesota River at Mankato.
Model performance for crop growth in the baseline scenario was quantified by comparing observed and predicted annual corn, soybean, and alfalfa yields using the percent bias (PBIAS; Moriasi et al., 2007):
where Oi is the observed annual crop yield, and Pi is the corresponding model predicted data. Positive values of PBIAS indicate model underestimation bias while negative values indicate model overestimation bias. The observed values for annual crop yields used in this statistical analysis were obtained from the National Agricultural Statistic Service for Nicollet County, Minnesota (USDA, 2022).
SWAT input parameters calibrated from model defaults can be found in the Supplementary Materials, Supplementary Table 1.
2.4 Alternative cropping system scenarios
Following model calibration, simulations were run for three different perennialized, alternative cropping system scenarios. These scenarios included cropping systems that incorporated: 1) IWG, 2) winter camelina, 3) alfalfa. Each are described in more detail below.
The IWG rotation used in model simulations was a 5-year rotation, beginning with 4 years planted in IWG followed by 1 year of soybean. IWG grown in this rotation was assumed to be grown for harvest of its grain (marketed as “Kernza®“), and biomass was not harvested. The rotation of IWG and soybean was based on a published rotation for IWG grown as a grain crop in the region (Jungers et al., 2017). The IWG simulation included a spring planting of the IWG to allow for a full year of soybean growth during the previous year. IWG requires vernalization (overwintering) for grain production, so the first year of IWG was used as a crop establishment year, while the following three years were harvested for grain. In this rotation, IWG was planted in early April, and fertilized at a rate of 60 kg N ha-1 at the end of April. The IWG grain was harvested in early August for years 2, 3 and 4, but not killed until the end of four years of growth. IWG was planted in the spring to allow for a full year of soybean growth. In the fifth year, fields were tilled in early May with a field cultivator prior to planting soybean in late May. Soybean harvest occurred in early October, with additional fall tillage using a chisel plow.
The alfalfa rotation simulated was a 6-year rotation, beginning with 4 years of alfalfa followed by 2 years of corn. Fields were prepared for alfalfa planting with a field cultivator tillage operation in mid-April in year 1, with alfalfa planted a few days later. In year 1 of alfalfa, the first harvest occurred in early September. In years 2-4, alfalfa was harvested 3 times during the growing season: on June 25, August 1, and September 10. Following the September harvest in year 4, fields were plowed (moldboard plow). For years when corn was grown in this rotation, fields were tilled with a field cultivator in early May, with corn planted following spring tillage. The corn crop in the alfalfa rotation was fertilized in the spring, at a rate of 45 kg N ha-1 in the first corn year, and 150 kg N ha-1 in the second year of corn (Yost et al., 2012). Additional tillage followed corn harvest in late October.
The winter camelina rotation simulated was a 3-year rotation, where winter camelina was double cropped with soybean (meaning winter camelina and soybean were grown in the same calendar year, but not at the same time). The rotation used in this study was based on the rotation described by Gesch et al. (2014), however we replaced the spring wheat used in their study with winter rye harvested for grain. Soybean was planted following spring tillage in early May in year 1 and harvested on Oct 1. Immediately following year 1 soybean harvest, winter rye was planted (as no-till). Winter rye was allowed to grow through the end of year 1 and into year 2, being harvested for grain in mid-July of year 2. Following rye harvest, winter camelina was planted on Sept 1 (with the field fallow between rye harvest and winter camelina planting). Winter camelina overwintered between years 2 and 3, before being harvested on July 1 in year 3, with no-till soybean immediately planted after winter camelina harvest. Soybean in year 3 was grown until the end of October. Nitrogen fertilizer was applied to winter rye in April of year 2, and to winter camelina in April of year 3, both as elemental N at a rate of 78 kg N ha-1.
2.5 Parameterization of IWG and winter camelina in SWAT
IWG and winter camelina are not crops that exist in the current SWAT crop database, and new crop database files needed to be created. Crop database files for both IWG and winter camelina were initially based on existing SWAT crop files of similar crops. The IWG crop was developed initially using crop parameters for winter wheat and perennial wheatgrass, and the winter camelina crop initially used SWAT default crop parameters for spring canola. Crop database parameters for the IWG and winter camelina crops were then changed in order to achieve similar results between predicted and observed crop biomass and nitrate-N losses in tile drainage. Nitrate-N was chosen as a factor for parameterization based on the goals of this study. While crop biomass is not a key result to achieve the project’s goals, predictions that were similar to observations would indicate a reasonable approximation of crop growth by the model. As observed data for biomass or nitrate-N loads for these crops was not available for the Roges Creek watershed, the observed data were obtained from literature values from previous studies conducted nearest the watershed area. Due to the limited nature of the observed datasets (including a small sample of observations), statistical measures of model accuracy were not appropriate, and rather acceptable fit was determined based on minimizing the percent error between the observed and predicted biomass and nitrate-N loads. Crop database parameters used in this study for IWG and winter camelina are reported as a Supplementary Materials, Supplementary Table 2.
Observed biomass values for a spring-seeded, improved grain-type IWG were obtained from Jungers et al. (2017), which reported biomass values for the years 2013-2015. In this study, reported biomass values corresponded to the IWG crop fertilized at a rate of 96 kg N ha-1 in 2013, 87 kg N ha-1 in 2014, and 77 kg N ha-1 in 2015. For winter camelina, observed biomass data were obtained from Liu et al. (2020) and personal correspondence with researchers at the USDA ARS. Observed data for nitrate-N loads in tile drainage was not available in the literature for both crops, however nitrate-N concentrations in soil-water had been reported. In order to make a comparison between predicted nitrate-N losses in tile for these crops to measured data, an “observed” nitrate-N load was calculated using the model predicted tile flow and reported soil-water nitrate-N concentration data. For IWG, the observed soil-water nitrate-N load was calculated using the average annual predicted tile drainage effluent depth in the baseline scenario, and measured soil-water nitrate concentrations for corn and intermediate wheatgrass reported in Jungers et al. (2019). For winter camelina, an “observed” nitrate-N load was calculated using the annual predicted tile drainage discharge depths and measured soil-water nitrate concentrations reported in Weyers et al. (2019) for soybean relay-cropped into winter camelina. The soil-water nitrate-N concentrations reported in Weyers et al. (2019) were measured over three time periods in 2-years, and included a “cover crop” period (Sept-April) when winter camelina was established, an “intercrop” period (May-June) when soybean was seeded into a standing winter camelina crop, and a “soybean” period (July-Oct) when soybean only was grown.
2.6 Targeting alternative cropping systems to the watershed to maximize water quality benefits
Model simulations were conducted in order to determine the effectiveness of the alternative cropping systems on reducing field losses of nitrate-N. These simulations examined nitrate-N loads given targeted conversion of corn-soybean land areas in the baseline scenario to the alternative cropping systems. Specifically, we examined how much land would need to be converted from the corn-soybean rotation to an alternative cropping system in order to achieve set reductions of 10, 20, 30, 40, and 50% in nitrate-N loads from the watershed compared to the baseline scenario. Corn and soybean HRUs were ranked based on losses of nitrate-N in the baseline scenario. The land-use for these HRUs was then changed from the baseline corn-soybean rotation to each of the alternative cropping systems, with those HRUs contributing the highest losses of nitrate-N under the baseline scenario targeted first with the alternative cropping systems. This method was done in order to allow for the largest reductions in nitrate-N losses at the watershed scale,while minimizing the area of land needing to be converted to an alternative cropping system. The alternative cropping systems were applied to land-use classified as corn and soybean in the baseline scenario–no other land-uses were changed from their baseline conditions in the watershed.
3 Results
3.1 Baseline scenario
3.1.1 Water balance
The SWAT-predicted average annual ET for the Rogers Creek watershed over all 18 years of simulation (2002-2019) was 52.8 cm (20.79 in). Using a watershed area draining to the gauge location equal to 38,590 km2 (14,900 mi2), the average observed ET (for years 2000-2018) calculated using the water balance approach with streamflow data for the Minnesota River at Mankato, was approximately 58.4 cm (23.4 in), which is a 9.5% difference from the predicted average annual value. Predicted average annual ET (averaged over 18 years of model simulations) accounted for 70% of the average annual precipitation. Tile drainage accounted for 17% of the average annual precipitation, lateral flow accounted for 7%, and surface runoff (RO) accounted for 6%. Losses to deep and shallow groundwater (GW) were approximately zero. Nangia et al. (2008) found tile drainage accounted for 25.3% of the total precipitation in the nearby Seven Mile Creek watershed (which does not include a coarse textured soil region), which is similar to the 17% predicted here. The SWAT model predicted average annual ET as a percent of average annual precipitation is similar to those measured on a fine-textured tile-drained soil (64.1% in 1992 and 72% in 1994) in central Iowa (Moorman et al., 1999).
3.1.2 Crop yields
Annual crop yields predicted by SWAT under the baseline scenario are shown in Figure 2, and are compared to annual measured crop yields in Nicollet County, Minnesota (USDA, 2022). Yields for alfalfa are shown only for years when alfalfa was grown in rotation in the baseline scenario. The calculated PBIAS for the corn, soybean, and alfalfa yields were 7.7, 0.18, and 6.9, respectively. Average annual predicted corn yields were 8% lower than the measured values, while predicted soybean yields show no difference, and alfalfa yields are 7% lower than measured values (Figure 2). SWAT tends to simulate yields lower than expected for alfalfa in the establishment year, and it is these years (2006 and 2012) which show the greatest deviation from measured values.
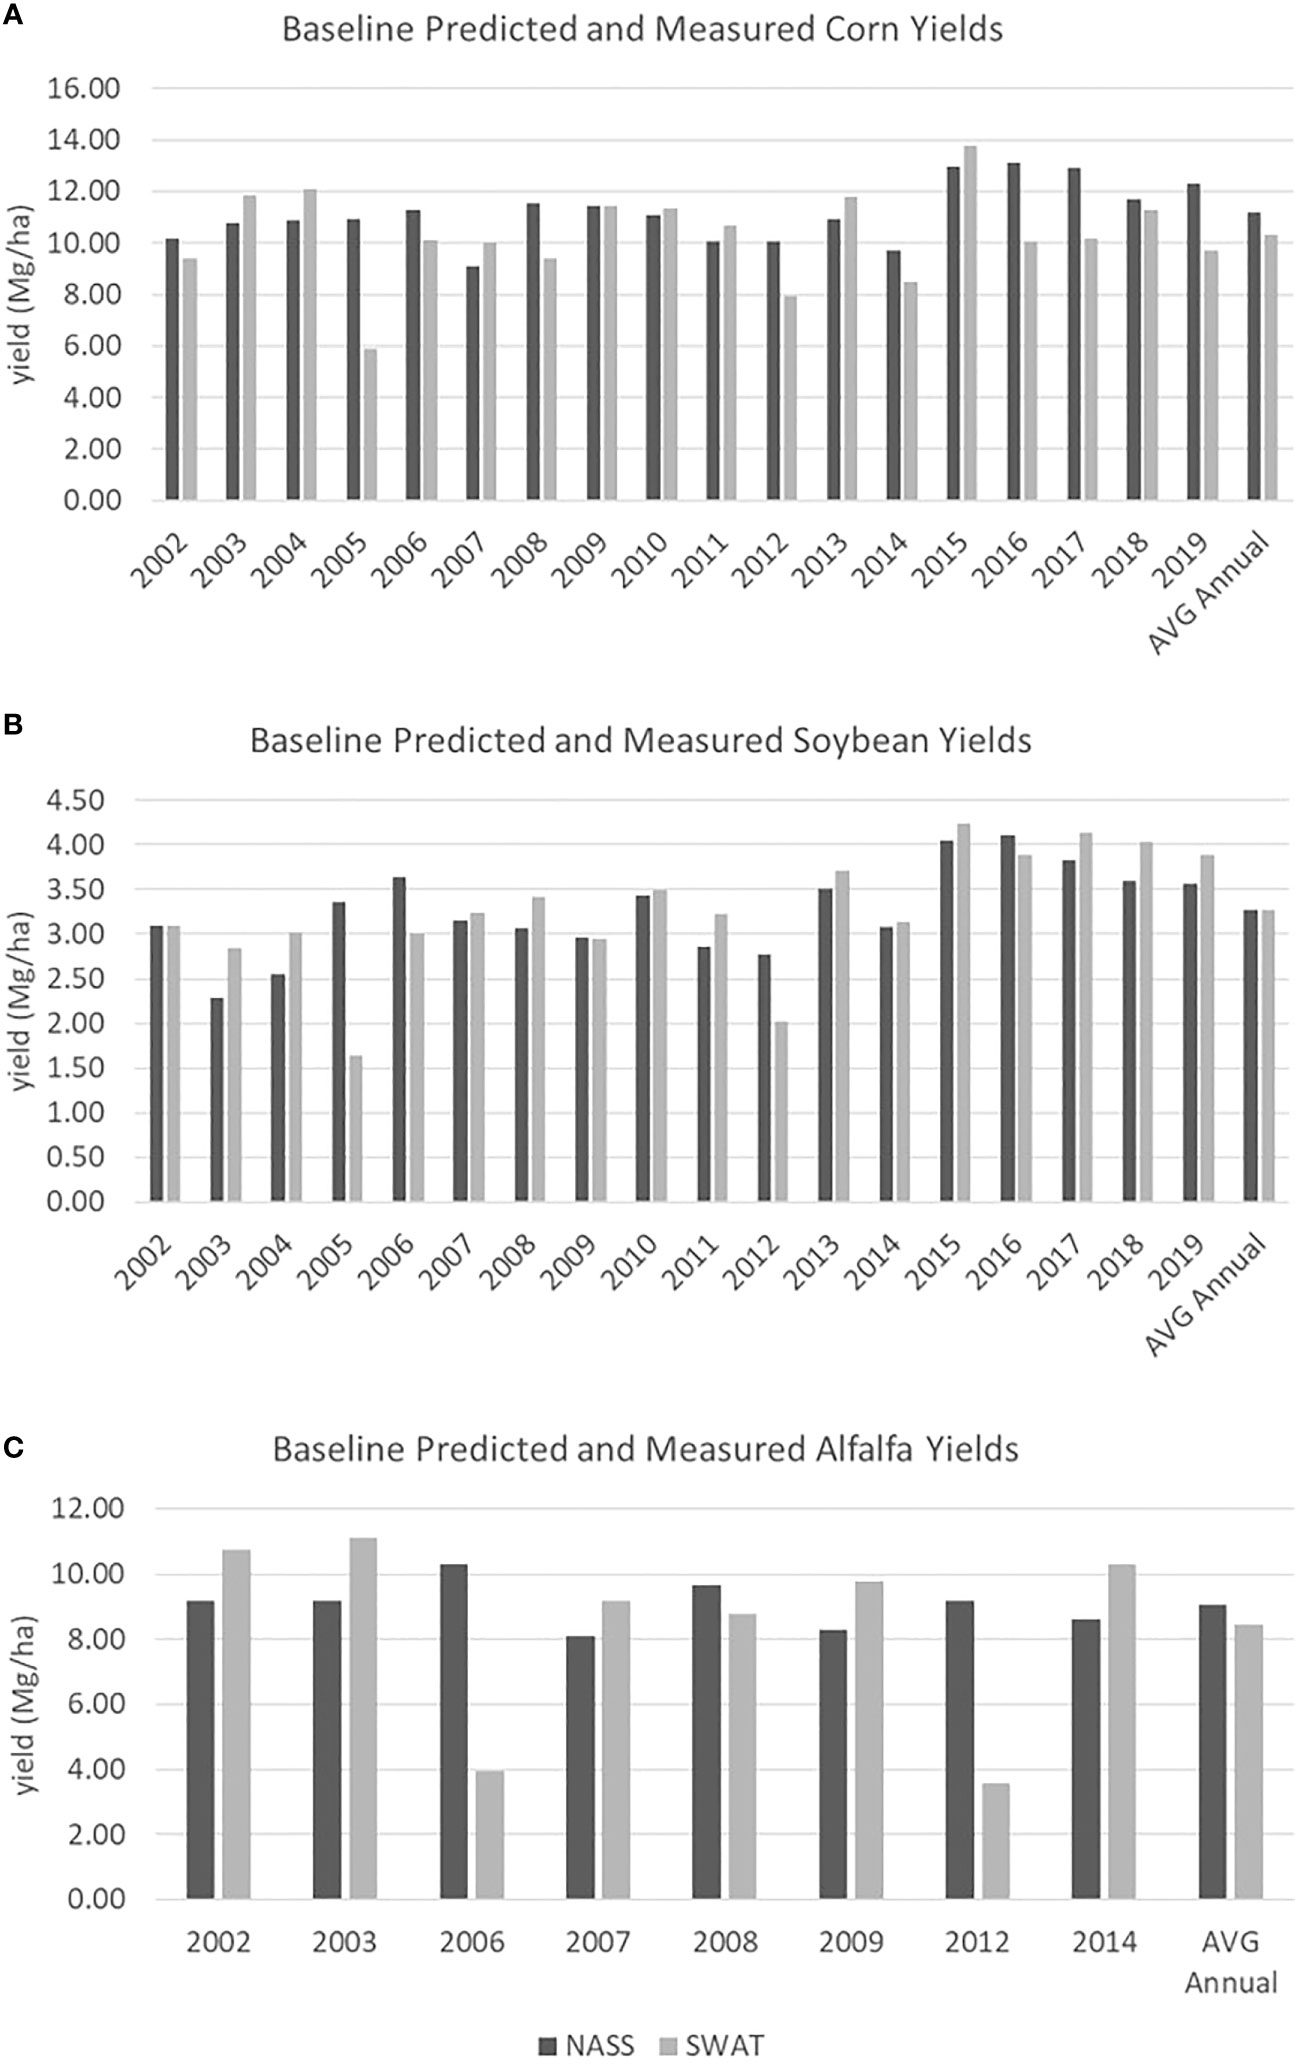
Figure 2 Annual predicted yields (“SWAT”) for corn (A), soybean (B), and alfalfa (C) in the baseline scenario compared to reported values for Nicollet County (“NASS”).
3.1.3 Nitrate-N loads
The annual predicted nitrate-N load for land in the corn-soybean rotation in the baseline scenario averaged over all 18 years of model simulation was 29 kg ha-1 yr-1. Nitrate-N loads from tile drainage accounted for 85% of the total nitrate-N load from fields predicted by the model. Nitrate-N in lateral flow was responsible for 12% of the total load, and surface runoff and leaching accounted for 2.8% and 0.2%, respectively. The annual loss of nitrate-N predicted in this study is similar to nitrate-N losses predicted for the adjacent Seven Mile Creek Watershed. Using the ADAPT model (Chung et al., 1992) for a corn-soybean rotation with subsurface tile drainage and N fertilizer rates equal to 154 kg N ha-1, Nangia et al. (2010) predicted average annual nitrate-N losses of 27.7 kg ha-1 (corresponding to the years 1999-2003). Nangia et al. (2008) reported measured nitrate-N losses from a single field in the Seven Mile Creek watershed during the growing season only (April-August) ranging from 6.2 to 27.5 kg ha-1, though fertilizer rates used on the field were less than the 150 kg N ha-1 used in the current study.
The highest nitrate-N loads from fields were found in HRUs within the corn-soybean land-use, scattered throughout the watershed. The highest nitrate-N losses in this cropping system were found for HRUs assumed to have tile drainage (with slopes less than 2%), and generally on poorly drained clay loam soils or somewhat poorly drained loam soils. These soils on tile drained areas accounted for 72% of the area cropped in the corn-soybean rotation and 60% of the field losses of nitrate-N. High field losses of nitrate-N were also found for HRUs on the far eastern portion of the watershed which were tile-drained but consisted of well drained loam soils. These HRUs accounted for 7% of the area specified in a corn-soybean rotation within the watershed area but 20% of field losses of nitrate-N.
3.2 SWAT crop parameterization results
3.2.1 Intermediate wheatgrass
The accuracy of parameters used in the crop file to describe IWG growth in SWAT were assessed by comparing the simulated biomass of IWG to measured values reported by Jungers et al. (2017) for a grain-type IWG seeded in the spring. Measured biomass at these sites was 11,880 kg ha-1, in 2013, 12,267 kg ha-1 in 2014, and 9,353 kg ha-1 in 2015, or an average annual value of 11,166 kg ha-1. Average annual predicted IWG biomass was 13,478 kg ha-1,a, 21% difference between observed and predicted annual biomass (Figure 3). However, simulated IWG yields were similar to other IWG yield observations from field trials within 100 km of the modeled watershed (Frahm et al., 2018; Hunter et al., 2020) Predicted biomass is shown in Figure 3 for years when IWG was grown within its rotation. Since measured values were not available for every year of SWAT prediction, model predictions of biomass were compared to the average annual measured value or 11,166 kg ha-1 in Figure 3. SWAT predictions of IWG biomass are greater than the average annual value for most years, though the percent difference is less than 10% for most years. However, for 6 years, predicted biomass was notably higher than measured values (years 2006, 2007, 2010, 2011, 2015 and 2016). These higher biomass values often occured during the first two years of IWG. This may indicate that the SWAT model assumes additional nitrogen available for the first two years of IWG resulting from the soybean crop the previous year. Grain yield was not compared between SWAT predictions and measured values for IWG because measured IWG grain yields decrease in the final year of their rotation without a corresponding decrease in their biomass (Jungers et al., 2017), a phenomenon which is difficult to achieve in SWAT due to crop yields being modeled as a fixed fraction of the overall biomass (Neitsch et al., 2011).
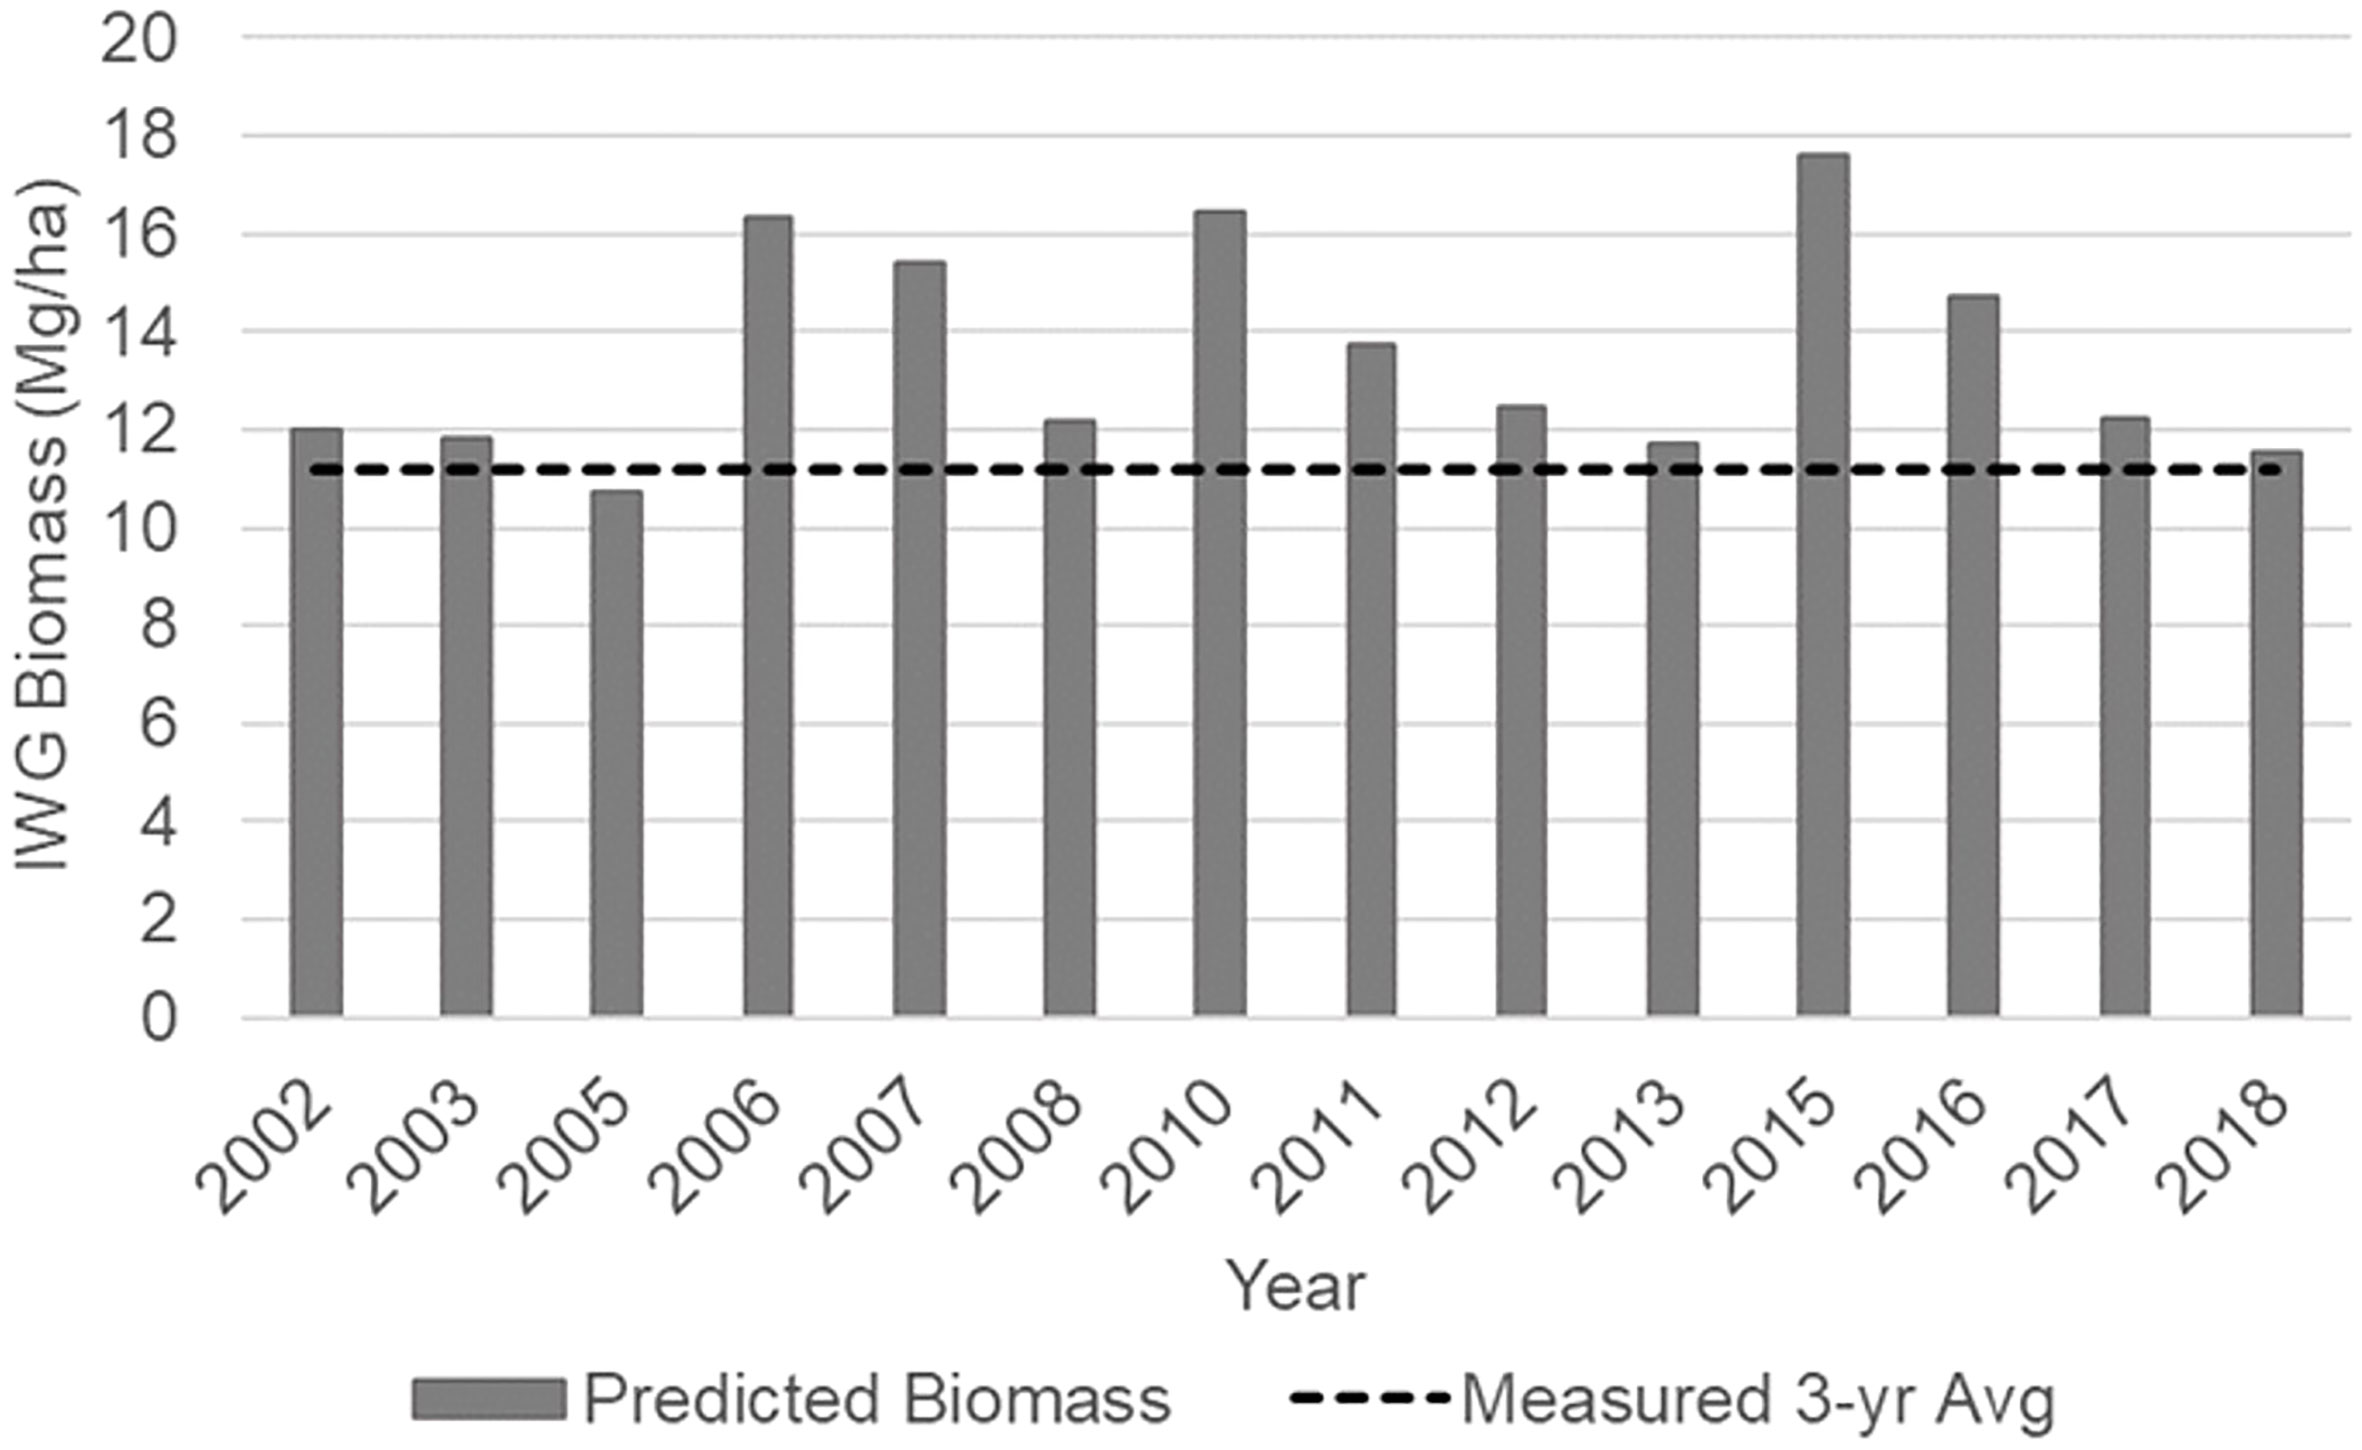
Figure 3 SWAT-predicted IWG above ground-biomass for all years of model simulation and average annual biomass from spring planted, grain-type IWG (Jungers et al 2017).
Predicted nitrate-N loads from tile drainage were compared to a calculated “observed” soil-water nitrate-N load, where the “observed” soil-water nitrate-N load was calculated using predicted tile drainage depth and measured soil-water nitrate concentrations reported in Jungers et al. (2019). Table 1 shows the predicted and observed nitrate-N loads for corn and IWG. The predicted nitrate-N loads from tile drainage shown in Table 1 were averaged over all years when either corn was planted (values from the baseline scenario), or when IWG was planted (values from the IWG rotation scenario). Observed loads were calculated using the predicted annual average tile flow depth (176 mm) and the measured soil-water nitrate-N concentrations reported in Jungers et al. (2019) for corn and IWG. Observed and predicted nitrate-N loads for IWG both show a drastically lower compared to the nitrate-N loads for corn. Predicted nitrate-N loads for IWG are larger than observed loads, but the difference is only 1.2 kg ha-1.
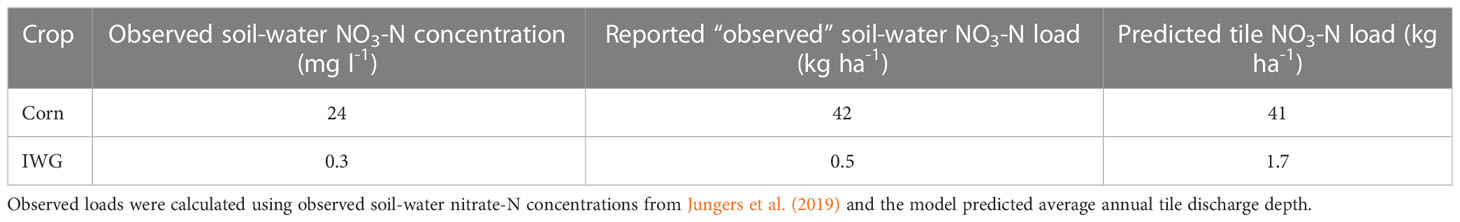
Table 1 Predicted and observed values of nitrate-N in tile flow (predicted) and soil-water (observed).
While SWAT predicted higher IWG biomass for all years, changes to the crop database parameters that would decrease biomass production also resulted in increases in nitrate-N losses due to a reduction in plant uptake of nitrogen. The crop parameter values used in this study (reported in the Supplementary Information) optimize results both with regards to biomass and nitrate-N loads.
3.2.2 Winter camelina
The accuracy of parameters used in the crop file to describe winter camelina growth in SWAT were assessed by comparing the simulated biomass and seed yield to measured values. Above ground biomass for winter camelina was expected to be approximately 1,120 kg ha-1 at the end of April, and reach a maximum of 4,483-6,725 kg ha-1 at harvest on July 1 (R. Gesch, personal communication). Averaged over all years of model simulation, crop biomass at harvest and in the spring was higher than the reported range, with an average of 2,111 kg ha-1 at the end of April and 8,306 kg ha-1 at harvest.
In order to make a direct comparison with SWAT model predictions for nitrate-N load, the measured soil water nitrate concentrations from Weyers et al. (2019) were multiplied by the average monthly tile flow depths predicted by SWAT to give an estimated “observed” nitrate-N load given measured nitrate concentration and the predicted tile flow depths. The observed data represents the average nitrate-N concentration measured at 30, 60, and 100 cm soil depths reported in Weyers et al. (2019) for the cover crop (Sept-April), intercrop (May-June), and soybean (July-Oct) periods (Table 2). Table 2 also includes a range in the observed data, calculated using the magnitude and direction of measurement errors presented in Weyers et al. (2019). As a total nitrate load over the growing season, the predicted value falls within the range in the observed data. However, the SWAT results differ from the observed data when examined by time period, with the predicted nitrate loads being higher during the Sept-April and May-June time period, but with lower loads predicted during the “soybean” phase in July-Oct. These differences could in part be due to a difference in the cropping systems. The predicted values represent a double-crop system where winter camelina is harvested before soybean is planted, whereas the observed concentration corresponds to a relay crop system, when there is a 2-month period where soybean and winter camelina grow concurrently. SWAT does not allow for crops to be grown simultaneously, thus simulations of winter camelina within the SWAT model are limited to only examining double cropping systems and not relay cropped systems.
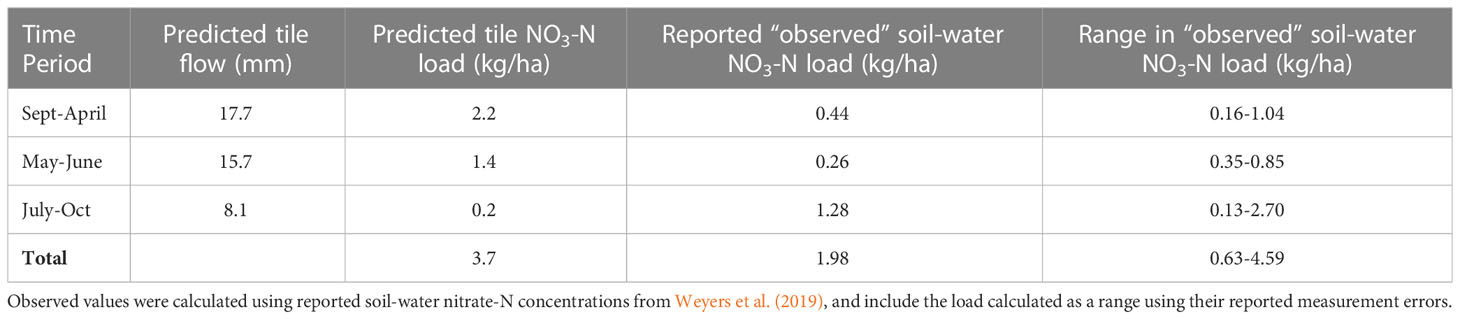
Table 2 Predicted and observed values of nitrate-N in tile flow (predicted) and soil-water (observed) for a winter camelina rotation.
3.3 Predicted nitrate-N losses for alternative cropping systems
3.3.1 Nitrate-N load for perennialized versus annual cropping systems
Figure 4 shows predicted annual field losses of nitrate-N (including losses in runoff, tile drainage, lateral flow, and leaching to groundwater) as an average over all fields in the watershed in the corn-soybean rotation in the baseline scenario, and each of the alternative perennialized cropping systems (IWG, alfalfa, and winter camelina rotations) assuming 100% of the corn-soybean area in the baseline scenario was converted to the alternative system. The corn-soybean rotation shows the highest predicted nitrate-N loads for most years. The winter camelina rotation generally shows the highest losses of nitrate-N compared to the other alternative cropping scenarios. However, there are some years in the IWG and alfalfa rotations where nitrate-N losses were higher than predicted losses with the winter camelina rotation. Years with relatively higher nitrate-N losses for the IWG rotation tend to occur in the year that follows soybean harvest. Soybean was grown in the rotation in the years 2004, 2009, 2014, and 2019, and the highest annual nitrate-N losses with the IWG rotation occur in the years 2005 and 2010. These higher nitrate-N losses in the years following soybean may be due to additional nitrogen being available in the soil following the planting of a legume crop. For the alfalfa rotation, the highest nitrate-N losses occured during years when corn was grown (2004, 2005, 2010, 2011, 2016, and 2017). In the alfalfa rotation these higher losses during corn years may be due to the annual crop being grown, in addition to nitrogen fertilizer being applied those years.
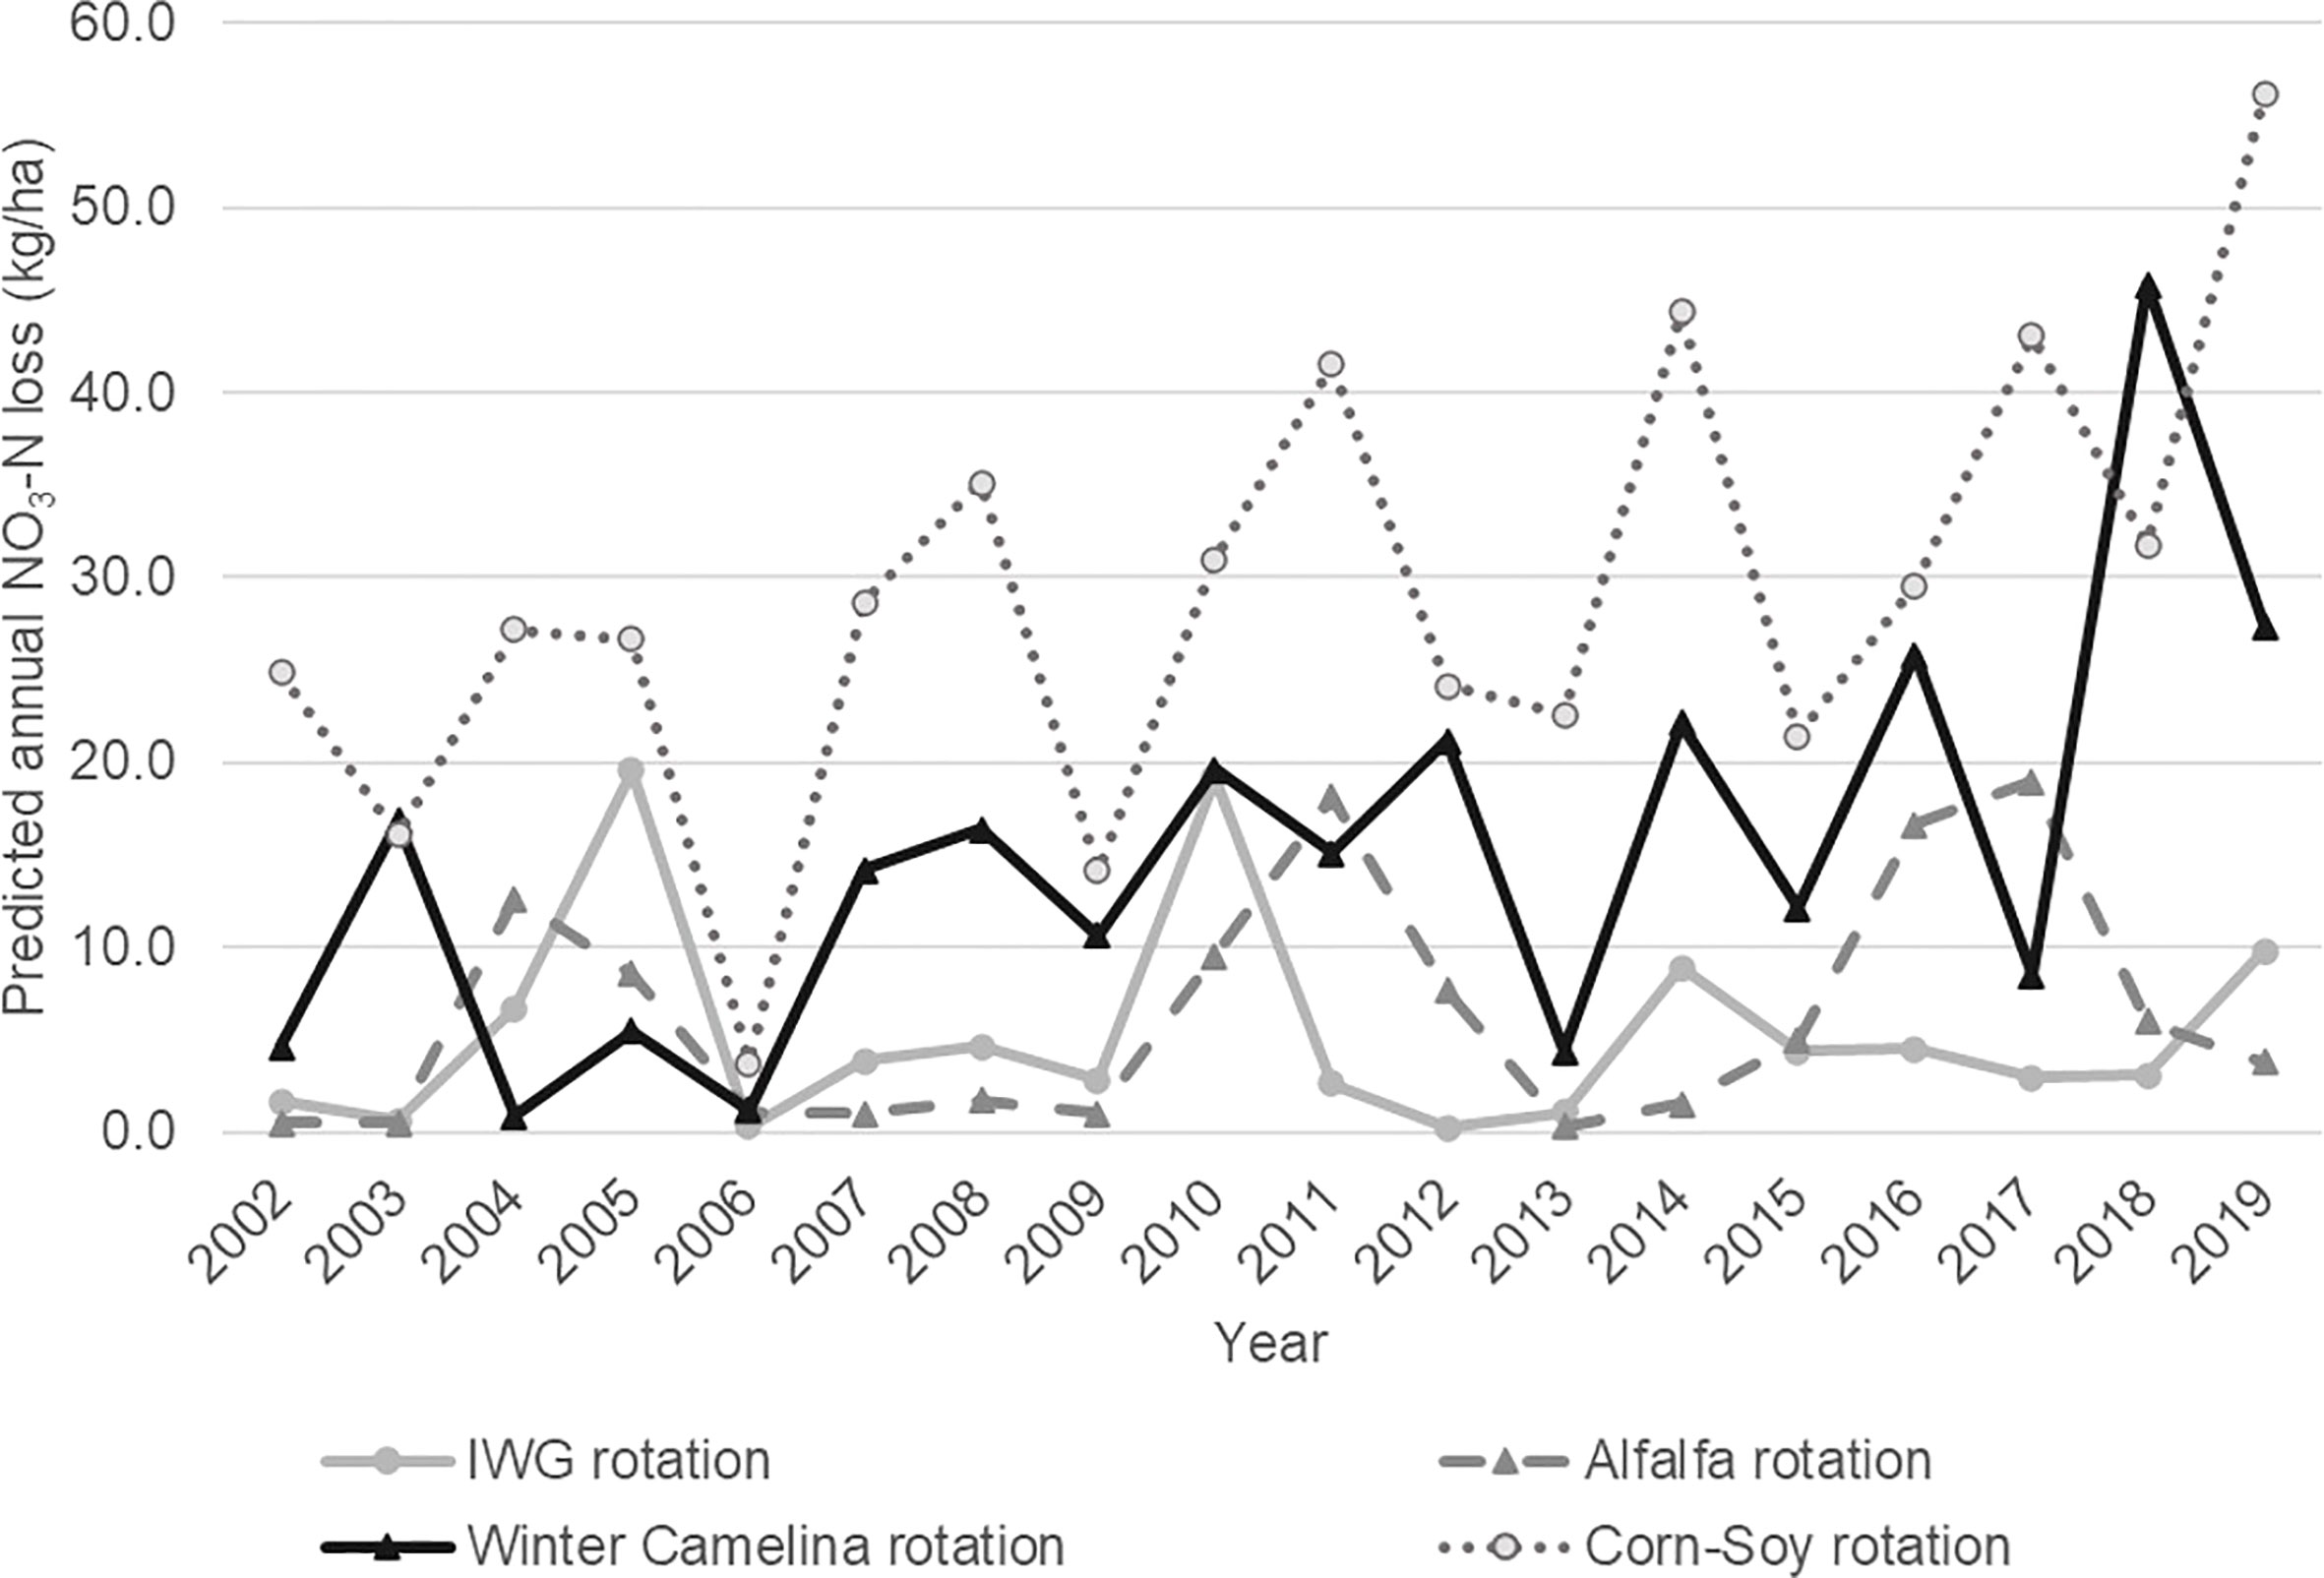
Figure 4 Predicted annual nitrate-N losses from fields for the baseline corn-soybean scenario and each of the alternative perennialized cropping systems (IWG, alfalfa, and winter camelina).
Examining nitrate-N losses from fields converted to the alternative cropping system only for years when IWG was planted (not considering all years of the rotation), simulated annual average nitrate-N loads from tile drainage were approximately 91% less compared to nitrate-N losses under the corn-soybean baseline scenario. These same years planted with alfalfa showed a similar reduction in nitrate-N losses compared to the annual crops corn and soybean, also showing on average an approximately 92% reduction in nitrate-N compared to corn-soybean. The predicted reduction in nitrate-N load from tile drainage for an alfalfa rotation compared to a corn-soybean rotation is similar to that reported in Randall et al. (1997), who found a 96% reduction in tile nitrate-N loads (7.2 kg ha-1 for alfalfa over 4 years compared to 203 kg ha-1 for corn-soybean rotation).
3.3.2 Watershed area required to achieve target reductions in nitrate-N
The land area cropped in corn and soybean under the baseline scenario that would need to be converted to the alfalfa, IWG, or winter camelina rotations in order to achieve specified reduction goals ranging from 10 to 50% in average annual field losses of nitrate-N is shown in Figure 5 (nitrate-N losses include losses in runoff, tile drainage, lateral flow, and leaching to groundwater). These results consider the average annual losses over the entire 18-year simulation period, and nitrate-N losses that occur during years when perennial crops are planted as well as the years when an annual crop is planted within the IWG and alfalfa rotations. Reduction goals of 10%. 20%, 30%, 40%, and 50%, corresponded to average annual nitrate-N losses of 26.2, 23.1, 20.4, 17.4, and 14.5 kg N ha-1, respectively. Results of simulations show that less land area needs to be converted to the IWG and alfalfa rotations compared to the winter camelina rotation in order to achieve a given fixed percent reductions in nitrate-N. Additionally, the results for the IWG and alfalfa rotations are similar, but the IWG rotation requires slightly less land than the alfalfa rotation in order to achieve the same reductions in nitrate-N (Figure 5).
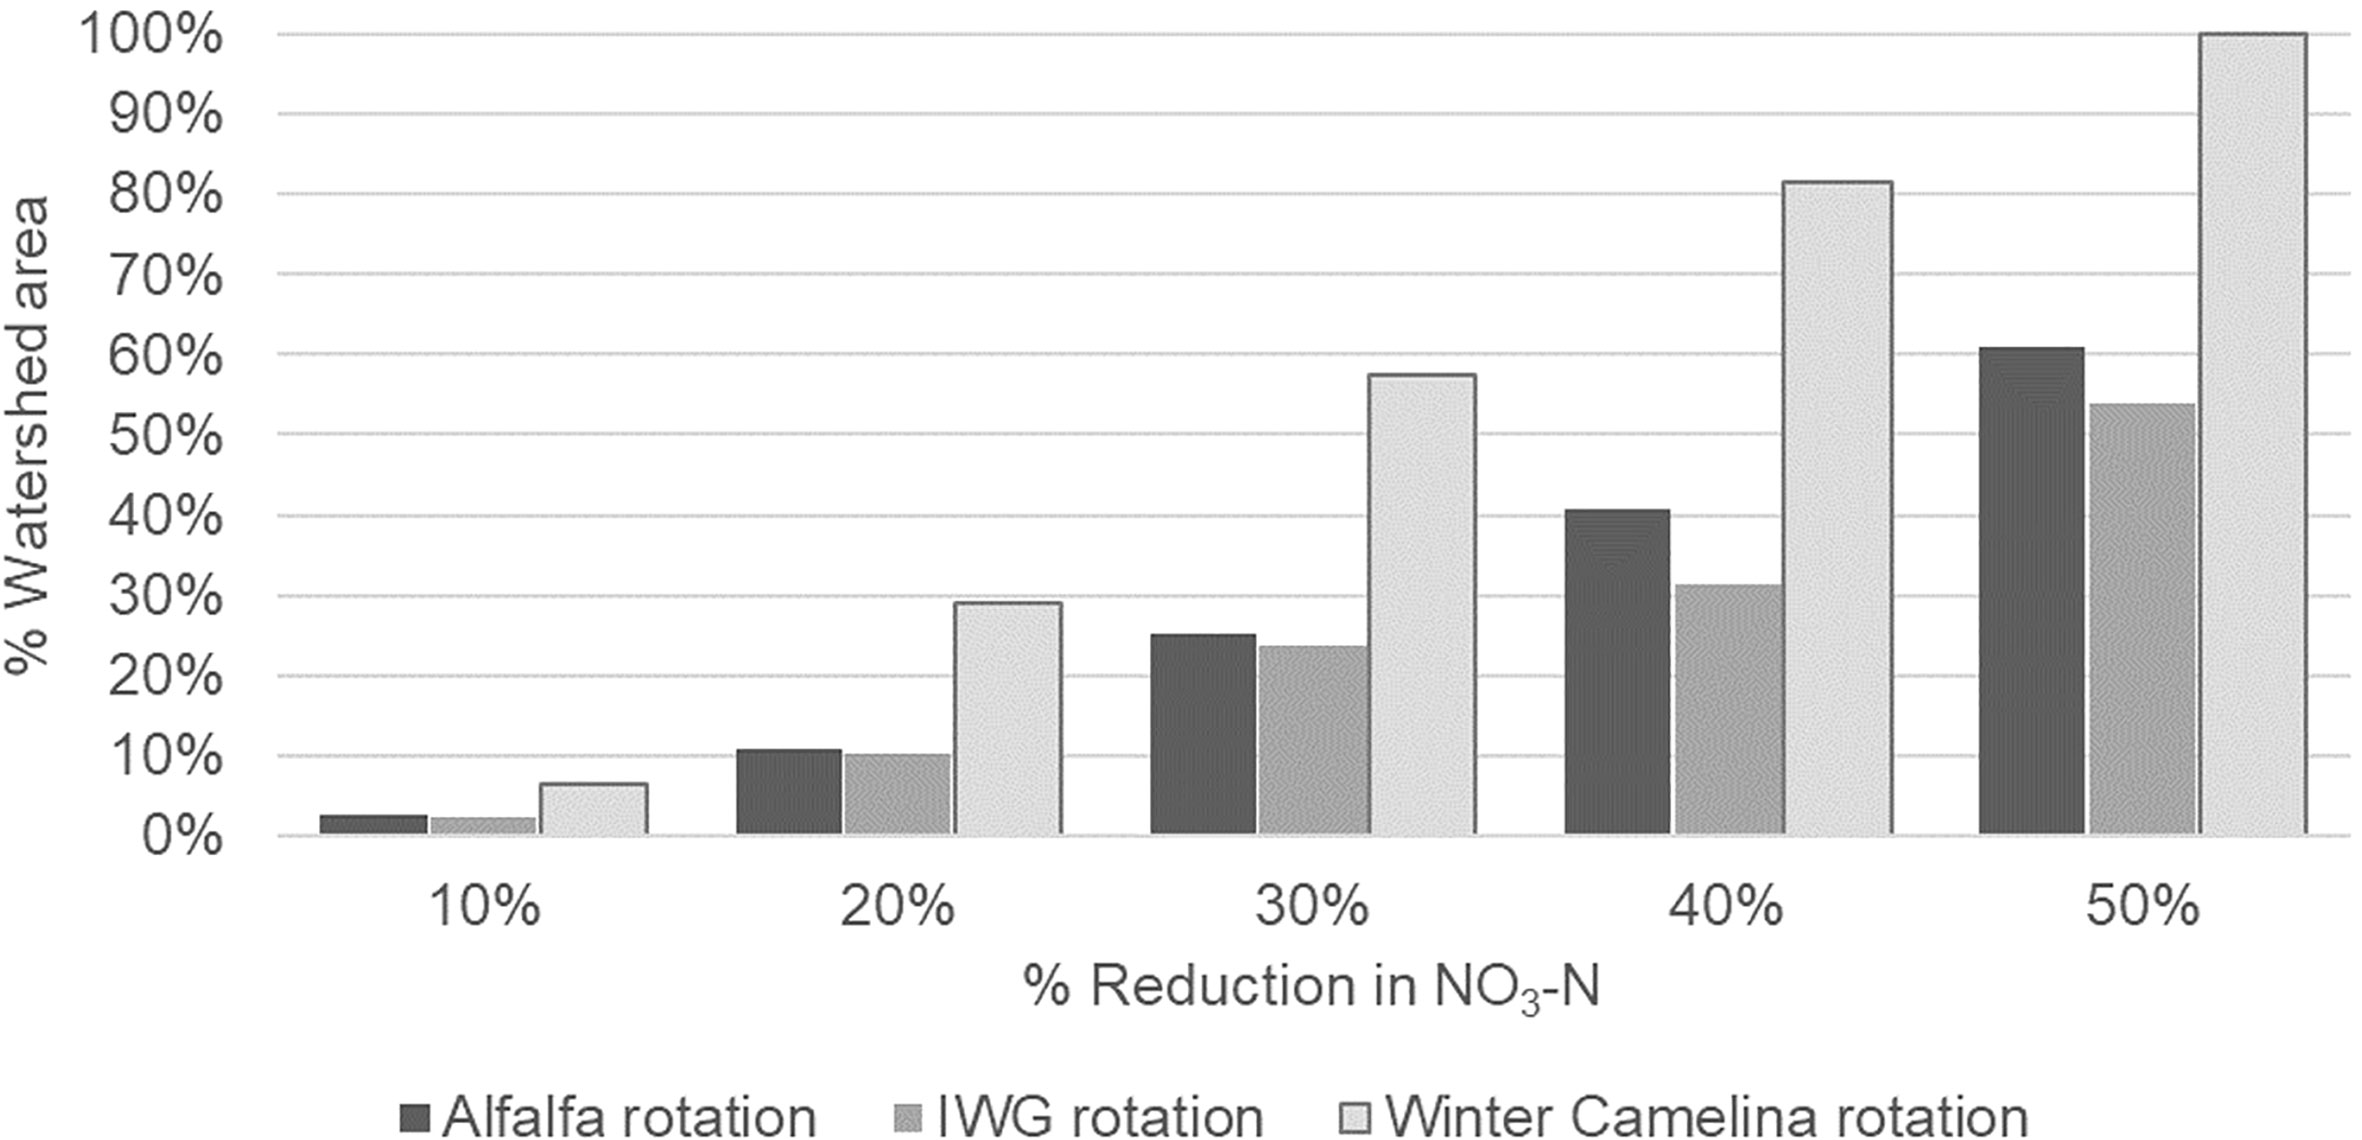
Figure 5 Percent of watershed area needing to be converted from the baseline (corn-soybean) land-use to an alternative crop rotation in order to achieve reductions in nitrate-N of 10, 20, 30, 40, and 50% compared to the baseline scenario.
In order to achieve a 30% reduction in nitrate-N losses in the watershed, 25% and 24% the area of land in a corn-soybean rotation in the baseline scenario needed to be converted to an alfalfa rotation or IWG rotation, respectively. In contrast, to achieve this same 30% reduction in nitrate-N losses, 57% of the corn-soybean area would need to be converted to the winter camelina rotation. A 50% reduction in nitrate-N losses required 61%, 54% or 100% of the corn-soybean area to be converted to the alfalfa, IWG, or winter camelina rotations, respectively (Figure 5). When all areas currently cropped in corn and soybean were converted to the alfalfa rotation, nitrate-N losses from fields at the watershed scale are predicted to decrease by 78% compared to the baseline crop rotation. Converting 100% of the corn-soybean acreage into the IWG rotation results in an 81% reduction in nitrate-N losses. In comparison, converting 100% of the land-area into the winter camelina rotation results in only a 48% reduction in nitrate-N.
4 Discussion
This modeling study evaluated hydrology and water quality effects of crop rotations that include crops with potential to improve water quality and provide new revenue to farmers. Specifically, these rotations included “perennializing” crops that increased the duration of living plant cover in these rotations, namely alfalfa, Kernza®, and winter camelina. Simulations indicated that these rotations had water quality benefits compared to corn-soybean rotations on tile-drained croplands of the Upper Midwest, USA. Predicted nitrate-N losses from tile drainage were reduced when acreage planted in a corn-soybean rotation was converted to rotations that included alfalfa, and newly developed varieties of intermediate wheatgrass (marketed as the grain Kernza®) and winter camelina. The greatest reductions of nitrate-N in the watershed occurred when large areas of land were converted from the corn-soybean rotation into one of the alternative crop rotations. Nitrate-N loads decreased by 78 and 81%, respectively, when all the current corn-soybean areas were converted to a 5-year IWG-soybean rotation, or 6-year corn-alfalfa rotation. Based on net returns in southcentral Minnesota for a corn-soybean rotation of $2223.57 ha-1 that exceed net returns for continuous alfalfa, 3-yr Kernza®, and soybean-camelina cropping system averaging $990.17 ha-1, $1285.45 ha-1, and $1407.44 ha-1, respectively (Forever Green Initiative, 2022), adoption of perennialized systems on all crop land is unlikely in watersheds in this region. However, when targeted to specific areas on the landscape, these rotations still have the potential to significantly reduce nitrate-N loads from extensively tile-drained watersheds. Pollution reduction strategies in the state of Minnesota have a goal of achieving reductions of 20-40% (MPCA, 2014). Nitrate-N loads were reduced by 30% when 25%, 24%, or 57% of corn-soybean areas were converted to the alfalfa, IWG, or winter camelina rotations, respectively.
Though winter camelina showed important reductions in nitrate-N loads compared to a corn-soybean rotation, nitrate-N loads were reduced the most when corn-soybean acreage was converted to a rotation that included a perennial crop, such as alfalfa or IWG. The better performance of the perennial crops could be explained by greater biomass production and plant N uptake throughout the year. Additionally, unlike the IWG and alfalfa rotations, the winter camelina rotation included a fallow period (Gesch et al., 2014), as well as additional tillage operations during the rotation, increasing soil disturbance.
Limitations of the SWAT model, the design of the crop rotations, and availability of measured water quality data have implications for results of this study. The winter camelina rotation simulated in this study assumed a double cropping system where only one crop was grown at a time. Many proposed winter camelina rotations instead utilize a relay crop approach, with more than one crop growing simultaneously (Weyers et al., 2019). The SWAT model is not able to grow more than one crop at a time, and so using this model to make predictions on nutrient dynamics in the soil and water for a winter camelina rotation limits predictions by SWAT to only one of two possible camelina rotations. Crop rotations used in this study were fixed with time (not all crops were grown during all years). Crop growth in a given year could be impacted by temperature and precipitation in that year, thus affecting predicted plant nitrogen uptake and nitrate-N losses in drainage. Nitrate-N loss in tile drainage has been shown to be greatly affected by precipitation and cycles of wet and dry years (Nangia et al., 2010). Given the fixed nature of the rotations used in this study, the reported predicted nitrate-N losses are at least slightly dependent on the weather occurring the year the crop was planted. However, this limitation is minimized to a large extent by using a relatively long climatic record of 20 years.
There were also limited measured hydrology and water quality datasets available in the Rogers Creek watershed for use in calibrating the model. Statistical measures of model goodness-of-fit require observed data and corresponding model predictions for multiple time points (such as daily, monthly, or annual) in order to obtain a useful statistic of model performance. While annual measurements of crop yields were available for the watershed, this is an ungauged watershed with no daily, monthly, or annual measurements of streamflow, or regular measurements of nitrate-N concentration in the main stream channel or in tile drainage discharge. While the model was calibrated given available hydrologic datasets, these datasets primarily considered average values over the entire simulation period (e.g. a single value of the average annual water balance and ET). Therefore, it was not appropriate to use statistical measures of model goodness-of-fit in assessing model performance during calibration of hydrology or water quality parameters, and a statistical measure (PBIAS) was only used in assessing model performance in predicting annual crop yield in the baseline scenario. In addition to the limited measured datasets for calibration of the model baseline scenario, there was also limited data available to calibrate model results for alternative cropping systems. Both IWG and winter camelina are crops that do not exist within the SWAT crop database, and parameter calibration was necessary to simulate water quality for these crops. Measured nitrate-N loads from subsurface tile drainage systems for both the IWG and winter camelina crops were not available for comparison to model predictions. Thus, this study utilized the available measured soil-water nitrate-N concentrations published in the literature, along with predicted values of tile drainage in order to obtain a value for expected observed nitrate-N loads from tile drains. Despite the limited measured hydrology and water quality data available, the work presented here is an important first step in evaluating the impact of novel perennialized cropping systems on water quality on a watershed scale, demonstrating the potential of these systems to reduce nutrient losses in tile-drained, row cropped areas. Additionally, the results of this work highlight the need for further research to generate robust observed water quality datasets for perennialized cropping systems in order to fully understand the impact of these systems on regional water quality.
Such evaluation is important to inform watershed and landscape-scale efforts to enhance stewardship of water in agricultural landscapes (Duru et al., 2015; Morton and Shea, 2022). Watershed-scale planning and action to advance diversification at watershed scales can serve the interests of farmers, firms, and public agencies. For example, major food manufacturers are pledging to support enhanced water management practices on large scales. To make good on these pledges, such firms are organizing to work with their producers on aggregated regional scales (“supplysheds,” General Mills, 2022). Public agencies are also supporting watershed-scale planning and action, including agricultural diversification (https://bwsr.state.mn.us/one-watershed-one-plan). Farmer groups also advocate watershed-scale planning and action (Gesch et al., 2020), and watershed-scale implementation of diversification and water conservation. Collective implementation of diversification on watershed scales can provide advantages for farmers, including mutual implementation support and other advantages of aggregation (Manson et al., 2016).
Planning and implementation of watershed-scale diversification likely requires collective action by public agencies, private firms, and farmers. Yet, implementation of diversification by collective action on watershed scale must manage inherent conflicts of interest among these parties (Bodin, 2021). Management of these conflicts, and achievement of mutual gains is likely to depend strongly on effective collaborative learning (Bodin, 2017). Watershed-scale diversification scenarios appear to support such learning (Slotterback et al., 2016). Therefore, watershed-scale implementation scenarios for diversification via novel crops are likely to be very important to collaborative learning regarding the utility of these crops to advance diversification. Accordingly, our development of these watershed-scale scenarios for several novel crops (Kernza® and winter camelina) is intended to support such collaborative learning processes for these particular crops. Both are of major interest to public, private sectors and to farmers. This study serves as an important first step in estimating the effects that adoption of these crops could have on field-scale nitrate-N losses in regions which are extensively tile-drained, and results of this modeling study encourage further watershed-scale learning and collective action to explore implementation of these novel crops.
Data availability statement
The original contributions presented in the study are included in the article/Supplementary Material. Further inquiries can be directed to the corresponding author.
Author contributions
GW was the primary writer of the paper and did the majority of analysis and modeling work presented. DM and JJ were both responsible for critical revisions for intellectual content. NJ and BG were both responsible for acquiring funding for this work as well as critical revisions for intellectual content. All authors contributed to the article and approved the submitted version.
Funding
Funding provided by: UMN MnDRIVE Transdisciplinary Bioeconomy project. 1000 11028 MNT11 100001488.
Acknowledgments
The authors would like to acknowledge the work of Russ W. Gesch (USDA-ARS-North Central Soil Consevation Research Lab, Morris, MN).
Conflict of interest
The authors declare that the research was conducted in the absence of any commercial or financial relationships that could be construed as a potential conflict of interest.
Publisher’s note
All claims expressed in this article are solely those of the authors and do not necessarily represent those of their affiliated organizations, or those of the publisher, the editors and the reviewers. Any product that may be evaluated in this article, or claim that may be made by its manufacturer, is not guaranteed or endorsed by the publisher.
Supplementary material
The Supplementary Material for this article can be found online at: https://www.frontiersin.org/articles/10.3389/fagro.2023.1180232/full#supplementary-material
References
Arnold J. G., Moriasi D. N., Gassman P. W., Abbaspour K. C., White M. J., Srinivasan R., et al. (2012). SWAT: Model use, calibration, and validation. Trans. ASABE 55 (4), 1491–1508. doi: 10.13031/2013.42256
Asbjornsen H., Hernandez-Santana V., Liebman M., Bayala J., Chen J., Helmers M., et al. (2014). Targeting perennial vegetation in agricultural landscapes for enhancing ecosystem services. Renewable Agric. Food Syst. 29 (2), 101–125. doi: 10.1017/S1742170512000385
Bajgain P., Zhang X., Jungers J., DeHaan L., Heim B., Sheaffer C., et al. (2020). ‘MN-Clearwater’, the first food-grade intermediate wheatgrass (Kernza perennial grain) cultivar. J. Plant Registrations 14 (3), 288–297. doi: 10.1002/plr2.20042
Bodin Ö (2017). Collaborative environmental governance. Science 357 (6352), 659–659. doi: 10.1126/science.aan1114
Camargo J. A., Alonso A. (2006). Ecological and toxicological effects of inorganic nitrogen pollution in aquatic ecosystems: A global assessment. Environ. Int. 32 (6), 831–849. doi: 10.1016/j.envint.2006.05.002
Chung S. O., Ward A. D., Schalk. C. W. (1992). Evaluation of the hydrologic component of the ADAPT water table management model. Trans. ASAE 35, 571–579. doi: 10.13031/2013.28635
Committee on Environment and Natural Resources (2010). Scientific assessment of hypoxia in U.S. coastal waters (Washington, DC: Joint Subcommittee on Ocean Science and Technology, National Science and Technology Council).
Culman S., Snapp S., Ollenburger M., Basso B., DeHaan L. (2013). Soil and water quality rapidly responds to the perennial grain kernza wheatgrass. Agron. J. 105 (3), 735–744. doi: 10.2134/agronj2012.0273
Dalzell B., Mulla D. (2018). Perennial vegetation impacts on stream discharge and channel sources of sediment in the Minnesota River Basin. J. Soil Water Conserv. 73 (2), 120–132. doi: 10.2489/jswc.73.2.120
David M. B., Drinkwater L. E., McIsaac G. F. (2010). Sources of nitrate yields in the mississippi river basin. J. Environ. Qual. 39 (5), 1657–1667. doi: 10.2134/jeq2010.0115
DeHaan L., Christians M., Crain J., Poland J. (2018). Development and evolution of an intermediate wheatgrass domestication program. Sustainability (Basel Switzerland) 10 (5), 1499. doi: 10.3390/su10051499
Duru M., Therond O., Fares M. (2015). Designing agroecological transitions; A review. Agron. Sustain. Dev. 35 (4), 1237–1257. doi: 10.1007/s13593-015-0318-x
Emmett B. D., O’Brien P. L., Malone R. W., Rogoska N., Kovar J. L., Parkin T. B. (2022). Nitrate losses in subsurface drainage and nitrous oxide emissions from a winter camelina relay cropping system reveal challenges to sustainable intensification. Agriculture Ecosyst. Environ. 339, 108136. doi: 10.1016/j.agee.2022.108136
Entz M., Bullied W., Forster D., Gulden R., Vessey J. (2001). Extraction of subsoil nitrogen by alfalfa, alfalfa–wheat, and perennial grass systems. Agron. J. 93 (3), 495–503. doi: 10.2134/agronj2001.933495x
Forever Green Initiative (2022) Enterprise Budgets for Continuous-Living-Cover Crops: Assessment of the Net Economic Returns to Land for Diversified Cropping Systems in USA and South Central, MN (College of Food, Agricultural and Natural Resource Sciences). Available at: https://forevergreen-umn.info/alfalfa/Alfalfa2022/Appendix_IV.1_Economic_Assessment_Report_final.pdf (Accessed July 3, 2023).
Frahm C. S., Tautges N. E., Jungers J. M., Ehlke N. J., Wyse D. L., Sheaffer C. C. (2018). Responses of intermediate wheatgrass to plant growth regulators and nitrogen fertilizer. Agron. J. 110 (3), 1028–1035. doi: 10.2134/agronj2017.11.0635
Gelder B. K. (2015). Automation of DEM Cutting for Hydrologic/Hydraulic Modeling, (Institute for Transportation, Iowa State University: Ames, IA).
General Mills (2022) Hitting the right target: A proposal for monitoring accurate supply shed impacts. Available at: https://www.sustain-cert.com/wp-content/uploads/2022/05/Hitting-the-Right-Target_GMI-SC_Report.pdf (Accessed March 5, 2023).
Gesch R., Archer D. (2013). Double-cropping with winter camelina in the northern Corn Belt to produce fuel and food. Ind. Crops Products 44, 718–725. doi: 10.1016/j.indcrop.2012.05.023
Gesch R. W., Archer D. W., Berti M. T. (2014). Dual cropping winter camelina with soybean in the northern corn belt. Agron. J. 106 (5), 1735–1745. doi: 10.2134/agronj14.0215
Gesch K., Kiel A., Sutphin T., Wolf R. (2020). Integrating farmer input and Agricultural Conservation Planning Framework results to develop watershed plans in Iowa. J. Soil Water Conserv. 75 (4), 101A–104A. doi: 10.2489/jswc.2020.0226A
Gowda P. H., Dalzell B. J., Mulla D. J. (2007). Model based nitrate TMDLs for two agricultural watersheds of Southeastern Minnesota1. J. Am. Water Resour. Assoc. 43 (1), 254–263. doi: 10.1111/j.1752-1688.2007.00020.x
Hunter M. C., Sheaffer C. C., Culman S. W., Lazarus W. F., Jungers J. M. (2020). Effects of defoliation and row spacing on intermediate wheatgrass II: Forage yield and economics. Agron. J. 112 (3), 1862–1880. doi: 10.1002/agj2.20124
Jungers J., DeHaan L., Betts K., Sheaffer C., Wyse D. (2017). Intermediate wheatgrass grain and forage yield responses to nitrogen fertilization. Agron. J. 109 (2), 462–472. doi: 10.2134/agronj2016.07.0438
Jungers J. M., DeHaan L. H., Mulla D. J., Sheaffer C. C., Wyse D. L. (2019). Reduced nitrate leaching in a perennial grain crop compared to maize in the Upper Midwest, USA. Agriculture Ecosyst. Environ. 272, 63–73. doi: 10.1016/j.agee.2018.11.007
Law E., Wayman S., Pelzer C., Culman S., Gomez M., DiTommaso A., et al. (2022). Multi-criteria assessment of the economic and environmental sustainability characteristics of intermediate wheatgrass grown as a dual-purpose grain and forage crop. Sustainability (Basel Switzerland) 14 (6), 3548. doi: 10.3390/su14063548
Liu R., Wells M. S., Garcia y Garcia A. (2020). Relay and sequential cropping corn with winter oilseed crops in northern climates. Nutrient Cycling Agroecosystems 116 (2), 195–203. doi: 10.1007/s10705-019-10036-x
Manson S. M., Jordan N. R., Nelson K. C., Brummel R. F. (2016). Modeling the effect of social networks on adoption of multifunctional agriculture. Environ. Model. Softw 75, 388–401. doi: 10.1016/j.envsoft.2014.09.015
Moorman T., Jaynes D., Cambardella C., Hatfield J., Pfeiffer R., Morrow A. (1999). Water quality in Walnut Creek watershed; herbicides in soils, subsurface drainage, and groundwater. J. Environ. Qual. 28 (1), 35–45. doi: 10.2134/jeq1999.00472425002800010004x
Moriasi D. N., Arnold J. G., Van Liew M. W., Bingner R. L., Harmel R. D., Veith T. L. (2007). Model evaluation guidelines for systematic quantification of accuracy in watershed simulations. Trans. ASABE 50 (3), 885–900. doi: 10.13031/2013.23153
Morton L. W., Shea E. (2022). Frontier: beyond productivity—Recreating the circles of life to deliver multiple benefits with circular systems. J. ASABE 65 (2), 411–418. doi: 10.13031/ja.14904
MPCA (2014) The Minnesota Nutrient Reduction Strategy. Available at: https://www.pca.state.mn.us/sites/default/files/wq-s1-80.pdf (Accessed June 29, 2023).
Nangia V., Gowda P., Mulla D., Sands G. (2008). Water quality modeling of fertilizer management impacts on nitrate losses in tile drains at the field scale. J. Environ. Qual. 37 (2), 296–307. doi: 10.2134/jeq2007.0224
Nangia V., Mulla D., Gowda P. (2010). Precipitation changes impact stream discharge, nitrate–nitrogen load more than agricultural management changes. J. Environ. Qual. 39 (6), 2063–2071. doi: 10.2134/jeq2010.0105
National Centers for Environmental Information (2022) US Climate Normals. Available at: https://www.ncei.noaa.gov/products/land-based-station/us-climate-normals (Accessed March 5, 2023).
Neitsch S. L., Arnold J. G., Kiniry J. R., Williams J. R. (2011). Equations: Optimal Growth,” in Soil and Water Assessment Tool Theoretical Documentation Version 2009., (Texas Water Resources Institute) 316–345. Available at: https://hdl.handle.net/1969.1/128050
Nolan B., Hitt K. (2006). Vulnerability of shallow groundwater and drinking-water wells to nitrate in the United States. Environ. Sci. Technol. 40 (24), 7834–7840. doi: 10.1021/es060911u
Randall G., Huggins D., Russelle M., Fuchs D., Nelson W., Anderson J. (1997). Nitrate losses through subsurface tile drainage in conservation reserve program, alfalfa, and row crop systems. J. Environ. Qual. 26 (5), 1240–1247. doi: 10.2134/jeq1997.00472425002600050007x
Reilly E., Gutknecht J., Sheaffer C., Jungers J. (2022). Reductions in soil water nitrate beneath a perennial grain crop compared to an annual crop rotation on sandy soil. Front. Sustain. Food Syst. 6. doi: 10.3389/fsufs.2022.996586
Russelle M., Entz M., Franzluebbers A. (2007). Reconsidering integrated crop-livestock systems in North America. Agron. J. 99 (2), 325–334. doi: 10.2134/agronj2006.0139
Russelle M., Lamb J., Montgomery B., Elsenheimer D., Miller B., Vance C. (2001). Alfalfa rapidly remediates excess inorganic nitrogen at a fertilizer spill site. J. Environ. Qual. 30 (1), 30–36. doi: 10.2134/jeq2001.30130x
Slotterback C. S., Runck B., Pitt D. G., Kne L., Jordan N. R., Mulla D. J., et al. (2016). Collaborative Geodesign to advance multifunctional landscapes. Landscape Urban Plann. 156, 71–80. doi: 10.1016/j.landurbplan.2016.05.011
Soil Survey Staff, Natural Resources Conservation Service, United States Department of Agriculture (2023) Web Soil Survey. Available at: https://websoilsurvey.nrcs.usda.gov/ (Accessed March 2022).
Strock J., Porter P., Russelle M. (2004). Cover cropping to reduce nitrate loss through subsurface drainage in the northern U.S. Corn Belt. J. Environ. Qual. 33 (3), 1010–1016. doi: 10.2134/jeq2004.1010
USDA (2022) NASS Quick Stats (Nicollet County, MN). Available at: https://quickstats.nass.usda.gov/ (Accessed March 5, 2023).
USDA NASS (2019) National Agricultural Statistics Service Cropland Data Layer. Published crop-specific data layer (Washington, DC: USDA-NASS). Available at: https://nassgeodata.gmu.edu/CropScape/ (Accessed March 2022 verified March 2023).
Vollmann J., Moritz T., Kargl C., Baumgartner S., Wagentristl H. (2007). Agronomic evaluation of camelina genotypes selected for seed quality characteristics. Ind. Crops Products 26 (3), 270–277. doi: 10.1016/j.indcrop.2007.03.017
Wagoner P. (1995). Intermediate wheatgrass (Thinopyrum intermedium): Development of a perennial grain crop. In Cereals and Pseudocereals. Williams J.T. Ed. (London, UK:Chapman and Hall), 1995 pp. 247–259.
Wang X., Melesse A. M., Yang W. (2006). Influences of potential evapotranspiration estimation methods on SWAT's hydrologic simulation in a northwestern Minnesota watershed. Trans. Am. Soc. Agric. Biol. Engineers 49 (6), 1755–1771. doi: 10.13031/2013.22297
Weyers S., Thom M., Forcella F., Eberle C., Matthees H., Gesch R., et al. (2019). Reduced potential for nitrogen loss in cover crop–soybean relay systems in a cold climate. J. Environ. Qual. 48 (3), 660–669. doi: 10.2134/jeq2018.09.0350
Wilson G. L., Dalzell B. J., Mulla D. J., Dogwiler T., Porter P. M. (2014). Estimating water quality effects of conservation practices and grazing land use scenarios. J. Soil Water Conserv. 69 (4), pp.330–pp.342. doi: 10.2489/jswc.69.4.330
Keywords: SWAT, watershed modeling, Kernza, winter camelina, alfalfa, nitrate-N, water quality
Citation: Wilson GL, Mulla DJ, Jordan NR, Jungers JM and Gordon BA (2023) Simulating the effect of perennialized cropping systems on nitrate-N losses using the SWAT model. Front. Agron. 5:1180232. doi: 10.3389/fagro.2023.1180232
Received: 20 April 2023; Accepted: 31 July 2023;
Published: 18 August 2023.
Edited by:
Walter A. H. Rossing, Wageningen University and Research, NetherlandsReviewed by:
Valentin D. Picasso, University of Wisconsin-Madison, United StatesGina Nichols, The Land Institute, United States
Copyright © 2023 Wilson, Mulla, Jordan, Jungers and Gordon. This is an open-access article distributed under the terms of the Creative Commons Attribution License (CC BY). The use, distribution or reproduction in other forums is permitted, provided the original author(s) and the copyright owner(s) are credited and that the original publication in this journal is cited, in accordance with accepted academic practice. No use, distribution or reproduction is permitted which does not comply with these terms.
*Correspondence: Grace L. Wilson, d2lsczA2NzRAdW1uLmVkdQ==